foodservice food waste action guide - refed · refed | foodservice food waste action guide 4...
TRANSCRIPT

Foodservice Food Waste Action Guide
2018

©2018 ReFED

CONTENTS
Acknowledgments 1
The Opportunity 3
Solutions Overview 4
Prevention Solutions 9
Recovery Solutions 15
Recycling Solutions 21
Characteristics of the Foodservice Industry 26
Setting the Strategy and Approach 28
The Path Ahead 29
Contributors & Reviewers 31
References 32
Appendix 33
Resources 36

1
ABOUT ReFED
ReFED is a collaboration of over 50 private, nonprofit, and public-sector leaders committed to reducing food waste in the United States. The organization engages stakeholders throughout the food system to implement solutions, envisioning a future where combatting food waste is a core driver of business profits, job creation, hunger relief, and environmental protection.
PROJECT TEAM
The development of the Foodservice Food Waste Action Guide was led by ReFED, including Chris Cochran, Eva Goulbourne, Chris Hunt, and Angel Veza.
Technical support provided by Eunomia Research and Consulting, Inc. including Mark Hilton, Sarah Edwards, Camilla Durrant, and Alice Walton.
Graphic design by Ocupop, including Abby Lindstrom, Michael Nieling, and Jason Reimer.
INDUSTRY PARTNERS
This guide was developed in partnership with the Food Waste Reduction Alliance and its members to accelerate waste reduction activities across the food industry. The Food Waste Reduction Alliance contributed valuable insights, data, and industry perspectives to inform the analysis and solutions presented in the guide.
Special thanks to the following companies for providing examples and thoughtful input: Aramark Corporation, Bon Appétit Management Company, Compass Group, Delaware North, Google, LeanPath, Sodexo, and University of Massachusetts Amherst.
The Foodservice Food Waste Action Guide was made possible with generous support from the following foundations and donors:
AJANA FOUNDATION
THE CROWN FAMILY

ReFED | Foodservice Food Waste Action Guide 2
ABOUT THE ROADMAPIn 2016, ReFED published A Roadmap to Reduce U.S. Food Waste by 20 Percent (refed.com/roadmap), the most comprehensive analysis of U.S. food waste and solutions conducted to date. ReFED now works with food businesses, foundations, investors, innovators, and policymakers to implement food waste solutions at scale, putting us on the path to achieving the USDA/EPA goal to cut food waste in half by 2030.
• The Roadmap shows a path to a 20% reduction of food waste through 27 cost-effective, scalable solutions. These solutions would reduce food waste by 13 million tons annually, generating $100 billion of cumulative economic value over the next decade.¹
ABOUT THE FOODSERVICE FOOD WASTE ACTION GUIDE
This Guide is a how-to resource based on interviews with sustainability and operations teams at foodservice organizations of varying sizes, observational site visits, a review of businesses processes and operational data, and interviews with food recovery organizations and ReFED’s Advisory Council.
The Guide is designed for foodservice sustainability directors, and others in leadership roles in the U.S. foodservice industry who are involved in creating or monitoring food waste reduction strategies. It provides an overview of the national food waste challenge, presents opportunities for companies to address it while improving business outcomes, and identifies action-oriented solutions, tools, and best practices.
The foodservice industry as defined in the Guide is composed of businesses that provide food for client organizations, including those in healthcare, corporate, and educational settings. Some of the solutions offered in the Guide will apply to other subsectors such as sports venues, prisons, and airline companies.

3
THE OPPORTUNITY• Today, the United States spends over $218 billion – 1.3% of GDP – growing,
processing, transporting, and disposing of food that is never eaten.2
• Each year, 52.4 million tons of food is sent to landfill, and an additional 10.1 million tons remains unharvested on farms, totaling roughly 63 million tons of annual waste.3
• Foodservice generates nearly 5 million tons of food waste each year (excluding corporate foodservice in commercial and office buildings) at a cost of $11.4 billion.4
FINANCIAL VALUE
• Foodservice providers can generate a minimum of $1 billion in cost savings by adopting Waste Tracking & Analytics alone.5
• When implementing food waste solutions at sites, clients can share in financial benefits, ranging from higher-quality food to lower waste hauling costs. The degree to which the benefit can be realized is dependent on the maturity of the programs and on the commitment of the client.
• Wasted food accounts for as much as 5.6% of total sales in many typical food service settings, split between pre- and post-consumer waste, meaning that on a $1 million contract, up to $56,000 in profit is lost to food waste,6 indicating a clear source of potential savings for any company without a mature prevention program.
REPUTATIONAL VALUE
Food waste is a tangible and highly visible challenge that is gaining public attention. Innovative food waste reduction programs, including guest education, offer foodservice companies the chance to strengthen their brand with clients and guests, employees, and investors.
• Food waste and other sustainability programs (e.g., animal welfare, responsible seafood, local produce, etc.) are increasingly important to contract foodservice clients in addition to cost savings and the bottom line. These programs are becoming important factors in the selection of a foodservice provider.
• Guests - major contributors to food waste—are becoming increasingly aware of food waste: a recent national consumer survey found that 42% of respondents had heard about food waste and 16% had sought information on how to reduce it.7
• Employees are critical to the success of a food waste reduction program. When highly engaged in such efforts, they can experience increased job satisfaction, productivity, and retention.
• Investors and shareholders are showing significantly more interest in environmental, social, and governance metrics. The percentage of investors who consider nonfinancial performance reporting "essential" or "important" grew from 36% in 2014 to 80% in 2015, illustrating the increasing interest in sustainability initiatives.8
FOODSERVICE PROVIDERS CAN GENERATE A MINIMUM OF $1 BILLION IN ANNUAL PROFIT BY ADOPTING WASTE TRACKING & ANALYTICS ALONE.

ReFED | Foodservice Food Waste Action Guide 4
SOLUTIONS OVERVIEWReFED has identified 15 solutions for foodservice companies (10 from the Roadmap and five that are new solutions or adapted from the Roadmap). For more detail on each of the solutions, see Appendix A.
FOOD RECOVERY HIERARCHY
ReFED has adapted the Environmental Protection Agency (EPA) Food Recovery Hierarchy framework to categorize the solutions to reduce food waste, prioritizing prevention first, then recovery, and finally recycling, to maximize economic, social and environmental benefits.
PREVENTION
• Prevention solutions represent close to 600 thousand tons of annual food waste averted for foodservice providers, valued at close to $3,000 per ton, making it the most cost-effective type of solution.9
• Implementing Waste Tracking & Analytics can reduce pre-consumer waste by up to 50%.10
• Adoption of Smaller Plates and Trayless Dining can result in up to 30% reduction in post-consumer waste.11
RECOVERY
• Only 10% of surplus food is being recovered in the combined foodservice and restaurant sector, leaving 900,000 tons of surplus food unrecovered —the equivalent of 1.5 billion meals per year.12
• Liability protections for food donations exist but education is needed to promote awareness and understanding of the federal Bill Emerson Good Samaritan Food Donation Act, which protects donors and recipients from liability.
• Recent improvements in food donation tax legislation have enhanced the ability of foodservice businesses to claim deductions. The 2015 Protecting Americans from Tax Hikes (PATH) Act entitles eligible foodservice businesses to enhanced deductions previously accessible only to large C Corporations.
• Effective donation tracking programs can lead to a 25% reduction in surplus (pre-consumer waste) food when used in conjunction with prevention initiatives.13
RECYCLING
• Recycling offers the largest diversion potential to reduce food waste nationally.
• Recycling solutions vary widely by location, with the Northeast, Northwest, and Midwest areas offering the highest economic value due to high landfill disposal fees and high compost and energy market prices.14
• Roughly 73% of recycling opportunity is expected to come from the creation of Centralized Composting and Centralized Anaerobic Digestion (AD) facilities.15
5
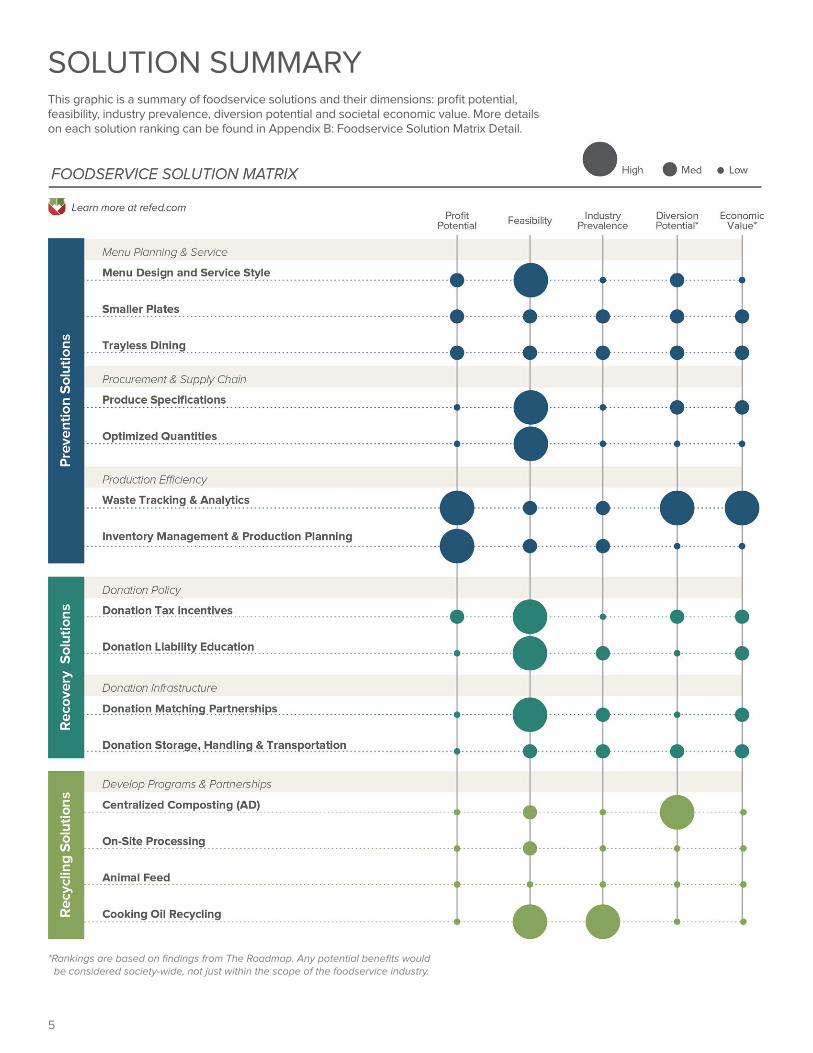
SOLUTION SUMMARYThis graphic is a summary of foodservice solutions and their dimensions: profit potential, feasibility, industry prevalence, diversion potential and societal economic value. More details on each solution ranking can be found in Appendix B: Foodservice Solution Matrix Detail.
*Rankings are based on findings from The Roadmap. Any potential benefits would be considered society-wide, not just within the scope of the foodservice industry.

ReFED | Foodservice Food Waste Action Guide 6
DIMENSION DESCRIPTIONSEach solution has been evaluated along six dimensions: profit potential, implementation effort, extent of upfront capital investment required, industry prevalence, diversion potential, and societal economic value.
PROFIT POTENTIALExpected net annual business benefit and/or cost savings that can be earned by investing in a solution after adjusting for the initial upfront investment required.
• High: net annual cost savings >2.5% of total food costs
• Medium: net annual cost savings of 0.5%-2.5% of total food costs
• Low: net annual cost savings of <0.5% of total food costs
FEASIBILITYA combination of implementation effort and upfront capital requirement.
IMPLEMENTATION EFFORTthe extent of procedural updates, staff training, and systems needed to implement a solution.
• High: The change can be made with procedural updates and ongoing training, combined with new systems. Client approval likely to be required.
• Medium: The change can be made with procedural updates and initial training, combined with new systems. Client approval may be required.
• Low: The change can be made with only minor procedural updates and training, but no new systems. No client approval is required.
INITIAL CAPITAL REQUIREMENTHow much upfront financial capital is needed to implement a solution.
• High: Upfront capital investment >2.5% of total annual food costs.
• Medium: Upfront capital investment is 0.5%-2.5% of total annual food costs.
• Low: Upfront capital investment <0.5% of total annual food costs.
INDUSTRY PREVALENCEEstimated percentage of foodservice providers that have implemented a solution.
• High: Prevalence within industry >50%
• Medium: 25%-50% Prevalence within industry
• Low: Prevalence within industry <25%
DIVERSION POTENTIAL (FROM ORIGINAL ReFED ROADMAP/COST CURVE)Portion of all food waste (by weight) that could be diverted from landfill through the implementation of a solution.
• High diversion potential means that the solution, if successfully implemented, could divert over 0.5% of all food waste from landfill.
• Medium diversion potential means that, if successfully implemented, between 0.1% and 0.5% of food waste could be diverted from landfill.
• Low diversion potential means that, if successfully implemented, less than 0.1% of food waste could be diverted from landfill.
SOCIETAL ECONOMIC VALUE (FROM ORIGINAL ReFED ROADMAP/COST CURVE)The annual aggregate financial benefit of a solution to society minus all investment and costs.
• High economic value means that the solution, if successfully implemented, could create over $1B of total annual economic value.
• Medium economic value means that the solution, if successfully implemented, could create between $100M and $1B of total annual economic value.
• Low economic value means that the solution, if successfully implemented, could create less than $100M of total annual economic value.

7
SOLUTION MATRIXThe Foodservice Solution Matrix is designed to help foodservice providers prioritize solutions based on two dimensions:
• PROFIT POTENTIAL: the net annual business benefit and/or cost savings of a given solution, not including initial investment.
• FEASIBILITY: a combination of the level of effort (e.g., the behavior, systems, process changes, and client approvals required) and the initial financial capital needed to implement a solution. The lower the level of effort and financial capital requirements, the higher the feasibility.
Solutions are sorted into three priority groups, with the first priority solution in the top right box, indicating high profit potential and feasibility. The third priority solutions are on the bottom left of the graph, indicating low profit potential and feasibility but potential importance to foodservice providers for nonfinancial reasons.
• The solutions with greatest profit potential for foodservice providers are both Prevention solutions: Waste Tracking & Analytics, and Inventory Management & Production Planning.
• The most feasible solutions (meaning easiest to implement and requiring lowest capital investment), are Menu Design and Service Style, Produce Specifications, Optimized Quantities, Donation Tax Incentives, Donation Liability Education, Donation Matching Partnerships, and Cooking Oil Recycling.
This solutions matrix was developed using a combination of quantitative and qualitative data. It is designed to help foodservice providers prioritize solutions based on business value, and does not reflect broader societal economic value. The matrix represents current landscape of the industry, and will evolve over time in response to shifts in: innovation, policy, and client and guest preferences, and as better data becomes available. More details on each solution ranking can be found in Appendix B: Foodservice Solution Matrix Detail.
ReFED | Foodservice Food Waste Action Guide 8
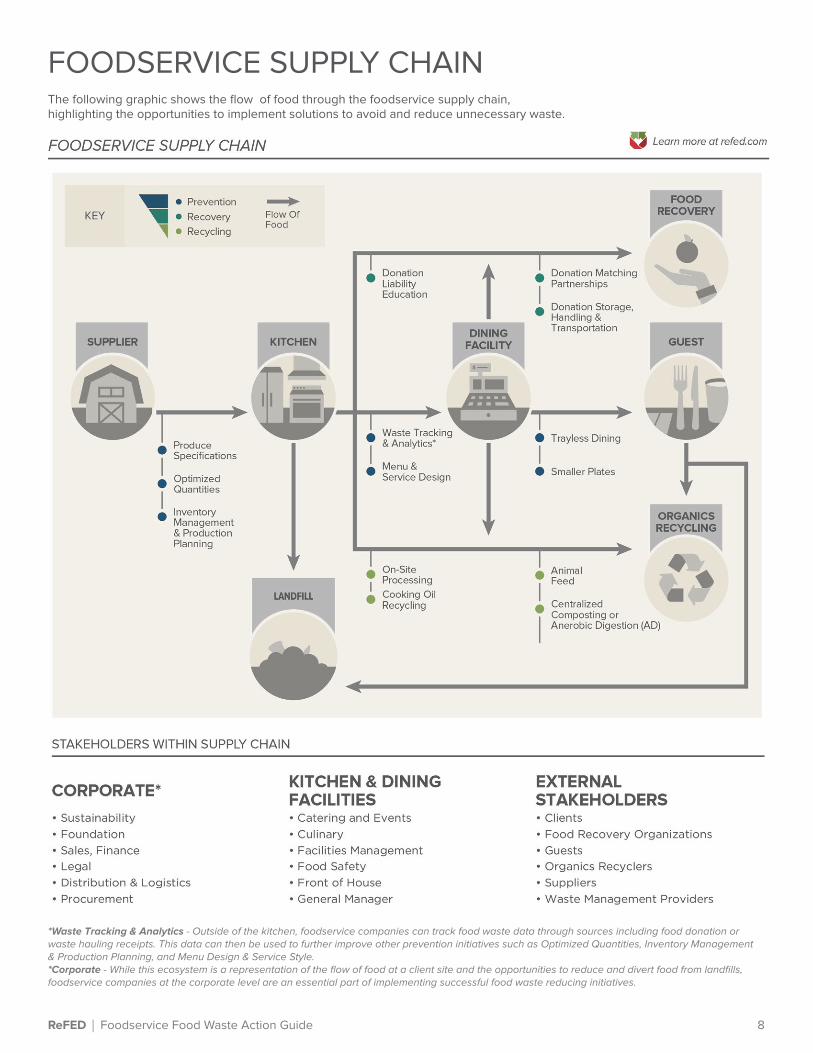
FOODSERVICE SUPPLY CHAINThe following graphic shows the flow of food through the foodservice supply chain, highlighting the opportunities to implement solutions to avoid and reduce unnecessary waste.
*Waste Tracking & Analytics - Outside of the kitchen, foodservice companies can track food waste data through sources including food donation or waste hauling receipts. This data can then be used to further improve other prevention initiatives such as Optimized Quantities, Inventory Management & Production Planning, and Menu Design & Service Style.*Corporate - While this ecosystem is a representation of the flow of food at a client site and the opportunities to reduce and divert food from landfills, foodservice companies at the corporate level are an essential part of implementing successful food waste reducing initiatives.
9
PREVENTION SOLUTIONS
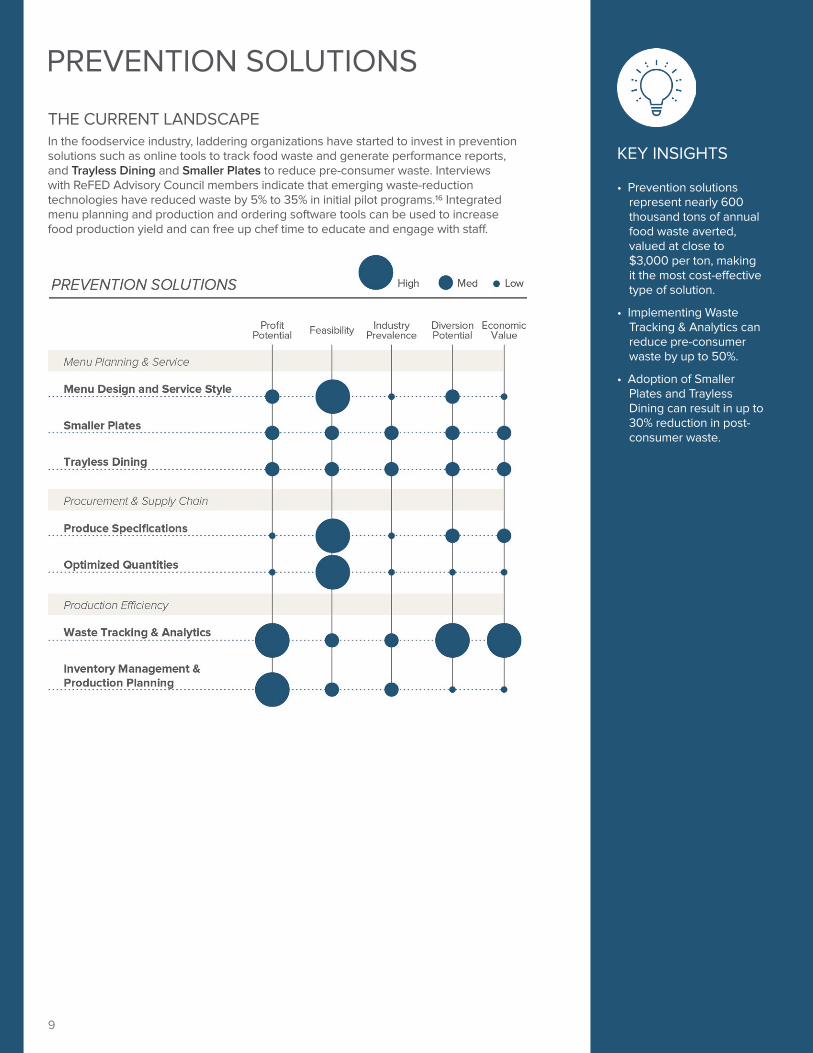
THE CURRENT LANDSCAPEIn the foodservice industry, laddering organizations have started to invest in prevention solutions such as online tools to track food waste and generate performance reports, and Trayless Dining and Smaller Plates to reduce pre-consumer waste. Interviews with ReFED Advisory Council members indicate that emerging waste-reduction technologies have reduced waste by 5% to 35% in initial pilot programs.16 Integrated menu planning and production and ordering software tools can be used to increase food production yield and can free up chef time to educate and engage with staff.
KEY INSIGHTS
• Prevention solutions represent nearly 600 thousand tons of annual food waste averted, valued at close to $3,000 per ton, making it the most cost-effective type of solution.
• Implementing Waste Tracking & Analytics can reduce pre-consumer waste by up to 50%.
• Adoption of Smaller Plates and Trayless Dining can result in up to 30% reduction in post-consumer waste.

ReFED | Foodservice Food Waste Action Guide 10
MENU DESIGN AND SERVICE STYLE
BENEFITS
Unique menu design with features such as multiple portion choices allows consumers to order meals that best suit their appetite and encourages them to order only what they want. This solution also provides chefs with the opportunity to be creative with menu design, using whole products and cross-utilizing ingredients to save on food costs.
BEST PRACTICES
• Encourage site managers to work with clients on alternative service models and provide them with resources to guide conversation. Alternative service models could include: plated or refill service, Smaller Plates, Trayless Dining, and meal customization. Other options include: different portion sizes, (e.g., a regular and “lite” option), side dish options, and the opportunity to sample food.
• Encourage culinary teams to be thoughtful about buffet order quantities and to offer just-in-time top-offs.
• When planning menus, minimize the range of ingredients used across dishes to maximize opportunities for cross-utilization.
• Standardize training of new culinary team members to include: optimized food preparation, batch cooking, specific portion sizes, and cross-utilization and repurposing of food trim and excess food.
• Make clear in recipe books how many portions should be delivered from packaged ingredients.
University of Massachusetts Amherst launched the Sustainability Program Pledge by Jehangir. With Chef Jehangir Mehta's consultation, the cooks feel empowered to be more imaginative in their culinary techniques and to create menu items using food trim and surplus food (e.g., oatmeal cake that incorporates leftover oatmeal from the breakfast buffet line or turkey salad made with turkey trim from the deli slicer). Not only has the Pledge resulted in reduced food waste, but the University is realizing cost savings. For instance, the culinary team began making vegetable soup with vegetable trimmings instead of purchasing new ingredients, reducing the dish’s food costs from 28% down to 12%.8
CHEF-DRIVEN FOOD WASTE REDUCTION
Menu Planning & ServiceMenu planning and design is critical to minimizing both pre- and post-consumer waste. Design menus to allow for the use of whole ingredients, and give chefs the flexibility to customize dishes to repurpose surplus food. Guest service options also influence levels of food waste: Trayless Dining and Smaller Plates have the potential to reduce food waste in the foodservice sector by 155,000 tons per year, the equivalent of 258 million meals.17
Implementation Effort
Initial Capital Requirement
Medium Low

11
TRAYLESS DINING
SMALLER PLATES
BENEFITS
Foodservice providers can achieve a positive return on investment, with a payback in as short as one to two months, by retrofitting dining facilities to switch to Trayless Dining, which reduces food purchase costs. Eliminating trays also reduces net waste by 30% or more in foodservice settings.18 Overall, this solution yields a diversion potential of 65,000 tons at a societal economic value of $147 million. 19
BEST PRACTICES
• Inform customers about Trayless Dining through media campaigns; display waste-related messaging on the number of meals saved and resulting greenhouse gas reduction benefits.
BENEFITS
Using smaller plate sizes in self-service settings results in smaller consumer portion sizes and can reduce waste by 20%.20 This solution can also divert up to 600,000 tons of waste in colleges and universities.21
BEST PRACTICES
• Change operations to a plated service, where possible, and use smaller plates. Offer meal customization such as different portion sizes (e.g., a regular and a “lite” option) or side dish options.
• To preempt guest resistance to reduced convenience and smaller portions, have site managers prepare signage and other guest messaging to explain the reason for these changes. This can make guests feel part of the food waste-capturing effort.
• Consider piloting alternative plate sizes coupled with educational materials about the importance of reducing waste to gauge consumer reaction and measure business impacts.
By removing trays in its all-you-can-eat facilities, Compass Group allowed diners to practice self-portioning and reduce their own post-consumer plate waste, which contributes 50—75% of overall foodservice waste volumes. This resulted in a reduction of post-consumer plate waste by an average of 30—50%.
GUEST-DRIVEN FOOD WASTE REDUCTION
To engage guests, Google has partnered with LeanPath to put its smart meters and digital data signage product in five of its employee cafes. The goal is simple: to monitor exactly how much post-consumer food is being discarded, and to relay that information back to diners to raise awareness and change behaviors. Digital signs update every five minutes to show how much food has been wasted that day, week, or month, making comparisons to previous totals with visual prompts on how they’re doing. Equating food waste data to lost meals and environmental impacts draws on behavioral science theories. Still early in its deployment, Google and LeanPath are innovating together to transform the back- and front-of-house perceptions to minimize food waste.
ENGAGING GUESTS TO REDUCE POST-CONSUMER WASTE
Implementation Effort
Initial Capital Requirement
Medium Medium
Implementation Effort
Initial Capital Requirement
Medium Medium

ReFED | Foodservice Food Waste Action Guide 12
OPTIMIZED QUANTITIES
PRODUCE SPECIFICATIONS
BENEFITS
By making purchasing decisions based on historic sales information, surplus food data, and inventory logs, site procurement managers can reduce over purchasing, minimize inventory loss, and save money.
BEST PRACTICES
• Closely engage with suppliers and negotiate deals that best suit clients’ menus and volume of consumers. This could include varying pack sizes (e.g., split packs and smaller minimum order quantities so that inventory is kept low and fresh food can be ordered regularly).
• Institute feedback mechanisms that allow chefs to adjust supply specifications.
• Provide on-site teams with flexibility to reach out to local farms and procure locally, especially for seasonal items. Local suppliers are likely to be able to provide small regular orders of fresh food.
• Encourage sites to choose suppliers that can provide specific quantities when needed. Generally, the longer the lead time and the larger the pack size, the more inventory and the greater the potential for food waste.
BENEFITS
Off-spec produce allows for lower input costs since it can be used as a lower-cost substitute for retail-grade, cosmetically perfect food. An estimated 35% of off-spec produce is fit for foodservice applications and can be rescued from farms in a safe and cost-effective manner.22
BEST PRACTICES
• Encourage sites to consider alternative produce specifications such as off-spec produce and pre-trimmed meat.
• Set up pilots to partner with individual farmers and distributors to assess the financial benefit of utilizing off-spec produce.
Starting in 2014, Bon Appétit Management Company (BAMCO) and its parent company, Compass Group USA, led the challenge to reduce food and water waste coming from its farms. To date, three million pounds of cosmetically challenged fruits and vegetables have been rescued through its Imperfectly Delicious Produce (IDP) program.
SETTING UP A DEDICATED OFF-SPEC PRODUCE PROGRAM
Procurement & Supply ChainExpanding produce specifications to include off-spec produce, pre-trimmed food, frozen items, and pack size variations unleashes tremendous potential to cut wasted food. This practice can be tailored to suit both small and large operations.
Implementation Effort
Initial Capital Requirement
Medium Low
Implementation Effort
Initial Capital Requirement
Low Low

13
Production EfficiencyUnderstanding where, how, and why food waste is generated can help businesses develop and implement procedures to standardize the management of food, minimizing food loss. According to 2016 data from a leading waste tracking company, 41% of waste transactions relate to overproduction, illustrating the opportunity to improve production systems and prevent waste.23
WASTE TRACKING & ANALYTICS
BENEFITS
Waste Tracking and Analytics can reduce pre-consumer waste by up to 50%.24 The accurate data this solution provides opens a wide range of possibilities for goal setting, progress tracking, and continuous improvement.
BEST PRACTICES
• Most useful waste tracking systems will capture: the weight (e.g., volume), type (e.g., fruits, vegetables) and source (e.g., spoilage, overproduction) of food waste, and use the information to improve kitchen operations. They can also feed the data directly into production planning systems to reduce overproduction and perform data analysis, reporting site-by-site comparisons via an online software platform. This enables target setting and continuous improvement.
• In smaller operations where there is less waste, institutional waste-tracking costs (including an upfront investment for software) can be relatively high. To mitigate costs, pilot a manual waste tracking system at a handful of sites. Some sites use hand-written production logs to capture amounts of food ordered, prepared, and left over, which are then transferred to a spreadsheet or app (See resources list, p. 36). Doing this highlights the volume of wasted food and associated dollars that can be used to build a business case for investment in waste-tracking tools.
• Pre- and post-consumer food waste are useful to track, as the resulting data can inform potential waste-reducing menu changes. Establish a baseline before implementing programs in order to track progress more accurately.
• Make space for food waste bins at all major stations that generate/receive waste, such as prep areas and plate-return areas.
Aramark established a goal to reduce food waste 50% by 2030. The company delivers on this commitment through its Green Thread™ platform, which provides resources and tools to reduce, reuse, and recycle food and other wastes. To meet this goal, Aramark integrated LeanPath’s tracking and analytics platform in 500 of its largest accounts. Since rolling out the waste tracking software in 2016, it has reduced food waste by 44% on average across 161 sites and avoided sending 479 tons of food waste to a landfill.25
TOOLS FOR REDUCING FOOD WASTE
Based on LeanPath data for over 100 foodservice sites of various sectors and sizes, there is an average food cost savings of about $90,000 per site, or $12 saved for every $1 invested in waste tracking.26
Implementation Effort
Initial Capital Requirement
Medium Medium

ReFED | Foodservice Food Waste Action Guide 14
INVENTORY MANAGEMENT & PRODUCTION PLANNING
BENEFITS
By investing in inventory systems that are linked to both menu planning and sales data, production planning can be mapped to demand. This practice results in reduced opportunity for foods to go unused and expire, minimizes overproduction, and reduces food waste, potentially decreasing hauling costs and increasing savings. This solution can also help companies address client concerns over not having enough food for guests.
BEST PRACTICES
• Encourage sites to improve demand forecasting using historic sales data and future considerations such as holidays and annual events.
• Use software that links demand forecasting with menu plans and recipe ingredient lists to help automate production planning and ordering processes.
• Use data from waste tracking as feedback to adjust ordering and production planning, and to inform portion control measures.
• If possible, compare the Electronic Point of Sale Systems (EPOS) data with production data to identify overproduction by menu item and to inform future production planning and ordering.
• Design training modules and a communications plan to disseminate information from corporate to the front line, and provide feedback loops back to corporate to allow continuous improvement.
• Strong corporate leadership overcomes organizational silos; managers, chefs, and kitchen staff all need to buy into the benefits to coordinate implementation. If frontline staff understand the rationale for cutting kitchen waste, they are more likely to be engaged, resulting in better-quality data.
Compass Group utilizes a comprehensive platform that reduces food waste by managing menus, ordering, production records, and waste tracking. Included is an extensive set of online tools the company created for chefs, which provides simple demand forecasting for five billion meals served around the world throughout the year. The tool scales recipe ingredients taken from the week’s menus to quantify production needs. It can also be used to link “special” menus to the ordering system and includes live data reflecting price spikes for various products. Waste information is tracked by the chef and feeds back into the system to help reduce over-production.
CUTTING DOWN ON OVERPRODUCTION
IF FRONTLINE STAFF UNDERSTAND THE RATIONALE FOR CUTTING KITCHEN WASTE, THEY ARE MORE LIKELY TO BE ENGAGED, RESULTING IN BETTER-QUALITY DATA.
Implementation Effort
Initial Capital Requirement
Medium Medium

15
RECOVERY SOLUTIONS
THE CURRENT LANDSCAPERecent improvements in food donation tax legislation have enhanced the ability of foodservice businesses to claim deductions. The 2015 Protecting Americans from Tax Hikes (PATH) Act entitles eligible foodservice businesses to enhanced deductions previously accessible only to large C-corporations. A donating business's total annual charitable deductions are capped at different rates, depending on what type of business makes the donation. For example, C-corporations generally cannot deduct more than 10% of their taxable income for the year, except when the corporation has donated food that can increase its deduction up to 15%. In contrast, a non-C-Corporation business can receive a total charitable deduction (for all food and other eligible donations) up to 30% of the business’s taxable income for the year. Businesses can deduct the lesser of either twice the basis.27 Businesses can deduct the lesser of either twice the basis value of the donated food or the basis value of the donated food plus one-half of the food's expected profit margin (i.e., the profit margin the donor would expect to capture if the food were sold at its fair market value).28 The basis value is the amount the business paid for the product.
To address liability concerns among food donors, education is needed around the federal Bill Emerson Good Samaritan Food Donation Act, which protects donors and recipients from civil or criminal liability short of gross negligence and misconduct. Foodservice operations that actively manage food safety will be better equipped to donate surplus food with confidence.
KEY INSIGHTS
• Only 10% of surplus food is being recovered in the combined foodservice and restaurant sector, leaving 900,000 tons of surplus food unrecovered —the equivalent of 1.5 billion meals per year.
• Liability protections for food donations exist but education is needed to promote awareness and understanding of the federal Bill Emerson Good Samaritan Food Donation Act, which protects donors and recipients from liability.
• Recent improvements in food donation tax legislation have enhanced the ability of foodservice businesses to claim deductions. The 2015 Protecting Americans from Tax Hikes (PATH) Act entitles eligible foodservice businesses to enhanced deductions previously accessible only to large C Corporations.
• Effective donation tracking programs can lead to a 25% reduction in surplus (pre-consumer waste) food when used in conjunction with prevention initiatives.

ReFED | Foodservice Food Waste Action Guide 16
FOOD RECOVERY GET-STARTED PLAN
1. DETERMINE THE BUSINESS CASE FOR DONATION Provide sites with waste-tracking procedures and equipment to record and monitor surplus food amounts. On-site teams can use a spreadsheet to calculate potential collection and disposal costs saved, number of meals saved, and potential tax benefit.
Offer clear guidelines on staff and management time required, potential reputational and sustainability benefits for site and client, and information on where to go for help.
2. CONSIDER THE POLICY LANDSCAPEEvaluate the policy landscape, including an understanding of the Good Samaritan Food Donation Act and state and local laws, to determine whether enhanced tax donations are available. Develop and distribute a list of resources for operational teams, like the donation fact sheet from the Harvard Food Law and Policy Clinic for help on how to qualify for, claim, and calculate deduction allowances.29
3. ENGAGE CLIENT PARTICIPATIONWork with the sales team to incorporate donation programs into client contracts by conveying their reputational benefits, how they are aligned with corporate objectives, and potential tax deductions. Adopt and demonstrate a food safety culture.
Make sure bid writers can address liability fears in proposals.27 Design contracts to facilitate food recovery and allow for the transfer of ownership of unsold food, which will allow tax donation deductions to be realized. Provide supporting literature on proper storage, handling, and transport procedures.
4. IDENTIFY LOCAL PARTNERSLink national contracts with food donation organizations or food donation matching organizations (see resources list, p. 36).
Develop a checklist to help sites choose a food donation partner specifying: types of surplus food produced; collection times, transport infrastructure, processes, and procedures in place for safe delivery of food to recipient; and information needed from the food donation organization to make tax deduction claims.
5. IMPLEMENT THE PROGRAMTo help gain buy-in from the client, suggest a pilot at one dining location and, if successful, roll out the program to other areas.
Involve site management in liability protection and safe handling (HACCP) education for staff, including labeling and storing of surplus food. Consider using National Restaurant Association’s ServSafe courses and examinations to help minimize food safety hazards. Involve the tax and accounting departments in obtaining proper documentation from both the site and food donation partner for potential tax rebates. Provide a spreadsheet or online platform that converts the donated food quantities to meal equivalents, and encourage sharing of this information with client and guests. Good relationships and open communication of problems with donation partners will facilitate timely collections.
Develop and implement procedures that ensure food is prepared, stored, and served in a manner that reduces the risk of causing foodborne illness. Train employees on safe food handling practices and monitor operations to minimize food safety hazards in any donated foods.
6. REVIEW AND UPDATEProvide sites with checklists to assess program effectiveness and re-evaluate partners and processes. In training manuals, detail the need for regular training on food donation, as staff turnover can result in unsafe practices and/or aborted programs.

17
DONATION TAX INCENTIVES
BENEFITS
Under the IRS Code, businesses that donate food are eligible for additional enhanced tax deductions. These benefits will be augmented by reduced food disposal costs, but those may be partially offset by costs such as labor to coordinate donations and packaging. The net financial impact will vary based on a foodservice operator’s specific circumstances. Variables include contractual and organizational factors related to ownership of the food, and the possibility that work associated with handling food donations and the related tax breaks may be recognized by different organizational entities. A donor will never make a profit by donating surplus food, but will lose less money because of this tax deduction and subsequent tax savings.
BEST PRACTICES
• Tax deductions provide a financial incentive by making food donations more cost effective.
• Internal Revenue Code 170(e)(3) (the Code) provides enhanced tax deductions to businesses to encourage donations of fit and wholesome food to qualified nonprofit organizations serving the poor and needy.
• The PATH Act, formally known as the 2015 Protecting Americans from Tax Hikes, gives eligible businesses permanent access to enhanced deductions. Businesses can deduct the lesser of twice the basis value of the donated food or the basis value of the donated food plus one-half of the food's expected profit margin (i.e., the profit margin the donor would expect to capture if the food were sold at its fair market value).
• With the expansion of the deduction in 2015 all businesses, regardless of size or incorporation status, can take the enhanced tax deduction when donating food to a 501(c)(3) nonprofit. The enhancements to the deduction help offset some of the costs of labor needed to separate and store food for donation as well as time spent communicating with food donation organizations.
Food Donation PolicyFood donation programs are most successful when employees and clients understand both the Bill Emerson Good Samaritan Food Donation Act and PATH Act. Education on the protection the former provides is critical to obtaining corporate commitment and dispelling liability myths held by clients and site staff. Data collected in order to apply for enhanced tax deductions through the PATH Act can also serve as a tool to track unnecessary waste and help identify waste prevention actions.
ALL BUSINESSES, REGARDLESS OF SIZE OR INCORPORATION STATUS, CAN TAKE THE ENHANCED TAX DEDUCTION WHEN DONATING FOOD TO A NONPROFIT.
Implementation Effort
Initial Capital Requirement
Medium Low

ReFED | Foodservice Food Waste Action Guide 18
DONATION LIABILITY EDUCATION
BENEFITS
Developing education and training materials for clients and employees on food donation liability and procedures—and making these permanent practices of the business—will help gain buy-in to food donation programs, and make implementation easier.
BEST PRACTICES
• Prepare simple presentation materials for staff on facts to address liability myths.28 Note that the Good Samaritan Act is federal law, and states cannot have a lower level of protection for donors. Some states may provide even greater liability protections, and/or additional tax breaks that complement those at the federal level.
• Use ReFED’s Food Waste Policy Finder to navigate state food liability requirements.
• Instill confidence in clients by signing a donation waiver and indemnity agreement with the company’s chosen recovery organization. Ensure that the organization has a valid certificate of insurance naming the company as an additional insured entity, or receive third-party verification.
• One way of reinforcing commitment and touting food recovery efforts as part of a company’s brand is to seek third-party verification. Food Recovery Verified (FRV) recognizes food businesses that are working to fight waste and feed people by donating surplus food at least once a month to nonprofits fighting hunger. Sponsored by the student-run nonprofit Food Recovery Network, the objective of FRV is to enhance national awareness and participation in food recovery.30
As part of its Better Tomorrow 2025 Roadmap, Sodexo is committed to eliminating food waste in its operations and to fighting hunger and malnutrition through its Stop Hunger programs. To support these efforts, Sodexo created an on-demand webinar that takes employees through the process of implementing a food recovery program at their account to educate employees about food donation liability and best practices. The company also produced a standard liability agreement that sites and their local food donation nonprofit partners can individualize as extra liability protection beyond federal and local levels. Such actions helped Sodexo facilitate the donation of nearly one million pounds of surplus food in the U.S. in fiscal year 2017 alone.
SETTING EMPLOYEES UP FOR SUCCESS TO DONATE SURPLUS FOOD
Visit refed.com/policy to learn more about food waste policy.
REFED RESOURCE
Implementation Effort
Initial Capital Requirement
Medium Low
19
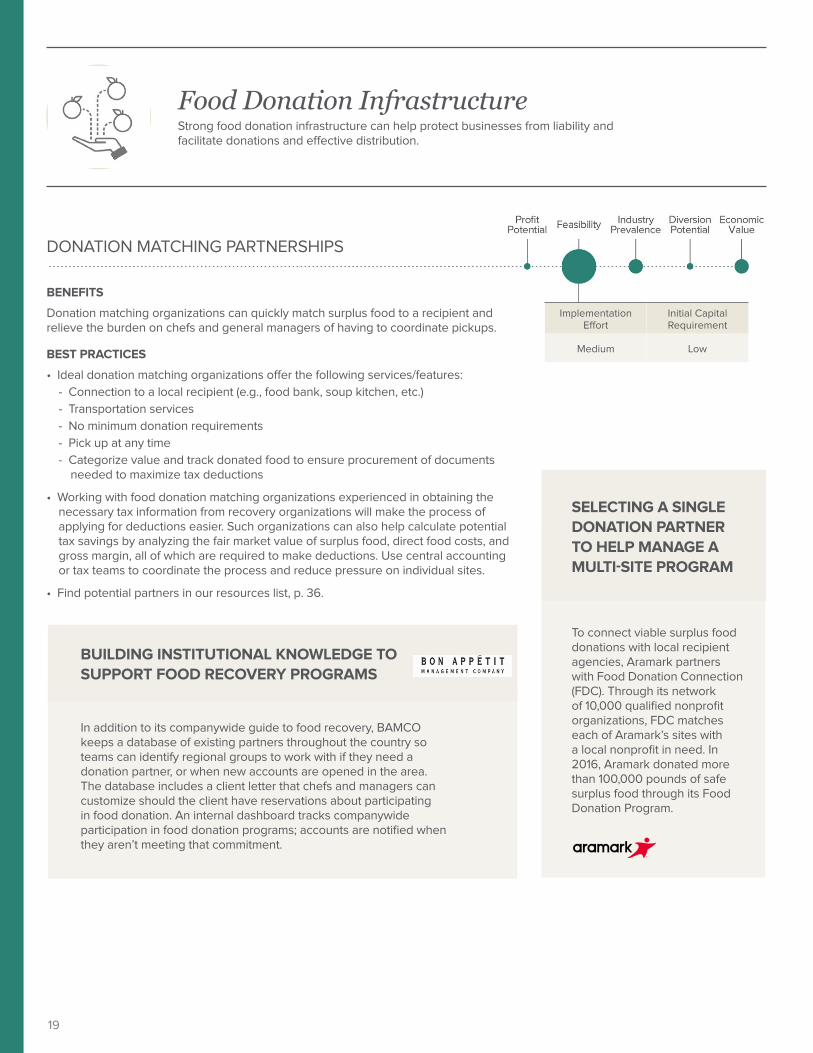
To connect viable surplus food donations with local recipient agencies, Aramark partners with Food Donation Connection (FDC). Through its network of 10,000 qualified nonprofit organizations, FDC matches each of Aramark’s sites with a local nonprofit in need. In 2016, Aramark donated more than 100,000 pounds of safe surplus food through its Food Donation Program.
In addition to its companywide guide to food recovery, BAMCO keeps a database of existing partners throughout the country so teams can identify regional groups to work with if they need a donation partner, or when new accounts are opened in the area. The database includes a client letter that chefs and managers can customize should the client have reservations about participating in food donation. An internal dashboard tracks companywide participation in food donation programs; accounts are notified when they aren’t meeting that commitment.
SELECTING A SINGLE DONATION PARTNER TO HELP MANAGE A MULTI-SITE PROGRAM
BUILDING INSTITUTIONAL KNOWLEDGE TO SUPPORT FOOD RECOVERY PROGRAMS
DONATION MATCHING PARTNERSHIPS
BENEFITS
Donation matching organizations can quickly match surplus food to a recipient and relieve the burden on chefs and general managers of having to coordinate pickups.
BEST PRACTICES
• Ideal donation matching organizations offer the following services/features:- Connection to a local recipient (e.g., food bank, soup kitchen, etc.)- Transportation services- No minimum donation requirements- Pick up at any time- Categorize value and track donated food to ensure procurement of documents
needed to maximize tax deductions
• Working with food donation matching organizations experienced in obtaining the necessary tax information from recovery organizations will make the process of applying for deductions easier. Such organizations can also help calculate potential tax savings by analyzing the fair market value of surplus food, direct food costs, and gross margin, all of which are required to make deductions. Use central accounting or tax teams to coordinate the process and reduce pressure on individual sites.
• Find potential partners in our resources list, p. 36.
Food Donation InfrastructureStrong food donation infrastructure can help protect businesses from liability and facilitate donations and effective distribution.
Implementation Effort
Initial Capital Requirement
Medium Low
ReFED | Foodservice Food Waste Action Guide 20
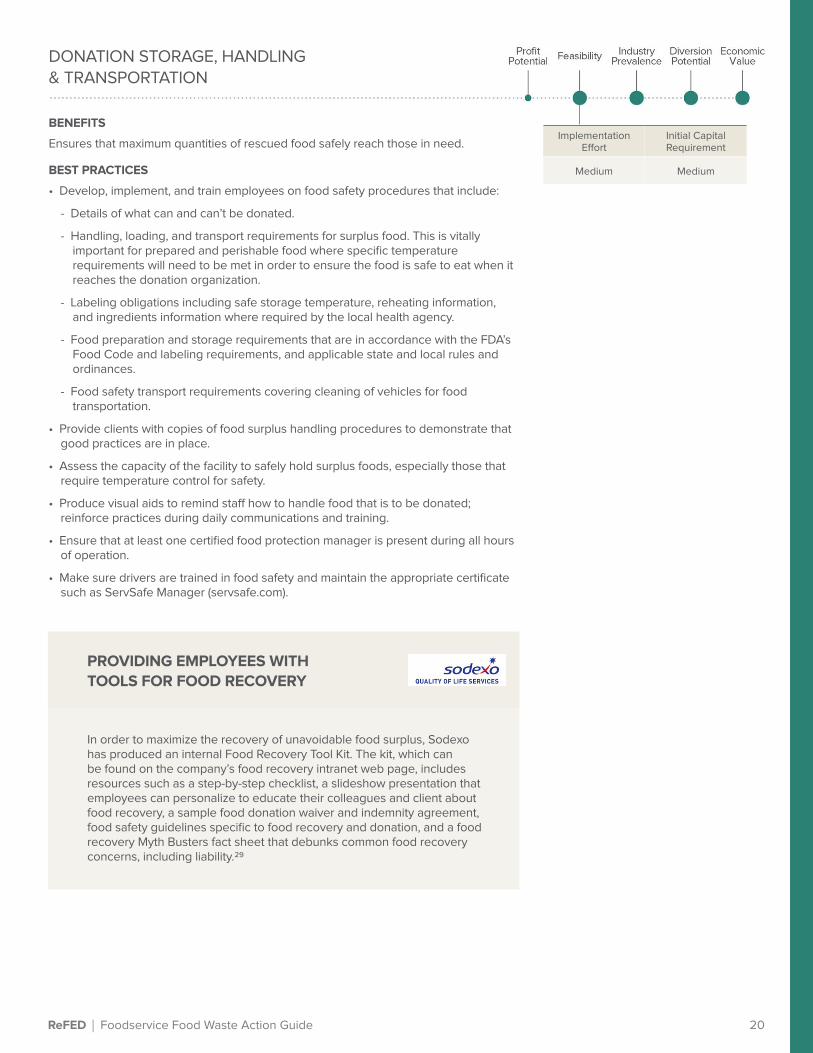
In order to maximize the recovery of unavoidable food surplus, Sodexo has produced an internal Food Recovery Tool Kit. The kit, which can be found on the company’s food recovery intranet web page, includes resources such as a step-by-step checklist, a slideshow presentation that employees can personalize to educate their colleagues and client about food recovery, a sample food donation waiver and indemnity agreement, food safety guidelines specific to food recovery and donation, and a food recovery Myth Busters fact sheet that debunks common food recovery concerns, including liability.29
PROVIDING EMPLOYEES WITH TOOLS FOR FOOD RECOVERY
DONATION STORAGE, HANDLING & TRANSPORTATION
BENEFITS
Ensures that maximum quantities of rescued food safely reach those in need.
BEST PRACTICES
• Develop, implement, and train employees on food safety procedures that include:
- Details of what can and can’t be donated.
- Handling, loading, and transport requirements for surplus food. This is vitally important for prepared and perishable food where specific temperature requirements will need to be met in order to ensure the food is safe to eat when it reaches the donation organization.
- Labeling obligations including safe storage temperature, reheating information, and ingredients information where required by the local health agency.
- Food preparation and storage requirements that are in accordance with the FDA’s Food Code and labeling requirements, and applicable state and local rules and ordinances.
- Food safety transport requirements covering cleaning of vehicles for food transportation.
• Provide clients with copies of food surplus handling procedures to demonstrate that good practices are in place.
• Assess the capacity of the facility to safely hold surplus foods, especially those that require temperature control for safety.
• Produce visual aids to remind staff how to handle food that is to be donated; reinforce practices during daily communications and training.
• Ensure that at least one certified food protection manager is present during all hours of operation.
• Make sure drivers are trained in food safety and maintain the appropriate certificate such as ServSafe Manager (servsafe.com).
Implementation Effort
Initial Capital Requirement
Medium Medium

21
RECYCLING SOLUTIONS
THE CURRENT LANDSCAPERoughly 73% of the recycling opportunity is expected to come from the creation of Centralized Composting and Centralized Anaerobic Digestion (AD) facilities.31 The economics of recycling is highly sensitive to local labor wages, disposal fees, compost values, and energy prices, however recycling solutions offer the greatest potential to divert food from landfill. Other variables include recycling legislation, availability of central composting, tipping fees, and available infrastructure.
KEY INSIGHTS
• Recycling offers the largest diversion potential to reduce food waste nationally.
• Recycling solutions vary widely by location, with the Northeast, Northwest, and Midwest areas offering the highest economic value due to high landfill disposal fees and high compost and energy market prices.
• Roughly 73% of recycling opportunity is expected to come from the creation of Centralized Composting and Centralized Anaerobic Digestion (AD) facilities.

ReFED | Foodservice Food Waste Action Guide 22
FOOD RECYCLING GET-STARTED PLAN
1. DETERMINE THE FEASIBILITY AND BUSINESS CASE FOR RECYCLING Provide site managers with waste tracking procedures and equipment to record and monitor recyclable wasted food. Develop a recycling map that enables sites to identify the recycling sites located in the area, or direct them to information provided by organizations such as BioCycle (see resources list, p. 36). When no external recycling solution is available, provide sites with a self-assessment tool, including details on space and permitting requirements, that will help them determine if on-site treatment is feasible.
Provide materials on budget needs for different recycling solutions, including information such as internal and external bin costs, and staff time needed to manage the recycling project. Include a contact person that site managers can go to for support.
4. IMPLEMENT THE PROGRAM Detail the merits of a pilot versus a full rollout so sites can assess implementation risk. Provide the site with an implementation toolkit. This should include: training material on what can and cannot be recycled; considerations when choosing internal and external bins; and signage needed for the program.
Provide site managers with spreadsheets or an online platform to calculate the financial and environmental benefits of recycling, and have them record the quantity of food waste recycled. This information can be provided to clients and used to motivate staff.
2. ENGAGE THE CLIENTDiscuss with the client the merits of handling the treatment and disposal of food surplus on their behalf. In cases where sites do not control hauling contracts, coach the client on how to make a strong business case for recycling.
5. REVIEW AND UPDATE Provide sites with checklists to assess the effectiveness of the program and re-evaluate partners and processes. In instructional materials, highlight the need for regular training on food recycling as staff turnover can result in wasted food being contaminated then rejected by the recycler.
3. IDENTIFY PARTNERSProvide site managers with written guidance on finding a hauler, including information needed and questions to ask to ensure the service is reliable, legally compliant, and fixed in price. Encourage managers to seek clarity on the types of disposables the recycler will and won’t accept (e.g., compostable cutlery), and what happens if compost becomes contaminated.
Where applicable, consider setting up national contracts for recycling services to standardize pricing and reduce management time. Provide standard contracts for sites to use with recyclers, or a list of key clauses that should be included such as requirements for tonnage data or annual performance reviews.
23
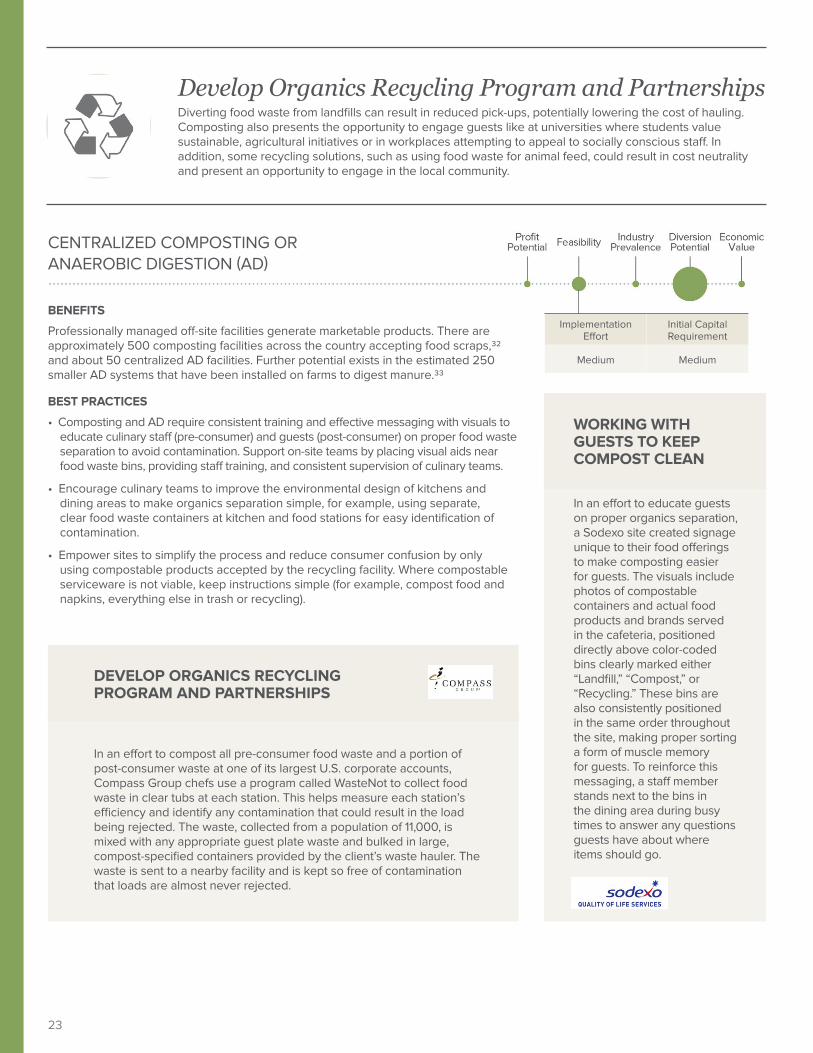
CENTRALIZED COMPOSTING OR ANAEROBIC DIGESTION (AD)
BENEFITS
Professionally managed off-site facilities generate marketable products. There are approximately 500 composting facilities across the country accepting food scraps,32 and about 50 centralized AD facilities. Further potential exists in the estimated 250 smaller AD systems that have been installed on farms to digest manure.33
BEST PRACTICES
• Composting and AD require consistent training and effective messaging with visuals to educate culinary staff (pre-consumer) and guests (post-consumer) on proper food waste separation to avoid contamination. Support on-site teams by placing visual aids near food waste bins, providing staff training, and consistent supervision of culinary teams.
• Encourage culinary teams to improve the environmental design of kitchens and dining areas to make organics separation simple, for example, using separate, clear food waste containers at kitchen and food stations for easy identification of contamination.
• Empower sites to simplify the process and reduce consumer confusion by only using compostable products accepted by the recycling facility. Where compostable serviceware is not viable, keep instructions simple (for example, compost food and napkins, everything else in trash or recycling).
In an effort to compost all pre-consumer food waste and a portion of post-consumer waste at one of its largest U.S. corporate accounts, Compass Group chefs use a program called WasteNot to collect food waste in clear tubs at each station. This helps measure each station’s efficiency and identify any contamination that could result in the load being rejected. The waste, collected from a population of 11,000, is mixed with any appropriate guest plate waste and bulked in large, compost-specified containers provided by the client’s waste hauler. The waste is sent to a nearby facility and is kept so free of contamination that loads are almost never rejected.
DEVELOP ORGANICS RECYCLING PROGRAM AND PARTNERSHIPS
Develop Organics Recycling Program and PartnershipsDiverting food waste from landfills can result in reduced pick-ups, potentially lowering the cost of hauling. Composting also presents the opportunity to engage guests like at universities where students value sustainable, agricultural initiatives or in workplaces attempting to appeal to socially conscious staff. In addition, some recycling solutions, such as using food waste for animal feed, could result in cost neutrality and present an opportunity to engage in the local community.
In an effort to educate guests on proper organics separation, a Sodexo site created signage unique to their food offerings to make composting easier for guests. The visuals include photos of compostable containers and actual food products and brands served in the cafeteria, positioned directly above color-coded bins clearly marked either “Landfill,” “Compost,” or “Recycling.” These bins are also consistently positioned in the same order throughout the site, making proper sorting a form of muscle memory for guests. To reinforce this messaging, a staff member stands next to the bins in the dining area during busy times to answer any questions guests have about where items should go.
WORKING WITH GUESTS TO KEEP COMPOST CLEAN
Implementation Effort
Initial Capital Requirement
Medium Medium

ReFED | Foodservice Food Waste Action Guide 24
ON-SITE PROCESSING
BENEFITS
Small-scale, on-site, and in-vessel composting devices with heat and mechanical power break down organics relatively quickly and eliminate hauling fees. This solution is ideal for large client sites that have consistent organic material to be processed on a regular basis, and that also have a need for compost to be used on-site for landscaping projects, on-site vegetable gardens, or farms.
BEST PRACTICES
• Understand the regulations for on-site processing in each client's state and city. (For more information, see State Compost Regulations.34)
• Choose a supplier that can provide technical support and train staff on what can and can’t be processed through the equipment.
• Clearly designate who is in charge of operation and maintenance of the equipment.
When Delaware North’s compost partner at Shenandoah National Park closed for business, the park’s remote location and the distance between the Delaware North-operated facilities at the park from it made finding another composting organization difficult. Extensive research led the company to Green Mountain Technologies (GMT) an on-site compost solutions provider, near Seattle. Because of concerns over wildlife intrusion, Delaware North chose an Earth Flow unit housed in a shipping container rather than the typical 20-by-8-foot steel tub Earth Flow model covered with a greenhouse dome. The sealed-vessel system uses aeration and an automated auger (tool for boring holes in compost) to expedite composting, yielding a consistent product and cutting the composting cycle from 6 months to 14-21 days. It requires little manpower, is energy-efficient, and highly effective. All waste that enters the unit is weighed and tracked. The resulting compost is used for landscaping Delaware North property and donated to the National Parks Service and local nonprofit farms.
USING IN-VESSEL COMPOSTING TO OVERCOME INFRASTRUCTURE CHALLENGES
Implementation Effort
Initial Capital Requirement
High High
25
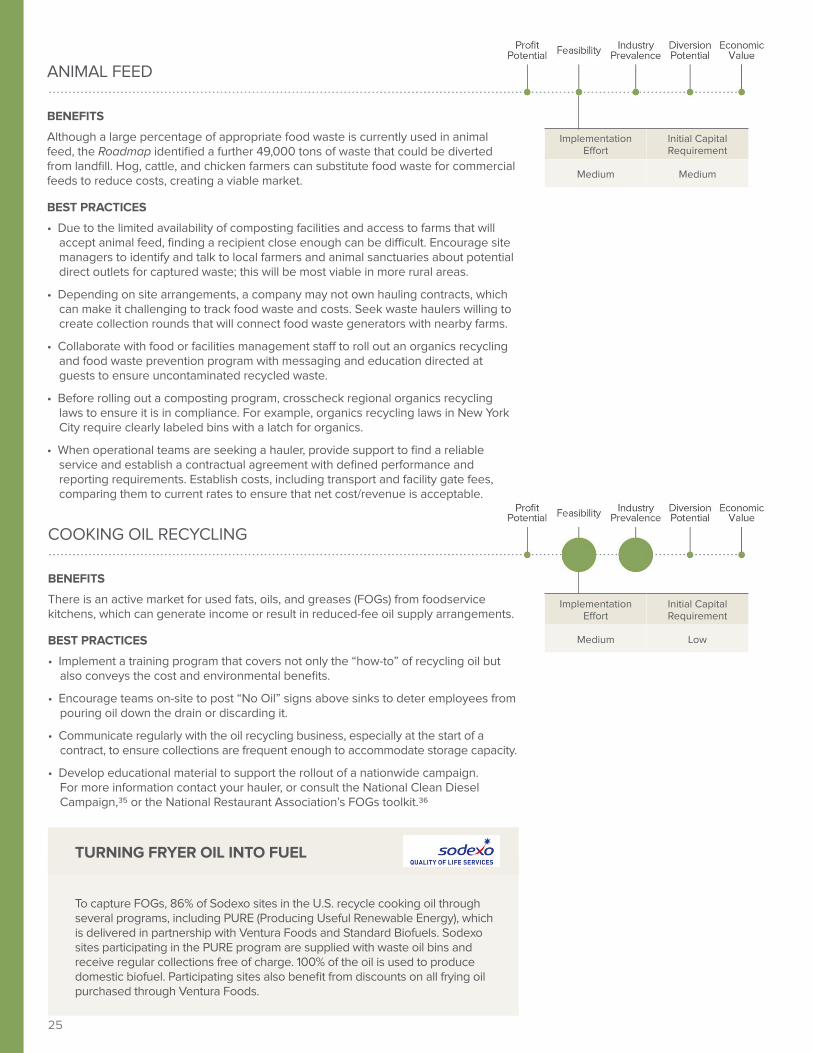
COOKING OIL RECYCLING
BENEFITS
There is an active market for used fats, oils, and greases (FOGs) from foodservice kitchens, which can generate income or result in reduced-fee oil supply arrangements.
BEST PRACTICES
• Implement a training program that covers not only the “how-to” of recycling oil but also conveys the cost and environmental benefits.
• Encourage teams on-site to post “No Oil” signs above sinks to deter employees from pouring oil down the drain or discarding it.
• Communicate regularly with the oil recycling business, especially at the start of a contract, to ensure collections are frequent enough to accommodate storage capacity.
• Develop educational material to support the rollout of a nationwide campaign. For more information contact your hauler, or consult the National Clean Diesel Campaign,35 or the National Restaurant Association’s FOGs toolkit.36
To capture FOGs, 86% of Sodexo sites in the U.S. recycle cooking oil through several programs, including PURE (Producing Useful Renewable Energy), which is delivered in partnership with Ventura Foods and Standard Biofuels. Sodexo sites participating in the PURE program are supplied with waste oil bins and receive regular collections free of charge. 100% of the oil is used to produce domestic biofuel. Participating sites also benefit from discounts on all frying oil purchased through Ventura Foods.
TURNING FRYER OIL INTO FUEL
ANIMAL FEED
BENEFITS
Although a large percentage of appropriate food waste is currently used in animal feed, the Roadmap identified a further 49,000 tons of waste that could be diverted from landfill. Hog, cattle, and chicken farmers can substitute food waste for commercial feeds to reduce costs, creating a viable market.
BEST PRACTICES
• Due to the limited availability of composting facilities and access to farms that will accept animal feed, finding a recipient close enough can be difficult. Encourage site managers to identify and talk to local farmers and animal sanctuaries about potential direct outlets for captured waste; this will be most viable in more rural areas.
• Depending on site arrangements, a company may not own hauling contracts, which can make it challenging to track food waste and costs. Seek waste haulers willing to create collection rounds that will connect food waste generators with nearby farms.
• Collaborate with food or facilities management staff to roll out an organics recycling and food waste prevention program with messaging and education directed at guests to ensure uncontaminated recycled waste.
• Before rolling out a composting program, crosscheck regional organics recycling laws to ensure it is in compliance. For example, organics recycling laws in New York City require clearly labeled bins with a latch for organics.
• When operational teams are seeking a hauler, provide support to find a reliable service and establish a contractual agreement with defined performance and reporting requirements. Establish costs, including transport and facility gate fees, comparing them to current rates to ensure that net cost/revenue is acceptable.
Implementation Effort
Initial Capital Requirement
Medium Medium
Implementation Effort
Initial Capital Requirement
Medium Low
ReFED | Foodservice Food Waste Action Guide 26
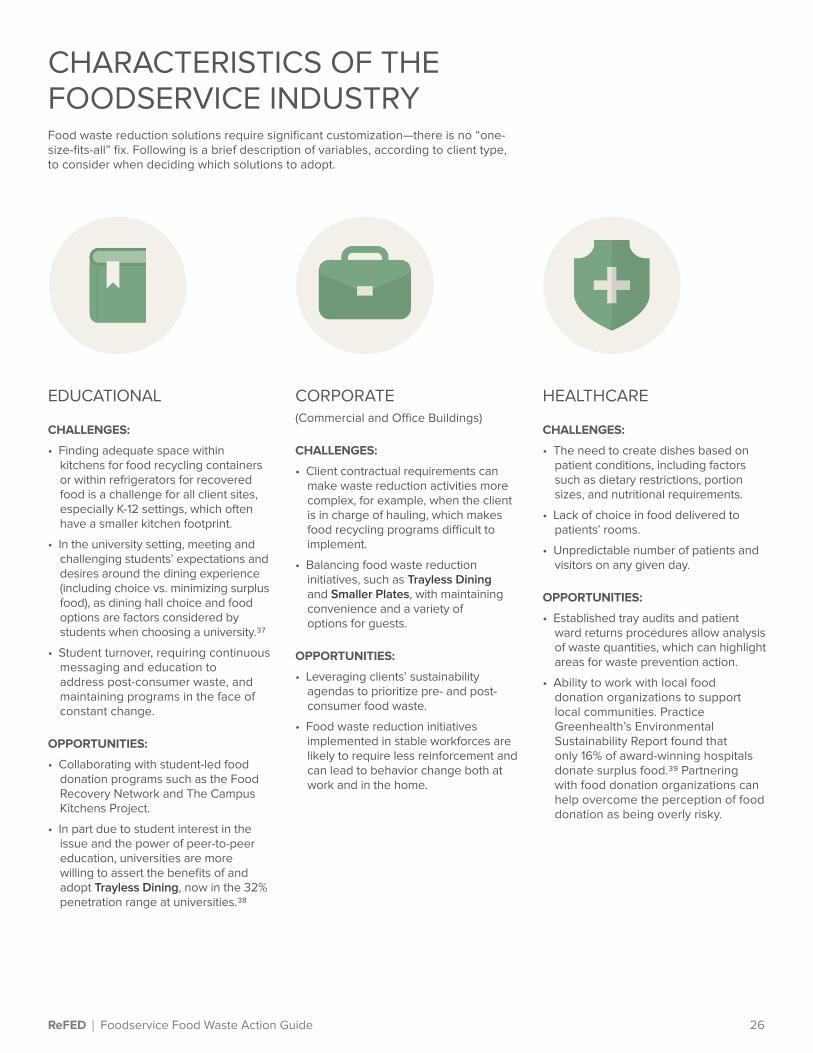
CHARACTERISTICS OF THE FOODSERVICE INDUSTRYFood waste reduction solutions require significant customization—there is no “one-size-fits-all” fix. Following is a brief description of variables, according to client type, to consider when deciding which solutions to adopt.
EDUCATIONAL
CHALLENGES:
• Finding adequate space within kitchens for food recycling containers or within refrigerators for recovered food is a challenge for all client sites, especially K-12 settings, which often have a smaller kitchen footprint.
• In the university setting, meeting and challenging students’ expectations and desires around the dining experience (including choice vs. minimizing surplus food), as dining hall choice and food options are factors considered by students when choosing a university.37
• Student turnover, requiring continuous messaging and education to address post-consumer waste, and maintaining programs in the face of constant change.
OPPORTUNITIES:
• Collaborating with student-led food donation programs such as the Food Recovery Network and The Campus Kitchens Project.
• In part due to student interest in the issue and the power of peer-to-peer education, universities are more willing to assert the benefits of and adopt Trayless Dining, now in the 32% penetration range at universities.38
CORPORATE(Commercial and Office Buildings)
CHALLENGES:
• Client contractual requirements can make waste reduction activities more complex, for example, when the client is in charge of hauling, which makes food recycling programs difficult to implement.
• Balancing food waste reduction initiatives, such as Trayless Dining and Smaller Plates, with maintaining convenience and a variety of options for guests.
OPPORTUNITIES:
• Leveraging clients’ sustainability agendas to prioritize pre- and post-consumer food waste.
• Food waste reduction initiatives implemented in stable workforces are likely to require less reinforcement and can lead to behavior change both at work and in the home.
HEALTHCARE
CHALLENGES:
• The need to create dishes based on patient conditions, including factors such as dietary restrictions, portion sizes, and nutritional requirements.
• Lack of choice in food delivered to patients’ rooms.
• Unpredictable number of patients and visitors on any given day.
OPPORTUNITIES:
• Established tray audits and patient ward returns procedures allow analysis of waste quantities, which can highlight areas for waste prevention action.
• Ability to work with local food donation organizations to support local communities. Practice Greenhealth’s Environmental Sustainability Report found that only 16% of award-winning hospitals donate surplus food.39 Partnering with food donation organizations can help overcome the perception of food donation as being overly risky.
27
CONTRACT STRUCTUREFoodservice contracts are generally Profit & Loss (P&L), in which the contractor bears all financial risk, or Management Fee/Cost Plus, where the client bears all financial risk. As clients face increasing budget pressures, there is a growing trend towards P&L contracts, which account for the majority of contracts in the foodservice sector.40 P&L contracts allow the foodservice company greater flexibility to implement food waste reduction solutions, but this is balanced by the need to manage costs. As long as key contract performance metrics are being met, the company has the autonomy under a P&L contract to:
• Make return on investment decisions related to waste tracking and modeling software.
• Control supply and product specifications to allow for use of off-spec (cosmetically challenged) produce.
• Benefit from tax deductions for food donations under The Protecting Americans from Tax Hikes (PATH) Act.
Food waste reduction solutions in management fee contracts are still possible but may require more client engagement and approval, which can slow down implementation but allow for a more thoughtful approach.
Hybrid contracts, which allow for greater sharing of the financial risks, are an increasingly popular method of allowing for future flexibility and can enable foodservice companies to take greater ownership of food waste reduction solutions.
BEST PRACTICES:
• Encourage and empower sales teams to articulate food waste goals and practices at the proposal and contract negotiation stage. Present clients with the business case for food waste reduction solutions early on, whether for tax donation deductions, waste tracking, or an onsite organic waste treatment program. This makes it easier for operational teams to address these issues when the contract is in effect.
• Support operational teams making the business case to clients for a food waste reduction program by providing presentation materials and the knowledge necessary to address client concerns.
CONTRACT SCOPE
The scope of services provided to clients affects the ease of delivery of certain solutions.
• When a company provides both food and facilities services, it oversees all aspects of waste streams management, including waste generation, bin placement, signage, and hauling contracts.
• When the client controls the hauler contract, providing waste-tracking data can demonstrate the potential for change.
• A common challenge for all foodservice companies is that contractual arrangements can restrict the ability to directly educate and influence guests. Since post-consumer waste can account for over 60% of food waste, this is a missed opportunity.41 To overcome this barrier, include in proposals a plan to host food waste-awareness events to engage clients and their sites. Provide marketing and promotional materials that can easily be rebranded by clients.
GEOGRAPHY
The location of a client site will help determine which solutions are most feasible. Food donation is usually easier in urban locations, where there are more food recovery organizations. Rural sites offer easier access to local farmers who will accept uncontaminated surplus food as animal feed. The maturity of the recycling market also differs across the U.S. and will affect solution choice. Organic recycling facilities are most common in the Northeast, Midwest, and West Coast.42
SIZE OF FACILITY
Kitchen size, number of establishments, and size of staff will help determine which solutions are best suited to a site. On-site processing solutions, e.g., In-Vessel Composting, are better suited to larger sites like universities that have multiple foodservice establishments, and grounds that can benefit from the resulting compost. Kitchen design and layout are key factors when considering surplus food storage for recovery or recycling.

ReFED | Foodservice Food Waste Action Guide 28
SETTING THE STRATEGY AND APPROACHBecause each foodservice segment is unique, food waste reduction solutions will need sector-specific plans for each client that build on a wider corporate sustainability agenda.
STRATEGYFood waste reduction efforts should be implemented under a defined strategy that outlines goals, activities, and responsibilities and is backed by senior-level commitment.
• The most effective food waste reduction strategies are aligned with corporate goals.
• To find shared goals, compare the company’s own food waste prevention strategies with the client’s current or future sustainability plans, either on a site-by-site basis or by the sales team. Foodservice companies that establish this type of cultural alignment with clients are at a competitive advantage.
• Food waste reduction goals should:
- Be quantifiable, tied to business metrics such as cost and revenue, or growth and time-bound, meaning with deadlines or strict time frames attached. Leading foodservice companies, which represent 80% of the market share, have committed to reducing food waste by up to 25% with support from organizations like the Food Waste Reduction Alliance, Champions 12.3 and Champions 2030.
- Include a public-facing commitment and reporting to increase accountability; review progress annually, with targets updated to drive continuous improvement; include a defined method of identifying and testing emerging disruptive technologies or innovations; include chef and employee training.
GOVERNANCE Governance, especially practices that facilitate cross-functional collaboration, are critical to the successful implementation of food waste reduction strategies.
• Efforts with the greatest potential to create large-scale change require support and investment from multiple departments, e.g., Procurement, Supply Chain, HR, and Regional and Site Operations. These departments may not have experience collaborating or may even be incentivized to carry out activities that create waste in other parts of the company.
• It is critical, then, to have overarching executive support and governance structures that can bring these functions to the table and resolve conflicts in incentives. Mechanisms to reward regional and site managers with bonuses tied to food waste performance are also helpful.
• Strong executive leadership will better ensure that adequate resources are allocated. Have a food waste leader or “green” champions who can oversee prevention, recovery, and recycling efforts at both the regional and site level. Their actions can help motivate on-site activities and disseminate best practices across the business.
MEASUREMENT AND COMMUNICATIONSMeasuring food waste will likely require investment in both tracking and analytics solutions and staff training, but is necessary to establish a baseline against which to monitor progress.
• Data collection on food and food waste in the supply chain is the key to opening the doors of many solutions and investments. Foodservice companies should implement a standard methodology for tracking food waste across all sites, and track and integrate food waste data with sales data, inventory management systems, and food supply systems.
• Measurement also enables internal and external communications on food waste reductions that can help companies recognize the reputational value of their efforts. Measurement results can be used to provide internal, site-specific food waste scorecards to compare performance over time and across sites. Externally, they can be incorporated into responsibility/sustainability reports, annual reports, and media stories.
29
THE PATH AHEADBy describing the size of the food waste prize and providing industry-specific guidance on how to implement an array of solutions, The Foodservice Action Guide has set the stage for action. Successful efforts on the three fronts of prevention, recovery, and recycling can be achieved by developing a top-down food waste reduction culture that flows from the executive suite to operational teams, to client relations, to front- and back-of-house employees, permeating every department of the business while supporting business objectives.
Guest engagement is equally critical; Consumer Education, in fact, is one of the most cost-effective and scalable Roadmap solutions. Foodservice companies can encourage guest involvement through efforts by sales teams, effective communication with clients, and positive on-site messaging.
There is a huge opportunity for the foodservice industry to lead national food waste reduction initiatives. This Guide calls upon every foodservice company in America to rise to the challenge and take part in turning food waste from a costly burden into a powerful resource to solve some of society’s biggest challenges.
Together, we can reduce food waste by 20 percent in the next decade For more details and to join ReFED, please contact us at info@refed.

ReFED | Foodservice Food Waste Action Guide 30
31
CONTRIBUTORS & REVIEWERSWe thank the following individuals for their feedback and contributions through participation in interviews, site visits, and reviews of the Guide.
Brandon Wright Aramark Corporation
Kathleen CacciolaAramark Corporation
Claire CummingsBon Appétit Management Company
Danielle RamosCater to You Food Services
Maarten de VreedeCater to You Food Services
Mia OrmesCater to You Food Services
Amy KeisterCompass Group
Becky Green Compass Group
Mike GoldblattCopia
Debbie FriedelDelaware North
Carrie CalvertFeeding America
Karen HannerFeeding America
Jim LarsonFood Donation Connection
Regina Northouse Food Recovery Network
Kristen RaineyGoogle
Katherine MillerJames Beard Foundation
Janet HauganLeanPath
Steven FinnLeanPath
Sarah VaredMissionPoint Partners
Susan KolodziejczykNational Geographic Society
Jeffrey ClarkNational Restaurant Association
Laura AbshireNational Restaurant Association
Darby HooverNatural Resources Defense Council
JoAnne BerkenkampNatural Resources Defense Council
Christopher SauterSodexo
Dave KimballSodexo
David FrischkornSodexo
Gregory PayneSodexo
Jean JohnsonSodexo
Juan NatalSodexo
Judy PanayosSodexo
Laura MontoSodexo
Nell FrySodexo
Tim SheehanSodexo
Tom NicklowSodexo
Ashley ZanolliUnited States Environmental Protection Agency
Lana SuarezUnited States Environmental Protection Agency
Kevin SmithUnited States Food & Drug Administration
Van SullivanUniversity of Massachusetts Amherst
Susan RobinsonWaste Management
Kai RobertsonWorld Resources Institute
Pete PearsonWorld Wildlife Fund

ReFED | Foodservice Food Waste Action Guide 32
REFERENCES1 ReFED. 2016. A Roadmap to Reduce U.S. Food Waste by 20
Percent. pg.5, 23. http://www.refed.com/download.
2 ReFED. 2016. A Roadmap to Reduce U.S. Food Waste by 20 Percent. pg. 10. http://www.refed.com/download.
3 ReFED. 2016. A Roadmap to Reduce U.S. Food Waste by 20 Percent. pg.5. http://www.refed.com/download.
4 Calculation: 5m tons (ReFED. 2016. A Roadmap to Reduce U.S. Food Waste by 20 Percent. Solutions Impact Model, unpublished) multiplied by 2000 to convert into lbs., which results in 10 billion lbs. 10 billion lbs. multiplied by $1.14, a weighted average of wholesale prices based on the Bureau of Labor Statistics 2015 (ReFED. 2016. A Roadmap to Reduce U.S. Food Waste by 20 Percent Technical Appendix. pg. 19) equals $11.4 billion.
5 ReFED. 2016. A Roadmap to Reduce U.S. Food Waste by 20 Percent. Solutions Impact Model, unpublished.
6 Eunomia calculation: Food costs are generally 28% to 35% of sales in a typical food service operation (Matthew. 2015. Costing and Pricing food in the Restaurant Industry. Web. https://www.gourmetmarketing.net/costing-pricing-food-regular-menus-catering-services-special-events/). Wasted food accounts for as much as 16% of food costs: ~8% pre-consumer waste (LeanPath. Interviews by Eunomia. Sept 2017.) and 8% post-consumer waste (J. Bloom. 2011. American Wasteland: How America Throws Away Nearly Half of Its Food and What We Can Do About It). As such, food waste is often as much as 16% of 35% (5.6%) of sales value in an average restaurant.
7 R. A. Neff, M. L. Spiker and P. L. 2017. Truant Wasted Food: U.S. Consumers' Reported Awareness, Attitudes, and Behaviors. Web. https://doi.org/10.1371/journal.pone.0127881.
8 Ernst & Young. 2017. Investment Rules 2.0: nonfinancial and ESG reporting trends. Web. http://www.ey.com/gl/en/services/specialty-services/climate-change-and-sustainability-services/ey-tomorrows-investment-rules-2.
9 Eunomia internal research based on confidential client data. Supported by: P. Lee, J. Parfitt, and A. Fryer. 2013. The True Cost of Food Waste within Hospitality and Food Service. (Table 3, pg. 6) Web. http://bit.ly/2zRjONb. The full cost of food waste for staff catering is ~£2,200 per metric tonne has been used which equals to ~$3,000 per US ton at an exchange rate of $1.32 to the £.
10 LeanPath. Interviews by ReFED and Eunomia. Sept 2017.
11 LeanPath. Food Waste Prevention Spotlight: University of Massachusetts. Web. http://www.leanpath.com/wp-content/themes/weaver-ii-pro/docs/LeanPath_Case_Study_UMass.PDF.
12 ReFED. 2016. A Roadmap to Reduce U.S. Food Waste by 20 Percent Technical Appendix. Figure 10, pg. 17. Web. https://www.refed.com/downloads/ReFED_Technical_Appendix.pdf.
13 H. Seed. Copia. Interview by Eunomia. August 2017.
14 ReFED. 2016. A Roadmap to Reduce U.S. Food Waste by 20 Percent. pg.50. Web. http://www.refed.com/download.
15 ReFED. 2016. A Roadmap to Reduce U.S. Food Waste by 20 Percent. pg. 51. Web. http://www.refed.com/download.
16 ReFED. 2016. A Roadmap to Reduce U.S. Food Waste by 20 Percent. pg. 29. Web. http://www.refed.com/download.
17 ReFED. 2016. A Roadmap to Reduce U.S. Food Waste by 20 Percent. Solutions Impact Model, unpublished.
18 K. Kim, S. Morawksi. 2012. Quantifying the Impact of Going Trayless in a University Dining Hall. Journal of Hunger & Environmental Nutrition. Vol. 7, Is. 4. Web. http://www.tandfonline.com/doi/abs/10.1080/19320248.2012.732918#preview.
19 65,061 tons (ReFED. 2016. A Roadmap to Reduce U.S. Food Waste by 20 Percent. Solutions Impact Model, unpublished.) 146,582.074 calculated by multiplying 65,061 tons by $2,253 per ton economic value (ReFED. 2016. A Roadmap to Reduce U.S. Food Waste by 20 Percent. pg.36. Web. http://www.refed.com/download).
20 P. Hansen. 2013. How do people change behavior? Web. http://videnskab.dk/kultur-samfund/nudging-hvordan-far-man-folk-til-aendre-adfaerd.
21 ReFED. 2016. A Roadmap to Reduce U.S. Food Waste by 20 Percent Technical Appendix. pg. 31. Web. https://www.refed.com/downloads/ReFED_Technical_Appendix.pdf.
22 ReFED. 2016. A Roadmap to Reduce U.S. Food Waste by 20 Percent Technical Appendix. pg. 30. Web. https://www.refed.com/downloads/ReFED_Technical_Appendix.pdf
23 LeanPath. Interviews by ReFED and Eunomia. Sept 2017.
24 LeanPath. Interviews by ReFED and Eunomia. Sept 2017.
25 K. Cacciola. 2017. Shrinking the Food Waste Circle. U.S Chamber of Commerce Foundation. Web. https://www.uschamberfoundation.org/shrinking-food-waste-circle.
26 LeanPath. Interviews by ReFED and Eunomia. Sept 2017.
27 K. Blazek, O. Balkus, E. Broad Lieb, et al. 2015. Federal Enhanced Tax Deduction for Food Donation a Legal Guide. Pg. 6. (2015) Web. http://www.chlpi.org/wp-content/uploads/2013/12/Food-Donation-Fed-Tax-Guide-for-Pub-2.pdf.
28 K. Blazek, O. Balkus, E. Broad Lieb, et al. 2015. Federal Enhanced Tax Deduction for Food Donation a Legal Guide. Pg. 4. (2015) Web. http://www.chlpi.org/wp-content/uploads/2013/12/Food-Donation-Fed-Tax-Guide-for-Pub-2.pdf.
29 Harvard Food Law and Policy Clinic. Legal Fact Sheet: The Bill Emerson Good Samaritan Food Donation Act. Web. bit.ly/2g9UbSR
30 Food Recovery Network. Food Recovery Verified. Web. https://www.foodrecoverynetwork.org/frv/.
31 ReFED. 2016. A Roadmap to Reduce U.S. Food Waste by 20 Percent. pg. 51. Web. http://www.refed.com/download.
32 ReFED. 2016. A Roadmap to Reduce U.S. Food Waste by 20 Percent. pg. 53. Web. http://www.refed.com/download.
33 ReFED. 2016. A Roadmap to Reduce U.S. Food Waste by 20 Percent. pg. 53. Web http://www.refed.com/download.
34 US Composting Council. State Composting Regulations. 2017. Web. https://compostingcouncil.org/state-compost-regulations-map/.
35 US EPA. 2017. Web. https://www.epa.gov/cleandiesel.
36 National Restaurant Association. Fats, Oils and Grease Control Best practices for effective grease control management. Web. http://conserve.restaurant.org/Downloads/PDFs/FOG/FOG-ToolkitFinal3.aspx.
37 J. Fortenbury. 2013. 15 important-ish Factors to Consider when Choosing a College. USA Today College. Web. http://college.usatoday.com/2013/11/18/15-important-ish-factors-to-consider-when-choosing-a-college/.
38 K. Kim, S. Morawksi. 2012. Quantifying the Impact of Going Trayless in a University Dining Hall. Journal of Hunger & Environmental Nutrition. Vol. 7, Is. 4. Web. http://www.tandfonline.com/doi/abs/10.1080/19320248.2012.732918.
39 Practice Greenhealth. 2016. 2016 Sustainability Benchmark Report. Web. https://practicegreenhealth.org/tools-resources/sustainability-benchmark-report-0. Supported by: J. Howard. 2016. Commentary: Food for thought-Hospitals must do more to end their wasteful ways. Modern Healthcare. Web. http://www.modernhealthcare.com/article/20160709/MAGAZINE/307099952.
40 A. Frewin. 2010. Types of catering contract. The Caterer. (2010) Web. https://www.thecaterer.com/articles/305459/types-of-catering-contract.
41 Confidential sector data provided to ReFED. Supported by: N. Goodfellow. 2016. Perch food waste audit report: Sodexo Dining Services at the University of Pittsburgh. Web. https://www.pc.pitt.edu/dining/documents/Perchaudit2016FINAL.pdf.
42 ReFED. 2016. A Roadmap to Reduce U.S. Food Waste by 20 Percent. pg. 52. Web. http://www.refed.com/download.
43 ReFED. 2016. A Roadmap to Reduce U.S. Food Waste by 20 Percent. pg. 18. Web. http://www.refed.com/download.

33
FOODSERVICE FOOD WASTE PREVENTION SOLUTIONS
CATEGORY SOLUTION DESCRIPTIONSTAKEHOLDERS
INTERNAL EXTERNAL
MENU PLANNING & SERVICEStrategically design menus to intentionally reduce food waste and plan the dining experience to reduce post-consumer waste.
Menu Design & Service Style
Design menus and service style to intentionally reduce pre- and post- consumer waste
Culinary, Front of House, Catering and Events
Suppliers, Clients, Consumers
Trayless Dining* Eliminate trays from all-you-can-eat dining establishments to reduce post-consumer waste
Finance, Culinary, General Manager, Catering and Events, Front of House
Clients, Guests
Smaller Plates* Provide consumers with smaller plates in self-serve all-you-can-eat dining settings to reduce portion sizes
Finance, Culinary, General Manager, Catering and Events, Front of House
Clients, Guests
PROCUREMENT & SUPPLY CHAINImplement systems and processes to standardize functions and build supplier relationships
Optimized Quantities
Provide flexibility for sites to customize order quantities to accurately match demand
Culinary, Procurement, Distribution and Logistics
Suppliers, Third Party Haulers
Produce Specifications*
Integrate off-spec (cosmetically challenged) produce for use in foodservice preparation
Culinary, Procurement, Distribution & Logistics
Suppliers, Third Party Haulers
PRODUCTION EFFICIENCYUse data from Waste Tracking & Analytics to improve ordering and inventory management to enhance production planning
Waste Tracking & Analytics*
Track data on wasted food to inform behavior and operational changes
Culinary, Front of House, Procurement, Finance
Clients, Waste Tracking Software Representatives
Inventory Management & Production Planning
Optimize ordering and inventory systems to increase accuracy of purchasing and production planning
Procurement, Culinary, Sales, Finance, Distribution & Logistics
Suppliers, Third Party Haulers
APPENDIX A: SOLUTION DETAILSThe following table provides a description of each solution and the stakeholders most likely required to engage when implementing a solution.

ReFED | Foodservice Food Waste Action Guide 34
FOODSERVICE FOOD SURPLUS RECOVERY SOLUTIONS
CATEGORY SOLUTION DESCRIPTIONSTAKEHOLDERS
INTERNAL EXTERNAL
FOOD DONATION POLICYBuild understanding of food donation policies to implement successful food donation programs
Donation Tax Incentives*
Motivate donations by capturing tax deductions
Finance, Sustainability/Foundation, Culinary, Front of House
Food Donation Organizations, Clients
Donation Liability Education*
Inform staff on food donation liability protections and food safety, eliminating fear of negative consequences of donation
Culinary, Front of House, Food Safety /Quality Assurance
Clients, Guests, Food Donation Organizations
FOOD DONATION INFRASTRUCTUREHandle, store, and transport food for donation from point of production to the point of delivery
Donation Matching Partnerships
Develop partnerships with donation matching organizations that can connect and coordinate foodservice donations with food recipient organizations
General Managers, Sustainability/Foundation, Legal, Sustainability/Foundations
Clients, Food Donation Organizations
Donation Storage, Handling & Transportation
Leverage existing transportation infrastructure for local recovery and long-haul transport capabilities
Culinary, General Managers, Front of House, Finance
Clients, Food Donation Organizations
FOODSERVICE FOOD WASTE RECYCLING SOLUTIONS
CATEGORY SOLUTION DESCRIPTIONSTAKEHOLDERS
INTERNAL EXTERNAL
DEVELOP ORGANICS RECYCLING PROGRAM AND PARTNERSHIPS
Centralized Composting or Anaerobic Digestion (AD)*
Transport waste to a centralized facility where it decomposes into compost or biogas and digestate
Culinary, Facilities Management, Procurement, Front of House
Clients, Organics Recycling Facilities, Waste Management Haulers, Suppliers
On-Site Processing
Implement small-scale in-vessel composting or anaerobic digestion developed for restaurants, which use heat and mechanical power to break down organics relatively quickly
Culinary, Front of House, Facilities Management, Finance, Procurement
Maintenance Suppliers, Permit-Granting Authorities
Animal Feed* Divert food waste to animals as feed after heat-treatment and dehydration; either mixed with dry feed or directly fed
Culinary, Front of House, Facilities Management
Clients, Farms, Waste Management Haulers
Cooking Oil Recycling
Transform fats, oils, and greases (FOGs) into biodiesel, an alternative to regular diesel
Culinary, Facilities Management, Finance
Oil Recyclers
* Indicates ReFED Roadmap solutions; all other solutions are modified or emerging solutions identified as being well suited to foodservices businesses.43

35
APPENDIX B: Foodservice Solution Matrix Detail
SOLUTIONPROFIT
POTENTIALFEASIBILITY
INDUSTRY PREVALENCE
ROADMAP DATA
DIVERSION POTENTIAL
ECONOMIC VALUE
Menu Design And Service Style
Medium High Implementation Effort: Medium Low Medium Low
Initial Capital Intensity: Low
Smaller Plates Medium Medium Implementation Effort: Medium Medium Medium Medium
Initial Capital Intensity: Medium
Trayless Dining Medium Medium Implementation Effort: Medium Medium Medium Medium
Initial Capital Intensity: Medium
Produce Specifications
Low High Implementation Effort: Low Low Medium Medium
Initial Capital Intensity: Low
Optimized Quantities
Low High Implementation Effort: Medium Low Low Low
Initial Capital Intensity: Low
Waste Tracking & Analytics
High Medium Implementation Effort: Medium Medium High High
Initial Capital Intensity: Medium
Inventory Management & Production Planning
High Medium Implementation Effort: Medium Medium Low Low
Initial Capital Intensity: Medium
Donation Tax Incentives
Medium High Implementation Effort: Medium Low Medium Medium
Initial Capital Intensity: Low
Donation Liability Education
Low High Implementation Effort: Medium Medium Low Medium
Initial Capital Intensity: Low
Donation Matching Partnerships
Low High Implementation Effort: Medium Medium Low Medium
Initial Capital Intensity: Low
Donation Storage, Handling & Transportation
Low Medium Implementation Effort: Medium Medium Medium Medium
Initial Capital Intensity: Medium
Centralized Composting or Anaerobic Digestion
Low Medium Implementation Effort: Medium Low High Low
Initial Capital Intensity: Medium
Animal Feed Low Medium Implementation Effort: Medium Low Low Low
Initial Capital Intensity: Medium
On-Site Processing Low Low Implementation Effort: High Low Low Low
Initial Capital Intensity: High
Cooking Oil Recycling
Low High Implementation Effort: Medium High Low Low
Initial Capital Intensity: Low

ReFED | Foodservice Food Waste Action Guide 36
ReFED RESOURCES
OTHER RESOURCESPREVENTION
A Strategic Guide on Using Data to Drive Food Loss and Waste Reductionsbit.ly/2vRmtUD
EPA Food Waste Cost Calculatorepa.gov/sites/production/files/2017-01/foodcost3.xls
EPA Food Waste and Packaging Tracking Toolepa.gov/sites/production/files/2015-09/documents/toolkt_training.pdf
EPA A Guide on How to Conduct and Analyze Food Waste Characterizationbit.ly/2ydSwCp
Food Loss and Waste Accounting and Reporting Standardflwprotocol.org
LeanPathleanpath.com/free-resources
Unilever’s “Wise Up on Waste” Appunileverfoodsolutions.ie/our-services/your-kitchen/wise-waste-app
RECOVERY
412 Food Rescue412foodrescue.org
Copiagocopia.com
Campus Kitchen’s Projectcampuskitchens.org
Fact Sheet from the Harvard Food Law and Policy Clinicbit.ly/2g9UbSR
Feeding Americafeedingamerica.org
Food Donation Connectionfoodtodonate.com
Food Donation Management Practicesbit.ly/2yXzHAe
Food Recovery Networkfoodrecoverynetwork.org
Food Recovery Verifiedfoodrecoverynetwork.org/frv
Information on the Bill Emerson Good Samaritan Food Donation Actbit.ly/2fo7ptj
Iowa Hunger Directoryiowahungersummit.org/en/the_iowa_hunger_directory
Keeping Food Out of the Landfill: Policy Ideas for States and Localitiesbit.ly/2gsU6GB
RECYCLING
BioCycle’s Find a Composterfindacomposter.com
Keeping Food Out of the Landfill: Policy Ideas for States and Localities bit.ly/2gsU6GB
Leftover’s for Livestock: A Legal Guide for Using Food Scraps for Animal Feedbit.ly/2yJfQVW
National Restaurant Association FOGs toolkitbit.ly/2zMH8w6
U.S. Composting Councilcompostingcouncil.org/state-compost-regulations-map
Waste Dive: Solid Waste & Recycling Newswww.wastedive.com
U.S. FOOD WASTE POLICY FINDER INNOVATOR DATABASE
refed.com/policy refed.com/innovators