food waste policies, initiatives and consumer behaviour ... · pdf fileconsumer behaviour....
TRANSCRIPT

Katarzyna Anna Papaj Licenciada em Proteção Ambiental
Food waste - Policies, initiatives and consumer behaviour. Case study: Poland
and Portugal
Dissertação para obtenção do Grau de Mestre em Gestão e Politícas Ambientais
Orientador: Profa Doutora Maria da Graça Madeira Martinho,
Profa Auxiliar da FCT-UNL
Júri:
Presidente: Profª Doutora Lia Maldonado Teles de Vasconcelos Vogal(ais): Profª Doutora Maria da Graça Madeira Martinho
Doutora Ana Lúcia Lourenço Pires
Setembro 2016


Food waste - Policies, initiatives and
consumer behaviour. Case study: Poland and Portugal

Food waste - Policies, initiatives and consumer behaviour. Case study: Poland and Portugal
Copyright © Katarzyna Anna Papaj, Faculdade de Ciências e Tecnologia, Universidade Nova de Lisboa. All rights reserved.
A Faculdade de Ciências e Tecnologia e a Universidade Nova de Lisboa têm o direito, perpétuo e sem limites geográficos, de arquivar e publicar esta dissertação através de exemplares impressos reproduzidos em papel ou de forma digital, ou por qualquer outro meio conhecido ou que venha a ser inventado, e de a divulgar através de repositórios científicos e de admitir a sua cópia e distribuição com objectivos educacionais ou de investigação, não comerciais, desde que seja dado crédito ao autor e editor.
The Faculty of Science and Technology and the New University of Lisbon have the right, perpetual and without geographical boundaries, to archive and publish this dissertation through printed copies reproduced on paper or digital form, or by any other means known or which may be invented, and its promotion through scientific repositories and admit its copy and distribution for educational or research purposes, non-commercial, as long as credit is given to the author and publisher.

v
Acknowledgment
First of all I would like to thank Professor Maria da Graça Madeira Martinho from FCT-UNL for
the help and guidance in the elaboration of the present study as well for the patience for Polish girl who sometimes could be difficult to understand.
The biggest thanks to my amazing mother. I would like to dedicate this thesis for you as a
reward for everything you have done for me in my whole life. As a single mother since the beginning
of my education you were supporting me with everything. You invested in my education because you
believed in me and I hope I made you proud. You were also my spiritual support since I decided to
make my master in another country, and even so many kilometres away from you I could always
count on you. You are everything to me and without you I wouldn’t achieve anything in my life.
Also I would like to thank my grandmother. You thought me how to be a good person in life
and respect everything and everyone. You are role model for me as you were for my mother. You
were always against food waste and you are one of the reasons I chose this subject and I hope you
will be proud of me.
Another thanks as important as others, to my boyfriend Ricardo who always help me with
everything. Starting with languages barriers I had on the beginning, passing to excels help and
finishing on simple spiritual support which was extremely important. Thank you for your patience,
because I know very well that I am not the easiest person to live with.
A special thank for my friends which I left in Poland. I always think about you and I know that
I can always count on you. Specially I would like to thank my friends for life which always stood by me during those two years aboard telling me all the time that I can make it. You know who you are.
I also would like to thank my new foreign friends from the course which helped me a lot
specially when I didn’t understand what the Professors were saying during the classes because of my
poor Portuguese. I didn’t feel like a stranger during the whole year of classes because of you and your help.
And I would also like to thank every Portuguese and every Polish who was that kind to
support my surveys spending few minutes fulfilling it and delivering it to the others!
Thank you so much.
“If a problem has a solution, it's no longer a problem”
Anonymous

vi

vii
Abstract
Food waste is a serious ethical, environmental and economic problem of excessive contemporary consumerism. The European Union (EU) estimates that around 88 million tonnes of food are wasted annually, with associated costs estimated at 143 billion euros. Food waste occurs in all phases of the food supply chain, starting with producers and ending with consumers, and this food waste has a staggering environmental impact. There are several factors which contribute to excessive quantities of wasted food. Some are related to current production systems and product commercialization, including food quality and security norms, others are more personal like people’s food habits, awareness, values and consumer attitudes in regards to consumption and food waste.
In order to implement policies, strategies and measures which contribute to reducing food waste on the consumer level there is a need to understand the factors which shape consumer behaviours.
Starting with the models and variables indicated in the literature overview, possible determinants of environmental behaviour were presented. Through these variables the study seeks to estimate if there is a differences between consumers in countries with different contexts and food habits by choosing Poland and Portugal as the case studies. The main differences between these countries lies in two key aspects which could have an influence not only on the behaviour related to consumption and wasting food but also on self-awareness and attitudes towards the problem. On the one hand Poland is one of the most agricultural country in the EU, while Portugal has already lost much of its agricultural production, whilst on the other hand, Polish and Portuguese food habits are different.
To achieve these objectives in terms of methodology, an online survey was created. The survey was translated into Polish and Portuguese and its goal was to understand the reasons for food waste, purchasing behaviour, attitudes, the level of consumer knowledge and opinions with respect to food waste, as well as perception about the quantities of wasted food in the consumer’s household.
Based on responses obtained in the survey in which 232 Polish and 244 Portuguese consumers participated, the conclusion is that despite the different contexts and food habits some of the behaviours and opinions are similar, namely the motives for throwing food away and opinions about the measures which could be taken to reduce food waste. Through the analysis, the results have shown that Polish consumers waste more than Portuguese and have less positive attitudes towards food waste than Portuguese consumers. Furthermore, the Polish seem to attribute less importance to the food waste problem and have less knowledge about food waste.
These differences could be not only due to different contexts and food habits but also to the types of campaigns and initiatives which Governments and Governmental organizations from both countries have implemented.
Keywords: food waste, policy, household, consumer behaviour, survey, the EU

viii
ix
Resumo
O desperdício alimentar representa atualmente um importante problema ético, ambiental e económico, sendo resultante do excessivo consumismo. A União Europeia (UE) estima que anualmente sejam desperdiçados na UE cerca de 88 milhões de toneladas de alimentos, com um custo associado de 143 biliões de euros. O desperdício alimentar ocorre em todas as fases da cadeia dos alimentos, desde o produtor até ao consumidor final, mas nos países desenvolvidos a maior parte dos alimentos são desperdiçados ao nível do consumidor final, sendo portanto os impactos negativos superiores nesta fase. Vários são os fatores que contribuem para o excessiva quantidade de resíduos alimentares, uns relacionados com os atuais sistemas de produção e comercialização dos produtos, incluindo as normas de qualidade e segurança dos alimentos, outros de natureza mais pessoal como, por exemplo, os hábitos alimentares, a consciencialização, os valores e as atitudes dos consumidores face ao consumo e ao desperdício alimentar.
Para se poderem implementar políticas, estratégias e medidas que contribuam para a redução do desperdício alimentar ao nível do consumidor, é necessário perceber que fatores contribuem para estes comportamentos.
Partindo de modelos e das variáveis identificadas na revisão da literatura como possíveis determinantes para os comportamentos ambientais, procurou-se neste trabalho de investigação avaliar, para essas variáveis, se existiriam ou não diferenças entre consumidores de países com diferentes contextos e hábitos alimentares, tendo-se selecionado para o efeito Portugal e Polónia. As principais diferenças entre estes países residem em dois aspetos principais que poderão ter influência não só nos comportamentos, relacionados com o consumo e o desperdício de alimentos, como na própria consciencialização e atitudes face ao problema. Por um lado, a Polónia é um dos países mais agrícolas da UE, enquanto que Portugal perdeu já há várias décadas grande parte da sua área agrícola, por outro lado, os hábitos alimentares de polacos e portugueses são diferentes.
Em termos metodológicos, para atingir estes objetivos, construiu-se um questionário online, traduzido em português e em polaco, com o qual se pretendeu conhecer os motivos do desperdício alimentar, os comportamentos de compra e destino dados aos restos alimentares, as atitudes , o nível de informação e as opiniões em relação ao desperdício de alimentos, bem como a perceção sobre a quantidade de desperdício de comida no agregado familiar do inquirido.
Com base nas respostas obtidas por questionário, ao qual responderam 232 polacos e 244 portugueses, conclui-se que apesar dos diferentes contextos e hábitos alimentares, alguns comportamentos e opiniões são semelhantes, nomeadamente os motivos que levam ao desperdício alimentar e as opiniões sobre as medidas a tomar para reduzir o desperdício de alimentos. Conclui-se ainda que os consumidores polacos, comparativamente aos portugueses, desperdiçam mais comida, têm atitudes menos positivas em relação ao desperdício de alimentos, revelam um menor conhecimento e atribuem menos importância ao problema do desperdício alimentar.
Estas diferenças poderão dever-se não só aos diferentes contextos e hábitos alimentares mas também ao tipo e intensidade de campanhas e iniciativas que os Governos e as Organizações Governamentais de ambos os países estão a implementar.

x

xi
List of Contents List of figures ................................................................................................................. xiii
List of tables ....................................................................................................................xv
1 Introduction................................................................................................................. 1
1.1 Framework.............................................................................................................. 1
1.2 Objectives and research scope ................................................................................. 1
1.3 Dissertation Structure .............................................................................................. 2
2 Literature and reference analysis and overview.............................................................. 3
2.1 Food waste and remains .......................................................................................... 3
Concepts and definitions................................................................................... 3 2.1.1
Waste and food waste origins ........................................................................... 4 2.1.2
The scale of the problem – waste and food waste quantities............................... 6 2.1.3
Causes of increased food waste ........................................................................10 2.1.4
Reducing food losses and its benefits................................................................12 2.1.5
2.2 Food waste impact .................................................................................................18
Environmental consequences of food waste......................................................18 2.2.1
Energy and resource waste ..............................................................................18 2.2.2
The full costs of food waste – global and household level ..................................19 2.2.3
2.3 Consumer behaviour...............................................................................................21
Determining factors of food waste behaviour....................................................21 2.3.1
Behaviour changing strategies ..........................................................................25 2.3.2
2.4 European policies and initiatives to combat food waste ............................................28
European Policies and strategies to combat food waste .....................................28 2.4.1
Organization initiatives and citizen movements to minimise the food waste .......31 2.4.2
2.5 The situation in Poland and Portugal........................................................................34
The situation in Poland ....................................................................................34 2.5.1
The situation in Portugal ..................................................................................36 2.5.2
3 Methodology ..............................................................................................................39
3.1 Case study – Comparison of Poland and Portugal .....................................................39
3.2 Specification of objectives and hypothesis of the research. .......................................39
3.3 Analytical instruments ............................................................................................39
Literature ........................................................................................................39 3.3.1
Consumer survey .............................................................................................40 3.3.2
3.4 Strengths and Limitations........................................................................................42
4 Results and discussion .................................................................................................43
4.1 Consumer survey ....................................................................................................43
4.2 Socio-demographic characteristics...........................................................................43
xii
4.3 Analysis of the results .............................................................................................45
Routines, habits and past experience ................................................................45 4.3.1
Consumer food waste knowledge and opinions .................................................47 4.3.2
Consumer behaviour........................................................................................48 4.3.3
Analysis of the behavioural model ....................................................................50 4.3.4
Level of importance .........................................................................................54 4.3.5
5 Conclusions.................................................................................................................55
5.1 Summary ...............................................................................................................55
5.2 Development of future studies ................................................................................56
6 Bibliography................................................................................................................59
Anexes ............................................................................................................................64
Anex 1 – Consumer survey - English version ....................................................................64
Anex 2 – Consumer survey - Portuguese version..............................................................69
Anex 3 – Consumer survey - Polish version ......................................................................74

xiii
List of figures
Figure 2.1 Food loss and food waste along the value chain ............................................................... 5 Figure 2.2 Sources of food waste and sources of environmental impacts in the food life cycle............ 5 Figure 2.3 The share of Total Food Loss and Waste by Stage in the Value Chain ................................. 6 Figure 2.4 The world’s food production ........................................................................................... 8 Figure 2.5 Municipal Solid Waste Composition EU 27. ...................................................................... 8 Figure 2.6 EU-28 Food waste by sectors .......................................................................................... 9 Figure 2.7 Share of global food loss and waste by commodities ...................................................... 10 Figure 2.8 The pyramid to combat food waste ............................................................................... 12 Figure 2.9 Costs associated with food waste by sector ................................................................... 20 Figure 2.10 Model of Theory the of Planned Behaviour .................................................................. 22 Figure 2.11 “Triandis” Theory of Interpersonal Behaviour............................................................... 24 Figure 2.12 A schematic overview of the Norm Activation Model.................................................... 25 Figure 2.13 The Model of The Cycle of Change............................................................................... 27 Figure 3.1 Structure of the questionnaire. ..................................................................................... 41 Figure 4.1 Frequency of meal preparation in Poland and Portugal................................................... 45 Figure 4.2 Frequency of shopping in Poland and Portugal............................................................... 46 Figure 4.3 Frequency of shopping place in Poland and Portugal. ..................................................... 46 Figure 4.4 Approximate food waste in Poland and Portugal. ........................................................... 48 Figure 4.5 The frequency of throwing away certain commodities in Poland and Portugal ................. 49 Figure 4.6 Polish level of accordance with the statements. ............................................................. 51 Figure 4.7 Portuguese level of accordance with the statements. ..................................................... 52 Figure 4.8 Level of difficulty to the statements in Poland and Portugal. ........................................... 53 Figure 4.9 Intention not to waste in Polish and Portuguese households. ......................................... 53 Figure 4.10 Level of importance of towards food waste in Poland and Portugal ............................... 54 Figure 4.11The level of feeling responsible for food waste by Polish and Portuguese consumers ...... 54

xiv

xv
List of tables
Table 2.1 Total Food Waste Generation in EU. ................................................................................. 7 Table 2.2 Possible actions for consumers to minimise food waste. .................................................. 13 Table 2.3 Government’s possible action to minimise food waste. ................................................... 15 Table 2.4 Costs per tonne of edible food waste.............................................................................. 20 Table 2.5 Leading Food Waste and Loss organization initiatives. ..................................................... 32 Table 2.6 Citizen campaigns. ......................................................................................................... 33 Table 4.1 Socio–demographic characteristics in Poland and Portugal. ............................................. 44

xvi

1
1 Introduction
1.1 Framework Worldwide, according to research of the Food and Agricultural Organization of the United
Nations (FAO), one third of food produced for human consumption is thrown away, reaching 1.3 billion tonnes per year. In Europe around 88 million tonnes of food are wasted annually, with associated costs estimated at 143 billion euros and if nothing is done this amount could rise to over 120 million tonnes by 2020 (European Commission, 2016e). By 2050 the amount of people living on earth is estimated to increase to 9,3 billion. Without more efficient use of resources it will be impossible to feed 2 billion more mouths by mid-century. According to a National Geographic report, today only 55 percent of the world’s crop calories feed people directly; the rest are fed to livestock (about 36 percent) or turned into biofuels and industrial products (roughly 9 percent). As the people in developing countries are unlikely to cut their meat eating habits this paper focuses on minimizing food waste as one of the acceptable solutions to reach the goal of feeding an increasing global population.
As imaginable, food waste takes places everywhere in the world. In developing countries food is mainly lost in the early and middle phases of the food supply chain which includes harvest, transportation and storage (FAO, 2011) while in developed countries the major contribution to food waste comes from the last parts of the food supply chain - household consumption. Moreover, this waste is that it is not caused by a lack of facilities (fridges) but consumer behaviour, mostly from an excess of readily available, relatively low cost food and less than ideal buying and storage habits . This paper is going to concentrate on the European Union (UE), and focuses on a close analysis of two developed countries - Poland and Portugal.
Household food waste has a higher accumulated environmental impact than food wasted in the other chains. The fact is that the later a product is lost or wasted along the supply chain, the higher the environmental cost, as impacts of processing, transport or cooking are added to the initial production impact (FAO, 2013). Reducing consumer food waste might cause substantial positive environmental effect. When thinking about threats to the environment the first thing that comes to mind is climate change, global warming, including increased pollution from the cars, factories or livestock and food waste is not seen as a problem. Unfortunately, avoidable food waste causes tonnes of CO2 in greenhouse gas emissions, is a substantial part of the water footprint and makes up a significant part of the residual waste stream. Benefits from preventing food waste are a big opportunity to reduce energy, water and other resources used during all of the supply food chain, reduction of emissions associated with storage and cooking as well as a decrease of the amounts of waste dumped in landfills.
1.2 Objectives and research scope The present study aims to analyse one of the biggest problems of contemporary excessive
consumerism – food waste. Growing population, lifestyle changes and growing consumption in households, increases the need to use more natural resources as a result producing more food waste every year, making it one of the most urgent development challenges.
In order to reduce consumer food waste in developed countries in the EU, there is a need to understand the factors which shape consumers behaviours. This study presents comprehensive research and analysis of customer behaviour, knowledge and attitudes of people including analysis of behaviour of people in Portugal and Poland. The objective of the research is to determine food waste attributes, daily food routines, shopping routines, planning as a predictor of food waste and policies varied in terms of household characteristics in each country. The results of the survey gives qualitative information about food waste including data on frequency of wasting food and reasons for wasting it, which are based on self-reported behaviour of participants. As consumers play a

2
crucial role to combat food waste via their own households it is important to find solutions that are relevant to consumers and are going to help them change their habits.
Food waste is a result of complex mostly misguided activities during all processes on supply food chain. One of the objectives of the study is to understand food waste problem at household level by picturing main causes affecting food waste giving deeper insight into consumer behaviour throughout food purchasing, storage, preparation, consumption till disposal. Important part of this work is to present concepts and clarify definitions of food waste making the problem more comprehensible for unacquainted reader. Through profound analyse of literature this paper presents origins and quantities of food waste quantifying the scale of the problem, including all causes and food waste impact on environment, and economy. Moreover the study focus on practical solutions for reducing wood waste on household level offering recommendation taken from case studies of successful initiatives.
An important part of this study is to discuss and contribute towards past, present and future European policies and strategies to combat food waste, involving initiatives of organizations and movements of citizens. Identifying government actions to reduce consumer related food waste is the main element of success. It is important to understand the variety of factors which cause and influence food waste behaviour. By using tools designed and proposed by the governments and organisations, it is possible to implement efficient management systems and policies to decrease avoidable food waste and effectively manage inevitable waste (FAO, 2011). On the European level there is coalition of public authorities, industry, representatives, universities and other organisations which aim to work towards reducing food waste in Europe (European Commission, 2016c).
1.3 Dissertation Structure The first chapter of the thesis provides brief information about food waste problem, as well as
objectives and research scope of the study. The second chapter of the present study provides a theoretical context for the thesis. It is divided into five main sections, which provide a literature analysis of current food waste problem. First section present the general scale of food waste with quantities including origins, causes of increasing waste and ideas on how to reduce the food waste, as well as its benefits. This chapter has the goal of raising awareness of the consumers by showing them how big the scale of the current problem is. The following section provides an overview on the environmental impact caused by wasting food with a summary of energy and resources waste and its economic and environmental costs. Consumers behaviour was analysed in the following section and factors of consumers food waste explained by applying psychological models. The behaviour changing strategies were also included in the same section. The fourth section provides detailed overview of measures taken by the EU to combat food waste through policies and strategies, as well as programmes and projects implemented to achieve success. Moreover, this section also focused on the initiatives run by governmental and non-profit organizations and some citizen movements to minimise the increasing amount of food waste. The last section of the chapter provides an overview of the situation in Poland and Portugal including some analysis of policies, initiatives and amounts of waste.
Methodology was presented in the third chapter and provides detailed information about analytical instruments and data collection. Since the presented study includes the survey for the consumer the section provides administration procedures for survey submission, selections of variable and questionnaire design.
Results of the study presents in the fourth chapter include the analysis of the survey between Polish and Portuguese consumers with discussion and socio-demographic characteristics. The last chapter presents conclusions based on the study and proposals of future studies.

3
2 Literature and reference analysis and overview
2.1 Food waste and remains Concepts and definitions 2.1.1
Food loss and waste definitions 2.1.1.1The food waste problem has been raised already in many papers and several authors
mentioned the food waste issue in their studies. Global food waste problem with its causes and prevention has been raised by Gustavsson, J., et.al, (2011). Paper work of Ward R. (2007) as a part of WRAP project delves into the aspects which helps to understand the food waste, bringing up the causes of household food waste as well as scale of the problem and detailed consumer awareness and reasons to waste The paper work presented by World Resource Institute with collaboration of Bryan Lipinski describes very in detail the definitions of food waste, scale of the problem and ideas how to reduce the food loss and food waste with its possible approaches.
According to FAO interpretation “Food loss and food waste refer to the decrease of food in subsequent stages of the food supply chain intended for human consumption. Food is lost or wasted throughout the supply chain, from initial production down to final household consumption.” Two of these problems seem similar, but have key distinctions within their definitions as well as different solutions. The causes of food waste or loss are numerous, and occur at all stages of the food supply chain.
Food loss is considered to be food that gets spilled or spoilt before it reaches its final product or retail stage (FAO, 2016). Normally food loss is unintended and results from inefficiencies in supply chains (FSC), which take place at production, post-harvest, and at the processing stages. It is also caused by poor infrastructure and logistics, lack of technology, insufficient skills, knowledge and management capacity. “Normally the decrease of food may be accidental or intentional, but ultimately leads to less food available for all” (FAO, 2016).
Food waste is recognized as a distinct part of food loss because those responsible for generating it and the solutions are different from those of food loss (FAO, 2014) and “refers to food that is of good quality and fit for human consumption but that does not get consumed because it is intentionally discarded – either before or after it spoils. Food waste typically, but not exclusively, occurs at the retail and consumption stages in the food value chain and is a result of negligence, or is a conscious decision to throw food away” (Lipinski et al., 2013) Furthermore, food waste can be categorised into four groups:
1. Original food which includes food in unopened packages which was thrown away because it passed the expiration date including products like cheese, yogurts (and other dairy products), loose fruits and vegetable which became rotten and was never used,
2. Partly used food, the food which could have been opened or started but was never finished, 3. Leftovers which consist of food left on the plates or were cooked in big amounts which
ended up not being eaten 4. And preparation residues (vegetable peels, egg shells) – this group which by contrast to the
three mentioned where food could potentially be still used and not thrown away, contains the fractions which cannot be avoided, especially when fresh food is used to cook (Schneider, 2008).
The first three groups belong to the avoidable food waste category, where food at some point was still edible and was wasted for several reasons (leftovers, out of date products). Another category is food possibly avoidable – food and drink that some people eat and others do not (e.g. bread crusts) or that can be eaten when a food is prepared in one way but not in another (e.g.

4
potato skins) (Quested & Parry, 2011). Unavoidable food waste is a waste arising from food or drink preparation that is not, and has not been edible under normal circumstances (e.g. meat and fish remains (bones), egg shells, tea bags, coffee ground, hulks, peels). which might be reprocessed but cannot be eaten (Quested & Parry, 2011).
To provide food safety the date labelling on products was developed. This labelling includes “best before” and “use by” labelling as also another information specially those for the retailer which are very often confused by consumers.
One of the common reasons for food waste in households is the fact that many people do not understand all the information on the products. “It is estimated that a considerable share of household food waste (15-33%, depending on the studies) could be linked to date marking due, amongst others, to consumer misunderstanding of the meaning of these dates” (European Commission, 2016a) Moreover, according to the Food Standards Agency (FSA) only one-third of people correctly interpret these terms and more than a quarter thought that food past its “best before” date could be unsafe and should be thrown away (Ward, 2007).
According to the study prepared by the European Commission “Eurobarometer 425” have founded that the meaning of date marking found on food products is poorly understood by consumers. Just under half (47%) of Europeans understand the meaning of “best before” labelling and somewhat fewer (40%) are aware of the meaning of “use by”. In both cases, a quarter or more think, incorrectly, that the meaning of date marking differs according to the type of food for which it is used (European Commission, 2015b).
Better understanding and use of date marking on food like “best before” and “use by”" dates, can prevent and reduce food waste in the EU. “Best before” and “use by” are dates indicated on products like fresh meat, fish and dairy which informs about risk and gives advice applied to lower the chance of food poisoning.
The “best before” date indicates the date until the food retains its expected quality. Food labelled with this means that it is still safe to consume after the indicated “best before” day as long as storage instructions are respected and packaging is not damaged, but it might begin to lose its quality like flavour, texture or some nutritional values although health issues are not likely to be a problem (European Commission, 2016a).
“Use by” indicates the date until the food can be eaten safely. From a food safety perspective it is recommended to not use any food after the expiration of the “use by” date (European Commission, 2016a).
Waste and food waste origins 2.1.2Before any actions are implemented to reduce food waste it is necessary to start with a
diagnosis of where food waste occurs. An important step to understand the origins of food waste is detailed analysis of the food supply chain which shows the scale of the issue in each phase. The food supply chain (FSC) is “the connected series of activities used to produce, storage, process, distribute and consume food” (Stenmarck et al,. 2016). Understanding what the food chain is and how it functions is an important first step to implement adequate measures to combat food waste.
Food is wasted or lost in every phase of the food supply chain. Figure 2.1 presents the division of FSC with a short description of the processes which cause food waste in each phase. In the first stages of the food value chain the losses in developing countries are primarily in the early production, handling and storage stages. Most common losses are connected with very poor storage facilities, rodent plagues, pests and many kinds of diseases, as well as a lack of management facilities. Many times installing adequate agro-tech schemes require good understand of local, social and cultural factors which are not always understood well. Moreover, farmers and smallholders have limited access to information and trade with non-local food markets (Bond et al., 2013), as a result of

5
a failure of infrastructure which could connect them to markets. Frequently financial and structural limitations during the first stages of the supply chain combined with climatic conditions are counterproductive, causing food spoilage. In the distribution phase, food is discarded intentionally due to high European esthetical food standards or poor stock management whilst in households it is caused by negligence or a conscious decision to throw food away.
Figure 2.1 Food loss and food waste along the value chain, 2009. Source: (Lipinski et al., 2013).
According to Lipinski et al. (2013) presented in Figure 2.1 the chain ends at the moment the food products are consumed, discarded or somehow removed from the food chain with the intention to feed people. Figure 2.2 presents sources of food waste including the “end-of-life” phase as an important phase, considering that the end of life phase is highly associated with costs and environmental damage. The fact is that the later a product is lost or wasted along the supply chain, the higher the environmental cost, as impacts of processing, transport or cooking are added to the initial production impact (Fao, 2013).
Figure 2.2 Sources of food waste and sources of environmental impacts in the food life cycle. Source: (Fao, 2013).

6
The food waste which occurs in the last stage of the food supply chain is the main focus of this study. Developed countries possess integrated and mechanised supply-chains and yet food waste on the consumption level represents the biggest part in all stages. A key aspect of food waste on the consumer level lies within consumer choices and household practices. Nowadays, with food being affordable, accessible and people not actively concerned about food waste, the last stage of the food supply chain accounts for 28% of all food waste (Figure 2.4).
An important fact is that 35% of total food waste occurring on consumption levels occurs in developed countries, which through mechanization and advanced technology implemented in the last phases of food supply chain could allow the complete elimination of food waste.
Proportionally, food which is not consumed by people in developing and developed countries might look similar but noteworthy differences occur in different stages of each group. In developing countries a significant amount of food is lost during early stages (production, handling and storage) whilst in developed countries a considerable amount is wasted at the latter stages (distribution and consumption).
Figure 2.3 Share of Total Food Loss and Waste by Stage in the Value Chain, 2009. Source: (Lipinski et
al., 2013).
One of the big problems in developed countries is that food waste occurs in big cities, especially on the consumption level. Almost all urban areas experience high levels of food waste. Consumers in developed countries waste more food due to the low cost of food compared to disposable income, existing high standards of food’s aesthetical appearance and mostly because of lack of understanding of food production process. Accordingly, people living in urbanized areas normally earn more money than rural workers, buy more food from supermarkets that have high appearance standards and live far from food production areas. The United Nation (UN) projects that by 2050, 2,5 billion more people will live in urban areas, which will make up about two-thirds of world’s population, with food waste increasing significantly by 2050 (Lipinski et al., 2015).
The scale of the problem – waste and food waste quantities 2.1.3Different research reports on food waste give a good overview on why, when and how food is
wasted. Around a third of all food produced globally for human consumption is lost or wasted, which according to FAO gives a total of 1,3 billion tonnes per year. Estimates made by the EU (Stenmarck et al., 2016) indicate that around 88 million tonnes of food are wasted annually in the EU, with 180 kg being thrown away per year per person. According to the United Nation World Food Programme

7
around 795 million people in the world do not have enough food to lead a healthy active life , which is about one in nine people.
The research prepared by Eurostat in 2006 and which focused on 27 EU countries came to the conclusion that more than 89 million tonnes of food was wasted in 2006. Table 2.1 presents the exact quantities of food wasted in the EU with Great Britain, Germany, Netherland, France and Poland being high on the list. As all of these countries have a large surface area and a high population they will naturally waste more food than countries with smaller areas and population. The phenomenon seen in the list is Netherlands which as a country with just 16,8 million inhabitants wastes substantial amounts of food, especially when compared with Poland that with almost 38 million of inhabitants wastes less.
Table 2.1 Total Food Waste Generation in EU MS: Best estimate by Member State. Source: (Bio
Intell igence Service et al., 2010).
About 37% of the Earth’s land mass is used for food production with 22% being directly used
to cultivate crops and 22% as pastures and meadows for animals. Increased crop production over the last 70 years has occurred as a result of both - the expansion of crop land (altering natural

8
ecosystems to produce products) and intensification (producing more of the desired products per unit area of land already used for agriculture or forestry) (Gregory, 2014). Currently, land area used for livestock production accounts for about 80% of total agricultural land use. Limiting the l and area used for its production is consequently considered a key approach in reducing livestock’s environmental impact. This also considers cutting trees and soya production for cattle feed. (Steinfeld et al., 2006). Furthermore, with global population and per-capita incomes still growing and the need to decrease undernourishment this implies increased pressure on the global food supply system. This amplifies the risk of further expansion of agricultural land into forests and other land with high biodiversity value.
Figure 2.4 The world’s food production. Source: (Live Science, 2013).
Based on studies of the content in municipal bins, the Zero Waste Europe program published data about the solid waste composition in the EU. Municipal Solid Waste (MSW) is a waste type consisting of everyday items that are discarded by the public (Lipinski et al., 2013).
As illustrated in the graph below (Figure 2.5), currently 80% of the municipal solid waste in Europe is recyclable or compostable where 25% of the total waste is related to kitchen waste, including avoidable and unavoidable food waste. Kitchen waste is the biggest part of municipal waste in Europe. Insight into European municipal waste composition gives an insight view of how much avoidable waste is produced by European citizens.
Figure 2.5 Municipal Solid Waste Composition EU 27. Source: (Zero Waste Europe, 2012).

9
According to research prepared by FUSIONS’ European programme, the data analysis from across Europe shows that the sectors contributing the most towards food waste are households (47 million tonnes – 53%) and processing (17 million tonnes – 19%). Together these two sectors account for 72% of EU food waste, although according to a FUSIONS’ report there is a considerable uncertainty around the estimate for the processing sector. The remaining 28 percent of food wasted consists of 11 million tonnes (12%) from food service, 9 million tonnes (11%) from production and 5 million tonnes (5%) from wholesale and retail. The uncertainty is due to only a small number of recent studies of sufficiently high quality being identified and data was only obtained for up to a quarter of Member States.
Furthermore, the data illustrated in Table 2.1 includes the 28 Member States whereas the Eurostat analysis incorporated 27 European States (as Croatia joined the EU in 2013).
Figure 2.6 EU-28 Food waste by sectors (2012). Source: (Stenmarck et al., 2016).
Normally the food estimates are based on food wasted by weight. “When considering weight, a ton of grains is the same as a ton of fruits, which is the same as a ton of meat. However, food types vary widely in terms of their water and caloric contents. For instance , a kilogram of wheat flour on average contains 12 percent water and 3,643 calories whereas a kilogram of apples on average contains 81 percent water and 1,704 kcal. Consequently, measuring by weight does not consistently reflect the energy on food products that could have been consumed by people” (Lipinski et al., 2013). Measurements presented by Lipinski (2013) illustrate the scale of the problem by presenting the quantities of food waste by converting the loss and waste into calories (Figure 2.7). The result of this is that 24 percent of all food produced is wasted, meaning that one out of every four calories produced for humans are not consumed (Lipinski et al., 2013). The numbers are smaller when analysing food loss and waste by weight but they are still very significant and display the amounts in different ways.

10
Figure 2.7 The share of global food loss and waste by commodities , 2009. Source: (Lipinski et al., 2013).
The comparison of these two diagrams presented above not only illustrates the scale of the problem but also gives an indication of the type of foodstuff being wasted. Food waste and loss quantities vary when comparing food commodities by weight or by kcal. Fruit and vegetables constitute the biggest percent of food loss or waste by weight while cereals consist of 53% of all food loss and waste by kcal. The variance primarily results from differences in water content (where much of the loss and waste in fruit and vegetables is water). Fruit and vegetable are food commodities which are the most fragile and most susceptible to weather conditions and mechanical damage during all of the food supply chain and also comes with a short expiration date when bought by consumers. A significant quantity of fruit and vegetables is discarded in the initial phases of the food chain (overproduction, plagues etc.), as high quality standards in the EU leads to food being discarded in the distribution phases before it even reaches the consumers. On the consumer level the most likely reason for throwing away fruit and vegetables is that they get mouldy very fast and they are thrown away because they do not appear to be optimal.
Causes of increased food waste 2.1.4As discussed above food loss and food waste might seem similar but the causes of increasing
amounts of wastage are different. Food waste occurs in the late stages of the food supply chain and is a result of people’s behaviour. Food waste in developed countries is not caused by a lack of innovative solutions in terms of technology, the problem lies in the intentional behaviour of individuals. Reasons for food waste are diverse and it is very complex problem. This section describes different causes of food waste including an overview of people’s behaviour that is strongly connected to food waste.
Food supply and its availability has been a crucial factor in problems associated with food waste. For the last few decades food has been cheaper and more readily available than probably at any time in history (Godfray et al., 2012). Affordability of food in developed countries has led to increased quantities bought, bigger meals and portions and thereby increased waste. Often a key aspect of food waste generation lies within retail provision where the competitiveness of the market forces retailers to make available varied food and in big quantities. Retailers are one of the reasons people waste food as they have the power to influence people’s purchasing decision at every step. Stores tempt consumers to buy more through different types of special offers, like those that include free quantities on purchase (BOGOF- Buy One Get One Free), bigger packages at reduced costs, leading to buying goods that are unplanned for and mostly unneeded potentially leading to waste. Although these types of promotions might seem like money savers the products normally end up being thrown away.

11
Consumer attitudes, behaviours and habits have been examined in many publications and a lot of research has been done to discover what causes such a large amount of food to be wasted in households. Considering that huge amount of choices are made by people every day including what kind of food to buy, where, how and when to buy, in what amounts and how to use the purchased food, these very significant decisions have an influence and are results of tardive causes of increasing amounts of food waste. Purchasing decisions mentioned above are influenced by retailers that in turn consequently affect the world’s food production system and is the consumers’ first step towards bad food practises. One of the most important key factors responsible for big amounts of food being wasted are poor home economic skills. As a result of poor meal planning and cooking ability people prepare too much food and serve to big portions. Preparing too much food would not be an issue in itself if the leftovers were not discarded immediately into the rubbish bin. People could learn a lot about food waste from their elders. In the past when food was not as cheap and readily available as presently, people respected food more and using leftovers as a subsequent meal was extremely common. Older people tend to prepare food essentially from scratch, plan better and in more adequate quantities. Often young people do not show interest in learning culinary skills and this can lead to greater waste.
Children and their influence is seen as one of the significant aspects of food waste in households. Shopping with children leads to over purchasing and due to children’s tastes at home parents cook separate dishes made especially for them and fussiness and discontent means more food being thrown away (Ward, 2007).
Another important issue causing large amounts of food waste in households is a lack of basic knowledge about food labelling, food safety basics or knowledge about the scale of food waste. There will never be success combatting food waste if people do not start to understand the food waste issue and acknowledge the scale of the problem. Governments are generally those that bear the responsibility of a lack of food waste awareness in households. There is a lot of evidence of poor understanding of food handling and optimal storage. Fridges are often too warm because many households are unaware of the importance of keeping the fridge at the right temperature (Ward, 2007). Furthermore, many families are very sensitive to food hygiene and they do not want to take a chance in eating food that is close to its “best before” date even if the food looks absolutely fine and is still edible. Frequently this is due to misunderstanding the food labelling information on the packages “use by” and “best before” (European Commission, 2015b). The lack of clear information about food storage and conditions close to expiration dates leads to a big amount of waste in households. It is very common to find households that do not possess the knowledge about social, economic and environmental side effects of food waste.
According to British study by Ward (2007), lifestyle changes can lead to high waste, where changes towards healthier eating or diets mean that people buy more fresh fruits and vegetables with short shelf lives. Often the person responsible for shopping in the household tries to provide a healthy balanced lifestyle for every member of the family and as not everybody is interested in healthy life style changes a very significant part of purchased food ends up uneaten. Lifestyle changing factors like not having time to plan meals or having a job with changing schedules, especially in the case of young people, leads to badly planned food shopping and consequently increasing food waste.
Inefficiencies in all of the food supply chain leads to waste at every step. The more steps that are taken in the supply chain the greater the risk (Williams, 2012). If the consumer demands a certain type of food then retailers are normally forced to meet these demands, simply because they want to be more profitable. Often corresponding to consumer demand is not as efficient as it might seem, especially as the consumers have a free choice over what they want to buy or not, so normally after big overproduction the supplier is the one to be blamed.

12
Reducing food losses and its benefits 2.1.5
Strategies to reduce food waste 2.1.5.1Unfortunately there is no magic solution to implement to reduce food waste because every
problem has to be solved individually. Reducing food loss and waste requires proactive measures from various sources – households, companies, farmers, policy-makers and others, as well as a wide range of approaches, including changes in technological practises, behaviour and policy (Lipinski et al., 2013). Collaboration is needed because no single group can deal with the food waste problem by themselves. Tristam Stuart, the author of book “Uncovering the Global Food Scandal” states that “The wonderful news is that we can reduce our environmental impact and it does not need to be a sacrifice. It’s not like asking people to fly less, eat less meat or drive less, all of which we may also have to do. It’s actually an opportunity. We simply need to stop throwing away food and enjoy it instead” (Stuart, 2009).
According to WRAP’s strategy which has already had a lot of success in reducing food waste in relation to the food waste management hierarchy, as reduction is always better than reutilisation, and re-use is better than recycling or recovery, and all of them are better than disposal. This strategy was fully supported by the EU and can help to minimise the quantities of food wasted.
Figure 2.8 The pyramid to combat food waste (from the most desirable option down to the least). Source: (Buchholzer, 2015).
Nowadays there are wide range of strategies for reducing food waste. Literature reviews, expert interviews, author insights and internet websites suggest practical and cost-effective approaches which could be implemented to reduce the food waste problem. As mentioned above all factors in the food value chain need to be involved. As consumer food waste has the biggest amount of waste there is the need to implement approaches on the household level which will motivate consumers to decrease the amount of food which is thrown away. The extent to which governments contribute is the inherent element of successfully combating food waste. The government notwithstanding, consumers have a tremendously important role to play in terms of their everyday decisions about food consumption.

13
Most people do not realize how much food they throw away every day — from uneaten leftovers to spoiled products. About 95 percent of the food we throw away ends up in landfills or combustion facilities (EPA, 2016c). Many different approaches can be used to reduce food waste. Presented below are ideas and as strategies which can definitely reduce the amounts of wasted food.
As food waste is a complex problem many factors needs to be involved. Below are ideas that present the divisions of recommendations and indications on how to avoid and minimise the food waste a on household level. These ideas are essential to successful combat of food waste.
Table 2.2 Possible actions for consumers to minimise food waste.
CONSUMERS
Buying locally and in season
Buying locally produced food has better environmental, social and economic outcomes . Local food has greater freshness, has reduced food miles, and benefi ts local farmers and communities and protects local economies and traditions . The really important fact is that nowadays people do not have contact with food except for that in their shop or on thei r plate. Lack of connection between consumers and the production of food and agricultural raw materials was suspected with the effect that consumers have di fficul ty visualizing growth and production. Consumers thus might lack of understanding of variation in appearance or lack of proper valuation of the food
(Aschemann-Witzel , 2015). Buying locally helps reconnect consumers with where their food comes from and might have a big influence on the process of understanding that food production requires time, money, and manual labour.
Composting Food waste is substantially harmful for the environment. Even when all actions have been taken to use wasted food, certain inedible parts will s till remain and can be turned into compost to feed
and nourish the soil. Composting is the natural process of de composition that turns organic materials like garden waste and vegetable food scraps compost. Using compost is the foundation of maintaining healthy soil by s timulating all plant growth and creating a beauti ful garden. Even without a garden, composting is still possible. The finished product is valuable for houseplants , or local allotment gardeners might be interested in using it (EPA, 2016a). On speci fic websi tes like
s topfoodwaste.ie of food there are many advices to learn how to do it, what can be composted and which option is best for each consumer.
Improving food storage
Food is often wasted because i t is not stored properly which allows i t to become mouldy, rot, or al ternatively has been in the freezer for too long. Storage methods play an important role in
reducing food waste and the right storage can contribute towards this. There are many great resources to learn about better s torage. Websites have many tips like food preparation methods to avoid inadequate s torage. Fridge should have the temperature below 5ºC and food products
should be ordered on the fridge shelfs with accordance to established patterns to as longest as possible make use of food products . Research shows that up to 70% of consumer fridges are too
warm, meaning food will not last as long as i t could (WRAP, 2016). Milk goes off much quicker i f the fridge is just a few degrees too warm. Many websites provides useful information how to s torage food. Rotating products in the fridge/freezer is one of the options to reduce food waste.
Right after buying a new product from the s tore, i t is advisable to bring all the older i tems in the cupboards and fridge/freezer to the front. Putting the new food products at the back will reduce
the risk of finding something rotten and mouldy in food storage compa rtments (European Commission, 2014b).
Donating food to food banks
It is very common that some perfectly good food just never gets eaten. One of the ways to reduce this type of waste is to simply redistribute food by giving i t to food banks and similar chari ties that help feed those in need. People can visi t many websites in their communities to get more knowledge about how to donate. Cari tas is an international organization which works essentially everywhere and is one of the options to get some more knowledge about how to help thereby
reducing food waste.

14
Freezing One of the simplest ways to reduce food waste is freezing leftovers food at home. Small amounts of bread can be frozen and taken out a few hours before consumption. Likewise cooked and al ready prepared foods are an option of a quick meal when there is no time to prepare i t. There are some products which do not freeze well like some fresh cheese and some vegetables with high
water content but other products can be frozen without any problems, can s tay in the freezer for weeks, and can be defrosted anytime.
Checking the dates An Important issue is to check date labelling before buying any product. Often purchasing food without checking the date in the firs t place leads to throwing products into the garbage as a result of fear of food poisoning. Short shelf life products should be purchased on the day when i t is to be
consumed, if such is not possible then products with longer shelf life should be purchased.
Preparing the right
amounts
The main reason people throw away food is because they prepare too much. People often do not
know the right amounts to cook, especially food that increases in volume like for example rice or pasta . Many try to follow their instinct and some cook all the package because i t is the easiest way to ensure that no one leaves the table hungry. It is important to measure the right amount of food to be cooked, and there are many ways to achieve this, especially as there are so many available accessories like scales, spoons and cups created to help people prepare the right amounts of the food.
Buying Less Food Buying in bulk can save consumers money, but unfortunately does not i f the consumer ends up throwing away a lot. Reducing food waste requires consumers to be more responsible with their food consumption. Instead of buying more food, consumers should buy food more conscientiously
(Worldwatch-Insti tute, 2011). The key factor is shopping with planning and responsibility, i t is essential to purchase only what a family can consume in a reasonable time or until the food’s expiration date. Ideally meals should be planned for a whole week. It might not seems that easy,
but checking the ingredients in fridges and cupboards and making an inventory, then wri ting a shopping list for just the extras which are needed helps signi ficantly decrease waste in the
household. Preparing and making shopping lists only works if people s tick to the list. There are a number of services that help consumers shop responsibly, applications like: Mealmixer or e -mealz help consumers make a weekly shopping list that help purchase the exact amount of products
needed. Buying fruit and vegetables individually instead of pre-packed can help buy exactly the amount needed. Many shops al ready provide options of buying many food products by weight where consumers easily can control to buy exactly the amount of food they need.
Avoiding to shop on
an empty stomach
When i t comes to food, eyes are defini tely bigger than s tomachs . It is a common mistake to go
shopping for food on empty s tomach. Hungry shoppers spend more money, and buy more. Before going food shopping on an empty s tomach, i t might be a good idea to eat a small snack beforehand. It will ensure less shopping and bigger savings . A research team led by Alison Jing Xu
of the Universi ty of Minnesota reports that hunger “is likely to activate general concepts and behavioural knowledge associated with acquisition”.
Shopping without children
One of the ways to waste less food is trying to go shopping without children. This may seem unrelated but children not only pressure into making unnecessary purchases but also have short
attention spans which get shorter when hungry. When there is no other option than taking chi ldren shopping i t can be a good idea to feed them first.
Managing purchased food
It is very common that consumers throw away food after preparing too much, often because the amount of food which is left is not enough to feed everyone or have no idea how to use the leftovers. There are many recipes, apps and websites which give creative and delicious ideas on how to use leftovers . Websites like: Love Food Hate Waste or Jamie Oliver, offer cooking recipes for leftover
food. A Simple “leftover recipe” search in google shows thousands of results for how to take advantage of leftovers , decreasing home food wastage. Planning in advance how to use or preserve leftovers can help a lot.
Self-Monitoring Sel f-Monitoring is a tool which makes it really easy for consumers to see what and how much they throw away. It helps to understand food habits and in the context of food waste is really important
as everything what consumers throw away disappears in the rubbish bin and is never seen again. The goal of self-monitoring is to show consumers the consequences of their behaviour. It might
show what is wasted per day or per week, what food is most commonly thrown away and why. Understanding all of these causes might be an effective tool to reduce food waste in households.

15
Table 2.3 Government’s possible action to minimise food waste.
GOVERNMENT
Better food date labels
Several date s tamps may be found on food labels: “best before”, “use by”, “sell by”, “display until”, but these are not always used consistently. The European Parliament has suggested dual -date labelling to include both “sell by” (which can help retailers avoid selling products reaching their end -of-life) and “use by” dates , but better consumer understanding of terminology is needed fi rst (European Commission, 2016a). The “use by” and “best by” dates found on food products are suggestions on when to consume the product. Misunderstanding package labelling is one of the factors in premature food discarding. Confusion about “use-by”, “sell -by”, “best-before” and other date labels , lead people to throw away food
that is still good to eat. One of the surveys prepared b y the Waste and Resources Action Programme (WRAP) in the United Kingdom have found that “one-fifth of food thrown out by households was incorrectly perceived as being out of date due to confusing labels”. It is a crucial issue to minimise consumer confusion about labelling. One of the solutions to help consumers avoid confusion is to remove certain date labels, such as “sell-by” dates , which is only relevant information for the retailers and often confuses the consumer. It appears that legislation and food producer’s usage should be improved and harmonized to better match how consumers actually can handle date labelling, to then educate consumers consis tently on i ts right understanding and usage. In the latter case, product package
information, as well as retailer’s in-store communication efforts might be able to contribute (Aschemann-Witzel et al., 2015). Consumers should be informed that using their own visual , ol factory and taste senses and judgement can be very helpful with many food products , e xcept when there is an expired “use by”
date.
Launch
consumer awareness campaigns
Consumer atti tudes and behaviour play a large role in determining the amount of food that is wasted in
households . Al though changing the way people consume and throw out food can be difficul t, communication campaigns can help influence consumer behaviour on the household level (Lipinski et al., 2013). Awareness campaigns reveal how much food people actually waste and provide simple solutions for cutting down on that waste. Not only can the government contribute by minimising problems but retailers like grocers can play a part in these ini tiatives under the guidance of the government. Initiatives such as cooking classes and information displays sponsored by local government and community groups can also provide consumers with information that signi ficantly helps reduce waste. Consumer education campaigns indirectly affect food waste by influencing people’s consumptive behaviour. (Lipinski et al., 2013) These campaigns should raise awareness about the benefi ts of preserving food waste and social, economic and environmental consequences of increasing the food waste problem.
School education
Getting food education in every early schools is a key solution to combat food waste on the household level . Food skills are one of the most valuable life skills which can be learned. School education about food
for children should give basic information to children about food, where i t comes from and how i t affects the body, what happens with unconsumed discarded food and what the economic, social and
environmental consequences are. If there was an opportunity for every child to learn about growing and cooking food and through this understand the implications of food waste on the overall community, the knowledge and tools gained could lead to a healthie r and more fulfilling live where food waste would not
be a problem (FoodDay, 2016). The important fact is that the more children cook and prepare fresh food from scratch, the more likely they are going to appreciate what food is and respectively try to not throw it away. Providing children with education about food and food waste has never been more important as it i s today where one third of food produced in the world goes to waste (FoodDay, 2016).
Smaller package size
The trend towards smaller households has important implications on food waste and packaging. Small single households tend to waste around 45% more food per person than the average larger household so there is evidently a big opportunity for producers to satisfy this group by providing smaller package sizes. New packaging innovation could significantly reduce food waste. Redesigning packaging, extending a product’s shelf life or by implementing more varied pack sizes are simple and attainable solutions to
achieve the goal. The challenge is to design primary packaging and secondary packaging that accommodates changing consumer needs . Nowadays , trend towards smaller households encourage consumers to buy cheaper and bigger amounts of products which as a result may increase food waste if
consumers end up buying more than needed (Plumb & Downing, 2013). Normally products end up going out of date, or get spoiled before being completely consumed. The new trend of single or two person
households needs to encourage manufacturers to consider implementation of more flexible package sizes
to meet consumer demands . Introducing small packages of daily products like salads, cheese and milk allows shoppers to choose the right amount of products . As long as there was correct management and
recycling of the packages there would also not be any worries about increasing amounts of plastic, metal

16
or paper. Smaller servings will therefore reduce waste by meeting the needs of single and two person households (WRAP, 2013).
Food waste
research Research has the potential to better inform governments about household food waste behaviour,
allowing the right tools and policies to be developed and implemented to minimise food waste. Unfortunately there is a lack of household-level researches on food waste. There is an importance to
prepare more s tudies which could focus on consumers knowledge, atti tudes and behaviour towards food waste. In particular, the each EU country regional speci fici ty on food system, waste management system and cultural norms in regards to food necessitates, place-based and geographically-sensitive analyses.
Emphasising women’s role in
combatting food waste
Women in both developing and developed countries have a really important role to play in reducing food waste. As women take part in every s tage of producing food right down to consumption it is important to
take a closer look at how they can combat the food waste problem. FAO said in i ts 2010-11 edition of The State of Food and Agricul ture report that “if women in rural areas had the same access to land, technology, financial services , education and markets as men, agricul tural production could be increased and the number of hungry people reduced by 100-150 million”. According to the World Food Programme analysis of the last s tage of the food value chain shows that woman are responsible for 85-90 percent of the time spent while preparing food in households . A partnership between Love Food Hate Waste and the Women’s Insti tute (WI) helped participants throw away 50% less food. The WI now has funding to work with young parents from disadvantaged backgrounds in England as part of i ts “Let’s Cook Local” project, which Love Food Hate Waste is also supporting. There are more initiatives worldwide like one created in Tanzania which focuses on providing female farmers with greater access to markets. A Campaign in
Australia called “1 Million Women” has the aim to encourage women to take action in environmental issues which includes reducing food waste. This kind of campaign hosts events with celebri ty chefs to raise awareness of food waste, and with the help of the official website provides tips on how to reduce waste,
including recipes for how to efficiently use food thereby avoiding food waste.
The benefits of reducing global food waste 2.1.5.2Reducing global food waste will have a significant part to play in increasing the availability of
food in the future. Predictions of the world’s population is that it will increase from 7 billion to 9,3 billion by 2050. If current trends continue, the world will need to increase food production by 70 percent by 2050 (FAO, 2009). Growing that amount of food will put a significant strain on the planet. In many articles there is a concern about whether more food can be produced sustai nably, how more food can be produced using less land and how to increase food production while minimizing the environmental impact. This is undoubtedly an important issue and should be considered when creating a new sustainable world able to feed a larger population. Unfortunately greater food production means increasing greenhouse gas emissions, water and energy consumption and bad management might causes inefficiency through all supply chain phases, leading to food waste and waste of natural resources. Over the past half-century food production has already increased, causing a big disproportion between those who are hungry or suffer from malnourishment and those who have fast and easy access to each type of food product (FAO, 2009). There needs to be greater concerns of equitable availability of food products to everyone. The global food system fails on many levels in ensuring that adequate food reaches hundreds of millions of poor people in developing countries, and only deep reforms will lead to a more equitable, sustainable and lasting food system that is truly capable of ending hunger by 2025 and feeding 9.3 billion people by 2050 (FAO, 2009). It is important to know that access (purchasing power and price of food) and supply problem are considerable issues. (Gustavsson et al., 2011). Future predictions indicate that food production must increase significantly (Madre & Devuyst ,2015). An important part of an adequate solution might not be increasing food production but proper use of what is already produced. Instead of increasing food output there should be more efficient management of food production, storage, distribution, and most importantly consumption, to minimise and develop simple waste-reducing measures in all phases and as a result to achieve the goal of feeding the increasing population.

17
To reduce food waste a lot of investments of time, money and goodwill will be required, but the potential economic, social and environmental benefits are vast, and the consequences of not taking sufficient action might be disastrous for individuals, countries and the food system as a whole.
Starting with the environmental benefits, the greatest benefit that would come from reducing food waste is preventing food from being wasted in the first place, thereby keeping food out of landfills. Decreasing food waste is a significant part of the effort to minimise the agricultural sector’s environmental impact. Reduction of food waste has enormous potential to reduce the amount of energy, water and natural resources used to grow, harvest, transport, process and sell food, as well as the huge amounts of greenhouse gas emissions and other general emissions which are associated with storage and cooking. Generally, highlighting the environmental benefits of wasting less food is not strong enough of a motive for most people to proactively reduce food waste, but when combined with potential financial savings can be a very effective additional motivator. Many consumers lack the skills or knowledge of how to reduce food waste, but even when this is not the case, some solutions which could help to reduce the food waste problem are out of the consumers control (such as package size in the stores and the incapacity to reseal opened packages).
Reducing food waste has significant economic benefits. However, despite these benefits being clear there may not be enough of an economic incentive to encourage consumers to reduce food waste. Reducing food waste has a cost, but it is not comparable with the benefits that come from successfully combating food waste. On a smaller scale it can considerably lower household food bills. Buying less food but in adequate amounts would reduce food waste and thereby consumption of all food bought. Rutten et al. (2013) suggested that reducing food waste by 50% between 2012 and 2020 could lead to an average savings of €192 per person or a saving of €94.4 billion for the EU as a whole per year, whilst leaving the EU economy relatively unaffected, although some sectors would to do better than others (Parry et al., 2015).
With growing world population, demand for food will increase if there is no adequate use of already grown food. Unfortunately, increased demand for food raises prices - whether the food is eaten or thrown away. This impacts low-income families the most, since a large portion of their income goes towards buying food. Reduction of food waste could help feed more people and could be important in the world-wide efforts to feed a growing world population (FAO, 2009). Social benefits might not be seen immediately but over time zero food waste would make a real difference. Cutting food waste is very important socially. Social actions like redirecting food to emergency food providers that aim to eliminate hunger in communities raises people’s solidarity and gives a sense of accomplishment.
A clear benefit of reducing waste is the increase in efficiency and productivity of the food system. The existence of food waste in all stages of the food system means that the system of food production, supply and consumption is not as efficient as it could be. Reducing the amount of food wasted increases efficiency by allowing the production of more food with the same amount of inputs. This means that the capital, labour and natural resources (land, water, and energy) used to produce, transport and sell food are used more efficiently and productivity increases (Parry et al., 2015).
Moreover, wasted food is a valuable resource and can be used as a source of renewable energy. Separate food collections which are not sent to landfills could be used to produce renewable energy, heat, biofuel and fertiliser through "anaerobic digestion". The composting process is one of the ways of avoiding food waste going to a landfill and has numerous benefits. Compost reduces and in some cases eliminates the need for chemical fertilizers (EPA, 2016b). It can be used in homes as well as a component of municipal composting, promoting higher yields of agricultural crops. Compost can help reforestation, wetlands restoration, and habitat revitalization efforts by improving contaminated, compacted, and marginal soils (EPA, 2016b). Compost can be used to remediate soils
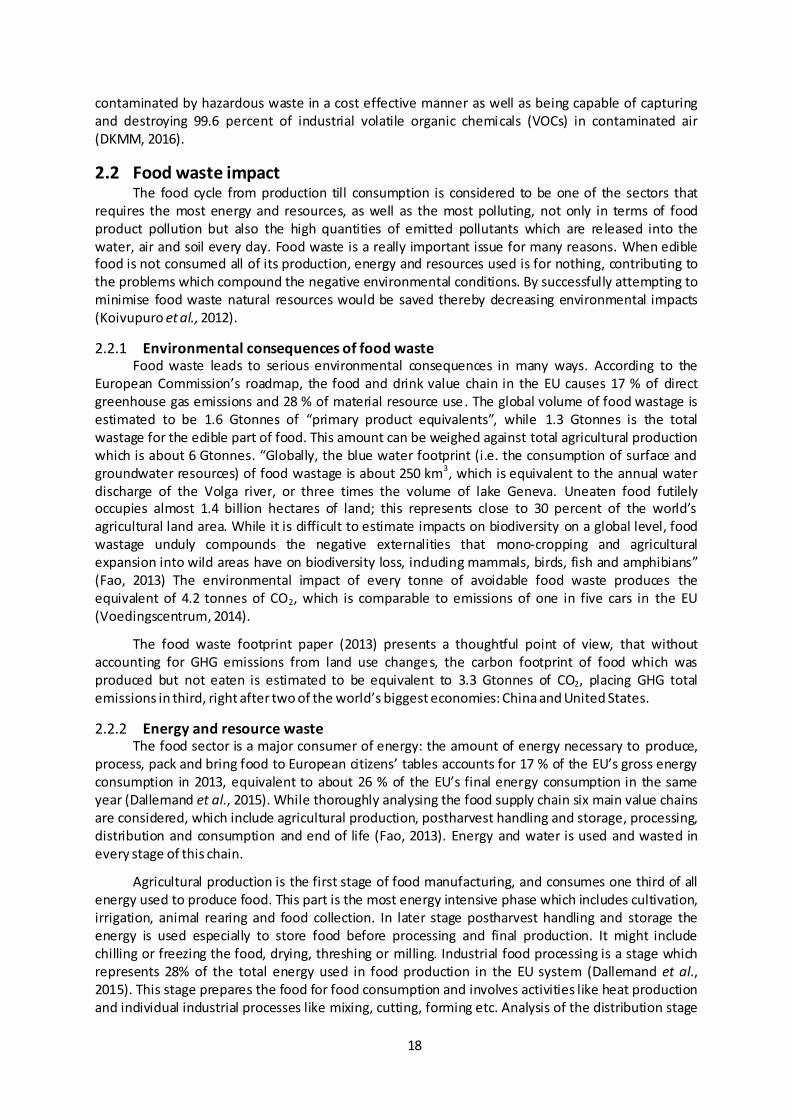
18
contaminated by hazardous waste in a cost effective manner as well as being capable of capturing and destroying 99.6 percent of industrial volatile organic chemicals (VOCs) in contaminated air (DKMM, 2016).
2.2 Food waste impact The food cycle from production till consumption is considered to be one of the sectors that
requires the most energy and resources, as well as the most polluting, not only in terms of food product pollution but also the high quantities of emitted pollutants which are released into the water, air and soil every day. Food waste is a really important issue for many reasons. When edible food is not consumed all of its production, energy and resources used is for nothing, contributing to the problems which compound the negative environmental conditions. By successfully attempting to minimise food waste natural resources would be saved thereby decreasing environmental impacts (Koivupuro et al., 2012).
Environmental consequences of food waste 2.2.1Food waste leads to serious environmental consequences in many ways. According to the
European Commission’s roadmap, the food and drink value chain in the EU causes 17 % of direct greenhouse gas emissions and 28 % of material resource use. The global volume of food wastage is estimated to be 1.6 Gtonnes of “primary product equivalents”, while 1.3 Gtonnes is the total wastage for the edible part of food. This amount can be weighed against total agricultural production which is about 6 Gtonnes. “Globally, the blue water footprint (i.e. the consumption of surface and groundwater resources) of food wastage is about 250 km3, which is equivalent to the annual water discharge of the Volga river, or three times the volume of lake Geneva. Uneaten food futilely occupies almost 1.4 billion hectares of land; this represents close to 30 percent of the world’s agricultural land area. While it is difficult to estimate impacts on biodiversity on a global level, food wastage unduly compounds the negative externalities that mono-cropping and agricultural expansion into wild areas have on biodiversity loss, including mammals, birds, fish and amphibians” (Fao, 2013) The environmental impact of every tonne of avoidable food waste produces the equivalent of 4.2 tonnes of CO2, which is comparable to emissions of one in five cars in the EU (Voedingscentrum, 2014).
The food waste footprint paper (2013) presents a thoughtful point of view, that without accounting for GHG emissions from land use changes, the carbon footprint of food which was produced but not eaten is estimated to be equivalent to 3.3 Gtonnes of CO2, placing GHG total emissions in third, right after two of the world’s biggest economies: China and United States.
Energy and resource waste 2.2.2The food sector is a major consumer of energy: the amount of energy necessary to produce,
process, pack and bring food to European citizens’ tables accounts for 17 % of the EU’s gross energy consumption in 2013, equivalent to about 26 % of the EU’s final energy consumption in the same year (Dallemand et al., 2015). While thoroughly analysing the food supply chain six main value chains are considered, which include agricultural production, postharvest handling and storage, processing, distribution and consumption and end of life (Fao, 2013). Energy and water is used and wasted in every stage of this chain.
Agricultural production is the first stage of food manufacturing, and consumes one third of all energy used to produce food. This part is the most energy intensive phase which includes cultivation, irrigation, animal rearing and food collection. In later stage postharvest handling and storage the energy is used especially to store food before processing and final production. It might include chilling or freezing the food, drying, threshing or milling. Industrial food processing is a stage which represents 28% of the total energy used in food production in the EU system (Dallemand et al., 2015). This stage prepares the food for food consumption and involves activities like heat production and individual industrial processes like mixing, cutting, forming etc. Analysis of the distribution stage

19
shows that transport and logistic accounts for 9,4% of energy use in this sector. This later stage is mainly responsible for international trade, food service establishments and retail . Furthermore, nowadays the industrialisation of the food sector has led to an increase of out-of-town shopping centres which have replaced small local shops meaning more frequent trips to purchase food thereby increasing the demand for land, fuel and energy needed to maintain the centres. Consumption level is responsible for household food conservation, preparation and cooking which require fuel, electricity and water consumption. According to the FAO (2014), 40 % of the world’s population still depend on bioenergy sources for cooking and heating. Inefficient and poorly designed cooking stoves means considerable energy wasting and public health issues. Even if generally managed in a safer way, food cooking and domestic conservation accounts for 13% of the energy embodied in the average EU food consumption in 2013 (Dallemand et al., 2015).
The final phase of the food chain which includes final disposal of waste accounts for 5% of energy use but food waste occurs in every step of the food chain. Of course the energy used in each sector differs notably and depends on many variables like changes in cultivation areas, farming practices, efficiency of processing and food produced etc., but when considering that around a third of all food produced globally for human consumption is lost or wasted, giving a total of 1,3 billion tonnes per year, it means that a third of all energy used to produce this food is wasted too. It is a huge amount when considering the amount of energy used in all cycles. Besides the energy, which is wasted during all of the food cycle during production, food waste causes miscellaneous technical problems in waste management. From the time food finishes up in the rubbish bin, problems occur practically in all phases of the waste management system, due to substances which are normally biodegraded under aerobic and anaerobic conditions. Residual food waste, especially that with specific organic content or heating value has to be pre-treated before land filling . Furthermore, extremely unpleasant odours are released, many environmentally toxic liquid and gaseous emissions are generated by the biodegradation process and waste bins and collection vehicles are contaminated, making it dangerous for animals and people.
Enormous amounts of energy are used throughout the food chain. Coal, oil, water or gas are all essential to produce energy and are non-renewable natural resources. Actually, nowadays many improvements can be made and implemented step by step in all the food supply chain. Energy efficiency in agriculture helps farmers become energy self-sufficient through the increase of renewable energy and contribute to reducing GHG emission. Energy efficiency in food transportation improves the energy performance of the transportation systems and optimises the amount of transportation necessary (Dallemand et al., 2015). Technological improvements can implement more efficient machines and engines, but what has to be improved most is the efficient management of food already produced so there is no energy waste. Consumers also have an important role to play as everyday decisions about food consumption might affect the amount of energy required to produce food potentially reducing the energy food print.
The full costs of food waste – global and household level 2.2.3Food which was grown and not eaten has significant social, economic and environmental
costs. Global costs of food waste were calculated from the analysis of categories like the atmosphere (costs of greenhouse gas emissions), water (water scarcity, water pollution, pesticides in sources of drinking water) soil (soil erosion, land occupation and deforestation) biodiversity/ecosystem impacts, social (livelihood, health damages) and economy (value of products lost and wasted) (FAO, 2014). Global calculations presented by the FAO final report „Food wastage footprint, full-costs accounting” indicates that in total 2,6trillion USD is lost annually, this amount of money is roughly equivalent to the French GDP.
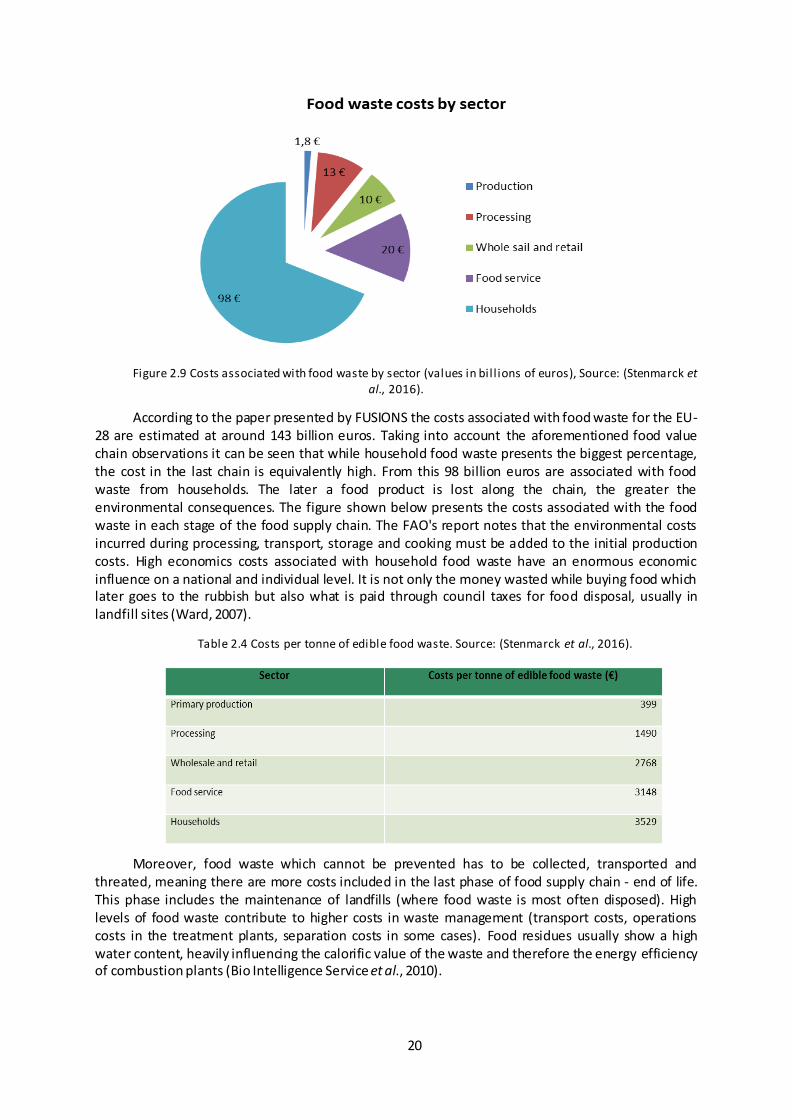
20
Figure 2.9 Costs associated with food waste by sector (values in bil l ions of euros), Source: (Stenmarck et al., 2016).
According to the paper presented by FUSIONS the costs associated with food waste for the EU-28 are estimated at around 143 billion euros. Taking into account the aforementioned food value chain observations it can be seen that while household food waste presents the biggest percentage, the cost in the last chain is equivalently high. From this 98 billion euros are associated with food waste from households. The later a food product is lost along the chain, the greater the environmental consequences. The figure shown below presents the costs associated with the food waste in each stage of the food supply chain. The FAO's report notes that the environmental costs incurred during processing, transport, storage and cooking must be added to the initial production costs. High economics costs associated with household food waste have an enormous economic influence on a national and individual level. It is not only the money wasted while buying food which later goes to the rubbish but also what is paid through council taxes for food disposal, usually in landfill sites (Ward, 2007).
Table 2.4 Costs per tonne of edible food waste. Source: (Stenmarck et al., 2016).
Moreover, food waste which cannot be prevented has to be collected, transported and threated, meaning there are more costs included in the last phase of food supply chain - end of life. This phase includes the maintenance of landfills (where food waste is most often disposed). High levels of food waste contribute to higher costs in waste management (transport costs, operations costs in the treatment plants, separation costs in some cases). Food residues usually show a high water content, heavily influencing the calorific value of the waste and therefore the energy efficiency of combustion plants (Bio Intelligence Service et al., 2010).

21
All of these are assigned approximate monetary values to social or environmental impacts as measures will always be inexact. Besides, there are many other hidden costs which cannot be quantified like for example bacteria which purify water or the scarcity of central agriculture or increasing food prices because of decreased supply.
Food wasted by consumers has a higher accumulated environmental impact than food wasted in the rest of the stages of the food chain and is therefore even more important to reduce. Reducing food waste makes sense environmentally, economically and socially speaking, and there is a need to make sure that people understand the scale of the problem and the cost to the environment and how big a contribution food waste makes to European landfills therefore by producing huge amounts of greenhouse gases (WRAP, 2007).
2.3 Consumer behaviour
Determining factors of food waste behaviour 2.3.1This part of the study aims to explain some of the boosts of household food waste behaviour
through the application of behavioural models. Various models like the Theory of Planned Behaviour, the Theory of Interpersonal Behaviour and the Model of Activation Norm were used to explain the behaviour of consumers in terms of food waste. These models provide a list of factors which are very useful to analyse the relationship between consumer behaviour and food waste.
The Theory of Planned Behaviour 2.3.1.1According to the Theory of Planned behaviour (TPB), human behaviour is guided by three
types of considerations: behavioural beliefs (beliefs about consequences of certain behaviour), normative beliefs (beliefs about the normative expectations of others), and control beliefs (beliefs about the presence of factors that may facilitate or impede behaviour).
In particular aggregates, behavioural beliefs produce a favourable or unfavourable attitude towards behaviour; normative beliefs result in perceived social pressure or subjective norm; and control beliefs give rise to perceived behavioural control. In combination, attitude towards the behaviour, subjective norm, and perception of behavioural control lead to the formation of a behavioural intention (Netemeyer et al., 1991).
“Because attitudes, subjective norms, and perceived behavioural control are assumed to be based on corresponding sets of beliefs, behavioural interventions must try to change the beliefs that, according to the theory, ultimately guide performance of the behaviour.” (Netemeyer et al. 1991). Behavioural beliefs associate a behaviour with certain outcomes and other attributes, and they determine the attitude towards the behaviour in line with the subjective values of these outcomes and attributes. The stronger the belief the more favourable or unfavourable the outcome and the stronger the impact of the belief on the attitude.
Attitudes can be influenced by many factors where moral aspects are an important part and are very relevant for food waste behaviour. As Schiffman (2014) defined, “Attitudes are an expression of inner feelings that reflect whether a person is favourably or unfavourably predisposed to some "object" and “attitude formation, in turn, is the process by which individuals form feelings or opinions towards other people, products, ideas, activities, and other objects in their environment” (Schiffman, 2004). It is important to ascertain if consumers feel bothered or guilty when throwing food away, if there is concern about wasted money, damage to the environment or economy or in general if the food wasted is seen as a problem.
Two further considerations influencing intentions are subjective norms and perceived behavioural control. Subjective norms refers to what is considered approved or disapproved behaviour in a specific situation (Netemeyer et al., 1991) and is guided by social pressure to engage or not to engage in a specific behaviour. According to this, people would waste less food if this behaviour was disapproved by others that are important to them. Perceived behavioural control

22
measures the perception of ease or difficulty of the particular behaviour in regards to food waste. Food waste perceived behaviour refers to people’s abilities and attempts to buy and cook exactly the amount of food that are needed, planning and predicting use of leftovers or in general attempt to eliminate food waste in households. Consumers that have these abilities will make more efforts to try to not waste food. The lack of these abilities may be a reason to not be motivated enough to avoid wasting food (Stefan et al., 2013), (Evans, 2012) Generally, the lack of these abilities normally leads to higher amounts of food being discarded.
The general rule is that, the more favourable the attitude and concern towards the food waste problem is, subjective norm (approvals or disapprovals and influence of others), and the greater the perceived control (abilities and attempt to predict and plan the right amounts of food needed), the stronger the consumer’s intention to improve behaviour towards food waste should be. Finally, given a sufficient degree of actual control over behaviour, “people are expected to carry out their intentions when the opportunity arises. Intention is thus assumed to be the immediate antecedent of behaviour” (Netemeyer et al., 1991).
Figure 2.10 Model of the Theory of Planned Behaviour, Source: (Ajzen, 2002).
The Theory of Interpersonal Behaviour 2.3.1.2According to Triandis, behaviour is a part of intention, part of habitual responses, and part of
situational constraints and conditions. Intention is influenced by social and affective factors as well as attitudes and emotions which are strongly influenced by beliefs (Egmond & Bruel, 2007). A belief is a conviction that an individual has of something. Through experience acquired, learning and external influences (family, friends, school) beliefs will be developed that will influence food waste behaviour. Supposing that, if during childhood after the meal the leftovers were put into the garbage bin or that purchasing big amount of products was a basic rule to provide enough food for all family members, it might be quite difficult to change attitudes in adulthood, which will eventually lead to wasting food. Beliefs as well as attitudes are generally well-anchored in the individual’s mind and are difficult to change (Perreau, 2016).
For many people, their beliefs and attitudes are part of their personality and of who they are. Attitude can be defined as a feeling of favourableness or unfavourableness that a consumer has towards food waste issue, and it allows them to develop a coherent behaviour towards a certain action or idea and normally have a direction which can be positive or negative in terms of the food

23
waste (Perreau, 2016). An important fact is that attitudes are a learned predisposition, which means that they are learned and formed as a result of individual experiences, interaction with other people and obtained information (Kanta, 2015). Moreover, attitudes occur within a certain situation. Sometimes, depending on the situation, a consumer may exhibit a behaviour that may be inconsistent with their usual attitude (Kanta, 2015). An example of a situation where a consumer has an abnormal attitude might be after organising a big party large amount of leftovers end up in the garbage bin as a result of over preparation and it being impossible to consume all remaining food. This kind of example is a good way to show that even if a consumer’s usual behaviour is against food waste, certain situations might lead to behaviour which might be disparate to the usual.
“Social factors include norms, roles and self-concept. Norms are the social rules about what should and should not be done. Roles are “sets of behaviours that are considered appropriate for persons holding particular positions in a group”(Egmond & Bruel, 2007). Each person possesses different roles and status in society depending on the groups, clubs, family, organization etc. to which they belong. “Self-concept refers to the idea that a person has of his/herself, the goals that it is appropriate for the person to pursue or to eschew, and the behaviour that the person does or does not engage in” (Egmond & Bruel, 2007). Household routines like food provisioning processes include shopping, cooking and households' perceived skills in dealing with these routines are considered as potential determinants of food waste behaviour in parallel to psycho-social factors.
“Emotional responses to a decision or to a decision situation are assumed distinct from rational-instrumental evaluations of consequences, and may include both positive and negative emotional responses of varying strengths” (Egmond & Bruel, 2007) “The wish to avoid experiencing negative emotions (such as guilt, frustration, annoyance, embarrassment or regret) underpinned both the motivations and the barriers to minimising food waste” (Graham-Rowe et al., 2014). Triandis proposed that affection serves as an input in the decision making process. In terms of food waste, affection could be defined as the emotional response to a particular situation that is primarily based on instinctive and unconscious mental processes.
An important part of this model which differentiates it from the model of Planned Behaviour is the role of habits. Habits are strongly influenced by frequency of past behaviours and are the result of decisions about all the activities which lead to throwing food away. According to Ouellette et al. (1998), past results of a behaviour may provide individuals with information that shapes their beliefs, which in turn, determines future behaviour. What is more, repeating a behaviour may lead to the formation of a habitual response, leading to behaving automatically with little effort or conscious awareness. The fact is that when past behaviour is found to have a direct effect on future behaviour over and above the influence of social cognitive variables, this is taken as evidence that the behaviour is under habitual control (Norman & Cooper, 2011). When past behaviour is found to have a direct influence on future behaviour, this is usually taken to reflect the involvement of habitual processes that serve to weaken the impact of intentions on behaviour (Egmond & Bruel, 2007). Habitual behaviours are performed frequently, but they are also performed automatically, efficiently, and with little effort or conscious awareness (Verplanken, 2003). The influence of habits increases over time, and the more often a behaviour is repeated, the more automatic and less deliberate it becomes.
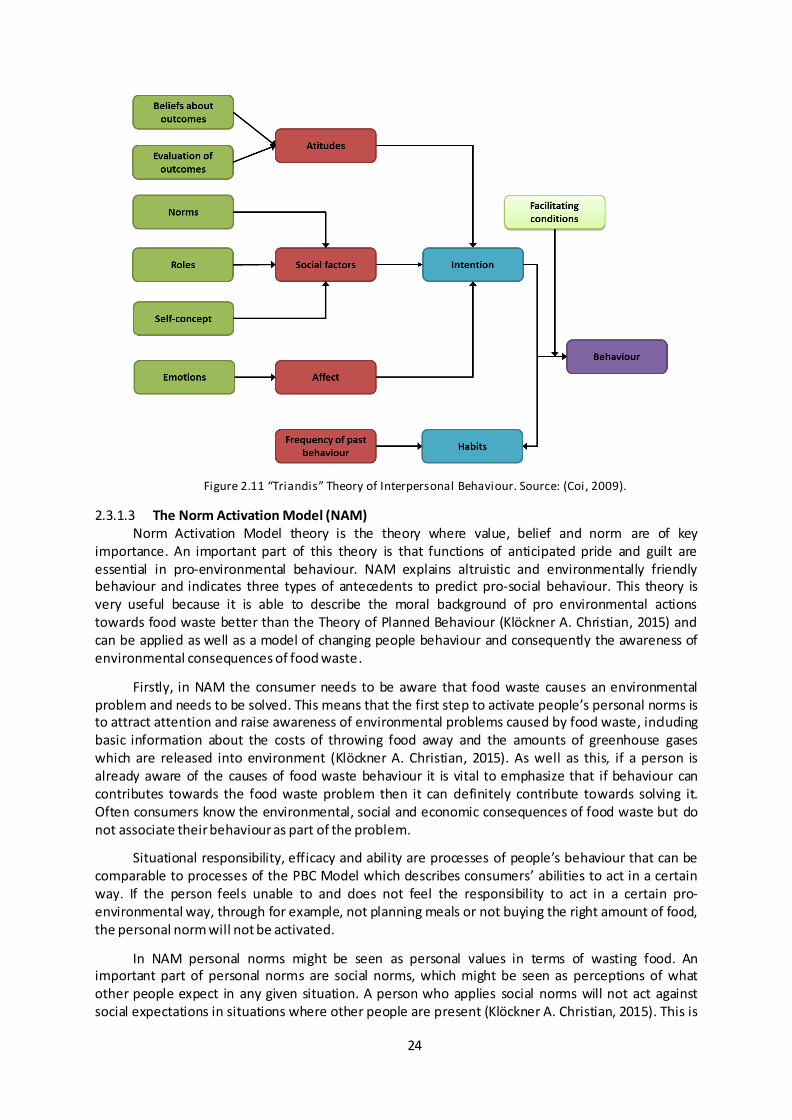
24
Figure 2.11 “Triandis” Theory of Interpersonal Behaviour. Source: (Coi, 2009).
The Norm Activation Model (NAM) 2.3.1.3Norm Activation Model theory is the theory where value, belief and norm are of key
importance. An important part of this theory is that functions of anticipated pride and guilt are essential in pro-environmental behaviour. NAM explains altruistic and environmentally friendly behaviour and indicates three types of antecedents to predict pro-social behaviour. This theory is very useful because it is able to describe the moral background of pro environmental actions towards food waste better than the Theory of Planned Behaviour (Klöckner A. Christian, 2015) and can be applied as well as a model of changing people behaviour and consequently the awareness of environmental consequences of food waste.
Firstly, in NAM the consumer needs to be aware that food waste causes an environmental problem and needs to be solved. This means that the first step to activate people’s personal norms is to attract attention and raise awareness of environmental problems caused by food waste, including basic information about the costs of throwing food away and the amounts of greenhouse gases which are released into environment (Klöckner A. Christian, 2015). As well as this, if a person is already aware of the causes of food waste behaviour it is vital to emphasize that if behaviour can contributes towards the food waste problem then it can definitely contribute towards solving it. Often consumers know the environmental, social and economic consequences of food waste but do not associate their behaviour as part of the problem.
Situational responsibility, efficacy and ability are processes of people’s behaviour that can be comparable to processes of the PBC Model which describes consumers’ abilities to act in a certain way. If the person feels unable to and does not feel the responsibility to act in a certain pro-environmental way, through for example, not planning meals or not buying the right amount of food, the personal norm will not be activated.
In NAM personal norms might be seen as personal values in terms of wasting food. An important part of personal norms are social norms, which might be seen as perceptions of what other people expect in any given situation. A person who applies social norms will not act against social expectations in situations where other people are present (Klöckner A. Christian, 2015). This is

25
especially important if the person is living in a pro-environmental society where food waste is seen as unwanted behaviour. One of the most common driving forces of personal norms is the feeling of guilt which causes individuals to behave in a way that is in line with personal norms (Onwezen et al., 2013). Often people who throw away food feel guilty about wasting resources especially when there is proof that they waste their own money. The reasons for feeling guilty might vary and depend on what is seen as good or bad. Personal norms are correlation of processes which normally lead to environmentally appropriate behaviour or environmentally inexpedient behaviour.
The NAM can be applied to food waste behaviour especially because household food waste is seen as a relevant environmental problem. An altruistic approach towards this model assumes that people have a general value orientation towards the welfare of others, that is, that they are motivated to prevent harm to others (Bamberg & Schmidt, 2003).
Figure 2.12 A schematic overview of the Norm Activation Model, Source: (Harland, 2007).
Behaviour changing strategies 2.3.2The stages of behaviour changes, which can be adapted to the consumer behaviour as
described by Prochaska and DiClemente (Figure 2.13) are that behaviour change starts in the stage of “contemplation” where consumers start to think about changing, and end with “action” where they implement the ideas and some gained experience to avoid and minimise food waste in the household. Evidently behaviour changes do not happen overnight, but is a complex process that passes through different stages. According to the model presented by Prochaska and DiClemente, to change behaviour consumers should pass through the stages below:
Pre-contemplation - it is a logical starting point of the model where there is no intention to change and food waste is not seen by a consumer as a problem. Often a household might be unaware of the food waste problem. The important part of becoming involved in this phase of consumer behaviour is to help develop reasons for change and encourage the consumers’ self-exploration where they will start to collect information about their abilities, skills and simple basic information about food waste problem (Horwath, 1999).
Contemplation is a very significant stage of consumer behaviour change where the household member becomes aware that there is a food waste problem and begin to think about changing. Nonetheless, it is unlikely that people will reduce their food waste unless they are forced too.

26
Intervention, which is designed to reduce household food waste is unlikely to be effective unless they target the key psychological mechanisms that underpin motivations and barriers to food waste reduction in households (Graham-Rowe et al., 2014). The fact is, that consumers will not start to think about changing behaviour if the food waste problem does not exist for them. The biggest challenge in the contemplation phase with regards to food waste problem is to present decreased food waste as having advantages as well as promoting environment friendly behaviours.
Preparation – in this phase the person intends to take action to correct the food waste problem in their household. Prioritizing behaviour change opportunities is essential for the consumer to be convinced that the change in the household is positive and by increasing their efficiency makes them believe that as an individual they can make a difference. It is desirable to make a consumer analyse their habits and daily routines related to food waste in the household. It is important to encourage small initial steps. Everyone has the ability to choose to eat something because the expiration date is sooner, make adequate plans for meals or buy the exact amount of food needed, or make the right decision about what to do with potential leftovers. Even if behavioural routines are relatively hard to modify, they can be changed (Maio et al., 2007). Individuals are responsible for reducing household waste and small efforts can make a difference in terms of the amount of food wasted.
Action is an essential stage in changing consumer behaviour where the consumer actively modifies their bad food behaviour. Consumers in this phase believe that they have the ability to change their behaviour (Horwath, 1999), and waste less food, and at the same time they will try to actively reduce food waste in their household by taking action through various techniques. Food waste techniques used to combat food waste vary depending on the household constituents, individual people’s capacities and the analysis of why food was thrown away in previous occasions. Some might start to plan meals, therefore reducing the amount of leftovers which would normally end up in the rubbish bin, others may start to use shopping lists and others might focus on reading date labelling on food more closely and try to buy food with the largest expiration date. People in this stage also tend to be open to receiving help and are also likely to seek support from others (Scott & M.D., 2016). It is important to approve and reinforce positive action so as to avoid consumer regression into bad habits.
Maintenance - this is a stage where the sustained change to reduce food waste occurs and new behaviours replaces the unwanted old ones (Horwath, 1999). The maintenance stage involves being able to successfully avoid any temptations to return to the bad habits which may cause food waste. It is essential to emphasize to customers that they should be patient because it often takes a while to let go of old behaviour patterns and practice new ones until they are second nature (Horwath, 1999) Even though they may have thoughts of returning to their old bad habits (for example because sometimes it might be easier to throw away the leftovers and prepare the new meal for the family the following day) it is important to resist the temptation and focus on the goals.
Relapse - can happens in every phase or any behaviour change, and it occurs when a consumer falls back into old patterns of behaviour, for example when tempted by retailer promotion like BOGOF or when go shopping on an empty stomach without any list, ending up with full shopping bags of unneeded items. If consumer falls into relapse it is essential to define the cause of the relapse and reassess again the motives why the consumer started to combat food waste in the first place. New strategies and stronger deployment of new behaviours might be effective measures to stay on track.
Upward spiral is the element in changing consumer behaviour which present that person going each time through this behavioural changing model, learn something from each relapse and hopefully change behaviour and grow stronger while minimising food waste behaviour. A normal

27
part of making changes in behaviour is to fall back to old habits. Even in the course of one day a consumer might go through several different stages of change (Horwath, 1999).
Figure 2.13 The Model of The Cycle of Change. Adapted from (Horwath, 1999).
Changing consumer behaviour is extremely challenging because of the many social and psychological factors like norms values, habits or attitudes. To change consumer behaviour it is essential to not only understand, identify and analyse the positive attitudes and beliefs but also the negative ones that consumers have, as well as understanding people’s values based on relationships with food when planning communication and educational initiatives related to food waste (Parizeau et al., 2015). A consumer possesses specific belief and attitude towards various things. There is the need to make it realistic for people to change by removing barriers which can lead to sustainable behaviour. Governments, manufacturers and retailers need to target groups rather than individuals because people learn, act and have the opportunity to change as a part of their social groups (Power, 2010). Through targeting workplaces, schools and universities there should be a change of what is socially acceptable because in these groups people can more easily adopt new non wasting food behaviours. According to the models presented above, people often act according to social norms, and when acting as a part of the group, people are reassured that action in favour of minimising food waste will make a difference.
To change consumer behaviour there is also the need to target more effectively because different people respond to different messages. One will adapt through policy instruments and strategies by being influenced by food waste campaigns, another through government actions which can influence consumers through promoting social norms, legislations, leaderships and by supporting industry initiatives, another through civil societies which can influence consumers behaviour through practical projects, useful food waste information and increasing public acceptance of policies (Power, 2010). Civil society has an important role to play in promoting new social norms that facilitate behaviour and culture change through campaigning work (Power, 2010).

28
2.4 European policies and initiatives to combat food waste
European Policies and strategies to combat food waste 2.4.1 The European Union Policies and Framework Programmes 2.4.1.1
There is increasing interest among policy makers in minimising food waste. The environmental, social and economic consequences of food waste led the European Union and its members to launch policies and strategies which can help combat food waste in the household.
The food waste issue has become a part of many EU Framework Programmes and strategies like Horizon 2020, Sustainable Development Goals (SDG) or Circular Economy Strategy.
Circular Economy is a strategy with measures covering the whole cycle: f rom production to consumption and waste management. Circular Economy includes Circular Economy Package containing revised legislative proposals on waste. Towards a Circular Economy the European Union proposes that Member States develop national food-waste prevention strategies and attempt to ensure that food waste in the manufacturing, retail/distribution, food service/hospitality sectors and households is reduced by at least 30 % by 2025 (Alexander et al., 2013). The waste proposals set clear targets for waste reduction and establish an ambitious and credible long-term path for waste management and recycling. To ensure effective implementation, the waste reduction targets in the new proposal are accompanied by specific measures to address obstacles on the ground and the different situations across EU Member States (European Commission, 2016d).
One of the Legislative proposals on waste is the Directive on Waste (EU 2008/98/EC) where the main element with regards to food waste is to promote its prevention in the first place. The measure taken by the EU should aim to prevent food waste in primary production, in processing and manufacturing, in retail, in restaurants and food services as well as in households. The Directive underlines the economic and environmental benefits of preventing food waste and appeals to the Member States to establish food waste prevention measures as well as uniform methodologies to facilitate the exchange of good practises across the EU as well as between Member States and food businesses (European Commission, 2015c).
The Directive on Waste was created to meet the Sustainable Development Goals (SDG) detailed in chapter 12.3 of SDG, adopted in September 2015, which includes a target to halve per capita food waste on the retail and consumer level by 2030, and reduce food loss across food production and supply chains (European Commission, 2016b).
As the food waste is very challenging problem and requires global, regional and local actions EU also created few measures improving actions to reduce the food waste issue.
1. Establishing a Food Loss and Food Waste Platform
The European Union has created a Platform for Food Loss and Food Waste which is constantly being added to, involving both Member States and those involved in the food chain in order to help define measures needed to achieve food waste SDG (European Commission, 2016b). The platform is built on the work of a group of experts established by the European Commission in order to provide advice on EU-wide actions to prevent and reduce food waste and facilitate sharing (European Commission, 2016c). The role of the platform is to prioritise actions which are going to be taken on the EU level in order to prevent food loss and food waste and support all involved in identifying and implementing appropriate actions to take on national, regional and local levels (European Commission, 2016c). Moreover, the platform helps to share information, learn, and provide guidance about best practises related to food waste prevention. The platform as well as provides a forum for exchange on national food waste prevention programmes, also monitor food waste levels and progress made towards the SDG 12.3 target (European Commission, 2016c).
2. Establishing of a dedicated Working Group
29
The European Working Group includes experts from the Member States, to help share knowledge and best practices. The group helps the Commission and Member States to remove, wherever possible, any regulatory barriers which lead to food waste, either on the EU or national level. This new group will support both the Commission and Member States to prevent and reduce food waste. An important goal of this group is to identify and prioritise any action which can be taken on the EU level to prevent food loss and food waste and support progress in areas like:
Research (consumer, scientific, etc.)
Awareness, information and education campaigns Simplifying and promoting better use of date marking
Facilitation of food redistribution
Guidance to ensure the highest value use of wasted food ("food use hierarchy")
Technological and social innovation (European Commission, 2014a).
The Working Group held two important meetings in 2014 and 2015 where 25 (1st) and 26 (2nd) State Members were presented. The second meeting included the adoption of the Agenda and the withdraw of the proposal on Circular Economy adopted in 2014 replacing it with a more ambitious one which includes food waste provisions. Moreover, it outlines the problem of data definition and availability on the national level and includes a manual to establish a common framework for food waste quantification which was published in March 2016 by FUSIONS. Several participants like Germany, Netherlands or United Kingdom indicated that they were pursuing integrated food waste prevention and reduction programmes and would welcome the sharing of information, knowledge and best practices.
3. Consistent food waste measures
One of the measures taken by the EU is to measure food waste consistently in co-operation with Member States and stakeholders as well as to examine ways to improve the use of date marking by those involved in the food chain as well as its understanding by consumers, in particular “best before” and “use by” labelling (European Commission, 2016b). To achieve these objectives two important pieces of research were prepared by the EU: the Eurobarometer 425 and a behavioural study in Milan during EXPO 2015.
The Eurobarometer 425 was one of the papers presented by the European Union and included a survey which was carried out in the 28 Member States and was based on different social and demographic groups and tried to understand citizens points of view, attitudes and practises related to food management and consumption as well as investigated the role of date marketing found on food labelling in relation to food waste (European Commission, 2015b). This research provided an important overview of general reasons why citizens do specific actions, and specified measures that citizens consider helpful in reducing food waste. The paper also focuses on people's attention and capacity to understand food labelling on the products which is an important tool of people’s health as well as while misreading contributes to increasing the food waste problem. As a considerable percentage of household food waste can be linked to date marking due, amongst other reasons, to consumers’ misunderstanding the meaning of these dates (European Commission, 2016a). This study presented information on the attention which citizens pay to phrases “use by” and “best before” on food products and if they correctly understand the meaning of these dates. Another important aspect raised in the research was how citizens use storage guidelines found on food labelling. The findings of this study will help government and police makers with future policies in this area.
Milan BEXpo 2015 was a behavioural study on food choices and eating habits created by the European Commission at the Milan Expo 2015, which provided insight into consumer behaviour related to food sustainability (Elsen et al., 2015). The study was focused on sustainable consumer choices and eating habits as well as exploring how consumers respond to the absence of “best

30
before” dates on non-perishable foods such as: pasta, coffee, UHT orange juice and canned tomato sauce, where the main goal was to find possible ways to reduce food waste at consumption level. Like in Barometer 425, the study highlights the importance of the “best before” date in reassuring consumers about product quality and safety throughout its shelf-life, reducing the likelihood of food being thrown away before the end of the “best before” date indicated on food labels.
4. The implementation of food waste prevention programmes and projects.
The EU has also implemented food waste prevention programmes which are essential to support the sharing of information about food waste best practises. As food waste is a complex issue it requires the implementation of several important tools to guarantee success.
FUSIONS
A significant part of the EU's contribution to combat food waste was to acknowledge FUSIONS ́(Food Use for Social Innovation by Optimising Waste Prevention Strategies) work. FUSIONS is a project about working towards a more resource efficient Europe by significantly reducing food waste. The project run for 4 years, from August 2012 to July 2016 and was funded by the European Commission Framework Programme 7. An essential part of the FUSIONS programme is that FUSIONS has 21 project partners from 13 countries (the most known being FAO Italy and WRAP UK) which bring together universities, institutes, consumer organisations and businesses (FUSIONS, 2016a). FUSIONS established a European FUSIONS Multi-stakeholder Platform with an appropriate tiered platform management structure, that has enabled it to last beyond the project timeframe. The FUSIONS platform is clear and consists of many detailed information about the project and its objectives as well as the progress of the program.
In July 2014 the project released recommendations on common standards, which EU countries could use to more accurately measure the amount, sources, and impacts of food waste. This is vital in helping halve the disposal of still-edible food by 2020, especially considering that the EU needs to provide solutions and in many European countries there is no accurate data on food waste, where in others the data is incomplete or cannot be easily compared. Furthermore, in March 2016 FUSIONS released “Food waste quantification manual to monitor food waste amounts and progression” that provides practical guidelines for Member States on the quantification of food waste at different stages of the supply chain. The manual provides activities like quantifying food waste in each stage of the food chain, combining sector quantifications using a common framework on the national level and reporting the results of national food waste (Tostivint et al., 2016).
As consumers are the most responsible for food waste, FUSIONS is also carrying out pilots on “social innovation” – new collaborations and on-the-ground initiatives that are both social in their ends and in their means to change people’s habits, and practices, for the better (European Commission, 2015a).
One of FUSION´s achievements has been to establish a network of researchers, businesses, policymakers and consumer groups to seek ways to understand the issues relating to food waste, such as policies, laws, food labelling, packaging, portion sizes and consumer behaviour. The network currently has over 180 members and includes Europe top retailers and food businesses. Their feedback is very important as it will help FUSIONS’ partners develop recommendations on EU-wide measures and practices that can help countries reduce food waste (European Commission, 2015a).
The Zero Waste Programme for Europe
Zero Waste has a goal, to guide people to emulate sustainable natural cycles, where all discarded materials are resources for others to use. Zero Waste design and manage products and processes to reduce the volume and toxicity of waste and materials, conserve and recover all resources, and not burn or bury them. Implementing Zero Waste will eliminate all discharges to land,

31
water, or air that may be a threat to planetary, human, animal or plant health (Zero Waste Europe, 2016). The Zero Waste Europe concentrates on waste prevention as well as on separate collections to maintain materials’ utility, source separation of reusable products and components, various recyclable materials, food & garden waste, and residual waste. Zero Waste municipalities in Europe are show that separate collection can achieve recycling rates of 80 to 90%. This leaves residual municipal waste at less than 100 kg per person.
REFRESH
REFRESH (Resource Efficient Food and dRink for the Entire Supply cHain) is a project where 26 partners from 12 European countries and China will work towards the project's goal to reduce food waste across Europe by 30% by 2025, including reducing waste management costs, and maximizing the value of unavoidable food waste and packaging materials (FUSIONS, 2016b). Refresh is a programme funded by EU Horizon 2020, which is the biggest EU Research and Innovation programme ever, with nearly €80 billion of funding available (European Commission, 2016f), and will run from July 2015 to June 2019. The main focus of the programme is to reduce avoidable waste and increased value of food resources, e.g. from food processing, and ICT-based platforms and tools, to support new and existing solutions to reduce food waste. By understanding all food waste processes the project will support better decision-making made by individual consumers and industry. Innovative approaches of the programme will develop strategic agreements to reduce food waste with governments, business and local stakeholders. The programme will be tested in four pilot countries including Spain, Netherlands, Germany and Hungary and after testing new approaches to reduce food waste it will hopefully be possible to implement them in other European countries. The programme will be responsible for formulating new EU policy recommendations and support national implementation of food waste policy framework.
Like FUSIONS, Refresh has an online platform with more detailed information about the Programme. The platform features key information about the goals of the program, events, and news (the Refresh Newsletter). On the platform the progress of the program can be easily followed and with methodologies and frameworks being published online.
Considering the importance of food waste management for effective municipal service provision, the reduction of waste treatment and landfill costs, social equity and environmental damage caused by increasing amount of food waste, there are already many measures created by governments to decrease the amount which is thrown away. Unfortunately, considering the scale of the problem, much more could be done (Parizeau et al., 2015). It is definitely true that senior levels must get involved in food waste policy on household levels through observations and surveys which could present more detailed data about the relationships between attitudes, behaviours, beliefs and the food waste problem (Parizeau et al., 2015).
Organization initiatives and citizen movements to minimise the food waste 2.4.2There is a lot of evidence that public awareness of food waste is rising. Thankfully, many
institutions are taking action to tackle the food waste problem. Funding and donor communities are tackling food loss and waste and initiatives cover a wide range of sectors – private businesses, universities, and non-profit organizations – illustrating the extent to which collaboration is the key to change.

32
Table 2.5 Leading Food Waste and Loss organization’s initiatives. Source: (Lipinski et al., 2013).
Organization
Initiative
Geography Description
SAVE FOOD Global SAVE FOOD is a global initiative based on food loss and waste
reduction and is led by FAO and Messe Düsseldorf. Since 2011, it has worked with donors, development agencies, financial institutions and the private sector (particularly the food packaging
industry) to develop and implement a program to reduce food loss and waste. The program rests on four pillars: 1) raise awareness; 2) collaboration with like- initiatives; 3) policy, strategy, and program development; 4) support those involved in the food supply chain
and organizations involved in food loss and waste reduction.
Think.Eat.Save Campaign
Global Think.Eat.Save is a campaign created by SAVE FOOD initiative led by UNEP, FAO, and Messes Düsseldorf. The campaign seeks to galvanize widespread global, regional, and national actions to reduce food waste, and specifically targets food wasted by
consumers, retailers, and the hospitality industry. The Think.Eat.Save website is a portal showcasing inspiring ideas and solutions, shares different methods of conserving food, including
policy recommendations and steps that consumers and households can take on their own to prevent waste.
Global FoodBanking Network
Global The Global FoodBanking Network (GFN) is a global non-profit organization committed to creating, supplying, and strengthening food banks and food bank networks throughout the world (outside
the United States). The GFN supports food banks and national food bank networks in more than 25 countries that are home to more than one-third of the world’s undernourished people. Food banks acquire donated food, much of which would otherwise be wasted,
and make it available to those in need through a network of community agencies that provide food to the hungry.
OECD Food Chain Analysis Network
Global The OECD Food Chain Analysis Network provides a broad platform for dialogue building on analytical work and policy experiences on emerging issues of relevance to the food chain. It consists of government officials, international organizations, industry
stakeholders, consumers, academic experts, and non-governmental organizations.
WRAP UK National UK Established as a non-profit company in 2000, WRAP is backed by United Kingdom government funding via Defra (Department for the Environment, Food and Rural Affairs), the Scottish Government, the
Welsh Government, and the Northern Ireland Executive. WRAP UK helps people recycle more and waste less, both at home and at work, which are practices that offer economic as well as
environmental benefits.
Love Food, Hate Waste
National UK A Campaign launched by WRAP in 2007, with the aim of reducing food waste in the UK. This program teaches consumers about food
waste and provides them with helpful portion and planning tips, as well as an array of recipes to make sure food does not go to waste. The campaign claims to have already helped almost two million households reduce their food waste amounting to savings of almost
£300 mill ion, preventing 137,000 tonnes of waste going to waste.

33
Table 2.6 Citizen campaigns.
Successful
European Citizen Campaigns and
Initiatives
Geography Description
Save Food from the Fridge
The Netherlands
Jihyun Ryou, a Korean designer and expert on food preservation, launched this project which attempts to prevent waste in homes by
bringing knowledge about food preservation into everyday life. The campaigner outlines several ideas for keeping foods fresher for longer without the use of modern kitchen technologies. Moreover, the existing blog on the website allows anyone to submit their own
innovative food storage ideas.
Stop SpildAf Mad (Stop Wasting Food)
Denmark The initiative was started by Selina Juul in 2008 and is currently Denmark’s largest movement of private consumers in reducing food waste. This is done through campaigns, stories in the media, debates and events – all with the mission of informing and preventing food
waste by providing the Danish population with concrete tools to make better use of their shopping (Nielsen, 2012). Furthermore, the campaigner has inspired Danish supermarket Rema 1000 to replace
buy-one-get-one-free and other quantity-based discounts with general discounts in all of its stores. Such discounts, frequentl y implemented by grocery stores to get produce off the shelves, often result in food being wasted at home.
Culinary Misfits Germany Started by two friends, Culinary Misfits seeks out the “ugly”
vegetables at grocery stores, farmers markets, and restaurants and turns them into delectable dishes at the events they cater in the city.
Slow Food Italy, worldwide Slow Food is a grassroots organization founded by Carlo Petrini in Italy in 1986 and has spread worldwide. Since it was founded, Slow Food has defended small-scale traditional food producers and raised
awareness among consumers at the grassroots level. Its aim is to create a more responsible food system, based on the pleasure of sharing good, clean, fair food (Slow Food, 2016).
Feeding 5000 UK/International
Feeding the 5000 is Tristram Stuart’s initiative to organise the world to prevent "wonky" fruits, vegetables, and other food from being
wasted. Feeding the 5000 encourages farmers to participate in the “gleaning movement” – where volunteers collect unattractive produce that would otherwise be wasted.
Poland
“Nie marnuje” (I do not waste)
„Nie marnuj jedzenia. Wyrzuć do śmieci stare przyzwyczajenia” (Do not waste, throw to the rubbish your old habits) is Polish nationwide campaign organized by Polish Federation of Food Banks and it is social campaign which goal is to raise awareness of negative ecological, social and economic impacts of wasting food. The campaign
influence the attitudes and behaviours of individual consumers as well as manufacturers and food distributors through educational activities. The campaign reaches the Polish society through television and radio advertisements as well as through advertisements
in newspapers, cinemas and billboards. With information a bout how important is to avoid food waste, through media debates federation wants to reach the largest group of people. The campaign established the online platform which is entirely devoted to food waste prevention and its goal is to show the consumers the easy way to avoid wasting
food. The website provides among other things information how to plan shopping and food portions and how to correctly storage the food.
Portugal
Refood The Re-food Movement is powered by the good will of the community, and it includes action from institutions, retailers, businesses and especially local volunteers which distribute food, and is sustained by ongoing resource activation. Refood´s goal is to

34
distribute food from food institutions (shops, restaurants) which is not going to be eaten to those who are in need. The action of the Re-food Movement endures due to built-in mechanisms that ensure sustainability in three key areas: financial, environmenta l and social.
DariAcordar DariAcordar is an association which promotes solidarity with support from political,
economic and social groups (City Council, Parishioners Commissions, Private Social Solidarity Institutions) which want to cooperate to raise social solidarity. The association has given rise to the “Zero Waste” movement which makes partnerships with
institutions through solidarity associations and pass meals and food products for those who need them.
The Food waste issue has become more popular in EU Member States. Established as a non-profit company in 2000, WRAP is backed by the United Kingdom government with funding from Defra (Department for the Environment, Food and Rural Affairs), the Scottish Government, the Welsh Government, and the Northern Ireland Executive. The WRAP Programme has led to reductions of 21% in avoidable household food waste (Mclntosh et al., 2015).
Organizations, initiatives and campaigns would not achieve any success if not for the participation of many volunteers around the world. Volunteers provide practical support to humanitarian food waste projects and contribute towards strengthening local capacity. European citizens in each European country get involved in various humanitarian projects to distribute uneaten food to those who need it.
2.5 The situation in Poland and Portugal The situation in Poland 2.5.1According to Eurostat data from 2006 published in the European Commission report in
October 2010, Poland wastes around 9 million tonnes of food. Production is responsible for wasting around 6,6 million, households for more than 2 million tonnes and the other sources are responsible for 0,35 tonnes of wasted food. Existing data places Poland in 5th place on the list of EU countries which waste food right after Great Britain, Germany, France and Holland with 235 kg of annually wasted food per person. It is worth emphasizing that in western countries the scale of wasted food is bigger on the household level, while in Poland retail is responsible for the biggest waste. There is a possibility that if the research was repeated, the proportions between consumers and the food industry might change. (Bio Intelligence Service et al., 2010)
Results of the research “Culinary tastes, dietary habits and behaviour of Polish consumers” prepared by Polish CBOS (Centre of Public Opinion Research) in 2005, show that food is mostly thrown away by well-educated, young people that live in big cities. It is also highly related to the level of income and the self-assessment of the consumers’ own material conditions .
Calculations of Polish monthly household food waste is estimated to be about 25zł to 45 zlotys per person (6-11€). It might not sound like a lot, but a family of four can save from 1000zł to 2000zł a year (250-500 €) which is significant (Polskie Radio, 2015).
The report published by the Federation of Polish Food Banks in 2015 "Do not waste food 2015" shows that in Polish households nearly 2 million tonnes of food is wasted annually, mostly discarded bread, fruit, meat, vegetables and yogurts. The President of the Federation of Polish Food Banks Marek Borowski underlined that more than 2 million tonnes of food wasted by consumers each year would be able to feed 2 million people who are in need. According to the report, 60 percent of Polish consumers between 16-75 years old admitted to wasting food. The main reason to throw the food away was an invalid expiration date, however, other reasons were incorrect food storage, excessively large meals portions, bad quality of product purchased, too much shopping, and dissatisfaction of the product's taste (Banki Żywności, 2015).

35
In 2009 the Federation of Polish Food Banks launched the social campaign “Nie marnuj jedzenia! Wyrzuć do śmieci stare przyzwyczajenia” (Do not waste food! Throw into the rubbish your old habits). The Campaign was realized through especially established Platform “nie marnuje.pl” and through billboards, newspapers and internet advertisements. The social campaign was accompanied by educational activities which targeted high school students, and junior high schools and were mostly realized during World Food Day (16 October). At this time the food waste problem in Poland was relatively rarely raised in public discussion. In 2008 just 6% of society perceived the food waste as a serious social problem, whereas in 2014 it was already 15% (Banki Żywności, 2015).
Moreover, Polish Food Banks introduced the “Zasada 4P” (4P Rule) which presented 4 e asy to remember steps to minimise food waste, created especially for children who bring food from homes.
1. Pack carefully – damaged sandwiches and fruit which were badly packed in children backpacks is a really common reason to throw food away. The advice is to pack them with paper and then put them into a special box to avoid damaging food.
2. Ask for a smaller portion – in the house, canteen or restaurant there is always the option to ask for a smaller portion if the person knows that they are not able to finish the whole portion.
3. Share with others – Already opened food can be shared with friends. Many children do not have prepared meals from homes and its worth thinking about them before throwing the food into the rubbish.
4. Eat 5 meals per day – five well balanced and planned meals at regular hours help to provide proper nutrition and at the same avoid food waste, assuming that the prepared food was totally consumed.
The amount of food wasted on the retail level is considerable but the good news is that food producers and distributors waste less each year, providing surplus to the Food Banks. Hence the products go to the canteens and organizations that prepare food packages for the ones who need it.
Although there are several approaches, there is no regulation in Poland that is designed to prevent food waste. The only incentives include VAT tax repeal for retailers if they want to donate the food to charities. Regulations related to VAT tax on food which was passed to charities changed at the beginning of October 2013. The state dismissed food producers from the obligation to pay this food tax, if they wanted to pass the food to those who needed it. This allows the retailers and private shop owner to donate the surplus of the food without any tax payment. Charities estimate that the changes would allow to redistribute from 300 to 600 thousand tonnes of food per year.
However, in the beginning of 2015 the Upper House of Parliament decided to tackle the food waste problem. In the Senate a new statute was created which imposed a legal obligation on food producers to make an agreement with non-profit organization to supply surplus of food products. This applied to food discarded by stores for commercial reasons like aesthetics or food close to the expiration date. Food is going to be provided from stores with an area exceeding 250 square meters, which half of income comes from the sale of food. Furthermore, except the obligation to pass the surplus of the food to the organizations, the Senate proposal imposed a fee on food sellers for producing food waste defined as "out of date or food unsuitable for consumption food". The defined amount of money is 10 groszy (~0,03 €) per kilogram of such waste, where the shop would calculate and pay the fee by itself. The money would be passed onto a public benefit organization with which sellers had made an agreement. The fee was intended to be a financial penalty for retailers who, in spite of the proposed project of unpaid tax free for food surplus transmission produces significant amounts of food waste in their shops. Senators included in the project a penalty for those stores which did not readjust to the new statute, and stores which did not sign a contract with a public benefit organization to transfer the food. The fine the shops are going to pay will start at 5 thousand
36
zlotys (~1250 €). If the retailer did not pay the ”waste fee” it may have to pay a fine from 500 to 10 000zł (~2500 €) (Kalińska, 2016).
Organizations that receive money from the waste fee, will be able to use it for only two purposes: to develop infrastructure for receiving food and for social campaigns where no more than 20 percent of the entire amount is used. They will also need to provide the seller with a written report on the use of the money. This new statute creation might be one of the first steps to minimise the amount of food waste being waste in the supermarkets.
The situation in Portugal 2.5.2According to Eurostat data in 2006 Portugal wasted around 1,4 million tonnes of food.
Production was responsible for wasting around 632 000 tonnes, households for around 385 000 tonnes and the other sources were responsible for 374 000 tonnes of wasted food.
Deco (Portuguese Consumer Defence Association) prepared a survey where 1 725 Portuguese consumers between the ages of 25 and 74 years inquired about food waste issues between September and November 2015. According to the research more than half of the consumers admitted to throwing away food which passed the expiration date, and two thirds of the interviewees did not know the difference between “use by” and “best before”. In relation to waste, the study data showed that 14% threw food away because they cooked too much. Seven out of ten responded that they do their shopping in the supermarkets. The price was the most important factor that contributed to this statement (80%), followed by proximity, variety of products and supply of the cheap products. The survey revealed a lot about food waste specially that more than half of the participants responded that they threw away out of date food. This attitude is prudent is the case of perishable products (the term refers to “use by” such as meat or fresh fish, eggs, milk cakes with cream or fresh cheese (DECO, 2015).
One important factor is the ratio of spending on food. In Portugal, food spending decreased from 21.5% of total household expenses in 1994/95, to only 13.3% in 2010/11, accordi ng to the survey of family expenses. Such a low ratio may not be enough of an incentive for a more committed attitude in combating food waste at home.
In Portugal the year 2016 became the National Year of Combating Food Waste. The Republic Assembly considered 2016 the year of "combating food waste and promoting efficient management of food." In total there are 15 recommendations proposed by deputies to promote combating food waste, including vast majority of recommendation shave general nature, such as the development of a set of initiatives vis-a-vis national year of combating food waste or development of youth ideas to combat food waste.
Despite Portugal not being at the top of the list of countries which wastes the most food, there are several organizations that actively combat food waste as the Re-Food and the Zero Waste movement, gathering meals that would otherwise be thrown away.
From the 1st July 2015 onwards, supermarkets with more than 400 square meters are required to donate food to charity. Actions to minimise food waste have been already implemented in supermarkets like Pingo Doce, Auchan or Continente, which developed several strategies that lead to reducing the amount of food wasted. Stores prioritise minimising food waste on all levels of the food value chain through promotions of products with close expiration dates, collecting ugly products from producers and changing them into already prepared food to sell in the shop as well as donating of raw and prepared food to associations like Dariacordar or Refood. (Carvalho Martins & Jiva, 2006)
An official source from Jerónimo Martins, which owns Pingo Doce and Cash & Carry, revealed that last year Pingo Doce donated more than 14 million euros worth of food products, which were distributed to 600 institutions of the country, including Madeira. The effort to combat food waste

37
not only focuses on selling food, but also concentrates on food that is already prepared. The Pingo Doce supermarkets collect non-standard vegetables, which were previously left in the fields, changing them into processed products. For this purpose the stores have developed processes of buying this kind of food products from the retailers which are afterwards cut and sealed in packages, or are used to prepare meals which are later on sold in the supermarket in accordance with the programme ”Meal Solutions”, which resulted in more than 3,400 tons of food being incorporated over the last two years (Carvalho Martins & Jiva, 2016).
Continente has a similar strategy, transforming fruit that is too ripe into natural juices of "great quality" and reuses all food products in internal or external events. Furthermore, Continente employees can make use of food that cannot be sold for reasons of appearance or because they are daily products in a special "social zone" where they can take advantage and use for domestic purposes. In the case of products close to the expiration date, they have the opportunity to buy products with a 50% discount.
Jumbo supermarket is also concerned with the increasing food waste problem in Portugal and has also developed strategies to minimise food waste. An essential strategy is allowing consumers the possibility to buy a product by weight. This approach gives an opportunity for the consumers to buy the exact amount of food needed whilst at the same time minimising the amount of packages needed to prepare products for sale. Also, the supermarket has a “self-discount” section with simpler packaging where consumer can purchase irregular fruit and vegetables. Furthermore, products which are close to the expiration date, are marked with orange tags and have discounts (Carvalho Martins & Jiva, 2016).

38
39
3 Methodology
3.1 Case study – Comparison of Poland and Portugal The comparison of Poland and Portugal was found as a good idea specially that analysed
countries have different cultures, habits and diets. Throughout the history of Polish cuisine there have been strong regional influences and changes, especially the areas that historically were inhabited by a mosaic of different nationalities. As a result, there are strong Eastern culinary influences like Tatar-Turkish, (formerly Mongolian), Ruthenian, German, French, Italian or Jewish. Typical for Polish cuisine are carbohydrates – cereal, bread and a variety of frumentaceous dishes - noodles, dumplings, soups and sauces. Polish cuisine typically includes many products available from undergrowth like wild mushrooms, fruits, nuts and herbs. Polish meat cuisine are dishes with pork, poultry and diverse game - from rabbits or birds deer and boar – and also freshwater fish.
Portuguese cuisine is characterized by diversity. Easy access to the sea guaranteed the variety of fish (especially codfish, sardines) and shellfish, which are coastal regional dishes, whilst in the central part of the country meat and cheese dominate. Portuguese cuisine is characterized by a lot of meat dishes, in particular pork and beef dishes. Moreover, many of the products are credited to Portuguese invaders: Romans brought wheat, the vine, figs, olives and almonds, whil st the Moors brought rice, citrus and fruits.
In Portugal the most important meal of the day is dinner and is eaten between 20:00 and 22:00. Lunch and breakfast are also important but are considered secondary meals. In Poland the most important meal of the day is lunch and is eaten between 12:30-14:00. Dinner is not intrinsically considered fully meal and is normally something small, typically – a sandwich. Breakfast is an important part of the Polish food tradition and normally involves scrambled eggs or milk with cereals or bread with something.
3.2 Specification of objectives and hypothesis of the research. Through comprehensive consumer research, study gathered and analysis of the food waste
problem of two European countries (Poland and Portugal) at the household level, determining attributes such as knowledge about food waste problem, routines, habits during shopping and food preparation, as well as characteristics such as the socio-economic group, household size, gender or the type of area lived in, as an object to collect basic background data on household behaviour in relation to food waste problem, understanding the factor which influences food wasting behaviour on the household and consumer level. Furthermore, the important part of the study is to present some recommendations for more focused and co-ordinated actions made by governments and institutions, food suppliers and food producers to orientate wiser and more sustainable consumer food choices leading to eliminating the food waste problem.
The hypothesis of the study is that people’s attitudes, behaviours and habits are strongly influencing amounts and origins of food waste and that to combat food waste the first and the most important thing is to influence consumers’ habits trying to change their behaviour. The study predicts that people choices mirror/reflect desires and needs which are shaped by cultural norms and values which are results of the food waste.
3.3 Analytical instruments Literature 3.3.1Many studies have been presented to clarify food-related problems and explaining factors
concerning consumer behaviour. An increasing amount of articles related to food waste and consumer behaviour have appeared over the past few years. Articles associated with food waste, databases like Science Direct, Web of Science, and all available platforms were used with search

40
terms “food waste”, “consumer behaviours”, “policies” and others similarly related to the problem. References to relevant articles related to the topic were frequently used as well. The study’s main focus was on research which was published between 2005-2016, including a few older articles for comparison. Polish, Portuguese and English were the languages of research with English being the main language. There was a need for precise analysis of factors like policies or consumer behaviour of each country where Polish and Portuguese were languages of research. The literature review included scientific articles, reports, books chapters and websites which provided recent and thorough information about food waste policies and European strategies to combat food waste.
Consumer survey 3.3.2 The selection of variables and questionnaire design 3.3.2.1To understand the reason for food waste in households in Poland and Portugal the survey was
created and translated into Polish and Portuguese (the copies included in the attachment), with 34 questions of which 28 were closed-ended questions, 2 were open-ended (including one which was a part of another question) and 5 were closed-ended with the possibility for the consumer to add a suggestion or opinion. Questions were created based on similar surveys by adding more possible responses or by editing the type of the questions to better suit the purpose of this survey. In other cases new questions were created to better understand the cultural differences and to expand the knowledge of the problem occurring in the discussed countries.
After the finishing the collection of the answers it was noticed that one answer in question 10 was missing in Polish survey that’s why this question was delated from the analysis and just Portuguese part was analysed.
The questionnaire started with a short introduction, where the purpose of the research was explained and some concepts were defined. The survey was divided into nine parts. This division was not visible to the participants and were created while preparing the survey to help better understand and analyse the results.
In part one, the households were asked about their behaviour while shopping and preparing food including routines, habits and past experience. Part two includes behaviours and opinions regarding food waste, where the types of food, amounts and the main reasons for throwing food away were assessed. Attitudes regarding food waste as well as social and personal norms were analysed in part three. This part is important to understand if subjective norms affect people behaviour. Moreover the degree of importance was checked to analyse the level of culpability of consumers regarding food waste. Consumer knowledge about food waste is relevant to have an idea if the problem might be the result of a lack of proper school education and government policies which could guide people to make the right decision beginning with getting the right product in the right amount until adequate disposal (if needed). Part four included subjective norms, which in this case meant showing if the approval and disapproval of people who are important to participants matters in their behaviour towards food waste. The level of importance included in the following part was created to give information about what importance households attribute to food waste and how they feel in relation to food waste in their households. Perceived behavioural control had the goal of testing if people have difficulty to prevent food waste in their households. The intention to not waste food as well as knowledge about food waste was assessed in part seventh and eighth. The last part of the survey was focused on the socio-demographic and background characteristics of the consumers to verify if income, gender, age or area where the household is located can influence the behaviour and amount of food waste.

41
Figure 3.1 Structure of the questionnaire.
Participants and administration procedures for survey submission 3.3.2.2The survey data was collected in July-August 2016 through a web-based survey Google form.
The questionnaire was developed in English and translated into Polish and Portuguese so it could be accessible to all Portuguese and Polish consumers. To achieve the objective of the survey anonymous questionnaires were distributed to participants (households) of each country (Portugal and Poland) with 476 consumers completing the survey (232 Polish consumers and 244 Portuguese). For the distribution of the questionnaire the snowball sampling technique was used. This technique is conducted in stages and has the goal of identifying people that have the necessary characteristics needed in order to participate in the survey and then those people are asked to forward the survey to other people they know (Hennink & Bailey, 2011).
This technique has the advantage of making it possible to reach people that othe rwise might be difficult to sample. Based on this technique the questionnaire was distributed to Polish and Portuguese consumers through e-mail and online platforms – mainly Facebook. First the link was sent to several possible candidates that pertained to the population of the study and these were asked to forward the link to other people in their list of friends or acquaintances. The questionnaire was also posted on online groups. In two cases the questionnaire was carried out face-to-face and then introduced to online platform.
The survey targeted Polish and Portuguese consumers with minimum age of 16 who are responsible to some extent for cooking and shopping in their households.
Analysis of the results 3.3.2.3The data collected though the Google forms survey was analysed using Excel. From the results
received from each survey crosstabs and chart bars were formed and desirable correlations were analysed. The crosstabs were normally comparing the differences between the countries and some were compared to socio-demographic characteristics of each country. The models which were mostly use to help design the survey which could help to gather all necessary information from the participants about the situation in regard to food waste in their household. The models as well were big help with analyse of the results of the consumers food waste behaviour. To describe and explain the consumer behaviour the Theory of Planned Behaviour was used analysing subjective norms, perceived behavioural control as well as intention not to waste. The Theory of Interpersonal Behaviour tackled the importance of the habits and its everyday food waste decisions as well as attitudes toward food waste. The Norm Activation Model described in the theoretical part of the
Q 1-7 •Behaviour during shopping and food preparation (routines, habits, past experience)
Q 8-13
•Behaviour and opinion about food waste (routines, habits, past experience)
Q 14 •Attitudes about food waste / personal and social standards
Q 15 •Subjective norms
Q 16-18
•Level of importance / allocation of consequences
Q 19 •Perceived behavioural control
Q 20 •Intention not to waste
Q 21-25
•Knowledge and opinions about food waste
Q 26 - 34
•Socio-demographic characteristics

42
thesis was a help to understand some aspect connected with the situational responsibility of the food waste in consumers’ households.
3.4 Strengths and Limitations This is first two-nation survey including two high-income countries of European Union focused
on food waste problem on the households level. The survey has very important observations based on the results of 34 questions analysing the behaviour of 476 participants of Poland and Portugal. During this study an effort was made to collect earnest and reliable responses of all participant. Moreover as food waste being a recent problem in growing world population the analysis of the results might present some overview of the existing problem among European consumers.
One of the limitation of this study is based in the relatively small survey . 244 participants from Portugal and 232 participants from Poland is substantial enough to carry out key the basic analysis but not sufficient in terms of socio-demographical diversity of both countries. Due to the sampling method the survey did not involve enough participants from the group of people above 65 year old which could be meaningful especially as people above this age are considered to waste less food. (Ward, 2007). Moreover, the survey was significantly predominate by females so there might be a lack of information about male’s attitudes and behaviour towards food waste. Furthermore, despite the fact that the survey used anonymous administration people are conscious that their behaviour, knowledge and attitudes during this survey are controlled and their responses might not be as honest as expected, thereupon the results might not provide 100% reliable information.
In connection with data available for amounts of wasted in each country the latest research was prepared by Eurostat in 2006. It is important to mention that in many European countries there is no accurate data on food waste, and in others the data is incomplete or cannot be easily compared.

43
4 Results and discussion
4.1 Consumer survey A total of 476 households participated in the study, with 244 being Portuguese consumers and
232 Polish. The participants represented one households and were asked to not give the survey to other members of the same household. People targeted to fulfil the survey were Polish and Portuguese consumers with a minimum age of 16 who are responsible to some extent for cooking and shopping in their household (one person who respond for her household was 11 years old, and was not deleted from the survey mainly because they indicated other people responsible for household shopping and meal preparation as well most of the data being already analysed before noticing about the age).
After the pilot test which was made for groups of each country (5 participants in Poland and 6 in Portugal) small changes into the survey were made. Most of the changes were made in wording, as well as two changes in the socio-demographic part, where one was not understandable for some of the Polish participants and another was not adequate when comparing with the Portuguese equivalent which might have caused the results to give subsequent analysis discrepancies. The results of the test survey showed that the participants of both countries have a negative attitude towards food waste and are conscious of the problem of food waste in their households.
4.2 Socio-demographic characteristics In both samples, the survey was predominated by females with 73,7% in Poland and 61,9% in
Portugal. In both cases plurality of the participants with higher education was 69,1% in Polish and 87,7% in Portuguese samples. A good part of people in Poland have a high school education (18,5%) and in Portugal 10,2%. The age ranges between 16 and 72 years old with an average of participants equal to 29 in Poland and 37 in Portugal. 15,5% of households in Poland have a child aged less than 16 years old where in Portugal the number raises to 24,2%.
The average size of the households in samples is 3,3 persons in Poland and 2,9 persons in Portugal, where in Poland the majority were two people household (32,2%) and in Portugal the majority was 3 people (31,1%). The maximum number of people with an age less than 16 per household was 4 in Polish and 3 in Portuguese samples, with most of the households in both counties having one child. In this study children were considered as being younger than 16 years old.
The average income of the households in the samples pertained to the interval between 601 Euros a 1700 Euros in Poland and likewise in Portugal but there was higher percentage of people’s income that was between 3 501 euros a 7 200 Euros (44,3%). In Poland the currency is zloty (1 euro ~ 4,31 zloty (of day 02.09.2016) was created adequately to the living standards in both countries as well considering the minimum salary in both countries.
The majority of Portugal participants’ area of living is the big city (45,1%) as well as in Poland (37,5%) with a significant part of people living in the small city or village (26,7%). Most of the respondents live in the apartments in the building with 57,3% in Poland and 74,6% in Portugal. Considerable number in Polish sample live in house with a yard (38,8% ) due to a substantial number of people living in small city or village.
Most of the participants in both countries were full time workers (>30 h per week) with 56% in Poland and 73,4% in Portugal. In Poland a significant part of interviewees’ occupation was considered “another situation” (8,6%) where after analysing the responses could be considered a full time job on the basis that a lot of people have indicated their occupation as a farmers or owners of their own company. Moreover, a big part of the participants in both countries are full time students with 21,1% in Poland and 14,3% in Portugal.
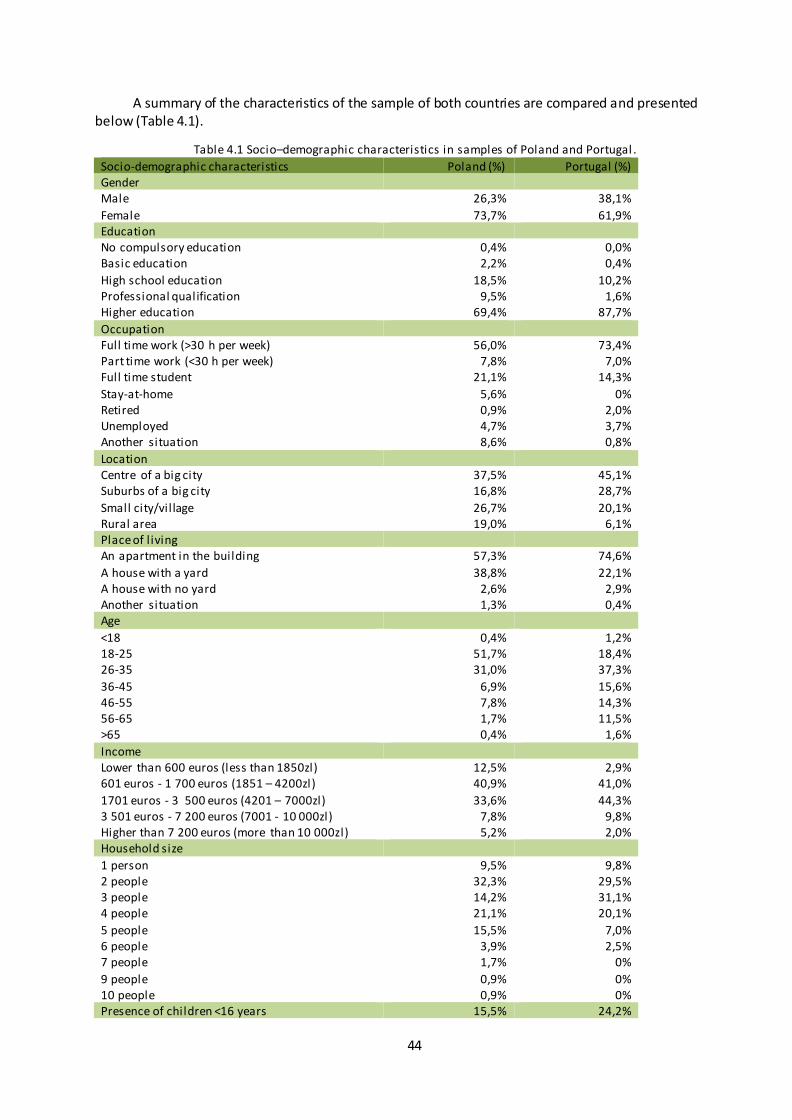
44
A summary of the characteristics of the sample of both countries are compared and presented below (Table 4.1).
Table 4.1 Socio–demographic characteristics in samples of Poland and Portugal .
Socio-demographic characteristics Poland (%) Portugal (%) Gender Male 26,3% 38,1%
Female 73,7% 61,9% Education No compulsory education 0,4% 0,0% Basic education 2,2% 0,4%
High school education 18,5% 10,2% Professional qualification 9,5% 1,6% Higher education 69,4% 87,7%
Occupation Full time work (>30 h per week) 56,0% 73,4% Part time work (<30 h per week) 7,8% 7,0% Full time student 21,1% 14,3%
Stay-at-home 5,6% 0% Retired 0,9% 2,0% Unemployed 4,7% 3,7% Another situation 8,6% 0,8%
Location Centre of a big city 37,5% 45,1% Suburbs of a big city 16,8% 28,7%
Small city/vil lage 26,7% 20,1% Rural area 19,0% 6,1% Place of l iving An apartment in the building 57,3% 74,6%
A house with a yard 38,8% 22,1% A house with no yard 2,6% 2,9% Another situation 1,3% 0,4% Age
<18 0,4% 1,2% 18-25 51,7% 18,4% 26-35 31,0% 37,3%
36-45 6,9% 15,6% 46-55 7,8% 14,3% 56-65 1,7% 11,5% >65 0,4% 1,6%
Income Lower than 600 euros (less than 1850zl) 12,5% 2,9% 601 euros - 1 700 euros (1851 – 4200zl) 40,9% 41,0%
1701 euros - 3 500 euros (4201 – 7000zl) 33,6% 44,3% 3 501 euros - 7 200 euros (7001 - 10 000zl) 7,8% 9,8% Higher than 7 200 euros (more than 10 000zl) 5,2% 2,0% Household size
1 person 9,5% 9,8% 2 people 32,3% 29,5% 3 people 14,2% 31,1% 4 people 21,1% 20,1%
5 people 15,5% 7,0% 6 people 3,9% 2,5% 7 people 1,7% 0%
9 people 0,9% 0% 10 people 0,9% 0% Presence of children <16 years 15,5% 24,2%

45
4.3 Analysis of the results The present study examined two developed countries Poland and Portugal and its household
food-related routines, skills, attitudes, opinions and knowledge with correlation with socio-demographic characteristics. Moreover, one of the survey’s goal was to collect information from all age groups (students, middle age, post war etc.) in each country and from different family models .
Routines, habits and past experience 4.3.1According to the results, in both countries’ samples the person the most responsible for doing
shopping was a female. The multiple choice questions allowed to gather information if the person most responsible for shopping was female, male or multiple people or divided equally. In Portugal from 43% of the answers, women were indicated as the one normally responsible for doing shopping while 86,5% of all answers, women were normally in some part involved in shopping The same pattern is observed in Polish households where 37,9% of women were normally responsible for shopping and 87,9% were at least partly involved.
Analysing the results of the person most responsible for preparing the meal in the household a very similar pattern can be noticed. In Poland 55,6% of women taking part in the survey are normally responsible for cooking while 87,1% is fully or at least somehow involved in cooking in the household. In Portugal 56,6% of woman are normally responsible for cooking and 85,7% are fully or are normally present in household meal preparation. Moreover in Portugal in both cases (cooking and shopping), men have a bigger participation as individual than in Poland.
The results of the survey show that Polish consumers taking part in the survey always (50,9%) or very often (15,5%) prepare breakfast. The findings show that breakfast is considered to be very important by Portuguese participants, with 78,7% indicating it as meal which is always prepared. A small meal in mid-morning by both nations is prepared rarely, Poland (38,8%) and Portugal (42,2%) or never in Portugal (27,5%) and with 15,9% in Poland. As in Poland lunch is the main meal of the day is always prepared by 50% of Polish participants or at least very often (21.6%) where in Portugal it is always prepared by just 26,6%. Measurably snacks seems to be prepared more times in Poland than in Portugal and it seems like there is not a strong influence of this meal in both cultures. As surmised dinner is the most important meal of the Portuguese consumers, and the results confirmed that in Portugal 59,8% always prepare dinner or at least very often (33,2%) while in Poland dinner is always prepared by 39,2% or very often by 28,4%.
Figure 4.1 Frequency of meal preparation in Poland and Portugal
An important part of the culture of both countries is also connected with the frequency of shopping. According to results presented in Figure 4.2, 56,9% of Polish consumers taking part in the survey, responded that they shop several times per week, with 28% of people who shop almost every day. Just one person indicated shopping once per month. A bit of a different pattern can be

46
observed by Portuguese consumers where the majority (48,4%) shop once per week or several times per week (35,7%). Conclusion of bellow’s diagrams is that Portuguese consumers usually do shopping with less frequency than Polish costumers. From the results it can be seen that it is more common by Polish consumers to do a meal plan before going shopping (7,5% assumed that they always or very often (13,8%) prepare the meal plan, while Portuguese always by 4,5% and 12,7% very often). This means that they do not make this plan for a whole week but for a single meal. On the contrary, more Portuguese stated that they always (30,7%) or at least very often (33,2%) do a shopping list of necessary food products before going shopping while 24,1% of Polish consumers do it always or very often (31,9%).
Figure 4.2 Frequency of shopping in Poland and Portugal
The confirmation of the above diagram results might also be answers given by interviewees about the frequency of using car while shopping. 34,4% of Portuguese responded that they always use car to be able to transport more products while the Polish result was just 19,8% and 22% Polish responded that they never use the car to do shopping.
Moreover, participants were asked where they normally do shopping. The majority of the Polish participants (39,%) indicated that it depends on the food type “food with short shelf life in the shops close to their house and food with longer shelf life in bigger shops” where in Portugal just 29,5%. The Portuguese majority responded that they normally shop in medium size market with 38,1% and in Poland it was 37,9%. According to the diagram more Polish participants (11,6%) normally go to local minimarkets but in Portugal just 6,1%.
Figure 4.3 Frequency of shopping place in Poland and Portugal .

47
Consumer food waste knowledge and opinions 4.3.2Consumers knowledge about food waste problems is essential information for the
government to establish adequate policies and design pertinent campaigns to combat food waste. Results show that both populations indicated consumers as the group most responsible for food waste, followed by hypermarkets and restaurants, and at the same time indicating farmers as the group the least responsible for food waste followed by industrial enterprises. A remark was found that consumers taking part in the survey do not see the government as a group responsible for increasing the food waste problem.
As food waste is an environmental, social and economic problem, participants were asked about their opinion about the relationship between food waste and problems like: energy waste, water consumption, consumption of natural resources, malnutrition and hunger in the world, amount of waste and environmental pollution. Most of the participants considered problems related with food waste and with less percentage as totally related. 50,4% of Portuguese participants considered consumption of natural resources as totally related to food waste where the majority of Polish (48,3%) considered the amount of waste as totally related. From all of the presented problems, malnutrition and hunger in the world is seen by both population as the least related to food waste. Moreover, there is very little people whose opinion of all the mentioned problems are unrelated to the food waste with superiority of Polish consumers. Unfortunately a considerable amount of people see these problems as indifferent in regards to food waste. A significant part of Polish participants (12,1%) considered consumption of natural resources as indifferent to them with Portuguese (10,2%) considering the waste of energy as indifferent. The “indifferent” option give a view of attitudes of both nations towards current world problems which are highly related with food waste. This negative attitude can be explained due to a lack of knowledge about the consequences of food waste to the environment.
The results showed that 66,8% of Portuguese and 69,8% of Polish participants do not know the destination of food waste in their area. 33,2% of Portuguese were able to indicate that food waste goes to landfill, incineration, or composting where in Poland 30,2%.
Information obtained during the study, showed that 88.8% of Polish interviewees do not have any knowledge about institutions which deal with food waste issues, and 62,7% of the Portuguese do not know of any institution. Most of the people who had knowledge about institutions, indicated food banks (Poland) and Refood institution as well as “fruta feia” (ugly fruit) and Lipor indicate by Portuguese.
79,7% of Polish interviewees did not find or look for information in regards to food waste, with the Portuguese number being 73,4%. For the question if participants have heard or read recently anything about food waste 42.7% of Polish did not recall any information about food waste, and the rest was spread between internet and television, with significant part who did not remember hearing or reading anything about food waste. In Portugal 34,8% did not hear or read anything, and the rest 56,6% got information form the internet, the television, at work or at school with a significant part not remembering.
To obtain consumers ideas about how to minimise food waste they were provided with a list of possible ideas which could be implemented to help reduce food waste. The most popular for those in Poland was to teaching in schools how to avoid food waste (59,5%), awareness campaigns and information for consumers about food waste and how to avoid it (55,6%), and idea that all of the products should be closed hermetically or sold in packages that can be closed again(37,9%). The first two indicated by the Polish are strongly correlated with the Portuguese answers but the third most common was that chose bigger variety of the size of the product packages (smaller sizes) with 36,5%. Other very popular ideas were to also teach people how to do shopping and how to correctly preserve food (Poland) and teach people how to reuse leftovers (Portugal).

48
Consumer behaviour 4.3.3The most important part of the study was to find out which of both nationalities taking part in
the study wastes more food. The participants were asked to indicate approximate amounts of the food wasted in percentages of food thrown away in their households. The analysis of the diagrams presented show that 53,7% of Portuguese consumers waste less than 5% ,whilst in Poland the majority (40,9%) waste between 5 and 10%. When summing up the amount of food wasted between 10% and more than 40% which already is a significant sum of wasted food, Polish participants in the study were 24,6% while in Portugal with 12.7%. Polish waste threefold more food between 20-40% than Portuguese and one person even indicated that they waste more than 40% of food. These results strongly confirm that Polish interviewees waste more food than Portuguese, when considering the percentage thrown away.
Figure 4.4 Approximate food wasted in Poland and Portugal.
Moreover one of the goals was to find out about food waste behaviour towards specific commodities in people’s households. From commodities indicated in the survey participants indicated the frequency of throwing these products away. The majority in both countries never throw away fish, and the most common answer for all the commodities was to “rarely” throw the food away. The results show that Polish participants throw away meat in more frequency then Portuguese. Meat and fish are a really important part of Portuguese culture while in Poland high prices of and stiff access to fresh fish might cause people to avoid wasting these commodity. Almost none was always thrown away except leftovers which was indicated in Poland (3,9%) and in Portugal (0,4%). The conclusion of the diagram presented below suggests that Polish and Portuguese interviewees throw leftovers and bread with the most frequency away, as well as fresh fruits and vegetables.

49
Figure 4.5 The frequency of throwing away certain commodities in Poland and Portugal .
From the analysis of approximate amounts of food waste and the size of households the results show that not necessarily the bigger household the waste is bigger. To check the approximately amount of food wasted per size of household the sum between 5% and more than 40% was made. Less than 5% was not considered in the calculation as it is a very insignificant amount and might happen in many households by accidental neglect. The results show that Polish single household taking part in the survey waste 25,4% of food between 5 and 40% and in Portugal only 12,3%. Two people households in Portugal seems to have the biggest contribution in waste with 15,6% while in Poland only 9,1%. The conclusion of these results is that in Poland the biggest amount of food, is wasted is in two people household while in Portugal in three persons household. Moreover, the analysis of households with more than three people shows that in Poland four (12,5%) and five people (9,9%) households also waste significant amount of food, while more than five people household are already much more careful about wasting food. In Portuguese sample the situation seems similar except that four people household waste a significant amount (8,6%).
Quite unexpected finding was that the amount of food waste was considerably higher in households where women were mainly responsible for cooking and doing shopping. In the households where the man was mainly responsible for these activities there was no statement in any of the countries’ samples that there is more waste than 20%.
Age is a factor proved to be negatively correlated with the amount of food waste. Younger people waste the most while older people, past 65 years old, normally state that they generate very small amounts of food waste (Ward, 2007). The survey results show that in Polish sample the biggest amount of food waste (between 20% and 40%) was generated by people between 16 and 25 year old, whereas all people of ages 56-65 and over 65 indicated the amount of their household as less than 5%. Exactly the same pattern can be observed in Portugal where the highest amount of food wasted was generated by people of the age 16-25 while 80,9% of people in the group 56- 65 and over 65 wasted less the 5%. The total amount of people in Poland of this age wasting less than 5% can be explained by the very difficult post-war situation in Poland where lack of had a big impact on the behaviour of people in this group.
Although it is more common in Polish households to buy products depending on its shelf time they assumed to waste bigger quantities of food than Portuguese interviewees. Notwithstanding the biggest part who waste less than 5% in Poland buy food in accordance to its shelf life there is still a significant part who waste more than 5%. According to the comparison of people who waste the most and the places where they go, as well as how often they go, the results show that in both countries people who shop many times per week waste the biggest amount of food and they normally shop in medium size markets.

50
Several question were asked to gain insight into consumer-decision making about discarding food in their households. Consumers through the selection of three main answers (from six possible) had to decide the most common in their households. Both countries and the majority of those surveyed stated that they throw away food because it passed the expiration date and that they were afraid of getting food poisoning with 67,2% of Polish and 57,4% of Portuguese claiming this. As the second choice they stated that they forget the food in the fridge – 57,3% of Polish and 56,6% of Portuguese participants. As the third reason, but also significant they indicated throwing food away because they prepared too much (40,1% of Polish and 37,3% of Portuguese). The results show that people who throw food mostly because it got out of day or they forgot it in the fridge have a tendency to often buy too many products that had promotions.
Moreover, another goal of the study was to find out how consumers verify if the food is still suitable for consumption. In both countries more than 90% responded that they verify food based on its appearance, taste or smell with 91,4% in Polish and 90,6% in Portuguese sample. As the subsequent option of checking if the food is still good Portuguese consumers verified the date indicated on the package “use by” (62,3%) and date labelling “best before” (49,6%), while in Poland 61,6% checked the date “use by” and they think how long the product has been open for (58,6%). Since the most common option in Portugal was indicating date labelling as the most common way to check if the food is still adequate for consumption it might mean that surveyed Portuguese are more concerned about food poisoning or that they understand date labelling more than Polish consumers. The results suggest that Polish consumers taking part in the survey trust their senses as well as intuition more than the date marked on the products.
In the survey consumers were asked what they do with potential leftovers. It is really common that Portuguese consumers try to make a use of already prepared food and heat or add some more ingredients and use it as a next meal. A considerable part never (28,7%) or rarely (41%) throw the food to the rubbish bin. Freezing food to eat it later was spread between many of possible answer but it is not that its really common to do in the households of interviewees. Giving food to animals or to make composting was very uncommon activities.
Analysis of the behavioural model 4.3.4
Attitudes 4.3.4.1One of the most important parts of the study was to find out about attitudes of Polish and
Portuguese consumers towards food waste. Participants were asked to indicate their agreement or disagreement with a set of statements (Figure 4.6) and (Figure 4.7). The general results show that Portuguese people responding in the survey definitely have stronger negative attitude towards food waste than Polish respondents.
The strongest accordance of people in both countries was indicated to the statement that wasting food is something that they condemn, especially as there are so many people starving. The most worrying attitude found in both samples was people’s agreement with the statement that the quantity of food which they throw away is something which does not bother them. 19% of Polish consumers agreed where 6,5% totally agreed with this statement where in Portugal 7,8% agreed and only 2,5% totally agreed. Definitely Polish interviewees seem less bothered about throwing food to the rubbish than Portuguese. Consumers were also asked, if they feel guilty when they throw the food away. 79,3% of Polish consumers responded that they feel guilty where in Portugal 83,6%. Similarly as in the statement above Polish participants seem to be feeling less guilty than Portuguese, with 7,8% of Polish and 6,5% of Portuguese who disagreed or totally disagreed with the statements.
Additionally consumers were asked to give their level of agreement about the statement “I do not care that much about the money I waste when I throw away the food”. 80,1% totally disagreed or at least disagreed with the statement where in Portugal 87,3%. Quite alarming information was found in Polish responses that 11,2% do not worry about the money they waste where Portuguese

51
only 5,1%. Majority of people’s income who responded that they totally disagreed with the statement, is just between 601-1700 €. All people who earned more than 7200€ totally agreed with the statements.
The study wanted to find out what people think about implementation of penalties for those who waste the food. The results show that 50% of Polish interviewees disagree or totally disagree with the statement where in Portugal only 25%. Since the Polish consumers taking part in the survey seem to be bigger food wasters than Portuguese they do not see the penalties as a good idea because it could hit them personally. This statement might give the real idea of the countries’ participants real behaviour towards food waste. Only 4,7% of Polish people agree with this statement where in Portugal 10,2%. The fact is that not all the people who state it, waste less than 5%. Maybe they see the implementation of the penalties as a motivator to start minimising the amount of food waste in their household.
Moreover, analysis the participants statement they seem conscious about the environmental effects of food waste. The information which was found during the analysis, show that in both countries there is a significant sample of consumers who disagree or totally disagree with the statement that throwing food into the rubbish bin will aggravate even more the waste problem in the environment. Some of the participants also think that food waste is not a problem because there are sophisticated technologies to recycle this waste. Furthermore, 6,9% of Polish consumer did not agreed with the statement that food waste is a significant part of resource waste. This all insignificant amounts of disagreement statements towards environmental effects might not seem preoccupying while whole analysis but it also give an impulse to action to change the wrong thinking of some of the people specially in Poland.
Figure 4.6 Polish level of accordance with the statements.

52
Figure 4.7 Portuguese level of accordance with the statements.
Subjective norm 4.3.4.2Consumers were asked to indicate their level of agreement with statements in regards to
approval of their food waste behaviour. According to the TBC, subjective norms refers to what is considered approved or disapproved behaviour in some specific situation (Netemeyer et al. 1991) and is guided by social pressure to engage or not to engage in a specific behaviour. According to this, people would waste less food if this behaviour was disapproved by others that are important to them. Proceeding, the Portuguese participants seem to be more aware of the approval of their behaviour by people important to them than Polish. 36,1% of Portuguese totally agreed with the statement that “people that are important to me disapprove that I am throwing away leftovers”, while in Poland only 28,9% of participants. 15,9% of Polish people disagreed with the statement while Portuguese only 5,7% disagreed.
Social pressure is an important factor in the communities and can be seen as a good motivator to minimise food waste amounts and to prove that consumers were asked if it is important to them if people that are relevant to them approve their behaviour. Generally in both counties’ sample this statement more or less achieved anticipated results with 63,5% of Portuguese who totally agreed or at least agreed and 62,9% of Polish. In both samples can be noticed that almost one quarter of the responses was indicated as a response that people did not agree or disagree. This kind of indifferences indicted by consumers are very significant obstacle to overcome.
Perceived behavioural control 4.3.4.3As perceived behavioural control measures the perception of ease or difficulty of the
particular behaviour in regards to food waste the consumers were asked to indicate the level of difficulty represented to the set of statements related to food behaviour to them or their family.
In regards to food waste perceived behaviour measures abilities and attempts to buy and plan the exact amounts of food which will be needed and general attempts to avoid to waste food. The analysis of the figure below illustrate that generally all these actions seem to be more easy to accomplish for Portuguese participants than that for Polish except planning and predicting exactly how much food will be consumed in their household, which seems to be more easier for Polish consumers. As discussed, Polish found more difficult in terms of the statements to eliminate food waste in their household.

53
Figure 4.8 Level of difficulty to the statements in Poland and Portugal .
The lack of ability to try to minimise the food waste in households may be a reason to not be motivated enough to avoid wasting food and the lack of these abilities may leads to higher amounts of food being discarded. This might be a confirmations of Polish people higher amounts of food waste than in Portugal. Portuguese people taking part in the survey seem to be have less difficulty in implementing above statements which can be clearly explained by the lower amounts of food wasted in this country.
Intention not to waste 4.3.4.4Consumer intention not to waste was measured according to three statements. Consumers
were asked to give their feedback in regards to their food behaviour over the following few weeks and their intention in relation to behaviour like buying and cooking the exact amount needed in their household. The results show that Polish and Portuguese sample have practically the same level of agreement. The results show that none of the Portuguese consumers marked the option that they totally disagree with the statements where in Poland this answer was present. Moreover, more Polish participants stated that they disagree than Portuguese. When two of these population where asked if they agree with the statement to not throw any food away in Portugal 86,1% said that they totally agreed or at least agreed while in Poland only 75,4%. It is clear that a bigger number of Polish interviewees tried to avoid answering on the questions choosing option that they don’t agree or disagree than Portuguese.
Figure 4.9 Intention not to waste in Polish and Portuguese households.

54
Level of importance 4.3.5The participants were asked what importance they attribute to food waste in their countries.
A substantial difference was found when comparing both countries. 43% of Portuguese participants attributed a lot of importance to food waste in their country while in Poland only 10,8%. More satisfying results were found when analysing attribution to “some importance” with 58,2% Polish and 48,8% Portuguese. While summing up “lot” and “some” of the importance of both countries Portuguese participants attributed 91,8% of importance to food waste whilst Polish only 68,2%. The results indicate that Polish people taking part in the survey have very small level of importance towards food waste in their own country. 18,1% of Polish consumers attribute little importance to food waste and 3,9% answered that their attribute no importance to food waste.
Figure 4.10 Level of importance of food waste in Poland and Portugal
Moreover, the consumers were also asked how they feel in relation to food waste in their households. As in the diagrams above the Portuguese interviewees seem to be definitely much more responsible than Polish. 45,9% of Portuguese respondents answered that they feel very responsible while in Poland only 22,8%. Those in Portugal indicated themselves as a responsible state with 45,9% and Polish 40,1%. It was found that 7,8% of Polish interviewees do not feel responsible whereas in Portugal nobody considered themselves to have no responsibility. The most bothering fact here is that the majority of Polish people who do not feel responsible at all are the ones responsible for cooking and shopping in their households.
Figure 4.11 The level of feeling responsible for food waste by Polish and Portuguese consumers

55
5 Conclusions
5.1 Discussion This survey paints a portrait of Polish and Portuguese consumer attitudes, knowledge,
awareness and behaviour in regards to food waste and the result present that households talking part in the survey throw away food for many reasons, including poor planning and preparing too much food, inability to consume food on time or forgetting food in the fridge and a lack of awareness in regards to food waste specially in Poland. Overcoming the indifference indicated by a very substantial amount of consumers in the survey is the most significant obstacle. Survey showed that while consumers understand somehow the importance of reducing food waste, they do not recognize that much their own role in solving the problem.
Consumer behaviour, attitudes, routines and habits were already a topic of some paper works presenting the results of consumer attitudinal factor based on survey results. Stefan (2012), Koivupuro (2012), Neff (2015) or Stancu (2015) are papers where similarities of this present paper can be found. Based on what is already known about consumer food waste it is normal that respondents as a groups they substantially underestimate their level of waste and may also be overestimating their efforts to reduce it. It is caused by the subconscious that they are feeling checked and controlled by the survey and even that that survey was anonymous, the participants do not want to be seen as a food wasters. This survey gives an idea of food waste behaviour of both countries but unfortunately is not that effective at assessing the levels of waste. Relatively small sample as well as limited variety of socio-demographic characteristic let to analyse the results of this specific sample of participants and not in general countries as a whole.
In the study there were important commonalities between countries like similar reasons for throwing food away or resembling the frequency of throwing certain commodities away . Moreover, similarity in consumers ideas about how to minimise the quantities of food wasted were found, which gives important information that similar approaches in both countries might be needed to successfully combat the food waste problem. What is most important is that both of the nationalities indicated consumers as the group responsible for the biggest amount of food waste. This is essential information the right group to be targeted by policy makers and governments. The government already with the information that the consumers see themselves as a responsible for waste need to now develop the right tools and measures to combat the problem.
Moreover, both nationalities participants seem to have a lack of knowledge about certain aspects in regards to food waste. It is to be wondered why so few know about institutions which deal with food waste or what is the destination of food waste produced in their household. This is important aspect to be considered in the development of future policies as well as social campaigns. With this lack of knowledge consumers cannot help, because they practically do know how. Nowadays very little people look the answer by themselves. Social media pressure instead of little social interest matters should focus more on the passing useful information to the groups who as observed have little knowledge about some aspects.
Furthermore, substantial differences between both countries can be seen. The study shows that Polish consumers talking part in the survey waste significantly more food waste than Portuguese. Some differences were that Polish consumers seem to attribute small importance to food waste in their country and they also do not feel responsible in relation to food waste in their household as much as in Portugal. Moreover, the study found that Polish interviewees’ attitudes towards set of statements in regards to the food waste was more negative. A significant percentage of Polish consumers are not bothered about the food they throw away and stated that their effort to reduce food waste is insignificant in solving the problem.

56
As the results show that in the household where women are mostly responsible for cooking and doing shopping it might be considerable factor when studying the case of food waste. Since the woman are normally the one responsible for households ,consumer education and behaviour change strategies should be concentrated on the right target with appropriate policies and tools. Indeed, the study suggests to concentrate on consumers more efficient food education, and several changes which could be made to help them understand the scale of the food waste problem. It can be done not only by politicians but also by the food industry by implementing small packages, discounts for food close to expiration dates or limiting the number of promotions which encourage people to buy more food.
Although, according to the results consumers seem to be not convinced that their effort to reduce food waste is insignificant to resolve the problem, fortunately every single one can play a role in reducing food waste. Starting with agricultural producers through governmental policies finishing with wise consumer decisions. There is a lot of concern about throwing away plastic, and othe r waste perceived of as non-biodegradable but unfortunately not enough about the one which is biodegradable and is definitely considered as an serious environmental problem.
5.2 Summary This work highlighted many key points in regards to food waste. Firstly more than one solution
is required to achieve as much as much of a reduction of food waste as possible, and it depends on many factors like having the necessary mechanisms in place and is strongly dependant on the financial resources available. The study findings results submit that food related routines like planning, shopping, cooking etc. might have potential influence of amount of food being discard in the households.
For household food waste which is one of the most environmental and economical damaging, high level of national communication, effective local engagement and changes to products, packaging and labelling are all equally important. It is essential that the government of each country, and especially in Poland with the full support of the EU provide food waste programmes with proper public funding including investment from other authorities like charities, trusts and organizations making sure that adequate amounts of resources are provided to maintain programmes.
The results showed that in the sample Portuguese participants are more concerned about the wood waste problem in their households and they pay more attention to minimise the problems. This is an open question why Polish participants talking part in the survey have such a negative attitude toward food waste. The fact is, that while comparing both of the countries there is definitely one difference which might give such a results. In Portugal the combat against food waste problem is definitely raised more often. Supermarkets, non-profit organisations like Refood and volunteers are active participants to minimise the food waste in the country.
5.3 Development of future studies Despite progress in reducing waste, a WRAP statement claimed that there is still a lot more
that can be done. It considered the EU target to reduce food waste by 30% to be challenging but achievable. Europe continues to waste very significant amounts of food which is still edible and normally ends up in landfills. Nowadays with the global food system under pressure, Europe needs to start to minimise the level of waste which has environmental, social and economic consequences.
To get better insight into the consumer food waste there is a need to more research, especially quantitative is needed to support the endeavour to find effective methods to reduce food waste especially in households level.
The results presented in the study collected answers from 472 households, giving an useful information about behaviours, attitudes and habits. Relatively small sample , and not that vast

57
diversity of participants make the survey useful but there is a lot of improvement which can be done in the future studies of this kind. To reliable results of this kind of study bigger sample of households should be collected with variety of socio-demographic characteristics like of age, place of living, incomes and educations level. Moreover, future research should also raise the household routines issue, like this one including shopping, planning routines, knowledge about the food waste problem and household practises of leftover use. This kind of research has a goal to understand the households’ behaviour and might help to find the solutions to minimise the food waste at the consumers level. The present study also found that in the collected sample of participants had very little knowledge about the food waste issue. The future research should improve that everyone is understanding the global food waste problem specially the one occurring in their households.
Besides this, the best way to gather information would be to prepare more researches like in the case of WRAP in 2008 where the waste of participants were collected and analyse d. This everyday systematic self-controlled food waste activities of households who are equipped with the proper measuring tools (tablets, electronic diaries, weight etc.) would allow to get the insight of what is thrown away and for what reasons. In the base of this kind of study the behaviour analysis of the households who produced the biggest and the smallest waste could be done to understand the factors of their behaviour to implement the right tools to combat the food waste in the households.

58

59
6 Bibliography
Ajzen, I., 2002. Perceived Behavioral Control, Self-Efficacy, Locus of Control, and the Theory of Planned Behavior. In Journal of Applied Social Pscychology. pp. 665–683.
Alexander, L., Allen, S. & Bindoff, N.L., 2013. Summary for Policymakers. Com(2014) 398, (September 2013), pp.1–36.
Aschemann-Witzel, J., de Hooge, I., Amani, P., Bech-Larsen, Tino., Oostindjer, M., 2015. Consumer-Related
Food Waste: Causes and Potential for Action. Sustainability, 7(6), pp.6457–6477. Available at: http://www.mdpi.com/2071-1050/7/6/6457/htm.
Aschemann-Witzel, J., 2015. Consumers and food waste-a review of research approaches and findings on point of purchase and in-household consumer behaviour. 143rd Joint EAAE/ …. Available at: http://ageconsearch.umn.edu/bitstream/202716/2/147.pdf.
Bamberg, S. & Schmidt, P., 2003. Incentives, Morality, Or Habit?: Predicting Students’ Car Use for University Routes With the Models of Ajzen, Schwartz, and Triandis. Environment & Behavior, 35(2), pp.264–285.
Banki Żywności, 2015. Raport Federacji Polskich Banków Żywności “Nie marnuj jedzenia 2015,”
Bio Intelligence Service, Umweltbundesamt & AEA Energy & Environment, 2010. Preparatory study on food waste across EU 27, Available at: http://ec.europa.eu/environment/eussd/pdf/bio_foodwaste_report.pdf.
Bond, M., Meacham, T., Bhunnoo, R. and Benton, T .G., 2013. Food waste within global food systems. Global Food Security Programme, pp.1–43.
Buchholzer, F., 2015. EU initiatives to fight food waste Fighting Food Waste.
Carvalho Martins, P. & Jiva, Z., 2016. “Não” ao desperdício alimentar. Eis a política dos hipers em Portugal. Available at: https://www.noticiasaominuto.com/pais/579010/nao-ao-desperdicio-alimentar-eis-a-politica-dos-hipers-em-portugal.
Coi, 2009. Communications and behaviour change. Behaviour Change, p.70.
Council of European Union, 2016. The European Council welcomes FUSIONS outcomes in its conclusions. Available at: http://www.eu-fusions.org/.
Dallemand, J., Pascua, I., Pinedo Motola, V., Banja, M., Scarlat, N., Medarac, H., Castellazzi, L., Labanca, N., Bertoldi, P., Pennington, D., Goralczyk, M., Schau, E M., Saouter, E., Sala, S., Notarnicola, B., Tassielli , G., Renzulli , P., Energy use in the EU food sector : State of play and opportunities for improvement.
DECO, 2015. Preço determina escolhas dos consumidores. RevistaProteste, pp.33–34.
DKMM, 2016. Benefits of Composting. Solid Waste District. Reduce, Reuse, Recycle . Available at: http://www.dkmm.org/benefits-of-composting.
Egmond, C. & Bruel, R., 2007. Triandis’ Theory of Interpersonal Behaviour. Analysis of theories and a tool for developing interventions to influence energy-related behaviour.
Elsen, M., van Giesen, R. & Jorna, L., 2015. Milan BExpo 2015 : A behavioural study on food choices and eating habits.
EPA, 2016a. Home composting. Available at: http://www.stopfoodwaste.ie/home-composting/.
EPA, 2016b. Reducing the Impact of Wasted Food by Feeding the Soil and Composting. Available at: https://www.epa.gov/sustainable-management-food/reducing-impact-wasted-food-feeding-soil-and-composting.
EPA, 2016c. Reducing Wasted Food At Home. Available at: https://www.epa.gov/recycle/reducing-wasted-food-home.

60
European Commission, 2015a. A recipe for reducing Europe’s food waste mountain. Available at: https://ec.europa.eu/programmes/horizon2020/en/news/recipe-reducing-europe%E2%80%99s-food-waste-mountain.
European Commission, 2016a. Date marking and food waste. Available at: http://ec.europa.eu/food/safety/food_waste/eu_actions/date_marking/index_en.htm.
European Commission, 2016b. EU actions against food waste. Available at: http://ec.europa.eu/food/safety/food_waste/eu_actions/index_en.htm.
European Commission, 2016c. EU Platform on Food Losses and Food Waste. Available at: http://ec.europa.eu/food/safety/food_waste/eu_actions/eu-platform/index_en.htm.
European Commission, 2014a. European Commission. European Commission, p.Economic and Financial Affairs. Available at: http://ec.europa.eu/economy_finance/euro/index_en.htm.
European Commission, 2015b. Flash Eurobarometer 425 Summary Food waste and date marking Fieldwork September 2015.
European Commission, 2015c. Proposal for a DIRECTIVE OF THE EUROPEAN PARLIAMENT AND OF THE COUNCIL amending. Directive 2008/98/EC of the European Parliament and of the Council of 19 November 2008 on waste and repealing certain Directives (OJ L 312, 22.11.2008, p. 3), COM(2015).
European Commission, 2016d. Review of Waste Policy and Legislation. Available at: http://ec.europa.eu/environment/waste/target_review.htm.
European Commission, 2016e. Stop food waste. Fusion 2016. Available at: http://ec.europa.eu/food/safety/food_waste/stop/index_en.htm.
European Commission, 2014b. Stop food waste. European Commission, p.1.
European Commission, 2016f. What is Horizon 2020? Available at: https://ec.europa.eu/programmes/horizon2020/en/what-horizon-2020.
Evans, D., 2012. Beyond the Throwaway Society: Ordinary Domestic Practice and a Sociological Approach to Household Food Waste. Sociology, 46(1), pp.41–56. Available at: http://soc.sagepub.com/content/46/1/41.abstract.
FAO, 2016. Food loss and food waste. Available at: http://www.fao.org/food-loss-and-food-waste/en/.
Fao, 2013. Food wastage footprint. Impacts on natural resources. Summary Report.
FAO, 2014. Food Wastage Footprint: Fool cost-accounting.
FAO, 2011. Global initiative on food loss and food waste reduction. Available at: http://www.fao.org/save-food/en/.
FAO, 2009. How to Feed the World in 2050. Insights from an expert meeting at FAO , 2050(1), pp.1–35. Available at: http://www.fao.org/wsfs/forum2050/wsfs -forum/en/.
FoodDay, 2016. Get Food Education in Every School. Available at: http://www.foodday.org/food_education.
FUSIONS, 2016a. About FUSIONS. Available at: http://www.eu-fusions.org/index.php/about-fusions.
FUSIONS, 2016b. New four year EU project on food waste: “REFRESH” (Resource Effi cient Food and dRink for the Entire Supply cHain). Available at: http://www.eu-fusions.org/.
Godfray, H.C.J., Beddington, J., Crute, I., Haddad, L., Lawrenc e, D., Muir, J.F., Pretty, J., Robinson, S., Thomas, S.M., Toulmin, C., 2012. “The Challenge of Food Security.” Science 327 (February): 812. doi:10.4337/9780857939388. 2012. The Challenge of Food Security. Science, 327(February), p.812. Available at: http://www.elgaronline.com/view/9780857939371.xml.
Graham-Rowe, E., Jessop, D.C. & Sparks, P., 2014. Identifying motivations and barriers to minimising household
food waste. Resources, Conservation and Recycling, 84, pp.15–23. Available at:

61
http://dx.doi.org/10.1016/j.resconrec.2013.12.005.
Gregory Peter J, I.J.S.I., 2014. Food Production and Land Use.
Gustavsson, J., Cederberg, C., Sonesson, U., van Otterdijk, R., Meybeck, A., 2011. Global food losses and food waste: extent, causes and prevention. International Congress: Save Food!, p.38. Available at: http://www.fao.org/fileadmin/user_upload/ags/publications/GFL_web.pdf.
Harland, P., 2007. Situational and Personality Factors as Direct or Personal Norm Mediated Predictors of Pro -environmental Behavior : Questions Derived From Norm-activation Theory. , 29(4), pp.323–334.
Hennink, M.I.H. & Bailey, A., 2011. Qualitative Research Methods, SAGE Publications Ltd.
Horwath, 1999. The Stages of Change. Effective Clinical Practice, pp.1–7.
Kalińska, A., 2016. Marnowanie żywności w Polsce. Available at:
http://www.money.pl/gospodarka/wiadomosci/artykul/marnowanie-zywnosci-w-polsce-senat-chce,222,0,2135518.html.
Kanta, 2015. Implications of consumer behaviour in marketing. INTERNATIONAL RESEARCH JOURNAL OF MARKETING AND ECONOMICS, 6(June), pp.1–10.
Klöckner A. Christian, 2015. The Psychology of Pro-Environmental Communication. Beyond Standard Information Strategies. , 271.
Koivupuro, H.K., Hartikainen, H., Si lvennoinen, K., Katajajuuri, J. M., Heikintalo, N., Reinikainen, A., Jalkanen, L.,
2012. Influence of socio-demographical, behavioural and attitudinal factors on the amount of avoidable food waste generated in Finnish households. International Journal of Consumer Studies, 36(2), pp.183–191.
Lipinski, B., Hanson, C., Lomax, J., Kitinoja, L., Waite, R., Searchinger, T., 2013. Reducing Food Loss and Waste. World Resource Institute, (June), pp.1–40.
Lipinski, B. & Singhal, A., 2015. How Food Waste Costs Our Cities Millions. Available at:
http://thecityfix.com/blog/food-waste-costs-cities-millions-urbanization-emissions-sustainability-aaryaman-singhal-brian-lipinski/.
Live Science, 2013. Feeding the world.
Madre, Y. & Devuyst, P ., 2015. How will we feed the world in the next decades? An analysis of the dwmand and supply factors for food. Farm Europe.
Maio, G.R., Verplanken, B., Manstead, A. S R., Stroebe, W., Abraham, C., Sheeran, P., Conner, M., 2007. Social Psychological Factors in Lifestyle Change and Their Relevance to Policy. Social Issues and Policy Review, 1(1), pp.99–137.
Mclntosh, A., Drax, R., Fitzpatrick, J., Glindon, M., McKenzie, I., 2015. Food security: demand, consumption, and waste. , II(January), p.36.
Netemeyer, R., Ryn, M. Van & Ajzen, I., 1991. The theory of planned behavior. Organizational Behavior and Human Decision Processes, 50(2), pp.179–211. Available at: http://linkinghub.elsevier.com/retrieve/pii/074959789190020T.
Nielsen, S.D., 2012. “ Stop Spild af Mad ”,“ Stop Wasting Food .”, pp.2010–2013.
Norman, P. & Cooper, Y., 2011. The theory of planned behaviour and breast self-examination: Assessing the impact of past behaviour, context stability and habit strength. Psychol Health, (August 2016), pp.1–17.
Onwezen, M.C., Antonides, G. & Bartels, J., 2013. The Norm Ac tivation Model: An exploration of the functions
of anticipated pride and guilt in pro-environmental behaviour. Journal of Economic Psychology, 39, pp.141–153.
Parizeau, K., von Massow, M. & Martin, R., 2015. Household-level dynamics of food waste production and related beliefs, attitudes, and behaviours in Guelph, Ontario. Waste Management, 35, pp.207–217.

62
Available at: http://dx.doi.org/10.1016/j.wasman.2014.09.019.
Parry, A., James, K. & LeRoux, S., 2015. Strategies to achieve economic and environmental gains by reducing food waste.
Perreau, F., 2016. The factors influencing consumer behavior.
Plumb, A. & Downing, P., 2013. Consumer Attitudes to Food Waste and Food Packaging .
Polskie Radio, 2015. Światowy Dzień Żywności: w Polsce marnuje się rocznie 9 milionów ton żywności. Available at: http://www.polskieradio.pl/42/273/Artykul/1531859,Swiatowy-Dzien-Zywnosci-w-Polsce-marnuje-sie-rocznie-9-milionow-ton-zywnosci.
Power, K., 2010. Introducing behaviour changes towards sustainable food consumption. , (December), pp.1–5.
Quested, T. & Parry, A., 2011. New estimates for household food and drink waste in the UK. , (November), pp.1–19.
Schiffman, L.G.. K.L.L., 2004. Consumer Behaviour 8th Editio. N. Prentice Hall, Upper Saddle River.
Schneider, F., 2008. Wasting Food – an Insistent Behaviour. Waste The Social Context Urban Issues and Solutions, 8, pp.1–10.
Scott, C.J. & M.D., 2016. Stages of Change Model. Available at: http://www.addictioninfo.org/articles/11/1/Stages -of-Change-Model/Page1.html.
Slow Food, 2016. Slow Europe. Available at: http://www.slowfood.com/sloweurope/en/topics/food-waste/.
Stefan, V., van Herpen, E., Tudoran, A.A., Lähteenmäki, L., 2013. Avoiding food waste by Romanian consumers: The importance of planning and shopping routines. Food Quality and Preference, 28(1), pp.375–381. Available at: http://dx.doi.org/10.1016/j.foodqual.2012.11.001.
Steinfeld, H. ; Gerber, P. ; Wassenaar, T. ; Castel, V. ; Rosales, M. ; de Haan, C., 2006. Livestock’s long shadow.
Stenmarck, Å., Jensen, C., Quested, T., Moates, G., 2016. "Estimates of European food waste levels".
Stuart, T., 2009. Waste: "Uncovering the Global Food Scandal".
Tostivint, C., Östergren, K., Quested, T., Soethoudt, H., Stenmarck, Å., Svanes, E., O’Connor, C., 2016. Food
waste quantification manual to monitor food waste amounts and progression , Available at: http://www.eu-fusions.org/phocadownload/Publications/Food waste quantification manual to monitor food waste amounts and progression.pdf.
Verplanken, B. and O., 2003. Reflections on past behavior: A self-report index of habit strength. Journal of Applied Social Psychology 33 (6), pp.1313–1330.
Voedingscentrum, 2014. Fact sheet: Consumer food waste.
Ward, R., 2007. Understanding food. Nursing mirror and midwives journal, 144(4), pp.57–58.
Williams, J., 2012. Competition and Efficiency in International Food Supply Chains. Improving Food Security Routledge.
Worldwatch-Institute, 2011. Five Simple Things Consumers Can Do to Prevent Food Waste. Worldwatch
Institute. Available at: http://www.worldwatch.org/five-simple-things-consumers-can-do-prevent-food-waste-0.
WRAP, 2016. Love your fridge and waste less. Love Food Hate Waste.
WRAP, 2013. Reducing food waste - how packaging can help. Available at: http://www.wrap.org.uk/fresherforlonger.
Zero Waste Europe, 2012. The European Parliament votes in favour of almost Zero Waste for 2020! Available at: https://www.zerowasteeurope.eu/2012/05/the-european-parliament-votes-in-favour-of-almost-zero-waste-for-2020/.

63
Zero Waste Europe, 2016. Zero Waste? Available at: https://www.zerowasteeurope.eu/about/principles -zw-europe/.

64
Attachments
Attachment 1 – Consumer survey - English version
1. Who usually does the shopping in your household?
ME ANOTHER FEMALE ANOTHER MALE MULTIPLE PEOPLE OR DIVIDED EQUALLY
2. Where do you normally go shopping for food?
MINIMARKETS ( LOCAL)
MEDIUM SIZE MARKETS BIG
SUPERMARKETS IT DEPENDS ON THE FOOD TYPE: FOOD WITH SHORT SHELF LIFE IN THE SHOPS CLOSE
TO MY HOUSE, FOOD WITH LONG SHELF LIFE IN BIGGER SHOPS
3. With what frequency do you go food shopping?
PRACTICALLY EVERYDAY SEVERAL TIME PER WEEK 2-3 TIMES PER WEEK 1 TIME PER WEEK 2-3 TIMES PER MONTH 1 TIME PER MONTH
4. With what frequency do you perform the following actions/behaviours before and during food shopping?
ALWAYS FREQUENTLY SOMETIMES RARELY NEVER
Check the fridge and pantry before going shopping
Do a meal plan before going shopping
Do a shopping list of necessary food products before going shopping
Stick to the shopping list
Buy more products when they are on promotion
Do shopping on an empty stomach
Go shopping by car to be able to transport/buy more products
Before buying food products verify the expiry date
Buy too much food due to worries that it may later run out
Buy too much food because small packages do not exist
Buy products which initially did not mean to buy
5. Who is normally responsible for making/preparing meals in your household?
ME OTHER PERSON OF FEMININE GENDER OTHER PERSON OF MASCULINE GENDER MANY MEMBERS OR EVERYONE EQUALLY
6. What is the frequency of making the following meals per week?
ALWAYS VERY OFTEN FREQUENTLY RARELY NEVER
Breakfast
Small meals mid-morning
Lunch
Snack
Dinner
7. How often do you buy pre-prepared food (take away) per week?
ALMOST EVERY DAY SEVERAL TIMES PER WEEK ONCE PER WEEK 2-3 TIMES PER MONTH ONCE PER MONTH ALMOST NEVER

65
8. What is the approximate quantity of food products which are eventually thrown away in your household? (remains, leftovers, food which passed the expiry date?
LESS THAN 5% BETWEEN 5 AND
10% BETWEEN 10 AND
20% BETWEEN 20 AND
40% MORE THAN 40%
9. Indicate, with what frequency do you usually throw away the following:
ALWAYS VERY OFTEN FREQUENTLY RARELY NEVER
Bread/sandwiches and other bakery products Dairy (milk, cheese, yogurts) and eggs
Fresh fruit and vegetables
Meat and other derived products Fish
Canned food and juices
Surplus leftovers of lunch/dinner
10. What is normally the destination of your meal leftovers?
ALWAYS VERY OFTEN FREQUENTLY RARELY NEVER
We throw it into the rubbish bin
We throw it into the kitchen crushing machine, sink or toilet
We reheat it and use it as the next meal
We use it to make a new meal adding some more ingredients
We freeze it to eat later or to make a new meal
We give it to animals
We make home composts
11. What are the main reasons of food waste in your household? (Choose three main reasons)
Dissatisfaction with quality, taste or freshness of the bought product/meal
Passing the expiration date and fear of getting food poisoning
Unsuccessful meal preparation (e.g. too seasoned, burnt)
Buying products in big quantities and then being unable to eat it within the validity period
Preparing too much food which is later not used
Forgetting the food which ends up spoiling
No one in the house likes to eat leftovers and that is why we have to throw it away
As there are no small packages we have to buy too much food which we later do not use I don’t know, I’ve never thought about it Another motive (open answer)
12. How do you verify if the product is still suitable to be consumed?
Based on its appearance / taste / smell
We verify the date indicated on the package “use by...”
We verify the date indicated on the package “best before...” We think about how long the product has been open for
We think about when we bought the product
Another way? (open answer)
13. Do you know what is the destination of the food waste which is produced in your area?
I DON’T KNOW COMPOSTING (ORGANIC BYPRODUCT) INCINERATION (ENERGETIC BYPRODUCT) LANDFILL

66
14. Please indicate your level of agreement with the following statements:
I TOTALLY
AGREE I AGREE I DON’T AGREE OR
DISAGREE I DISAGREE I TOTALLY
DISAGREE
People that are important to me disapprove that I am throwing away leftovers
For me it is very important that people that are relevant to me approve of my behaviour
15. Please indicate your level of agreement with the following statements:
I TOTALLY AGREE I AGREE I DON’T AGREE OR
DISAGREE I DISAGREE I TOTALLY DISAGREE
Wasting food is something that I condemn, specially as there are so many people starving
I do not care that much about the money I waste when I throw away the food
Throwing food into the rubbish bin will aggravate even more the waste problem in the environment
My effort to reduce food waste is insignificant to resolve the problem
Food waste is a significant part of resource waste The quantity of food which I throw away is something which does not bother me
Food waste is a private matter and nobody else’s business
People who waste food should be punished
Food waste is not a problem because there are sophisticated technologies to recycle this waste
I always avoid food waste, even if this costs me my time and effort
I feel guilty when I throw food away It is perhaps even beneficial for the economy if people don’t use all their food
16. What importance do you attribute to food waste in Portugal / Poland?
A LOT SOME INDIFFERENT LITTLE NONE
17. In your opinion, who is mainly responsible for food waste? (Indicate in order of importance)
FARMERS AGRO INDUSTRIAL
ENTERPRISES DISTRIBUTION
COMPANIES SUPERMARKETS CONSUMERS RESTAURANTS THE GOVERNMENT
18. How do you feel in relation to food waste in your house?
VERY RESPONSIBLE RESPONSIBLE INDIFFERENT A LITTLE RESPONSIBLE NOT RESPONSIBLE AT
ALL
19. Indicate the level of difficulty that the following behaviours represent to you or your family.
VERY EASY EASY NOT EASY OR DIFFICULT DIFFICULT VERY DIFFICULT Plan and predict exactly how much food will be consumed
Buy only what its necessary and resist novelties Use all leftovers to make/prepare other meals Consume beyond the expiration date if the food still looks good
Totally eliminate food waste

67
20. Thinking about the next few weeks what is your intention in relation to the following behaviour?
I TOTALLY AGREE I AGREE I DON’T AGREE OR
DISAGREE I DISAGREE I TOTALLY DISAGREE
Buy exactly the right amount of food which my house need
Cook and prepare meals with the exact quantities needed
I try to not throw any food away
21. In your opinion what is the relationship between food waste and the following problems?
TOTALLY
RELATED VERY RELATED INDIFFERENT LITTLE
RELATED UNRELATED I DON’T HAVE
AN OPINION
Energy waste
Water consumption
Consumption of natural resources
Malnutrition and hunger in the world
Amount of waste
Environmental pollution
22. Below are measures to reduce food waste. Which of them do you consider most effective? (choose three)
Prohibit promotions that encourage people to buy in bulk
Bigger variety of the size of the product packages (smaller sizes)
All of the products should be closed hermetically or sold in packages that can be closed again
Awareness campaigns and information for consumers about food waste and how to avoid it
Teaching in schools how to avoid food waste
Encourage and help people to make home composts
Create small municipal compost centres
Teach people how to use leftovers
Teach people how to do shopping and how to correctly preserve food
23. Do you have knowledge about institutions which deal with food waste issues?
NO YES IF YES, WHAT’S ITS NAME?
24.In recent months did you find or look for information about food waste?
NO YES
25. Have you recently heard or read anything about food waste?
NO YES, ON
THE RADIO YES, ON THE
TELEVISION YES, AT WORK YES, AT
SCHOOL YES, IN BROCHURES
IN THE STREETS YES, IN A BOOK
/NEWSPAPER YES, ON THE
INTERNET I DON’T
REMEMBER
Socio-demographic characteristics
26. Gender FEMALE MALE 27. Age
28. Not including you, how many people currently live in your house and what is their age?
< 16 YEARS OLD BETWEEN 16 AND 24
YEARS OLD BETWEEN 25 AND
34 YEARS OLD BETWEEN 35 AND
44 YEARS OLD BETWEEN 45 AND
55A YEARS OLD BETWEEN 55 AND
64 YEARS OLD > 65 YEARS OLD

68
29. The place where you live is:
AN APARTMENT IN THE
BUILDING A HOUSE WITH NO
YARD A HOUSE WITH A YARD ANOTHER SITUATION (PLEASE SPECIFY)
30. The area where you live is located:
IN THE CENTRE OF A BIG
CITY IN THE SUBURBS OF A
BIG CITY IN A SMALL
CITY/VILLAGE IN A RURAL AREA
31. What is your level of education?
NO COMPULSORY
EDUCATION BASIC EDUCATION HIGH SCHOOL
EDUCATION PROFESSIONAL
QUALIFICATION HIGHER EDUCATION
32. What is your occupation?
FULL TIME WORKER (> 30 h PER
WEEK) PART TIME WORKER ( 30 h
PER WEEK)
FULL TIME
STUDENT STAY-AT-HOME
RETIRED UNEMPLOYED ANTHER
SITUATION
33. Are you or someone in your family usually at home most of the time during the day?
YES NO
34. What is the average income in your household?
LESS THAN N 600€ BETWEEN 601 AND
1700 € BETWEEN 1701 AND
3500€ BETWEEN 3501 AND
7200€ MORE THAN 7200€

69
Attachment 2 – Consumer survey - Portuguese version
1. Em sua casa, quem costuma habitualmente fazer as compras de produtos alimentares?
EU PRÓPRIO OUTRA PESSOA DO SEXO FEMININO OUTRA PESSOA DO SEXO MASCULINO VÁRIOS OU TODOS IGUALMENTE
2. Onde fazem normalmente as compras de produtos alimentares?
MINIMERCADOS
(COMÉRCIO LOCAL) MERCADOS DE MÉDIA
DIMENSÃO (LIDL, PINGO
DOCE)
GRANDES
HIPERMERCADOS
(JUMBO, CONTINANTE)
DEPENDE DO TIPO DE PRODUTOS: ALIMENTOS DE CURTA VALIDADE EM LOJAS PERTO
DE CASA, ALIMENTOS COM PRAZOS DE VALIDADE MAIOR EM LOJAS MAIORES
3. Com que frequência costumam ir fazer as compras de bens alimentares?
PRATICAMENTE TODOS OS DIAS VARIASVEZES POR SEMANA UMA VEZ POR SEMANA 2 A 3 VEZES POR MÊS 1 VEZ POR MÊS
4. Com que frequência realizam os seguintes comportamentos antes e durante as compras de bens alimentares?
SEMPRE MUITAS
VEZES FREQUENTEME
NTE RARAMENTE NUNCA
Verificar o frigorifico e a dispensa antes de fazer as compras
Fazer um plano das refeições antes de ir às compras
Fazer uma lista de bens alimentares necessários antes de ir às compras
Seguir à risca a lista das compras
Comprar mais produtos quando estão em promoção
Fazer as compras com estômago vazio
Ir de carro às compras para poder transportar mais produtos
Antes de comprar verificar o prazo de validade dos alimentos
Comprar alimentos/comida a mais com receio que depois faltem
Comprar comida a mais porque não existem embalagens mais pequenas
Comprar alimentos que inicialmente não tinha intenção de comprar
5. Em sua casa, quem é que normalmente é o responsável pela confecção das refeições?
EU PRÓPRIO OUTRA PESSOA DO SEXO FEMININO OUTRA PESSOA DO SEXO MASCULINO VÁRIOS OU TODOS IGUALMENTE
6. Com que frequência fazem as seguintes refeições em casa por semana?
SEMPRE MUITAS VEZES FREQUENTEMENTE RARAMENTE NUNCA
Pequeno-almoço
Pequena refeição a meio da manhã
Almoço
Lanche
Jantar
7. Com que frequência compram refeições já preparadas (take away) por semana?
PRATICAMENTE TODOS OS DIAS VARIAS VEZES POR
SEMANA UMA VEZ POR
SEMANA 2 A 3 VEZES POR MÊS 1 VEZ POR MÊS QUASE NUNCA

70
8. Dos produtos alimentares que compram, que quantidade aproximadamente acabam por deitar fora (restos, sobras,
comida fora de prazo)?
MENOS DE 5% ENTRE 5 A 10% ENTRE 10 A 20% ENTRE 20 A 40% MAIS DE 40%
9. Por favor indique com que frequência costuma deitar fora os seguintes bens alimentares:
SEMPRE MUITAS VEZES FREQUENTEMENTE RARAMENTE NUNCA
Pão/sandes e outros produtos de padaria/pastelaria Laticínios (leite, queijo, iogurtes) e ovos
Frutas e vegetais frescos
Carne e enchidos Peixe
Comida enlatada e sumos
Sobras excedentes do jantar-almoço
10. Quando têm sobras das refeições, que destino lhes dão normalmente?
SEMPRE MUITAS VEZES FREQUENTEMENTE RARAMENTE NUNCA
Deitamos para o caixote do lixo
Deitamos para o triturador da cozinha, lavatório ou sanita
Aquecemos e utilizamos tal como está numa refeição seguinte
Utilizamos para fazer uma nova refeição acrescentando mais alguns ingredientes
Congelamos para comer mais tarde
Damos aos animais que temos
Fazemos compostagem doméstica
11. Quais são as principais razões para o desperdício da comida na sua casa?
Insatisfação com a qualidade, sabor ou frescura do alimento/comida comprada
Expiração da data de validade e receio em apanhar uma intoxicação alimentar
Insucesso na confecção das refeições (ex. ficou queimada ou demasiado temperada)
Compra de alimentos em grandes quantidades que depois não conseguimos consumir dentro do prazo de validade
Preparação de comida em excesso que depois não é utilizada
Esquecimento da comida que acaba por se estragar
Ninguém cá em casa gosta de comer as sobras e por isso temos que as deitar fora
O facto de não haver embalagens mais pequenas temos que comprar comida a mais que depois não utilizamos
Não sei, nunca pensei no assunto
Outro motivo (pergunta aberta)
12. Como verificam se o produto ainda está próprio para o consumo?
Com base no seu aspecto/cheiro/sabor
Verificamos a data indicada na embalagem “consumir até...”
Verificamos a data indicada na embalagem “consumir de preferência antes de...”
Pensamos há quanto tempo o produto está aberto
Pensamos há quando comprámos o produto
Outra forma, qual? (pergunta aberta)
13. Sabe qual é o destino dos resíduos alimentares que se produzem na sua zona?
NÃO SEI COMPOSTAGEM (VALORIZAÇÃO
ORGÂNICA) INCINERAÇÃO (VALORIZAÇÃO ENERGÉTICA) ATERRO SANITÁRIO

71
14. Por favor indique o seu grau de concordância com as seguintes frases:
CONCORDO
TOTALMENTE CONCORDO NEM CONCORDO,
NEM DISCORDO DISCORDO DISCORDO
TOTALMENTE
As pessoas mais importantes para mim desaprovam que eu deite os restos de comida para o lixo
Para mim, é muito importante que as pessoas mais importantes para mim aprovem os meus comportamentos
15. Por favor indique o seu grau de concordância com as seguintes afirmações:
CONCORDO
TOTALMENTE CONCORDO NEM CONCORDO,
NEM DISCORDO DISCORDO DISCORDO
TOTALMENTE
Desperdiçar comida é uma coisa que condeno quando há tantas pessoas a passar fome
Não me preocupa muito o dinheiro que desperdiço quando deito fora comida
Deitar comida para o caixote do lixo vai agravar ainda mais o problema dos resíduos no ambiente
O meu esforço para reduzir o desperdício alimentar
é insignificante para resolver o problema
O desperdício alimentar representa um desperdício importante de recursos
A quantidade de comida que deito fora é uma coisa que não me preocupa
O desperdício alimentar é uma coisa que diz respeito a cada um, ninguém tem nada com isso
As pessoas que desperdiçam comida deviam ter uma penalização
O desperdício alimentar não é um problema porque existem tecnologias sofisticadas para reciclar estes resíduos
Evito sempre o desperdício alimentar, mesmo que isso represente ter que perder mais tempo ou mais esforço
Sinto-me culpado quando deito comida fora As pessoas não precisam de aproveitar a comida toda que compram porque até é bom para a economia
16. Que importância atribui ao desperdício alimentar em Portugal/Polónia?
MUITA IMPORTÂNCIA ALGUMA IMPORTÂNCIA INDIFERENTE POUCA IMPORTÂNCIA NENHUMA IMPORTÂNCIA
17. Na sua opinião, quem é o principal responsável pelo maior desperdício da comida? (indique por ordem de
importância 1- mais responsável, 7 - não responsável)
AGRICULTORES EMPRESAS
AGROINDUSTRIAIS EMPRESAS DE
DISTRIBUIÇÃO HIPERMERCADOS CONSUMIDORES RESTAURANTES GOVERNO
18. Como se sente face ao desperdício alimentar da sua casa?
MUITO RESPONSÁVEL RESPONSÁVEL NEM MUITO, NEM
POUCO RESPONSÁVEL POUCO RESPONSÁVEL NADA RESPONSÁVEL
19. Indique o grau de dificuldade que representa para si, ou para a sua família, os seguintes comportamentos
MUITO FÁCIL FÁCIL NEM FÁCIL, NEM
DIFÍCIL DIFÍCIL MUITO DIFÍCIL
Planear e prever exactamente quanta comida será consumida

72
Comprar só o que se necessita e resistir às novidades
Aproveitar todos os restos para fazer outras refeições
Consumir para além do prazo de validade se a comida ainda estiver com bom aspeto
Eliminar totalmente o desperdício alimentar
20. Pensando nas próximas duas semanas, qual é a sua intenção em relação aos seguintes comportamentos:
CONCORDO
TOTALMENTE CONCORDO NEM CONCORDO, NEM
DISCORDO DISCORDO DISCORDO
TOTALMENTE
Comprar exatamente a quantidade de comida que a minha casa precisa
Cozinhar e preparar as refeições nas quantidades exatamente necessárias
Tenciono não deitar comida nenhuma fora
21. Na sua opinião, qual a relação entre o desperdício alimentar e os seguintes problemas:
TOTALMENTE RELACIONADO
MUITO
RELACIONADO É
INDIFERENTE POUCO
RELACIONADO NADA
RELACIONADO NÃO TENHO
UMA OPINIÃO
Desperdício de energia
Consumo de água Consumo de recurso naturais
Subnutrição e fome no mundo
Quantidade de resíduos
Poluição ambiental geral (solos, água, ar)
22. Das medidas indicadas em baixo, quais as três que considera mais eficazes para reduzir o desperdício alimentar
Proibir as promoções que incentivam as pessoas a comprar muito
Maior variedade na dimensão dos produtos embalados (doses mais pequenas)
Todos os produtos devem ser fechados hermeticamente ou vendidos em embalagens que se possam fechar novamente
Campanhas de sensibilização e informação aos consumidores sobre os problemas do desperdício alimentar e como evitá-lo
Ensinar nas escolas como evitar o desperdício alimentar
Incentivar e ajudar as pessoas a fazer compostagem doméstica
Criação de pequenas centrais de compostagem municipais
Ensinar as pessoas a aproveitar os restos
Ensinar as pessoas a fazer as compras e a preservar bem os alimentos
Outra, qual?
23. Tem conhecimento de alguma instituição que lide com problemas de desperdício de alimentos?
NÃO SIM SE SIM, COMO SE CHAMA?
24. Nos últimos meses, procurou ou encontrou informação sobre o desperdício de alimentos?
NÃO SIM
25. Lembra-se de ter ouvido ou lido nos últimos tempos qualquer informação sobre desperdício alimentar?
NÃO SIM, NA
RÁDIO SIM, NA
TELEVISÃO SIM, NO
EMPREGO SIM, NA
ESCOLA SIM, EM CARTAZES
NA RUA SIM, NUM
LIVRO/REVISTA SIM, NA
INTERNET NÃO ME
LEMBRO
Para finalizar, gostaríamos que nos desse algumas informações sobre si e a sua família
26. Sexo FEMININO MASCULINO 27. Idade
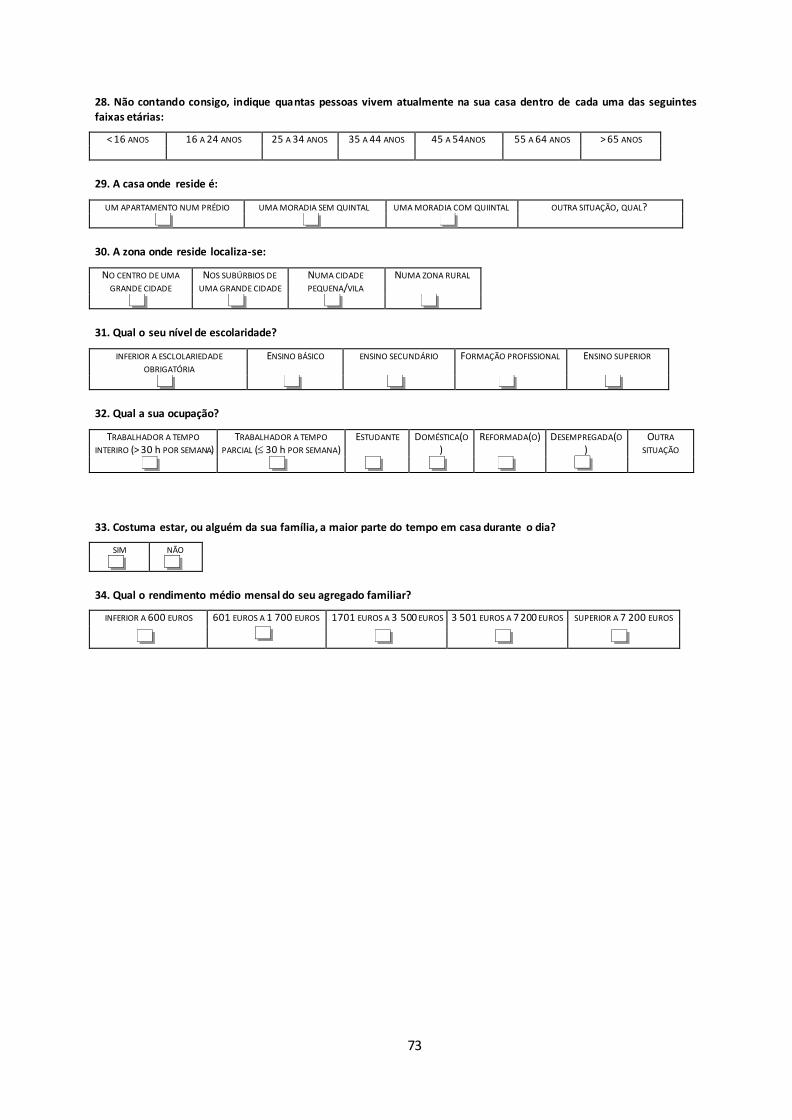
73
28. Não contando consigo, indique quantas pessoas vivem atualmente na sua casa dentro de cada uma das seguintes faixas etárias:
< 16 ANOS 16 A 24 ANOS 25 A 34 ANOS 35 A 44 ANOS 45 A 54ANOS 55 A 64 ANOS > 65 ANOS
29. A casa onde reside é:
UM APARTAMENTO NUM PRÉDIO UMA MORADIA SEM QUINTAL UMA MORADIA COM QUIINTAL OUTRA SITUAÇÃO, QUAL?
30. A zona onde reside localiza-se:
NO CENTRO DE UMA
GRANDE CIDADE NOS SUBÚRBIOS DE
UMA GRANDE CIDADE NUMA CIDADE
PEQUENA/VILA NUMA ZONA RURAL
31. Qual o seu nível de escolaridade?
INFERIOR A ESCLOLARIEDADE
OBRIGATÓRIA ENSINO BÁSICO ENSINO SECUNDÁRIO FORMAÇÃO PROFISSIONAL ENSINO SUPERIOR
32. Qual a sua ocupação?
TRABALHADOR A TEMPO
INTERIRO (> 30 h POR SEMANA) TRABALHADOR A TEMPO
PARCIAL ( 30 h POR SEMANA) ESTUDANTE DOMÉSTICA(O
) REFORMADA(O) DESEMPREGADA(O
) OUTRA
SITUAÇÃO
33. Costuma estar, ou alguém da sua família, a maior parte do tempo em casa durante o dia?
SIM NÃO
34. Qual o rendimento médio mensal do seu agregado familiar?
INFERIOR A 600 EUROS 601 EUROS A 1 700 EUROS 1701 EUROS A 3 500 EUROS 3 501 EUROS A 7 200 EUROS SUPERIOR A 7 200 EUROS

74
Attachment 3 – Consumer survey - Polish version
1. Kto w Pani/Pana domu jest zazwyczaj odpowiedzialny za zakup żywości? (pytanie wielokrotnego wyboru)
JA INNA OSOBA PŁCI ŻEŃSKIEJ INNA OSOBA PŁCI MĘSKIEJ RÓŻNIE LUB WSZYSCY JEDNAKOWO
2. Gdzie zazwyczaj robią Państwo zakupy produktów żywnościowych?
MINIMARKETY/
LOKALNE /
OSIEDLOWE SKLEPY
SPOŻYWCZE
SKLEPY DYSKONTOWE
(LIDL, BIEDRONKA...) HIPERMARKETY
(TESCO, REAL…) TO ZALEŻY OD PRODUKTU: ARTYKUŁY SPOŻYWCZE KRÓTKIEGO OKRESU PRZYDATNOŚCI DO
SPOŻYCIA – W SKLEPACH BLISKO DOMU, ARTYKUŁY SPOŻYWCZE DŁUGIEGO OKRESU
PRZYDATNOŚCI DO SPOŻYCIA – W DUŻYCH SKLEPACH I HIPERMARKETACH
3. Jak często robią Państwo zakupy artykułów spożywczych?
PRAWIE CODZIENNIE KILKA RAZY W TYGODNIU RAZ W TYGODNIU 2 – 3 RAZY W MIESIĄCU RAZ W MIESIĄCU
4. Z jaką częstotliwością realizują Państwo poniższe czynności przed i w trakcie robienia zakupów spożywczych?
ZAWSZE BARDZO CZĘSTO CZĘSTO RZADKO NIGDY
Sprawdzanie lodówki i braków przez pójściem na zakupy
Sporządzanie jadłospisu przed pójściem na zakupy
Sporządzenie listy potrzebnych produktów żywnościowych przed pójściem na zakupy
Kupowanie tylko tych produktów, które są na liście zakupów
Kupowanie/Zakup większej ilości produktów objętych promocją
Robienie zakupów z pustym żołądkiem
Jeżdżenie na zakupy samochodem, aby mieć możliwość przewiezienia większej ilości produktów
Sprawdzanie daty ważności przed kupnem produktów
Kupowanie większej ilości produktów w obawie przed tym, że potem może czegoś zabraknąć
Kupowanie większej ilości produktów z powodu braku mniejszych opakowań
Kupowanie produktów, których początkowo nie miałam/-em zamiaru kupić
5. Kto jest w Pańskim domu zazwyczaj odpowiedzialny za przygotowanie posiłków? (odpowiedź wielokrotnego wyboru)
JA INNA OSOBA PŁCI ŻEŃSKIEJ INNA OSOBA PŁCI MĘSKIEJ RÓŻNIE LUB WSZYSCY JEDNAKOWO
6. Jak często w tygodniu przygotowują Państwo poniższe posiłki?
ZAWSZE BARDZO CZĘSTO CZĘSTO RZADKO NIGDY
Śniadanie
Mały posiłek w południe
Obiad
Przekąska
Kolacja
7. Jak często kupują Państwo już gotowe produkty? (take away)
PRAWIE CODZIENNIE KILKA RAZY W TYGODNIU RAZ W TYGODNIU 2 -3 RAZY W MIESIĄCU RAZ W MIESIĄCU PRAWIE NIGDY

75
8. Jaka część produktów, które Państwo kupują, jest wyrzucana? (pozostałości, resztki , przeterminowana lub zepsuta
żywność)
MNIEJ NIŻ 5% MIĘDZY 5 A 10% MIĘDZY 10 A 20% MIĘDZY 20 A 40% WIĘCEJ NIŻ 40%
9. Z jaką częstotliwością wyrzucają Państwo następujące produkty?
ZAWSZE BARDZO CZĘSTO CZĘSTO RZADKO NIGDY
Pieczywo/kanapki i inne produkty wyrobów cukierniczych i piekarskich
Przetwory mleczne (mleko, sery, jogurty) i jajka
Świeże owoce i warzywa
Mięso i wędliny Ryby
Żywność w puszkach i soki
Reszki z obiadu i kolacji
10. Co zazwyczaj dzieje się z resztkami żywności w Państwa domu?
ZAWSZE BARDZO CZĘSTO CZĘSTO RZADKO NIGDY
Wyrzucamy do kosza
Wyrzucamy do kuchennej niszczarki, zlewu albo ubikacji
Podgrzewamy i zjadamy jako kolejny posiłek
Wykorzystujemy je do przygotowania nowego posiłku wzbogacając w kilka nowych składników
Zamrażamy, żeby zjeść w innym terminie
Dajemy zwierzętom
Kompostujemy
11. Jakie są główne powody marnowania żywności w Pańskim domu? (proszę wybrać trzy główne powody)
Niezadowolenie z jakości, smaku lub świeżości zakupionego produktu
Przeterminowanie się produktu i strach przed zatruciem pokarmowym
Niepowodzenie podczas przygotowania posiłku (przypalenie, przesolenie)
Zakup jedzenia w zbyt dużych ilościach, przez co nie jesteśmy w stanie go zjeść w przeciągu okresu przydatności do spożycia
Przygotowanie jedzenia w nadmiarze, które potem nie jest zjedzone
Zapominanie o jedzeniu, co skutkuje jego zepsuciem
Nikt w domu nie lubi zjadać pozostałego jedzenia z obiadu/kolacji, dlatego musimy je wyrzucać
Z powodu braku mniejszych opakowań kupujemy za dużo jedzenia, którego potem nie zjadamy Nie wiem, nigdy o tym nie myślałam/em
Inny powód (proszę wpisać odpowiedź) ________________________________________________________________________________
12. Jak sprawdzają Państwo, czy produkt nadaje się jeszcze do spożycia? (proszę wybrać trzy główne)
Na podstawie wyglądu / smaku / zapachu
Sprawdzamy datę podaną na opakowaniu „należy spożyć do…”
Sprawdzamy datę podaną na opakowaniu “najlepiej spożyć przed...” Przypominamy sobie jak długo produkt jest otwarty
Przypominamy sobie kiedy zakupiliśmy produkt
Inny sposób? (proszę wpisać odpowiedź)_______________________________________________________________________________
13. Czy wie Pani/Pan jakie jest przeznaczenie odpadów żywnościowych w Pani/Pana okolicy?
NIE WIEM KOMPOSTOWANIE (PRODUKCJA KOMPOSTU ORGANICZNEGO) SPALANIE (PRODUKCJA ENERGII) SKŁADOWISKO ODPADÓW
14. W jakim stopniu zgadza się Pani/Pan z poniższymi stwierdzeniami?
CAŁKOWICIE
SIĘ
ZGADZAM
ZGADZAM SIĘ ANI SIĘ ZGADZAM, ANI SIĘ NIE
ZGADZAM
NIE
ZGADZAM
SIĘ
CAŁKOWICIE SIĘ
NIE ZGADZAM
Osoby najbardziej mi bliskie wyrażają dezaprobatę, kiedy wyrzucam resztki jedzenia do kosza

76
Jest dla mnie bardzo ważne, aby osoby mi bliskie popierały moje zachowanie
15. W jakim stopniu zgadza się Pani/Pan z poniższymi stwierdzeniami?
CAŁKOWICIE SIĘ
ZGADZAM ZGADZAM
SIĘ ANI SIĘ ZGADZAM,
ANI SIĘ NIE
ZGADZAM
NIE
ZGADZAM
SIĘ
CAŁKOWICIE SIĘ
NIE ZGADZAM
Marnotrawienie żywności to sprawa, którą potępiam, szczególnie kiedy na świecie jest tyle ludzi, którzy głodują
Nie martwią mnie pieniądze, które marnuję, kiedy wyrzucam jedzenie do kosza
Wyrzucanie jedzenia do kosza jeszcze bardziej zwiększy problem odpadów w środowisku
Mój wysiłek, aby zmniejszyć marnowanie żywności nie ma wpływu na rozwiązanie problemu
Marnotrawstwo żywności stanowi istotną część w marnowaniu zasobów naturalnych
Ilość jedzenia, którą wyrzucam to sprawa, która mnie nie martwi
Marnotrawstwo żywności to sprawa, która dotyczy każdego z osobna, nikogo to nie powinno interesować
Osoby, które marnują żywność powinny być karane Marnotrawstwo żywności nie jest problemem, ponieważ istnieją wystarczająco zaawansowane technologie, aby przeprowadzić recykling tych odpadów
Unikam marnowania żywności, mimo że muszę włożyć w to trochę wysiłku i marnuję swój czas
Czuje się winna/winny, kiedy wyrzucam jedzenie To może nawet korzystne dla gospodarki, jeśli ludzie nie wykorzystują całego jedzenia
16. Jaka uwagę przywiązuje Pani/Pan do problemu marnowania żywności w Polsce?
OGROMNĄ UWAGĘ PEWNĄ UWAGĘ JEST MI TO
OBOJĘTNE MAŁĄ UWAGĘ NIE PRZYWIĄZUJĘ DO TEGO ŻADNEJ
UWAGI
17. Według Pani/Pana, kto jest najbardziej odpowiedzialny za marnotrawstwo żywności? (Proszę uszeregować w kolejności używając numerów od 1-7, gdzie 1 odpowiada za największe marnotrawstwo, 7 za najmniejsze)
ROLNICY FIRMY AGRONOMICZNE FIRMY
DYSTRYBUCYJNE HIPERMARKETY KONSUMENCI RESTAURACJE RZĄD
18. W jakim stopniu czuje się Pani/Pan odpowiedzialna za marnowanie żywności w Pańskim domu?
BARDZO
ODPOWIEDZIALNA/-Y ODPOWIEDZIALNA/-Y ANI BARDZO, ANI
TROCHĘ
ODPOWIEDZIALNA/-Y
TROCHĘ
ODPOWIEDZIALNA/-Y NIE CZUJĘ SIĘ
ODPOWIEDZIALNA/-Y
19. Proszę wskazać poziom trudności, z jaką przychodzą Pani/Panu lub Pańskiej rodzinie poniższe czynności:
BARDZO
ŁATWO ŁATWO ANI ŁATWO, ANI
TRUDNO TRUDNO BARDZO TRUDNO
Planowanie i przewidzenie dokładnej ilości konsumowanego jedzenia
Kupowanie tylko tego, co jest potrzebne i oparcie się pokusie kupna nowości
Wykorzystanie resztek jedzenia do przygotowania nowego posiłku
Skonsumowanie produktu mimo upływu daty ważności, jeżeli produkt wyglądałby dobrze
Całkowite wyeliminowanie marnowania żywności

77
20. Biorąc pod uwagę nadchodzące dwa tygodnie, jakie są Pani/Pana intencje odnośnie poniższych stwierdzeń?
CAŁKOWICIE SIĘ
ZGADZAM ZGADZAM
SIĘ ANI SIĘ ZGADZAM, ANI SIĘ
NIE ZGADZAM NIE
ZGADZAM
SIĘ
CAŁKOWICIE SIĘ NIE
ZGADZAM
Kupowanie dokładnie takiej ilości jedzenia, jaka będzie potrzebna w domu
Gotowanie i przygotowywanie posiłków dokładnie w odpowiednich ilościach
Nie zamierzam wyrzucać żadnego jedzenia
21. Według Pani w jakim stopniu poniższe problemy są powiązane z marnotrawstwem żywności?
CAŁKOWICIE
POWIĄZANE BARDZO
POWIĄZANE JEST TO
OBOJĘTNE TROCHĘ
POWIĄZANE NIE
POWIĄZANE NIE MAM
OPINII NA TEN
TEMAT
Marnotrawstwo wody Zużycie wody
Zużycie zasobów naturalnych
Niedożywienie i głód na świecie Ilość odpadów
Ogólne zanieczyszczenie środowiska (gleby, powietrze, woda)
22. Z rozwiązań podanych poniżej, które trzy uznałaby/-łby Pani/Pan za najskuteczniejsze w celu zredukowania marnotrawstwa żywności? (Proszę zaznaczyć trzy odpowiedzi)
Zakaz promocji, które zachęcałaby do dużych zakupów
Większy wybór rozmiarów pakowanych produktów (opcja mniejszych opakowań)
Wszystkie produkty powinny być zamykane hermetycznie albo sprzedawane w opakowaniach, które mogą być ponownie zamknięte
Kampanie społeczne i informacje dla konsumentów na temat problemów odnośnie marnotrawstwa żywności i możliwości unikania/wyeliminowania go
Edukacja w szkołach dotycząca unikania marnotrawstwa żywności
Zachęcanie i pomoc w przeprowadzaniu kompostowania w domach
Tworzenie małych komunalnych centrów kompostowania
Edukacja o sposobach wykorzystywania resztek z obiadu
Edukacja o sposobach robienia zakupów i odpowiedniego przechowywania produktów żywnościowych
Inne? (proszę wpisać swoje rozwiązanie) ____________________________________________________________________
23. Czy zna Pani/Pan jakąś instytucję, która zajmuje się problemami marnowania żywności?
NIE TAK JEŻELI TAK, JAK SIĘ NAZYWA?
24. Czy w ostatnich kilku miesiącach szukała albo znalazła Pani/Pan informacje na temat marnotrawstwa żywności?
NIE TAK
25. Przypomina sobie Pani/Pan, czy czytał/-a lub słyszał/-a w ostatnim czasie cokolwiek na temat marnotrawstwa żywności? (odpowiedź wielokrotnego wyboru)
NIE TAK, W
RADIU
TAK, W
TELEWIZJI
TAK, W
PRACY
TAK, W
SZKOLE
TAK, NA PLAKATACH
NA ULICY I
ULOTKACH
TAK, W
GAZECIE/KSIĄŻ
CE
TAK, W
INTERNECIE
NIE PAMIĘTAM
Na zakończenie chciałabym, żeby udzielił/-a mi Pani/Pan kilka informacji na swój temat:
26. Płeć KOBIETA MĘŻCZYZNA 27. Wiek

78
28. Nie licząc Pani/Pana proszę wpisać liczbę osób w danym wieku mieszkających w Pani/Pana gospodarstwie domowym? (w przypadku posiadania dzieci w wieku 3, 7 i 15 lat proszę zaznaczyć w wierszu „< 16 LAT” opcję „3” w odpowiedniej kolumnie.
< 16 LAT 16 -24 LAT 25 - 34 LAT 35 - 44 LAT 45 - 55 LAT 55 - 64 LAT > 65 LAT
29. Lokum, w którym Państwo mieszkają to:
MIESZKANIE W BUDYNKU DOM Z OGRODEM DOM BEZ OGRODU INNE (PROSZĘ WPISAĆ ODPOWIEDŹ)
30. Strefa, w której Państwo mieszkają to:
CENTRUM DUŻEGO
MIASTA OBRZEŻA DUŻEGO
MIASTA MAŁE
MIASTO/MIASTECZKO OBSZARY WIEJSKIE
31. Jaki jest Pani/Pana poziom wykształcenia?
BEZ WYKSZTAŁCENIA
OBOWIĄZKOWEGO WYKSZTAŁCENIE
PODSTAWOWE WYKSZTAŁCENIE
ŚREDNIE WYKSZTAŁCENIE
ŚREDNIE TECHNICZNE WYKSZTAŁCENIE
WYŻSZE
32. Jaki jest Pani/Pana zawód?
PRACOWNIK NA PEŁNYM ETACIE
(> 30 h TYGODNIOWO) PRACOWNIK NA PÓŁ ETATU (
30 h TYGODNIOWO)
STUDENT
DZIENNY GOSPODARZ/
GOSPODYNI
DOMOWA
EMERYT BEZROBOTNY INNA SYTUACJA
33. Czy ktoś w Pańskiej rodzinie spędza większość czasu w ciągu dnia w domu?
TAK NIE
34. Jak oceniłaby/-łby Pani/Pan średni dochód w Państwa gospodarstwie domowym?
PONIŻEJ 1850 ZŁ 1850 – 4200 ZŁ 4201 – 7000ZŁ 7001 – 10000ZŁ POWYŻEJ 10 000 ZŁ