food waste hero: the internet of things meets behavioral economics in school
TRANSCRIPT

Food Waste HeroAntony Quinn11 June 2013

Introductions
Hello!
Interaction design: human behaviour, emotions and experiences.
I’m Antony Quinn, an interaction designer. Thats means I’m interested in how we interact with computers at a cognitive and emotional level. I’ve worked as an interaction designer and software engineer in bioinformatics and medical informatics for the past 10 years. Before that I worked as a software developer in journalism, language translation, management consulting and investment banking. I studied economics at university in France, and then studied computer science, genetics and human-computer interaction at university in London and Cambridge.

Summary
1. Understand2. Design3. Build4. Demo5. Future Work6. Acknowledgements7. Q & A
I’ll discuss some of the phases of the design process - understand, design, build - but will not talk about the “study” and “evaluate” phases. We can discuss those phases in the Q&A or after the talk if you’re interested.

Summary
1. Understand2. Design3. Build4. Demo5. Future Work6. Acknowledgements7. Q & A
For the “understand” phase I undertook desk research to see what had already been done.

Food Waste in the UK
Fortunately WRAP (wrap.org.uk) had undertaken a comprehensive study of food waste behaviours in 2008, which saved me a lot of time. WRAP undertook quantitative and qualitative research in several localities in England and Wales, looking at what and how much we throw away, and why. This encompassed surveys, interviews, contextual enquiry (observation) over several weeks, and even the weighing and categorising of waste from around 2000 households.

Nearly a fifth is avoidable
Examples of unavoidable food waste: tea bags, banana skins, bones, potato peelings. This is not clear cut and is to an extent culturally-dependent - for example, offal and tripe are considered as food by people in many other European countries and by older generations in the UK, but would be more likely viewed as unavoidable waste (“non-food”) by younger generations in the UK.

Why?
Top 3 reasons

70kg per person per year
The average per capita waste per year masks a large variance between one-person and multi-person households.
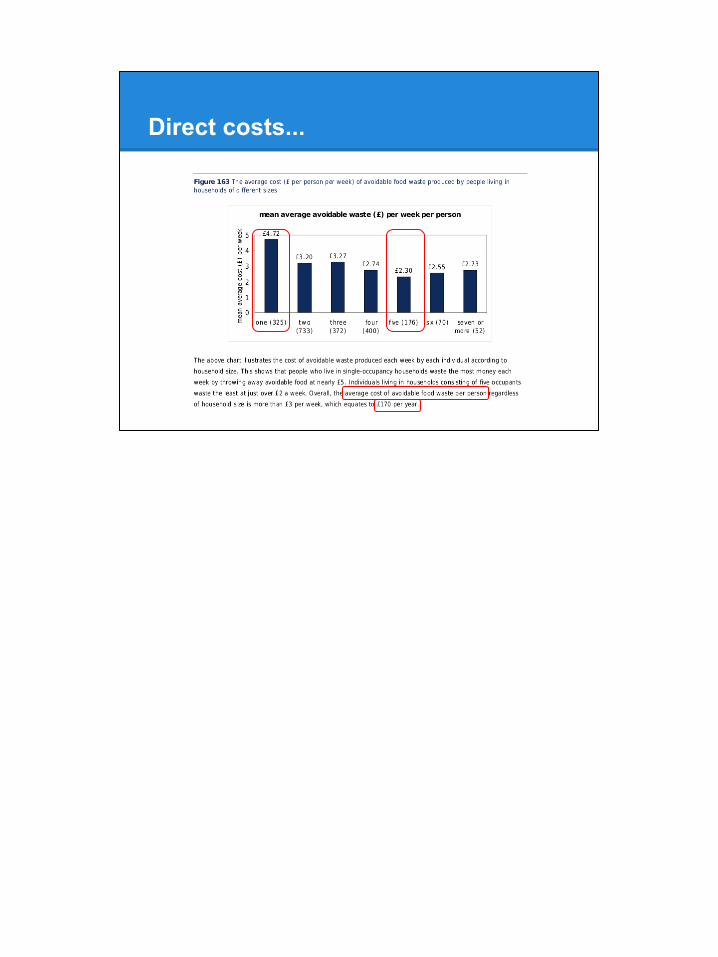
Direct costs...

... and indirect costs
● Financial○ Electricity: fridge/freezer○ Petrol: supermarket○ Council tax: refuse collection
● Environmental○ Pollution (air, water, land): agriculture, processing,
transport, retail, disposal○ Biodiversity: land use
● Social○ Food security: imports○ Malnourishment: higher prices and opportunity costs
I have inferred these costs (they are not mentioned in the report).

Lack of awareness
"We don’t realise how much we throw away. Even householders who are adamant that their household wastes no food at all are throwing away 88kg of avoidable food a year."

A familiar storyBut I don't like crusts!
Eugh! Mouldy potatoes!
Hmm...
USE BY:11-JUN-13
Translating the top 3 reasons for food waste into everyday experience.

An unfamiliar story...

The Rise and Fall of
Billy the Banana
Telling the story of food from the point of view of food, in this case the banana supply chain.

Topics:● Ecuador: climate, history, language & people● Agriculture: photosynthesis & insolation, water use, soil, pesticides,
insecticides● Economics: labour, mechanisation, free vs fair trade, cash crops● Individual stories: farmer and family

Topics:● Transport: roads, ports, vehicle types, fuel, insurance, fatalities● People: skills, languages, education● Climate change: emissions per banana per kilometre by truck and ship; effect
on agriculture in Ecuador and elsewhere● Oceans: currents, habitats, navigation● Individual stories: truck driver, crane operator, ship captain and crew

Topics:● Business: wholesale vs retail, intermediaries, volumes, profits, logistics,
packaging, marketing● Waste: volumes lost or discarded at each stage of supply chain

Topics:● Transport: emissions per banana per kilometre by car (compare to truck and
ship)● Biology: ripening signals

Topics:● Avoidable vs unavoidable waste● Recycling vs re-using

A sad ending!
Topics:● Waste management: people, costs, stages, landfill vs composting● Biology: micro-organisms, compost● Climate change: emissions● Food security● Starvation and malnourishment● Individual stories: refuse collector, recycling officer

15,000 bananas just like Billy are thrown away by UK families every day.
Please...
THINK BEFORE YOU THROW
15,000 is an uneducated guess!

Summary
1. Understand2. Design3. Build4. Demo5. Future Work6. Acknowledgements7. Q & A
How can we translate this knowledge into action?

Making the unremarkable remarkable
the humble bin the humble scales awareness
The kitchen bin is an easily overlooked mundane item, yet it connects us with people and systems across the globe.


Behaviour change
"Behavioral economics ... studies the effects of social, cognitive, and emotional factors on the economic decisions of individuals and institutions". [Source: Wikipedia]
The work pioneered by Kahneman and Tversky beginning in the 1970s has been popularised by other academics such as Dan Ariely.

We are influenced by:
Messenger - who tells us
Incentives - rules-of-thumb
Norms - what others do
Defaults - go with the flow
Salience - what's novel & relevant
Priming - subconscious cues
Affect - emotional associations
Commitment - public promises
Ego - feeling good about ourself
The MINDSPACE report applies the principles of behavioural economics - aka “nudge” - to public policy. Examples include tackling gang violence in Strathclyde and childhood obesity. MINDSPACE is a useful acronym.

Design
"Today one the leading-edge areas in which design can influence behaviour change is in relation to safeguarding the environment ... giving home-owners immediate and understandable visual feedback".
Jeremy Myerson, Helen Hamlyn Professor of Design, Royal College of Art
[Source: MINDSPACE 02 March 2010]
Designers have taken an interest recently in tackling social and environmental problems, sometimes applying ideas from behavioural economics. For example, the Design Council helped reduce violence against staff in A&E wards by working with the NHS to re-design waiting and treatment areas, patient-staff interactions and information provision.

We are influenced by:
Messenger -
Incentives
Norms - UK average
Defaults
Salience - twinkly lights
Priming
Affect - smiley faces
Commitment
Ego
We will use three main principles in this project:1. Social norms: we will show householders how they are doing compared to the
UK average based on WRAP’s estimated per capita avoidable food waste2. Salience: we will provide immediate visual feedback on or near the kitchen
food waste bin3. Affect: we will use smiley or sad faces to invoke an emotional response

Waste separation
Residents of Cambridge City and South Cambridgeshire District councils are required to separate food waste. Many residents have a separate bin for food waste in their kitchen.

Maths
Use a simple number to tell a complex story of global economics, politics and human values:
if > 0 : wasting more than per capita average
Notes:● 0.61 = 61% ["most of the food we throw away (4.1 million tonnes or 61%) is avoidable"]● 192 = 70,000g / 365 = 192 grammes ["on average, every one of us throws away 70kg of
avoidable food a year"]
The calculation gives a simple Boolean response to the question “is our household wasting more than the UK per capita average?”
● True (x > 0)● False (x <= 0)
We use WRAP’s estimates for the proportion of avoidable food waste (61%) and avoidable food waste per person per day (192 grammes). This masks variations in household size and habits.

Conceptual design:● Digital or analogue scales to weigh kitchen food waste bin● Google spreadsheet to capture data● Manual data entry via laptop, desktop and mobile devices - for own household
and others● Automatic data entry via USB weighing scales or equivalent● Google charts and APIs to visualise data● Google server-side scripting to share data via Facebook, Twitter ...etc
Questions:● How do we design for people with physical, sensory and cognitive
impairment? For example, people with dyslexia or arthritis.● How do we design for people whose first language is not English? Or for
people from other cultures where colours and symbols may have different meanings?

Summary
1. Understand2. Design3. Build4. Demo5. Future Work6. Acknowledgements7. Q & A

Google Spreadsheet
Using technical testing and usability testing, we develop the spreadsheet iteratively. This provides a good environment for rapid prototyping. We can check our calculations and experiment with different words, UI controls, colours and symbols.

Information visualisation
When we have some sample data we can experiment with different ways of visualising the data, again using usability testing to support or reject our assumptions.

Version 1: Arduino
Having developed a system for manual data entry, we can now build an automatic system. Version 1 used a laptop running Ubuntu to collect the data and control LEDs via Arduino to give immediate feedback (“salience”).

Version 2: Raspberry Pi
● UK schools● Python● "Internet of things"● USB postal scales
Version 2 replaces the laptop and Arduino with a Raspberry Pi. We use USB scales designed to weigh parcels and letters (cost approx £10 on Amazon UK), and we use an open-source C library to interface to the USB scales. We control LEDs using the GPIO library: green = wasting same or less than UK per capita average, red = wasting more. We save data to the Google spreadsheet over wifi using a one-line script (“the internet of things”).
The scripts are currently a mix of Bash, Perl and Python. The intention is to convert all scripts to Python, the main language taught in computer science classes in UK schools.

Summary
1. Understand2. Design3. Build4. Demo5. Future Work6. Acknowledgements7. Q & A
Full demo version: food bin, scales, LEDs, Raspberry Pi, Google spreadsheet. We start with an empty bin and sample every 10 seconds. The green LED is on and the spreadsheet shows a smiley face. We add potatoes, bananas ...etc to the bin, showing the change in weight on the spreadsheet and console window, until the green LED goes off and the red LED lights up, and a sad face appears in the spreadsheet.

Demo
tinyurl.com/fwh-niab-2013
Data from live demo at NIAB June 2013.

"Billy" take 2
We can now re-tell Billy’s story. In this version, we have a more sophisticated bin with the personality of a dog: a motion detector senses movement towards the bin, our 7-day moving average shows we are wasting more per capita than the UK average so the bin backs away and growls. This gives our adult character pause for thought and they look up on lovefoodhatewaste.com what to do with a brown banana. In the final frame, Billy brings joy to the children of the house by becoming their favourite dish: a banana split. A happy ending after all!
This shows that through design and technology we can become active participants in the story rather than just passive observers.

Summary
1. Understand2. Design3. Build4. Demo5. Future Work6. Acknowledgements7. Q & A

Potential Partners
● WRAP: Waste & Resources Action Programme
● Ellen MacArthur Foundation: Circular Economy
● Schools: storytelling, D&T, computer science, art, biology, history ...etc
● Local government: Landfill Tax, pay-as-you-throw, national and international targets
● CSR: Tesco, M&S, Pret-a-Manger

Questions
● Purpose of food?○ nutrition○ social bonds ("quality time")○ dieting○ fads (superfoods/celebrity chefs)○ 5-a-day
● Not segmenting by number in household - problem of the "mean" (report fig. 163)
● Simplify for schools: spreadsheet + kitchen scales

Design challenges
Questions:● What do colours mean to people in the UK in this context? For example:
○ Action: green = go, red = stop○ Emotion: orange = happy, blue = sad○ Environment: green = good, yellow = bad?
● What do colours mean in other countries? For example, red in China is the colour of good luck.
● How do we weigh bin if it’s attached to a door? ● How can we make the bin part of a wider digital ecosystem, including mobile
apps and other IoT devices?

Reality is messy
We need to design for a challenging physical environment!

Summary
1. Understand2. Design3. Build4. Demo5. Future Work6. Acknowledgements7. Q & A

AcknowledgementsMINDSPACE: Influencing behaviour through public policy - Paul Dolan, Michael Hallsworth, David Halpern, Dominic King, Ivo Vlaev (02 March 2010)http://www.instituteforgovernment.org.uk/publications/mindspace
The Food We Waste http://news.bbc.co.uk/1/shared/bsp/hi/pdfs/foodwewaste_fullreport08_05_08.pdfUpdates: www.wrap.org.uk
Thank you David
