food texture and perception - wsu dissertations - washington state
TRANSCRIPT

FOOD TEXTURE AND PERCEPTION
By
MAITE ANDREA CHAUVIN
A dissertation submitted in partial fulfillment of
the requirements for the degree of
DOCTOR OF PHILOSOPHY IN FOOD SCIENCE
WASHINGTON STATE UNIVERSITY
Department of Food Science and Human Nutrition
DECEMBER 2007
To the Faculty of Washington State University
The members of the Committee appointed to examine the dissertation of MAITE
ANDREA CHAUVIN find it satisfactory and recommend that it be accepted
______________________________ Chair ______________________________ Co-Chair ______________________________ ______________________________
ii
ACKNOWLEDGMENTS
I would like to take the opportunity to acknowledge and thank all those who have
helped me in any way through this research I wish to thank my advisor Dr Barry G
Swanson and the other members of my committee Drs Carolyn Ross Stephanie Clark
and Craig Parks for their time support expertise encouragement advice and confidence
while I worked towards my doctorate degree
In addition I would like to express my sincere appreciation to the following
bull My husband and parents for their support encouragement and love
bull Frank Younce for your friendship help and suggestions in my research Thank
you for always being there when I needed you
bull Tina Plotka Mike Costello and Karen Weller for their continuous support in the
lab
bull The office personnel for answering all my questions (Jodi Richard Carolee and
Marsha)
bull All graduate students for their love and encouragement throughout the PhD
program
It has been great working with all of you
iii
FOOD TEXTURE AND PERCEPTION
Abstract
by Maite Andrea Chauvin PhD
Washington State University
December 2007
Chair Barry G Swanson
Co-Chair Carolyn Ross
The most complete system of sensory texture determination is the General Foods
Sensory Texture Profiling Technique (Brandt et al 1963 Szczesniak et al 1963) The
first objective of the current research was to validate through a multidimensional (MDS)
representation the standard texture scales presented for select foods in the General Foods
Sensory Texture Profiling Technique MDS is highly instructive in quantitatively
assessing the perceptions of naive panelistsrsquo qualitative textural differences of food as
well as a good statistical instrument to graphically validate existing food texture scales
The selected textures of standard foods were rated similarly using MDS and food
standard texture scales
The second objective was to study the sensory textural attributes of apples and
pears and the relationships between human sensory perception instrumental firmness
and tensile material properties of apples and pears Significant correlations were
observed among the sensory texture attributes of crispness firmness and fracturability for
iv
apples and pears (r gt 088) Differences in juiciness perception of apples and pears were
attributed to differences in cell structure When correlating sensory to instrumental
determinations the Sinclair iQtrade System texture assessment tool provided acceptable
correlations of apple firmness (r = 079 to 082) Guss pressure sensor provided
significant correlations of apple (r = 078 to 083) and pear (r = 083) firmness Tensile
determinations predicted crispness in apples (r = 088) and pears (r = 085) well
The third objective was to establish a standard texture scale for dry and wet crisp
crunchy and crackly foods The relationship between acoustical and oral sensation of
crispness crunchiness and crackliness of selected standard foods was also evaluated A
consumer study of the newly developed texture scales was validated through MDS The
developed standard scales for crispness crunchiness and crackliness for dry and wet
foods provide individuals interested in auditory texture evaluation a starting point to
assist in training panelists in descriptive analysis of food texture MDS output
demonstrated that crispness crunchiness and crackliness are distinguishable sensory
texture attributes that belong to selected discernible concepts and may be accurately
recognized by the sole presence of auditory cues
v
TABLE OF CONTENTS
ACKNOWLEDGEMENTShelliphelliphelliphelliphelliphelliphelliphelliphelliphelliphelliphelliphelliphelliphelliphelliphelliphelliphelliphelliphelliphelliphelliphellipiii
ABSTRACThelliphelliphelliphelliphelliphelliphelliphelliphelliphelliphelliphelliphelliphelliphelliphelliphelliphelliphelliphelliphelliphelliphelliphelliphelliphelliphelliphelliphellipiv
LIST OF TABLEShelliphelliphelliphelliphelliphelliphelliphelliphelliphelliphelliphelliphelliphelliphelliphelliphelliphelliphelliphelliphelliphelliphelliphelliphelliphellipix
LIST OF FIGUREShelliphelliphelliphelliphelliphelliphelliphelliphelliphelliphelliphelliphelliphelliphelliphelliphelliphelliphelliphelliphelliphelliphelliphelliphelliphellipxii
DEDICATIONhelliphelliphelliphelliphelliphelliphelliphelliphelliphelliphelliphelliphelliphelliphelliphelliphelliphelliphelliphelliphelliphelliphelliphelliphelliphelliphellipxiv
1 INTRODUCTION
LITERATURE REVIEW
1 Texturehelliphelliphelliphelliphelliphelliphelliphelliphelliphelliphelliphelliphelliphelliphelliphelliphelliphelliphelliphelliphelliphelliphelliphellip1
2 Texture Profile Analysis and Standard Scales of Texturehelliphelliphelliphellip2
3 Multidimensional Scalinghelliphelliphelliphelliphelliphelliphelliphelliphelliphelliphelliphelliphelliphelliphelliphelliphellip6
4 Texture of Fresh Fruithelliphelliphelliphelliphelliphelliphelliphelliphelliphelliphelliphelliphelliphelliphelliphelliphelliphellip9
41 Fruit Texturehelliphelliphelliphelliphelliphelliphelliphelliphelliphelliphelliphelliphelliphelliphelliphelliphelliphelliphelliphelliphellip9
42 Fruit Anatomyhelliphelliphelliphelliphelliphelliphelliphelliphelliphelliphelliphelliphelliphelliphelliphelliphelliphelliphelliphellip9
43 Food-Mouth Interactionshelliphelliphelliphelliphelliphelliphelliphelliphelliphelliphelliphelliphelliphelliphellip12
44 Consumer Awareness and Reasons to Determine Texture in Fruit
helliphelliphelliphelliphelliphelliphelliphelliphelliphelliphelliphelliphelliphelliphelliphelliphelliphelliphelliphelliphelliphelliphelliphelliphelliphellip12
45 Methods of Determining Texture in Fruithelliphelliphelliphelliphelliphelliphelliphelliphellip13
46 Relationship of Instrumental and Sensory Determinations of
Texturehelliphelliphelliphelliphelliphelliphelliphelliphelliphelliphelliphelliphelliphelliphelliphelliphelliphelliphelliphelliphelliphellip16
5 Sensory Perception of Crisp Crunchy and Crackly Textureshelliphelliphellip17
51 Structural Properties of Food with an Auditory Componenthelliphellip17
52 Perception of Soundhelliphelliphelliphelliphelliphelliphelliphelliphelliphelliphelliphelliphelliphelliphelliphelliphellip18
vi
53 Sensory Studieshelliphelliphelliphelliphelliphelliphelliphelliphelliphelliphelliphelliphelliphelliphelliphelliphelliphelliphellip19
54 Acoustic Studieshelliphelliphelliphelliphelliphelliphelliphelliphelliphelliphelliphelliphelliphelliphelliphelliphelliphelliphellip24
6 Referenceshelliphelliphelliphelliphelliphelliphelliphelliphelliphelliphelliphelliphelliphelliphelliphelliphelliphelliphelliphelliphelliphelliphellip28
2 MULTIDIMENSIONAL REPRESENTATION OF THE STANDARD
SCALES OF FOOD TEXTURE
1 Abstracthelliphelliphelliphelliphelliphelliphelliphelliphelliphelliphelliphelliphelliphelliphelliphelliphelliphelliphelliphelliphelliphelliphelliphellip38
2 Introductionhelliphelliphelliphelliphelliphelliphelliphelliphelliphelliphelliphelliphelliphelliphelliphelliphelliphelliphelliphelliphelliphelliphellip40
3 Materials and Methodshelliphelliphelliphelliphelliphelliphelliphelliphelliphelliphelliphelliphelliphelliphelliphelliphelliphellip43
4 Results and Discussionshelliphelliphelliphelliphelliphelliphelliphelliphelliphelliphelliphelliphelliphelliphelliphelliphellip46
5 Conclusionshelliphelliphelliphelliphelliphelliphelliphelliphelliphelliphelliphelliphelliphelliphelliphelliphelliphelliphelliphelliphelliphelliphellip50
6 Tables and Figureshelliphelliphelliphelliphelliphelliphelliphelliphelliphelliphelliphelliphelliphelliphelliphelliphelliphelliphelliphellip51
7 Referenceshelliphelliphelliphelliphelliphelliphelliphelliphelliphelliphelliphelliphelliphelliphelliphelliphelliphelliphelliphelliphelliphelliphellip60
3 RELATIONSHIP BETWEEN INSTRUMENTAL AND SENSORY
DETERMINATION OF APPLE AND PEAR TEXTURE
1 Abstracthelliphelliphelliphelliphelliphelliphelliphelliphelliphelliphelliphelliphelliphelliphelliphelliphelliphelliphelliphelliphelliphelliphelliphellip64
2 Introductionhelliphelliphelliphelliphelliphelliphelliphelliphelliphelliphelliphelliphelliphelliphelliphelliphelliphelliphelliphelliphelliphelliphellip65
3 Materials and Methodshelliphelliphelliphelliphelliphelliphelliphelliphelliphelliphelliphelliphelliphelliphelliphelliphelliphellip68
4 Results and Discussionshelliphelliphelliphelliphelliphelliphelliphelliphelliphelliphelliphelliphelliphelliphelliphelliphellip73
5 Conclusionshelliphelliphelliphelliphelliphelliphelliphelliphelliphelliphelliphelliphelliphelliphelliphelliphelliphelliphelliphelliphelliphelliphellip80
6 Tables and Figureshelliphelliphelliphelliphelliphelliphelliphelliphelliphelliphelliphelliphelliphelliphelliphelliphelliphelliphelliphellip81
7 Referenceshelliphelliphelliphelliphelliphelliphelliphelliphelliphelliphelliphelliphelliphelliphelliphelliphelliphelliphelliphelliphelliphelliphellip97
vii
4 STANDARD SCALES FOR CRISPNESS CRACKLINESS AND
CRUNCHINESS IN DRY AND WET FOODS RELATIONSHIP WITH
ACOUSTICAL DETERMINATIONS
1 Abstracthelliphelliphelliphelliphelliphelliphelliphelliphelliphelliphelliphelliphelliphelliphelliphelliphelliphelliphelliphelliphelliphelliphellip101
2 Introductionhelliphelliphelliphelliphelliphelliphelliphelliphelliphelliphelliphelliphelliphelliphelliphelliphelliphelliphelliphelliphelliphellip103
3 Materials and Methodshelliphelliphelliphelliphelliphelliphelliphelliphelliphelliphelliphelliphelliphelliphelliphelliphelliphellip106
4 Results and Discussionshelliphelliphelliphelliphelliphelliphelliphelliphelliphelliphelliphelliphelliphelliphelliphelliphellip112
5 Conclusionshelliphelliphelliphelliphelliphelliphelliphelliphelliphelliphelliphelliphelliphelliphelliphelliphelliphelliphelliphelliphelliphellip118
6 Tables and Figureshelliphelliphelliphelliphelliphelliphelliphelliphelliphelliphelliphelliphelliphelliphelliphelliphelliphelliphellip119
7 Referenceshelliphelliphelliphelliphelliphelliphelliphelliphelliphelliphelliphelliphelliphelliphelliphelliphelliphelliphelliphelliphelliphelliphellip139
5 CONCLUSIONS AND FUTURE WORK
1 Conclusionshelliphelliphelliphelliphelliphelliphelliphelliphelliphelliphelliphelliphelliphelliphelliphelliphelliphelliphelliphelliphelliphellip144
2 Future Workhelliphelliphelliphelliphelliphelliphelliphelliphelliphelliphelliphelliphelliphelliphelliphelliphelliphelliphelliphelliphelliphellip146
viii
LIST OF TABLES
Chapter 1
1 Definitions of crispnesshelliphelliphelliphelliphelliphelliphelliphelliphelliphelliphelliphelliphelliphelliphelliphelliphelliphelliphelliphellip20
2 Definitions of crunchinesshelliphelliphelliphelliphelliphelliphelliphelliphelliphelliphelliphelliphelliphelliphelliphelliphelliphelliphellip22
3 Definitions of cracklinesshelliphelliphelliphelliphelliphelliphelliphelliphelliphelliphelliphelliphelliphelliphelliphelliphelliphelliphellip23
Chapter 2
1 Standard scales of texturehelliphelliphelliphelliphelliphelliphelliphelliphelliphelliphelliphelliphelliphelliphelliphelliphelliphelliphellip51
2 Definitions of the textural attributes of hardness chewiness viscosity
gumminess adhesiveness and fracturabilityhelliphelliphelliphelliphelliphelliphelliphelliphelliphelliphelliphellip52
3 MDS stress and R2 for paired comparisons of texture scaleshelliphelliphelliphelliphelliphellip53
4 Standard hardness scalehelliphelliphelliphelliphelliphelliphelliphelliphelliphelliphelliphelliphelliphelliphelliphelliphelliphelliphelliphellip54
5 Standard viscosity scalehelliphelliphelliphelliphelliphelliphelliphelliphelliphelliphelliphelliphelliphelliphelliphelliphelliphelliphelliphellip55
6 Standard adhesiveness scalehelliphelliphelliphelliphelliphelliphelliphelliphelliphelliphelliphelliphelliphelliphelliphelliphelliphellip56
7 Standard fracturability scalehelliphelliphelliphelliphelliphelliphelliphelliphelliphelliphelliphelliphelliphelliphelliphelliphelliphellip57
8 Standard gumminess scalehelliphelliphelliphelliphelliphelliphelliphelliphelliphelliphelliphelliphelliphelliphelliphelliphelliphelliphellip58
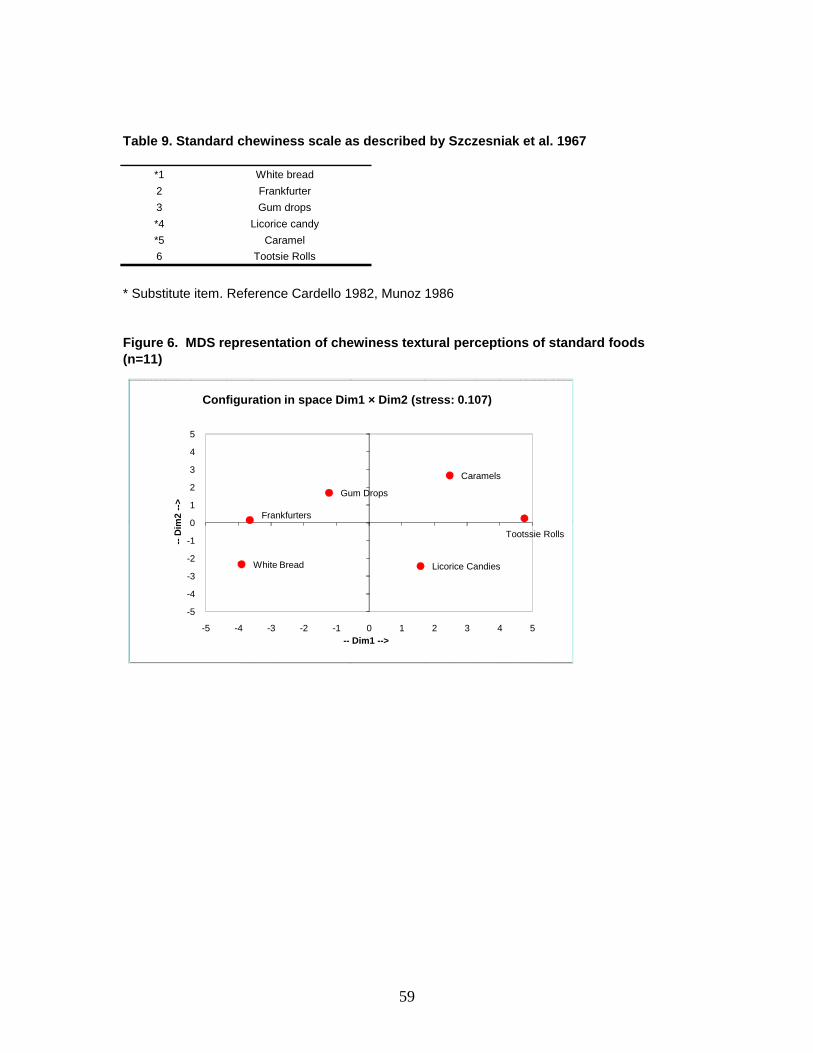
9 Standard chewiness scalehelliphelliphelliphelliphelliphelliphelliphelliphelliphelliphelliphelliphelliphelliphelliphelliphelliphelliphelliphellip59
Chapter 3
1 Apple and pear texture attributes and descriptors as evaluated by the texture
panelhelliphelliphelliphelliphelliphelliphelliphelliphelliphelliphelliphelliphelliphelliphelliphelliphelliphelliphelliphelliphelliphelliphelliphelliphelliphelliphellip82
2 Texture standards used for the evaluation of texture sensory attributeshelliphellip83
3 Sensory texture profiling technique for apples and pearshelliphelliphelliphelliphelliphelliphellip84
ix
4 Two way ANOVA for sensory analysis of apple texture by the trained panel in 2005
and 2006helliphelliphelliphelliphelliphelliphelliphelliphelliphelliphelliphelliphelliphelliphelliphelliphelliphelliphelliphelliphellip85
5 Two way ANOVA for sensory analysis of pear texture by the trained panel in 2006
helliphelliphelliphelliphelliphelliphelliphelliphelliphelliphelliphelliphelliphelliphelliphelliphelliphelliphelliphelliphelliphelliphelliphelliphelliphelliphelliphelliphelliphelliphelliphelliphellip86
6 One way ANOVA for instrumental analysis of apples in 2005 and 2006helliphelliphellip87
7 One way ANOVA for instrumental analysis of pears in 2006helliphelliphelliphelliphelliphellip88
8 Correlation matrix of sensory texture attributes of apples for 2005 and
200689
9 Correlation matrix of sensory texture attributes of pears for 2006helliphelliphelliphellip90
10 Correlation matrix on sensory attributes and instrumental determinations of
apples for 2005 and 2006helliphelliphelliphelliphelliphelliphelliphelliphelliphelliphelliphelliphelliphelliphelliphelliphelliphelliphelliphellip91
11 Correlation matrix of sensory attributes and instrumental determinations of
pears for 2006helliphelliphelliphelliphelliphelliphelliphelliphelliphelliphelliphelliphelliphelliphelliphelliphelliphelliphelliphelliphelliphelliphelliphellip92
Chapter 4
1 Literature citations of crispnesshelliphelliphelliphelliphelliphelliphelliphelliphelliphelliphelliphelliphelliphelliphelliphelliphellip119
2 Literature citation of crunchinesshelliphelliphelliphelliphelliphelliphelliphelliphelliphelliphelliphelliphelliphelliphelliphellip121
3 Literature citations of cracklinesshelliphelliphelliphelliphelliphelliphelliphelliphelliphelliphelliphelliphelliphelliphelliphellip123
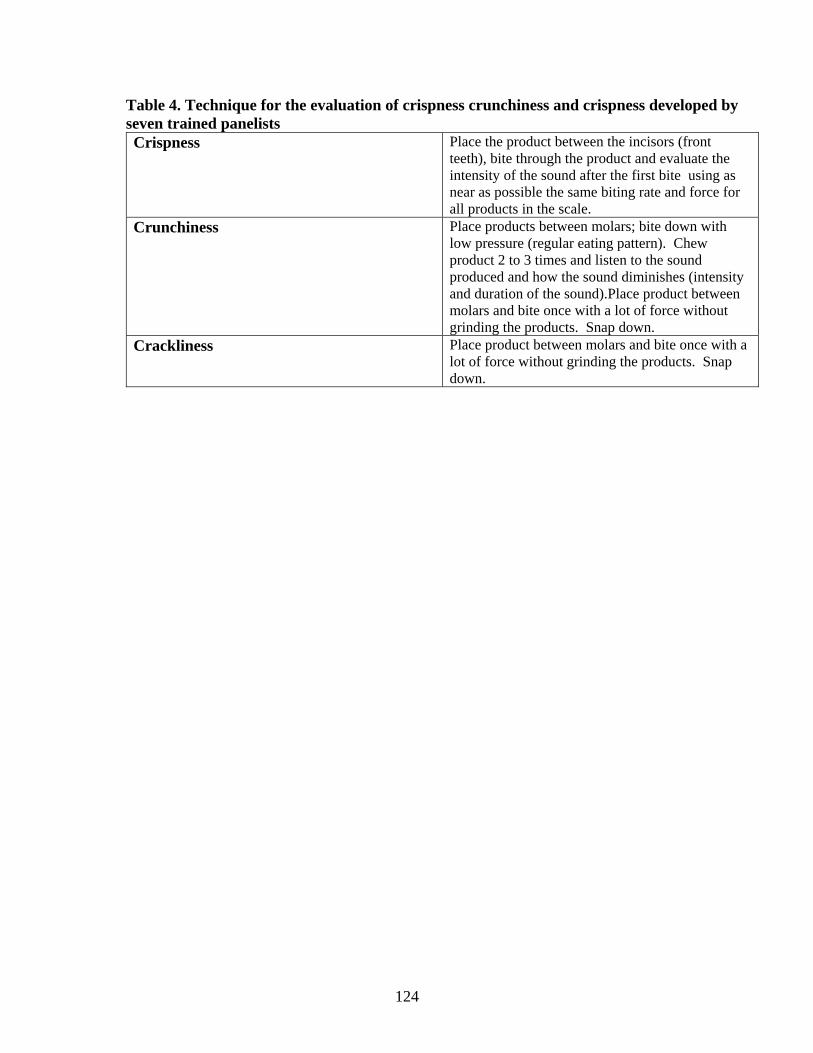
4 Technique for the evaluation of crispness crunchiness and crispness
developed by seven trained panelistshelliphelliphelliphelliphelliphelliphelliphelliphelliphelliphelliphelliphelliphelliphellip124
5 Crispness standard scale for dry foods developed by seven trained panelists
helliphelliphelliphelliphelliphelliphelliphelliphelliphelliphelliphelliphelliphelliphelliphelliphelliphelliphelliphelliphelliphelliphelliphelliphelliphelliphelliphelliphelliphellip125
6 Crispness standard scale for wet foods developed by seven trained panelists
helliphelliphelliphelliphelliphelliphelliphelliphelliphelliphelliphelliphelliphelliphelliphelliphelliphelliphelliphelliphelliphelliphelliphelliphelliphelliphelliphelliphelliphellip126
x
7 Crunchiness standard scale for dry foods developed by seven trained
panelistshelliphelliphelliphelliphelliphelliphelliphelliphelliphelliphelliphelliphelliphelliphelliphelliphelliphelliphelliphelliphelliphelliphelliphelliphelliphellip127
8 Crunchiness standard scale for wet foods developed by seven trained
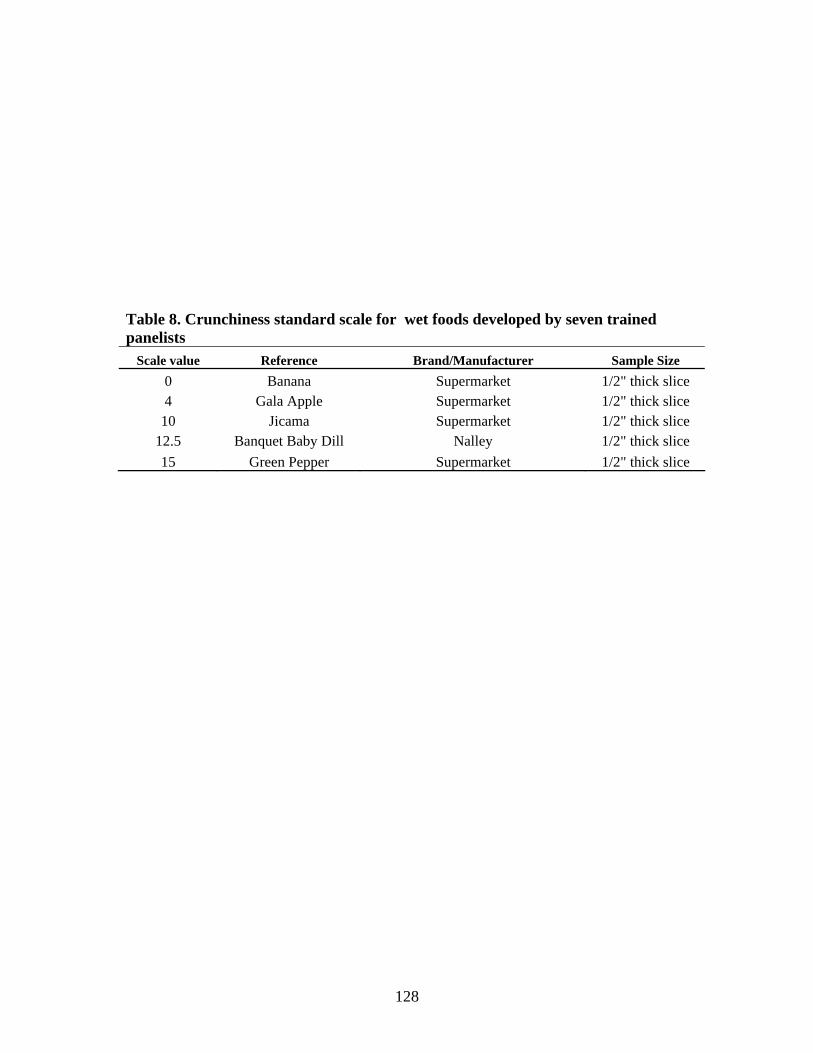
panelistshelliphelliphelliphelliphelliphelliphelliphelliphelliphelliphelliphelliphelliphelliphelliphelliphelliphelliphelliphelliphelliphelliphelliphelliphelliphellip128
9 Crackliness standard scale for dry foods developed by seven trained panelists
helliphelliphelliphelliphelliphelliphelliphelliphelliphelliphelliphelliphelliphelliphelliphelliphelliphelliphelliphelliphelliphelliphelliphelliphelliphelliphelliphelliphelliphellip129
10 Crackliness standard scale for wet foods developed by seven trained
panelistshelliphelliphelliphelliphelliphelliphelliphelliphelliphelliphelliphelliphelliphelliphelliphelliphelliphelliphelliphelliphelliphelliphelliphelliphelliphellip130
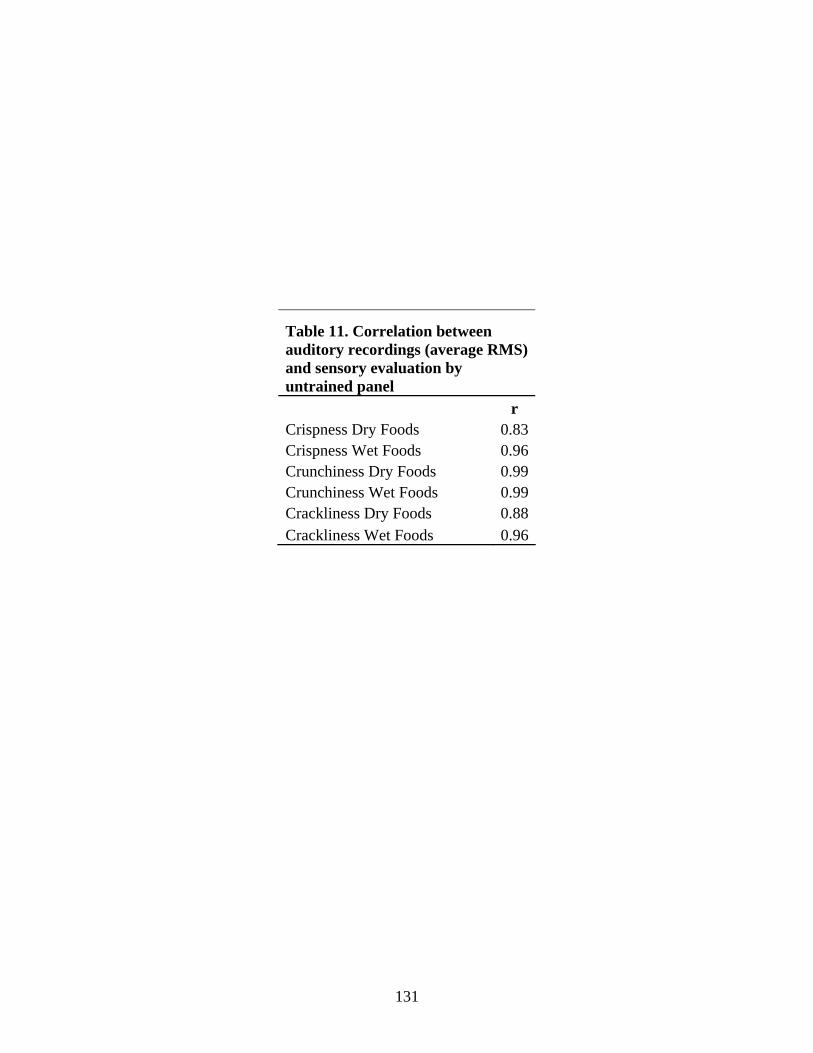
11 Correlation between auditory recordings (average RMS) and sensory
evaluation by untrained panelhelliphelliphelliphelliphelliphelliphelliphelliphelliphelliphelliphelliphelliphelliphelliphelliphellip131
xi
LIST OF FIGURES
Chapter 1
1 Procedures for evaluating texturehelliphelliphelliphelliphelliphelliphelliphelliphelliphelliphelliphelliphelliphelliphelliphellip5
Chapter 2
1 MDS representation of hardness textural perceptions of food as evaluated by
eleven panelistshelliphelliphelliphelliphelliphelliphelliphelliphelliphelliphelliphelliphelliphelliphelliphelliphelliphelliphelliphelliphelliphelliphellip54
2 MDS representation of viscosity textural perceptions of food as evaluated by
eleven panelistshelliphelliphelliphelliphelliphelliphelliphelliphelliphelliphelliphelliphelliphelliphelliphelliphelliphelliphelliphelliphelliphelliphellip55
3 MDS representation of adhesiveness textural perceptions of food as evaluated
by eleven panelistshelliphelliphelliphelliphelliphelliphelliphelliphelliphelliphelliphelliphelliphelliphelliphelliphelliphelliphelliphelliphelliphellip56
4 MDS representation of fracturability textural perceptions of food as evaluated
by eleven panelistshelliphelliphelliphelliphelliphelliphelliphelliphelliphelliphelliphelliphelliphelliphelliphelliphelliphelliphelliphelliphelliphellip57
5 MDS representation of gumminess textural perceptions of food as evaluated
by eleven panelistshelliphelliphelliphelliphelliphelliphelliphelliphelliphelliphelliphelliphelliphelliphelliphelliphelliphelliphelliphelliphelliphellip58
6 MDS representation of chewiness textural perceptions of food as evaluated
by eleven panelistshelliphelliphelliphelliphelliphelliphelliphelliphelliphelliphelliphelliphelliphelliphelliphelliphelliphelliphelliphelliphelliphellip59
Chapter 3
1 Apple firmness effect on sensory texture attributes for 2005 and 2006 harvest
yearshelliphelliphelliphelliphelliphelliphelliphelliphelliphelliphelliphelliphelliphelliphelliphelliphelliphelliphelliphelliphelliphelliphelliphelliphelliphelliphelliphellip93
2 Apple differentiation soft intermediate and hard apple firmness for 2005 and
xii
2006 combined harvest yearshelliphelliphelliphelliphelliphelliphelliphelliphelliphelliphelliphelliphelliphelliphelliphelliphelliphellip94
3 Pear firmness effect on sensory texture attributes for 2006 harvest yearhellip95
4 Pear differentiation of soft intermediate and hard pear firmness for 2006
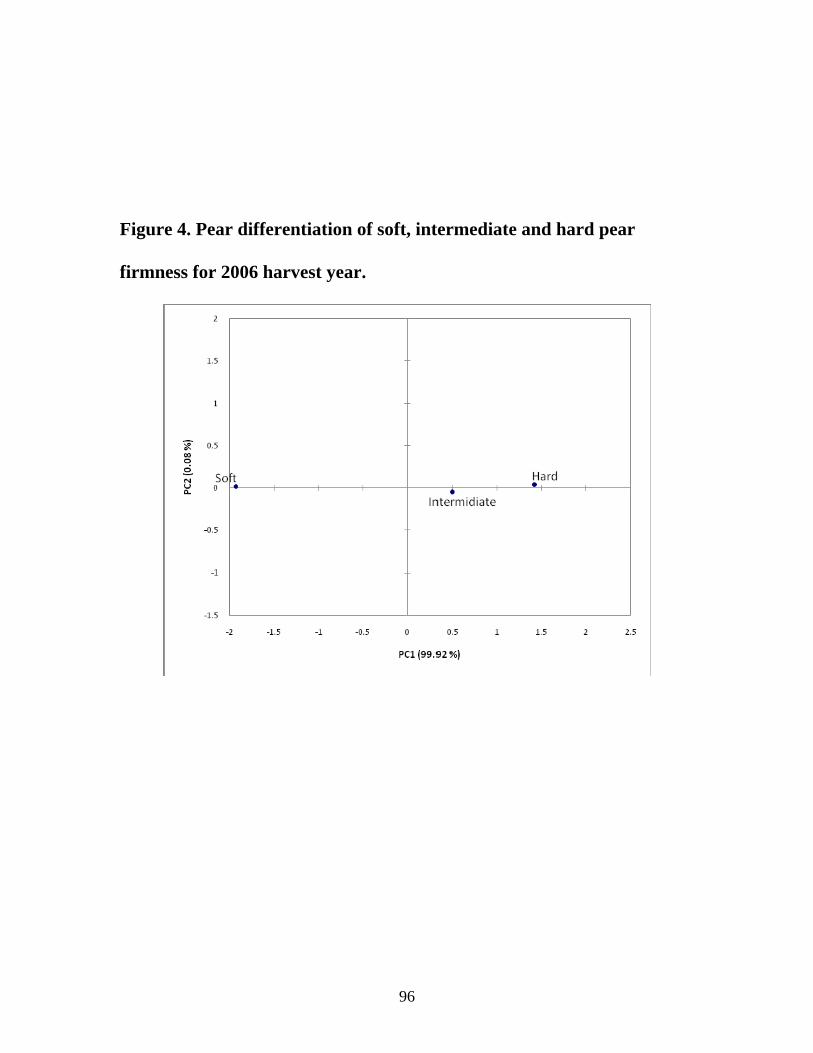
harvest yearhelliphelliphelliphelliphelliphelliphelliphelliphelliphelliphelliphelliphelliphelliphelliphelliphelliphelliphelliphelliphelliphelliphelliphellip96
Chapter 4
1 MDS representation of auditory crispness for dry foodshelliphelliphelliphelliphelliphelliphellip132
2 MDS representation of auditory crispness for wet foodshelliphelliphelliphelliphelliphelliphellip133
3 MDS representation for auditory crunchiness for dry foodshelliphelliphelliphelliphelliphellip134
4 MDS representation of auditory crunchiness for wet foodshelliphelliphelliphelliphelliphellip135
5 MDS representation of auditory crackliness for dry foodshelliphelliphelliphelliphelliphellip136
6 MDS representation of auditory crackliness for wet foodshelliphelliphelliphelliphelliphellip137
7 MDS representation for overall auditory crispness crunchiness and
crackliness for dry and wet foodshelliphelliphelliphelliphelliphelliphelliphelliphelliphelliphelliphelliphelliphelliphelliphellip138
xiii
DEDICATION
This work is dedicated to my husband Fariss for his patience love and care I
also dedicate my work to my parents for their encouragement and endless support
My mother drew a distinction between achievement and success She said that
achievement is the knowledge that you have studied and worked hard and done the best
that is in you Success is being praised by others and thats nice too but not as
important or satisfying Always aim for achievement and forget about success
By Helen Hayes (1900 - 1993)
xiv
Chapter One
INTRODUCTION
LITERATURE REVIEW
The following literature review is organized in association with each chapter
1 Texture
Texture in food is difficult to define for many scientists since texture means
different things to different people Muller (1969) claimed that the term texture may be
discarded because is confusing Muller (1969) suggested that texture terminology usage
may be divided into two terms in place of the word texture ldquorheologyrdquo defining the
physical properties of food and ldquohaptaesthesisrdquo defining the perceptions of the
mechanical behavior of materials
Szczesniak (1990) wrote ldquotexture can be defined as a sensory manifestation of the
structure of the food and the manner in which this structure reacts to applied forces the
specific senses involved being vision kinesthetics and hearingrdquo The International
Organization for Standardization (Standard 5492 1992) wrote ldquoTexture is a noun that
comprises all the mechanical (geometrical and surface) attributes of a food product
perceptible by means of mechanical tactile and where appropriate visual and auditory
receptorsrdquo The British Standards Organization (No 5098) defines texture as ldquothe
attribute resulting from a combination of physical properties perceived by the senses of
kinesthesis touch (including mouth feel sight and hearing) The properties may include
size shape number nature and conformation of constituent structural elementsrdquo Other
authors such as Bourne (2002) stated ldquothe textural properties of a food are that group of
1
physical characteristics that arise from the structural elements of the food are sensed
primarily by the feeling of touch are related to the deformation disintegration and flow
of the food under a force and are measured objectively by functions of mass time and
distancerdquo
2 Texture Profile Analysis and Standard Scales of Texture
The texture profile panel is a powerful instrument that can reliably determine the
textural attributes of food products The texture profile panel allows investigators to
relate the way the food behaves in the mouth rather than only obtaining selected chemical
and physical properties of food The use of standard terminology standard reference
foods and standard evaluation procedures in texture profile methods makes texture
profile panels great objective assessing tools of sensory data (Civille and Szczesniak
1973) The texture profile method is widely used for many applications in the food
industry including food product development and quality assurance (Civille and
Szczesniak 1973)
The sensory texture profile method was developed from the A D Little Flavor
Profile Method as a protocol based on the order of appearance of texture attributes
(Brandt et al 1963) The order of appearance relates to the chronological order in
which the various attributes of foods are perceived (General Foods Corp 1967) A
texture profile is defined as ldquothe sensory analysis of the texture complex of a food in
terms of its mechanical geometrical fat and moisture characteristics the degree of each
present and the order in which they appear from first bite to complete masticationrdquo
(Brandt et al 1963)
2
The texture profile analysis requires a panel of judges with prior knowledge of the
texture classification system use of standard rating scales and appropriate panel
procedures with regards to the mechanics of testing and food presentation (Brandt et al
1963)
Szczesniak (1963) classified texture attributes in three categories First are the
mechanical characteristics related to the reaction of food to stress Second are the
geometrical characteristics related to the shape size and arrangement of particles within
a food Finally are other characteristics related to the moisture and fat content
The standard rating scales provide a method of correlating sensory and
instrumental (texturometer) evaluations of texture (General Foods Corp 1967) A
trained sensory panel includes practice in the use of scales to reinforce the perception of
the mechanical and geometrical characteristics of food Standard scales are developed to
identify each of the mechanical characteristics of texture hardness fracturability
chewiness gumminess viscosity and adhesiveness and provide a defined quantitative
method of texture evaluation (Szczesniak 1963) The standard scales represent the full
range of a specific mechanical parameter as it is encountered in foods (Civille and
Szczesniak 1973) Geometrical characteristics are difficult to classify in a specific
scale There are however two general groups of geometrical characteristics geometrical
characteristics related to the size and shape of the particles such as gritty grainy or
coarse and geometrical characteristics related to the particle shape and orientation such
as fibrous cellular or crystalline Evaluation of the geometrical characteristics of foods
is qualitative and semi-quantitative Geometrical characteristics are evaluated as to type
and amount present Standard scales help panelists build confidence and provide
3
practice in perception and discrimination during the training process (General Foods
Corp 1967)
In texture profiling it is necessary to standardize the technique of determination
handling and presentation of the foods Each panelist must evaluate the foods in
identical manner and the replicate foods presented to panelists must be reproducible
(Civille and Szczesniak 1973) The first bite or initial phase encompasses the
mechanical characteristics of hardness fracturability viscosity and any geometrical
characteristics observed initially The second or masticatory phase encompasses the
mechanical characteristics of gumminess chewiness adhesiveness and any geometrical
characteristics observed during chewing The third or residual phase encompasses
changes induced in the mechanical and geometrical characteristics through mastication
(General Foods Corp 1967) Procedures for evaluating texture are presented in Figure
1
4
Masticatory (Perceived During Chewing)
Mechanical (gumminess chewiness and
adhesiveness)
Geometrical (any depending upon food
structure)
Initial (Perceived on First Bite)
Mechanical (viscosity hardness and
brittleness)
Geometrical (any depending upon food
structure)
Residual (Changes During Mastication)
Rate and type of breakdown moisture absorption and mouthcoating
Figure 1 Procedures for evaluating Texture (Brandt et al 1963)
5
The consistency of the panel performance will depend on three factors the
reliability of the trained panel as a whole to reproduce the whole panel findings from one
evaluation to another the ability of an individual panelist to replicate the panelistsrsquo
findings from one evaluation to another and the ability of the panelists to agree with one
another The panel performance can be determined through the use of blind controls and
duplicate samples regular review of panel results and the presence of a good panel
leader (Civille and Szczesniak 1973)
The texture profile method is used to characterize sensory textural attributes of
fruits Paoletti et al (1993) used a modified version of the texture profile method on
selected apple cultivars to characterize textural attributes such as firmness fracturability
cohesiveness juiciness and mealiness and relate them to the mechanical properties of
fruit Abbott et al (1994) investigated apple texture using sensory data evaluated as
crisp hard tough mealy spongy and juicy and developed a relationship with a modified
version of the Instron texture profile analysis Diehl and Hamann (1979) used texture
profile analyses to characterize the sensory properties of raw potatoes melons and apples
and related them with uniaxial compression and torsion methods
3 Multidimensional Scaling
Multidimensional scaling (MDS) is a set of techniques designed for the statistical
analysis of the degree of similarity or dissimilarity of experimental data on a set of
objects (Borg and Groenen 1997) MDS mathematical techniques enable a scientist to
discover the ldquohidden structurerdquo of data MDS calculations use proximities among
objects of any kind as input
6
A proximity is a number that predicts perception of similarity or difference
between two objects (Kruskal and Wish 1978) MDS techniques represent objects
judged as similar to one another as points close to each other in a resultant spatial map
Objects judged as dissimilar are represented as points distant from one another in a
spatial map (Schiffman et al 1981) The MDS graphical representation or spatial map
allows the data analyst to interpret the data and explore panelistsrsquo perceptions visually
(Borg and Groenen 1997)
A common procedure for obtaining proximities data is to ask individuals to
directly judge the ldquopsychological distancerdquo among stimulus objects To discover rather
than impose the dimensions the attributes on which the stimuli are judged are usually not
specified (Kruskal and Wish 1978)
An advantage of MDS procedures is the small experimenter contamination
Panelists do not require prior knowledge of the attribute of the stimuli evaluated MDS
data provide a special context that reveals dimensions relevant to the subjects (Schiffman
et al 1981) Another advantage of MDS is its wide functionality MDS represents
similarity or dissimilarity data as distances in low-dimensional space to make data
accessible to visual inspection and exploration MDS is used as a technique allowing the
experimenter to test if and how certain criteria by which the experimenter can distinguish
among different objects of interest are mirrored in corresponding empirical similarities or
differences of these objects MDS is also a data-analytic approach that allows
discovering dimensions that underlie judgments of similarity or dissimilarity
The primary disadvantage of MDS is that such analytical techniques are often
time consuming and expensive (Schiffman et al 1981) A number of researchers have
7
explored alternative data collection procedures for MDS modeling some of which are
less time consuming and fatiguing than pairwise similarity ratings Alternative data
collection procedures include sorting data and confusion measures (Lawless et al 1995)
MDS calculations are complex and are difficult to perform without the aid of a
computer A variety of computational programs are used (Kruskal and Wish 1978)
Each program is capable of performing a wide variety of analyses all of which are
generically known as Multidimensional Scaling Some example programs used for MDS
applications are Minissa Polycon Kyst Indscal Sindscal Alscal Multiscale etc
(Schiffman et al 1981)
MDS is a robust technique that is used by researchers to assess visual auditory
taste and olfactory stimuli (Drewnowski 1984) In food sensory science one approach
to modeling the qualitative variation among sets of foods is to determine food similarity
and submit the data to MDS analysis Lawless et al (1995) created perceptual maps of
cheeses with the aid of MDS MDS procedures were used to asses flavor perception and
taste preferences of eight non-diet sodas judged by obese and normal weight sensory
panelists (Drewnowski 1984) Odor perception of six groups of panelists with varied
experience and training in odor evaluation were examined using MDS (Lawless and
Glatter 1990) Auditory perception of crispness crunchiness and crackliness was
examined in selected foods with the aid of MDS (Vickers and Wasserman 1979) Zraick
et al (2000) demonstrated through MDS studies of voice perception that perception of
normal voice quality is multidimensional
MDS is a statistical procedure that provides a perceptual map of differences and
similarities of stimuli based on the perceptions and interpretations of sensory panelists
8
MDS is a powerful methodology that is valuable in assisting scientists to gain important
unique understanding of human behavior
4 Texture of Fresh Fruit
41 Fruit Texture
Szczesniak (1963) divides textural parameters into three categories mechanical
geometrical and other characteristics (moisture and fat) Studies of fruit texture focus
primarily on the mechanical properties of the fruit tissue The few studies on the
geometric properties of fruit tissues such as grittiness in pear were conducted by fruit
breeders (Bell and Janick 1990) or as part of sensory studies (Diehl and Hamann 1979
Stec et al 1989) An increasing emphasis on the assessment of juiciness in fruits was
also reported recently (Szczesniak and Ilker 1988 Harker et al 2006)
The complex nature of fruit is related to the variety of attributes required to fully
describe textural properties of fruits and the textural changes that occur as fruit ripens
The lexicon for sensory texture attributes for fruits include crispness crunchiness ease
of breakdown fibrousness flouriness graininess grittiness hardness juiciness
mealiness pastiness pulpiness and starchiness (Harker et al 1997) The physiological
genetic biochemical nature of living tissues is important to an understanding of the
complexity of the ripening process in fruit (Dilley et al 1993)
42 Fruit Anatomy
The flesh in fruits is primarily composed of parenchyma cells that exhibit thin
non-lignified cell walls and large vacuoles that contain 90 of the water in the cell (Pitt
1982) The walls of the adjacent cells are separated by the middle lamella rich in pectin
9
(Huber 1993) The texture of the fruit depends of the cell size cell shape and packing
cell wall thickness cell wall strength cell turgor pressure and cell-cell adhesion (Harker
et al 1997)
The skin in fruits varies in size and complexity depending on the mechanical
properties of each fruit In fruits such as apples and pears the skin is consumed and
imparts different textural characteristics than other fruits with inedible skins Edible
skins are considered simple and are composed of tightly fitting epidermal cells coated
with wax layers Beneath epidermal layers of cells are layers of hypodermis cells which
are smaller than the epidermal cells In other fruits such as melons or oranges the skin is
inedible due to the thickness and presence of collenchyma sclerenchyma and lignin
impregnated cells (Harker et al 1997)
Seeds in apples and pears are located in the interior of the flesh called the core
The core is associated with the central tissue and contains seeds seed cavities and
sclerified lining and vascular strands Seeds associated with the core tissue are inedible
and are avoided during eating (Harker et al 1997)
Cell size and packing patters determine the volume of intercellular space which
influence cell adhesion by determining the extent of cell to cell contact Very limited cell
to cell contact occurs in ripen apples (Reeve 1953) An increased cell wall thickness and
decrease in cell size increase the strength of the fruit tissue Cell size and cell wall
thickness influence juiciness through their effect on packing of liquids There is a good
correlation between large cells and increased juiciness in fruits (Szczesniak and Ilker
1988)
10
The strength and texture of fruit tissues are related to the mechanical properties of
cell walls the turgor of cells and the strength of bonds between adjacent cells The
mechanical properties of cell walls of fresh fruit are determined by a mixture of pectic
hemocellulosic and fibrous cellulose polysaccharides Also cell wall properties differ
depending on the calcium content enzymatic hydrolysis and turgor of the cells Cell wall
properties confer plasticity enabling a cell to expand as the cell enlarges during
maturation and rigidity confers strength and cell shape to the fruit Cell wall breakdown
results in a marked effect on texture changes such as fruit softening (Harker et al 1997)
The excess of turgor or internal pressure of cells imparts a hydrostatic component
to cell tissue strength and increases the brittleness of the cell wall Turgor pressure is
influenced by the membrane permeability the osmotic gradient across the primary cell
wall and the cell wall expansion and contraction (Harker et al 1997) Cell turgor is an
integral part of fruit softening As turgor decreases during the maturations process the
fruit softens The turgor of cells in freshly harvested apples may contribute to the
softening of fruit associated with the increasing separation of individual cells during
storage (Harker and Hallett 1992)
The way cells separate or break open and release cell contents is one of the most
critical mechanical factors influencing fruit texture Cell disruption and release is
determined by the strength of the cell wall relative to the strength of the bonds between
adjacent cells Both are expected to decline as fruit ripens and softens The strength of
the bonds between cells is influenced by the strength of the middle lamella the area of
cell to cell contact and the extent of plasmodesmatal connections (Harker et al 1997)
11
43 Food-Mouth Interactions
An understanding of the physiology of the mouth and the occurrence of food
breakdown during chewing is important to the perception food texture The shape size
texture orientation and mechanical properties of food are perceived by the lips tongue
teeth and jaw When food is placed in the mouth the teeth reduce the food to a size and
shape that allows flow to the gut which allows for bacterial hydrolysis (Harker et al
1997) Additionally saliva that is released and mixed with the food initiates digestion
and alters overall texture of the food to facilitate swallowing (Jenkins 1978)
The mouth is very sensitive to textural properties of food during biting and
chewing The speeds of the mouth determined during chewing are faster than speeds
used during instrumental testing Texture determinations alone performed by instruments
may not simulate biting or chewing events occurring in the mouth well (Harker et al
1997) During biting and chewing the mandible moves in three directions opening and
lateral movement protrusion and retrusion The tongue is assisted by the muscles of the
inner surface of the check and the lips manipulate the food and aid sensory perception of
food As food is chewed saliva is induced to form a bolus for swallowing (Beyron
1964) Food is chewed and crushed by the molars The forces necessary to chew
decrease as moisture increases
44 Consumer Awareness and Reasons to Determine Texture in Fruit
Consumer awareness and attitudes towards texture are affected by various factors
Szczesniak and Kahn (1971) reported that socioeconomic status culture gender flavor
intensity and eating occasion influence consumersrsquo perceptions of texture Blindfolded
panelists given pureed foods exhibited difficulty identifying pureed apples strawberries
12
and bananas Difficulty in identifying pureed foods demonstrates that texture structures
are essential for accurate food identification (Bourne 2002) However for most foods
texture is considered a minor component of sensory quality unless the texture does not
meet expectations Unexpected textures usually signal poor food quality (Szczesniak and
Kahn 1971)
Texture is very important to quality perception of food The implication that fresh
fruit is a flavor-predominant characteristic is no longer accepted A consumer study
conducted in the United Kingdom with 12 apple cultivars demonstrated that panelists
preferred either a sweet hard apple or an acidic juicy apple (Daillant-Spinnler et al
1996) In a study profiling aroma flavor and texture of Royal Gala apples an increase
in acceptability was observed when juiciness and crispness increased between 16 and 20
weeks of controlled atmosphere storage (Harker et al 1997) Textural recognition with
fruit is of critical importance to marketers of fruit and there is a need for more research
in this area
45 Methods of Determining Texture in Fruits
A wide selection of fundamental empirical and imitative methods are available
for determining fruit texture (Bourne 2002)
bull Puncture tests Involve penetrating the fruit with a cylindrical probe with a
convex tip Examples are the Magness-Taylor Effegi Ballauf Chatillon
Penetrometers are characterized by using a force determination instrument rate of
penetrometer movement into the food and a standard distance (Bourne 2002)
13
bull Whole-Fruit Deformation Involves compressing an intact fruit between two
parallel flat plates This method involves deforming the fruit at a fixed distance
and determining the force required to achieve the deformation (Bourne 2002)
bull Tactile Assessment Squeezing fruit by hand is an important method for
evaluation of texture quality Human tactile sense is sensitive when fruits are
relatively soft However as fruit firmness increases beyond a threshold
individualsrsquo discrimination among fruits becomes difficult Tactile approach is
not recommended with hard fruits such as apples and pears (Batten 1990)
bull Shear and Extrusion A shear test for fruits can be conducted by obtaining a plug
of tissue from a thin slice held between two rigid plates The Kramer shear cell is
the most frequently used method for determining the shear or extrusion properties
of fruit tissue (Mohsenin 1977)
bull Compression Tests Compression tests are usually applied to tissue excised from
the whole fruit A common test is the texture profile analysis where a bite size
cube of tissue is compressed through two cycles between two plates or probes
The resulting force-distance curve is used to differentiate a number of food
attributes hardness cohesiveness adhesiveness springiness gumminess and
chewiness (Bourne 2002)
bull Beam Tests A cylindrical or rectangular fruit tissue is supported by pivots at both
ends A blunt blade located between pivots descends at constant speed so the
fruit tissue bends and breaks Beam tests are used to determine rupture force
shear and elastic modulus of foods (Vincent et al 1991)
14
bull Wedge Tests A sharp wedge is driven into a block of tissue and many elements
can be determined from the force-distance curves (Vincent et al 1991)
bull Tensile Tests Consist of securely fixing both ends of a fruit tissue into an
instrument by either using clamps cutting tissue into a shape which slots between
sets of claws or by gluing Tensile tests allow scientists to examine fracture
surfaces using a scanning electron microscope (Harker and Hallett 1992)
bull Dynamic Tests Consists of deforming a tissue by applying a sinusoidal stress
usually between 01 and 500 Hz (Mohsenin 1970)
bull Twist Test Consists of a rectangular blade fixed radially at its axis to a sharpened
spindle The fruit is impaled onto the spindle until the blade completely enters the
flesh The fruit is then twisted by hand or by an automated system The twist
tests allow scientists to determine tissue strength in different tissue zones by
altering the length of the spindle (Studman and Yuwana 1992)
bull Tissue Juiciness Generally juiciness is characterized as percentage of juice
released from a fixed weight of fruit tissue A number of methods were
developed utilizing homogenization centrifugation or juice extractors
(Szczesniak 1987)
bull Auditory Recordings of Chewing Sounds Sound produced during biting and
chewing can be recorded using a microphone pressed firmly against the ear and
analyzed from amplitude-time plots (Edmister and Vickers 1985)
bull Sensory Evaluations There are two types of sensory assessments consumer and
analytical panels Consumer panels indicate preference or acceptability of a food
Analytical panels involve individuals trained to describe aroma taste and texture
15
attributes of a product Analytical sensory panels can be either difference tests or
descriptive analysis techniques (Harker et al 1997)
bull Electrical Impedance Electrical impedance spectroscopy is used to investigate
the resistance of intracellular and extracellular compartments within plant tissue
At 50 Hz the resistance of the extracellular pathway is determined Weakening of
the cell wall is associated with changes in texture (Zhang and Willison 1991)
46 Relationship between Instrumental and Sensory Determinations of Texture
Szczesniak (1987) recommended that instrumental determinations of texture may
be established depending on the accuracy and precision of the selected instrument to
predict sensory texture attributes Szczesniak (1987) determined correlations between
instrumental and sensory measurements of food texture to satisfy the desire of the food
industry for quality assurance instruments to predict consumer responses to understand
the textures being perceived in sensory assessment and to develop instrumentation that
will accurately replicate sensory evaluations Szczesniak (1987) emphasized that the
range selection and diversity of texture attributes in the assessment of food texture as
well as the scale and appropriateness of the comparison among foods must be considered
before correlating instrumental and sensory data
Numerous studies examined the relationship between instrumental and sensory
measurements on apples (Diehl and Hamann 1979 Abbott et al 1984 Richardson
1986 Paoletti et al 1993) Many studies report good correlations (r gt 08) between
firmness crispness and instrumental determination with puncture (Abbott et al 1984)
sensory evaluation (Brenan et al 1970) shear and extrusion (Hard et al 1977) whole
fruit compression (Abbott et al 1984) and tensile tests (Holt and Schoorl 1985) While
16
significant correlations were reported between many mechanical and sensory assessments
of texture variation of fruit cultivars between seasons and during the storage period
resulted in some problems due to the non-homogeneous distribution of the results
5 Sensory Perception of Crisp Crunchy and Crackly Textures
51 Structural Properties of Food with an Auditory Component
Food structure is fundamental to the production of sound during the biting and
chewing of food Food texture attributes such as crispness crunchiness and crackliness
are greatly influenced by the arrangement of the cells chemical bonds cracks and
impurities in the food (Al Chakra et al 1996) Foods producing a perceivable auditory
response may be divided into two groups dry and wet crisp foods (Edmister and Vickers
1985)
Fruits and vegetables are wet crisp foods because they contain fluid within cells
Fruits and vegetables are composed of turgid cells with elastic cell walls An increase in
turgidity is associated with an increase in crispy crunchy and crackly sounds Turgidity
occurs when the fluids inside the cell press outwards on the cell wall while the cell wall
presses inwards Turgidity in wet food is characterized by strength and elasticity During
biting or chewing of the food the contents of the cell expand rapidly and when released
a sound wave is produced The resulting sound is responsible for the perception not only
of crispness but also crunchiness and crackliness (Vickers and Bourne 1976)
Dry crisp foods are cellular foods that contain air within the cells Foods such as
chips and biscuits contain air filled cavities with brittle walls During biting or chewing
the brittle walls bend and break The remaining fragments of the cells produced during
17
breakage snap back to their original shape and emit vibrations resulting in sound
emission The sound emission results in the perceptions of crisp crunchy and crackly
sounds (Vickers and Bourne 1976)
Sound attributes in foods are at a maximum during the first bite The decline or
absence of sound is observed as chewing progresses (Lee et al 1990) Sound perception
is also influenced by length width and thickness of the food (Al Chakra et al 1996)
The perception of crispness crunchiness and crackliness for both wet and dry foods
declines as mastication and saliva hydration progresses
52 Perception of Sound
Sounds produced during biting or chewing foods are detected by air conduction
and by bone conduction Air conduction sounds are perceived directly through the ear
Air molecules vibrate across molecules producing sound waves that travel through the
auditory canal Vibrations reaching the eardrum activate the movements on the ossicles
on the drum membrane transferring the sound into the inner ear The inner ear is
responsible for the perception of loudness and pitch of the sound (Kinsler and Frey
1962)
Bone conduction sounds are transmitted through the mandible bones cheeks and
tongue into the ears Bone conducted sounds are perceived as a higher frequency when
chewing with the mouth closed rather than opened and exert a dampening effect on the
sound Because of the differences in sound contribution between air and bone the two
sounds must be combine and equalize in order to fully quantify the acoustic sensations
produced by crisp crunchy or crackly foods (Vickers and Borne 1976)
18
53 Sensory Studies
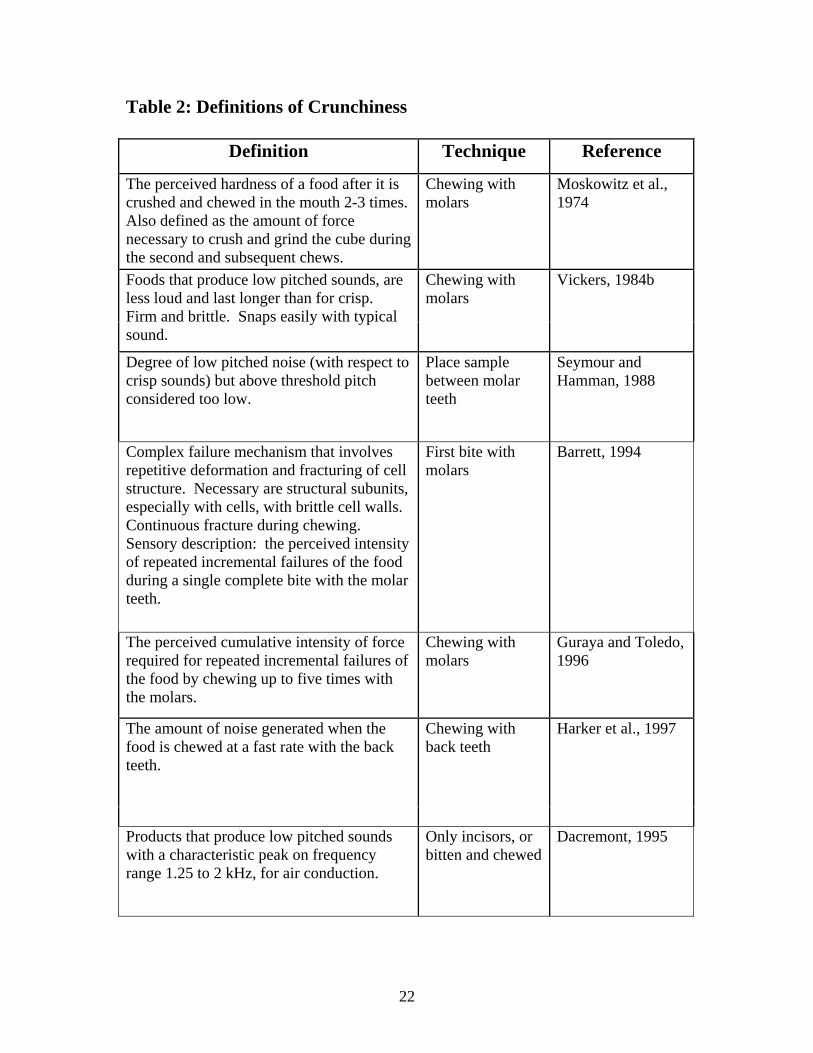
Sensory evaluations of crispness crunchiness and crackliness are reported by
Jeon et al 1975 Vickers 1984a 1984b Seymour and Hamman 1988 Szczesniak
1988 Dacremont 1995 Harker et al 1997 Vincent et al 2002 Duizer and Winger
2005 and Dijksterhuis et al 2005 Sensory evaluations were performed with trained
and untrained panelists Consumer evaluations with untrained panelists are reported
using magnitude estimation (Vickers and Wassermann 1979 Vickers 1981 Christensen
and Vickers 1981 Mohamed et al 1982 Edmister and Vickers 1985) Trained
panelistsrsquo evaluations are focused on descriptive analysis where panelists are asked to
reach a consensus about the meaning of selected texture attributes Thus in some
evaluations verbal definitions were developed to identify the attributes crispy (Table 1)
crunchy (Table 2) and crackly (Table 3) Crispy crunchy and crackly definitions
exhibit only moderate agreement and large variation in the perception of each attribute
Important aspects cited when defining crispness crunchiness and crackliness are the
structure of the intact food sounds emitted at chewing or biting force needed to crush the
food and collapse and appearance of the food at fracture (Roudaut et al 2002)
Differences in definitions among trained panelists demonstrate that the perception
and sensory evaluation of crispness crunchiness and crackliness is not an easy process
The difference between a sensory attribute concept and its definition should be
acknowledged (Roudaut et al 2002) Also studies conducted in several countries add
difficulty in comparing results among sensory studies Drake (1989) indicated that
crispness may be described as having more than one equivalent term in other languages
Also even if a term exists in more than one language the phrase may not express
19
equivalent meaning in all languages The lack of standardization in the procedures
implementing sensory studies adds difficulty to the understanding of crispness
crunchiness and crackliness Further research must standardize sensory evaluations to
improve consistency in the outcomes of the studies
Table 1 Definitions of Crispness
Definition Technique Reference
Relative force required to bite through the food Biting with front teeth
Jeon et al 1975
Foods that produce a high pitched sound Biting with front teeth
Vickers 1984b
First Bite place the food between the incisors bite through and evaluate the level of high pitched noise
Biting with front teeth
Seymour and Hamman 1988
Firm and brittle snaps easily emitting a typical frequency sound upon deformation
NA Szczesniak 1988
The perceived relative force used by crunching the food in the mouth
Molars Onwulata and Heymann 1994
The perceived force with which the food separates into two or more distinct pieces during a single bite with the incisors An abrupt and complete failure of the food is required
Incisors first bite
Barrett 1994
Foods that produce a high pitched sound with a frequency higher than 5 kHz especially for air conduction sounds
Only incisors or bitten and chewed
Dacremont 1995
Harker et al 1997 The amount and pitch of sound generated when the sample is first bitten with the front teeth
Front teeth bite
A combination of the noise produced and the breakdown of the food as bitten through entirely with the back molars
Biting with the back molars
Duizer et al 1998
20
Fractures in an abrupt manner after applying a relatively small force on the food
Front teeth first bite
Vincent et al 2002
Fracture in an abrupt brittle manner after applying a relatively small force on the food on the first chew with the molars
Molars second bite
Vincent et al 2002
Cracks you can force your teeth through slowly more airy than crackling
At first bite Dijksterhuis et al 2005
Soft sound more airy than crackling Association with freshness Disintegrates into pieces smaller than when crackling
During chewing
Dijksterhuis et al 2005
A combination of the type of sound ie short snapping and longer cracking sounds and the force to bite and chew as perceived on the first bite
First bite Duizer and Winger 2005
21
Table 2 Definitions of Crunchiness
Definition Technique Reference
The perceived hardness of a food after it is crushed and chewed in the mouth 2-3 times Also defined as the amount of force necessary to crush and grind the cube during the second and subsequent chews
Chewing with molars
Moskowitz et al 1974
Foods that produce low pitched sounds are less loud and last longer than for crisp Firm and brittle Snaps easily with typical sound
Chewing with molars
Vickers 1984b
Degree of low pitched noise (with respect to crisp sounds) but above threshold pitch considered too low
Place sample between molar teeth
Seymour and Hamman 1988
Complex failure mechanism that involves repetitive deformation and fracturing of cell structure Necessary are structural subunits especially with cells with brittle cell walls Continuous fracture during chewing Sensory description the perceived intensity of repeated incremental failures of the food during a single complete bite with the molar teeth
First bite with molars
Barrett 1994
The perceived cumulative intensity of force required for repeated incremental failures of the food by chewing up to five times with the molars
Chewing with molars
Guraya and Toledo 1996
Harker et al 1997 The amount of noise generated when the food is chewed at a fast rate with the back teeth
Chewing with back teeth
Products that produce low pitched sounds with a characteristic peak on frequency range 125 to 2 kHz for air conduction
Only incisors or bitten and chewed
Dacremont 1995
22
Temporal aspects of the sensory feedback during mastication are important for the crunchy sensation Crunchiness is independent from hardness
Chewing with molars
Brown et al 1998
Crunchy would be associated with a hard and dense texture that fractures without prior deformation producing a loud low-pitch sound that is repeated during several chews It was suggested that crunchy is more relevant to fruits and vegetables than crispness
Mainly during chewing
Fillion and Kilcast 2001
Fractures after applying a higher force on the food than for crispness
Front teeth first bite
Vincent et al 2002
Fractures after applying a higher force on the food than for crispness on the first chew with the molars
Molars second bite
Vincent et al 2002
High pitched sound light sound longer sounding
During chewing Dijksterhuis et al 2005
Table 3 Definitions of Crackliness
Definition Technique Reference To make small sharp sudden and repeated noises
At first bite or during chewing
Vickers 1984a
Foods that generate low pitched sounds with a high level of bone conduction Discrimination between crackly and crunchy foods could be due to vibrations propagated by bone conduction that also generate vibrotactile sensations
Only incisors Dacremont 1995
Combination of sound and bite force Clip between the teeth and it breaks Crackling is harder than crispy
At first bite Dijksterhuis et al 2005
Audible for a long period during chewing large pieces of food mainly of the crust
During chewing Dijksterhuis et al 2005
23
54 Acoustic Studies
The association that acoustic sensations have with the perception of texture was
reported for crisp crunchy and crackly foods (Drake 1963 Kapur 1971 Vickers and
Bourne 1976 Vickers and Wasserman 1979 Vickers and Christensen 1980 Vickers
1981 1983 1984a 1984b 1987a 1987b Dacremont et al 1991 1995 Zampini and
Spence 2004) Two primary approaches were developed to study the relationships
between texture of food and sound The first approach involves recording the sounds
produced during application of a force to a food to obtain quantitative information
regarding the crisp and crunchy sounds (Drake 1963 Kapur 1971 Vickers and Bourne
1976 Edmister and Vickers 1985 Vickers 1985 Seymour and Hamann 1988
Dacremont et al 1991) The second approach consists of assessing the panelistsrsquo
perceptions of air-conducted sounds to study the involvement of sounds produced when
eating food to perceptions of crispness crunchiness or crackliness (Christensen and
Vickers 1981 Vickers and Wasserman 1979 Vickers 1980 1981 1984a 1984b) Both
acoustic approaches combined with mechanical force-deformation techniques more
adequately describe the sounds resulting from biting or chewing foods than either
approach alone (Vickers 1987a Szczesniak 1988)
In the first approach acoustic recordings are used to record sounds associated
with crispness crunchiness and crackliness of eating foods Numerous studies using
amplitude-time plots are reported and correlated to sensory determinations of crispness
crunchiness and crackliness Drake (1965) inferred that the higher the amplitude of the
amplitude time plot the crisper the food Drake (1965) concluded the amplitude of the
sound emitted during biting toasted bread increased as the degree of toasting increased
24
Edmister and Vickers (1985) concluded that a combination of the mean height of the
peaks x the number of peaks is a better predictor of crispness for dry and wet crisp foods
than other parameters such as number of sound bursts duration mean height peaks x
number of sound bursts mean height peaks x number of sound burststhickness
Seymour and Hamann (1988) studied the effect of sound pressure in the perception of
crispness and crunchiness in potato chips and reported that potato chips with a low water
activity exhibited a higher mean sound pressure than potato chips with a high water
activity Seymour and Hamann (1988) concluded the sound produced during chewing of
the potato chips was louder at low water activities than at higher water activities
The Fast Fourier Transform (FFT) method is used to characterize the most evident
frequencies during biting and chewing of foods Comparison of the predominant
frequencies resulting from biting and chewing crisp crunchy and crackly is possible with
FFT The biting or chewing of crunchy and crackly foods is characterized by a sound in
frequency range between 125 and 2 kHz A large volume of bone conduction is evident
when eating crackly foods and absent when eating crunchy foods Consumption of crispy
foods is characterized by sound with frequencies greater than 2 kHz (Dacremont 1995)
Tesch et al (1995) determined the role of fractal analysis in mechanical and acoustical
perception of crunchy foods and reported mechanical acoustical signatures of cheese
balls and croutons concluding that fractal analysis is potentially useful in calculations to
assess auditory and mechanical perception of crunchy foods
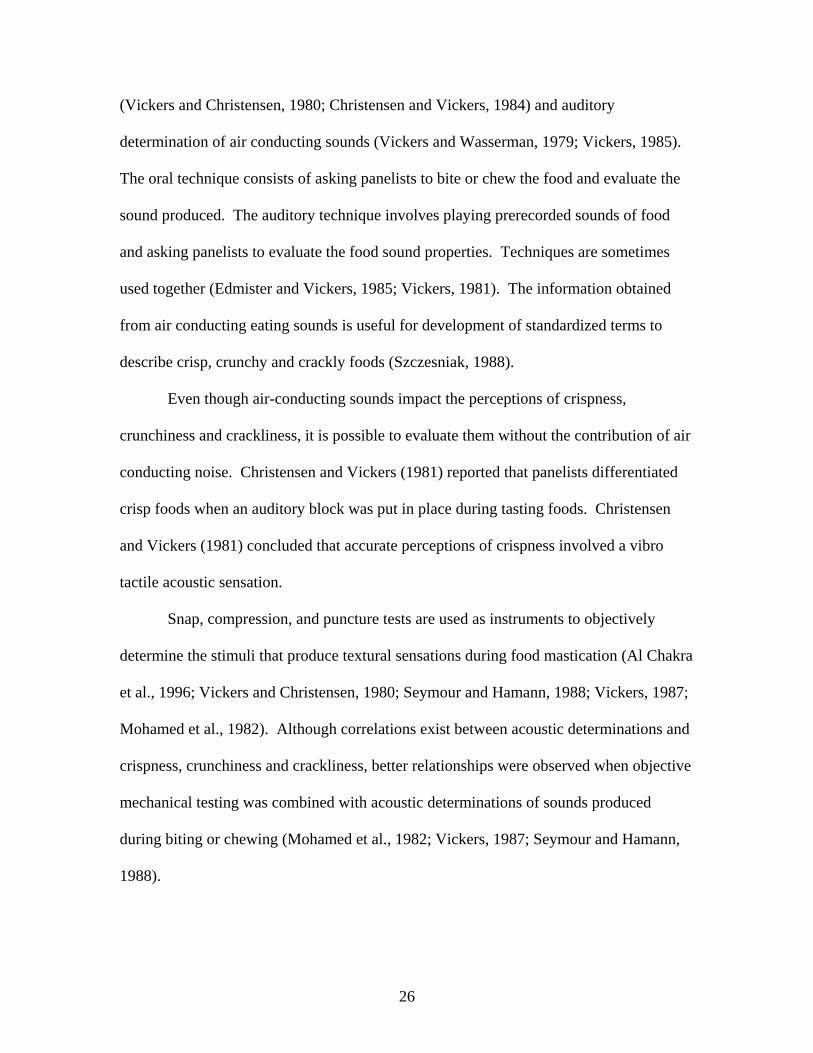
The second approach focuses on the contribution of air conducting sounds to
crisp crunchy and crackly textures resulting from biting and chewing selected foods
There are currently two techniques used oral determination of air conducting sounds
25
(Vickers and Christensen 1980 Christensen and Vickers 1984) and auditory
determination of air conducting sounds (Vickers and Wasserman 1979 Vickers 1985)
The oral technique consists of asking panelists to bite or chew the food and evaluate the
sound produced The auditory technique involves playing prerecorded sounds of food
and asking panelists to evaluate the food sound properties Techniques are sometimes
used together (Edmister and Vickers 1985 Vickers 1981) The information obtained
from air conducting eating sounds is useful for development of standardized terms to
describe crisp crunchy and crackly foods (Szczesniak 1988)
Even though air-conducting sounds impact the perceptions of crispness
crunchiness and crackliness it is possible to evaluate them without the contribution of air
conducting noise Christensen and Vickers (1981) reported that panelists differentiated
crisp foods when an auditory block was put in place during tasting foods Christensen
and Vickers (1981) concluded that accurate perceptions of crispness involved a vibro
tactile acoustic sensation
Snap compression and puncture tests are used as instruments to objectively
determine the stimuli that produce textural sensations during food mastication (Al Chakra
et al 1996 Vickers and Christensen 1980 Seymour and Hamann 1988 Vickers 1987
Mohamed et al 1982) Although correlations exist between acoustic determinations and
crispness crunchiness and crackliness better relationships were observed when objective
mechanical testing was combined with acoustic determinations of sounds produced
during biting or chewing (Mohamed et al 1982 Vickers 1987 Seymour and Hamann
1988)
26
Acoustic determinations are important for the appreciation of crispness
crunchiness and crackliness in foods Through the use of a combination of acoustic and
instrumental techniques or either technique alone sensory science may potentially
improve the understanding of the perceptions evolving from biting or chewing crisp
crunchy and crackly foods (Duizer 2001)
27
References
Abbott JA Watada AE and Massie DR 1984 Sensory and instrument
measurement of apple texture J Am Soc Hort Sci 109 221-228
Al Chakra W Allaf K and Jemai AB 1996 Characterization of brittle food
products Application of acoustical emission method J Text Stud 27 327-
348
Batten DJ 1990 Effect of temperature on ripening and postharvest life of fruit of
atemoya cv lsquoAfrican Pridersquo Scientia Hort 45129-136
Barrett AH Cardello AV Lesher LL and Taub IA 1994 Cellularity mechanical
failure and textural perception of corn meal extrudates J Text Stud 25 77-95
Bell R L and Janick J 1990 Quantitative genetic analysis of fruit quality in pears J
Am Soc Hort Sci 115 829-834
Beyron H 1964 Occlusal relations and mastication in Autralian aborigines Acta
Odontol Scand 22 597-678
Borg I and Groenen P 1997 Modern multidimensional scaling theory and
applications 1st ed Springer-Verlag New York 471 p
Bourne M 2002 Texture Viscosity and Food Ch 1 In Food Texture and Viscosity
Concept and Measurement 2nd Ed Academic Press Geneva NY
Brandt MA Skinner EZ and Coleman JA 1963 Texture Profile Method J Food
Sci 28404-9
Brennan JG Jowitt GR and Mughsi OA 1970 Some experiences with the general
foods Texturometer J Text Stud 1 167-184
28
Brown WE Langley KR and Braxton D 1998 Insight into consumer assessments
of biscuit texture based on mastication analysis-hardness versus crunchiness J
Text Stud 29 481-497
Christensen CM and Vickers ZM 1981 Relationships of chewing sounds to
judgments of crispness J Food Sci 46 574-578
Civille GV and Szczesniak AS 1973 Guidelines to training a texture profile panel
J Text Stud 4204-223
Dacremont C Colas B and Sauvageot F 1991 Contribution of the air and bone
conduction to the creation of sounds perceived during sensory evaluation of
foods J Text Stud 22 443-456
Dacremont C 1995 Spectral composition of eating sounds generated by crispy
crunchy and crackly foods J Text Stud 26 27-43
Daillant-Spinnler B MacFie JH Beyts PK and Hedderley D 1996 Relationships
between perceived sensory properties and major preference directions of 12
varieties of apples from the southern hemisphere Food Qual Prefer 7 113-126
Diehl K C Hamann DD Whitfield J K 1979 Structural failure in selected raw
fruits and vegetables J Text Stud 10371-400
Dijksterhuis G Hannemieke L De Wijk R and Mojet J 2005 A new sensory
vocabulary for crisp and crunchy dry model foods Food Qual Pref 18 37-50
Dilley LA Wilson ID Kuai J Poneleit L Zhu Y and Pekker Y 1993
Molecular biology of pome fruit ripening and senescence concepts status
perspectives and future prospects Acta Hort 326 325-334
Drake BK 1963 Food crushing sounds- An introductory study J Food Sci 28 233
29
Drake BK 1965 Food crushing sounds- comparison of objective and subjective data
J Food Sci 30 556-559
Drake DK 1989 Sensory texture rheological properties ndash a polyglot list J Text
Stud 20 1-27
Drewnowski A 1984 New techniques multidimensional analyses of taste
responsiveness Int J Obesity 8599-607
Duizer LM Campanella OH and Barnes GRG 1998 Sensory instrumental and
acoustic characteristics of extruded snack food products J Text Stud 29 397-
411
Duizer LM and Winger RJ 2006 Instrumental measures of bite forces associated
with crisp products J Text Stud 37 1-15
Edmister JA and Vickers ZA 1985 Instrumental acoustical measures of crispness in
foods J Text Stud 16 153-167
Fillion L and Kilcast D 2001 Consumer perception of crispness and crunchiness in
fruits and vegetables Food Qual Pref 13 23-29 General Foods Corp 1967
Sensory Texture Profiling
Guraya HS and Toledo RT 1996 Microstructural characteristics and compression
resistance as indices of sensory texture in a crunchy snack product J Text
Stud 27 687-701
Hard MM Zaebringer MV Bowman F and Mackey AC 1977 Predicting texture
of fresh fruit and vegetables by chemical and physical methods College of Agr
Washington State Univ Bul 836
30
Harker FR and Hallet IC 1992 Physiological changes associated with development
of mealiness of apple fruit during cool storage HortSci 271291-1294
Harker FR Redgwell RJ Hallet IC and Murray SH 1997 Text in fresh fruit
Hort Rev 20 121-224
Harker FR Amos RL Echeverria G Amdgunson FA 2006 Influence of texture
on taste insights gained during studies of hardness juiciness and sweetness of
apple fruit J Food Sci 71(2) S77-S82
Holt JE and Schoorl D 1985 Mechanical properties and texture of stored apples J
Text Stud 15377-394
Huber DJ 1983 The role of cell wall hydrolases in fruit softening Hort Rev 5 169-
219
Jeon IJ Breene WM and Munson ST 1975 Texture of fresh pack whole
cucumber pickles correlations of instrumental and sensory measurements J
Text Stud 5 399-409
Jenkins GN 1978 The physiology and biochemistry of the mouth Blackwell Oxford
Kapur KK 1971 Frequency spectrographic analysis of bone conducting chewing
sounds in persons with natural and artificial dentitions J Text Stud 2 50-61
Kinsler LE and Frey AR 1962 Fundamentals of acoustics 2nd Ed John Wiley amp
Sons New York p 392-400
Kruskal JB and Wish M 1978 Multidimensional scaling 2nd ed Sage Publications
Beverly Hills CA 93 p
Lashly KS 1916 Reflex secretion of the human parotid gland J Expt Psychol 1
461-493
31
Lawless HT and Glatter S 1990 Consistency of multidimensional scaling models
derived from odor sorting J Sens Stud 5217-30
Lawless HT Sheng N and Knoops SSC 1995 Multidimensional scaling of sorting
data applied to cheese perception Food Qual Pref 691-98
Lee III WE Schweitzer MA Morgan GM and Shepherd DC 1990 Analysis of
food crushing sounds during mastication total sound level studies J Text
Stud 21 165-178
Mohamed AAA Jowitt R and Brennan JG 1982 Instrumental and sensory
evaluation of crispness 1 in friable foods J Food Eng 155-75
Mohsenin NN 1970 Physical properties of plant and animal materials structure
physical characteristics and mechanical properties Gordan and Breach Science
Publ New York
Mohsenin NN 1977 Characterization and failure of solid foods with particular
reference to fruits and vegetables J Text Stud 8 169-193
Moskowitz HR Segars RA Kapsalis JG and Kluter RA 1974 Sensory ratio
scales relating hardness and crunchiness to mechanical properties of space cubes
J Food Sci 39 200-202
Muller HG 1969 Mechanical properties rheology and haptaesthesis of food J
Text Stud 138-42
Onwulata C and Heymann H 1994 Sensory properties of extruded corn meal related
to the spatial distribution of process conditions J Sens Stud 9 101-112
32
Paoletti F Moneta E Bertone A and Sinesio F 1993 Mechanical properties and
sensory evaluation of selected apple cultivars Lebensm-Wiss Technol 26
721-726
Pitts RE 1982 Models for the rheology and statistical strength of uniformly stressed
vegetative tissue Trans Am Soc Agr Eng 26 1776-1784
Reeve RM 1953 Histological investigations of texture in apples II Structure and
intercellular spaces Food Res 18604-617
Richardson A 1986 The effects of herbicide soil management systems and nitrogen
fertilizer on the eating quality of Coxrsquos Orange Pippin apples J Hort Sci 61
447-456
Roudaut G Dacremont C and Le Meste M 1998 Influence of water on the
crispness of cereal-based foods acoustic mechanical and sensory studies J
Text Stud 29 199-213
Schiffman S Reynolds ML and Young FW 1981 Introduction to
multidimensional scaling 1st ed Academic Press New York 413 p
Seymour SK and Hamann DD 1988 Crispness and crunchiness of selected low
moisture foods J Text Stud 19 79-95
Stec M G H Hodgson JA MacRae EA and Triggs CM 1989 Role of fruit
firmness in sensory evaluation of kiwifruit (Actinidia deliciosa cv Hayward) J
Sci Food Agr 47 417-433
Studman CJ and Yuwana 1992 Twist test for measuring fruit firmness J Text
Stud 23 215-227
Szczesniak AS 1963 Classification of textural characteristics J Food Sci 28385-9
33
Szczesniak AS and Kahn EL 1971 Consumer awareness of and attitudes to food
texture I Adults J Text Stud 2 280-295
Szczesniak AS 1987 Correlating sensory with instrumental texture measurements -
an overview of recent developments J Text Stud 181-15
Szczesniak AS 1988 The meaning of textural characteristics ndash crispness J Text
Stud 19 51-59
Szczesniak AS and Ilker R 1988 The meaning of textural characteristics ndash juiciness
in plant foodstuff J Text Stud 19 61-78
Szczesniak AS 1990 Texture It is still an overlooked food attribute Food Technol
44(9)8688909295
Tesch R Normand MD and Peleg M 1995 The apparent fractal dimension of
sound bursts in acoustic signature of two crunchy foods J Text Stud 26
685-694
Tesch R Normand MD and Peleg M 1996 Comparison of the acoustic and
mechanical signatures of two cellular crunchy cereal foods at various water
activity levels J Sci Food Agric 70 347-354
Vickers Z M and Bourne MC 1976 A psycho acoustical theory of crispness J
Food Sci 41 1158-1164
Vickers ZM and Wasserman SS 1979 Sensory qualities of food sounds based on
individual perceptions J Text Stud 10 319-332
Vickers Z M and Christensen CM 1980 Relationships between sensory crispness
and other sensory instrumental parameters J Text Stud 11 291-307
34
Vickers ZM 1980 Food sounds how much information do they contain J Food Sci
45 1494-1496
Vickers ZM 1981 Relationship of chewing sounds to judgments of crispness
crunchiness and hardness J Food Sci 47 121-124
Vickers ZM 1983 Pleasantness of food sounds J Food Sci 48 783-786
Vickers ZM 1984a Crackliness relationships of auditory judgments to tactile
judgments and instrumental acoustical measurements J Text Stud 15 49-
58
Vickers ZM 1984b Crispness and crunchiness- a difference in pitch J Text Stud
15 157-163
Vickers ZM 1985 The relationship of pitch loudness and eating technique to
judgments of crispness and crunchiness of food sounds J Text Stud 16 85-
95
Vickers ZM 1987a Instrumental measures of crispness and their correlation with
sensory assessment J Text Stud 19 1-14
Vickers ZM 1987b Sensory acoustical and force deformation measurements of
potato chips crispness J Food Sci 52138-140
Vincent JFV 1991 Texture of plants and fruits p19-33 In JFV Vincent and PJ
Lillford (eds) Feeding and the texture of food Cambridge Univ Press
Cambridge
Vincent JFV and Saunders DEJ 2002 The use of critical stress intensity factor to
quantify hardness and crunchiness objectively J Text Stud 33 149-159
Yurkstas AA 1965 The masticatory act J Prosthet Dent 15 248-260
35
Zraick RI Liss JM Dorman MF and Case J L 2000 Multidimensional scaling
of nasal voice quality J Speech Hear Res 43989-96
Zhang M I N and JHM Willison 1991 Electrical impedance analysis in plant
tissues A double shell model J Exp Bot 421465-1475
36
Chapter Two
MULTIDIMENSIONAL REPRESENTATION OF THE
STANDARD SCALES OF FOOD TEXTURE
M A CHAUVIN C PARKS C ROSS and BG SWANSON
Department of Food Science and Human Nutrition
Washington State University
Pullman WA 99164-6376 USA
Corresponding author Dr Barry G Swanson
Department of Food Science and Human Nutrition
Washington State University Pullman WA 99164-6376 USA
Tel 1-509-335-3793
Fax 1-509-335-4815
Email swansonbwsuedu
(Multidimensional scaling of texture)
37
ABSTRACT
The use of standard terminology standard reference foods and standard
evaluation procedures for utilizing standard scales in texture profile methods makes them
effective objective tools for assessing panelists in descriptive analysis However their
use is often limited due to lack of availability of foods and the drift of scales over time
The objective of this study was to evaluate the standard texture scales developed by
Szczesniak et al (1963) for the classification of the textural characteristics of foods
through the use of multidimensional scaling (MDS) The texture perceptions of foods by
eleven panelists were evaluated using the standard texture scales of Szczesniak et al
(1963) Each scale was anchored by a series of representative standard foods that
illustrated the intensity gradation of the subjective magnitude of the texture dimension
under study hardness chewiness gumminess viscosity adhesiveness and fracturability
MDS was highly instructive in quantitatively assessing the qualitative textural difference
perceptions of naive panelists (r gt 089) The selected foods were rated similarly using
MDS and standard texture scales
PRACTICAL APPLICATIONS
MDS is an efficient tool for the analysis of sensory perception data Using MDS
it is possible to corroborate food texture standard scales published many years ago and
assay food texture more accurately today Caution is necessary when assuming that
standard scales developed in the past are as useful today as when were developed The
item drift theory hypothesizes that questions become less reflective of a concept over
time for natural reasons The purpose of this study was to use Multidimensional Scaling
38
to reproduce the original dimensions and original order of stimuli to analyze existing
food textural scales for hardness chewiness gumminess viscosity adhesiveness and
fracturability
Key Words Multidimensional scaling MDS texture standard scales sensory
perception
39
INTRODUCTION
Szczesniak et al (1963) developed a series of standard food texture scales for the
mechanical properties of texture using common foods to represent selected textures
within the entire range of characteristic texture intensities encountered in foods (Table 1)
Using the standard texture scales developed by Szczesniak et al (1963) Brandt et al
(1963) developed the descriptive analysis technique for food texture designated as the
General Foods Texture Profile The General Foods Texture Profile technique uses
terminology to describe basic categories or classifications of food texture characteristics
developed by Szczesniak (1963) for training texture profile panelists The primary
characteristics of the food texture profile technique are standardization reproducibility
and correlation of texture attributes with instrumental determinations of food texture
(Civille and Liska 1975) The General Foods Texture Profile represents experimental
design of an organized and structured study of food texture specifically to ldquostudy the
sensory analysis of the texture complex of a food in terms of its mechanical geometrical
fat and moisture characteristics the degree of each present and the order in which they
appear from first bite through complete masticationrdquo (General Foods 1967)
Evaluation of the mechanical characteristics of food texture is both qualitative and
quantitative and may be assessed by the standard texture scales Texture standard scales
use category scaling to designate differences in textural attributes In texture analysis
the category scale is used to represent intensity of the attribute with the number of
categories varying with the texture attribute scaled For each texture attribute scale the
full range of the textural attribute is demonstrated using foods that possess a given texture
attribute as a major property The standard texture scales developed by Szczesniak et al
40
(1963) are practical tools to demonstrate the principal range of texture for each specific
texture attribute Szczesniak scales are evolving and were modified throughout the years
by a number of researchers including General Foods (1967) Civille and Liska (1975)
Szczesniak (1975) and Munoz (1986) However the initial publication by Szczesniak
(1963) is considered a highly standardized reference system for food texture
Szczesniak (1963) concluded that texture is a discernible sensory attribute of
foods and that in some foods such as meat potato chips cornflakes and celery texture
may be more important than flavor The effectiveness of sensory panelists to distinguish
and articulate mechanical texture characteristics such as hardness viscosity
adhesiveness fracturability gumminess and chewiness of foods varies among
individuals The complexity of the human masticatory apparatus cultural diversity
health status age sex and food preferences influence texture perception of foods among
individuals The use of Multidimensional Scaling (MDS) may elucidate differences
among panelists by developing configurations of attributesrsquo cognitive grouping and
describing multidimensional plots that illustrate similarity and differences in attribute
observations
MDS is a mathematical technique that describes proximities among objects on a
spatial representation or map (Schiffman 1981) The MDS method assumes that
subjective estimates of similarity or dissimilarity represent individual estimates of spatial
comparisons between the two stimuli in a selected geometrical space of relatively small
dimensions (Moskowitz 1977) Foods assessed as similar are closer together on the
spatial representation (map) than foods assessed as dissimilar The MDS spatial
configuration may provide insights into important textural dimensions of foods that may
41
exist MDS may also minimize experimenter influence and provide fewer constraints to
sensory panelists than panelistsrsquo data from attribute rating scales (Schiffman 1981)
MDS was previously used in visual auditory taste and olfactory research of
foods (Moskowitz 1976a and 1976b Schiffman 1976 Drewnowski 1984 Hellemann
et al 1987 Lawless and Glatter 1990 Bertino and Lawless 1993 Lawless et al 1994
Zraick et al 2000) However little research is published using MDS to interpret
assessment of food texture
Magnitude estimation and category scaling are frequently compared for the
determination of sensory intensity for a variety of stimuli Controversy in the literature
exists regarding the relationship between both scaling techniques Some studies suggest
that magnitude estimation may provide a more accurate depiction of the true underlying
psychophysical function than category scaling (Mcdaniel and Sawyer 1981 Moskowitz
1982 Cardello et al 1982a) However Birnbaum (1982) and Vickers (1983) report no
particular advantage for magnitude estimation or category scaling techniques Category
scaling was selected over magnitude estimation in the present study to avoid confusion
among panelists resulting from the large number of foods presented
The objective of this study was to evaluate through MDS the standard food
texture scales for hardness chewiness gumminess viscosity adhesiveness and
fracturability developed by Szczesniak et al (1963)
42
MATERIALS AND METHODS
Panelists were recruited from Washington State University staff students and
members of the community and screened for allergies dental conditions and interest in
participating in the study Minimal information about the study was provided to the
panelists to reduce potential bias Eleven panelists five males and six females between
the ages of 23-54 years participated in the study Panelists were awarded a small
compensation for participation in the experiment None of the panelists expressed
previous experience with texture evaluation of foods and were considered naive panelists
Experimental foods were selected to represent the complete standard texture
scales for hardness chewiness gumminess viscosity adhesiveness and fracturability
(Szczesniak et al 1963) Due to unavailability of some foods substitutions were
selected as described in Cardello et al (1982a 1982b) Food items source size and
serving temperatures are presented in Table 1
Two four-hour sessions were conducted At the beginning of each session
panelists were required to sign a written consent form to participate in the study
Panelists were also given a demographic questionnaire and oral and written instructions
The written instructions included both an operational definition of the textural attribute
judged (Table 2) as well as instructions on the use of similarity judgments scales As
explained in the sensory texture profiling manual (General Food Corp 1967) the first 30
min of each session were devoted to familiarizing the panelists with the scales and the
technique used for assessing texture of experimental foods
There were N(N-1)2 possible pairs of foods to compare for a set of N foods in
each scale Representative food pairs were presented to panelists in a room fitted with
43
individual tables Three standard texture scales were analyzed in each session The
standard scales for hardness viscosity and adhesiveness were evaluated in session one
The fracturability gumminess and chewiness standard scales were evaluated in session
two
Two standard foods were presented as paired comparisons together with a ballot
asking each panelist to quantitatively judge the textural similarity between the two foods
A similarity scale consisting of a 9-point scale with the words ldquoexactly the samerdquo at the
high end (9) and ldquocompletely differentrdquo at the low end (1) was presented to each
panelist A separate ballot was provided for each paired comparison Panelists rinsed
their mouths with distilled water andor unsalted crackers between foods and were
permitted to take as many breaks as necessary to avoid fatigue Once each panelist was
finished with the first comparison shehe was instructed to advance to the next
comparison The panelists were instructed to wait one minute between each pair of
texture evaluations Panelists were advised not to go back to review or modify any
previous responses A mandatory 15-minute break was imposed between standard
scales
Food pairs were presented in a random order identified with three digit codes
Each food was presented uniformly as established by Szczesniak et al (1963) and placed
inside a 3 oz souffleacute cup (Solo Cup Company Urbana IL) Each food pair was
evaluated once by each panelist A total of 36 paired comparisons for hardness 28 for
viscosity and 10 for adhesiveness were assessed in the first session A total of 21 paired
comparisons for fracturability 10 for gumminess and 15 for chewiness were assessed in
the second session
44
Data Analysis
For each of the eleven panelists one individual matrix was constructed from the
pairwise similarity scores for each of the standard texture scales hardness chewiness
gumminess viscosity adhesiveness and fracturability Each cell within each individual
matrix yielded a similarity score ranging from 1 to 9 quantifying perceived similarities in
texture on the 9-point scale
The eleven panelistsrsquo matrices were combined to yield one matrix for each
standard food texture scale reflective of the mean group pairwise similarity scores
Every cell within each group matrix yielded a mean score for all foods on each standard
food texture scale reflective of the 9-point scale
Data were analyzed as similarity estimates using SPSS Version 120 statistical
analysis software (SPSS Inc Chicago IL) and on XLSTAT 754 (Addinsoft Paris-
France) MDS algorithm ALSCAL module for nonmetric multidimensional scaling was
employed using the option for minimizing Kruskalrsquos stress Formula 1 two-dimensional
solutions Output from the scaling software program included an assessment of stress
quantifying the fit among the data and the scaling model and R2 values calculating the
variance among underlying data that accounted for the scaling solution (Zraick 2000)
45
RESULTS AND DISCUSSION
Multidimensional scaling was performed on each paired comparison for the six
standard texture scales Stress and R2 values were calculated on the two-dimensional
configuration Stress and R2 results are presented in Table 3 Stress values for the
three-dimensional configuration of the six standard texture scales slightly improved
compared with the two-dimensional configuration Thus further analyses of the six
standard texture scales were performed in the two-dimensional configuration only The
mean stress values were small (lt 013) for hardness viscosity adhesiveness
fracturability gumminess and chewiness R2 values were correspondingly large (gt 089)
Small stress values and large R2values reflect the accuracy of the MDS algorithm to fit
calculated distances to the texture results in two dimensions Well organized two-
dimensional structures and agreement among the panelists for food texture analyses were
observed
MDS two-dimensional graphical representation of mean hardness of standard
foods on the hardness scale (Figure 1) illustrated agreement with the original standard
hardness scale (Table 4) Cream cheese was located at the softest point (smallest scale
value) and lemon drops were located at the hardest point (largest scale value) The
remaining foods were distributed between the soft and hard extremes with a cluster
observed at the ldquosofterrdquo end of the scale Specifically the texture of cream cheese egg
whites frankfurters cheese and olives were perceived as very similar to each other
potentially resulting in perceptual confusion by the panelists during evaluation Good
separation of peanuts carrots almonds and lemon drops were observed similar to the
original standard scale Confusion in assessing the similarity among softer foods may be
46
attributed to changes in the standard foodsrsquo formulations over time However with
further training confusion among softer textures could be minimized
Figure 2 presents two-dimensional perceived means of the viscosity standard
scale Agreement between perceived viscosity means and the original viscosity standard
scale was observed (Table 5) However distinctions among the viscosities of heavy
cream light cream and evaporated milk were difficult among panelists as they were
perceived to be very similar to each other Unfamiliarity of the panelists with the foods
may account for these results For instance today evaporated milk is mainly used as an
ingredient for numerous recipes and very few people know what it tastes like on its own
On the other hand in the early 1960rsquos when the original scales were developed
evaporated milk was marketed as a coffee creamer and evaporated milk taste was more
familiar Using standard scales generated a number of years ago may result in the
assumption that foods consumed many years ago are still in use or of equivalent use
today
MDS two-dimensional graphical representation of means of adhesiveness
standard scale (Figure 3) presented little variability from the original standard scale
(Table 6) The only inconsistency from the original standard adhesiveness scale was
between the perception of Crisco as less adhesive than Velveeta processed cheese The
discrepancy was attributed to taste preference and inability of the panelists to hold the
Crisco inside their mouths for a required amount of time
Figure 4 illustrates the means of fracturability standard scale which agreed with
almost all points of the original fracturability scale (Table 7) Only peanut brittle was an
47
outlier in the MDS graphical representation Differences in peanut brittle formulation
may be a source of variation in fracturability assessment
MDS two-dimensional graphical representations for gumminess (Figure 5) and
chewiness (Figure 6) coincide with their standard original scale equivalent at all points
(Tables 8 and 9)
The gumminess standard scale comprised of selected concentrations of white
flour and water were well discerned by the panelists Controlled food systems may
reduce problems related to continuous changes or unavailability of food standards
Nonetheless the advantage of multi-food standard scales is that frequently a given
characteristic is perceived differently in selected foods Converting food texture scales
to a one-dimensional series may be undesirable because a simple dimension may distort
illustration of diversified sensory perceptions of the mechanical parameters (Civille and
Liska 1975)
For many years research with food texture implied that texture was a single
concept and did not actively recognize that the perceptions of texture are the result of a
number of parameters Szczesniak (1963) categorized the textural parameters of foods
as mechanical geometrical and other (fat moisture) Furthermore terms identified as
primary food texture attributes include hardness adhesiveness cohesiveness and
springiness Secondary food texture attributes are described as perceived combinations
of two or more primary food textures and include fracturability chewiness and
gumminess
The first dimension of MDS analyses or food texture attribute calculated for all
standard texture scales represents specific mechanical parameters as a main textural
48
property For example hardness represents the first dimension on the hardness scale
This is demonstrated by the fact that food items that represented the strength of a specific
stimulus are located in similar geometrical space as their location on the standard food
texture scale The second dimension can be credited to hedonics or liking because
panelists were considered naiumlve consumers Panelists generally respond to odor and
taste of food pleasantness or unpleasantness first prior to classifying the texture
parameter or intensity (Moskowitz 1976b) The second dimension is also defined by
texture descriptive terms containing perceived fractions of several attributes As a result
secondary terms describe texture as combinations of two or more primary texture
attributes Perhaps no descriptor term relates to a ldquopurerdquo texture attribute but rather
each term is a mixture of primary textural attributes to a greater or lesser degree
(Moskowitz and Kapsalis 1975) Food items selected for the standard scales of texture
possessed sensory attributes other than texture that may affect the perception of texture
The spatial MDS representation for each standard texture scale coincided with the
arrangement of each point presented on the food texture standard scales (Szczesniak et
al 1963) Occasional deviant points were observed and are attributed to factors such as
sensory panelist adaptation fatigue or carry-over effects (Lawless et al 1995 Also
depending on the geographical location of the panel distribution of selected foods is
limited making it difficult for people to recognize the standard foods Familiarity with
the standard foods may also change over time and cultural differences may also influence
the results Other factors to consider when employing standard food scales is that many
foods initially designated as standards are no longer available or the textural character
changed as a result of reformulation or processing alterations (Civille and Liska 1974)
49
In addition procedures for texture evaluation adhere to rigid experimental controls to
minimize variation in texture perception The preparation serving and presentation of
the experimental foods must be consistent Techniques for biting chewing and
swallowing experimental foods must also be standardized (Civille and Szczesniak 1973)
Panelists with limited training and with little sensory evaluation experience may
also influence the results in the MDS output Cardello et al (1982) demonstrated that
trained and consumer panel judgments of texture differ significantly primarily due to
expanded perceptual ranges of trained panelists
CONCLUSIONS
The contribution of Szczesniak (1963) to food texture evaluation constituted the
first step in creating a rational tool for scientific description of food texture A
modification of the standard food texture scales may be necessary as challenges are
encountered in its practical use including the change of food formulations over time and
food distribution limitations However more than forty years later the initial standard
texture scales are still in use and Szczesniak (1963) represents a highly standardized and
well defined reference system for training texture profile panels
Multidimensional scaling is a strong exploratory statistical and graphical
technique effectively producing a graphical representation of overall similarity in food
texture perceptions from sensory panelists MDS is highly instructive in assessing naive
panelistsrsquo perceptions of qualitative textural similarities of food and provides a high-
quality statistical instrument to graphically validate existing standard scales
50
Scale value Product Brand or Type Manufacturer Sample size Temp
1 Cream Cheese Philadelphia Kraft Foods 1 cm cube 45-55 ordmF
2 Egg white hard cooked (5 min) 1 cm tip room
3 Frankfurters large uncooked Oscar Mayers Beef 1 cm slice 50-65 ordmF
4 Cheese mild Cheddar Kraft Foods 1 cm cube 50-65 ordmF
5 Olives stuffed Safeway 1 olive pimento removed room
6 Peanuts cocktail type in vacuum tin Planters Peanuts 1 nut room
7 Carrots fresh uncooked 1 cm slice room
8 Almonds 1 nut room
9 Hard Candy lemon drops Safeway 1 piece room
1 Corn muffin made from mix Jiffy 1 cm cube room
2 Shortbread Shortcake Keebler 1 cm cube room
3 Graham crackers Nabisco National Biscuit Corp 12 square room
4 Melba toast plain Old London 12 square room
5 Wheat thins Nabisco National Biscuit Corp 1 cm square room
6 Ginger snaps Nabisco National Biscuit Corp 12 square room
7 Peanut brittle candy part Safeway 12 square room
1 Hydrogenated vegetable oil Crisco Proctor amp Gamble Co 12 tsp 45-55 ordmF
2 Velveeta unsliced Kraft Foods 1 cm cube 45-55 ordmF
3 Cream cheese Philadelphia Kraft Foods 1 cm cube 45-55 ordmF
4 Marshmallow topping Kraft Foods 12 tsp 45-55 ordmF
5 Peanut Butter Skippy Smooth Best Foods 12 tsp 45-55 ordmF
1 40 flour paste Gold Medal General Mills 1 tbs room
2 45 flour paste Gold Medal General Mills 1 tbs room
3 50 flour paste Gold Medal General Mills 1 tbs room
4 55 flour paste Gold Medal General Mills 1 tbs room
5 60 flour paste Gold Medal General Mills 1 tbs room
1 Water distilled 12 tsp 45-55 ordmF
2 Light cream half and half Lucerne 12 tsp 45-55 ordmF
3 Heavy cream table cream Lucerne 12 tsp 45-55 ordmF
4 Evaporated Milk Carnation Co 12 tsp 45-55 ordmF
5 Maple Syrup natural maple syrup Wheelers Maple Products 12 tsp 45-55 ordmF
6 Chocolate Syrup Hershey Chocolate Corp 12 tsp 45-55 ordmF
7 Mixture 1 12 cup condensed milk Nestle 12 tsp 45-55 ordmF
amp1 tbl heavy cream
8 Condensed milk sweetened Nestle 12 tsp 45-55 ordmF
1 White bread fresh center cut Safeway 1 12 cm cube room
2 Frankfurter large uncooked skinless Oscar Mayers Beef 1 12 cm cube 50-70 ordmF
3 Gum drops spice drops Safeway 1 piece room
4 Licorice candy red vines American Licorice Co 1 piece room
5 Caramel Kraft 12 piece room
6 Tootsie Rolls midget size Sweet Co of America 1 piece room
Substitute item Reference Cardello 1982 Munoz 1986
Table 1 Standard Scales of Texture
Standard Viscosity Scale
Standard Chewiness Scale
Standard Hardness Scale
Standard Fracturability scale
Standard Adhesiveness Scale
Standard for Gumminess Scale
Szczesniak et al 1967
51
Table 2 Definitions of the textural attributes of hardness chewiness viscositygumminess adhesiveness and fracturability (General Foods Corp 1967)Hardness
Chewiness
ViscosityGumminess
Adhesiveness
Fracturability
Perceived force required to compress a substance between the molar teethTotal perceived work required to masticate a sample to reduce it toa consistency suitable for swallowing
after complete compression of the sample between tongue and palateForce with which sample ruptures when placing sample between molars and biting down completely at a fast rate
Perceived force required to draw a liquid from a spoon over the tongueEnergy required to disintegrate a semisolid food product to a state ready for swallowingForce required to remove product completely from palate using tongue
52
Table 3 MDS Stress and R2 for paired comparisons of texture scales
Stress R2
Hardness 006 099Viscosity 009 097Adhesiveness 013 089Fracturability 010 096Gumminess 004 099Chewiness 013 091
53
Scale value Product
1 Cream Cheese2 Egg white3 Frankfurters4 Cheese (Medium Cheddar)5 Olives6 Peanuts7 Carrots8 Almonds9 Hard Candy
Figure1 MDS representation of hardness textural perceptions of standard foods (n=11)
Table 4 Standard hardness scale as described by Szczesniak et al 1967
Substitute item Reference Cardello 1982 Munoz 1986
Cream cheeseEgg white
FrankfurtersCheese
Olives
PeanutsCarrots
Almonds
Lemon Drops
-8
-6
-4
-2
0
2
4
6
8
-8 -6 -4 -2 0 2 4 6 8
--D
im2
--gt
-- Dim1 --gt
Configuration in space Dim1 times Dim2 (stress 0113)
54
Table 5 Standard viscosity scale as described by Szczesniak et al 1967
Scale value Product1 Water2 Light cream3 Heavy cream4 Evaporated Milk5 Maple Syrup6 Chocolate Syrup7 Mixture 1 12 cup condensed milk
amp1 tbl heavy cream8 Condensed milk
Figure 2 MDS representation of viscosity textural perceptions of standard foods (n=11)
Substitute item Reference Cardello 1982 Munoz 1986
Water
Light Cream
Heavy CreamEvaporated Milk
Maple Syrup
Chocolate Syrup
Mixture
Condensed Milk
-5-4-3-2-1012345
-5 -4 -3 -2 -1 0 1 2 3 4 5
--D
im1
--gt
-- Dim2 --gt
Configuration in space Dim1 times Dim2 (stress 0088)
55
Table 6 Standard adhesiveness scale as described by Szczesniak et al 1967
Scale value Product1 Crisco2 Velveeta 3 Cream cheese4 Marshmallow topping5 Peanut Butter
Substitute item Reference Cardello 1982 Munoz 1986
Figure 3 MDS representation of adhesiveness textural perceptions of standard foods(n=11)
Crisco
VelveetaCream Cheese
Marshmallow Topping
Peanut Butter
-4
-3
-2
-1
0
1
2
3
4
-4 -3 -2 -1 0 1 2 3 4
--D
im2
--gt
-- Dim1 --gt
Configuration in space Dim1 times Dim2 (stress 0099)
56
Table 7 Standard fracturability scale as described by Szczesniak et al 1967
Scale value Product1 Corn muffin2 Shortbread3 Graham crackers4 Melba toast5 Wheat thins6 Ginger snaps7 Peanut brittle
Figure 4 MDS representation of fracturability textural perceptions of standard foods(n=11)
Substitute item Reference Cardello 1982 Munoz 1986
Corn Muffin ShortbreadGraham Crackers
Melba toast
Wheat Thins
Ginger Snaps
Peanut Brittle
-6
-4
-2
0
2
4
6
-6 -4 -2 0 2 4 6
--D
im1
--gt
-- Dim2 --gt
Configuration in space Dim1times Dim2 (stress 0118)
57
Table 8 Standard gumminess scale as described by Szczesniak et al 1967
Scale value Product1 40 flour paste2 45 flour paste3 50 flour paste4 55 flour paste5 60 flour paste
Figure 5 MDS representation of gumminess textural perceptions of standard foods(n=11)
40 flour paste
45 flour paste
50 flour paste
55 flour paste
60 flour paste
-5
-4
-3
-2
-1
0
1
2
3
4
5
-5 -4 -3 -2 -1 0 1 2 3 4 5
--D
im1
--gt
-- Dim2 --gt
Configuration in space Dim1 times Dim2 (stress 0068)
58
Table 9 Standard chewiness scale as described by Szczesniak et al 1967
1 White bread2 Frankfurter3 Gum drops4 Licorice candy5 Caramel6 Tootsie Rolls
Figure 6 MDS representation of chewiness textural perceptions of standard foods(n=11)
Substitute item Reference Cardello 1982 Munoz 1986
White Bread
Frankfurters
Gum Drops
Licorice Candies
Caramels
Tootssie Rolls
-5
-4
-3
-2
-1
0
1
2
3
4
5
-5 -4 -3 -2 -1 0 1 2 3 4 5
--D
im2
--gt
-- Dim1 --gt
Configuration in space Dim1 times Dim2 (stress 0107)
59
REFERENCES
BERTINO M and LAWLESS HT 1993 Understanding mouthfeel attributes A
multidimensional scaling approach J Sens Stud 8101-114
BRANDT MA SKINNER EZ and COLEMAN JA 1963 Texture Profile Method
J Food Sci 28404-9
BIRNBAUM MH 1982 Problems with so-called ldquodirectrdquoscaling In Selected Sensory
Methods Problems and Approaches to Hedonicsrdquo (Ed) JT Kuznicki RA
Johnson and AF Rutkievic ASTM STP 773 p 32 American Society for
Testing and Materials
CARDELLO AV MALLER O KAPSALIS JG SEGARS RA SAWYER FM
MURPHY C and MOSKOWITZ HR 1982a Perception of texture by trained
and consumer panelists J Food Sci 471186-97
CARDELLO AV MATAS A and SWEENEY J 1982b The Standard Scales of
Texture Rescaling by Magnitude Estimation J Food Sci 471738-1740 1742
CIVILLE GV and SZCZESNIAK AS 1973 Guidelines to training a texture profile
panel J Text Stud 4204-223
CIVILLE GV and LISKA IH 1975 Modifications and applications to foods of the
General Foods sensory texture profile techniques J Text Stud 619-31
DREWNOWSKI A 1984 New techniques multidimensional analyses of taste
responsiveness Int J Obesity 8599-607
HELLEMANN U TUORILA H SALOVAARA H and TARKKONEN L 1987
Sensory profiling and multidimensional scaling of selected Finnish rye bread Int
J Food Sci Technol 22693-700
60
GENERAL FOODS CORP 1967 Sensory Texture Profiling
LAWLESS HT and GLATTER S 1990 Consistency of multidimensional scaling
models derived from odor sorting J Sens Stud 5217-30
LAWLESS HT SHENG N and KNOOPS SSC 1995 Multidimensional scaling of
sorting data applied to cheese perception Food Qual Pref 691-8
McDANIEL MR and SAWYER FM 1981 Preference testing of whiskey-sour
formulations Magnitude estimation versus the 9-point hedonic J Food Sci
46182
MOSKOWITZ HR 1972 Psychophysical measures of texture JText Stud 3135-
45
MOSKOWITZ HR and KAPSALIS JG 1975 The texture profile its foundations
and outlook J Text Stud 6157-166
MOSKOWITZ HR 1976a Psychometric analysis of food aromas by profiling and
multidimensional scaling J Food Sci 41567-71
MOSKOWITZ HR 1976b Multidimensional scaling of odorants and mixtures
Lebensm-Wiss Technol 9232-8
MOSKOWITZ HR 1977 Psychophysical and Psychometric approaches to sensory
evaluation Crit Rev Food Sci Nutr 441-79
MOSKOWITZ HR 1982 Utilitarian benefits of magnitude estimation scaling for
testing product acceptability In In Selected Sensory Methods Problems and
Approaches to Hedonicsrdquo (Ed) JT Kuznicki RA Johnson and AF Rutkievic
ASTM STP 773 p 11 American Society for Testing and Materials
61
MUNOZ AM 1986 Development and application of texture reference scales J Sens
Stud 155-83
VICKERS Z 1983 Magnitude estimation vs category scaling of the hedonic quality of
food sounds J Food Sci 481183-1186
SCHIFFMAN S REYNOLDS ML and YOUNG FW 1981 Introduction to
multidimensional scaling 1st Ed New York Academic Press 413 p
SCHIFFMAN S 1976 Multidimensional Scaling A useful tool to measure flavor
Cereal Food World 2164-68
SZCZESNIAK AS BRANDT MA and FRIEDMAN HH 1963 Development of
standard rating scales for mechanical parameters of texture and correlation
between the objective and the sensory methods of texture evaluation J Food Sci
28397-403
SZCZESNIAK AS 1963 Classification of textural characteristics J Food Sci
28385-9
SZCZESNIAK AS 1975 General Foods texture profile revisited-ten years
perspective J Text Stud 65-17
ZRAICK RI LISS JM DORMAN MF and CASE JL 2000 Multidimensional
scaling of nasal voice quality J Speech Hear Res 43989-96
62
Chapter Three
Relationship between Instrumental and Sensory Determination of
Apple and Pear Texture
MAITE A CHAUVIN1 CAROLYN ROSS1 4 MARVIN PITTS2
EUGENE KUPFERMAN3 and BARRY SWANSON1
1Food Science and Human Nutrition
2Biological Systems Engineering
3WSU Wenatchee TFREC
Washington State University
Pullman WA 99164-6376 USA
4Corresponding author Dr Carolyn Ross
Food Science and Human Nutrition
Washington State University Pullman WA 99164-6376 USA
Tel 1-509-335-2438
Fax 1-509-335-4815
Email cfrosswsuedu
APPLE AND PEAR TEXTURE
Journal Section Sensory and Nutritive Qualities of Food
63
ABSTRACT
The relationship between compressive forces tensile forces and sensory analyses
of apple and pear texture was evaluated A total of twenty-seven sensory panelists were
trained to assess a wide variety of texture attributes in apples and pears including
crispness hardness fracturability juiciness and chewiness Apples from 2005 and 2006
harvest years and pears from the 2006 harvest year were evaluated by a trained sensory
panel The instrumental tests used to evaluate fruit texture were the Guss fruit texture
analyzer (compression forces) and the Sinclair iQtrade system for both apples and pears
Tensile determinations were obtained using a unique method employing both tensile and
compression elastic modulus of the fruit tissue Significant correlations (r = 080 to 090)
among the sensory texture attributes of crispness hardness and fracturability for apples
and pears was observed The correlations between juiciness and hardness differed for
apples (r = 065 to 080) and pears (r = -032) Hard apples and soft pears were perceived
as the juiciest fruits among all firmness levels When correlating sensory to instrumental
determinations the Sinclair iQtrade System texture assessment provided an acceptable
determination of apple hardness (r = 079 to 082) Guss pressure sensor provided
significant determination of apple (r = 078 to 083) and pear (r = 083) hardness Tensile
determinations predicted crispness in apples (r = 088) and pears (r = 085) well A
combination method of compressive and tensile determinations may offer the most
accurate prediction of textural properties of apples and pears
Key Words Apples pears sensory evaluation Sinclair iQtrade System Guss Fruit
Texture Analyzer tensile tests
64
INTRODUCTION
Consumers of fresh apples and pears consider fruit quality more important than
price in making purchase decisions (Market Review 1996) Fruit quality incorporates
sensory attributes such as appearance flavor aroma and texture Of these quality
attributes textural characteristics exert a strong influence on fruit acceptability Daillant-
Spinnler and others (1996) observed that in apples the texture attributes of hardness and
juiciness were the most important to consumers Using preference mapping Daillant-
Spinnler and others (1996) confirmed that purchase intent of apple consumers in the
United Kingdom tended to fall into two groups consumers that preferred hard and sweet
apples or consumers that preferred juicy and acidic apples Jaeger and others (1998)
reported that soft and mealy apples were liked less than hard and non-mealy apples
Numerous other studies also confirmed the importance of texture to consumer
acceptability of apples (Corrigan and others 1997 Thybo and others 2003) Turner and
others (2005) observed that participants preferred a sweet pear with flavor The most
important quality factors recognized by consumers were texture tartness and sourness
and juiciness Consumer attitudes and attention to apple and pear texture cannot be
ignored and are of critical importance to food marketers
Comparative and quantitative assessment of apple and pear texture involves
instrumental and subjective sensory determinations (Harker and others 1997) Sensory
determination of texture is very important in food quality because no instrumental
determinations are adequately developed to replace human evaluation Sensory
evaluation continues to be the gold standard by which the successes of instrumental
determinations are evaluated (Bourne 2002) Instrumental quality control methods
65
designed to evaluate texture are often difficult to implement because of the challenges
associated with correlating instrumental rheological determinations to perceived sensory
attributes or acceptability (Kapsalis and Moskowitz 1978)
The speeds measured during chewing are faster that those used during
instrumental testing of food Masticatory speeds and duration may result in shear
thinning that may not be replicated using instruments of lower speeds For this reason
alone textural determinations made using instruments may not represent the events
occurring in the mouth (Harker and others 1997) According to Harker and others
(2002) a reliable relationship between objective instrument-based and subjective sensory
methods is not always feasible However because of practical concerns such as the
time expertise and costs associated with sensory evaluation instrumental analysis is
often employed Many empirical and imitative instrumental tests were developed to
potentially correlate with sensory texture descriptors (Paoletti and others 1993 Peleg
1993 Harker and others 2002 Shmulevick and others 2003) However the entire
complex of actions that occur during mastication cannot be determined completely by
instruments There is no instrument available containing the complexity sensitivity and
extent of mechanical motions in the mouth or that can appropriately change the speed and
mode of mastication in response to the sensations received during the previous chew
(Bourne 2002)
Instrumental determinations of fruit texture such as Texture Profile Analysis
(TPA) are the accepted foundation of fruit quality assessment In apples many studies
demonstrate satisfactory relationships between sensory texture attributes such as firmness
and crispiness and instrumental texture measurements including TPA Kramer shear
66
disk compression vibration and tension instruments (Harker and others 1997) Puncture
tests using instruments such as the penetrometer are the most widely used instrumental
texture methods in the apple industry (Harker and others 1997) Puncture tests determine
the force required to push a cylindrical probe with a convex tip into the flesh of the fruit
Even with extensive replication of the penetrometer ambiguity exists in the literature as
to the relevance of penetrometer determinations as predictors of perceived apple firmness
(Abbott and others 1976 Bongers 1992 Harker and others 1996)
In response to the need to develop an instrumental determination of texture with a
strong correlation to sensory evaluation a new methodology was developed whereby the
tensile properties of apples and pears were measured Analysis of apple tissue failure
during biting or cutting with a knife suggests that dominant failure mode is a combination
of tensile and shear failure resulting in the wedge action of the knife blade or teeth One
difficulty associated with tensile properties determination is food manipulation during
measurement Previous research in tensile determination was dependent on securely
fixing both ends of a fruit tissue in the instrument designed to apply the test Tensile
determination was achieved using clamps (Schoorl and Holt 1983) cutting tissue into a
shape with slots between sets of claws (Stow1983 Harker and Hallet 1992) or by gluing
(Harker and Hallet 1994) However the short amount of time available to mount and test
the tissue before the tissue decay begins and the amount of moisture loss proved to make
tensile determinations very difficult
A new method to determine tensile properties based on recording the force
deflection values and compressive elastic modulus to determine the tensile elastic
modulus and failure stress in fruit is proposed To assess the usefulness of this method
67
comparisons between results from the tensile determinations and sensory evaluation of
texture were performed Therefore the objective of this study was to evaluate the new
method and instrumentation of tensile properties and compare the results with human
texture perception (trained texture panel) puncture test (Guss pressure sensor) and non-
destructive test (Sinclair) Specifically the relationships between tensile material
properties and hardness and human sensory perception of apples and pears were studied
To determine the most effective instrumental parameter for prediction of apple and pear
texture the relationships between the sensory textural attributes of apples and pears were
also examined
MATERIALS AND METHODS
Fruit Selection
lsquoRed Deliciousrsquo lsquoGranny Smithrsquo lsquoPink Ladyrsquo lsquoCameorsquo and lsquoGalarsquo apples
(Wenatchee WA) from selected sources were harvested in 2005 and 2006 at commercial
maturity Harvest times varied from mid-September to early November lsquoAnjoursquo
lsquoBartlettrsquo and lsquoBoscrsquo pears (Wenatchee WA) were harvested in 2006 To effectively
compare the performance of analytical methods to sensory measurement determinations
apples and pears with a diverse range of textures were presented to the sensory panel
The range of apple and pear textures was generated through use of a number of selected
cultivars of each fruit and selected maturity levels
Harvested apples were sorted into three predetermined groups soft (lt 11 lb)
intermediate (14-16 lb) and hard (gt18 lb) as identified by the Fruit Texture Analyzer
The range of apple firmness was identified as the apples were placed into storage at
68
harvest from values seen historically in hard and soft cultivar lots The range of hardness
in the harvested pears was adjusted by holding the pears at room temperature (22degC) for a
selected number of days (4 6 8 days or more) prior to evaluation Pears were
categorized in three selected groups for soft (lt5 lb) intermediate (9-12 lb) and hard (gt 15
lb)
Apple or pear firmness was evaluated using the nondestructive method Sinclair
iQtrade (Sinclair Systems International- Fresno CA) and a destructive method
computerized Fruit Texture Analyzer (Guss Strand Western Cape South Africa)
Sensory Panel
The sensory panel was composed of ten panelists in 2005 and seventeen panelists
in 2006 all between the ages of 21 and 62 Panelists were recruited from the
WSUPullman community The panel was composed of two males and eight females in
2005 and three males and fourteen females in 2006 The panelists were regular apple and
pear consumers (at least once a week) All panelists signed an Informed Consent Form
and the sensory evaluation protocols were approved by the Washington State University
Institutional Review Board for human subjects participation Panelists were screened for
dental problems and other conditions that may have affected their performance in this
panel A minimum amount of information on the nature of the study was provided to
reduce potential bias panelists were informed they were expected to assess the texture of
apples and pears
Sensory Panel Training
The panelists performed the Texture Profile Method following the procedures of
texture profile analysis described in Civille and Szczesniak (1973) The texture attributes
69
were selected based upon previous literature (Paoletti and others 1993) Panelists were
trained to recognize apple texture attributes of hardness juiciness crispness and
fracturability as defined in Table 1 In 2005 the panelists were also trained to recognize
chewiness however chewiness attribute was excluded from evaluations in 2006 as it did
not yield significant results in the 2005 study In 2005 the sensory properties of apples
were evaluated by biting or chewing in an orientation parallel to the core of the fruit In
2006 sensory properties of apples and pears were evaluated by biting or chewing the
fruit in an orientation perpendicular to the core of the fruit Published texture scales
(Table 2) were used to train the selected texture attributes Panelists were trained to
recognize attributes using specific evaluative techniques (Table 3) and to assign intensity
ratings on a 15 cm line scale indented 1 cm at both ends of the line Fruits of selected
texture maturities and selected cultivars were used for training Panelists trained with
selected apple cultivars may more clearly focus on texture attributes of the fruit
Panelists received 30 to 40 hours of training each year learning the definition and
technique for each texture descriptor with the goal of reducing panelist variability and
increasing reliability Validity of the panel was assessed by analyzing the number of
correct responses over time Reliability was assessed by using duplicate test fruits and
replicating the tests Panelists were provided with feedback of individual and group
evaluations following each training session and additional training was provided if
necessary
Firmness Evaluation of Fruit
Apples and pears were equilibrated at room temperature for one day prior to
testing Firmness determinations were performed on the whole apple or pear with the
70
Sinclair iQtrade system (Sinclair Systems International- Fresno CA) The results were a
mean of three replications Fruit firmness was also determined on two peeled sides of
each fruit (sunny and shady) using a Fruit Texture Analyzer (Guss Strand Western
Cape South Africa) Results were expressed as lb of pressure and the mean value of the
two replicates was recorded
Sensory Panel Evaluations
Following apple or pear groupings for hardness by instrumental determinations
apples or pears from the soft intermediate and hard groupings were halved Half of the
fruit was utilized for tensile property determination while the other half was utilized for
sensory evaluation The apples or pears were labeled such that the tensile data and the
sensory data for each apple or pear were correlated The fruit half that was utilized in the
sensory testing was split in half Two fruit quarters were obtained from each fruit half
and presented to two panelists thus each panelist was presented with frac14 of the apple for
evaluation During each formal evaluation session panelists were presented with six
quarters of apples or pears Three replicated sessions were conducted over one week
with each session at a similar time each day Within each session each apple or pear
grouping (soft intermediate and hard) was evaluated twice in a randomized complete
block design (3 x 2 x 3 = 18 fruit quarters)
Sensory evaluation took place in individual sensory booths equipped with laptop
computers for entering and recording data The apple quarters were randomly presented
to the panelists at room temperature Apple quarters were identified using three-digit
codes and presented one at a time to panelists The fruits were scored for intensity of
each texture attribute using a 15 cm unstructured line scale with an indent 1 cm at the left
71
end of the scale corresponding to the lowest intensity (0 cm= extremely low) and an
indent 1 cm at the right end corresponding to the highest intensity (15 cm=extremely
high) Evaluations were conducted under normal light conditions Panelists were
presented with water and expectoration cups to cleanse the palate between fruit A knife
was provided to peel each fruit quarter
Results were collected and analyzed using Compusense 60 software (Guelph
ON) and sensory data were quantified by determining the distance in cm of the mark
along the line
Instrumental Analysis
Tensile properties were determined using a new methodology developed by Pitts
and others (httpwwwbsysewsueduMainPeoplefacultypittshtm) Tensile properties
were determined through a destructive test in which a slab of fruit tissue was removed
from the apple or pear and placed in a bending apparatus The bending created a
combination of compressive and tensile loads on the fruit A second tissue slab was
removed from the apple or pear to determine the compressive elastic modulus required to
determine the tensile material properties from the bending test During the bending test
the force applied and the deflection of the block were recorded in triplicate The force
and deflection values were utilized together with the compressive elastic modulus to
determine the tensile elastic modulus and failure stress of each fruit slab In the first
harvest year the tensile properties were determined in an orientation parallel to the core
of the fruit In the second harvest year tensile properties were evaluated in an orientation
perpendicular to the core (for apples and pears)
72
Data Analysis
The sensory data were subjected to two-way analysis of variance (ANOVA) using
panelist and firmness grouping as the main effects The interaction between panelists and
firmness levels were also determined for evaluation of crispness hardness fracturability
juiciness and chewiness The instrumental data was subjected to a one-way ANOVA to
determine how well the instrument differentiated the apples and pears among the three
firmness groupings Tukeyrsquos HSD was calculated to interpret the significant differences
among selected fruit firmness and sensory texture attributes (Version 753 XLSTAT
Addinsoft France) Significance was predetermined at p lt 005 Correlation analysis
was conducted to identify correlations between sensory texture and instrumental
determinations Principal component analysis was applied to sensory and instrumental
terms as a function of procedure means to compare sensory and instrumental methods
differentiation of apple and pear texture (Version 753 XLSTAT Addinsoft France)
RESULTS AND DISCUSSION
Sensory attribute ANOVA results for apple firmness groupings characterization
as determined by instrumentals determinations panelists and interaction between apples
and panelists are presented in Table 4 Differences among panelists and interaction
between apples and panelists were not significant (pgt005) This reveals consistency
among panelists and a small level of error In 2005 there were no significant differences
between intermediate and hard apples for selected texture sensory parameters However
significant textural differences between the apples were observed for the selected sensory
parameters of crispness hardness fracturability and juiciness in the 2006 cultivars
73
Panelists were able to differentiate apples harvested in 2006 based on firmness level
(Figure 1)
A logarithmic relationship between the physical properties of apples and
associated sensory response is observed in our 2005 data When apples are soft the
consumers might be expected to be more sensitive to texture differences than available
instruments are capable of determining When apples are hard the ability of consumers
to sense texture differences may decrease due to fatigue and thus instrumental
determination is more reliable than the consumer at discriminating between hard and very
hard fruit (Harker and others 1998) Figure 2 presents a summary of panelistsrsquo ability to
distinguish between soft and hard apples from the 2005 and 2006 combined harvest
years However differentiating between intermediate to hard apple cultivars was more
difficult than differentiating between soft and hard apples PC1 describes 9647 of
variation and is primarily defined by soft intermediate and hard firmness PC2 describes
only 353 of the variation and is primarily defined by intermediate firmness Similar
patterns are observed for pears in 2006 (Figure 4) Increased panelists training resulted in
a significant improvement in differentiating between intermediate and hard apples as
observed in the 2006 results
Table 5 presents the two-way ANOVA sensory attribute F values for pear texture
parameters panelists and interaction between pears and panelists Significant differences
were observed between pears for all attributes with the exception of juiciness indicating
that the sensory training received was adequate and panelists were able to differentiate
pears with selected firmness groupings (Figure 3) Significant differences were not
74
observed among the panelists demonstrating consistency within the panel Also no
significant interactions were observed among pears and panelists for selected attributes
Table 6 and Table 7 present the one-way ANOVA results of instrumental
determinations and relationships with apple and pear groupings respectively
Significant differences between apple and pear groupings were observed indicating that
selected instrumental determinations differentiated between soft intermediate and hard
apples and pears Instrumental determinations were originally selected to characterize the
apples and pears and the objective texture assessment of harvested apples and pears
supported the initial groupings
Correlation matrices for sensory texture attributes of apples are presented in Table
8 Strong correlations (rgt 080) were observed among crispiness hardness fracturability
and juiciness for apples harvested in 2005 Chewiness assessment resulted in weak
correlations with the other sensory attributes indicating that was not a strong predictor of
apple firmness Thus chewiness was removed from the apple texture profiling in 2006
In the 2006 harvest year correlations between sensory attributes were slightly smaller
especially the juiciness correlation to crispness hardness and fracturability as compared
to apples harvested in 2005
Correlation matrices for textural sensory attributes for pears are presented in
Table 9 Strong correlations (r gt 086) were observed among crispness hardness and
fracturability of pears However juiciness of pears was weakly correlated to crispness
hardness and fracturability sensory texture attributes These observations demonstrated
that the mechanism for releasing juice in the mouth is not the same among apples and
pears with the release of cell fluids depending upon the physiology of the fruit
75
Harker and others (2006) observed that juice release in apples is dependent on the
breakdown of individual cells and varies between firm and soft apples In firm apples
tissue fracture is associated with breakage of individual cells and results in the release of
cytoplasm fluids In soft apples fracture occurs as a result of cell-to-cell debonding
Individual cells do not always break open and release their contents and this result in a
mealy apple Harker and othersrsquo (2006) observations are supported by the present study
for both harvest years of apples as an increase in juiciness was observed with an increase
in apple firmness Pears behaved differently from apples as evaluated by the sensory
panel in that increased fruit firmness resulted in a small amount of juice released from
the fruit The relationship between firmness and juice release for pears is attributed to
cell-to-cell debonding and little juice is released from cells Soft pear texture is
associated with breakage of individual cells resulting in the release of juice and often a
juicy pear (Harker and others 1997) Differences between apples and pears in the way
juice contents are released may be attributed to fruit physiology and starch hydrolysis
during ripening
Correlation analysis of the degree of association between instrumental and
sensory determinations of apples is provided in Table 10 Large positive or negative
values indicate a strong association Strong to moderate correlations were observed
among the Guss Sinclair and compressive elastic modulus and the sensory attributes of
crispness hardness fracturability and juiciness Weak correlations were observed
between the tensile elastic modulus and selected sensory texture attributes in 2005
Strong correlations were observed between the Guss Sinclair compressive elastic
modulus tensile elastic modulus and the sensory attributes of crispness hardness and
76
fracturability in 2006 Guss Sinclair and compressive elastic modulus provided
determinations that did not significantly differ (p gt005) in their relationship to sensory
attributes for both harvest years However tensile elastic modulus determinations
differed significantly (p lt 005) between apples from 2005 and 2006
An increased predictability of apple crispness hardness and fracturability was
observed in 2006 Also small variability in correlations between instrumental and
sensory determinations was observed in apples between both harvest years In 2005
correlations between the Sinclair and the Guss determinations and sensory attributes were
higher than the 2006 correlations This variability may be attributed to structural
differences in selected varieties of apples and the different location of fruit harvest when
collecting the fruit Harker and others (2002) suggested that possible reasons for the
range of correlations obtained over different harvest years include the range of firmness
of fruit presented to panelists the variability between the texture of apples at the point of
instrumental determination and region of the fruit eaten by each panelist and the range of
sensory acuities and cognitive abilities of individual panelists Paoletti and others (1993)
also suggested that the mechanical and texture characteristics of apples and pears are
influenced by the structural features of the flesh and are affected by storage conditions
that result in great structural variability
Correlation analysis of the degree of association between instrumental and
sensory determinations for pears is provided in Table 11 Strong correlations were
observed between the Guss tensile elastic modulus and the texture sensory attributes of
crispness hardness and fracturability of pears Determinations made using the Sinclair
and the average elastic modulus by compression demonstrated poor correlations for
77
predicting sensory texture attributes in pears Evaluation of juiciness was negatively and
poorly correlated to instrumental determinations
Tensile elastic modulus varied significantly between apples from the 2005 and
2006 harvest years Differences of tensile determinations between harvest years may be
attributed to the distinction in how the measurement was made between the two years In
2005 the tensile elastic modulus and failure modulus were determined in a direction
parallel to the core line However in 2006 the determinations were perpendicular to the
core line due to redesign of the experimental technique Sensory evaluation techniques
and training did not differ between harvest years Tensile material properties are highly
orthotropic in that the properties change with orientation of the tissue with respect to the
core line of the fruit Paoletti and others (2003) observed that significant relationships
between flesh density and stiffness measured in torsion of apples is limited to radial
orientation (perpendicular to the core line) and not to the tangential orientation of the
apples (parallel to the core)
The current study results affirmed Paolettirsquos (2003) observations Strong
correlations of tensile determinations and crispness for apples and pears were observed
when samples were taken perpendicular to the core line as opposed to parallel to the core
line These observations are associated with the fact that tissue failure from biting with
the front teeth is crack-related Tensile material properties play a dominant role when a
crack propagates and the length of the crack propagation In the current study
fracturability and hardness were determined with the molars where compressive material
properties dominated The observations indicate that tensile material properties are
78
correlated to compressive properties and compressive properties are correlated to
fracturability and hardness
Fruit firmness or strength is a function of the mechanical properties of the cell
wall cell turgor and bonding among cells Another factor that impacts fruit firmness is
the contents of the cell Cell strength is a hydrostatic phenomenon that is diminished in
the reduction or absence of cell contents (Harker and others 1997) Studies on fruits
using pressure probes as a measure of compressive forces demonstrate that the cell wall
elastic modulus increases with increasing turgor pressure in the cell (Harker and others
1997) The results indicate that tensile material properties in fruits are attributed to the
strength of the pectin bonds between cells and the cell wall strength The compressive
material properties are attributed to the turgor pressure in the cell and to a lesser extent
on pectin bonds and cell wall strength Under selected storage environments the fruit
may mature without noticeably changing cellular turgor pressure
An advantage of tensile tests to assess fruit texture is the opportunity to determine
the mechanism of tissue failure through the examination of the fracture surface in fruit
(Harker and others 2002) There are three forms of tissue failure cell fracture cell
rupture and cell-to-cell debonding (Harker and others 1997) Harker and others (2002)
studies demonstrated that cell fracture was dominant in high firmness apples (gt66 N) cell
rupture dominated in intermediate firm apples (45 to 66 N) and cell-to-cell debonding
dominated in low firmness apples (lt 39 N)
De Belie and others (2000) observed a curvilinear relationship between pear
firmness and the tensile strength of cells demonstrating variation of mechanical
properties of a population of cells versus individual cells The compression and shear
79
properties of the cell population is evaluated in puncture tests of whole fruits while
during tensile testing the strength of thin layers of individual cells is determined The
strength of the weakest cell may define the strength of the entire fruit in tensile
determinations Generally failure in uniaxial compression of fruit is associated with an
increase in turgor pressure involving an increase of volume in the cells and rupturing of
cell walls Rupture during tension involves breakage of the cell walls andor cell-to-cell
debonding Compressive properties may be relevant to understanding factors affecting
the development of bruises in apples and pear while tensile determinations may be
closely related to biting and chewing of fruit
CONCLUSIONS
Determination of texture provides an indication of apple and pear maturity and
acceptability and is an integral part of routine fruit quality evaluation Sensory results of
apple and pear texture indicated high correlations among the sensory texture attributes of
crispness hardness and fracturability for apples and pears Disparity in juiciness
perceptions in apples and pears was attributed to the dissimilarity in cell structure When
correlating sensory evaluation to instrumental determinations both the Sinclair iQtrade
System and the Guss pressure sensor provided a reasonable predictor of apple hardness
Most of tensile properties in apples and pears have potential in predicting crispness but
are highly dependent on the orientation of the fruit A combination approach assaying
with an instrument to determine compressive and tensile properties provides the most
accurate prediction of apples and pear textural properties compared to any existing
method
80
ACKNOWLEDGMENTS
Funding for this research was provided by the Washington Tree Fruit Research
Commission (1719 Springwater Wenatchee WA 98801)
81
Attributes DescriptionCrispness Crispiness is primarily an acoustical sensation that
is detected by the ear during the fracturing of crisp foods
HardnessFirmness Hardness is the force required to bite completely through sample placed between molars
Fracturability Fracturability is the force with which sample ruptures when placing sampbetween molars and biting completely down at a fast rate
Juiciness Juiciness is the amount of juice released on mastication
Chewiness Chewiness is defined as the energy required masticating a solid food product to a state ready for swallowing (only in spring)
Table 1 Apple and pear texture attributes and descriptors as evaluated by the trained texture panel
l
82
Table 2 Texture standards used for the evaluation of texture sensory attributes
Scale value Product Brand or Type Manufacturer Sample size Temp
1 Chewy cookies Chips Ahoy Nabisco 1 cookie room
5 Chizz Sticks Cheez-it crackers The Sunshine Biscuit Co 1 piece room
10 Potato Chips Miss Vickis Miss Vickis 1 piece room
Scale value Product Brand or Type Manufacturer Sample size Temp
1 Cream Cheese Philadelphia Kraft Foods 1 cm cube 45-55 ordmF
2 Egg white hard cooked (5 min) 1 cm tip room
3 Frankfurters large uncooked Oscar Mayers Beef 1 cm slice 50-65 ordmF
4 Cheese mild Cheddar Kraft Foods 1 cm cube 50-65 ordmF
5 Olives stuffed Safeway 1 olive pimento removed room
6 Peanuts cocktail type in vacuum tin Planters Peanuts 1 nut room
7 Carrots fresh uncooked 1 cm slice room
8 Almonds 1 nut room
9 Hard Candy lemon drops Safeway 1 piece room
Substitute item Reference Cardello et al (1982) Munoz (1986)
1 Corn muffin made from mix Jiffy 1 cm cube room
2 Shortbread Shortcake Keebler 1 cm cube room
3 Graham crackers Nabisco National Biscuit Corp 12 square room
4 Melba toast plain Old London 12 square room
5 Wheat thins Nabisco National Biscuit Corp 1 cm square room
6 Ginger snaps Nabisco National Biscuit Corp 12 square room
7 Peanut brittle candy part Safeway 12 square room
1 White bread fresh center cut Safeway 1 12 cm cube room
2 Frankfurter large uncooked skinless Oscar Mayers Beef 1 12 cm cube 50-70 ordmF
3 Gum drops spice drops Safeway 1 piece room
4 Licorice candy red vines American Licorice Co 1 piece room
5 Caramel Kraft 12 piece room
6 Tootsie Rolls midget size Sweet Co of America 1 piece room
Standard Juiciness Scale (10 = most juicy all raw)
Scale value Product
0 Banana
1 Carrots
2 Mushroom
3 Snap Bean
4 Tomatoe Wedge
5 Cucumber
6 Apple
7 Strawberry
8 Honeydew Melon
9 Orange
10 Watermenlon
Szczesniak et al (1963)
Standard Chewiness Scale
Standard Crispness
Szczesniak et al (1963)
Standard Fracturability scale
Szczesniak et al (1963)
Standard Hardness Scale
Szczesniak and Ilker (1988)
83
Table 3 Sensory texture profiling technique for apples and pears
Stage I Place the fruit between front teeth Bite through the fruit by applying steady force Evaluate for
bull Crispiness amount of sound produced on the first chew Stage II Place the fruit between molars Bite through the fruit by applying steady force Evaluate for
bull Hardness force required to bite through the piece bull Fracturability force with which the cookie shatters
Stage III Chew the whole fruit Bite through the fruit by applying steady force Evaluate for
bull Juiciness amount of fluid released on the first three chews bull Chewiness number of chews required to hydrate the fruit and
bring it to a state ready for swallowing
84
Table 4 Two-way ANOVA for sensory analysis of apple texture by the trained panel in 2005 and 2006
2005 Crispness Hardness Fracturability Juiciness Chewiness Apple (S) 24167 267663 28591 83742 17299 Panelist (P) 204 13290 1164 4873 2919 Interaction (S x P) 042 1352 213 1207 225
2006 Apple (S) 13000 41600 24047 27149 NA Panelist (P) 042 1061 127 374 NA Interaction (S x P) 018 109 063 225 NA F value and significant levels from a two-way ANOVA Significant at P lt 005
85
Table 5 Two-way ANOVA for sensory analysis of pear texture by the trained panel in 2006 Crispness Hardness Fracturability Juiciness Pear (S) 33029 25855 177190 20484 Panelist (P) 1197 805 5065 6317 Interaction (S x P) 361 226 1987 2154 F value and significant levels from a two-way ANOVA Significant at P lt 005
86
Table 6 One-way ANOVA for instrumental analysis of apples in2005 and 2006
2005 Guss Sinclair AEMC AEMT Apple (S) 76539 42093 25545 2701
2006 Apple (S) 146833 128347 19576 9863 F value and significant levels from a One-way ANOVA Significant at P lt 005
87
Table7 One-way ANOVA for instrumental analysis of pears in 2006 Guss Sinclair AEMC AEMT Pear (S) 89178 13825 7987 11012 F value and significant levels from a One-way ANOVA Significant at P lt 005
88
Table 8 Correlation matrix of sensory texture attributes of apples for 2005 and 2006 Year 1 Crispness Hardness Fracturability Juiciness Chewiness Crispness 100 088 091 082 062 Hardness 088 100 092 080 064 Fracturability 091 092 100 085 061 Juiciness 082 080 085 100 058 Chewiness 062 064 061 058 100 Year 2 Crispness Hardness Fracturability Juiciness Chewiness Crispness 100 082 079 073 NA Hardness 082 100 085 065 NA Fracturability 079 085 100 067 NA Juiciness 073 065 067 100 NA
89
Table 9 Correlation matrix of sensory texture attributes of pears for 2006 Year 1 Crispness Hardness Fracturability Juiciness Crispness 100 086 087 -025 Hardness 086 100 090 -032 Fracturability 087 090 100 -028 Juiciness -025 -032 -028 100
90
Table 10 Correlation matrix of sensory attributes and instrumental determinations of apples in 2005 and 2006 Year 1 Crispness Hardness Fracturability Juiciness ChewinessGuss 072 078 074 066 064 Sinclair 081 082 083 076 065 Compressive EM 076 078 078 070 064 Tensile EM 057 062 063 053 1 Year 2 Crispness Hardness Fracturability Juiciness ChewinessGuss 078 083 076 066 NA Sinclair 075 079 074 063 NA Compressive EM 068 073 067 057 NA Tensile EM 088 078 074 069 NA EM Elastic Modulus
91
Table 11 Correlation matrix of sensory attributes and instrumental determinations of pears for 2006 Year 1 Crispness Hardness Fracturability Juiciness Guss 079 083 081 -041 Sinclair 068 071 071 -025 Compressive EM 059 061 059 -021 Tensile EM 085 079 081 -031
92
Figure 1 Apple firmness effect on sensory texture attributes for 2005
and 2006 harvest years
a
Different letters indicate significant differences (plt005) as determined by Tukeyrsquos
HSD
93
Figure 2 Apple differentiation of soft intermediate and hard apple
firmness for 2005 and 2006 combined harvest years
Soft
Intermediate
Hard
-2
-1
0
1
2
3
-4 -3 -2 -1 0 1 2 3
PC2
(35
3
)
PC1 (9647 )
94
Figure 3 Pear firmness effect on sensory texture attributes for 2006
harvest year
Different letters indicate significant differences (plt005) as determined by Tukeyrsquos
HSD
95
Figure 4 Pear differentiation of soft intermediate and hard pear
firmness for 2006 harvest year
96
REFERENCES
Abbott JA Watada AE and Massie DR 1976 Effe-gi Magnus-Taylor and Instron
fruit pressure testing devises for apple peaches and nectarines J Am Soc Hort
Sci 101698-700
Bongers AJ 1992 Comparison of three penetrometers used to evaluate apple
firmness Washington State University Tree Fruit Postharvest J 37-9
Bourne M 2002 Sensory methods of texture and viscosity measurement Ch 7 In
Food Texture and Viscosity Concept and Measurement 2nd Ed Academic Press
Geneva NY
Cardello AV Matas MA and Sweeney J 1982 The Standard Scales of Texture
Rescaling by Magnitude Estimation J Food Sci 47 1738-1740 1742
Civille GV and Szczesniak AS 1973 Guidelines to training a texture profile panel J
Texture Stud 4 204-223
Corrigan V Hurst L and Boulton G 1997 Sensory characteristics and consumer
acceptability of lsquoPink Ladyrsquo and other late-season apple cultivars New Zeal J
Crop Hort 25 375-383
Daillant-Spinnler B Macfie HJH Beyts PK and Hedderley D 1996 Relationships
between perceived sensory properties and major preference directions of 12
varieties of apples from the southern hemisphere Food Qual Prefer 7 113-126
DeBelie N Hallett IC Harker FR and Baerdemaeker J 2000 Influence of ripening and
turgor on the tensile properties of pears a microscopic study of cellular and tissue
changes J Am Soc Hort Sci 125(3) 350-356
Jaeger SR Andani Z Wakeling IN and Macfie HJH 1998 Consumer preference for
97
fresh and aged apples a cross cultural comparison Food Qual Pref 9 355-366
Harker FR and Hallett IC 1992 Physiological changes associated with development of
mealiness of apple fruit during storage HortSci 27 1291-1294
Harker FR and Hallett IC 1994 Physiological and mechanical properties of
kiwifruit tissue associated with texture change during cold storage J Am Soc
Hort Sci 119 987-993
Harker FR Maindonald JH and Jackson PJ 1996 Measurement of kiwifruit texture
operator and instrument differences J Am Soc Hort Sci 121 927-936
Harker FR Redgwell RJ Hallett IC Murray SH and Carter G 1997 Texture of fresh
fruit Hort Rev 20 121-224
Harker FR Hallett IC Murray SH and Carter G 1998 Food-Mouth interactions
towards a better understanding of fruit texture Acta Hort 464461-466
Harker FR Maindonald J Murray SH Gunson FA Hallett IC and Walker SB 2002
Sensory interpretation of instrumental measurements 1 texture of apple fruit
Postharvest Biol Tec 24 225-239
Harker FR Amos RL Echeverria G and Amdgunson FA 2006 Influence of texture on
taste insights gained during studies of hardness juiciness and sweetness of apple
fruit J Food Sci 71(2)S77-S82
Kapsalis JG and Moskowitz HR 1978 Views on relating instrumental tests to
sensory assessment of food texture J Texture Stud 9 371-393
Market Review 1996 UK fruit and vegetable market review 1995-1996 Fresh Fruit
and Vegetable information Bureau London
Meilgaard M Civille GV and Carr BT 1999 Descriptive analysis techniques Ch 10
98
In Sensory Evaluation Techniques 3rd Ed CRC Press Boca Raton FL
Munoz AM 1986 Development and application of texture reference scales J Sens
Stud 155-83
Paoletti F Moneta E Bertone A and Sinesio F 1993 Mechanical properties and
sensory evaluation of selected apple cultivars LWT 26 264-270
Peleg K 1993 Comparison of non-destructive and destructive measurement of apple
firmness J Agr Eng Res 55 227-238
Schoorl D and Holt JE 1983 A practical method for tensile testing of apple tissue J
Texture Stud 14 155-164
Shmulevich I Galili N and Howarth MS 2003 Nondestructive dynamic testing of
apples for firmness evaluation Postharvest Biol Tec 29 287-299
Stow J 1989 The involvement of calcium ions in maintenance of apple fruit tissue
structure J Exp Bot 40 1053-1057
Szczesniak AS Brandt MA and Friedman HH 1963 Development of standard rating
scales for mechanical parameters of texture and correlation between the objective
and the sensory methods of texture evaluation J Food Sci 28 397-403
Szczesniak AS and Ilker R 1988 The meaning of textural characteristics-
juiciness in plant food stuffs J Texture Stud 19 61-78
Thybo AK Kuhn BF and Martens H 2003 Explaining Danish childrenrsquos
preferences for apples using instrumental sensory and demographicbehavioral
data Food Qual Pref 15 53-63
Turner J Bai J Marin A and Colonna A 2005 Consumer sensory evaluation of pear
cultivars in the Pacific Northwest USA Acta Hort 671 355-360
99
Chapter Four
STANDARD SCALES FOR CRISPNESS CRACKLINESS AND
CRUNCHINESS IN DRY AND WET FOODS RELATIONSHIP
WITH ACOUSTICAL DETERMINATIONS
MAITE A CHAUVIN1 FRANK YOUNCE1 CAROLYN ROSS1 and
BARRY SWANSON12
1Food Science and Human Nutrition
Washington State University
Pullman WA 99164-6376 USA
2Corresponding author Dr Barry Swanson
Food Science and Human Nutrition
Washington State University Pullman WA 99164-6376 USA
Tel 1-509-335-3793
Fax 1-509-335-4815
Email swansonbwsuedu
STANDARD SCALES OF TEXTURE
100
ABSTRACT
To quantitatively evaluate food texture a trained panel developed rating scales for
crispness crunchiness and crackliness for dry and wet foods based on the auditory
perception of selected foods The newly developed scales were then evaluated by forty
untrained panelists and the sound perception of standard foods was assessed through the
analysis of the root mean square (RMS) of the 5 s audio waveforms and multidimensional
scaling (MDS) The RMS was highly correlated to auditory sensory perception of
crispness (r = 083 and 096) crunchiness (r = 099 and 099) and crackliness (r = 088
and 096) for dry and wet foods respectively MDS technique applied for the 40
untrained panelists was instructive in assessing auditory textural differences of naive
panelists and a good statistical instrument to graphically validate selected scales
Auditory perception of the selected foods were rated similarly using standard auditory
texture scales for crispness crunchiness and crackliness developed by the trained panel
and MDS results from the consumer panel
PRACTICAL APPLICATIONS
Crispness crunchiness and crackliness are not only important and useful
descriptors of food texture but are desirable textural qualities in many foods The lack of
consistency in the procedures used for evaluation of crunchy crispy and crackly in
sensory studies often results in confusion when training expert panels Research will
benefit textural studies through an improvement of consistent textural definitions
development of standard scales and evaluation techniques
The crispness crunchiness and crackliness scales developed and applied in the
current study represent a new potential standard frame of reference that may be used for
101
training panelists in texture parameters related to food auditory perception The scales
may be considered illustrations demonstrating full and practical ranges for each texture
attribute with regards to analyzing auditory parameters of foods The root mean square
(RMS) of the audio waveform is a reliable fast and convenient tool to analyze auditory
texture parameters in food while MDS is an effective means of analysis for comparing
auditory data generated by untrained panelists
KEY WORDS crispness crunchiness crackliness auditory perception MDS wet
foods dry foods RMS
102
INTRODUCTION
Textural properties are key drivers in food acceptability Texture in food is
perceived through a combination of visual tactile kinesthetic and auditory sensations
Crispy and crunchy properties are the main texture attributes affecting acceptability of
food with regard to auditory sensations (Roudaut et al 2002 Szczesniak 2002)
Although crispness and crunchiness are commonly used terms in sensory studies there is
little agreement among experts regarding their definitions and evaluation techniques
The association of acoustic sensations with the perception of texture was
previously studied for crisp crunchy and crackly foods (Drake 1963 Kapur 1971
Vickers and Bourne 1976 Vickers and Wasserman 1979 Vickers and Christensen
1980 Vickers 1981 1983 1984a 1984b 1987a 1987b Dacremont et al 1991 1995
Lee et al 1990 De Belie et al 2002 Luyten and Van Vliet 2006) The acoustic
sensations of a food are affected by the arrangements of cells chemical bonds fruit or
vegetable maturity and moisture (Al Chakra et al 1996) The noise production resulting
from biting is attributed to the rupture of the cell wall Few too many cells may rupture
at any point during the mastication process to produce an irregular series of sounds
resulting from crushing the cellular structure of foods (Vickers and Bourne 1976)
Cellular foods that contain only air within their cells such as biscuits or chips are
designated dry crisp foods while foods that contain fluids within their cells such as fruits
and vegetables are called wet crisp foods Edmister and Vickers (1985) believe that
although dry crisp and wet crisp foods differ in cellular composition both foods produce
similar auditory cues for crispness perception Vickers and Bourne (1976) suggested that
the mechanism of sound production for dry and wet foods is different but the consumer
103
perception while chewing either food is similar However Jowith (1974) Vickers and
Christensen (1980) and Mohamed et al( 1982) suggest that the loudness of panelistsrsquo
chewing sounds perception of crispness andor instrumental crispness determinations
may differ between dry and wet crisp foods
The sensory evaluation of crispness crunchiness and crackliness is a complex
process The use of the same descriptor in different studies with trained panelists is not a
guarantee that an equivalent sensory perception is observed For example ldquocrispyrdquo is
employed to illustrate the same parameters described by other panelists as ldquocrunchyrdquo
(Brown et al 1998 Guraya and Toledo 1996) Whether crispy and crunchy refer to a
similar sensory concept remains unresolved Seymour and Hamann (1988) and Vickers
(1981 1985) reported a strong positive correlation between crispness and crunchiness
which favors the hypothesis of two descriptors for a unique sensory perception
parameter However other research suggests that crispy and crunchy refer to different
sensory parameters (Dacremont 1991 1995) Moreover studies on crispness
crunchiness and crackliness conducted in several countries contribute additional
complexities in comparing the results (Roudaut et al 2002)
Descriptive analysis training of panelists for crispness crunchiness and
crackliness evaluation focuses on parameters such as the structure of the intact food
sounds emitted at fracture the force needed to crush the food the collapse of the food at
fracture and the appearance of pieces observed and perceived following fracture
(Roudaut et al 2002) However little agreement exists on definitions and techniques of
oral manipulation during chewing in determining crispness crunchiness and crackliness
104
Depending on the definitions (Tables 1 2 and 3) some parameters for crispy crunchy
and crackly foods are emphasized more than others (Roudaut et al 2002)
For acoustic studies of crisp crunchy and crackly food products two approaches
are generally followed The first acoustic approach determines the contribution of the
perception of air-conducted sounds to the sensation of crispness and crunchiness
(Christensen and Vickers 1981 Vickers 1979 1980 1981 1984a) The second acoustic
approach involves recording sounds produced during the application of force to a food to
obtain quantitative acoustic information regarding the crisp crunchy or crackly sounds
(Drake 1963 Kapur 1971 Vickers and Bourne 1976 Edmister and Vickers 1985
Vickers 1985 Seymour and Hamann 1988 Dacremont et al 1991) Acoustic
determinations are also combined with mechanical determinations (force-deformation) to
predict crispness and crunchiness (Vickers 1987 Szczesniak 1988) A combination of
acoustic and mechanical techniques more adequately describes food sound perception
than either technique alone (Vickers 1987)
The association that acoustic sensations exhibit with the perception of texture
provides the opportunity to develop a standard scale composed of crispy crunchy and
crackly food sounds that can be recorded and be free of changes with time The standard
scales will also be useful for texture comparison of foods among laboratories (Vickers
and Bourne 1976) and for descriptive analysis by trained panelists The objective of this
study was to establish a standard reference scale for selected dry and wet crisp crunchy
and crackly foods The relationship between acoustical and oral perception of crispness
crunchiness and crackliness was also developed in order to distinguish between sensory
evaluations of crispness crunchiness and crackliness sensory parameters
105
MATERIALS AND METHODS
DEVELOPMENT OF NEW TEXTURE REFERENCE SCALES
Panelists
Eight panelists from Washington State University participated in the development
of texture references for dry and wet crispness crunchiness and crackliness scales
Panelists included 8 females 21 to 63 years of age who were trained for 80 hours in a
previous study using the Texture Profile method (Civille and Szczesniak 1973)
Panelists were screened for normal hearing ability dental problems and other conditions
that may have affected their performance on the panel All panelists signed an Informed
Consent Form and the sensory evaluation protocols were approved by the Washington
State University Institutional Review Board for human subjects participation Panelists
received a small compensation for their participation in the study
Training Procedure
The first stage of training involved extensive instruction about methods and
descriptors of interest Literature regarding the techniques and definitions of crispness
crunchiness and crackliness was examined by the trained panel through a summary of
existing literature presented by the facilitator (Tables 1 2 and 3) A crispness scale
developed previously for descriptive training with dry foods (Meilgaard et al 1999) was
presented as a starting point of discussion and a modification of the scale was suggested
by the panelists in a focus group setting The facilitator took notes and the summary of
the discussion was distributed to each panelist following each session Due to the
variability in procedures and texture definitions the panelists agreed to establish a
comprehensive evaluation technique and definition of crispness crunchiness and
106
crackliness for texture evaluation of foods A variety of foods were selected for
consideration by the panelists as preliminary evaluation Foods were selected after
review of previous studies of crispness crunchiness and crackliness The objective was
to guide panelists in establishing the textural attribute of interest and standardization of
corresponding evaluation procedures to characterize crispness crunchiness and
crackliness The use of a 15 cm unstructured line scale indented 1 cm at both ends was
introduced during this stage of training Individual evaluations were marked on the
unstructured line scales anchored at the ends with the terms ldquononerdquo and ldquoextremerdquo This
rating method was used throughout the entire training period and during texture
evaluation sessions
Immediately following the initial orientation the panel met for a total of twenty
hours four hours per week for five weeks to practice the techniques developed during
the orientation training session Throughout this second stage of training the crispness
crunchiness and crackliness standard scales for dry and wet foods were developed and
definitions and evaluation techniques were discussed The development of each scale
started with a group discussion to suggest food items representing the texture
characteristic under study For the subsequent evaluations the potential reference
materials were purchased by the facilitator and evaluated by each panelist Group
discussion followed individual evaluations for each standard scale development
Consensus approval of each item and size was required before a food was accepted as a
standard Within each standard scale a range of commercial foods was selected to
develop the final standard scale Once the range of the standard scale was established
three replicate samples within a product type were evaluated Texture data for each
107
attribute were collected analyzed and uniformity and appropriateness of each food were
discussed by the panel
In the third stage of training two 2 hour sessions were held following scale
development for each standard scale The biting or chewing sounds generated by the
facilitator from each food along the newly developed standard scales were recorded in
triplicate The objective was to compare the recorded sounds generated by biting or
chewing every food on each standard scale by evaluation of the root mean square (RMS)
of all recorded sounds RMS was used as an instrumental method to compare the results
from perceptual texture assessment of the trained panel The RMS of the voltage output
was determined from the microphone which was proportional to the RMS of the sound
pressure Based on the RMS results of the recordings during subsequent sessions several
foods were eliminated by consensus of the panelists and new standard foods were
considered in order to include the entire range of intensities for every attribute When the
panelists considered that a range of standard foods was representative of a specific
intensity the food was included in the standard scale The final intensity of each
reference food on the scale was established by individual judgments followed by group
discussion to reach consensus The final foods selected for each standard scale are
presented in Tables 5 to 10
Acoustic Analysis of the Standard Scales
Foods for the developed standard scales (Tables 5 to 10) were purchased in a local
supermarket Fruits and vegetables were inspected visually and manipulated by hand to
determine freshness Sound recordings of an individual biting or chewing of the foods in
each standard scale were produced by employing the technique presented in Table 4 To
108
avoid recording the clacking of teeth when biting during the crispiness test a 158 mm
thick piece of FDA compliant silicone rubber sheet (Durometer 50A firmness) was
placed between the incisors in the mouth opposite of the food standard During both the
biting and chewing an AKG condenser microphone (model C577 Nashville Tennessee)
was held inside a Koss headphone (model Ur29 Milwaukee Wisconsin) and against the
outer ear immediately above the opening of the ear canal Chewing or biting sounds were
recorded on a personal computer using Syntrillium Cool Edit (Syntrillium Software
Corporation Phoenix Arizona) A Radio Design Labs low noise microphone
preamplifier (model STM 2 Prescott Arizona) with a Power One 24 volt linear DC
power supply (model HB24-12A) which was connected between the microphone and
the personal computer Six recordings of each food were recorded at 44100 kHz mono
in replicate and saved as 5 s ldquowavrdquo files Recorded sounds were analyzed using root
mean square (RMS) calculated from the voltage signal of the entire 5 s waveform by
means of Cool Edit program (Syntrillium Software Corporation Phoenix Arizona)
Data Analysis
Correlation analysis was conducted to identify correlations between auditory
determinations and the sensory panel evaluations Principal component analysis (PCA)
was applied to instrumental and sensory terms as a function of procedure means to
compare how the instrumental and sensory methods differentiated the texture attributes
(Version 753 XLSTAT Addinsoft France) Significance was established at p lt 005
109
CONSUMER PANEL
Panelists
Panelists were recruited from Washington State University staff students and members
of the community Panelists were screened for auditory conditions and interest in
participating in the study Minimal information about the study was given to the
panelists to reduce bias Panelists consisted of 27 women and 13 men between the ages
of 21 to 60 years All panelists signed an Informed Consent Form and the sensory
evaluation protocols were approved by the Washington State University Institutional
Review Board for human subjects participation Panelists received compensation for
participation in the study Panelists were also given a demographic questionnaire and
oral and written instructions before their participation in the study None of the panelists
expressed previous experiences with auditory evaluation of foods and were considered
naive panelists
Preparation of Recordings
The audio recordings from the acoustic analysis of the standard scales containing
minimal background noise were selected for the consumer panel
Multidimensional Scaling Test
Test foods consisted of the audio recordings representing the standard scales for
crispness crunchiness and crackliness for dry and wet foods Foods source and size of
all standard scales are presented in Tables 5 to 10 Multidimensional scaling (MDS) was
used to examine panelistsrsquo auditory perceived similarities among foods
Panelists participated in a single one hour test session Each panelist evaluated
the sound files individually in the presence of the facilitator Instructions to the panelists
110
included both an operational definition of each attribute to be presented to the panelists
(Table 4) as well as instructions on the utilization of similarity judgments scales
There were N(N-1)2 possible pairs to compare for a set of N foods in each
standard scale Panelists listened to the audio recordings through a Koss Ur29
headphones connected to a personal computer Panelists were instructed that a person
was biting or chewing a food and were asked to compare the loudness (the degree of
volume of the sound) of each pair of audio recordings
Audio recordings were presented as paired comparisons together with a ballot
asking panelists to quantitatively rate the similarity between the two audio recordings of
food being bitten or chewed A similarity 9-point scale with the words ldquoexactly the
samerdquo at the high end (9) and ldquocompletely differentrdquo at the low end (1) was presented to
the panelists Similarity judgments were formulated by writing a number describing
quantitatively the perceived similarity between each pair Once each panelist was
finished with the first comparison shehe was instructed to advance to the second
comparison A separate ballot was provided for each standard scale and all panelists
were instructed to wait one minute between each standard scale Panelists were not
permitted to go back review or change previous responses
Pairs of foods audio recordings were presented in a random order labeled with a
three digit code Each audio recording pair was analyzed once by each panelist A total
of 10 paired comparisons for crispness of dry and wet foods crunchiness of wet foods
and crackliness of dry and wet food sounds were analyzed A total of 15 paired
comparisons for crunchiness of dry food sounds were also evaluated
111
Data Analysis
One matrix was constructed from the pairwise similarity scores for each standard
scale for crispness crunchiness or crackliness of dry and wet foods for each of the forty
panelists Every cell within each matrix yielded a similarity score ranging from 1 to 9
quantifying perceived differences in auditory perception on the 9-point scale
The forty individual matrices were combined to yield one matrix for each
standard scale illustrating the mean group pairwise similarity scores Each cell within
the group matrices yielded a mean score for each standard food on every scale reflective
of the 9-point scale
Data were analyzed as similarity estimates with XLSTAT 754 (Addinsoft Paris-
France) MDS algorithm ALSCAL module for nonmetric multidimensional scaling
using the option for minimizing Kruskalrsquos stress Formula 1 two-dimensional solutions
was applied Outputs included an assessment of stress quantifying the fit between the
data and the scaling model and R2 values calculating the variability among underlying
data that accounted for the MDS solution (Zraick 2000)
RESULTS and DISCUSSION
Tables 5 to 10 present the standard scales developed for crispness crunchiness
and crackliness of dry and wet foods The standard scales include the range of intensity
of a selected textural auditory characteristic observed with biting and chewing in food
products as perceived by panelists Each point on the scale is represented by a specific
food product allowing the designation of a numerical rating to an unknown food by
comparing it to a known food Within each scale a range of specific auditory textural
112
parameters is demonstrated using foods that have the attribute under study as a major
property The advantage of a multi-food standard scale is that frequently a given
attribute is perceived differently in selected foods Converting food texture standard
scales to a one-dimensional series may be undesirable because a single dimension may
distort illustration of diversified sensory perceptions of the textural parameters (Civille
and Liska 1975) The standard scales are not intensity scales against which foods are
compared to obtain a rating Rather the standard scales are illustrations that demonstrate
the principal range of selected textural characteristics The standard scales for crispness
crunchiness and crackliness of dry and wet products are offered as a means of helping the
food researcher obtain descriptive and quantitative sensory data on textural characteristics
related to sound emitted during chewing or biting of food The use of a descriptive panel
over a compression instrument is preferred when working with masticatory sounds
because it includes changes during mastication particularly its hydration with saliva
(Dacremont et al1991)
The procedures for texture sensory evaluation must adhere to rigid testing
controls Table 4 presents the methods used in this study to assess crispness crunchiness
and crackliness Attention to preparation serving presentation biting and chewing
techniques must be standardized (Civille and Szczesniak 1973) The entire panel must
receive consistent training in the principles and evaluation methods of crispness
crunchiness and crackliness of foods Many factors may be responsible for the large
variation in crisp crunchy or crackly sounds the size shape and orientation of the food
in the mouth the amount of contact surface between the teeth and the food the degree to
which the mouth is opened variations within the food the rate and force of biting or the
113
way the food breaks down A properly trained panel will minimize variation (Vickers
and Bourne 1976) The appropriate use of auditory textural scales will yield data
reproducible among panelists panels and locations The reproducibility of the trained
panel is related to establishment of common frames of reference among panelists and
panels
The consumer study conducted was analyzed through Multidimensional Scaling
(MDS) MDS was performed for the newly developed standard scales for crispness
crunchiness and crackliness of dry and wet foods Analyses of the six standard auditory
texture scales were performed in the two-dimensional configuration The mean stress
values were small (lt01) and reflected the ability of the MDS algorithm to fit calculated
distances to the texture results in two dimensions MDS two-dimensional graphical
representation of crispness crunchiness and crackliness for dry and wet foods are
presented in Figures 1 to 6 All figures illustrate agreement with the newly developed
standard scales for all attributes Every food in the consumer MDS graphical
representation is located in a similar location as presented in all standard scales
developed by the trained panel
The first dimension in the MDS output for auditory crispness of dry foods is
attributed to the texture characteristic of crispness (Figure 1) The food items that
represented the intensity of a specific stimulus are located in similar geometrical space as
their location on the standard food texture scale The second dimension may be credited
to other auditory cues because the panelists were not trained and were considered naiumlve
consumers Similar trends were observed for crispness in wet foods (Figure 2) and
crunchiness in dry and wet foods (Figures 3 and 4 respectively) The second dimension
114
in the MDS output for crackliness in dry and wet foods (Figures 5 and 6) is attributed to
the texture characteristic of crackliness and the first dimension to other auditory cues
The consumer study confirms the perceptual differences identified by the panelists
among crispness crunchiness and crackliness The consumer results indicate that the
standard scales were appropriately developed and are useful for further training of
panelists for texture evaluation
Jowith (1974) Vickers and Christensen (1980) and Mohamed et al (1982)
suggested that sensory crispness andor instrumental crispness determination may differ
between wet and dry crisp foods The results of the current study support this theory
Figure 7 from the MDS analysis illustrates the separation on wet and dry foods along the
three attributes Panelists were able to differentiate between auditory crispness
crunchiness and crackliness and also between wet and dry foods Three independent
clusters between each texture attribute of crispness crunchiness and crackliness are
observed and within each cluster a clear distinction between dry and wet foods is seen
The difference between dry and wet foods and its relationship with auditory
perception presented in Figure 7 can be explained by the fact that most wet foods are
comprised of living cells and contribute turgidity A sound is generated whenever a
turgid cell is ruptured Strong cell walls can withstand more pressure and release more
moisture on chewing or biting producing a louder noise Soft cell walls exhibit little or
no accompanying sounds during chewing or biting therefore a decrease in sound is
observed (Vickers and Bourne 1976) The mechanism of sound production in dry foods
is different In dry foods the cells are filled with air and the cell walls are brittle The
sounds are produced from the collective breaking of individual cells when biting or
115
chewing is applied to a brittle cell wall When the cell wall bends and breaks the
residual of the cell wall and any fragments snap back to the original shape generating a
sound Loudness in dry foods is influenced by the velocity of which the broken cell wall
vibrates The decrease of cell wall stiffness resulting from an increase in moisture
content is accompanied by a decrease in sound production (Vickers and Bourne 1976)
The assessment of wet foods standard scales could be problematic during training
due to cultivar and regional differences of fruits and vegetables Szczesniak and Ilker
(1988) successfully developed a standard scale for juiciness analysis consisting of
selected fruits Using wet foods Munoz (1986) also developed standard scales for
adhesiveness to lip cohesiveness of mass adhesiveness to teeth and wetness analysis
Although work went into the selection of the foods representing the various points in
each scale in the present study some foods may not be readily available due to
seasonality or location It is feasible to substitute foods in each standard scale depending
on specific needs circumstances and availability When an appropriate food substitute is
identified it should be evaluated objectively to ensure that the food is similar to the
original reference food Evaluation is important to make certain that the food substitute
exhibits the proper intensity of the desired auditory textural characteristic (Civille and
Liska 1974)
The newly developed standard scales for crispness crunchiness and crackliness
for dry and wet foods were validated instrumentally by calculating the average power
estimated from the RMS of the voltage signal Table 11 presents strong correlations (r =
083 to 099) between the average power and sensory evaluations of crispness
crunchiness and crackliness for wet and dry foods The average RMS power is a strong
116
measure of the overall loudness of the waveform selection Vickers and Bourne (1976)
observed less total sound produced in the less crisp foods and louder sound production in
more crisp foods The difference in perceived crispness was associated with a difference
in the number of sounds produced in a given biting distance and the loudness of the
sounds produced Vickers and Christensen (1980) evaluated how crispness loudness and
firmness were perceived by panelists by both biting and chewing the food concluding
that the chewing or biting technique made no difference in the sensory judgments The
relationship between crispness and loudness suggested that crispness judgments were
more highly correlated to the auditory sensation of loudness than to the tactile sensation
of firmness Snap loud and crackly were other sensory attributes closely associated with
crispness
Moskowitz and Kapsalis (1974) Vickers (1979) Vickers and Wasserman (1980)
Vickers (1984b) Szczesniak and Kahn (1971) and Vickers (1981) produced evidence to
indicate that crispness crunchiness and crackliness are closely related attributes and are
not descriptors of one attribute alone In the current research perceptual sensory
differences among crispness crunchiness and crackliness were found (Figure 7)
Untrained panelists separated auditory sensations when judgments were made on the
basis of loudness only Vickers (1981) observed high correlations between crispness
crunchiness and hardness and between oral and auditory perception of foods Vickers
(1984a) evaluated crackliness and hardness of food under three selected conditions
normal biting and chewing with biting and chewing sounds blocked and by listening to
recorded biting and chewing sounds Vickers (1984) concluded that either oral tactile
cues or auditory cues can be used to make crackliness judgments The current study
117
research demonstrates that auditory cues are adequate to identify crispness crunchiness
and crackliness perception of foods
CONCLUSIONS
The developed standard scales for crispness crunchiness and crackliness for dry
and wet foods provide individuals interested in auditory texture evaluation a starting
point to assist in training descriptive analysis of food texture Although future
modifications in reference material attribute definition or evaluation procedures are
expected this study represents a first step in the generation of reproducible auditory
sensory data using standard scales MDS output demonstrated that crispness crunchiness
and crackliness are distinguishable sensory texture parameters belonging to selected
distinguishable concepts and can be analyzed by the sole presence of auditory cues
Also it was demonstrated that there is a perceptual difference between texture attributes
for dry and wet foods and that differentiating between both is essential for descriptive
analysis training
ACKOWLEDGMENTS
A special recognition to the expert panel from Washington State University for
their enthusiastic participation and contribution to this study C Armfield E Giesbers
MJ Hamilton P Konomos S Lee M Sanborn D Setiady
118
TABLES AND FIGURES
Table 1 Literature citations of crispness Definition Technique Reference
Relative force required to bite through the product
Biting with front teeth
Jeon et al 1975
Products that produce a higher pitched sound Biting with front teeth
Vickers 1984b
First Bite place the product between the incisors bite through and evaluate the level of higher pitched noise
Biting with front teeth
Seymour and Hamman 1988
Firm and brittle snaps easily emitting a typical sound upon deformation
NA Szczesniak 1988
The perceived relative force used by crunching the product in the mouth
Molars Onwulata and Heymann 1994
The perceived force with which the product separates into two or more distinct pieces during a single bite with the incisors An abrupt and complete failure of the product is required
Incisors first bite
Barrett 1994
Products that produce a high pitched sound that show high level of frequency higher than 5 kHz especially for air conduction sounds
Only incisors or bitten and chewed
Dacremont 1995
The amount and pitch of sound generated when the product is first bitten with the front teeth
Front teeth bite
Harker et al 1997
A combination of the noise produced and the breakdown of the product as it is bitten entirely through with the back molars
Biting with the back molars
Duizer et al 1998
Fractures in an abrupt manner after applying a relatively small force on the product
Front teeth first bite
Vincent et al 2002
Fracture in an abrupt brittle manner after applying a relatively small force on the product on the first chew with the molars
Molars second bite
Vincent et al 2002
Cracks you can force your teeth through slowly more airy than crackling
At first bite Dijksterhuis et al 2005
119
Soft sound more airy than crackling Association with fresh disintegrates into pieces smaller than when crackling
During chewing
Dijksterhuis et al 2005
A combination of the type of sound ie short snapping and longer cracking sounds and the force to bite and chew as perceived on the first bite
First bite Duizer and Winger 2006
120
Table 2 Literature citation of crunchiness Definition Technique Reference
Is the perceived hardness of a food after it is crushed and chewed in the mouth 2-3 times Also defined as the amount of force necessary to crush and grind the cube during the second and subsequent chews
Chewing with molars
Moskowitz et al 1974
Products that produce lower pitched sounds are less loud and last longer than for crisp Firm and brittle Snaps easily with typical sound
Chewing with molars
Vickers 1984b
Degree of low pitched noise (with respect to crisp sounds) but above threshold pitch considered too low
Place product between molar teeth
Seymour and Hamman 1988
Complex failure mechanism that involves repetitive deformation and fracturing of cell structure Necessary are structural subunits especially with cells with brittle cell walls Continuous fracture during chewing Sensory description the perceived intensity of repeated incremental failures of the product during a single complete bite with the molar teeth
First bite with molars
Barrett 1994
The perceived cumulative intensity of force required for repeated incremental failures of the product by chewing up to five times with the molars
Chewing with molars
Guraya and Toledo 1996
Harker et al 1997 The amount of noise generated when the product is chewed at a fast rate with the back teeth
Chewing with back teeth
Products that produce a low-pitched sound with a characteristic peak on frequency range 125 to 2 kHz for air conduction
Only incisors or bitten and chewed
Dacremont 1995
Temporal aspects of the sensory feedback during mastication are important for the crunchy sensation Independent from hardness
Chewing with molars
Brown et al 1998
121
Crunchy would be associated with a hard and dense texture that fractures without prior deformation producing a loud low-pitch sound that is repeated during several chews Crunchy is more relevant to fruits and vegetables when compared to crispness
Mainly during chewing
Fillion and Kilcast 2001
Fractures after applying a higher force on the product than for crispness
Front teeth first bite
Vincent et al 2002
Fractures after applying a higher force on the product than for crispness on the first chew with the molars
Molars second bite
Vincent et al 2002
High-pitched sound light sound long sounding During chewing Dijksterhuis et al 2005
122
Table 3 Literature citations of crackliness Definition Technique Reference
To make small sharp sudden and repeated noises
At first bite or during chewing
Vickers 1984a
Products that generate low-pitched sounds with a high level of bone conduction Discrimination between crackly and crunchy foods could be due to vibrations propagated by bone conduction that also generated vibrotactile sensations
Only incisors Dacremont 1995
Combination of sound and bite force Clip between the teeth and it breaks Crackling is harder than crispy It snaps
At first bite Dijksterhuis et al 2005
Audible for a long period during chewing bigger pieces mainly of the crust
During chewing Dijksterhuis et al 2005
123
Table 4 Technique for the evaluation of crispness crunchiness and crispness developed by seven trained panelists Crispness Place the product between the incisors (front
teeth) bite through the product and evaluate the intensity of the sound after the first bite using as near as possible the same biting rate and force for all products in the scale
Crunchiness Place products between molars bite down with low pressure (regular eating pattern) Chew product 2 to 3 times and listen to the sound produced and how the sound diminishes (intensity and duration of the sound)Place product between molars and bite once with a lot of force without grinding the products Snap down
Crackliness Place product between molars and bite once with a lot of force without grinding the products Snap down
124
Table 5 Crispness standard scale for dry foods developed by seven trained panelists Scale value Reference BrandManufacturer Sample Size
2 Rice Krispies Treats Kelloggs 16 bar 5 Fiber Rye Wasa 13 slice 8 Multigrain Mini Rice Cakes (Honey Graham) Quaker 1 cake
10 Tortilla Chips (Bite size Tostitos) Frito Lay 1 chip 15 Kettle Chips Frito Lay 1 chip
125
Table 6 Crispness standard scale for wet foods developed by seven trained panelists Scale value Reference BrandManufacturer Sample Size
0 Banana Supermarket 12 thick slice 4 Gala Apple Supermarket 12 thick slice
75 Granny Smith Apple Supermarket 12 thick slice 10 Jicama Supermarket 12 thick slice 15 Carrots Supermarket 1 mini peeled carrot
126
Table 7 Crunchiness standard scale for dry foods developed by seven trained panelists Scale value Reference BrandManufacturer Sample Size
1 Rice Krispies Treats Kelloggs 16 bar 4 Goldfish Baked Crackers Pepperidge Farm 1 cracker 7 Cheez-it Baked Snack Crackers Sunshine 1 cracker 9 Tortilla Chips (Bite size Tostitos) Frito Lay 1 chip
12 Honey Maid Graham Honey Sticks Nabisco 1 stick 15 Melba Toast Old London 12 toast
127
Table 8 Crunchiness standard scale for wet foods developed by seven trained panelists
Scale value Reference BrandManufacturer Sample Size 0 Banana Supermarket 12 thick slice 4 Gala Apple Supermarket 12 thick slice
10 Jicama Supermarket 12 thick slice 125 Banquet Baby Dill Nalley 12 thick slice 15 Green Pepper Supermarket 12 thick slice
128
Table 9 Crackliness standard scale for dry foods developed by seven trained panelists Scale value Reference BrandManufacturer Sample Size
2 Club Cracker Keebler 12 cracker 7 Multigrain Mini Rice Cakes Quaker 12 cake 9 Le Petit Beurre Tea Cookie Lu 18 square
12 Triscuit Nabisco 14 broken with the grain 15 Ginger Snap Archway 12 cookie
129
Table 10 Crackliness standard scale for wet foods developed by seven trained panelists Scale value Reference BrandManufacturer Sample Size
1 Medium Black Olives Canned 1 olive 5 Daikon Radish Supermarket 14 thick slice
75 Turnip Supermarket 14 thick slice 10 Jicama Supermarket 14 thick slice 15 Carrots Supermarket 12 mini peeled carrot
130
Table 11 Correlation between auditory recordings (average RMS) and sensory evaluation by untrained panel r Crispness Dry Foods 083Crispness Wet Foods 096Crunchiness Dry Foods 099Crunchiness Wet Foods 099Crackliness Dry Foods 088Crackliness Wet Foods 096
131
Figure 1 MDS representation of auditory crispness for dry foods
Rice Krispie Treats
Fiber Rye
Mini Rice Cakes
Tortilla Chips
Kettle Chips
-5
-4
-3
-2
-1
0
1
2
3
4
5
-5 -4 -3 -2 -1 0 1 2 3 4 5
--D
im1
--gt
-- Dim2 --gt
Configuration in space Dim2 times Dim1 (stress 0076)
132
Figure 2 MDS representation of auditory crispness for wet foods
Banana
Gala Apple
Granny Smith Apple
Jicama
Carrots
-6
-4
-2
0
2
4
6
-6 -4 -2 0 2 4 6
--D
im1
--gt
-- Dim2 --gt
Configuration in space Dim2 times Dim1 (stress 0090)
133
Figure 3 MDS representation for auditory crunchiness for dry foods
Rice Krispies Treats
Goldfish Baked Crackers
Cheez-it Crackers
Graham Honey Sticks
Tortilla Chips
Melba Toast
-5
-4
-3
-2
-1
0
1
2
3
4
5
-5 -4 -3 -2 -1 0 1 2 3 4 5
--D
im1
--gt
-- Dim2 --gt
Configuration in space Dim2 times Dim1 (stress 0087)
134
Figure 4 MDS representation of auditory crunchiness for wet foods
135
Figure 5 MDS representation of auditory crackliness for dry foods
136
Figure 6 MDS representation of auditory crackliness for wet foods
137
Figure 7 MDS representation for overall auditory crispness crunchiness and
crackliness for dry and wet foods
138
REFERENCES
AL CHAKRA W ALLAF K and JEMAI AB 1996 Characterization of brittle food
products Application of acoustical emission method J Text Stud 27 327-
348
BARRETT AH CARDELLO AV LESHER LL and TAUB IA 1994
Cellularity mechanical failure and textural perception of corn meal extrudates J
Text Stud 25 77-95
BROWN WE LANGLEY KR and BRAXTON D 1998 Insight into consumer
assessments of biscuit texture based on mastication analysis-hardness versus
crunchiness J Text Stud 29 481-497
CHRISTENSEN CM and VICKERS ZM 1981 Relationships of chewing sounds to
judgments of crispness J Food Sci 46 574-578
CIVILLE GV and SZCZESNIAK AS 1973 Guidelines to training a texture profile
panel J Text Stud 4 204-223
CIVILLE GV and LISKA IH 1975 Modifications and applications to foods of the
general foods sensory texture profile technique J Text Stud 6 19-31
DACREMONT C COLAS B and SAUVAGEOT F 1991 Contribution of the air
and bone conduction to the creation of sounds perceived during sensory
evaluation of foods J Text Stud 22 443-456
DACREMONT C 1995 Spectral composition of eating sounds generated by crispy
crunchy and crackly foods J Text Stud 26 27-43
DE BELIE N HARKER FR and DE BAERDEMAEKER J 2002 Crispness
139
judgments of royal gala apples based on chewing sounds Biosystems Eng 81
297-303
DIJKSTERHUIS G HANNEMIEKE L DE WIJK R and MOJET J 2005 A new
sensory vocabulary for crisp and crunchy dry model foods Food Qual Pref 18
37-50
DRAKE BK 1963 Food crushing sounds- An introductory study J Food Sci 28
233
DUIZER LM CAMPANELLA OH and BARNES GRG 1998 Sensory
instrumental and acoustic characteristics of extruded snack food products J
Text Stud 29 397-411
DUIZER LM and WINGER RJ 2006 Instrumental measures of bite forces
associated with crisp products J Text Stud 37 1-15
EDMISTER JA and VICKERS ZA 1985 Instrumental acoustical measures of
crispness in foods J Text Stud 16 153-167
FILLION L and KILCAST D 2001 Consumer perception of crispness and
crunchiness in fruits and vegetables Food Qual Pref 13 23-29
GURAYA HS and TOLEDO RT 1996 Microstructural characteristics and
compression resistance as indices of sensory texture in a crunchy snack product
J Text Stud 27 687-701
HARKER FR REDGWELL RJ HALLET IC and MURRAY SH 1997 Texture
in fresh fruit Hort Rev 20 121-224
140
JEON IJ BREENE WM and MUNSON ST 1975 Texture of fresh pack whole
cucumber pickles correlations of instrumental and sensory measurements J
Text Stud 5 399-409
JOWITT R 1974 The terminology of food texture J Text Stud 5 351-358
KAPUR KK 1971 Frequency spectrographic analysis of bone conducting chewing
sounds in persons with natural and artificial dentitions J Text Stud 2 50-61
LEE III WE SCHWEITZER MA MORGAN GM and Shepherd DC 1990
Analysis of food crushing sounds during mastication total sound level studies J
Text Stud 21 165-178
LUYTEN H and VAN VLIET T 2006 Acoustic emission fracture behavior and
morphology of dry crispy foods a discussion article J Text Stud 37 221-
240
MEILGAARD M CIVILLE GV and CARR BT 1999 The Spectrumtm descriptive
analysis method Ch 11 In Sensory Evaluation Techniques 3rd Ed CRC Press
Boca Raton FL
MOHAMED AAA JOWITT R and BRENNAN JG 1982 Instrumental and
sensory evaluation of crispness 1 in friable foods J Food Eng 1 55-75
MOSKOWITZ HR SEGARS RA KAPSALIS JG and KLUTER RA 1974
Sensory ratio scales relating hardness and crunchiness to mechanical properties
of space cubes J Food Sci 39 200-202
MUNOZ AM 1986 Development and application of texture reference scales J Sens
Stud 1 55-83
ONWULATA C and HEYMANN H 1994 Sensory properties of extruded corn meal
141
related to the spatial distribution of process conditions J Sens Stud 9 101-112
ROUDAUT G DACREMONT C VALES PAMIES B COLAS B and MESTE M
2002 Crispness A critical review on sensory and material science approaches
Trends Food Sci Technol 13 217-227
SEYMOUR SK and HAMANN DD 1988 Crispness and crunchiness of selected
low moisture foods J TextStud 19 79-95
SZCZESNIAK AS 1988 The meaning of textural characteristics ndash crispness J
Text Stud 19 51-59
SZCZESNIAK AS and ILKER R 1988 The meaning of textural characteristics-
juiciness in plant food stuffs J Text Stud 19 61-78
SZCZESNIAK AS 2002 Texture is a sensory property Food Qual Prefer 13 215-
225
VICKERS Z M and BOURNE MC 1976 A psycho acoustical theory of crispness
J Food Sci 41 1158-1164
VICKERS ZM and WASSERMAN SS 1979 Sensory qualities of food sounds
based on individual perceptions J Text Stud 10 319-332
VICKERS Z M and CHRISTENSEN CM 1980 Relationships between sensory
crispness and other sensory instrumental parameters J Text Stud 11 291-307
VICKERS ZM 1981 Relationship of chewing sounds to judgments of crispness
crunchiness and hardness J Food Sci 47 121-124
VICKERS ZM 1984a Crackliness relationships of auditory judgments to tactile
judgments and instrumental acoustical measurements J Text Stud 15 49-
58
142
VICKERS ZM 1984b Crispness and crunchiness- a difference in pitch J Text
Stud 15 157-163
VICKERS ZM 1985 The relationship of pitch loudness and eating technique to
judgments of crispness and crunchiness of food sounds J Text Stud 16 85-
95
VICKERS ZM 1987a Instrumental measures of crispness and their correlation with
sensory assessment J Text Stud 19 1-14
VICKERS ZM 1987b Sensory acoustical and force deformation measurements of
potato chips crispness J Food Sci 52138-140
VINCENT JFV and SAUNDERS DEJ 2002 The use of critical stress intensity
factor to quantify hardness and crunchiness objectively J Text Stud 33 149-
159
143
Chapter Five
Conclusions and Future Work
1 Conclusions
bull Multidimensional scaling is a robust exploratory statistical and graphical
technique effectively producing a graphical representation of overall similarity in
food texture perceptions from selected sensory panelists MDS significance in
validating existing scales is to visually evaluate if scales created in the past retain
their properties and functions as when they were originally developed
bull Sensory results of apples and pears texture indicate strong correlations among the
sensory texture attributes of crispness hardness and fracturability for apples and
pears Disparity in juiciness perceptions in apples and pears were attributed to the
differences in cell structure
bull When correlating sensory evaluation to instrumental determinations both the
Sinclair iQtrade System and the Guss pressure sensor provided a reasonable
predictor of apple hardness The tensile properties of apples and pears may
potentially predict crispness but accurate predictions are highly dependent on the
orientation of the fruit when analyzed by an instrument or in the mouth A
combination approach assaying with an instrument to determine compressive and
tensile properties provides the most accurate prediction of apple and pear textural
properties compared to any existing method
bull The developed standard texture scales for crispness crunchiness and crackliness
for dry and wet foods provides individuals interested in auditory texture
evaluation a starting point to assist in training sensory panelists for descriptive
144
analysis of food texture Although future modifications in reference foodsrsquo
attribute definitions or evaluation procedures are expected this study represents a
first step in the generation of reproducible auditory sensory data using food
standard texture scales
bull The average power calculated from the RMS voltage signal is a reliable rapid
and straightforward tool to analyze auditory texture parameters in food
bull MDS output demonstrates that crispness crunchiness and crackliness are
distinguishable sensory texture parameters belonging to selected distinguishable
concepts and may be analyzed solely by auditory cues Also a perceptual
difference is observed between texture attributes for dry and wet foods
Differentiating between both is essential for more accurate descriptive analysis
training
145
2 Future Work
bull There is a need for improved training of sensory texture panelists
selection for panelists sensitive to texture notes and more attention
devoted to understanding texture nomenclature Developing official
international standards for sensory texture testing procedures will allow
for normalized results among panelists laboratories and countries
bull More studies are needed to obtain improved correlations between sensory
texture profile analysis and instrumental texture profile analysis
bull The knowledge base of the psychological factors influencing perception
and individualsrsquo choices should be integrated with physiological factors
This can be integrated with the use of multivariate statistical techniques
widely used in sensory science Interactions between texture and other
sensory modalities must be taken into account in understanding texture
influences
bull There is a fundamental lack of understanding of physiological factors
influencing texture perception mechanisms and mastication processes
Dental research must be integrated into sensory research studies for
example dental researchers are focused on mastication while sensory
scientists are focused on first bite The integration of both sciences can
complement each other and offer great opportunity of fully understanding
the perception of textural properties in foods
146
bull A new generation of texture assessment instrumentation is needed that can
operate at greater compression speeds especially for foods that are strain
rate sensitive
bull Understanding the influence of saliva on the texture of food may be
valuable because knowledge may provide a better understanding of the
full sequence of the mastication process More studies are needed on the
chemical composition and rheological properties of saliva and how
selected foods affect the amount or type of saliva induced in the mouth
Also more studies regarding the interactions of saliva with foods and the
effects on the structure of foods are needed to fully understand food
texture
147
- m_chauvin_10029078_ Part I
- m_chauvin_10029078_Part II
-

To the Faculty of Washington State University
The members of the Committee appointed to examine the dissertation of MAITE
ANDREA CHAUVIN find it satisfactory and recommend that it be accepted
______________________________ Chair ______________________________ Co-Chair ______________________________ ______________________________
ii
ACKNOWLEDGMENTS
I would like to take the opportunity to acknowledge and thank all those who have
helped me in any way through this research I wish to thank my advisor Dr Barry G
Swanson and the other members of my committee Drs Carolyn Ross Stephanie Clark
and Craig Parks for their time support expertise encouragement advice and confidence
while I worked towards my doctorate degree
In addition I would like to express my sincere appreciation to the following
bull My husband and parents for their support encouragement and love
bull Frank Younce for your friendship help and suggestions in my research Thank
you for always being there when I needed you
bull Tina Plotka Mike Costello and Karen Weller for their continuous support in the
lab
bull The office personnel for answering all my questions (Jodi Richard Carolee and
Marsha)
bull All graduate students for their love and encouragement throughout the PhD
program
It has been great working with all of you
iii
FOOD TEXTURE AND PERCEPTION
Abstract
by Maite Andrea Chauvin PhD
Washington State University
December 2007
Chair Barry G Swanson
Co-Chair Carolyn Ross
The most complete system of sensory texture determination is the General Foods
Sensory Texture Profiling Technique (Brandt et al 1963 Szczesniak et al 1963) The
first objective of the current research was to validate through a multidimensional (MDS)
representation the standard texture scales presented for select foods in the General Foods
Sensory Texture Profiling Technique MDS is highly instructive in quantitatively
assessing the perceptions of naive panelistsrsquo qualitative textural differences of food as
well as a good statistical instrument to graphically validate existing food texture scales
The selected textures of standard foods were rated similarly using MDS and food
standard texture scales
The second objective was to study the sensory textural attributes of apples and
pears and the relationships between human sensory perception instrumental firmness
and tensile material properties of apples and pears Significant correlations were
observed among the sensory texture attributes of crispness firmness and fracturability for
iv
apples and pears (r gt 088) Differences in juiciness perception of apples and pears were
attributed to differences in cell structure When correlating sensory to instrumental
determinations the Sinclair iQtrade System texture assessment tool provided acceptable
correlations of apple firmness (r = 079 to 082) Guss pressure sensor provided
significant correlations of apple (r = 078 to 083) and pear (r = 083) firmness Tensile
determinations predicted crispness in apples (r = 088) and pears (r = 085) well
The third objective was to establish a standard texture scale for dry and wet crisp
crunchy and crackly foods The relationship between acoustical and oral sensation of
crispness crunchiness and crackliness of selected standard foods was also evaluated A
consumer study of the newly developed texture scales was validated through MDS The
developed standard scales for crispness crunchiness and crackliness for dry and wet
foods provide individuals interested in auditory texture evaluation a starting point to
assist in training panelists in descriptive analysis of food texture MDS output
demonstrated that crispness crunchiness and crackliness are distinguishable sensory
texture attributes that belong to selected discernible concepts and may be accurately
recognized by the sole presence of auditory cues
v
TABLE OF CONTENTS
ACKNOWLEDGEMENTShelliphelliphelliphelliphelliphelliphelliphelliphelliphelliphelliphelliphelliphelliphelliphelliphelliphelliphelliphelliphelliphelliphelliphellipiii
ABSTRACThelliphelliphelliphelliphelliphelliphelliphelliphelliphelliphelliphelliphelliphelliphelliphelliphelliphelliphelliphelliphelliphelliphelliphelliphelliphelliphelliphelliphellipiv
LIST OF TABLEShelliphelliphelliphelliphelliphelliphelliphelliphelliphelliphelliphelliphelliphelliphelliphelliphelliphelliphelliphelliphelliphelliphelliphelliphelliphellipix
LIST OF FIGUREShelliphelliphelliphelliphelliphelliphelliphelliphelliphelliphelliphelliphelliphelliphelliphelliphelliphelliphelliphelliphelliphelliphelliphelliphelliphellipxii
DEDICATIONhelliphelliphelliphelliphelliphelliphelliphelliphelliphelliphelliphelliphelliphelliphelliphelliphelliphelliphelliphelliphelliphelliphelliphelliphelliphelliphellipxiv
1 INTRODUCTION
LITERATURE REVIEW
1 Texturehelliphelliphelliphelliphelliphelliphelliphelliphelliphelliphelliphelliphelliphelliphelliphelliphelliphelliphelliphelliphelliphelliphelliphellip1
2 Texture Profile Analysis and Standard Scales of Texturehelliphelliphelliphellip2
3 Multidimensional Scalinghelliphelliphelliphelliphelliphelliphelliphelliphelliphelliphelliphelliphelliphelliphelliphelliphellip6
4 Texture of Fresh Fruithelliphelliphelliphelliphelliphelliphelliphelliphelliphelliphelliphelliphelliphelliphelliphelliphelliphellip9
41 Fruit Texturehelliphelliphelliphelliphelliphelliphelliphelliphelliphelliphelliphelliphelliphelliphelliphelliphelliphelliphelliphelliphellip9
42 Fruit Anatomyhelliphelliphelliphelliphelliphelliphelliphelliphelliphelliphelliphelliphelliphelliphelliphelliphelliphelliphelliphellip9
43 Food-Mouth Interactionshelliphelliphelliphelliphelliphelliphelliphelliphelliphelliphelliphelliphelliphelliphellip12
44 Consumer Awareness and Reasons to Determine Texture in Fruit
helliphelliphelliphelliphelliphelliphelliphelliphelliphelliphelliphelliphelliphelliphelliphelliphelliphelliphelliphelliphelliphelliphelliphelliphelliphellip12
45 Methods of Determining Texture in Fruithelliphelliphelliphelliphelliphelliphelliphelliphellip13
46 Relationship of Instrumental and Sensory Determinations of
Texturehelliphelliphelliphelliphelliphelliphelliphelliphelliphelliphelliphelliphelliphelliphelliphelliphelliphelliphelliphelliphelliphellip16
5 Sensory Perception of Crisp Crunchy and Crackly Textureshelliphelliphellip17
51 Structural Properties of Food with an Auditory Componenthelliphellip17
52 Perception of Soundhelliphelliphelliphelliphelliphelliphelliphelliphelliphelliphelliphelliphelliphelliphelliphelliphellip18
vi
53 Sensory Studieshelliphelliphelliphelliphelliphelliphelliphelliphelliphelliphelliphelliphelliphelliphelliphelliphelliphelliphellip19
54 Acoustic Studieshelliphelliphelliphelliphelliphelliphelliphelliphelliphelliphelliphelliphelliphelliphelliphelliphelliphelliphellip24
6 Referenceshelliphelliphelliphelliphelliphelliphelliphelliphelliphelliphelliphelliphelliphelliphelliphelliphelliphelliphelliphelliphelliphelliphellip28
2 MULTIDIMENSIONAL REPRESENTATION OF THE STANDARD
SCALES OF FOOD TEXTURE
1 Abstracthelliphelliphelliphelliphelliphelliphelliphelliphelliphelliphelliphelliphelliphelliphelliphelliphelliphelliphelliphelliphelliphelliphelliphellip38
2 Introductionhelliphelliphelliphelliphelliphelliphelliphelliphelliphelliphelliphelliphelliphelliphelliphelliphelliphelliphelliphelliphelliphelliphellip40
3 Materials and Methodshelliphelliphelliphelliphelliphelliphelliphelliphelliphelliphelliphelliphelliphelliphelliphelliphelliphellip43
4 Results and Discussionshelliphelliphelliphelliphelliphelliphelliphelliphelliphelliphelliphelliphelliphelliphelliphelliphellip46
5 Conclusionshelliphelliphelliphelliphelliphelliphelliphelliphelliphelliphelliphelliphelliphelliphelliphelliphelliphelliphelliphelliphelliphelliphellip50
6 Tables and Figureshelliphelliphelliphelliphelliphelliphelliphelliphelliphelliphelliphelliphelliphelliphelliphelliphelliphelliphelliphellip51
7 Referenceshelliphelliphelliphelliphelliphelliphelliphelliphelliphelliphelliphelliphelliphelliphelliphelliphelliphelliphelliphelliphelliphelliphellip60
3 RELATIONSHIP BETWEEN INSTRUMENTAL AND SENSORY
DETERMINATION OF APPLE AND PEAR TEXTURE
1 Abstracthelliphelliphelliphelliphelliphelliphelliphelliphelliphelliphelliphelliphelliphelliphelliphelliphelliphelliphelliphelliphelliphelliphelliphellip64
2 Introductionhelliphelliphelliphelliphelliphelliphelliphelliphelliphelliphelliphelliphelliphelliphelliphelliphelliphelliphelliphelliphelliphelliphellip65
3 Materials and Methodshelliphelliphelliphelliphelliphelliphelliphelliphelliphelliphelliphelliphelliphelliphelliphelliphelliphellip68
4 Results and Discussionshelliphelliphelliphelliphelliphelliphelliphelliphelliphelliphelliphelliphelliphelliphelliphelliphellip73
5 Conclusionshelliphelliphelliphelliphelliphelliphelliphelliphelliphelliphelliphelliphelliphelliphelliphelliphelliphelliphelliphelliphelliphelliphellip80
6 Tables and Figureshelliphelliphelliphelliphelliphelliphelliphelliphelliphelliphelliphelliphelliphelliphelliphelliphelliphelliphelliphellip81
7 Referenceshelliphelliphelliphelliphelliphelliphelliphelliphelliphelliphelliphelliphelliphelliphelliphelliphelliphelliphelliphelliphelliphelliphellip97
vii
4 STANDARD SCALES FOR CRISPNESS CRACKLINESS AND
CRUNCHINESS IN DRY AND WET FOODS RELATIONSHIP WITH
ACOUSTICAL DETERMINATIONS
1 Abstracthelliphelliphelliphelliphelliphelliphelliphelliphelliphelliphelliphelliphelliphelliphelliphelliphelliphelliphelliphelliphelliphelliphellip101
2 Introductionhelliphelliphelliphelliphelliphelliphelliphelliphelliphelliphelliphelliphelliphelliphelliphelliphelliphelliphelliphelliphelliphellip103
3 Materials and Methodshelliphelliphelliphelliphelliphelliphelliphelliphelliphelliphelliphelliphelliphelliphelliphelliphelliphellip106
4 Results and Discussionshelliphelliphelliphelliphelliphelliphelliphelliphelliphelliphelliphelliphelliphelliphelliphelliphellip112
5 Conclusionshelliphelliphelliphelliphelliphelliphelliphelliphelliphelliphelliphelliphelliphelliphelliphelliphelliphelliphelliphelliphelliphellip118
6 Tables and Figureshelliphelliphelliphelliphelliphelliphelliphelliphelliphelliphelliphelliphelliphelliphelliphelliphelliphelliphellip119
7 Referenceshelliphelliphelliphelliphelliphelliphelliphelliphelliphelliphelliphelliphelliphelliphelliphelliphelliphelliphelliphelliphelliphelliphellip139
5 CONCLUSIONS AND FUTURE WORK
1 Conclusionshelliphelliphelliphelliphelliphelliphelliphelliphelliphelliphelliphelliphelliphelliphelliphelliphelliphelliphelliphelliphelliphellip144
2 Future Workhelliphelliphelliphelliphelliphelliphelliphelliphelliphelliphelliphelliphelliphelliphelliphelliphelliphelliphelliphelliphelliphellip146
viii
LIST OF TABLES
Chapter 1
1 Definitions of crispnesshelliphelliphelliphelliphelliphelliphelliphelliphelliphelliphelliphelliphelliphelliphelliphelliphelliphelliphelliphellip20
2 Definitions of crunchinesshelliphelliphelliphelliphelliphelliphelliphelliphelliphelliphelliphelliphelliphelliphelliphelliphelliphelliphellip22
3 Definitions of cracklinesshelliphelliphelliphelliphelliphelliphelliphelliphelliphelliphelliphelliphelliphelliphelliphelliphelliphelliphellip23
Chapter 2
1 Standard scales of texturehelliphelliphelliphelliphelliphelliphelliphelliphelliphelliphelliphelliphelliphelliphelliphelliphelliphelliphellip51
2 Definitions of the textural attributes of hardness chewiness viscosity
gumminess adhesiveness and fracturabilityhelliphelliphelliphelliphelliphelliphelliphelliphelliphelliphelliphellip52
3 MDS stress and R2 for paired comparisons of texture scaleshelliphelliphelliphelliphelliphellip53
4 Standard hardness scalehelliphelliphelliphelliphelliphelliphelliphelliphelliphelliphelliphelliphelliphelliphelliphelliphelliphelliphelliphellip54
5 Standard viscosity scalehelliphelliphelliphelliphelliphelliphelliphelliphelliphelliphelliphelliphelliphelliphelliphelliphelliphelliphelliphellip55
6 Standard adhesiveness scalehelliphelliphelliphelliphelliphelliphelliphelliphelliphelliphelliphelliphelliphelliphelliphelliphelliphellip56
7 Standard fracturability scalehelliphelliphelliphelliphelliphelliphelliphelliphelliphelliphelliphelliphelliphelliphelliphelliphelliphellip57
8 Standard gumminess scalehelliphelliphelliphelliphelliphelliphelliphelliphelliphelliphelliphelliphelliphelliphelliphelliphelliphelliphellip58
9 Standard chewiness scalehelliphelliphelliphelliphelliphelliphelliphelliphelliphelliphelliphelliphelliphelliphelliphelliphelliphelliphelliphellip59
Chapter 3
1 Apple and pear texture attributes and descriptors as evaluated by the texture
panelhelliphelliphelliphelliphelliphelliphelliphelliphelliphelliphelliphelliphelliphelliphelliphelliphelliphelliphelliphelliphelliphelliphelliphelliphelliphelliphellip82
2 Texture standards used for the evaluation of texture sensory attributeshelliphellip83
3 Sensory texture profiling technique for apples and pearshelliphelliphelliphelliphelliphelliphellip84
ix
4 Two way ANOVA for sensory analysis of apple texture by the trained panel in 2005
and 2006helliphelliphelliphelliphelliphelliphelliphelliphelliphelliphelliphelliphelliphelliphelliphelliphelliphelliphelliphelliphellip85
5 Two way ANOVA for sensory analysis of pear texture by the trained panel in 2006
helliphelliphelliphelliphelliphelliphelliphelliphelliphelliphelliphelliphelliphelliphelliphelliphelliphelliphelliphelliphelliphelliphelliphelliphelliphelliphelliphelliphelliphelliphelliphelliphellip86
6 One way ANOVA for instrumental analysis of apples in 2005 and 2006helliphelliphellip87
7 One way ANOVA for instrumental analysis of pears in 2006helliphelliphelliphelliphelliphellip88
8 Correlation matrix of sensory texture attributes of apples for 2005 and
200689
9 Correlation matrix of sensory texture attributes of pears for 2006helliphelliphelliphellip90
10 Correlation matrix on sensory attributes and instrumental determinations of
apples for 2005 and 2006helliphelliphelliphelliphelliphelliphelliphelliphelliphelliphelliphelliphelliphelliphelliphelliphelliphelliphelliphellip91
11 Correlation matrix of sensory attributes and instrumental determinations of
pears for 2006helliphelliphelliphelliphelliphelliphelliphelliphelliphelliphelliphelliphelliphelliphelliphelliphelliphelliphelliphelliphelliphelliphelliphellip92
Chapter 4
1 Literature citations of crispnesshelliphelliphelliphelliphelliphelliphelliphelliphelliphelliphelliphelliphelliphelliphelliphelliphellip119
2 Literature citation of crunchinesshelliphelliphelliphelliphelliphelliphelliphelliphelliphelliphelliphelliphelliphelliphelliphellip121
3 Literature citations of cracklinesshelliphelliphelliphelliphelliphelliphelliphelliphelliphelliphelliphelliphelliphelliphelliphellip123
4 Technique for the evaluation of crispness crunchiness and crispness
developed by seven trained panelistshelliphelliphelliphelliphelliphelliphelliphelliphelliphelliphelliphelliphelliphelliphellip124
5 Crispness standard scale for dry foods developed by seven trained panelists
helliphelliphelliphelliphelliphelliphelliphelliphelliphelliphelliphelliphelliphelliphelliphelliphelliphelliphelliphelliphelliphelliphelliphelliphelliphelliphelliphelliphelliphellip125
6 Crispness standard scale for wet foods developed by seven trained panelists
helliphelliphelliphelliphelliphelliphelliphelliphelliphelliphelliphelliphelliphelliphelliphelliphelliphelliphelliphelliphelliphelliphelliphelliphelliphelliphelliphelliphelliphellip126
x
7 Crunchiness standard scale for dry foods developed by seven trained
panelistshelliphelliphelliphelliphelliphelliphelliphelliphelliphelliphelliphelliphelliphelliphelliphelliphelliphelliphelliphelliphelliphelliphelliphelliphelliphellip127
8 Crunchiness standard scale for wet foods developed by seven trained
panelistshelliphelliphelliphelliphelliphelliphelliphelliphelliphelliphelliphelliphelliphelliphelliphelliphelliphelliphelliphelliphelliphelliphelliphelliphelliphellip128
9 Crackliness standard scale for dry foods developed by seven trained panelists
helliphelliphelliphelliphelliphelliphelliphelliphelliphelliphelliphelliphelliphelliphelliphelliphelliphelliphelliphelliphelliphelliphelliphelliphelliphelliphelliphelliphelliphellip129
10 Crackliness standard scale for wet foods developed by seven trained
panelistshelliphelliphelliphelliphelliphelliphelliphelliphelliphelliphelliphelliphelliphelliphelliphelliphelliphelliphelliphelliphelliphelliphelliphelliphelliphellip130
11 Correlation between auditory recordings (average RMS) and sensory
evaluation by untrained panelhelliphelliphelliphelliphelliphelliphelliphelliphelliphelliphelliphelliphelliphelliphelliphelliphellip131
xi
LIST OF FIGURES
Chapter 1
1 Procedures for evaluating texturehelliphelliphelliphelliphelliphelliphelliphelliphelliphelliphelliphelliphelliphelliphelliphellip5
Chapter 2
1 MDS representation of hardness textural perceptions of food as evaluated by
eleven panelistshelliphelliphelliphelliphelliphelliphelliphelliphelliphelliphelliphelliphelliphelliphelliphelliphelliphelliphelliphelliphelliphelliphellip54
2 MDS representation of viscosity textural perceptions of food as evaluated by
eleven panelistshelliphelliphelliphelliphelliphelliphelliphelliphelliphelliphelliphelliphelliphelliphelliphelliphelliphelliphelliphelliphelliphelliphellip55
3 MDS representation of adhesiveness textural perceptions of food as evaluated
by eleven panelistshelliphelliphelliphelliphelliphelliphelliphelliphelliphelliphelliphelliphelliphelliphelliphelliphelliphelliphelliphelliphelliphellip56
4 MDS representation of fracturability textural perceptions of food as evaluated
by eleven panelistshelliphelliphelliphelliphelliphelliphelliphelliphelliphelliphelliphelliphelliphelliphelliphelliphelliphelliphelliphelliphelliphellip57
5 MDS representation of gumminess textural perceptions of food as evaluated
by eleven panelistshelliphelliphelliphelliphelliphelliphelliphelliphelliphelliphelliphelliphelliphelliphelliphelliphelliphelliphelliphelliphelliphellip58
6 MDS representation of chewiness textural perceptions of food as evaluated
by eleven panelistshelliphelliphelliphelliphelliphelliphelliphelliphelliphelliphelliphelliphelliphelliphelliphelliphelliphelliphelliphelliphelliphellip59
Chapter 3
1 Apple firmness effect on sensory texture attributes for 2005 and 2006 harvest
yearshelliphelliphelliphelliphelliphelliphelliphelliphelliphelliphelliphelliphelliphelliphelliphelliphelliphelliphelliphelliphelliphelliphelliphelliphelliphelliphelliphellip93
2 Apple differentiation soft intermediate and hard apple firmness for 2005 and
xii
2006 combined harvest yearshelliphelliphelliphelliphelliphelliphelliphelliphelliphelliphelliphelliphelliphelliphelliphelliphelliphellip94
3 Pear firmness effect on sensory texture attributes for 2006 harvest yearhellip95
4 Pear differentiation of soft intermediate and hard pear firmness for 2006
harvest yearhelliphelliphelliphelliphelliphelliphelliphelliphelliphelliphelliphelliphelliphelliphelliphelliphelliphelliphelliphelliphelliphelliphelliphellip96
Chapter 4
1 MDS representation of auditory crispness for dry foodshelliphelliphelliphelliphelliphelliphellip132
2 MDS representation of auditory crispness for wet foodshelliphelliphelliphelliphelliphelliphellip133
3 MDS representation for auditory crunchiness for dry foodshelliphelliphelliphelliphelliphellip134
4 MDS representation of auditory crunchiness for wet foodshelliphelliphelliphelliphelliphellip135
5 MDS representation of auditory crackliness for dry foodshelliphelliphelliphelliphelliphellip136
6 MDS representation of auditory crackliness for wet foodshelliphelliphelliphelliphelliphellip137
7 MDS representation for overall auditory crispness crunchiness and
crackliness for dry and wet foodshelliphelliphelliphelliphelliphelliphelliphelliphelliphelliphelliphelliphelliphelliphelliphellip138
xiii
DEDICATION
This work is dedicated to my husband Fariss for his patience love and care I
also dedicate my work to my parents for their encouragement and endless support
My mother drew a distinction between achievement and success She said that
achievement is the knowledge that you have studied and worked hard and done the best
that is in you Success is being praised by others and thats nice too but not as
important or satisfying Always aim for achievement and forget about success
By Helen Hayes (1900 - 1993)
xiv
Chapter One
INTRODUCTION
LITERATURE REVIEW
The following literature review is organized in association with each chapter
1 Texture
Texture in food is difficult to define for many scientists since texture means
different things to different people Muller (1969) claimed that the term texture may be
discarded because is confusing Muller (1969) suggested that texture terminology usage
may be divided into two terms in place of the word texture ldquorheologyrdquo defining the
physical properties of food and ldquohaptaesthesisrdquo defining the perceptions of the
mechanical behavior of materials
Szczesniak (1990) wrote ldquotexture can be defined as a sensory manifestation of the
structure of the food and the manner in which this structure reacts to applied forces the
specific senses involved being vision kinesthetics and hearingrdquo The International
Organization for Standardization (Standard 5492 1992) wrote ldquoTexture is a noun that
comprises all the mechanical (geometrical and surface) attributes of a food product
perceptible by means of mechanical tactile and where appropriate visual and auditory
receptorsrdquo The British Standards Organization (No 5098) defines texture as ldquothe
attribute resulting from a combination of physical properties perceived by the senses of
kinesthesis touch (including mouth feel sight and hearing) The properties may include
size shape number nature and conformation of constituent structural elementsrdquo Other
authors such as Bourne (2002) stated ldquothe textural properties of a food are that group of
1
physical characteristics that arise from the structural elements of the food are sensed
primarily by the feeling of touch are related to the deformation disintegration and flow
of the food under a force and are measured objectively by functions of mass time and
distancerdquo
2 Texture Profile Analysis and Standard Scales of Texture
The texture profile panel is a powerful instrument that can reliably determine the
textural attributes of food products The texture profile panel allows investigators to
relate the way the food behaves in the mouth rather than only obtaining selected chemical
and physical properties of food The use of standard terminology standard reference
foods and standard evaluation procedures in texture profile methods makes texture
profile panels great objective assessing tools of sensory data (Civille and Szczesniak
1973) The texture profile method is widely used for many applications in the food
industry including food product development and quality assurance (Civille and
Szczesniak 1973)
The sensory texture profile method was developed from the A D Little Flavor
Profile Method as a protocol based on the order of appearance of texture attributes
(Brandt et al 1963) The order of appearance relates to the chronological order in
which the various attributes of foods are perceived (General Foods Corp 1967) A
texture profile is defined as ldquothe sensory analysis of the texture complex of a food in
terms of its mechanical geometrical fat and moisture characteristics the degree of each
present and the order in which they appear from first bite to complete masticationrdquo
(Brandt et al 1963)
2
The texture profile analysis requires a panel of judges with prior knowledge of the
texture classification system use of standard rating scales and appropriate panel
procedures with regards to the mechanics of testing and food presentation (Brandt et al
1963)
Szczesniak (1963) classified texture attributes in three categories First are the
mechanical characteristics related to the reaction of food to stress Second are the
geometrical characteristics related to the shape size and arrangement of particles within
a food Finally are other characteristics related to the moisture and fat content
The standard rating scales provide a method of correlating sensory and
instrumental (texturometer) evaluations of texture (General Foods Corp 1967) A
trained sensory panel includes practice in the use of scales to reinforce the perception of
the mechanical and geometrical characteristics of food Standard scales are developed to
identify each of the mechanical characteristics of texture hardness fracturability
chewiness gumminess viscosity and adhesiveness and provide a defined quantitative
method of texture evaluation (Szczesniak 1963) The standard scales represent the full
range of a specific mechanical parameter as it is encountered in foods (Civille and
Szczesniak 1973) Geometrical characteristics are difficult to classify in a specific
scale There are however two general groups of geometrical characteristics geometrical
characteristics related to the size and shape of the particles such as gritty grainy or
coarse and geometrical characteristics related to the particle shape and orientation such
as fibrous cellular or crystalline Evaluation of the geometrical characteristics of foods
is qualitative and semi-quantitative Geometrical characteristics are evaluated as to type
and amount present Standard scales help panelists build confidence and provide
3
practice in perception and discrimination during the training process (General Foods
Corp 1967)
In texture profiling it is necessary to standardize the technique of determination
handling and presentation of the foods Each panelist must evaluate the foods in
identical manner and the replicate foods presented to panelists must be reproducible
(Civille and Szczesniak 1973) The first bite or initial phase encompasses the
mechanical characteristics of hardness fracturability viscosity and any geometrical
characteristics observed initially The second or masticatory phase encompasses the
mechanical characteristics of gumminess chewiness adhesiveness and any geometrical
characteristics observed during chewing The third or residual phase encompasses
changes induced in the mechanical and geometrical characteristics through mastication
(General Foods Corp 1967) Procedures for evaluating texture are presented in Figure
1
4
Masticatory (Perceived During Chewing)
Mechanical (gumminess chewiness and
adhesiveness)
Geometrical (any depending upon food
structure)
Initial (Perceived on First Bite)
Mechanical (viscosity hardness and
brittleness)
Geometrical (any depending upon food
structure)
Residual (Changes During Mastication)
Rate and type of breakdown moisture absorption and mouthcoating
Figure 1 Procedures for evaluating Texture (Brandt et al 1963)
5
The consistency of the panel performance will depend on three factors the
reliability of the trained panel as a whole to reproduce the whole panel findings from one
evaluation to another the ability of an individual panelist to replicate the panelistsrsquo
findings from one evaluation to another and the ability of the panelists to agree with one
another The panel performance can be determined through the use of blind controls and
duplicate samples regular review of panel results and the presence of a good panel
leader (Civille and Szczesniak 1973)
The texture profile method is used to characterize sensory textural attributes of
fruits Paoletti et al (1993) used a modified version of the texture profile method on
selected apple cultivars to characterize textural attributes such as firmness fracturability
cohesiveness juiciness and mealiness and relate them to the mechanical properties of
fruit Abbott et al (1994) investigated apple texture using sensory data evaluated as
crisp hard tough mealy spongy and juicy and developed a relationship with a modified
version of the Instron texture profile analysis Diehl and Hamann (1979) used texture
profile analyses to characterize the sensory properties of raw potatoes melons and apples
and related them with uniaxial compression and torsion methods
3 Multidimensional Scaling
Multidimensional scaling (MDS) is a set of techniques designed for the statistical
analysis of the degree of similarity or dissimilarity of experimental data on a set of
objects (Borg and Groenen 1997) MDS mathematical techniques enable a scientist to
discover the ldquohidden structurerdquo of data MDS calculations use proximities among
objects of any kind as input
6
A proximity is a number that predicts perception of similarity or difference
between two objects (Kruskal and Wish 1978) MDS techniques represent objects
judged as similar to one another as points close to each other in a resultant spatial map
Objects judged as dissimilar are represented as points distant from one another in a
spatial map (Schiffman et al 1981) The MDS graphical representation or spatial map
allows the data analyst to interpret the data and explore panelistsrsquo perceptions visually
(Borg and Groenen 1997)
A common procedure for obtaining proximities data is to ask individuals to
directly judge the ldquopsychological distancerdquo among stimulus objects To discover rather
than impose the dimensions the attributes on which the stimuli are judged are usually not
specified (Kruskal and Wish 1978)
An advantage of MDS procedures is the small experimenter contamination
Panelists do not require prior knowledge of the attribute of the stimuli evaluated MDS
data provide a special context that reveals dimensions relevant to the subjects (Schiffman
et al 1981) Another advantage of MDS is its wide functionality MDS represents
similarity or dissimilarity data as distances in low-dimensional space to make data
accessible to visual inspection and exploration MDS is used as a technique allowing the
experimenter to test if and how certain criteria by which the experimenter can distinguish
among different objects of interest are mirrored in corresponding empirical similarities or
differences of these objects MDS is also a data-analytic approach that allows
discovering dimensions that underlie judgments of similarity or dissimilarity
The primary disadvantage of MDS is that such analytical techniques are often
time consuming and expensive (Schiffman et al 1981) A number of researchers have
7
explored alternative data collection procedures for MDS modeling some of which are
less time consuming and fatiguing than pairwise similarity ratings Alternative data
collection procedures include sorting data and confusion measures (Lawless et al 1995)
MDS calculations are complex and are difficult to perform without the aid of a
computer A variety of computational programs are used (Kruskal and Wish 1978)
Each program is capable of performing a wide variety of analyses all of which are
generically known as Multidimensional Scaling Some example programs used for MDS
applications are Minissa Polycon Kyst Indscal Sindscal Alscal Multiscale etc
(Schiffman et al 1981)
MDS is a robust technique that is used by researchers to assess visual auditory
taste and olfactory stimuli (Drewnowski 1984) In food sensory science one approach
to modeling the qualitative variation among sets of foods is to determine food similarity
and submit the data to MDS analysis Lawless et al (1995) created perceptual maps of
cheeses with the aid of MDS MDS procedures were used to asses flavor perception and
taste preferences of eight non-diet sodas judged by obese and normal weight sensory
panelists (Drewnowski 1984) Odor perception of six groups of panelists with varied
experience and training in odor evaluation were examined using MDS (Lawless and
Glatter 1990) Auditory perception of crispness crunchiness and crackliness was
examined in selected foods with the aid of MDS (Vickers and Wasserman 1979) Zraick
et al (2000) demonstrated through MDS studies of voice perception that perception of
normal voice quality is multidimensional
MDS is a statistical procedure that provides a perceptual map of differences and
similarities of stimuli based on the perceptions and interpretations of sensory panelists
8
MDS is a powerful methodology that is valuable in assisting scientists to gain important
unique understanding of human behavior
4 Texture of Fresh Fruit
41 Fruit Texture
Szczesniak (1963) divides textural parameters into three categories mechanical
geometrical and other characteristics (moisture and fat) Studies of fruit texture focus
primarily on the mechanical properties of the fruit tissue The few studies on the
geometric properties of fruit tissues such as grittiness in pear were conducted by fruit
breeders (Bell and Janick 1990) or as part of sensory studies (Diehl and Hamann 1979
Stec et al 1989) An increasing emphasis on the assessment of juiciness in fruits was
also reported recently (Szczesniak and Ilker 1988 Harker et al 2006)
The complex nature of fruit is related to the variety of attributes required to fully
describe textural properties of fruits and the textural changes that occur as fruit ripens
The lexicon for sensory texture attributes for fruits include crispness crunchiness ease
of breakdown fibrousness flouriness graininess grittiness hardness juiciness
mealiness pastiness pulpiness and starchiness (Harker et al 1997) The physiological
genetic biochemical nature of living tissues is important to an understanding of the
complexity of the ripening process in fruit (Dilley et al 1993)
42 Fruit Anatomy
The flesh in fruits is primarily composed of parenchyma cells that exhibit thin
non-lignified cell walls and large vacuoles that contain 90 of the water in the cell (Pitt
1982) The walls of the adjacent cells are separated by the middle lamella rich in pectin
9
(Huber 1993) The texture of the fruit depends of the cell size cell shape and packing
cell wall thickness cell wall strength cell turgor pressure and cell-cell adhesion (Harker
et al 1997)
The skin in fruits varies in size and complexity depending on the mechanical
properties of each fruit In fruits such as apples and pears the skin is consumed and
imparts different textural characteristics than other fruits with inedible skins Edible
skins are considered simple and are composed of tightly fitting epidermal cells coated
with wax layers Beneath epidermal layers of cells are layers of hypodermis cells which
are smaller than the epidermal cells In other fruits such as melons or oranges the skin is
inedible due to the thickness and presence of collenchyma sclerenchyma and lignin
impregnated cells (Harker et al 1997)
Seeds in apples and pears are located in the interior of the flesh called the core
The core is associated with the central tissue and contains seeds seed cavities and
sclerified lining and vascular strands Seeds associated with the core tissue are inedible
and are avoided during eating (Harker et al 1997)
Cell size and packing patters determine the volume of intercellular space which
influence cell adhesion by determining the extent of cell to cell contact Very limited cell
to cell contact occurs in ripen apples (Reeve 1953) An increased cell wall thickness and
decrease in cell size increase the strength of the fruit tissue Cell size and cell wall
thickness influence juiciness through their effect on packing of liquids There is a good
correlation between large cells and increased juiciness in fruits (Szczesniak and Ilker
1988)
10
The strength and texture of fruit tissues are related to the mechanical properties of
cell walls the turgor of cells and the strength of bonds between adjacent cells The
mechanical properties of cell walls of fresh fruit are determined by a mixture of pectic
hemocellulosic and fibrous cellulose polysaccharides Also cell wall properties differ
depending on the calcium content enzymatic hydrolysis and turgor of the cells Cell wall
properties confer plasticity enabling a cell to expand as the cell enlarges during
maturation and rigidity confers strength and cell shape to the fruit Cell wall breakdown
results in a marked effect on texture changes such as fruit softening (Harker et al 1997)
The excess of turgor or internal pressure of cells imparts a hydrostatic component
to cell tissue strength and increases the brittleness of the cell wall Turgor pressure is
influenced by the membrane permeability the osmotic gradient across the primary cell
wall and the cell wall expansion and contraction (Harker et al 1997) Cell turgor is an
integral part of fruit softening As turgor decreases during the maturations process the
fruit softens The turgor of cells in freshly harvested apples may contribute to the
softening of fruit associated with the increasing separation of individual cells during
storage (Harker and Hallett 1992)
The way cells separate or break open and release cell contents is one of the most
critical mechanical factors influencing fruit texture Cell disruption and release is
determined by the strength of the cell wall relative to the strength of the bonds between
adjacent cells Both are expected to decline as fruit ripens and softens The strength of
the bonds between cells is influenced by the strength of the middle lamella the area of
cell to cell contact and the extent of plasmodesmatal connections (Harker et al 1997)
11
43 Food-Mouth Interactions
An understanding of the physiology of the mouth and the occurrence of food
breakdown during chewing is important to the perception food texture The shape size
texture orientation and mechanical properties of food are perceived by the lips tongue
teeth and jaw When food is placed in the mouth the teeth reduce the food to a size and
shape that allows flow to the gut which allows for bacterial hydrolysis (Harker et al
1997) Additionally saliva that is released and mixed with the food initiates digestion
and alters overall texture of the food to facilitate swallowing (Jenkins 1978)
The mouth is very sensitive to textural properties of food during biting and
chewing The speeds of the mouth determined during chewing are faster than speeds
used during instrumental testing Texture determinations alone performed by instruments
may not simulate biting or chewing events occurring in the mouth well (Harker et al
1997) During biting and chewing the mandible moves in three directions opening and
lateral movement protrusion and retrusion The tongue is assisted by the muscles of the
inner surface of the check and the lips manipulate the food and aid sensory perception of
food As food is chewed saliva is induced to form a bolus for swallowing (Beyron
1964) Food is chewed and crushed by the molars The forces necessary to chew
decrease as moisture increases
44 Consumer Awareness and Reasons to Determine Texture in Fruit
Consumer awareness and attitudes towards texture are affected by various factors
Szczesniak and Kahn (1971) reported that socioeconomic status culture gender flavor
intensity and eating occasion influence consumersrsquo perceptions of texture Blindfolded
panelists given pureed foods exhibited difficulty identifying pureed apples strawberries
12
and bananas Difficulty in identifying pureed foods demonstrates that texture structures
are essential for accurate food identification (Bourne 2002) However for most foods
texture is considered a minor component of sensory quality unless the texture does not
meet expectations Unexpected textures usually signal poor food quality (Szczesniak and
Kahn 1971)
Texture is very important to quality perception of food The implication that fresh
fruit is a flavor-predominant characteristic is no longer accepted A consumer study
conducted in the United Kingdom with 12 apple cultivars demonstrated that panelists
preferred either a sweet hard apple or an acidic juicy apple (Daillant-Spinnler et al
1996) In a study profiling aroma flavor and texture of Royal Gala apples an increase
in acceptability was observed when juiciness and crispness increased between 16 and 20
weeks of controlled atmosphere storage (Harker et al 1997) Textural recognition with
fruit is of critical importance to marketers of fruit and there is a need for more research
in this area
45 Methods of Determining Texture in Fruits
A wide selection of fundamental empirical and imitative methods are available
for determining fruit texture (Bourne 2002)
bull Puncture tests Involve penetrating the fruit with a cylindrical probe with a
convex tip Examples are the Magness-Taylor Effegi Ballauf Chatillon
Penetrometers are characterized by using a force determination instrument rate of
penetrometer movement into the food and a standard distance (Bourne 2002)
13
bull Whole-Fruit Deformation Involves compressing an intact fruit between two
parallel flat plates This method involves deforming the fruit at a fixed distance
and determining the force required to achieve the deformation (Bourne 2002)
bull Tactile Assessment Squeezing fruit by hand is an important method for
evaluation of texture quality Human tactile sense is sensitive when fruits are
relatively soft However as fruit firmness increases beyond a threshold
individualsrsquo discrimination among fruits becomes difficult Tactile approach is
not recommended with hard fruits such as apples and pears (Batten 1990)
bull Shear and Extrusion A shear test for fruits can be conducted by obtaining a plug
of tissue from a thin slice held between two rigid plates The Kramer shear cell is
the most frequently used method for determining the shear or extrusion properties
of fruit tissue (Mohsenin 1977)
bull Compression Tests Compression tests are usually applied to tissue excised from
the whole fruit A common test is the texture profile analysis where a bite size
cube of tissue is compressed through two cycles between two plates or probes
The resulting force-distance curve is used to differentiate a number of food
attributes hardness cohesiveness adhesiveness springiness gumminess and
chewiness (Bourne 2002)
bull Beam Tests A cylindrical or rectangular fruit tissue is supported by pivots at both
ends A blunt blade located between pivots descends at constant speed so the
fruit tissue bends and breaks Beam tests are used to determine rupture force
shear and elastic modulus of foods (Vincent et al 1991)
14
bull Wedge Tests A sharp wedge is driven into a block of tissue and many elements
can be determined from the force-distance curves (Vincent et al 1991)
bull Tensile Tests Consist of securely fixing both ends of a fruit tissue into an
instrument by either using clamps cutting tissue into a shape which slots between
sets of claws or by gluing Tensile tests allow scientists to examine fracture
surfaces using a scanning electron microscope (Harker and Hallett 1992)
bull Dynamic Tests Consists of deforming a tissue by applying a sinusoidal stress
usually between 01 and 500 Hz (Mohsenin 1970)
bull Twist Test Consists of a rectangular blade fixed radially at its axis to a sharpened
spindle The fruit is impaled onto the spindle until the blade completely enters the
flesh The fruit is then twisted by hand or by an automated system The twist
tests allow scientists to determine tissue strength in different tissue zones by
altering the length of the spindle (Studman and Yuwana 1992)
bull Tissue Juiciness Generally juiciness is characterized as percentage of juice
released from a fixed weight of fruit tissue A number of methods were
developed utilizing homogenization centrifugation or juice extractors
(Szczesniak 1987)
bull Auditory Recordings of Chewing Sounds Sound produced during biting and
chewing can be recorded using a microphone pressed firmly against the ear and
analyzed from amplitude-time plots (Edmister and Vickers 1985)
bull Sensory Evaluations There are two types of sensory assessments consumer and
analytical panels Consumer panels indicate preference or acceptability of a food
Analytical panels involve individuals trained to describe aroma taste and texture
15
attributes of a product Analytical sensory panels can be either difference tests or
descriptive analysis techniques (Harker et al 1997)
bull Electrical Impedance Electrical impedance spectroscopy is used to investigate
the resistance of intracellular and extracellular compartments within plant tissue
At 50 Hz the resistance of the extracellular pathway is determined Weakening of
the cell wall is associated with changes in texture (Zhang and Willison 1991)
46 Relationship between Instrumental and Sensory Determinations of Texture
Szczesniak (1987) recommended that instrumental determinations of texture may
be established depending on the accuracy and precision of the selected instrument to
predict sensory texture attributes Szczesniak (1987) determined correlations between
instrumental and sensory measurements of food texture to satisfy the desire of the food
industry for quality assurance instruments to predict consumer responses to understand
the textures being perceived in sensory assessment and to develop instrumentation that
will accurately replicate sensory evaluations Szczesniak (1987) emphasized that the
range selection and diversity of texture attributes in the assessment of food texture as
well as the scale and appropriateness of the comparison among foods must be considered
before correlating instrumental and sensory data
Numerous studies examined the relationship between instrumental and sensory
measurements on apples (Diehl and Hamann 1979 Abbott et al 1984 Richardson
1986 Paoletti et al 1993) Many studies report good correlations (r gt 08) between
firmness crispness and instrumental determination with puncture (Abbott et al 1984)
sensory evaluation (Brenan et al 1970) shear and extrusion (Hard et al 1977) whole
fruit compression (Abbott et al 1984) and tensile tests (Holt and Schoorl 1985) While
16
significant correlations were reported between many mechanical and sensory assessments
of texture variation of fruit cultivars between seasons and during the storage period
resulted in some problems due to the non-homogeneous distribution of the results
5 Sensory Perception of Crisp Crunchy and Crackly Textures
51 Structural Properties of Food with an Auditory Component
Food structure is fundamental to the production of sound during the biting and
chewing of food Food texture attributes such as crispness crunchiness and crackliness
are greatly influenced by the arrangement of the cells chemical bonds cracks and
impurities in the food (Al Chakra et al 1996) Foods producing a perceivable auditory
response may be divided into two groups dry and wet crisp foods (Edmister and Vickers
1985)
Fruits and vegetables are wet crisp foods because they contain fluid within cells
Fruits and vegetables are composed of turgid cells with elastic cell walls An increase in
turgidity is associated with an increase in crispy crunchy and crackly sounds Turgidity
occurs when the fluids inside the cell press outwards on the cell wall while the cell wall
presses inwards Turgidity in wet food is characterized by strength and elasticity During
biting or chewing of the food the contents of the cell expand rapidly and when released
a sound wave is produced The resulting sound is responsible for the perception not only
of crispness but also crunchiness and crackliness (Vickers and Bourne 1976)
Dry crisp foods are cellular foods that contain air within the cells Foods such as
chips and biscuits contain air filled cavities with brittle walls During biting or chewing
the brittle walls bend and break The remaining fragments of the cells produced during
17
breakage snap back to their original shape and emit vibrations resulting in sound
emission The sound emission results in the perceptions of crisp crunchy and crackly
sounds (Vickers and Bourne 1976)
Sound attributes in foods are at a maximum during the first bite The decline or
absence of sound is observed as chewing progresses (Lee et al 1990) Sound perception
is also influenced by length width and thickness of the food (Al Chakra et al 1996)
The perception of crispness crunchiness and crackliness for both wet and dry foods
declines as mastication and saliva hydration progresses
52 Perception of Sound
Sounds produced during biting or chewing foods are detected by air conduction
and by bone conduction Air conduction sounds are perceived directly through the ear
Air molecules vibrate across molecules producing sound waves that travel through the
auditory canal Vibrations reaching the eardrum activate the movements on the ossicles
on the drum membrane transferring the sound into the inner ear The inner ear is
responsible for the perception of loudness and pitch of the sound (Kinsler and Frey
1962)
Bone conduction sounds are transmitted through the mandible bones cheeks and
tongue into the ears Bone conducted sounds are perceived as a higher frequency when
chewing with the mouth closed rather than opened and exert a dampening effect on the
sound Because of the differences in sound contribution between air and bone the two
sounds must be combine and equalize in order to fully quantify the acoustic sensations
produced by crisp crunchy or crackly foods (Vickers and Borne 1976)
18
53 Sensory Studies
Sensory evaluations of crispness crunchiness and crackliness are reported by
Jeon et al 1975 Vickers 1984a 1984b Seymour and Hamman 1988 Szczesniak
1988 Dacremont 1995 Harker et al 1997 Vincent et al 2002 Duizer and Winger
2005 and Dijksterhuis et al 2005 Sensory evaluations were performed with trained
and untrained panelists Consumer evaluations with untrained panelists are reported
using magnitude estimation (Vickers and Wassermann 1979 Vickers 1981 Christensen
and Vickers 1981 Mohamed et al 1982 Edmister and Vickers 1985) Trained
panelistsrsquo evaluations are focused on descriptive analysis where panelists are asked to
reach a consensus about the meaning of selected texture attributes Thus in some
evaluations verbal definitions were developed to identify the attributes crispy (Table 1)
crunchy (Table 2) and crackly (Table 3) Crispy crunchy and crackly definitions
exhibit only moderate agreement and large variation in the perception of each attribute
Important aspects cited when defining crispness crunchiness and crackliness are the
structure of the intact food sounds emitted at chewing or biting force needed to crush the
food and collapse and appearance of the food at fracture (Roudaut et al 2002)
Differences in definitions among trained panelists demonstrate that the perception
and sensory evaluation of crispness crunchiness and crackliness is not an easy process
The difference between a sensory attribute concept and its definition should be
acknowledged (Roudaut et al 2002) Also studies conducted in several countries add
difficulty in comparing results among sensory studies Drake (1989) indicated that
crispness may be described as having more than one equivalent term in other languages
Also even if a term exists in more than one language the phrase may not express
19
equivalent meaning in all languages The lack of standardization in the procedures
implementing sensory studies adds difficulty to the understanding of crispness
crunchiness and crackliness Further research must standardize sensory evaluations to
improve consistency in the outcomes of the studies
Table 1 Definitions of Crispness
Definition Technique Reference
Relative force required to bite through the food Biting with front teeth
Jeon et al 1975
Foods that produce a high pitched sound Biting with front teeth
Vickers 1984b
First Bite place the food between the incisors bite through and evaluate the level of high pitched noise
Biting with front teeth
Seymour and Hamman 1988
Firm and brittle snaps easily emitting a typical frequency sound upon deformation
NA Szczesniak 1988
The perceived relative force used by crunching the food in the mouth
Molars Onwulata and Heymann 1994
The perceived force with which the food separates into two or more distinct pieces during a single bite with the incisors An abrupt and complete failure of the food is required
Incisors first bite
Barrett 1994
Foods that produce a high pitched sound with a frequency higher than 5 kHz especially for air conduction sounds
Only incisors or bitten and chewed
Dacremont 1995
Harker et al 1997 The amount and pitch of sound generated when the sample is first bitten with the front teeth
Front teeth bite
A combination of the noise produced and the breakdown of the food as bitten through entirely with the back molars
Biting with the back molars
Duizer et al 1998
20
Fractures in an abrupt manner after applying a relatively small force on the food
Front teeth first bite
Vincent et al 2002
Fracture in an abrupt brittle manner after applying a relatively small force on the food on the first chew with the molars
Molars second bite
Vincent et al 2002
Cracks you can force your teeth through slowly more airy than crackling
At first bite Dijksterhuis et al 2005
Soft sound more airy than crackling Association with freshness Disintegrates into pieces smaller than when crackling
During chewing
Dijksterhuis et al 2005
A combination of the type of sound ie short snapping and longer cracking sounds and the force to bite and chew as perceived on the first bite
First bite Duizer and Winger 2005
21
Table 2 Definitions of Crunchiness
Definition Technique Reference
The perceived hardness of a food after it is crushed and chewed in the mouth 2-3 times Also defined as the amount of force necessary to crush and grind the cube during the second and subsequent chews
Chewing with molars
Moskowitz et al 1974
Foods that produce low pitched sounds are less loud and last longer than for crisp Firm and brittle Snaps easily with typical sound
Chewing with molars
Vickers 1984b
Degree of low pitched noise (with respect to crisp sounds) but above threshold pitch considered too low
Place sample between molar teeth
Seymour and Hamman 1988
Complex failure mechanism that involves repetitive deformation and fracturing of cell structure Necessary are structural subunits especially with cells with brittle cell walls Continuous fracture during chewing Sensory description the perceived intensity of repeated incremental failures of the food during a single complete bite with the molar teeth
First bite with molars
Barrett 1994
The perceived cumulative intensity of force required for repeated incremental failures of the food by chewing up to five times with the molars
Chewing with molars
Guraya and Toledo 1996
Harker et al 1997 The amount of noise generated when the food is chewed at a fast rate with the back teeth
Chewing with back teeth
Products that produce low pitched sounds with a characteristic peak on frequency range 125 to 2 kHz for air conduction
Only incisors or bitten and chewed
Dacremont 1995
22
Temporal aspects of the sensory feedback during mastication are important for the crunchy sensation Crunchiness is independent from hardness
Chewing with molars
Brown et al 1998
Crunchy would be associated with a hard and dense texture that fractures without prior deformation producing a loud low-pitch sound that is repeated during several chews It was suggested that crunchy is more relevant to fruits and vegetables than crispness
Mainly during chewing
Fillion and Kilcast 2001
Fractures after applying a higher force on the food than for crispness
Front teeth first bite
Vincent et al 2002
Fractures after applying a higher force on the food than for crispness on the first chew with the molars
Molars second bite
Vincent et al 2002
High pitched sound light sound longer sounding
During chewing Dijksterhuis et al 2005
Table 3 Definitions of Crackliness
Definition Technique Reference To make small sharp sudden and repeated noises
At first bite or during chewing
Vickers 1984a
Foods that generate low pitched sounds with a high level of bone conduction Discrimination between crackly and crunchy foods could be due to vibrations propagated by bone conduction that also generate vibrotactile sensations
Only incisors Dacremont 1995
Combination of sound and bite force Clip between the teeth and it breaks Crackling is harder than crispy
At first bite Dijksterhuis et al 2005
Audible for a long period during chewing large pieces of food mainly of the crust
During chewing Dijksterhuis et al 2005
23
54 Acoustic Studies
The association that acoustic sensations have with the perception of texture was
reported for crisp crunchy and crackly foods (Drake 1963 Kapur 1971 Vickers and
Bourne 1976 Vickers and Wasserman 1979 Vickers and Christensen 1980 Vickers
1981 1983 1984a 1984b 1987a 1987b Dacremont et al 1991 1995 Zampini and
Spence 2004) Two primary approaches were developed to study the relationships
between texture of food and sound The first approach involves recording the sounds
produced during application of a force to a food to obtain quantitative information
regarding the crisp and crunchy sounds (Drake 1963 Kapur 1971 Vickers and Bourne
1976 Edmister and Vickers 1985 Vickers 1985 Seymour and Hamann 1988
Dacremont et al 1991) The second approach consists of assessing the panelistsrsquo
perceptions of air-conducted sounds to study the involvement of sounds produced when
eating food to perceptions of crispness crunchiness or crackliness (Christensen and
Vickers 1981 Vickers and Wasserman 1979 Vickers 1980 1981 1984a 1984b) Both
acoustic approaches combined with mechanical force-deformation techniques more
adequately describe the sounds resulting from biting or chewing foods than either
approach alone (Vickers 1987a Szczesniak 1988)
In the first approach acoustic recordings are used to record sounds associated
with crispness crunchiness and crackliness of eating foods Numerous studies using
amplitude-time plots are reported and correlated to sensory determinations of crispness
crunchiness and crackliness Drake (1965) inferred that the higher the amplitude of the
amplitude time plot the crisper the food Drake (1965) concluded the amplitude of the
sound emitted during biting toasted bread increased as the degree of toasting increased
24
Edmister and Vickers (1985) concluded that a combination of the mean height of the
peaks x the number of peaks is a better predictor of crispness for dry and wet crisp foods
than other parameters such as number of sound bursts duration mean height peaks x
number of sound bursts mean height peaks x number of sound burststhickness
Seymour and Hamann (1988) studied the effect of sound pressure in the perception of
crispness and crunchiness in potato chips and reported that potato chips with a low water
activity exhibited a higher mean sound pressure than potato chips with a high water
activity Seymour and Hamann (1988) concluded the sound produced during chewing of
the potato chips was louder at low water activities than at higher water activities
The Fast Fourier Transform (FFT) method is used to characterize the most evident
frequencies during biting and chewing of foods Comparison of the predominant
frequencies resulting from biting and chewing crisp crunchy and crackly is possible with
FFT The biting or chewing of crunchy and crackly foods is characterized by a sound in
frequency range between 125 and 2 kHz A large volume of bone conduction is evident
when eating crackly foods and absent when eating crunchy foods Consumption of crispy
foods is characterized by sound with frequencies greater than 2 kHz (Dacremont 1995)
Tesch et al (1995) determined the role of fractal analysis in mechanical and acoustical
perception of crunchy foods and reported mechanical acoustical signatures of cheese
balls and croutons concluding that fractal analysis is potentially useful in calculations to
assess auditory and mechanical perception of crunchy foods
The second approach focuses on the contribution of air conducting sounds to
crisp crunchy and crackly textures resulting from biting and chewing selected foods
There are currently two techniques used oral determination of air conducting sounds
25
(Vickers and Christensen 1980 Christensen and Vickers 1984) and auditory
determination of air conducting sounds (Vickers and Wasserman 1979 Vickers 1985)
The oral technique consists of asking panelists to bite or chew the food and evaluate the
sound produced The auditory technique involves playing prerecorded sounds of food
and asking panelists to evaluate the food sound properties Techniques are sometimes
used together (Edmister and Vickers 1985 Vickers 1981) The information obtained
from air conducting eating sounds is useful for development of standardized terms to
describe crisp crunchy and crackly foods (Szczesniak 1988)
Even though air-conducting sounds impact the perceptions of crispness
crunchiness and crackliness it is possible to evaluate them without the contribution of air
conducting noise Christensen and Vickers (1981) reported that panelists differentiated
crisp foods when an auditory block was put in place during tasting foods Christensen
and Vickers (1981) concluded that accurate perceptions of crispness involved a vibro
tactile acoustic sensation
Snap compression and puncture tests are used as instruments to objectively
determine the stimuli that produce textural sensations during food mastication (Al Chakra
et al 1996 Vickers and Christensen 1980 Seymour and Hamann 1988 Vickers 1987
Mohamed et al 1982) Although correlations exist between acoustic determinations and
crispness crunchiness and crackliness better relationships were observed when objective
mechanical testing was combined with acoustic determinations of sounds produced
during biting or chewing (Mohamed et al 1982 Vickers 1987 Seymour and Hamann
1988)
26
Acoustic determinations are important for the appreciation of crispness
crunchiness and crackliness in foods Through the use of a combination of acoustic and
instrumental techniques or either technique alone sensory science may potentially
improve the understanding of the perceptions evolving from biting or chewing crisp
crunchy and crackly foods (Duizer 2001)
27
References
Abbott JA Watada AE and Massie DR 1984 Sensory and instrument
measurement of apple texture J Am Soc Hort Sci 109 221-228
Al Chakra W Allaf K and Jemai AB 1996 Characterization of brittle food
products Application of acoustical emission method J Text Stud 27 327-
348
Batten DJ 1990 Effect of temperature on ripening and postharvest life of fruit of
atemoya cv lsquoAfrican Pridersquo Scientia Hort 45129-136
Barrett AH Cardello AV Lesher LL and Taub IA 1994 Cellularity mechanical
failure and textural perception of corn meal extrudates J Text Stud 25 77-95
Bell R L and Janick J 1990 Quantitative genetic analysis of fruit quality in pears J
Am Soc Hort Sci 115 829-834
Beyron H 1964 Occlusal relations and mastication in Autralian aborigines Acta
Odontol Scand 22 597-678
Borg I and Groenen P 1997 Modern multidimensional scaling theory and
applications 1st ed Springer-Verlag New York 471 p
Bourne M 2002 Texture Viscosity and Food Ch 1 In Food Texture and Viscosity
Concept and Measurement 2nd Ed Academic Press Geneva NY
Brandt MA Skinner EZ and Coleman JA 1963 Texture Profile Method J Food
Sci 28404-9
Brennan JG Jowitt GR and Mughsi OA 1970 Some experiences with the general
foods Texturometer J Text Stud 1 167-184
28
Brown WE Langley KR and Braxton D 1998 Insight into consumer assessments
of biscuit texture based on mastication analysis-hardness versus crunchiness J
Text Stud 29 481-497
Christensen CM and Vickers ZM 1981 Relationships of chewing sounds to
judgments of crispness J Food Sci 46 574-578
Civille GV and Szczesniak AS 1973 Guidelines to training a texture profile panel
J Text Stud 4204-223
Dacremont C Colas B and Sauvageot F 1991 Contribution of the air and bone
conduction to the creation of sounds perceived during sensory evaluation of
foods J Text Stud 22 443-456
Dacremont C 1995 Spectral composition of eating sounds generated by crispy
crunchy and crackly foods J Text Stud 26 27-43
Daillant-Spinnler B MacFie JH Beyts PK and Hedderley D 1996 Relationships
between perceived sensory properties and major preference directions of 12
varieties of apples from the southern hemisphere Food Qual Prefer 7 113-126
Diehl K C Hamann DD Whitfield J K 1979 Structural failure in selected raw
fruits and vegetables J Text Stud 10371-400
Dijksterhuis G Hannemieke L De Wijk R and Mojet J 2005 A new sensory
vocabulary for crisp and crunchy dry model foods Food Qual Pref 18 37-50
Dilley LA Wilson ID Kuai J Poneleit L Zhu Y and Pekker Y 1993
Molecular biology of pome fruit ripening and senescence concepts status
perspectives and future prospects Acta Hort 326 325-334
Drake BK 1963 Food crushing sounds- An introductory study J Food Sci 28 233
29
Drake BK 1965 Food crushing sounds- comparison of objective and subjective data
J Food Sci 30 556-559
Drake DK 1989 Sensory texture rheological properties ndash a polyglot list J Text
Stud 20 1-27
Drewnowski A 1984 New techniques multidimensional analyses of taste
responsiveness Int J Obesity 8599-607
Duizer LM Campanella OH and Barnes GRG 1998 Sensory instrumental and
acoustic characteristics of extruded snack food products J Text Stud 29 397-
411
Duizer LM and Winger RJ 2006 Instrumental measures of bite forces associated
with crisp products J Text Stud 37 1-15
Edmister JA and Vickers ZA 1985 Instrumental acoustical measures of crispness in
foods J Text Stud 16 153-167
Fillion L and Kilcast D 2001 Consumer perception of crispness and crunchiness in
fruits and vegetables Food Qual Pref 13 23-29 General Foods Corp 1967
Sensory Texture Profiling
Guraya HS and Toledo RT 1996 Microstructural characteristics and compression
resistance as indices of sensory texture in a crunchy snack product J Text
Stud 27 687-701
Hard MM Zaebringer MV Bowman F and Mackey AC 1977 Predicting texture
of fresh fruit and vegetables by chemical and physical methods College of Agr
Washington State Univ Bul 836
30
Harker FR and Hallet IC 1992 Physiological changes associated with development
of mealiness of apple fruit during cool storage HortSci 271291-1294
Harker FR Redgwell RJ Hallet IC and Murray SH 1997 Text in fresh fruit
Hort Rev 20 121-224
Harker FR Amos RL Echeverria G Amdgunson FA 2006 Influence of texture
on taste insights gained during studies of hardness juiciness and sweetness of
apple fruit J Food Sci 71(2) S77-S82
Holt JE and Schoorl D 1985 Mechanical properties and texture of stored apples J
Text Stud 15377-394
Huber DJ 1983 The role of cell wall hydrolases in fruit softening Hort Rev 5 169-
219
Jeon IJ Breene WM and Munson ST 1975 Texture of fresh pack whole
cucumber pickles correlations of instrumental and sensory measurements J
Text Stud 5 399-409
Jenkins GN 1978 The physiology and biochemistry of the mouth Blackwell Oxford
Kapur KK 1971 Frequency spectrographic analysis of bone conducting chewing
sounds in persons with natural and artificial dentitions J Text Stud 2 50-61
Kinsler LE and Frey AR 1962 Fundamentals of acoustics 2nd Ed John Wiley amp
Sons New York p 392-400
Kruskal JB and Wish M 1978 Multidimensional scaling 2nd ed Sage Publications
Beverly Hills CA 93 p
Lashly KS 1916 Reflex secretion of the human parotid gland J Expt Psychol 1
461-493
31
Lawless HT and Glatter S 1990 Consistency of multidimensional scaling models
derived from odor sorting J Sens Stud 5217-30
Lawless HT Sheng N and Knoops SSC 1995 Multidimensional scaling of sorting
data applied to cheese perception Food Qual Pref 691-98
Lee III WE Schweitzer MA Morgan GM and Shepherd DC 1990 Analysis of
food crushing sounds during mastication total sound level studies J Text
Stud 21 165-178
Mohamed AAA Jowitt R and Brennan JG 1982 Instrumental and sensory
evaluation of crispness 1 in friable foods J Food Eng 155-75
Mohsenin NN 1970 Physical properties of plant and animal materials structure
physical characteristics and mechanical properties Gordan and Breach Science
Publ New York
Mohsenin NN 1977 Characterization and failure of solid foods with particular
reference to fruits and vegetables J Text Stud 8 169-193
Moskowitz HR Segars RA Kapsalis JG and Kluter RA 1974 Sensory ratio
scales relating hardness and crunchiness to mechanical properties of space cubes
J Food Sci 39 200-202
Muller HG 1969 Mechanical properties rheology and haptaesthesis of food J
Text Stud 138-42
Onwulata C and Heymann H 1994 Sensory properties of extruded corn meal related
to the spatial distribution of process conditions J Sens Stud 9 101-112
32
Paoletti F Moneta E Bertone A and Sinesio F 1993 Mechanical properties and
sensory evaluation of selected apple cultivars Lebensm-Wiss Technol 26
721-726
Pitts RE 1982 Models for the rheology and statistical strength of uniformly stressed
vegetative tissue Trans Am Soc Agr Eng 26 1776-1784
Reeve RM 1953 Histological investigations of texture in apples II Structure and
intercellular spaces Food Res 18604-617
Richardson A 1986 The effects of herbicide soil management systems and nitrogen
fertilizer on the eating quality of Coxrsquos Orange Pippin apples J Hort Sci 61
447-456
Roudaut G Dacremont C and Le Meste M 1998 Influence of water on the
crispness of cereal-based foods acoustic mechanical and sensory studies J
Text Stud 29 199-213
Schiffman S Reynolds ML and Young FW 1981 Introduction to
multidimensional scaling 1st ed Academic Press New York 413 p
Seymour SK and Hamann DD 1988 Crispness and crunchiness of selected low
moisture foods J Text Stud 19 79-95
Stec M G H Hodgson JA MacRae EA and Triggs CM 1989 Role of fruit
firmness in sensory evaluation of kiwifruit (Actinidia deliciosa cv Hayward) J
Sci Food Agr 47 417-433
Studman CJ and Yuwana 1992 Twist test for measuring fruit firmness J Text
Stud 23 215-227
Szczesniak AS 1963 Classification of textural characteristics J Food Sci 28385-9
33
Szczesniak AS and Kahn EL 1971 Consumer awareness of and attitudes to food
texture I Adults J Text Stud 2 280-295
Szczesniak AS 1987 Correlating sensory with instrumental texture measurements -
an overview of recent developments J Text Stud 181-15
Szczesniak AS 1988 The meaning of textural characteristics ndash crispness J Text
Stud 19 51-59
Szczesniak AS and Ilker R 1988 The meaning of textural characteristics ndash juiciness
in plant foodstuff J Text Stud 19 61-78
Szczesniak AS 1990 Texture It is still an overlooked food attribute Food Technol
44(9)8688909295
Tesch R Normand MD and Peleg M 1995 The apparent fractal dimension of
sound bursts in acoustic signature of two crunchy foods J Text Stud 26
685-694
Tesch R Normand MD and Peleg M 1996 Comparison of the acoustic and
mechanical signatures of two cellular crunchy cereal foods at various water
activity levels J Sci Food Agric 70 347-354
Vickers Z M and Bourne MC 1976 A psycho acoustical theory of crispness J
Food Sci 41 1158-1164
Vickers ZM and Wasserman SS 1979 Sensory qualities of food sounds based on
individual perceptions J Text Stud 10 319-332
Vickers Z M and Christensen CM 1980 Relationships between sensory crispness
and other sensory instrumental parameters J Text Stud 11 291-307
34
Vickers ZM 1980 Food sounds how much information do they contain J Food Sci
45 1494-1496
Vickers ZM 1981 Relationship of chewing sounds to judgments of crispness
crunchiness and hardness J Food Sci 47 121-124
Vickers ZM 1983 Pleasantness of food sounds J Food Sci 48 783-786
Vickers ZM 1984a Crackliness relationships of auditory judgments to tactile
judgments and instrumental acoustical measurements J Text Stud 15 49-
58
Vickers ZM 1984b Crispness and crunchiness- a difference in pitch J Text Stud
15 157-163
Vickers ZM 1985 The relationship of pitch loudness and eating technique to
judgments of crispness and crunchiness of food sounds J Text Stud 16 85-
95
Vickers ZM 1987a Instrumental measures of crispness and their correlation with
sensory assessment J Text Stud 19 1-14
Vickers ZM 1987b Sensory acoustical and force deformation measurements of
potato chips crispness J Food Sci 52138-140
Vincent JFV 1991 Texture of plants and fruits p19-33 In JFV Vincent and PJ
Lillford (eds) Feeding and the texture of food Cambridge Univ Press
Cambridge
Vincent JFV and Saunders DEJ 2002 The use of critical stress intensity factor to
quantify hardness and crunchiness objectively J Text Stud 33 149-159
Yurkstas AA 1965 The masticatory act J Prosthet Dent 15 248-260
35
Zraick RI Liss JM Dorman MF and Case J L 2000 Multidimensional scaling
of nasal voice quality J Speech Hear Res 43989-96
Zhang M I N and JHM Willison 1991 Electrical impedance analysis in plant
tissues A double shell model J Exp Bot 421465-1475
36
Chapter Two
MULTIDIMENSIONAL REPRESENTATION OF THE
STANDARD SCALES OF FOOD TEXTURE
M A CHAUVIN C PARKS C ROSS and BG SWANSON
Department of Food Science and Human Nutrition
Washington State University
Pullman WA 99164-6376 USA
Corresponding author Dr Barry G Swanson
Department of Food Science and Human Nutrition
Washington State University Pullman WA 99164-6376 USA
Tel 1-509-335-3793
Fax 1-509-335-4815
Email swansonbwsuedu
(Multidimensional scaling of texture)
37
ABSTRACT
The use of standard terminology standard reference foods and standard
evaluation procedures for utilizing standard scales in texture profile methods makes them
effective objective tools for assessing panelists in descriptive analysis However their
use is often limited due to lack of availability of foods and the drift of scales over time
The objective of this study was to evaluate the standard texture scales developed by
Szczesniak et al (1963) for the classification of the textural characteristics of foods
through the use of multidimensional scaling (MDS) The texture perceptions of foods by
eleven panelists were evaluated using the standard texture scales of Szczesniak et al
(1963) Each scale was anchored by a series of representative standard foods that
illustrated the intensity gradation of the subjective magnitude of the texture dimension
under study hardness chewiness gumminess viscosity adhesiveness and fracturability
MDS was highly instructive in quantitatively assessing the qualitative textural difference
perceptions of naive panelists (r gt 089) The selected foods were rated similarly using
MDS and standard texture scales
PRACTICAL APPLICATIONS
MDS is an efficient tool for the analysis of sensory perception data Using MDS
it is possible to corroborate food texture standard scales published many years ago and
assay food texture more accurately today Caution is necessary when assuming that
standard scales developed in the past are as useful today as when were developed The
item drift theory hypothesizes that questions become less reflective of a concept over
time for natural reasons The purpose of this study was to use Multidimensional Scaling
38
to reproduce the original dimensions and original order of stimuli to analyze existing
food textural scales for hardness chewiness gumminess viscosity adhesiveness and
fracturability
Key Words Multidimensional scaling MDS texture standard scales sensory
perception
39
INTRODUCTION
Szczesniak et al (1963) developed a series of standard food texture scales for the
mechanical properties of texture using common foods to represent selected textures
within the entire range of characteristic texture intensities encountered in foods (Table 1)
Using the standard texture scales developed by Szczesniak et al (1963) Brandt et al
(1963) developed the descriptive analysis technique for food texture designated as the
General Foods Texture Profile The General Foods Texture Profile technique uses
terminology to describe basic categories or classifications of food texture characteristics
developed by Szczesniak (1963) for training texture profile panelists The primary
characteristics of the food texture profile technique are standardization reproducibility
and correlation of texture attributes with instrumental determinations of food texture
(Civille and Liska 1975) The General Foods Texture Profile represents experimental
design of an organized and structured study of food texture specifically to ldquostudy the
sensory analysis of the texture complex of a food in terms of its mechanical geometrical
fat and moisture characteristics the degree of each present and the order in which they
appear from first bite through complete masticationrdquo (General Foods 1967)
Evaluation of the mechanical characteristics of food texture is both qualitative and
quantitative and may be assessed by the standard texture scales Texture standard scales
use category scaling to designate differences in textural attributes In texture analysis
the category scale is used to represent intensity of the attribute with the number of
categories varying with the texture attribute scaled For each texture attribute scale the
full range of the textural attribute is demonstrated using foods that possess a given texture
attribute as a major property The standard texture scales developed by Szczesniak et al
40
(1963) are practical tools to demonstrate the principal range of texture for each specific
texture attribute Szczesniak scales are evolving and were modified throughout the years
by a number of researchers including General Foods (1967) Civille and Liska (1975)
Szczesniak (1975) and Munoz (1986) However the initial publication by Szczesniak
(1963) is considered a highly standardized reference system for food texture
Szczesniak (1963) concluded that texture is a discernible sensory attribute of
foods and that in some foods such as meat potato chips cornflakes and celery texture
may be more important than flavor The effectiveness of sensory panelists to distinguish
and articulate mechanical texture characteristics such as hardness viscosity
adhesiveness fracturability gumminess and chewiness of foods varies among
individuals The complexity of the human masticatory apparatus cultural diversity
health status age sex and food preferences influence texture perception of foods among
individuals The use of Multidimensional Scaling (MDS) may elucidate differences
among panelists by developing configurations of attributesrsquo cognitive grouping and
describing multidimensional plots that illustrate similarity and differences in attribute
observations
MDS is a mathematical technique that describes proximities among objects on a
spatial representation or map (Schiffman 1981) The MDS method assumes that
subjective estimates of similarity or dissimilarity represent individual estimates of spatial
comparisons between the two stimuli in a selected geometrical space of relatively small
dimensions (Moskowitz 1977) Foods assessed as similar are closer together on the
spatial representation (map) than foods assessed as dissimilar The MDS spatial
configuration may provide insights into important textural dimensions of foods that may
41
exist MDS may also minimize experimenter influence and provide fewer constraints to
sensory panelists than panelistsrsquo data from attribute rating scales (Schiffman 1981)
MDS was previously used in visual auditory taste and olfactory research of
foods (Moskowitz 1976a and 1976b Schiffman 1976 Drewnowski 1984 Hellemann
et al 1987 Lawless and Glatter 1990 Bertino and Lawless 1993 Lawless et al 1994
Zraick et al 2000) However little research is published using MDS to interpret
assessment of food texture
Magnitude estimation and category scaling are frequently compared for the
determination of sensory intensity for a variety of stimuli Controversy in the literature
exists regarding the relationship between both scaling techniques Some studies suggest
that magnitude estimation may provide a more accurate depiction of the true underlying
psychophysical function than category scaling (Mcdaniel and Sawyer 1981 Moskowitz
1982 Cardello et al 1982a) However Birnbaum (1982) and Vickers (1983) report no
particular advantage for magnitude estimation or category scaling techniques Category
scaling was selected over magnitude estimation in the present study to avoid confusion
among panelists resulting from the large number of foods presented
The objective of this study was to evaluate through MDS the standard food
texture scales for hardness chewiness gumminess viscosity adhesiveness and
fracturability developed by Szczesniak et al (1963)
42
MATERIALS AND METHODS
Panelists were recruited from Washington State University staff students and
members of the community and screened for allergies dental conditions and interest in
participating in the study Minimal information about the study was provided to the
panelists to reduce potential bias Eleven panelists five males and six females between
the ages of 23-54 years participated in the study Panelists were awarded a small
compensation for participation in the experiment None of the panelists expressed
previous experience with texture evaluation of foods and were considered naive panelists
Experimental foods were selected to represent the complete standard texture
scales for hardness chewiness gumminess viscosity adhesiveness and fracturability
(Szczesniak et al 1963) Due to unavailability of some foods substitutions were
selected as described in Cardello et al (1982a 1982b) Food items source size and
serving temperatures are presented in Table 1
Two four-hour sessions were conducted At the beginning of each session
panelists were required to sign a written consent form to participate in the study
Panelists were also given a demographic questionnaire and oral and written instructions
The written instructions included both an operational definition of the textural attribute
judged (Table 2) as well as instructions on the use of similarity judgments scales As
explained in the sensory texture profiling manual (General Food Corp 1967) the first 30
min of each session were devoted to familiarizing the panelists with the scales and the
technique used for assessing texture of experimental foods
There were N(N-1)2 possible pairs of foods to compare for a set of N foods in
each scale Representative food pairs were presented to panelists in a room fitted with
43
individual tables Three standard texture scales were analyzed in each session The
standard scales for hardness viscosity and adhesiveness were evaluated in session one
The fracturability gumminess and chewiness standard scales were evaluated in session
two
Two standard foods were presented as paired comparisons together with a ballot
asking each panelist to quantitatively judge the textural similarity between the two foods
A similarity scale consisting of a 9-point scale with the words ldquoexactly the samerdquo at the
high end (9) and ldquocompletely differentrdquo at the low end (1) was presented to each
panelist A separate ballot was provided for each paired comparison Panelists rinsed
their mouths with distilled water andor unsalted crackers between foods and were
permitted to take as many breaks as necessary to avoid fatigue Once each panelist was
finished with the first comparison shehe was instructed to advance to the next
comparison The panelists were instructed to wait one minute between each pair of
texture evaluations Panelists were advised not to go back to review or modify any
previous responses A mandatory 15-minute break was imposed between standard
scales
Food pairs were presented in a random order identified with three digit codes
Each food was presented uniformly as established by Szczesniak et al (1963) and placed
inside a 3 oz souffleacute cup (Solo Cup Company Urbana IL) Each food pair was
evaluated once by each panelist A total of 36 paired comparisons for hardness 28 for
viscosity and 10 for adhesiveness were assessed in the first session A total of 21 paired
comparisons for fracturability 10 for gumminess and 15 for chewiness were assessed in
the second session
44
Data Analysis
For each of the eleven panelists one individual matrix was constructed from the
pairwise similarity scores for each of the standard texture scales hardness chewiness
gumminess viscosity adhesiveness and fracturability Each cell within each individual
matrix yielded a similarity score ranging from 1 to 9 quantifying perceived similarities in
texture on the 9-point scale
The eleven panelistsrsquo matrices were combined to yield one matrix for each
standard food texture scale reflective of the mean group pairwise similarity scores
Every cell within each group matrix yielded a mean score for all foods on each standard
food texture scale reflective of the 9-point scale
Data were analyzed as similarity estimates using SPSS Version 120 statistical
analysis software (SPSS Inc Chicago IL) and on XLSTAT 754 (Addinsoft Paris-
France) MDS algorithm ALSCAL module for nonmetric multidimensional scaling was
employed using the option for minimizing Kruskalrsquos stress Formula 1 two-dimensional
solutions Output from the scaling software program included an assessment of stress
quantifying the fit among the data and the scaling model and R2 values calculating the
variance among underlying data that accounted for the scaling solution (Zraick 2000)
45
RESULTS AND DISCUSSION
Multidimensional scaling was performed on each paired comparison for the six
standard texture scales Stress and R2 values were calculated on the two-dimensional
configuration Stress and R2 results are presented in Table 3 Stress values for the
three-dimensional configuration of the six standard texture scales slightly improved
compared with the two-dimensional configuration Thus further analyses of the six
standard texture scales were performed in the two-dimensional configuration only The
mean stress values were small (lt 013) for hardness viscosity adhesiveness
fracturability gumminess and chewiness R2 values were correspondingly large (gt 089)
Small stress values and large R2values reflect the accuracy of the MDS algorithm to fit
calculated distances to the texture results in two dimensions Well organized two-
dimensional structures and agreement among the panelists for food texture analyses were
observed
MDS two-dimensional graphical representation of mean hardness of standard
foods on the hardness scale (Figure 1) illustrated agreement with the original standard
hardness scale (Table 4) Cream cheese was located at the softest point (smallest scale
value) and lemon drops were located at the hardest point (largest scale value) The
remaining foods were distributed between the soft and hard extremes with a cluster
observed at the ldquosofterrdquo end of the scale Specifically the texture of cream cheese egg
whites frankfurters cheese and olives were perceived as very similar to each other
potentially resulting in perceptual confusion by the panelists during evaluation Good
separation of peanuts carrots almonds and lemon drops were observed similar to the
original standard scale Confusion in assessing the similarity among softer foods may be
46
attributed to changes in the standard foodsrsquo formulations over time However with
further training confusion among softer textures could be minimized
Figure 2 presents two-dimensional perceived means of the viscosity standard
scale Agreement between perceived viscosity means and the original viscosity standard
scale was observed (Table 5) However distinctions among the viscosities of heavy
cream light cream and evaporated milk were difficult among panelists as they were
perceived to be very similar to each other Unfamiliarity of the panelists with the foods
may account for these results For instance today evaporated milk is mainly used as an
ingredient for numerous recipes and very few people know what it tastes like on its own
On the other hand in the early 1960rsquos when the original scales were developed
evaporated milk was marketed as a coffee creamer and evaporated milk taste was more
familiar Using standard scales generated a number of years ago may result in the
assumption that foods consumed many years ago are still in use or of equivalent use
today
MDS two-dimensional graphical representation of means of adhesiveness
standard scale (Figure 3) presented little variability from the original standard scale
(Table 6) The only inconsistency from the original standard adhesiveness scale was
between the perception of Crisco as less adhesive than Velveeta processed cheese The
discrepancy was attributed to taste preference and inability of the panelists to hold the
Crisco inside their mouths for a required amount of time
Figure 4 illustrates the means of fracturability standard scale which agreed with
almost all points of the original fracturability scale (Table 7) Only peanut brittle was an
47
outlier in the MDS graphical representation Differences in peanut brittle formulation
may be a source of variation in fracturability assessment
MDS two-dimensional graphical representations for gumminess (Figure 5) and
chewiness (Figure 6) coincide with their standard original scale equivalent at all points
(Tables 8 and 9)
The gumminess standard scale comprised of selected concentrations of white
flour and water were well discerned by the panelists Controlled food systems may
reduce problems related to continuous changes or unavailability of food standards
Nonetheless the advantage of multi-food standard scales is that frequently a given
characteristic is perceived differently in selected foods Converting food texture scales
to a one-dimensional series may be undesirable because a simple dimension may distort
illustration of diversified sensory perceptions of the mechanical parameters (Civille and
Liska 1975)
For many years research with food texture implied that texture was a single
concept and did not actively recognize that the perceptions of texture are the result of a
number of parameters Szczesniak (1963) categorized the textural parameters of foods
as mechanical geometrical and other (fat moisture) Furthermore terms identified as
primary food texture attributes include hardness adhesiveness cohesiveness and
springiness Secondary food texture attributes are described as perceived combinations
of two or more primary food textures and include fracturability chewiness and
gumminess
The first dimension of MDS analyses or food texture attribute calculated for all
standard texture scales represents specific mechanical parameters as a main textural
48
property For example hardness represents the first dimension on the hardness scale
This is demonstrated by the fact that food items that represented the strength of a specific
stimulus are located in similar geometrical space as their location on the standard food
texture scale The second dimension can be credited to hedonics or liking because
panelists were considered naiumlve consumers Panelists generally respond to odor and
taste of food pleasantness or unpleasantness first prior to classifying the texture
parameter or intensity (Moskowitz 1976b) The second dimension is also defined by
texture descriptive terms containing perceived fractions of several attributes As a result
secondary terms describe texture as combinations of two or more primary texture
attributes Perhaps no descriptor term relates to a ldquopurerdquo texture attribute but rather
each term is a mixture of primary textural attributes to a greater or lesser degree
(Moskowitz and Kapsalis 1975) Food items selected for the standard scales of texture
possessed sensory attributes other than texture that may affect the perception of texture
The spatial MDS representation for each standard texture scale coincided with the
arrangement of each point presented on the food texture standard scales (Szczesniak et
al 1963) Occasional deviant points were observed and are attributed to factors such as
sensory panelist adaptation fatigue or carry-over effects (Lawless et al 1995 Also
depending on the geographical location of the panel distribution of selected foods is
limited making it difficult for people to recognize the standard foods Familiarity with
the standard foods may also change over time and cultural differences may also influence
the results Other factors to consider when employing standard food scales is that many
foods initially designated as standards are no longer available or the textural character
changed as a result of reformulation or processing alterations (Civille and Liska 1974)
49
In addition procedures for texture evaluation adhere to rigid experimental controls to
minimize variation in texture perception The preparation serving and presentation of
the experimental foods must be consistent Techniques for biting chewing and
swallowing experimental foods must also be standardized (Civille and Szczesniak 1973)
Panelists with limited training and with little sensory evaluation experience may
also influence the results in the MDS output Cardello et al (1982) demonstrated that
trained and consumer panel judgments of texture differ significantly primarily due to
expanded perceptual ranges of trained panelists
CONCLUSIONS
The contribution of Szczesniak (1963) to food texture evaluation constituted the
first step in creating a rational tool for scientific description of food texture A
modification of the standard food texture scales may be necessary as challenges are
encountered in its practical use including the change of food formulations over time and
food distribution limitations However more than forty years later the initial standard
texture scales are still in use and Szczesniak (1963) represents a highly standardized and
well defined reference system for training texture profile panels
Multidimensional scaling is a strong exploratory statistical and graphical
technique effectively producing a graphical representation of overall similarity in food
texture perceptions from sensory panelists MDS is highly instructive in assessing naive
panelistsrsquo perceptions of qualitative textural similarities of food and provides a high-
quality statistical instrument to graphically validate existing standard scales
50
Scale value Product Brand or Type Manufacturer Sample size Temp
1 Cream Cheese Philadelphia Kraft Foods 1 cm cube 45-55 ordmF
2 Egg white hard cooked (5 min) 1 cm tip room
3 Frankfurters large uncooked Oscar Mayers Beef 1 cm slice 50-65 ordmF
4 Cheese mild Cheddar Kraft Foods 1 cm cube 50-65 ordmF
5 Olives stuffed Safeway 1 olive pimento removed room
6 Peanuts cocktail type in vacuum tin Planters Peanuts 1 nut room
7 Carrots fresh uncooked 1 cm slice room
8 Almonds 1 nut room
9 Hard Candy lemon drops Safeway 1 piece room
1 Corn muffin made from mix Jiffy 1 cm cube room
2 Shortbread Shortcake Keebler 1 cm cube room
3 Graham crackers Nabisco National Biscuit Corp 12 square room
4 Melba toast plain Old London 12 square room
5 Wheat thins Nabisco National Biscuit Corp 1 cm square room
6 Ginger snaps Nabisco National Biscuit Corp 12 square room
7 Peanut brittle candy part Safeway 12 square room
1 Hydrogenated vegetable oil Crisco Proctor amp Gamble Co 12 tsp 45-55 ordmF
2 Velveeta unsliced Kraft Foods 1 cm cube 45-55 ordmF
3 Cream cheese Philadelphia Kraft Foods 1 cm cube 45-55 ordmF
4 Marshmallow topping Kraft Foods 12 tsp 45-55 ordmF
5 Peanut Butter Skippy Smooth Best Foods 12 tsp 45-55 ordmF
1 40 flour paste Gold Medal General Mills 1 tbs room
2 45 flour paste Gold Medal General Mills 1 tbs room
3 50 flour paste Gold Medal General Mills 1 tbs room
4 55 flour paste Gold Medal General Mills 1 tbs room
5 60 flour paste Gold Medal General Mills 1 tbs room
1 Water distilled 12 tsp 45-55 ordmF
2 Light cream half and half Lucerne 12 tsp 45-55 ordmF
3 Heavy cream table cream Lucerne 12 tsp 45-55 ordmF
4 Evaporated Milk Carnation Co 12 tsp 45-55 ordmF
5 Maple Syrup natural maple syrup Wheelers Maple Products 12 tsp 45-55 ordmF
6 Chocolate Syrup Hershey Chocolate Corp 12 tsp 45-55 ordmF
7 Mixture 1 12 cup condensed milk Nestle 12 tsp 45-55 ordmF
amp1 tbl heavy cream
8 Condensed milk sweetened Nestle 12 tsp 45-55 ordmF
1 White bread fresh center cut Safeway 1 12 cm cube room
2 Frankfurter large uncooked skinless Oscar Mayers Beef 1 12 cm cube 50-70 ordmF
3 Gum drops spice drops Safeway 1 piece room
4 Licorice candy red vines American Licorice Co 1 piece room
5 Caramel Kraft 12 piece room
6 Tootsie Rolls midget size Sweet Co of America 1 piece room
Substitute item Reference Cardello 1982 Munoz 1986
Table 1 Standard Scales of Texture
Standard Viscosity Scale
Standard Chewiness Scale
Standard Hardness Scale
Standard Fracturability scale
Standard Adhesiveness Scale
Standard for Gumminess Scale
Szczesniak et al 1967
51
Table 2 Definitions of the textural attributes of hardness chewiness viscositygumminess adhesiveness and fracturability (General Foods Corp 1967)Hardness
Chewiness
ViscosityGumminess
Adhesiveness
Fracturability
Perceived force required to compress a substance between the molar teethTotal perceived work required to masticate a sample to reduce it toa consistency suitable for swallowing
after complete compression of the sample between tongue and palateForce with which sample ruptures when placing sample between molars and biting down completely at a fast rate
Perceived force required to draw a liquid from a spoon over the tongueEnergy required to disintegrate a semisolid food product to a state ready for swallowingForce required to remove product completely from palate using tongue
52
Table 3 MDS Stress and R2 for paired comparisons of texture scales
Stress R2
Hardness 006 099Viscosity 009 097Adhesiveness 013 089Fracturability 010 096Gumminess 004 099Chewiness 013 091
53
Scale value Product
1 Cream Cheese2 Egg white3 Frankfurters4 Cheese (Medium Cheddar)5 Olives6 Peanuts7 Carrots8 Almonds9 Hard Candy
Figure1 MDS representation of hardness textural perceptions of standard foods (n=11)
Table 4 Standard hardness scale as described by Szczesniak et al 1967
Substitute item Reference Cardello 1982 Munoz 1986
Cream cheeseEgg white
FrankfurtersCheese
Olives
PeanutsCarrots
Almonds
Lemon Drops
-8
-6
-4
-2
0
2
4
6
8
-8 -6 -4 -2 0 2 4 6 8
--D
im2
--gt
-- Dim1 --gt
Configuration in space Dim1 times Dim2 (stress 0113)
54
Table 5 Standard viscosity scale as described by Szczesniak et al 1967
Scale value Product1 Water2 Light cream3 Heavy cream4 Evaporated Milk5 Maple Syrup6 Chocolate Syrup7 Mixture 1 12 cup condensed milk
amp1 tbl heavy cream8 Condensed milk
Figure 2 MDS representation of viscosity textural perceptions of standard foods (n=11)
Substitute item Reference Cardello 1982 Munoz 1986
Water
Light Cream
Heavy CreamEvaporated Milk
Maple Syrup
Chocolate Syrup
Mixture
Condensed Milk
-5-4-3-2-1012345
-5 -4 -3 -2 -1 0 1 2 3 4 5
--D
im1
--gt
-- Dim2 --gt
Configuration in space Dim1 times Dim2 (stress 0088)
55
Table 6 Standard adhesiveness scale as described by Szczesniak et al 1967
Scale value Product1 Crisco2 Velveeta 3 Cream cheese4 Marshmallow topping5 Peanut Butter
Substitute item Reference Cardello 1982 Munoz 1986
Figure 3 MDS representation of adhesiveness textural perceptions of standard foods(n=11)
Crisco
VelveetaCream Cheese
Marshmallow Topping
Peanut Butter
-4
-3
-2
-1
0
1
2
3
4
-4 -3 -2 -1 0 1 2 3 4
--D
im2
--gt
-- Dim1 --gt
Configuration in space Dim1 times Dim2 (stress 0099)
56
Table 7 Standard fracturability scale as described by Szczesniak et al 1967
Scale value Product1 Corn muffin2 Shortbread3 Graham crackers4 Melba toast5 Wheat thins6 Ginger snaps7 Peanut brittle
Figure 4 MDS representation of fracturability textural perceptions of standard foods(n=11)
Substitute item Reference Cardello 1982 Munoz 1986
Corn Muffin ShortbreadGraham Crackers
Melba toast
Wheat Thins
Ginger Snaps
Peanut Brittle
-6
-4
-2
0
2
4
6
-6 -4 -2 0 2 4 6
--D
im1
--gt
-- Dim2 --gt
Configuration in space Dim1times Dim2 (stress 0118)
57
Table 8 Standard gumminess scale as described by Szczesniak et al 1967
Scale value Product1 40 flour paste2 45 flour paste3 50 flour paste4 55 flour paste5 60 flour paste
Figure 5 MDS representation of gumminess textural perceptions of standard foods(n=11)
40 flour paste
45 flour paste
50 flour paste
55 flour paste
60 flour paste
-5
-4
-3
-2
-1
0
1
2
3
4
5
-5 -4 -3 -2 -1 0 1 2 3 4 5
--D
im1
--gt
-- Dim2 --gt
Configuration in space Dim1 times Dim2 (stress 0068)
58
Table 9 Standard chewiness scale as described by Szczesniak et al 1967
1 White bread2 Frankfurter3 Gum drops4 Licorice candy5 Caramel6 Tootsie Rolls
Figure 6 MDS representation of chewiness textural perceptions of standard foods(n=11)
Substitute item Reference Cardello 1982 Munoz 1986
White Bread
Frankfurters
Gum Drops
Licorice Candies
Caramels
Tootssie Rolls
-5
-4
-3
-2
-1
0
1
2
3
4
5
-5 -4 -3 -2 -1 0 1 2 3 4 5
--D
im2
--gt
-- Dim1 --gt
Configuration in space Dim1 times Dim2 (stress 0107)
59
REFERENCES
BERTINO M and LAWLESS HT 1993 Understanding mouthfeel attributes A
multidimensional scaling approach J Sens Stud 8101-114
BRANDT MA SKINNER EZ and COLEMAN JA 1963 Texture Profile Method
J Food Sci 28404-9
BIRNBAUM MH 1982 Problems with so-called ldquodirectrdquoscaling In Selected Sensory
Methods Problems and Approaches to Hedonicsrdquo (Ed) JT Kuznicki RA
Johnson and AF Rutkievic ASTM STP 773 p 32 American Society for
Testing and Materials
CARDELLO AV MALLER O KAPSALIS JG SEGARS RA SAWYER FM
MURPHY C and MOSKOWITZ HR 1982a Perception of texture by trained
and consumer panelists J Food Sci 471186-97
CARDELLO AV MATAS A and SWEENEY J 1982b The Standard Scales of
Texture Rescaling by Magnitude Estimation J Food Sci 471738-1740 1742
CIVILLE GV and SZCZESNIAK AS 1973 Guidelines to training a texture profile
panel J Text Stud 4204-223
CIVILLE GV and LISKA IH 1975 Modifications and applications to foods of the
General Foods sensory texture profile techniques J Text Stud 619-31
DREWNOWSKI A 1984 New techniques multidimensional analyses of taste
responsiveness Int J Obesity 8599-607
HELLEMANN U TUORILA H SALOVAARA H and TARKKONEN L 1987
Sensory profiling and multidimensional scaling of selected Finnish rye bread Int
J Food Sci Technol 22693-700
60
GENERAL FOODS CORP 1967 Sensory Texture Profiling
LAWLESS HT and GLATTER S 1990 Consistency of multidimensional scaling
models derived from odor sorting J Sens Stud 5217-30
LAWLESS HT SHENG N and KNOOPS SSC 1995 Multidimensional scaling of
sorting data applied to cheese perception Food Qual Pref 691-8
McDANIEL MR and SAWYER FM 1981 Preference testing of whiskey-sour
formulations Magnitude estimation versus the 9-point hedonic J Food Sci
46182
MOSKOWITZ HR 1972 Psychophysical measures of texture JText Stud 3135-
45
MOSKOWITZ HR and KAPSALIS JG 1975 The texture profile its foundations
and outlook J Text Stud 6157-166
MOSKOWITZ HR 1976a Psychometric analysis of food aromas by profiling and
multidimensional scaling J Food Sci 41567-71
MOSKOWITZ HR 1976b Multidimensional scaling of odorants and mixtures
Lebensm-Wiss Technol 9232-8
MOSKOWITZ HR 1977 Psychophysical and Psychometric approaches to sensory
evaluation Crit Rev Food Sci Nutr 441-79
MOSKOWITZ HR 1982 Utilitarian benefits of magnitude estimation scaling for
testing product acceptability In In Selected Sensory Methods Problems and
Approaches to Hedonicsrdquo (Ed) JT Kuznicki RA Johnson and AF Rutkievic
ASTM STP 773 p 11 American Society for Testing and Materials
61
MUNOZ AM 1986 Development and application of texture reference scales J Sens
Stud 155-83
VICKERS Z 1983 Magnitude estimation vs category scaling of the hedonic quality of
food sounds J Food Sci 481183-1186
SCHIFFMAN S REYNOLDS ML and YOUNG FW 1981 Introduction to
multidimensional scaling 1st Ed New York Academic Press 413 p
SCHIFFMAN S 1976 Multidimensional Scaling A useful tool to measure flavor
Cereal Food World 2164-68
SZCZESNIAK AS BRANDT MA and FRIEDMAN HH 1963 Development of
standard rating scales for mechanical parameters of texture and correlation
between the objective and the sensory methods of texture evaluation J Food Sci
28397-403
SZCZESNIAK AS 1963 Classification of textural characteristics J Food Sci
28385-9
SZCZESNIAK AS 1975 General Foods texture profile revisited-ten years
perspective J Text Stud 65-17
ZRAICK RI LISS JM DORMAN MF and CASE JL 2000 Multidimensional
scaling of nasal voice quality J Speech Hear Res 43989-96
62
Chapter Three
Relationship between Instrumental and Sensory Determination of
Apple and Pear Texture
MAITE A CHAUVIN1 CAROLYN ROSS1 4 MARVIN PITTS2
EUGENE KUPFERMAN3 and BARRY SWANSON1
1Food Science and Human Nutrition
2Biological Systems Engineering
3WSU Wenatchee TFREC
Washington State University
Pullman WA 99164-6376 USA
4Corresponding author Dr Carolyn Ross
Food Science and Human Nutrition
Washington State University Pullman WA 99164-6376 USA
Tel 1-509-335-2438
Fax 1-509-335-4815
Email cfrosswsuedu
APPLE AND PEAR TEXTURE
Journal Section Sensory and Nutritive Qualities of Food
63
ABSTRACT
The relationship between compressive forces tensile forces and sensory analyses
of apple and pear texture was evaluated A total of twenty-seven sensory panelists were
trained to assess a wide variety of texture attributes in apples and pears including
crispness hardness fracturability juiciness and chewiness Apples from 2005 and 2006
harvest years and pears from the 2006 harvest year were evaluated by a trained sensory
panel The instrumental tests used to evaluate fruit texture were the Guss fruit texture
analyzer (compression forces) and the Sinclair iQtrade system for both apples and pears
Tensile determinations were obtained using a unique method employing both tensile and
compression elastic modulus of the fruit tissue Significant correlations (r = 080 to 090)
among the sensory texture attributes of crispness hardness and fracturability for apples
and pears was observed The correlations between juiciness and hardness differed for
apples (r = 065 to 080) and pears (r = -032) Hard apples and soft pears were perceived
as the juiciest fruits among all firmness levels When correlating sensory to instrumental
determinations the Sinclair iQtrade System texture assessment provided an acceptable
determination of apple hardness (r = 079 to 082) Guss pressure sensor provided
significant determination of apple (r = 078 to 083) and pear (r = 083) hardness Tensile
determinations predicted crispness in apples (r = 088) and pears (r = 085) well A
combination method of compressive and tensile determinations may offer the most
accurate prediction of textural properties of apples and pears
Key Words Apples pears sensory evaluation Sinclair iQtrade System Guss Fruit
Texture Analyzer tensile tests
64
INTRODUCTION
Consumers of fresh apples and pears consider fruit quality more important than
price in making purchase decisions (Market Review 1996) Fruit quality incorporates
sensory attributes such as appearance flavor aroma and texture Of these quality
attributes textural characteristics exert a strong influence on fruit acceptability Daillant-
Spinnler and others (1996) observed that in apples the texture attributes of hardness and
juiciness were the most important to consumers Using preference mapping Daillant-
Spinnler and others (1996) confirmed that purchase intent of apple consumers in the
United Kingdom tended to fall into two groups consumers that preferred hard and sweet
apples or consumers that preferred juicy and acidic apples Jaeger and others (1998)
reported that soft and mealy apples were liked less than hard and non-mealy apples
Numerous other studies also confirmed the importance of texture to consumer
acceptability of apples (Corrigan and others 1997 Thybo and others 2003) Turner and
others (2005) observed that participants preferred a sweet pear with flavor The most
important quality factors recognized by consumers were texture tartness and sourness
and juiciness Consumer attitudes and attention to apple and pear texture cannot be
ignored and are of critical importance to food marketers
Comparative and quantitative assessment of apple and pear texture involves
instrumental and subjective sensory determinations (Harker and others 1997) Sensory
determination of texture is very important in food quality because no instrumental
determinations are adequately developed to replace human evaluation Sensory
evaluation continues to be the gold standard by which the successes of instrumental
determinations are evaluated (Bourne 2002) Instrumental quality control methods
65
designed to evaluate texture are often difficult to implement because of the challenges
associated with correlating instrumental rheological determinations to perceived sensory
attributes or acceptability (Kapsalis and Moskowitz 1978)
The speeds measured during chewing are faster that those used during
instrumental testing of food Masticatory speeds and duration may result in shear
thinning that may not be replicated using instruments of lower speeds For this reason
alone textural determinations made using instruments may not represent the events
occurring in the mouth (Harker and others 1997) According to Harker and others
(2002) a reliable relationship between objective instrument-based and subjective sensory
methods is not always feasible However because of practical concerns such as the
time expertise and costs associated with sensory evaluation instrumental analysis is
often employed Many empirical and imitative instrumental tests were developed to
potentially correlate with sensory texture descriptors (Paoletti and others 1993 Peleg
1993 Harker and others 2002 Shmulevick and others 2003) However the entire
complex of actions that occur during mastication cannot be determined completely by
instruments There is no instrument available containing the complexity sensitivity and
extent of mechanical motions in the mouth or that can appropriately change the speed and
mode of mastication in response to the sensations received during the previous chew
(Bourne 2002)
Instrumental determinations of fruit texture such as Texture Profile Analysis
(TPA) are the accepted foundation of fruit quality assessment In apples many studies
demonstrate satisfactory relationships between sensory texture attributes such as firmness
and crispiness and instrumental texture measurements including TPA Kramer shear
66
disk compression vibration and tension instruments (Harker and others 1997) Puncture
tests using instruments such as the penetrometer are the most widely used instrumental
texture methods in the apple industry (Harker and others 1997) Puncture tests determine
the force required to push a cylindrical probe with a convex tip into the flesh of the fruit
Even with extensive replication of the penetrometer ambiguity exists in the literature as
to the relevance of penetrometer determinations as predictors of perceived apple firmness
(Abbott and others 1976 Bongers 1992 Harker and others 1996)
In response to the need to develop an instrumental determination of texture with a
strong correlation to sensory evaluation a new methodology was developed whereby the
tensile properties of apples and pears were measured Analysis of apple tissue failure
during biting or cutting with a knife suggests that dominant failure mode is a combination
of tensile and shear failure resulting in the wedge action of the knife blade or teeth One
difficulty associated with tensile properties determination is food manipulation during
measurement Previous research in tensile determination was dependent on securely
fixing both ends of a fruit tissue in the instrument designed to apply the test Tensile
determination was achieved using clamps (Schoorl and Holt 1983) cutting tissue into a
shape with slots between sets of claws (Stow1983 Harker and Hallet 1992) or by gluing
(Harker and Hallet 1994) However the short amount of time available to mount and test
the tissue before the tissue decay begins and the amount of moisture loss proved to make
tensile determinations very difficult
A new method to determine tensile properties based on recording the force
deflection values and compressive elastic modulus to determine the tensile elastic
modulus and failure stress in fruit is proposed To assess the usefulness of this method
67
comparisons between results from the tensile determinations and sensory evaluation of
texture were performed Therefore the objective of this study was to evaluate the new
method and instrumentation of tensile properties and compare the results with human
texture perception (trained texture panel) puncture test (Guss pressure sensor) and non-
destructive test (Sinclair) Specifically the relationships between tensile material
properties and hardness and human sensory perception of apples and pears were studied
To determine the most effective instrumental parameter for prediction of apple and pear
texture the relationships between the sensory textural attributes of apples and pears were
also examined
MATERIALS AND METHODS
Fruit Selection
lsquoRed Deliciousrsquo lsquoGranny Smithrsquo lsquoPink Ladyrsquo lsquoCameorsquo and lsquoGalarsquo apples
(Wenatchee WA) from selected sources were harvested in 2005 and 2006 at commercial
maturity Harvest times varied from mid-September to early November lsquoAnjoursquo
lsquoBartlettrsquo and lsquoBoscrsquo pears (Wenatchee WA) were harvested in 2006 To effectively
compare the performance of analytical methods to sensory measurement determinations
apples and pears with a diverse range of textures were presented to the sensory panel
The range of apple and pear textures was generated through use of a number of selected
cultivars of each fruit and selected maturity levels
Harvested apples were sorted into three predetermined groups soft (lt 11 lb)
intermediate (14-16 lb) and hard (gt18 lb) as identified by the Fruit Texture Analyzer
The range of apple firmness was identified as the apples were placed into storage at
68
harvest from values seen historically in hard and soft cultivar lots The range of hardness
in the harvested pears was adjusted by holding the pears at room temperature (22degC) for a
selected number of days (4 6 8 days or more) prior to evaluation Pears were
categorized in three selected groups for soft (lt5 lb) intermediate (9-12 lb) and hard (gt 15
lb)
Apple or pear firmness was evaluated using the nondestructive method Sinclair
iQtrade (Sinclair Systems International- Fresno CA) and a destructive method
computerized Fruit Texture Analyzer (Guss Strand Western Cape South Africa)
Sensory Panel
The sensory panel was composed of ten panelists in 2005 and seventeen panelists
in 2006 all between the ages of 21 and 62 Panelists were recruited from the
WSUPullman community The panel was composed of two males and eight females in
2005 and three males and fourteen females in 2006 The panelists were regular apple and
pear consumers (at least once a week) All panelists signed an Informed Consent Form
and the sensory evaluation protocols were approved by the Washington State University
Institutional Review Board for human subjects participation Panelists were screened for
dental problems and other conditions that may have affected their performance in this
panel A minimum amount of information on the nature of the study was provided to
reduce potential bias panelists were informed they were expected to assess the texture of
apples and pears
Sensory Panel Training
The panelists performed the Texture Profile Method following the procedures of
texture profile analysis described in Civille and Szczesniak (1973) The texture attributes
69
were selected based upon previous literature (Paoletti and others 1993) Panelists were
trained to recognize apple texture attributes of hardness juiciness crispness and
fracturability as defined in Table 1 In 2005 the panelists were also trained to recognize
chewiness however chewiness attribute was excluded from evaluations in 2006 as it did
not yield significant results in the 2005 study In 2005 the sensory properties of apples
were evaluated by biting or chewing in an orientation parallel to the core of the fruit In
2006 sensory properties of apples and pears were evaluated by biting or chewing the
fruit in an orientation perpendicular to the core of the fruit Published texture scales
(Table 2) were used to train the selected texture attributes Panelists were trained to
recognize attributes using specific evaluative techniques (Table 3) and to assign intensity
ratings on a 15 cm line scale indented 1 cm at both ends of the line Fruits of selected
texture maturities and selected cultivars were used for training Panelists trained with
selected apple cultivars may more clearly focus on texture attributes of the fruit
Panelists received 30 to 40 hours of training each year learning the definition and
technique for each texture descriptor with the goal of reducing panelist variability and
increasing reliability Validity of the panel was assessed by analyzing the number of
correct responses over time Reliability was assessed by using duplicate test fruits and
replicating the tests Panelists were provided with feedback of individual and group
evaluations following each training session and additional training was provided if
necessary
Firmness Evaluation of Fruit
Apples and pears were equilibrated at room temperature for one day prior to
testing Firmness determinations were performed on the whole apple or pear with the
70
Sinclair iQtrade system (Sinclair Systems International- Fresno CA) The results were a
mean of three replications Fruit firmness was also determined on two peeled sides of
each fruit (sunny and shady) using a Fruit Texture Analyzer (Guss Strand Western
Cape South Africa) Results were expressed as lb of pressure and the mean value of the
two replicates was recorded
Sensory Panel Evaluations
Following apple or pear groupings for hardness by instrumental determinations
apples or pears from the soft intermediate and hard groupings were halved Half of the
fruit was utilized for tensile property determination while the other half was utilized for
sensory evaluation The apples or pears were labeled such that the tensile data and the
sensory data for each apple or pear were correlated The fruit half that was utilized in the
sensory testing was split in half Two fruit quarters were obtained from each fruit half
and presented to two panelists thus each panelist was presented with frac14 of the apple for
evaluation During each formal evaluation session panelists were presented with six
quarters of apples or pears Three replicated sessions were conducted over one week
with each session at a similar time each day Within each session each apple or pear
grouping (soft intermediate and hard) was evaluated twice in a randomized complete
block design (3 x 2 x 3 = 18 fruit quarters)
Sensory evaluation took place in individual sensory booths equipped with laptop
computers for entering and recording data The apple quarters were randomly presented
to the panelists at room temperature Apple quarters were identified using three-digit
codes and presented one at a time to panelists The fruits were scored for intensity of
each texture attribute using a 15 cm unstructured line scale with an indent 1 cm at the left
71
end of the scale corresponding to the lowest intensity (0 cm= extremely low) and an
indent 1 cm at the right end corresponding to the highest intensity (15 cm=extremely
high) Evaluations were conducted under normal light conditions Panelists were
presented with water and expectoration cups to cleanse the palate between fruit A knife
was provided to peel each fruit quarter
Results were collected and analyzed using Compusense 60 software (Guelph
ON) and sensory data were quantified by determining the distance in cm of the mark
along the line
Instrumental Analysis
Tensile properties were determined using a new methodology developed by Pitts
and others (httpwwwbsysewsueduMainPeoplefacultypittshtm) Tensile properties
were determined through a destructive test in which a slab of fruit tissue was removed
from the apple or pear and placed in a bending apparatus The bending created a
combination of compressive and tensile loads on the fruit A second tissue slab was
removed from the apple or pear to determine the compressive elastic modulus required to
determine the tensile material properties from the bending test During the bending test
the force applied and the deflection of the block were recorded in triplicate The force
and deflection values were utilized together with the compressive elastic modulus to
determine the tensile elastic modulus and failure stress of each fruit slab In the first
harvest year the tensile properties were determined in an orientation parallel to the core
of the fruit In the second harvest year tensile properties were evaluated in an orientation
perpendicular to the core (for apples and pears)
72
Data Analysis
The sensory data were subjected to two-way analysis of variance (ANOVA) using
panelist and firmness grouping as the main effects The interaction between panelists and
firmness levels were also determined for evaluation of crispness hardness fracturability
juiciness and chewiness The instrumental data was subjected to a one-way ANOVA to
determine how well the instrument differentiated the apples and pears among the three
firmness groupings Tukeyrsquos HSD was calculated to interpret the significant differences
among selected fruit firmness and sensory texture attributes (Version 753 XLSTAT
Addinsoft France) Significance was predetermined at p lt 005 Correlation analysis
was conducted to identify correlations between sensory texture and instrumental
determinations Principal component analysis was applied to sensory and instrumental
terms as a function of procedure means to compare sensory and instrumental methods
differentiation of apple and pear texture (Version 753 XLSTAT Addinsoft France)
RESULTS AND DISCUSSION
Sensory attribute ANOVA results for apple firmness groupings characterization
as determined by instrumentals determinations panelists and interaction between apples
and panelists are presented in Table 4 Differences among panelists and interaction
between apples and panelists were not significant (pgt005) This reveals consistency
among panelists and a small level of error In 2005 there were no significant differences
between intermediate and hard apples for selected texture sensory parameters However
significant textural differences between the apples were observed for the selected sensory
parameters of crispness hardness fracturability and juiciness in the 2006 cultivars
73
Panelists were able to differentiate apples harvested in 2006 based on firmness level
(Figure 1)
A logarithmic relationship between the physical properties of apples and
associated sensory response is observed in our 2005 data When apples are soft the
consumers might be expected to be more sensitive to texture differences than available
instruments are capable of determining When apples are hard the ability of consumers
to sense texture differences may decrease due to fatigue and thus instrumental
determination is more reliable than the consumer at discriminating between hard and very
hard fruit (Harker and others 1998) Figure 2 presents a summary of panelistsrsquo ability to
distinguish between soft and hard apples from the 2005 and 2006 combined harvest
years However differentiating between intermediate to hard apple cultivars was more
difficult than differentiating between soft and hard apples PC1 describes 9647 of
variation and is primarily defined by soft intermediate and hard firmness PC2 describes
only 353 of the variation and is primarily defined by intermediate firmness Similar
patterns are observed for pears in 2006 (Figure 4) Increased panelists training resulted in
a significant improvement in differentiating between intermediate and hard apples as
observed in the 2006 results
Table 5 presents the two-way ANOVA sensory attribute F values for pear texture
parameters panelists and interaction between pears and panelists Significant differences
were observed between pears for all attributes with the exception of juiciness indicating
that the sensory training received was adequate and panelists were able to differentiate
pears with selected firmness groupings (Figure 3) Significant differences were not
74
observed among the panelists demonstrating consistency within the panel Also no
significant interactions were observed among pears and panelists for selected attributes
Table 6 and Table 7 present the one-way ANOVA results of instrumental
determinations and relationships with apple and pear groupings respectively
Significant differences between apple and pear groupings were observed indicating that
selected instrumental determinations differentiated between soft intermediate and hard
apples and pears Instrumental determinations were originally selected to characterize the
apples and pears and the objective texture assessment of harvested apples and pears
supported the initial groupings
Correlation matrices for sensory texture attributes of apples are presented in Table
8 Strong correlations (rgt 080) were observed among crispiness hardness fracturability
and juiciness for apples harvested in 2005 Chewiness assessment resulted in weak
correlations with the other sensory attributes indicating that was not a strong predictor of
apple firmness Thus chewiness was removed from the apple texture profiling in 2006
In the 2006 harvest year correlations between sensory attributes were slightly smaller
especially the juiciness correlation to crispness hardness and fracturability as compared
to apples harvested in 2005
Correlation matrices for textural sensory attributes for pears are presented in
Table 9 Strong correlations (r gt 086) were observed among crispness hardness and
fracturability of pears However juiciness of pears was weakly correlated to crispness
hardness and fracturability sensory texture attributes These observations demonstrated
that the mechanism for releasing juice in the mouth is not the same among apples and
pears with the release of cell fluids depending upon the physiology of the fruit
75
Harker and others (2006) observed that juice release in apples is dependent on the
breakdown of individual cells and varies between firm and soft apples In firm apples
tissue fracture is associated with breakage of individual cells and results in the release of
cytoplasm fluids In soft apples fracture occurs as a result of cell-to-cell debonding
Individual cells do not always break open and release their contents and this result in a
mealy apple Harker and othersrsquo (2006) observations are supported by the present study
for both harvest years of apples as an increase in juiciness was observed with an increase
in apple firmness Pears behaved differently from apples as evaluated by the sensory
panel in that increased fruit firmness resulted in a small amount of juice released from
the fruit The relationship between firmness and juice release for pears is attributed to
cell-to-cell debonding and little juice is released from cells Soft pear texture is
associated with breakage of individual cells resulting in the release of juice and often a
juicy pear (Harker and others 1997) Differences between apples and pears in the way
juice contents are released may be attributed to fruit physiology and starch hydrolysis
during ripening
Correlation analysis of the degree of association between instrumental and
sensory determinations of apples is provided in Table 10 Large positive or negative
values indicate a strong association Strong to moderate correlations were observed
among the Guss Sinclair and compressive elastic modulus and the sensory attributes of
crispness hardness fracturability and juiciness Weak correlations were observed
between the tensile elastic modulus and selected sensory texture attributes in 2005
Strong correlations were observed between the Guss Sinclair compressive elastic
modulus tensile elastic modulus and the sensory attributes of crispness hardness and
76
fracturability in 2006 Guss Sinclair and compressive elastic modulus provided
determinations that did not significantly differ (p gt005) in their relationship to sensory
attributes for both harvest years However tensile elastic modulus determinations
differed significantly (p lt 005) between apples from 2005 and 2006
An increased predictability of apple crispness hardness and fracturability was
observed in 2006 Also small variability in correlations between instrumental and
sensory determinations was observed in apples between both harvest years In 2005
correlations between the Sinclair and the Guss determinations and sensory attributes were
higher than the 2006 correlations This variability may be attributed to structural
differences in selected varieties of apples and the different location of fruit harvest when
collecting the fruit Harker and others (2002) suggested that possible reasons for the
range of correlations obtained over different harvest years include the range of firmness
of fruit presented to panelists the variability between the texture of apples at the point of
instrumental determination and region of the fruit eaten by each panelist and the range of
sensory acuities and cognitive abilities of individual panelists Paoletti and others (1993)
also suggested that the mechanical and texture characteristics of apples and pears are
influenced by the structural features of the flesh and are affected by storage conditions
that result in great structural variability
Correlation analysis of the degree of association between instrumental and
sensory determinations for pears is provided in Table 11 Strong correlations were
observed between the Guss tensile elastic modulus and the texture sensory attributes of
crispness hardness and fracturability of pears Determinations made using the Sinclair
and the average elastic modulus by compression demonstrated poor correlations for
77
predicting sensory texture attributes in pears Evaluation of juiciness was negatively and
poorly correlated to instrumental determinations
Tensile elastic modulus varied significantly between apples from the 2005 and
2006 harvest years Differences of tensile determinations between harvest years may be
attributed to the distinction in how the measurement was made between the two years In
2005 the tensile elastic modulus and failure modulus were determined in a direction
parallel to the core line However in 2006 the determinations were perpendicular to the
core line due to redesign of the experimental technique Sensory evaluation techniques
and training did not differ between harvest years Tensile material properties are highly
orthotropic in that the properties change with orientation of the tissue with respect to the
core line of the fruit Paoletti and others (2003) observed that significant relationships
between flesh density and stiffness measured in torsion of apples is limited to radial
orientation (perpendicular to the core line) and not to the tangential orientation of the
apples (parallel to the core)
The current study results affirmed Paolettirsquos (2003) observations Strong
correlations of tensile determinations and crispness for apples and pears were observed
when samples were taken perpendicular to the core line as opposed to parallel to the core
line These observations are associated with the fact that tissue failure from biting with
the front teeth is crack-related Tensile material properties play a dominant role when a
crack propagates and the length of the crack propagation In the current study
fracturability and hardness were determined with the molars where compressive material
properties dominated The observations indicate that tensile material properties are
78
correlated to compressive properties and compressive properties are correlated to
fracturability and hardness
Fruit firmness or strength is a function of the mechanical properties of the cell
wall cell turgor and bonding among cells Another factor that impacts fruit firmness is
the contents of the cell Cell strength is a hydrostatic phenomenon that is diminished in
the reduction or absence of cell contents (Harker and others 1997) Studies on fruits
using pressure probes as a measure of compressive forces demonstrate that the cell wall
elastic modulus increases with increasing turgor pressure in the cell (Harker and others
1997) The results indicate that tensile material properties in fruits are attributed to the
strength of the pectin bonds between cells and the cell wall strength The compressive
material properties are attributed to the turgor pressure in the cell and to a lesser extent
on pectin bonds and cell wall strength Under selected storage environments the fruit
may mature without noticeably changing cellular turgor pressure
An advantage of tensile tests to assess fruit texture is the opportunity to determine
the mechanism of tissue failure through the examination of the fracture surface in fruit
(Harker and others 2002) There are three forms of tissue failure cell fracture cell
rupture and cell-to-cell debonding (Harker and others 1997) Harker and others (2002)
studies demonstrated that cell fracture was dominant in high firmness apples (gt66 N) cell
rupture dominated in intermediate firm apples (45 to 66 N) and cell-to-cell debonding
dominated in low firmness apples (lt 39 N)
De Belie and others (2000) observed a curvilinear relationship between pear
firmness and the tensile strength of cells demonstrating variation of mechanical
properties of a population of cells versus individual cells The compression and shear
79
properties of the cell population is evaluated in puncture tests of whole fruits while
during tensile testing the strength of thin layers of individual cells is determined The
strength of the weakest cell may define the strength of the entire fruit in tensile
determinations Generally failure in uniaxial compression of fruit is associated with an
increase in turgor pressure involving an increase of volume in the cells and rupturing of
cell walls Rupture during tension involves breakage of the cell walls andor cell-to-cell
debonding Compressive properties may be relevant to understanding factors affecting
the development of bruises in apples and pear while tensile determinations may be
closely related to biting and chewing of fruit
CONCLUSIONS
Determination of texture provides an indication of apple and pear maturity and
acceptability and is an integral part of routine fruit quality evaluation Sensory results of
apple and pear texture indicated high correlations among the sensory texture attributes of
crispness hardness and fracturability for apples and pears Disparity in juiciness
perceptions in apples and pears was attributed to the dissimilarity in cell structure When
correlating sensory evaluation to instrumental determinations both the Sinclair iQtrade
System and the Guss pressure sensor provided a reasonable predictor of apple hardness
Most of tensile properties in apples and pears have potential in predicting crispness but
are highly dependent on the orientation of the fruit A combination approach assaying
with an instrument to determine compressive and tensile properties provides the most
accurate prediction of apples and pear textural properties compared to any existing
method
80
ACKNOWLEDGMENTS
Funding for this research was provided by the Washington Tree Fruit Research
Commission (1719 Springwater Wenatchee WA 98801)
81
Attributes DescriptionCrispness Crispiness is primarily an acoustical sensation that
is detected by the ear during the fracturing of crisp foods
HardnessFirmness Hardness is the force required to bite completely through sample placed between molars
Fracturability Fracturability is the force with which sample ruptures when placing sampbetween molars and biting completely down at a fast rate
Juiciness Juiciness is the amount of juice released on mastication
Chewiness Chewiness is defined as the energy required masticating a solid food product to a state ready for swallowing (only in spring)
Table 1 Apple and pear texture attributes and descriptors as evaluated by the trained texture panel
l
82
Table 2 Texture standards used for the evaluation of texture sensory attributes
Scale value Product Brand or Type Manufacturer Sample size Temp
1 Chewy cookies Chips Ahoy Nabisco 1 cookie room
5 Chizz Sticks Cheez-it crackers The Sunshine Biscuit Co 1 piece room
10 Potato Chips Miss Vickis Miss Vickis 1 piece room
Scale value Product Brand or Type Manufacturer Sample size Temp
1 Cream Cheese Philadelphia Kraft Foods 1 cm cube 45-55 ordmF
2 Egg white hard cooked (5 min) 1 cm tip room
3 Frankfurters large uncooked Oscar Mayers Beef 1 cm slice 50-65 ordmF
4 Cheese mild Cheddar Kraft Foods 1 cm cube 50-65 ordmF
5 Olives stuffed Safeway 1 olive pimento removed room
6 Peanuts cocktail type in vacuum tin Planters Peanuts 1 nut room
7 Carrots fresh uncooked 1 cm slice room
8 Almonds 1 nut room
9 Hard Candy lemon drops Safeway 1 piece room
Substitute item Reference Cardello et al (1982) Munoz (1986)
1 Corn muffin made from mix Jiffy 1 cm cube room
2 Shortbread Shortcake Keebler 1 cm cube room
3 Graham crackers Nabisco National Biscuit Corp 12 square room
4 Melba toast plain Old London 12 square room
5 Wheat thins Nabisco National Biscuit Corp 1 cm square room
6 Ginger snaps Nabisco National Biscuit Corp 12 square room
7 Peanut brittle candy part Safeway 12 square room
1 White bread fresh center cut Safeway 1 12 cm cube room
2 Frankfurter large uncooked skinless Oscar Mayers Beef 1 12 cm cube 50-70 ordmF
3 Gum drops spice drops Safeway 1 piece room
4 Licorice candy red vines American Licorice Co 1 piece room
5 Caramel Kraft 12 piece room
6 Tootsie Rolls midget size Sweet Co of America 1 piece room
Standard Juiciness Scale (10 = most juicy all raw)
Scale value Product
0 Banana
1 Carrots
2 Mushroom
3 Snap Bean
4 Tomatoe Wedge
5 Cucumber
6 Apple
7 Strawberry
8 Honeydew Melon
9 Orange
10 Watermenlon
Szczesniak et al (1963)
Standard Chewiness Scale
Standard Crispness
Szczesniak et al (1963)
Standard Fracturability scale
Szczesniak et al (1963)
Standard Hardness Scale
Szczesniak and Ilker (1988)
83
Table 3 Sensory texture profiling technique for apples and pears
Stage I Place the fruit between front teeth Bite through the fruit by applying steady force Evaluate for
bull Crispiness amount of sound produced on the first chew Stage II Place the fruit between molars Bite through the fruit by applying steady force Evaluate for
bull Hardness force required to bite through the piece bull Fracturability force with which the cookie shatters
Stage III Chew the whole fruit Bite through the fruit by applying steady force Evaluate for
bull Juiciness amount of fluid released on the first three chews bull Chewiness number of chews required to hydrate the fruit and
bring it to a state ready for swallowing
84
Table 4 Two-way ANOVA for sensory analysis of apple texture by the trained panel in 2005 and 2006
2005 Crispness Hardness Fracturability Juiciness Chewiness Apple (S) 24167 267663 28591 83742 17299 Panelist (P) 204 13290 1164 4873 2919 Interaction (S x P) 042 1352 213 1207 225
2006 Apple (S) 13000 41600 24047 27149 NA Panelist (P) 042 1061 127 374 NA Interaction (S x P) 018 109 063 225 NA F value and significant levels from a two-way ANOVA Significant at P lt 005
85
Table 5 Two-way ANOVA for sensory analysis of pear texture by the trained panel in 2006 Crispness Hardness Fracturability Juiciness Pear (S) 33029 25855 177190 20484 Panelist (P) 1197 805 5065 6317 Interaction (S x P) 361 226 1987 2154 F value and significant levels from a two-way ANOVA Significant at P lt 005
86
Table 6 One-way ANOVA for instrumental analysis of apples in2005 and 2006
2005 Guss Sinclair AEMC AEMT Apple (S) 76539 42093 25545 2701
2006 Apple (S) 146833 128347 19576 9863 F value and significant levels from a One-way ANOVA Significant at P lt 005
87
Table7 One-way ANOVA for instrumental analysis of pears in 2006 Guss Sinclair AEMC AEMT Pear (S) 89178 13825 7987 11012 F value and significant levels from a One-way ANOVA Significant at P lt 005
88
Table 8 Correlation matrix of sensory texture attributes of apples for 2005 and 2006 Year 1 Crispness Hardness Fracturability Juiciness Chewiness Crispness 100 088 091 082 062 Hardness 088 100 092 080 064 Fracturability 091 092 100 085 061 Juiciness 082 080 085 100 058 Chewiness 062 064 061 058 100 Year 2 Crispness Hardness Fracturability Juiciness Chewiness Crispness 100 082 079 073 NA Hardness 082 100 085 065 NA Fracturability 079 085 100 067 NA Juiciness 073 065 067 100 NA
89
Table 9 Correlation matrix of sensory texture attributes of pears for 2006 Year 1 Crispness Hardness Fracturability Juiciness Crispness 100 086 087 -025 Hardness 086 100 090 -032 Fracturability 087 090 100 -028 Juiciness -025 -032 -028 100
90
Table 10 Correlation matrix of sensory attributes and instrumental determinations of apples in 2005 and 2006 Year 1 Crispness Hardness Fracturability Juiciness ChewinessGuss 072 078 074 066 064 Sinclair 081 082 083 076 065 Compressive EM 076 078 078 070 064 Tensile EM 057 062 063 053 1 Year 2 Crispness Hardness Fracturability Juiciness ChewinessGuss 078 083 076 066 NA Sinclair 075 079 074 063 NA Compressive EM 068 073 067 057 NA Tensile EM 088 078 074 069 NA EM Elastic Modulus
91
Table 11 Correlation matrix of sensory attributes and instrumental determinations of pears for 2006 Year 1 Crispness Hardness Fracturability Juiciness Guss 079 083 081 -041 Sinclair 068 071 071 -025 Compressive EM 059 061 059 -021 Tensile EM 085 079 081 -031
92
Figure 1 Apple firmness effect on sensory texture attributes for 2005
and 2006 harvest years
a
Different letters indicate significant differences (plt005) as determined by Tukeyrsquos
HSD
93
Figure 2 Apple differentiation of soft intermediate and hard apple
firmness for 2005 and 2006 combined harvest years
Soft
Intermediate
Hard
-2
-1
0
1
2
3
-4 -3 -2 -1 0 1 2 3
PC2
(35
3
)
PC1 (9647 )
94
Figure 3 Pear firmness effect on sensory texture attributes for 2006
harvest year
Different letters indicate significant differences (plt005) as determined by Tukeyrsquos
HSD
95
Figure 4 Pear differentiation of soft intermediate and hard pear
firmness for 2006 harvest year
96
REFERENCES
Abbott JA Watada AE and Massie DR 1976 Effe-gi Magnus-Taylor and Instron
fruit pressure testing devises for apple peaches and nectarines J Am Soc Hort
Sci 101698-700
Bongers AJ 1992 Comparison of three penetrometers used to evaluate apple
firmness Washington State University Tree Fruit Postharvest J 37-9
Bourne M 2002 Sensory methods of texture and viscosity measurement Ch 7 In
Food Texture and Viscosity Concept and Measurement 2nd Ed Academic Press
Geneva NY
Cardello AV Matas MA and Sweeney J 1982 The Standard Scales of Texture
Rescaling by Magnitude Estimation J Food Sci 47 1738-1740 1742
Civille GV and Szczesniak AS 1973 Guidelines to training a texture profile panel J
Texture Stud 4 204-223
Corrigan V Hurst L and Boulton G 1997 Sensory characteristics and consumer
acceptability of lsquoPink Ladyrsquo and other late-season apple cultivars New Zeal J
Crop Hort 25 375-383
Daillant-Spinnler B Macfie HJH Beyts PK and Hedderley D 1996 Relationships
between perceived sensory properties and major preference directions of 12
varieties of apples from the southern hemisphere Food Qual Prefer 7 113-126
DeBelie N Hallett IC Harker FR and Baerdemaeker J 2000 Influence of ripening and
turgor on the tensile properties of pears a microscopic study of cellular and tissue
changes J Am Soc Hort Sci 125(3) 350-356
Jaeger SR Andani Z Wakeling IN and Macfie HJH 1998 Consumer preference for
97
fresh and aged apples a cross cultural comparison Food Qual Pref 9 355-366
Harker FR and Hallett IC 1992 Physiological changes associated with development of
mealiness of apple fruit during storage HortSci 27 1291-1294
Harker FR and Hallett IC 1994 Physiological and mechanical properties of
kiwifruit tissue associated with texture change during cold storage J Am Soc
Hort Sci 119 987-993
Harker FR Maindonald JH and Jackson PJ 1996 Measurement of kiwifruit texture
operator and instrument differences J Am Soc Hort Sci 121 927-936
Harker FR Redgwell RJ Hallett IC Murray SH and Carter G 1997 Texture of fresh
fruit Hort Rev 20 121-224
Harker FR Hallett IC Murray SH and Carter G 1998 Food-Mouth interactions
towards a better understanding of fruit texture Acta Hort 464461-466
Harker FR Maindonald J Murray SH Gunson FA Hallett IC and Walker SB 2002
Sensory interpretation of instrumental measurements 1 texture of apple fruit
Postharvest Biol Tec 24 225-239
Harker FR Amos RL Echeverria G and Amdgunson FA 2006 Influence of texture on
taste insights gained during studies of hardness juiciness and sweetness of apple
fruit J Food Sci 71(2)S77-S82
Kapsalis JG and Moskowitz HR 1978 Views on relating instrumental tests to
sensory assessment of food texture J Texture Stud 9 371-393
Market Review 1996 UK fruit and vegetable market review 1995-1996 Fresh Fruit
and Vegetable information Bureau London
Meilgaard M Civille GV and Carr BT 1999 Descriptive analysis techniques Ch 10
98
In Sensory Evaluation Techniques 3rd Ed CRC Press Boca Raton FL
Munoz AM 1986 Development and application of texture reference scales J Sens
Stud 155-83
Paoletti F Moneta E Bertone A and Sinesio F 1993 Mechanical properties and
sensory evaluation of selected apple cultivars LWT 26 264-270
Peleg K 1993 Comparison of non-destructive and destructive measurement of apple
firmness J Agr Eng Res 55 227-238
Schoorl D and Holt JE 1983 A practical method for tensile testing of apple tissue J
Texture Stud 14 155-164
Shmulevich I Galili N and Howarth MS 2003 Nondestructive dynamic testing of
apples for firmness evaluation Postharvest Biol Tec 29 287-299
Stow J 1989 The involvement of calcium ions in maintenance of apple fruit tissue
structure J Exp Bot 40 1053-1057
Szczesniak AS Brandt MA and Friedman HH 1963 Development of standard rating
scales for mechanical parameters of texture and correlation between the objective
and the sensory methods of texture evaluation J Food Sci 28 397-403
Szczesniak AS and Ilker R 1988 The meaning of textural characteristics-
juiciness in plant food stuffs J Texture Stud 19 61-78
Thybo AK Kuhn BF and Martens H 2003 Explaining Danish childrenrsquos
preferences for apples using instrumental sensory and demographicbehavioral
data Food Qual Pref 15 53-63
Turner J Bai J Marin A and Colonna A 2005 Consumer sensory evaluation of pear
cultivars in the Pacific Northwest USA Acta Hort 671 355-360
99
Chapter Four
STANDARD SCALES FOR CRISPNESS CRACKLINESS AND
CRUNCHINESS IN DRY AND WET FOODS RELATIONSHIP
WITH ACOUSTICAL DETERMINATIONS
MAITE A CHAUVIN1 FRANK YOUNCE1 CAROLYN ROSS1 and
BARRY SWANSON12
1Food Science and Human Nutrition
Washington State University
Pullman WA 99164-6376 USA
2Corresponding author Dr Barry Swanson
Food Science and Human Nutrition
Washington State University Pullman WA 99164-6376 USA
Tel 1-509-335-3793
Fax 1-509-335-4815
Email swansonbwsuedu
STANDARD SCALES OF TEXTURE
100
ABSTRACT
To quantitatively evaluate food texture a trained panel developed rating scales for
crispness crunchiness and crackliness for dry and wet foods based on the auditory
perception of selected foods The newly developed scales were then evaluated by forty
untrained panelists and the sound perception of standard foods was assessed through the
analysis of the root mean square (RMS) of the 5 s audio waveforms and multidimensional
scaling (MDS) The RMS was highly correlated to auditory sensory perception of
crispness (r = 083 and 096) crunchiness (r = 099 and 099) and crackliness (r = 088
and 096) for dry and wet foods respectively MDS technique applied for the 40
untrained panelists was instructive in assessing auditory textural differences of naive
panelists and a good statistical instrument to graphically validate selected scales
Auditory perception of the selected foods were rated similarly using standard auditory
texture scales for crispness crunchiness and crackliness developed by the trained panel
and MDS results from the consumer panel
PRACTICAL APPLICATIONS
Crispness crunchiness and crackliness are not only important and useful
descriptors of food texture but are desirable textural qualities in many foods The lack of
consistency in the procedures used for evaluation of crunchy crispy and crackly in
sensory studies often results in confusion when training expert panels Research will
benefit textural studies through an improvement of consistent textural definitions
development of standard scales and evaluation techniques
The crispness crunchiness and crackliness scales developed and applied in the
current study represent a new potential standard frame of reference that may be used for
101
training panelists in texture parameters related to food auditory perception The scales
may be considered illustrations demonstrating full and practical ranges for each texture
attribute with regards to analyzing auditory parameters of foods The root mean square
(RMS) of the audio waveform is a reliable fast and convenient tool to analyze auditory
texture parameters in food while MDS is an effective means of analysis for comparing
auditory data generated by untrained panelists
KEY WORDS crispness crunchiness crackliness auditory perception MDS wet
foods dry foods RMS
102
INTRODUCTION
Textural properties are key drivers in food acceptability Texture in food is
perceived through a combination of visual tactile kinesthetic and auditory sensations
Crispy and crunchy properties are the main texture attributes affecting acceptability of
food with regard to auditory sensations (Roudaut et al 2002 Szczesniak 2002)
Although crispness and crunchiness are commonly used terms in sensory studies there is
little agreement among experts regarding their definitions and evaluation techniques
The association of acoustic sensations with the perception of texture was
previously studied for crisp crunchy and crackly foods (Drake 1963 Kapur 1971
Vickers and Bourne 1976 Vickers and Wasserman 1979 Vickers and Christensen
1980 Vickers 1981 1983 1984a 1984b 1987a 1987b Dacremont et al 1991 1995
Lee et al 1990 De Belie et al 2002 Luyten and Van Vliet 2006) The acoustic
sensations of a food are affected by the arrangements of cells chemical bonds fruit or
vegetable maturity and moisture (Al Chakra et al 1996) The noise production resulting
from biting is attributed to the rupture of the cell wall Few too many cells may rupture
at any point during the mastication process to produce an irregular series of sounds
resulting from crushing the cellular structure of foods (Vickers and Bourne 1976)
Cellular foods that contain only air within their cells such as biscuits or chips are
designated dry crisp foods while foods that contain fluids within their cells such as fruits
and vegetables are called wet crisp foods Edmister and Vickers (1985) believe that
although dry crisp and wet crisp foods differ in cellular composition both foods produce
similar auditory cues for crispness perception Vickers and Bourne (1976) suggested that
the mechanism of sound production for dry and wet foods is different but the consumer
103
perception while chewing either food is similar However Jowith (1974) Vickers and
Christensen (1980) and Mohamed et al( 1982) suggest that the loudness of panelistsrsquo
chewing sounds perception of crispness andor instrumental crispness determinations
may differ between dry and wet crisp foods
The sensory evaluation of crispness crunchiness and crackliness is a complex
process The use of the same descriptor in different studies with trained panelists is not a
guarantee that an equivalent sensory perception is observed For example ldquocrispyrdquo is
employed to illustrate the same parameters described by other panelists as ldquocrunchyrdquo
(Brown et al 1998 Guraya and Toledo 1996) Whether crispy and crunchy refer to a
similar sensory concept remains unresolved Seymour and Hamann (1988) and Vickers
(1981 1985) reported a strong positive correlation between crispness and crunchiness
which favors the hypothesis of two descriptors for a unique sensory perception
parameter However other research suggests that crispy and crunchy refer to different
sensory parameters (Dacremont 1991 1995) Moreover studies on crispness
crunchiness and crackliness conducted in several countries contribute additional
complexities in comparing the results (Roudaut et al 2002)
Descriptive analysis training of panelists for crispness crunchiness and
crackliness evaluation focuses on parameters such as the structure of the intact food
sounds emitted at fracture the force needed to crush the food the collapse of the food at
fracture and the appearance of pieces observed and perceived following fracture
(Roudaut et al 2002) However little agreement exists on definitions and techniques of
oral manipulation during chewing in determining crispness crunchiness and crackliness
104
Depending on the definitions (Tables 1 2 and 3) some parameters for crispy crunchy
and crackly foods are emphasized more than others (Roudaut et al 2002)
For acoustic studies of crisp crunchy and crackly food products two approaches
are generally followed The first acoustic approach determines the contribution of the
perception of air-conducted sounds to the sensation of crispness and crunchiness
(Christensen and Vickers 1981 Vickers 1979 1980 1981 1984a) The second acoustic
approach involves recording sounds produced during the application of force to a food to
obtain quantitative acoustic information regarding the crisp crunchy or crackly sounds
(Drake 1963 Kapur 1971 Vickers and Bourne 1976 Edmister and Vickers 1985
Vickers 1985 Seymour and Hamann 1988 Dacremont et al 1991) Acoustic
determinations are also combined with mechanical determinations (force-deformation) to
predict crispness and crunchiness (Vickers 1987 Szczesniak 1988) A combination of
acoustic and mechanical techniques more adequately describes food sound perception
than either technique alone (Vickers 1987)
The association that acoustic sensations exhibit with the perception of texture
provides the opportunity to develop a standard scale composed of crispy crunchy and
crackly food sounds that can be recorded and be free of changes with time The standard
scales will also be useful for texture comparison of foods among laboratories (Vickers
and Bourne 1976) and for descriptive analysis by trained panelists The objective of this
study was to establish a standard reference scale for selected dry and wet crisp crunchy
and crackly foods The relationship between acoustical and oral perception of crispness
crunchiness and crackliness was also developed in order to distinguish between sensory
evaluations of crispness crunchiness and crackliness sensory parameters
105
MATERIALS AND METHODS
DEVELOPMENT OF NEW TEXTURE REFERENCE SCALES
Panelists
Eight panelists from Washington State University participated in the development
of texture references for dry and wet crispness crunchiness and crackliness scales
Panelists included 8 females 21 to 63 years of age who were trained for 80 hours in a
previous study using the Texture Profile method (Civille and Szczesniak 1973)
Panelists were screened for normal hearing ability dental problems and other conditions
that may have affected their performance on the panel All panelists signed an Informed
Consent Form and the sensory evaluation protocols were approved by the Washington
State University Institutional Review Board for human subjects participation Panelists
received a small compensation for their participation in the study
Training Procedure
The first stage of training involved extensive instruction about methods and
descriptors of interest Literature regarding the techniques and definitions of crispness
crunchiness and crackliness was examined by the trained panel through a summary of
existing literature presented by the facilitator (Tables 1 2 and 3) A crispness scale
developed previously for descriptive training with dry foods (Meilgaard et al 1999) was
presented as a starting point of discussion and a modification of the scale was suggested
by the panelists in a focus group setting The facilitator took notes and the summary of
the discussion was distributed to each panelist following each session Due to the
variability in procedures and texture definitions the panelists agreed to establish a
comprehensive evaluation technique and definition of crispness crunchiness and
106
crackliness for texture evaluation of foods A variety of foods were selected for
consideration by the panelists as preliminary evaluation Foods were selected after
review of previous studies of crispness crunchiness and crackliness The objective was
to guide panelists in establishing the textural attribute of interest and standardization of
corresponding evaluation procedures to characterize crispness crunchiness and
crackliness The use of a 15 cm unstructured line scale indented 1 cm at both ends was
introduced during this stage of training Individual evaluations were marked on the
unstructured line scales anchored at the ends with the terms ldquononerdquo and ldquoextremerdquo This
rating method was used throughout the entire training period and during texture
evaluation sessions
Immediately following the initial orientation the panel met for a total of twenty
hours four hours per week for five weeks to practice the techniques developed during
the orientation training session Throughout this second stage of training the crispness
crunchiness and crackliness standard scales for dry and wet foods were developed and
definitions and evaluation techniques were discussed The development of each scale
started with a group discussion to suggest food items representing the texture
characteristic under study For the subsequent evaluations the potential reference
materials were purchased by the facilitator and evaluated by each panelist Group
discussion followed individual evaluations for each standard scale development
Consensus approval of each item and size was required before a food was accepted as a
standard Within each standard scale a range of commercial foods was selected to
develop the final standard scale Once the range of the standard scale was established
three replicate samples within a product type were evaluated Texture data for each
107
attribute were collected analyzed and uniformity and appropriateness of each food were
discussed by the panel
In the third stage of training two 2 hour sessions were held following scale
development for each standard scale The biting or chewing sounds generated by the
facilitator from each food along the newly developed standard scales were recorded in
triplicate The objective was to compare the recorded sounds generated by biting or
chewing every food on each standard scale by evaluation of the root mean square (RMS)
of all recorded sounds RMS was used as an instrumental method to compare the results
from perceptual texture assessment of the trained panel The RMS of the voltage output
was determined from the microphone which was proportional to the RMS of the sound
pressure Based on the RMS results of the recordings during subsequent sessions several
foods were eliminated by consensus of the panelists and new standard foods were
considered in order to include the entire range of intensities for every attribute When the
panelists considered that a range of standard foods was representative of a specific
intensity the food was included in the standard scale The final intensity of each
reference food on the scale was established by individual judgments followed by group
discussion to reach consensus The final foods selected for each standard scale are
presented in Tables 5 to 10
Acoustic Analysis of the Standard Scales
Foods for the developed standard scales (Tables 5 to 10) were purchased in a local
supermarket Fruits and vegetables were inspected visually and manipulated by hand to
determine freshness Sound recordings of an individual biting or chewing of the foods in
each standard scale were produced by employing the technique presented in Table 4 To
108
avoid recording the clacking of teeth when biting during the crispiness test a 158 mm
thick piece of FDA compliant silicone rubber sheet (Durometer 50A firmness) was
placed between the incisors in the mouth opposite of the food standard During both the
biting and chewing an AKG condenser microphone (model C577 Nashville Tennessee)
was held inside a Koss headphone (model Ur29 Milwaukee Wisconsin) and against the
outer ear immediately above the opening of the ear canal Chewing or biting sounds were
recorded on a personal computer using Syntrillium Cool Edit (Syntrillium Software
Corporation Phoenix Arizona) A Radio Design Labs low noise microphone
preamplifier (model STM 2 Prescott Arizona) with a Power One 24 volt linear DC
power supply (model HB24-12A) which was connected between the microphone and
the personal computer Six recordings of each food were recorded at 44100 kHz mono
in replicate and saved as 5 s ldquowavrdquo files Recorded sounds were analyzed using root
mean square (RMS) calculated from the voltage signal of the entire 5 s waveform by
means of Cool Edit program (Syntrillium Software Corporation Phoenix Arizona)
Data Analysis
Correlation analysis was conducted to identify correlations between auditory
determinations and the sensory panel evaluations Principal component analysis (PCA)
was applied to instrumental and sensory terms as a function of procedure means to
compare how the instrumental and sensory methods differentiated the texture attributes
(Version 753 XLSTAT Addinsoft France) Significance was established at p lt 005
109
CONSUMER PANEL
Panelists
Panelists were recruited from Washington State University staff students and members
of the community Panelists were screened for auditory conditions and interest in
participating in the study Minimal information about the study was given to the
panelists to reduce bias Panelists consisted of 27 women and 13 men between the ages
of 21 to 60 years All panelists signed an Informed Consent Form and the sensory
evaluation protocols were approved by the Washington State University Institutional
Review Board for human subjects participation Panelists received compensation for
participation in the study Panelists were also given a demographic questionnaire and
oral and written instructions before their participation in the study None of the panelists
expressed previous experiences with auditory evaluation of foods and were considered
naive panelists
Preparation of Recordings
The audio recordings from the acoustic analysis of the standard scales containing
minimal background noise were selected for the consumer panel
Multidimensional Scaling Test
Test foods consisted of the audio recordings representing the standard scales for
crispness crunchiness and crackliness for dry and wet foods Foods source and size of
all standard scales are presented in Tables 5 to 10 Multidimensional scaling (MDS) was
used to examine panelistsrsquo auditory perceived similarities among foods
Panelists participated in a single one hour test session Each panelist evaluated
the sound files individually in the presence of the facilitator Instructions to the panelists
110
included both an operational definition of each attribute to be presented to the panelists
(Table 4) as well as instructions on the utilization of similarity judgments scales
There were N(N-1)2 possible pairs to compare for a set of N foods in each
standard scale Panelists listened to the audio recordings through a Koss Ur29
headphones connected to a personal computer Panelists were instructed that a person
was biting or chewing a food and were asked to compare the loudness (the degree of
volume of the sound) of each pair of audio recordings
Audio recordings were presented as paired comparisons together with a ballot
asking panelists to quantitatively rate the similarity between the two audio recordings of
food being bitten or chewed A similarity 9-point scale with the words ldquoexactly the
samerdquo at the high end (9) and ldquocompletely differentrdquo at the low end (1) was presented to
the panelists Similarity judgments were formulated by writing a number describing
quantitatively the perceived similarity between each pair Once each panelist was
finished with the first comparison shehe was instructed to advance to the second
comparison A separate ballot was provided for each standard scale and all panelists
were instructed to wait one minute between each standard scale Panelists were not
permitted to go back review or change previous responses
Pairs of foods audio recordings were presented in a random order labeled with a
three digit code Each audio recording pair was analyzed once by each panelist A total
of 10 paired comparisons for crispness of dry and wet foods crunchiness of wet foods
and crackliness of dry and wet food sounds were analyzed A total of 15 paired
comparisons for crunchiness of dry food sounds were also evaluated
111
Data Analysis
One matrix was constructed from the pairwise similarity scores for each standard
scale for crispness crunchiness or crackliness of dry and wet foods for each of the forty
panelists Every cell within each matrix yielded a similarity score ranging from 1 to 9
quantifying perceived differences in auditory perception on the 9-point scale
The forty individual matrices were combined to yield one matrix for each
standard scale illustrating the mean group pairwise similarity scores Each cell within
the group matrices yielded a mean score for each standard food on every scale reflective
of the 9-point scale
Data were analyzed as similarity estimates with XLSTAT 754 (Addinsoft Paris-
France) MDS algorithm ALSCAL module for nonmetric multidimensional scaling
using the option for minimizing Kruskalrsquos stress Formula 1 two-dimensional solutions
was applied Outputs included an assessment of stress quantifying the fit between the
data and the scaling model and R2 values calculating the variability among underlying
data that accounted for the MDS solution (Zraick 2000)
RESULTS and DISCUSSION
Tables 5 to 10 present the standard scales developed for crispness crunchiness
and crackliness of dry and wet foods The standard scales include the range of intensity
of a selected textural auditory characteristic observed with biting and chewing in food
products as perceived by panelists Each point on the scale is represented by a specific
food product allowing the designation of a numerical rating to an unknown food by
comparing it to a known food Within each scale a range of specific auditory textural
112
parameters is demonstrated using foods that have the attribute under study as a major
property The advantage of a multi-food standard scale is that frequently a given
attribute is perceived differently in selected foods Converting food texture standard
scales to a one-dimensional series may be undesirable because a single dimension may
distort illustration of diversified sensory perceptions of the textural parameters (Civille
and Liska 1975) The standard scales are not intensity scales against which foods are
compared to obtain a rating Rather the standard scales are illustrations that demonstrate
the principal range of selected textural characteristics The standard scales for crispness
crunchiness and crackliness of dry and wet products are offered as a means of helping the
food researcher obtain descriptive and quantitative sensory data on textural characteristics
related to sound emitted during chewing or biting of food The use of a descriptive panel
over a compression instrument is preferred when working with masticatory sounds
because it includes changes during mastication particularly its hydration with saliva
(Dacremont et al1991)
The procedures for texture sensory evaluation must adhere to rigid testing
controls Table 4 presents the methods used in this study to assess crispness crunchiness
and crackliness Attention to preparation serving presentation biting and chewing
techniques must be standardized (Civille and Szczesniak 1973) The entire panel must
receive consistent training in the principles and evaluation methods of crispness
crunchiness and crackliness of foods Many factors may be responsible for the large
variation in crisp crunchy or crackly sounds the size shape and orientation of the food
in the mouth the amount of contact surface between the teeth and the food the degree to
which the mouth is opened variations within the food the rate and force of biting or the
113
way the food breaks down A properly trained panel will minimize variation (Vickers
and Bourne 1976) The appropriate use of auditory textural scales will yield data
reproducible among panelists panels and locations The reproducibility of the trained
panel is related to establishment of common frames of reference among panelists and
panels
The consumer study conducted was analyzed through Multidimensional Scaling
(MDS) MDS was performed for the newly developed standard scales for crispness
crunchiness and crackliness of dry and wet foods Analyses of the six standard auditory
texture scales were performed in the two-dimensional configuration The mean stress
values were small (lt01) and reflected the ability of the MDS algorithm to fit calculated
distances to the texture results in two dimensions MDS two-dimensional graphical
representation of crispness crunchiness and crackliness for dry and wet foods are
presented in Figures 1 to 6 All figures illustrate agreement with the newly developed
standard scales for all attributes Every food in the consumer MDS graphical
representation is located in a similar location as presented in all standard scales
developed by the trained panel
The first dimension in the MDS output for auditory crispness of dry foods is
attributed to the texture characteristic of crispness (Figure 1) The food items that
represented the intensity of a specific stimulus are located in similar geometrical space as
their location on the standard food texture scale The second dimension may be credited
to other auditory cues because the panelists were not trained and were considered naiumlve
consumers Similar trends were observed for crispness in wet foods (Figure 2) and
crunchiness in dry and wet foods (Figures 3 and 4 respectively) The second dimension
114
in the MDS output for crackliness in dry and wet foods (Figures 5 and 6) is attributed to
the texture characteristic of crackliness and the first dimension to other auditory cues
The consumer study confirms the perceptual differences identified by the panelists
among crispness crunchiness and crackliness The consumer results indicate that the
standard scales were appropriately developed and are useful for further training of
panelists for texture evaluation
Jowith (1974) Vickers and Christensen (1980) and Mohamed et al (1982)
suggested that sensory crispness andor instrumental crispness determination may differ
between wet and dry crisp foods The results of the current study support this theory
Figure 7 from the MDS analysis illustrates the separation on wet and dry foods along the
three attributes Panelists were able to differentiate between auditory crispness
crunchiness and crackliness and also between wet and dry foods Three independent
clusters between each texture attribute of crispness crunchiness and crackliness are
observed and within each cluster a clear distinction between dry and wet foods is seen
The difference between dry and wet foods and its relationship with auditory
perception presented in Figure 7 can be explained by the fact that most wet foods are
comprised of living cells and contribute turgidity A sound is generated whenever a
turgid cell is ruptured Strong cell walls can withstand more pressure and release more
moisture on chewing or biting producing a louder noise Soft cell walls exhibit little or
no accompanying sounds during chewing or biting therefore a decrease in sound is
observed (Vickers and Bourne 1976) The mechanism of sound production in dry foods
is different In dry foods the cells are filled with air and the cell walls are brittle The
sounds are produced from the collective breaking of individual cells when biting or
115
chewing is applied to a brittle cell wall When the cell wall bends and breaks the
residual of the cell wall and any fragments snap back to the original shape generating a
sound Loudness in dry foods is influenced by the velocity of which the broken cell wall
vibrates The decrease of cell wall stiffness resulting from an increase in moisture
content is accompanied by a decrease in sound production (Vickers and Bourne 1976)
The assessment of wet foods standard scales could be problematic during training
due to cultivar and regional differences of fruits and vegetables Szczesniak and Ilker
(1988) successfully developed a standard scale for juiciness analysis consisting of
selected fruits Using wet foods Munoz (1986) also developed standard scales for
adhesiveness to lip cohesiveness of mass adhesiveness to teeth and wetness analysis
Although work went into the selection of the foods representing the various points in
each scale in the present study some foods may not be readily available due to
seasonality or location It is feasible to substitute foods in each standard scale depending
on specific needs circumstances and availability When an appropriate food substitute is
identified it should be evaluated objectively to ensure that the food is similar to the
original reference food Evaluation is important to make certain that the food substitute
exhibits the proper intensity of the desired auditory textural characteristic (Civille and
Liska 1974)
The newly developed standard scales for crispness crunchiness and crackliness
for dry and wet foods were validated instrumentally by calculating the average power
estimated from the RMS of the voltage signal Table 11 presents strong correlations (r =
083 to 099) between the average power and sensory evaluations of crispness
crunchiness and crackliness for wet and dry foods The average RMS power is a strong
116
measure of the overall loudness of the waveform selection Vickers and Bourne (1976)
observed less total sound produced in the less crisp foods and louder sound production in
more crisp foods The difference in perceived crispness was associated with a difference
in the number of sounds produced in a given biting distance and the loudness of the
sounds produced Vickers and Christensen (1980) evaluated how crispness loudness and
firmness were perceived by panelists by both biting and chewing the food concluding
that the chewing or biting technique made no difference in the sensory judgments The
relationship between crispness and loudness suggested that crispness judgments were
more highly correlated to the auditory sensation of loudness than to the tactile sensation
of firmness Snap loud and crackly were other sensory attributes closely associated with
crispness
Moskowitz and Kapsalis (1974) Vickers (1979) Vickers and Wasserman (1980)
Vickers (1984b) Szczesniak and Kahn (1971) and Vickers (1981) produced evidence to
indicate that crispness crunchiness and crackliness are closely related attributes and are
not descriptors of one attribute alone In the current research perceptual sensory
differences among crispness crunchiness and crackliness were found (Figure 7)
Untrained panelists separated auditory sensations when judgments were made on the
basis of loudness only Vickers (1981) observed high correlations between crispness
crunchiness and hardness and between oral and auditory perception of foods Vickers
(1984a) evaluated crackliness and hardness of food under three selected conditions
normal biting and chewing with biting and chewing sounds blocked and by listening to
recorded biting and chewing sounds Vickers (1984) concluded that either oral tactile
cues or auditory cues can be used to make crackliness judgments The current study
117
research demonstrates that auditory cues are adequate to identify crispness crunchiness
and crackliness perception of foods
CONCLUSIONS
The developed standard scales for crispness crunchiness and crackliness for dry
and wet foods provide individuals interested in auditory texture evaluation a starting
point to assist in training descriptive analysis of food texture Although future
modifications in reference material attribute definition or evaluation procedures are
expected this study represents a first step in the generation of reproducible auditory
sensory data using standard scales MDS output demonstrated that crispness crunchiness
and crackliness are distinguishable sensory texture parameters belonging to selected
distinguishable concepts and can be analyzed by the sole presence of auditory cues
Also it was demonstrated that there is a perceptual difference between texture attributes
for dry and wet foods and that differentiating between both is essential for descriptive
analysis training
ACKOWLEDGMENTS
A special recognition to the expert panel from Washington State University for
their enthusiastic participation and contribution to this study C Armfield E Giesbers
MJ Hamilton P Konomos S Lee M Sanborn D Setiady
118
TABLES AND FIGURES
Table 1 Literature citations of crispness Definition Technique Reference
Relative force required to bite through the product
Biting with front teeth
Jeon et al 1975
Products that produce a higher pitched sound Biting with front teeth
Vickers 1984b
First Bite place the product between the incisors bite through and evaluate the level of higher pitched noise
Biting with front teeth
Seymour and Hamman 1988
Firm and brittle snaps easily emitting a typical sound upon deformation
NA Szczesniak 1988
The perceived relative force used by crunching the product in the mouth
Molars Onwulata and Heymann 1994
The perceived force with which the product separates into two or more distinct pieces during a single bite with the incisors An abrupt and complete failure of the product is required
Incisors first bite
Barrett 1994
Products that produce a high pitched sound that show high level of frequency higher than 5 kHz especially for air conduction sounds
Only incisors or bitten and chewed
Dacremont 1995
The amount and pitch of sound generated when the product is first bitten with the front teeth
Front teeth bite
Harker et al 1997
A combination of the noise produced and the breakdown of the product as it is bitten entirely through with the back molars
Biting with the back molars
Duizer et al 1998
Fractures in an abrupt manner after applying a relatively small force on the product
Front teeth first bite
Vincent et al 2002
Fracture in an abrupt brittle manner after applying a relatively small force on the product on the first chew with the molars
Molars second bite
Vincent et al 2002
Cracks you can force your teeth through slowly more airy than crackling
At first bite Dijksterhuis et al 2005
119
Soft sound more airy than crackling Association with fresh disintegrates into pieces smaller than when crackling
During chewing
Dijksterhuis et al 2005
A combination of the type of sound ie short snapping and longer cracking sounds and the force to bite and chew as perceived on the first bite
First bite Duizer and Winger 2006
120
Table 2 Literature citation of crunchiness Definition Technique Reference
Is the perceived hardness of a food after it is crushed and chewed in the mouth 2-3 times Also defined as the amount of force necessary to crush and grind the cube during the second and subsequent chews
Chewing with molars
Moskowitz et al 1974
Products that produce lower pitched sounds are less loud and last longer than for crisp Firm and brittle Snaps easily with typical sound
Chewing with molars
Vickers 1984b
Degree of low pitched noise (with respect to crisp sounds) but above threshold pitch considered too low
Place product between molar teeth
Seymour and Hamman 1988
Complex failure mechanism that involves repetitive deformation and fracturing of cell structure Necessary are structural subunits especially with cells with brittle cell walls Continuous fracture during chewing Sensory description the perceived intensity of repeated incremental failures of the product during a single complete bite with the molar teeth
First bite with molars
Barrett 1994
The perceived cumulative intensity of force required for repeated incremental failures of the product by chewing up to five times with the molars
Chewing with molars
Guraya and Toledo 1996
Harker et al 1997 The amount of noise generated when the product is chewed at a fast rate with the back teeth
Chewing with back teeth
Products that produce a low-pitched sound with a characteristic peak on frequency range 125 to 2 kHz for air conduction
Only incisors or bitten and chewed
Dacremont 1995
Temporal aspects of the sensory feedback during mastication are important for the crunchy sensation Independent from hardness
Chewing with molars
Brown et al 1998
121
Crunchy would be associated with a hard and dense texture that fractures without prior deformation producing a loud low-pitch sound that is repeated during several chews Crunchy is more relevant to fruits and vegetables when compared to crispness
Mainly during chewing
Fillion and Kilcast 2001
Fractures after applying a higher force on the product than for crispness
Front teeth first bite
Vincent et al 2002
Fractures after applying a higher force on the product than for crispness on the first chew with the molars
Molars second bite
Vincent et al 2002
High-pitched sound light sound long sounding During chewing Dijksterhuis et al 2005
122
Table 3 Literature citations of crackliness Definition Technique Reference
To make small sharp sudden and repeated noises
At first bite or during chewing
Vickers 1984a
Products that generate low-pitched sounds with a high level of bone conduction Discrimination between crackly and crunchy foods could be due to vibrations propagated by bone conduction that also generated vibrotactile sensations
Only incisors Dacremont 1995
Combination of sound and bite force Clip between the teeth and it breaks Crackling is harder than crispy It snaps
At first bite Dijksterhuis et al 2005
Audible for a long period during chewing bigger pieces mainly of the crust
During chewing Dijksterhuis et al 2005
123
Table 4 Technique for the evaluation of crispness crunchiness and crispness developed by seven trained panelists Crispness Place the product between the incisors (front
teeth) bite through the product and evaluate the intensity of the sound after the first bite using as near as possible the same biting rate and force for all products in the scale
Crunchiness Place products between molars bite down with low pressure (regular eating pattern) Chew product 2 to 3 times and listen to the sound produced and how the sound diminishes (intensity and duration of the sound)Place product between molars and bite once with a lot of force without grinding the products Snap down
Crackliness Place product between molars and bite once with a lot of force without grinding the products Snap down
124
Table 5 Crispness standard scale for dry foods developed by seven trained panelists Scale value Reference BrandManufacturer Sample Size
2 Rice Krispies Treats Kelloggs 16 bar 5 Fiber Rye Wasa 13 slice 8 Multigrain Mini Rice Cakes (Honey Graham) Quaker 1 cake
10 Tortilla Chips (Bite size Tostitos) Frito Lay 1 chip 15 Kettle Chips Frito Lay 1 chip
125
Table 6 Crispness standard scale for wet foods developed by seven trained panelists Scale value Reference BrandManufacturer Sample Size
0 Banana Supermarket 12 thick slice 4 Gala Apple Supermarket 12 thick slice
75 Granny Smith Apple Supermarket 12 thick slice 10 Jicama Supermarket 12 thick slice 15 Carrots Supermarket 1 mini peeled carrot
126
Table 7 Crunchiness standard scale for dry foods developed by seven trained panelists Scale value Reference BrandManufacturer Sample Size
1 Rice Krispies Treats Kelloggs 16 bar 4 Goldfish Baked Crackers Pepperidge Farm 1 cracker 7 Cheez-it Baked Snack Crackers Sunshine 1 cracker 9 Tortilla Chips (Bite size Tostitos) Frito Lay 1 chip
12 Honey Maid Graham Honey Sticks Nabisco 1 stick 15 Melba Toast Old London 12 toast
127
Table 8 Crunchiness standard scale for wet foods developed by seven trained panelists
Scale value Reference BrandManufacturer Sample Size 0 Banana Supermarket 12 thick slice 4 Gala Apple Supermarket 12 thick slice
10 Jicama Supermarket 12 thick slice 125 Banquet Baby Dill Nalley 12 thick slice 15 Green Pepper Supermarket 12 thick slice
128
Table 9 Crackliness standard scale for dry foods developed by seven trained panelists Scale value Reference BrandManufacturer Sample Size
2 Club Cracker Keebler 12 cracker 7 Multigrain Mini Rice Cakes Quaker 12 cake 9 Le Petit Beurre Tea Cookie Lu 18 square
12 Triscuit Nabisco 14 broken with the grain 15 Ginger Snap Archway 12 cookie
129
Table 10 Crackliness standard scale for wet foods developed by seven trained panelists Scale value Reference BrandManufacturer Sample Size
1 Medium Black Olives Canned 1 olive 5 Daikon Radish Supermarket 14 thick slice
75 Turnip Supermarket 14 thick slice 10 Jicama Supermarket 14 thick slice 15 Carrots Supermarket 12 mini peeled carrot
130
Table 11 Correlation between auditory recordings (average RMS) and sensory evaluation by untrained panel r Crispness Dry Foods 083Crispness Wet Foods 096Crunchiness Dry Foods 099Crunchiness Wet Foods 099Crackliness Dry Foods 088Crackliness Wet Foods 096
131
Figure 1 MDS representation of auditory crispness for dry foods
Rice Krispie Treats
Fiber Rye
Mini Rice Cakes
Tortilla Chips
Kettle Chips
-5
-4
-3
-2
-1
0
1
2
3
4
5
-5 -4 -3 -2 -1 0 1 2 3 4 5
--D
im1
--gt
-- Dim2 --gt
Configuration in space Dim2 times Dim1 (stress 0076)
132
Figure 2 MDS representation of auditory crispness for wet foods
Banana
Gala Apple
Granny Smith Apple
Jicama
Carrots
-6
-4
-2
0
2
4
6
-6 -4 -2 0 2 4 6
--D
im1
--gt
-- Dim2 --gt
Configuration in space Dim2 times Dim1 (stress 0090)
133
Figure 3 MDS representation for auditory crunchiness for dry foods
Rice Krispies Treats
Goldfish Baked Crackers
Cheez-it Crackers
Graham Honey Sticks
Tortilla Chips
Melba Toast
-5
-4
-3
-2
-1
0
1
2
3
4
5
-5 -4 -3 -2 -1 0 1 2 3 4 5
--D
im1
--gt
-- Dim2 --gt
Configuration in space Dim2 times Dim1 (stress 0087)
134
Figure 4 MDS representation of auditory crunchiness for wet foods
135
Figure 5 MDS representation of auditory crackliness for dry foods
136
Figure 6 MDS representation of auditory crackliness for wet foods
137
Figure 7 MDS representation for overall auditory crispness crunchiness and
crackliness for dry and wet foods
138
REFERENCES
AL CHAKRA W ALLAF K and JEMAI AB 1996 Characterization of brittle food
products Application of acoustical emission method J Text Stud 27 327-
348
BARRETT AH CARDELLO AV LESHER LL and TAUB IA 1994
Cellularity mechanical failure and textural perception of corn meal extrudates J
Text Stud 25 77-95
BROWN WE LANGLEY KR and BRAXTON D 1998 Insight into consumer
assessments of biscuit texture based on mastication analysis-hardness versus
crunchiness J Text Stud 29 481-497
CHRISTENSEN CM and VICKERS ZM 1981 Relationships of chewing sounds to
judgments of crispness J Food Sci 46 574-578
CIVILLE GV and SZCZESNIAK AS 1973 Guidelines to training a texture profile
panel J Text Stud 4 204-223
CIVILLE GV and LISKA IH 1975 Modifications and applications to foods of the
general foods sensory texture profile technique J Text Stud 6 19-31
DACREMONT C COLAS B and SAUVAGEOT F 1991 Contribution of the air
and bone conduction to the creation of sounds perceived during sensory
evaluation of foods J Text Stud 22 443-456
DACREMONT C 1995 Spectral composition of eating sounds generated by crispy
crunchy and crackly foods J Text Stud 26 27-43
DE BELIE N HARKER FR and DE BAERDEMAEKER J 2002 Crispness
139
judgments of royal gala apples based on chewing sounds Biosystems Eng 81
297-303
DIJKSTERHUIS G HANNEMIEKE L DE WIJK R and MOJET J 2005 A new
sensory vocabulary for crisp and crunchy dry model foods Food Qual Pref 18
37-50
DRAKE BK 1963 Food crushing sounds- An introductory study J Food Sci 28
233
DUIZER LM CAMPANELLA OH and BARNES GRG 1998 Sensory
instrumental and acoustic characteristics of extruded snack food products J
Text Stud 29 397-411
DUIZER LM and WINGER RJ 2006 Instrumental measures of bite forces
associated with crisp products J Text Stud 37 1-15
EDMISTER JA and VICKERS ZA 1985 Instrumental acoustical measures of
crispness in foods J Text Stud 16 153-167
FILLION L and KILCAST D 2001 Consumer perception of crispness and
crunchiness in fruits and vegetables Food Qual Pref 13 23-29
GURAYA HS and TOLEDO RT 1996 Microstructural characteristics and
compression resistance as indices of sensory texture in a crunchy snack product
J Text Stud 27 687-701
HARKER FR REDGWELL RJ HALLET IC and MURRAY SH 1997 Texture
in fresh fruit Hort Rev 20 121-224
140
JEON IJ BREENE WM and MUNSON ST 1975 Texture of fresh pack whole
cucumber pickles correlations of instrumental and sensory measurements J
Text Stud 5 399-409
JOWITT R 1974 The terminology of food texture J Text Stud 5 351-358
KAPUR KK 1971 Frequency spectrographic analysis of bone conducting chewing
sounds in persons with natural and artificial dentitions J Text Stud 2 50-61
LEE III WE SCHWEITZER MA MORGAN GM and Shepherd DC 1990
Analysis of food crushing sounds during mastication total sound level studies J
Text Stud 21 165-178
LUYTEN H and VAN VLIET T 2006 Acoustic emission fracture behavior and
morphology of dry crispy foods a discussion article J Text Stud 37 221-
240
MEILGAARD M CIVILLE GV and CARR BT 1999 The Spectrumtm descriptive
analysis method Ch 11 In Sensory Evaluation Techniques 3rd Ed CRC Press
Boca Raton FL
MOHAMED AAA JOWITT R and BRENNAN JG 1982 Instrumental and
sensory evaluation of crispness 1 in friable foods J Food Eng 1 55-75
MOSKOWITZ HR SEGARS RA KAPSALIS JG and KLUTER RA 1974
Sensory ratio scales relating hardness and crunchiness to mechanical properties
of space cubes J Food Sci 39 200-202
MUNOZ AM 1986 Development and application of texture reference scales J Sens
Stud 1 55-83
ONWULATA C and HEYMANN H 1994 Sensory properties of extruded corn meal
141
related to the spatial distribution of process conditions J Sens Stud 9 101-112
ROUDAUT G DACREMONT C VALES PAMIES B COLAS B and MESTE M
2002 Crispness A critical review on sensory and material science approaches
Trends Food Sci Technol 13 217-227
SEYMOUR SK and HAMANN DD 1988 Crispness and crunchiness of selected
low moisture foods J TextStud 19 79-95
SZCZESNIAK AS 1988 The meaning of textural characteristics ndash crispness J
Text Stud 19 51-59
SZCZESNIAK AS and ILKER R 1988 The meaning of textural characteristics-
juiciness in plant food stuffs J Text Stud 19 61-78
SZCZESNIAK AS 2002 Texture is a sensory property Food Qual Prefer 13 215-
225
VICKERS Z M and BOURNE MC 1976 A psycho acoustical theory of crispness
J Food Sci 41 1158-1164
VICKERS ZM and WASSERMAN SS 1979 Sensory qualities of food sounds
based on individual perceptions J Text Stud 10 319-332
VICKERS Z M and CHRISTENSEN CM 1980 Relationships between sensory
crispness and other sensory instrumental parameters J Text Stud 11 291-307
VICKERS ZM 1981 Relationship of chewing sounds to judgments of crispness
crunchiness and hardness J Food Sci 47 121-124
VICKERS ZM 1984a Crackliness relationships of auditory judgments to tactile
judgments and instrumental acoustical measurements J Text Stud 15 49-
58
142
VICKERS ZM 1984b Crispness and crunchiness- a difference in pitch J Text
Stud 15 157-163
VICKERS ZM 1985 The relationship of pitch loudness and eating technique to
judgments of crispness and crunchiness of food sounds J Text Stud 16 85-
95
VICKERS ZM 1987a Instrumental measures of crispness and their correlation with
sensory assessment J Text Stud 19 1-14
VICKERS ZM 1987b Sensory acoustical and force deformation measurements of
potato chips crispness J Food Sci 52138-140
VINCENT JFV and SAUNDERS DEJ 2002 The use of critical stress intensity
factor to quantify hardness and crunchiness objectively J Text Stud 33 149-
159
143
Chapter Five
Conclusions and Future Work
1 Conclusions
bull Multidimensional scaling is a robust exploratory statistical and graphical
technique effectively producing a graphical representation of overall similarity in
food texture perceptions from selected sensory panelists MDS significance in
validating existing scales is to visually evaluate if scales created in the past retain
their properties and functions as when they were originally developed
bull Sensory results of apples and pears texture indicate strong correlations among the
sensory texture attributes of crispness hardness and fracturability for apples and
pears Disparity in juiciness perceptions in apples and pears were attributed to the
differences in cell structure
bull When correlating sensory evaluation to instrumental determinations both the
Sinclair iQtrade System and the Guss pressure sensor provided a reasonable
predictor of apple hardness The tensile properties of apples and pears may
potentially predict crispness but accurate predictions are highly dependent on the
orientation of the fruit when analyzed by an instrument or in the mouth A
combination approach assaying with an instrument to determine compressive and
tensile properties provides the most accurate prediction of apple and pear textural
properties compared to any existing method
bull The developed standard texture scales for crispness crunchiness and crackliness
for dry and wet foods provides individuals interested in auditory texture
evaluation a starting point to assist in training sensory panelists for descriptive
144
analysis of food texture Although future modifications in reference foodsrsquo
attribute definitions or evaluation procedures are expected this study represents a
first step in the generation of reproducible auditory sensory data using food
standard texture scales
bull The average power calculated from the RMS voltage signal is a reliable rapid
and straightforward tool to analyze auditory texture parameters in food
bull MDS output demonstrates that crispness crunchiness and crackliness are
distinguishable sensory texture parameters belonging to selected distinguishable
concepts and may be analyzed solely by auditory cues Also a perceptual
difference is observed between texture attributes for dry and wet foods
Differentiating between both is essential for more accurate descriptive analysis
training
145
2 Future Work
bull There is a need for improved training of sensory texture panelists
selection for panelists sensitive to texture notes and more attention
devoted to understanding texture nomenclature Developing official
international standards for sensory texture testing procedures will allow
for normalized results among panelists laboratories and countries
bull More studies are needed to obtain improved correlations between sensory
texture profile analysis and instrumental texture profile analysis
bull The knowledge base of the psychological factors influencing perception
and individualsrsquo choices should be integrated with physiological factors
This can be integrated with the use of multivariate statistical techniques
widely used in sensory science Interactions between texture and other
sensory modalities must be taken into account in understanding texture
influences
bull There is a fundamental lack of understanding of physiological factors
influencing texture perception mechanisms and mastication processes
Dental research must be integrated into sensory research studies for
example dental researchers are focused on mastication while sensory
scientists are focused on first bite The integration of both sciences can
complement each other and offer great opportunity of fully understanding
the perception of textural properties in foods
146
bull A new generation of texture assessment instrumentation is needed that can
operate at greater compression speeds especially for foods that are strain
rate sensitive
bull Understanding the influence of saliva on the texture of food may be
valuable because knowledge may provide a better understanding of the
full sequence of the mastication process More studies are needed on the
chemical composition and rheological properties of saliva and how
selected foods affect the amount or type of saliva induced in the mouth
Also more studies regarding the interactions of saliva with foods and the
effects on the structure of foods are needed to fully understand food
texture
147
- m_chauvin_10029078_ Part I
- m_chauvin_10029078_Part II
-

ACKNOWLEDGMENTS
I would like to take the opportunity to acknowledge and thank all those who have
helped me in any way through this research I wish to thank my advisor Dr Barry G
Swanson and the other members of my committee Drs Carolyn Ross Stephanie Clark
and Craig Parks for their time support expertise encouragement advice and confidence
while I worked towards my doctorate degree
In addition I would like to express my sincere appreciation to the following
bull My husband and parents for their support encouragement and love
bull Frank Younce for your friendship help and suggestions in my research Thank
you for always being there when I needed you
bull Tina Plotka Mike Costello and Karen Weller for their continuous support in the
lab
bull The office personnel for answering all my questions (Jodi Richard Carolee and
Marsha)
bull All graduate students for their love and encouragement throughout the PhD
program
It has been great working with all of you
iii
FOOD TEXTURE AND PERCEPTION
Abstract
by Maite Andrea Chauvin PhD
Washington State University
December 2007
Chair Barry G Swanson
Co-Chair Carolyn Ross
The most complete system of sensory texture determination is the General Foods
Sensory Texture Profiling Technique (Brandt et al 1963 Szczesniak et al 1963) The
first objective of the current research was to validate through a multidimensional (MDS)
representation the standard texture scales presented for select foods in the General Foods
Sensory Texture Profiling Technique MDS is highly instructive in quantitatively
assessing the perceptions of naive panelistsrsquo qualitative textural differences of food as
well as a good statistical instrument to graphically validate existing food texture scales
The selected textures of standard foods were rated similarly using MDS and food
standard texture scales
The second objective was to study the sensory textural attributes of apples and
pears and the relationships between human sensory perception instrumental firmness
and tensile material properties of apples and pears Significant correlations were
observed among the sensory texture attributes of crispness firmness and fracturability for
iv
apples and pears (r gt 088) Differences in juiciness perception of apples and pears were
attributed to differences in cell structure When correlating sensory to instrumental
determinations the Sinclair iQtrade System texture assessment tool provided acceptable
correlations of apple firmness (r = 079 to 082) Guss pressure sensor provided
significant correlations of apple (r = 078 to 083) and pear (r = 083) firmness Tensile
determinations predicted crispness in apples (r = 088) and pears (r = 085) well
The third objective was to establish a standard texture scale for dry and wet crisp
crunchy and crackly foods The relationship between acoustical and oral sensation of
crispness crunchiness and crackliness of selected standard foods was also evaluated A
consumer study of the newly developed texture scales was validated through MDS The
developed standard scales for crispness crunchiness and crackliness for dry and wet
foods provide individuals interested in auditory texture evaluation a starting point to
assist in training panelists in descriptive analysis of food texture MDS output
demonstrated that crispness crunchiness and crackliness are distinguishable sensory
texture attributes that belong to selected discernible concepts and may be accurately
recognized by the sole presence of auditory cues
v
TABLE OF CONTENTS
ACKNOWLEDGEMENTShelliphelliphelliphelliphelliphelliphelliphelliphelliphelliphelliphelliphelliphelliphelliphelliphelliphelliphelliphelliphelliphelliphelliphellipiii
ABSTRACThelliphelliphelliphelliphelliphelliphelliphelliphelliphelliphelliphelliphelliphelliphelliphelliphelliphelliphelliphelliphelliphelliphelliphelliphelliphelliphelliphelliphellipiv
LIST OF TABLEShelliphelliphelliphelliphelliphelliphelliphelliphelliphelliphelliphelliphelliphelliphelliphelliphelliphelliphelliphelliphelliphelliphelliphelliphelliphellipix
LIST OF FIGUREShelliphelliphelliphelliphelliphelliphelliphelliphelliphelliphelliphelliphelliphelliphelliphelliphelliphelliphelliphelliphelliphelliphelliphelliphelliphellipxii
DEDICATIONhelliphelliphelliphelliphelliphelliphelliphelliphelliphelliphelliphelliphelliphelliphelliphelliphelliphelliphelliphelliphelliphelliphelliphelliphelliphelliphellipxiv
1 INTRODUCTION
LITERATURE REVIEW
1 Texturehelliphelliphelliphelliphelliphelliphelliphelliphelliphelliphelliphelliphelliphelliphelliphelliphelliphelliphelliphelliphelliphelliphelliphellip1
2 Texture Profile Analysis and Standard Scales of Texturehelliphelliphelliphellip2
3 Multidimensional Scalinghelliphelliphelliphelliphelliphelliphelliphelliphelliphelliphelliphelliphelliphelliphelliphelliphellip6
4 Texture of Fresh Fruithelliphelliphelliphelliphelliphelliphelliphelliphelliphelliphelliphelliphelliphelliphelliphelliphelliphellip9
41 Fruit Texturehelliphelliphelliphelliphelliphelliphelliphelliphelliphelliphelliphelliphelliphelliphelliphelliphelliphelliphelliphelliphellip9
42 Fruit Anatomyhelliphelliphelliphelliphelliphelliphelliphelliphelliphelliphelliphelliphelliphelliphelliphelliphelliphelliphelliphellip9
43 Food-Mouth Interactionshelliphelliphelliphelliphelliphelliphelliphelliphelliphelliphelliphelliphelliphelliphellip12
44 Consumer Awareness and Reasons to Determine Texture in Fruit
helliphelliphelliphelliphelliphelliphelliphelliphelliphelliphelliphelliphelliphelliphelliphelliphelliphelliphelliphelliphelliphelliphelliphelliphelliphellip12
45 Methods of Determining Texture in Fruithelliphelliphelliphelliphelliphelliphelliphelliphellip13
46 Relationship of Instrumental and Sensory Determinations of
Texturehelliphelliphelliphelliphelliphelliphelliphelliphelliphelliphelliphelliphelliphelliphelliphelliphelliphelliphelliphelliphelliphellip16
5 Sensory Perception of Crisp Crunchy and Crackly Textureshelliphelliphellip17
51 Structural Properties of Food with an Auditory Componenthelliphellip17
52 Perception of Soundhelliphelliphelliphelliphelliphelliphelliphelliphelliphelliphelliphelliphelliphelliphelliphelliphellip18
vi
53 Sensory Studieshelliphelliphelliphelliphelliphelliphelliphelliphelliphelliphelliphelliphelliphelliphelliphelliphelliphelliphellip19
54 Acoustic Studieshelliphelliphelliphelliphelliphelliphelliphelliphelliphelliphelliphelliphelliphelliphelliphelliphelliphelliphellip24
6 Referenceshelliphelliphelliphelliphelliphelliphelliphelliphelliphelliphelliphelliphelliphelliphelliphelliphelliphelliphelliphelliphelliphelliphellip28
2 MULTIDIMENSIONAL REPRESENTATION OF THE STANDARD
SCALES OF FOOD TEXTURE
1 Abstracthelliphelliphelliphelliphelliphelliphelliphelliphelliphelliphelliphelliphelliphelliphelliphelliphelliphelliphelliphelliphelliphelliphelliphellip38
2 Introductionhelliphelliphelliphelliphelliphelliphelliphelliphelliphelliphelliphelliphelliphelliphelliphelliphelliphelliphelliphelliphelliphelliphellip40
3 Materials and Methodshelliphelliphelliphelliphelliphelliphelliphelliphelliphelliphelliphelliphelliphelliphelliphelliphelliphellip43
4 Results and Discussionshelliphelliphelliphelliphelliphelliphelliphelliphelliphelliphelliphelliphelliphelliphelliphelliphellip46
5 Conclusionshelliphelliphelliphelliphelliphelliphelliphelliphelliphelliphelliphelliphelliphelliphelliphelliphelliphelliphelliphelliphelliphelliphellip50
6 Tables and Figureshelliphelliphelliphelliphelliphelliphelliphelliphelliphelliphelliphelliphelliphelliphelliphelliphelliphelliphelliphellip51
7 Referenceshelliphelliphelliphelliphelliphelliphelliphelliphelliphelliphelliphelliphelliphelliphelliphelliphelliphelliphelliphelliphelliphelliphellip60
3 RELATIONSHIP BETWEEN INSTRUMENTAL AND SENSORY
DETERMINATION OF APPLE AND PEAR TEXTURE
1 Abstracthelliphelliphelliphelliphelliphelliphelliphelliphelliphelliphelliphelliphelliphelliphelliphelliphelliphelliphelliphelliphelliphelliphelliphellip64
2 Introductionhelliphelliphelliphelliphelliphelliphelliphelliphelliphelliphelliphelliphelliphelliphelliphelliphelliphelliphelliphelliphelliphelliphellip65
3 Materials and Methodshelliphelliphelliphelliphelliphelliphelliphelliphelliphelliphelliphelliphelliphelliphelliphelliphelliphellip68
4 Results and Discussionshelliphelliphelliphelliphelliphelliphelliphelliphelliphelliphelliphelliphelliphelliphelliphelliphellip73
5 Conclusionshelliphelliphelliphelliphelliphelliphelliphelliphelliphelliphelliphelliphelliphelliphelliphelliphelliphelliphelliphelliphelliphelliphellip80
6 Tables and Figureshelliphelliphelliphelliphelliphelliphelliphelliphelliphelliphelliphelliphelliphelliphelliphelliphelliphelliphelliphellip81
7 Referenceshelliphelliphelliphelliphelliphelliphelliphelliphelliphelliphelliphelliphelliphelliphelliphelliphelliphelliphelliphelliphelliphelliphellip97
vii
4 STANDARD SCALES FOR CRISPNESS CRACKLINESS AND
CRUNCHINESS IN DRY AND WET FOODS RELATIONSHIP WITH
ACOUSTICAL DETERMINATIONS
1 Abstracthelliphelliphelliphelliphelliphelliphelliphelliphelliphelliphelliphelliphelliphelliphelliphelliphelliphelliphelliphelliphelliphelliphellip101
2 Introductionhelliphelliphelliphelliphelliphelliphelliphelliphelliphelliphelliphelliphelliphelliphelliphelliphelliphelliphelliphelliphelliphellip103
3 Materials and Methodshelliphelliphelliphelliphelliphelliphelliphelliphelliphelliphelliphelliphelliphelliphelliphelliphelliphellip106
4 Results and Discussionshelliphelliphelliphelliphelliphelliphelliphelliphelliphelliphelliphelliphelliphelliphelliphelliphellip112
5 Conclusionshelliphelliphelliphelliphelliphelliphelliphelliphelliphelliphelliphelliphelliphelliphelliphelliphelliphelliphelliphelliphelliphellip118
6 Tables and Figureshelliphelliphelliphelliphelliphelliphelliphelliphelliphelliphelliphelliphelliphelliphelliphelliphelliphelliphellip119
7 Referenceshelliphelliphelliphelliphelliphelliphelliphelliphelliphelliphelliphelliphelliphelliphelliphelliphelliphelliphelliphelliphelliphelliphellip139
5 CONCLUSIONS AND FUTURE WORK
1 Conclusionshelliphelliphelliphelliphelliphelliphelliphelliphelliphelliphelliphelliphelliphelliphelliphelliphelliphelliphelliphelliphelliphellip144
2 Future Workhelliphelliphelliphelliphelliphelliphelliphelliphelliphelliphelliphelliphelliphelliphelliphelliphelliphelliphelliphelliphelliphellip146
viii
LIST OF TABLES
Chapter 1
1 Definitions of crispnesshelliphelliphelliphelliphelliphelliphelliphelliphelliphelliphelliphelliphelliphelliphelliphelliphelliphelliphelliphellip20
2 Definitions of crunchinesshelliphelliphelliphelliphelliphelliphelliphelliphelliphelliphelliphelliphelliphelliphelliphelliphelliphelliphellip22
3 Definitions of cracklinesshelliphelliphelliphelliphelliphelliphelliphelliphelliphelliphelliphelliphelliphelliphelliphelliphelliphelliphellip23
Chapter 2
1 Standard scales of texturehelliphelliphelliphelliphelliphelliphelliphelliphelliphelliphelliphelliphelliphelliphelliphelliphelliphelliphellip51
2 Definitions of the textural attributes of hardness chewiness viscosity
gumminess adhesiveness and fracturabilityhelliphelliphelliphelliphelliphelliphelliphelliphelliphelliphelliphellip52
3 MDS stress and R2 for paired comparisons of texture scaleshelliphelliphelliphelliphelliphellip53
4 Standard hardness scalehelliphelliphelliphelliphelliphelliphelliphelliphelliphelliphelliphelliphelliphelliphelliphelliphelliphelliphelliphellip54
5 Standard viscosity scalehelliphelliphelliphelliphelliphelliphelliphelliphelliphelliphelliphelliphelliphelliphelliphelliphelliphelliphelliphellip55
6 Standard adhesiveness scalehelliphelliphelliphelliphelliphelliphelliphelliphelliphelliphelliphelliphelliphelliphelliphelliphelliphellip56
7 Standard fracturability scalehelliphelliphelliphelliphelliphelliphelliphelliphelliphelliphelliphelliphelliphelliphelliphelliphelliphellip57
8 Standard gumminess scalehelliphelliphelliphelliphelliphelliphelliphelliphelliphelliphelliphelliphelliphelliphelliphelliphelliphelliphellip58
9 Standard chewiness scalehelliphelliphelliphelliphelliphelliphelliphelliphelliphelliphelliphelliphelliphelliphelliphelliphelliphelliphelliphellip59
Chapter 3
1 Apple and pear texture attributes and descriptors as evaluated by the texture
panelhelliphelliphelliphelliphelliphelliphelliphelliphelliphelliphelliphelliphelliphelliphelliphelliphelliphelliphelliphelliphelliphelliphelliphelliphelliphelliphellip82
2 Texture standards used for the evaluation of texture sensory attributeshelliphellip83
3 Sensory texture profiling technique for apples and pearshelliphelliphelliphelliphelliphelliphellip84
ix
4 Two way ANOVA for sensory analysis of apple texture by the trained panel in 2005
and 2006helliphelliphelliphelliphelliphelliphelliphelliphelliphelliphelliphelliphelliphelliphelliphelliphelliphelliphelliphelliphellip85
5 Two way ANOVA for sensory analysis of pear texture by the trained panel in 2006
helliphelliphelliphelliphelliphelliphelliphelliphelliphelliphelliphelliphelliphelliphelliphelliphelliphelliphelliphelliphelliphelliphelliphelliphelliphelliphelliphelliphelliphelliphelliphelliphellip86
6 One way ANOVA for instrumental analysis of apples in 2005 and 2006helliphelliphellip87
7 One way ANOVA for instrumental analysis of pears in 2006helliphelliphelliphelliphelliphellip88
8 Correlation matrix of sensory texture attributes of apples for 2005 and
200689
9 Correlation matrix of sensory texture attributes of pears for 2006helliphelliphelliphellip90
10 Correlation matrix on sensory attributes and instrumental determinations of
apples for 2005 and 2006helliphelliphelliphelliphelliphelliphelliphelliphelliphelliphelliphelliphelliphelliphelliphelliphelliphelliphelliphellip91
11 Correlation matrix of sensory attributes and instrumental determinations of
pears for 2006helliphelliphelliphelliphelliphelliphelliphelliphelliphelliphelliphelliphelliphelliphelliphelliphelliphelliphelliphelliphelliphelliphelliphellip92
Chapter 4
1 Literature citations of crispnesshelliphelliphelliphelliphelliphelliphelliphelliphelliphelliphelliphelliphelliphelliphelliphelliphellip119
2 Literature citation of crunchinesshelliphelliphelliphelliphelliphelliphelliphelliphelliphelliphelliphelliphelliphelliphelliphellip121
3 Literature citations of cracklinesshelliphelliphelliphelliphelliphelliphelliphelliphelliphelliphelliphelliphelliphelliphelliphellip123
4 Technique for the evaluation of crispness crunchiness and crispness
developed by seven trained panelistshelliphelliphelliphelliphelliphelliphelliphelliphelliphelliphelliphelliphelliphelliphellip124
5 Crispness standard scale for dry foods developed by seven trained panelists
helliphelliphelliphelliphelliphelliphelliphelliphelliphelliphelliphelliphelliphelliphelliphelliphelliphelliphelliphelliphelliphelliphelliphelliphelliphelliphelliphelliphelliphellip125
6 Crispness standard scale for wet foods developed by seven trained panelists
helliphelliphelliphelliphelliphelliphelliphelliphelliphelliphelliphelliphelliphelliphelliphelliphelliphelliphelliphelliphelliphelliphelliphelliphelliphelliphelliphelliphelliphellip126
x
7 Crunchiness standard scale for dry foods developed by seven trained
panelistshelliphelliphelliphelliphelliphelliphelliphelliphelliphelliphelliphelliphelliphelliphelliphelliphelliphelliphelliphelliphelliphelliphelliphelliphelliphellip127
8 Crunchiness standard scale for wet foods developed by seven trained
panelistshelliphelliphelliphelliphelliphelliphelliphelliphelliphelliphelliphelliphelliphelliphelliphelliphelliphelliphelliphelliphelliphelliphelliphelliphelliphellip128
9 Crackliness standard scale for dry foods developed by seven trained panelists
helliphelliphelliphelliphelliphelliphelliphelliphelliphelliphelliphelliphelliphelliphelliphelliphelliphelliphelliphelliphelliphelliphelliphelliphelliphelliphelliphelliphelliphellip129
10 Crackliness standard scale for wet foods developed by seven trained
panelistshelliphelliphelliphelliphelliphelliphelliphelliphelliphelliphelliphelliphelliphelliphelliphelliphelliphelliphelliphelliphelliphelliphelliphelliphelliphellip130
11 Correlation between auditory recordings (average RMS) and sensory
evaluation by untrained panelhelliphelliphelliphelliphelliphelliphelliphelliphelliphelliphelliphelliphelliphelliphelliphelliphellip131
xi
LIST OF FIGURES
Chapter 1
1 Procedures for evaluating texturehelliphelliphelliphelliphelliphelliphelliphelliphelliphelliphelliphelliphelliphelliphelliphellip5
Chapter 2
1 MDS representation of hardness textural perceptions of food as evaluated by
eleven panelistshelliphelliphelliphelliphelliphelliphelliphelliphelliphelliphelliphelliphelliphelliphelliphelliphelliphelliphelliphelliphelliphelliphellip54
2 MDS representation of viscosity textural perceptions of food as evaluated by
eleven panelistshelliphelliphelliphelliphelliphelliphelliphelliphelliphelliphelliphelliphelliphelliphelliphelliphelliphelliphelliphelliphelliphelliphellip55
3 MDS representation of adhesiveness textural perceptions of food as evaluated
by eleven panelistshelliphelliphelliphelliphelliphelliphelliphelliphelliphelliphelliphelliphelliphelliphelliphelliphelliphelliphelliphelliphelliphellip56
4 MDS representation of fracturability textural perceptions of food as evaluated
by eleven panelistshelliphelliphelliphelliphelliphelliphelliphelliphelliphelliphelliphelliphelliphelliphelliphelliphelliphelliphelliphelliphelliphellip57
5 MDS representation of gumminess textural perceptions of food as evaluated
by eleven panelistshelliphelliphelliphelliphelliphelliphelliphelliphelliphelliphelliphelliphelliphelliphelliphelliphelliphelliphelliphelliphelliphellip58
6 MDS representation of chewiness textural perceptions of food as evaluated
by eleven panelistshelliphelliphelliphelliphelliphelliphelliphelliphelliphelliphelliphelliphelliphelliphelliphelliphelliphelliphelliphelliphelliphellip59
Chapter 3
1 Apple firmness effect on sensory texture attributes for 2005 and 2006 harvest
yearshelliphelliphelliphelliphelliphelliphelliphelliphelliphelliphelliphelliphelliphelliphelliphelliphelliphelliphelliphelliphelliphelliphelliphelliphelliphelliphelliphellip93
2 Apple differentiation soft intermediate and hard apple firmness for 2005 and
xii
2006 combined harvest yearshelliphelliphelliphelliphelliphelliphelliphelliphelliphelliphelliphelliphelliphelliphelliphelliphelliphellip94
3 Pear firmness effect on sensory texture attributes for 2006 harvest yearhellip95
4 Pear differentiation of soft intermediate and hard pear firmness for 2006
harvest yearhelliphelliphelliphelliphelliphelliphelliphelliphelliphelliphelliphelliphelliphelliphelliphelliphelliphelliphelliphelliphelliphelliphelliphellip96
Chapter 4
1 MDS representation of auditory crispness for dry foodshelliphelliphelliphelliphelliphelliphellip132
2 MDS representation of auditory crispness for wet foodshelliphelliphelliphelliphelliphelliphellip133
3 MDS representation for auditory crunchiness for dry foodshelliphelliphelliphelliphelliphellip134
4 MDS representation of auditory crunchiness for wet foodshelliphelliphelliphelliphelliphellip135
5 MDS representation of auditory crackliness for dry foodshelliphelliphelliphelliphelliphellip136
6 MDS representation of auditory crackliness for wet foodshelliphelliphelliphelliphelliphellip137
7 MDS representation for overall auditory crispness crunchiness and
crackliness for dry and wet foodshelliphelliphelliphelliphelliphelliphelliphelliphelliphelliphelliphelliphelliphelliphelliphellip138
xiii
DEDICATION
This work is dedicated to my husband Fariss for his patience love and care I
also dedicate my work to my parents for their encouragement and endless support
My mother drew a distinction between achievement and success She said that
achievement is the knowledge that you have studied and worked hard and done the best
that is in you Success is being praised by others and thats nice too but not as
important or satisfying Always aim for achievement and forget about success
By Helen Hayes (1900 - 1993)
xiv
Chapter One
INTRODUCTION
LITERATURE REVIEW
The following literature review is organized in association with each chapter
1 Texture
Texture in food is difficult to define for many scientists since texture means
different things to different people Muller (1969) claimed that the term texture may be
discarded because is confusing Muller (1969) suggested that texture terminology usage
may be divided into two terms in place of the word texture ldquorheologyrdquo defining the
physical properties of food and ldquohaptaesthesisrdquo defining the perceptions of the
mechanical behavior of materials
Szczesniak (1990) wrote ldquotexture can be defined as a sensory manifestation of the
structure of the food and the manner in which this structure reacts to applied forces the
specific senses involved being vision kinesthetics and hearingrdquo The International
Organization for Standardization (Standard 5492 1992) wrote ldquoTexture is a noun that
comprises all the mechanical (geometrical and surface) attributes of a food product
perceptible by means of mechanical tactile and where appropriate visual and auditory
receptorsrdquo The British Standards Organization (No 5098) defines texture as ldquothe
attribute resulting from a combination of physical properties perceived by the senses of
kinesthesis touch (including mouth feel sight and hearing) The properties may include
size shape number nature and conformation of constituent structural elementsrdquo Other
authors such as Bourne (2002) stated ldquothe textural properties of a food are that group of
1
physical characteristics that arise from the structural elements of the food are sensed
primarily by the feeling of touch are related to the deformation disintegration and flow
of the food under a force and are measured objectively by functions of mass time and
distancerdquo
2 Texture Profile Analysis and Standard Scales of Texture
The texture profile panel is a powerful instrument that can reliably determine the
textural attributes of food products The texture profile panel allows investigators to
relate the way the food behaves in the mouth rather than only obtaining selected chemical
and physical properties of food The use of standard terminology standard reference
foods and standard evaluation procedures in texture profile methods makes texture
profile panels great objective assessing tools of sensory data (Civille and Szczesniak
1973) The texture profile method is widely used for many applications in the food
industry including food product development and quality assurance (Civille and
Szczesniak 1973)
The sensory texture profile method was developed from the A D Little Flavor
Profile Method as a protocol based on the order of appearance of texture attributes
(Brandt et al 1963) The order of appearance relates to the chronological order in
which the various attributes of foods are perceived (General Foods Corp 1967) A
texture profile is defined as ldquothe sensory analysis of the texture complex of a food in
terms of its mechanical geometrical fat and moisture characteristics the degree of each
present and the order in which they appear from first bite to complete masticationrdquo
(Brandt et al 1963)
2
The texture profile analysis requires a panel of judges with prior knowledge of the
texture classification system use of standard rating scales and appropriate panel
procedures with regards to the mechanics of testing and food presentation (Brandt et al
1963)
Szczesniak (1963) classified texture attributes in three categories First are the
mechanical characteristics related to the reaction of food to stress Second are the
geometrical characteristics related to the shape size and arrangement of particles within
a food Finally are other characteristics related to the moisture and fat content
The standard rating scales provide a method of correlating sensory and
instrumental (texturometer) evaluations of texture (General Foods Corp 1967) A
trained sensory panel includes practice in the use of scales to reinforce the perception of
the mechanical and geometrical characteristics of food Standard scales are developed to
identify each of the mechanical characteristics of texture hardness fracturability
chewiness gumminess viscosity and adhesiveness and provide a defined quantitative
method of texture evaluation (Szczesniak 1963) The standard scales represent the full
range of a specific mechanical parameter as it is encountered in foods (Civille and
Szczesniak 1973) Geometrical characteristics are difficult to classify in a specific
scale There are however two general groups of geometrical characteristics geometrical
characteristics related to the size and shape of the particles such as gritty grainy or
coarse and geometrical characteristics related to the particle shape and orientation such
as fibrous cellular or crystalline Evaluation of the geometrical characteristics of foods
is qualitative and semi-quantitative Geometrical characteristics are evaluated as to type
and amount present Standard scales help panelists build confidence and provide
3
practice in perception and discrimination during the training process (General Foods
Corp 1967)
In texture profiling it is necessary to standardize the technique of determination
handling and presentation of the foods Each panelist must evaluate the foods in
identical manner and the replicate foods presented to panelists must be reproducible
(Civille and Szczesniak 1973) The first bite or initial phase encompasses the
mechanical characteristics of hardness fracturability viscosity and any geometrical
characteristics observed initially The second or masticatory phase encompasses the
mechanical characteristics of gumminess chewiness adhesiveness and any geometrical
characteristics observed during chewing The third or residual phase encompasses
changes induced in the mechanical and geometrical characteristics through mastication
(General Foods Corp 1967) Procedures for evaluating texture are presented in Figure
1
4
Masticatory (Perceived During Chewing)
Mechanical (gumminess chewiness and
adhesiveness)
Geometrical (any depending upon food
structure)
Initial (Perceived on First Bite)
Mechanical (viscosity hardness and
brittleness)
Geometrical (any depending upon food
structure)
Residual (Changes During Mastication)
Rate and type of breakdown moisture absorption and mouthcoating
Figure 1 Procedures for evaluating Texture (Brandt et al 1963)
5
The consistency of the panel performance will depend on three factors the
reliability of the trained panel as a whole to reproduce the whole panel findings from one
evaluation to another the ability of an individual panelist to replicate the panelistsrsquo
findings from one evaluation to another and the ability of the panelists to agree with one
another The panel performance can be determined through the use of blind controls and
duplicate samples regular review of panel results and the presence of a good panel
leader (Civille and Szczesniak 1973)
The texture profile method is used to characterize sensory textural attributes of
fruits Paoletti et al (1993) used a modified version of the texture profile method on
selected apple cultivars to characterize textural attributes such as firmness fracturability
cohesiveness juiciness and mealiness and relate them to the mechanical properties of
fruit Abbott et al (1994) investigated apple texture using sensory data evaluated as
crisp hard tough mealy spongy and juicy and developed a relationship with a modified
version of the Instron texture profile analysis Diehl and Hamann (1979) used texture
profile analyses to characterize the sensory properties of raw potatoes melons and apples
and related them with uniaxial compression and torsion methods
3 Multidimensional Scaling
Multidimensional scaling (MDS) is a set of techniques designed for the statistical
analysis of the degree of similarity or dissimilarity of experimental data on a set of
objects (Borg and Groenen 1997) MDS mathematical techniques enable a scientist to
discover the ldquohidden structurerdquo of data MDS calculations use proximities among
objects of any kind as input
6
A proximity is a number that predicts perception of similarity or difference
between two objects (Kruskal and Wish 1978) MDS techniques represent objects
judged as similar to one another as points close to each other in a resultant spatial map
Objects judged as dissimilar are represented as points distant from one another in a
spatial map (Schiffman et al 1981) The MDS graphical representation or spatial map
allows the data analyst to interpret the data and explore panelistsrsquo perceptions visually
(Borg and Groenen 1997)
A common procedure for obtaining proximities data is to ask individuals to
directly judge the ldquopsychological distancerdquo among stimulus objects To discover rather
than impose the dimensions the attributes on which the stimuli are judged are usually not
specified (Kruskal and Wish 1978)
An advantage of MDS procedures is the small experimenter contamination
Panelists do not require prior knowledge of the attribute of the stimuli evaluated MDS
data provide a special context that reveals dimensions relevant to the subjects (Schiffman
et al 1981) Another advantage of MDS is its wide functionality MDS represents
similarity or dissimilarity data as distances in low-dimensional space to make data
accessible to visual inspection and exploration MDS is used as a technique allowing the
experimenter to test if and how certain criteria by which the experimenter can distinguish
among different objects of interest are mirrored in corresponding empirical similarities or
differences of these objects MDS is also a data-analytic approach that allows
discovering dimensions that underlie judgments of similarity or dissimilarity
The primary disadvantage of MDS is that such analytical techniques are often
time consuming and expensive (Schiffman et al 1981) A number of researchers have
7
explored alternative data collection procedures for MDS modeling some of which are
less time consuming and fatiguing than pairwise similarity ratings Alternative data
collection procedures include sorting data and confusion measures (Lawless et al 1995)
MDS calculations are complex and are difficult to perform without the aid of a
computer A variety of computational programs are used (Kruskal and Wish 1978)
Each program is capable of performing a wide variety of analyses all of which are
generically known as Multidimensional Scaling Some example programs used for MDS
applications are Minissa Polycon Kyst Indscal Sindscal Alscal Multiscale etc
(Schiffman et al 1981)
MDS is a robust technique that is used by researchers to assess visual auditory
taste and olfactory stimuli (Drewnowski 1984) In food sensory science one approach
to modeling the qualitative variation among sets of foods is to determine food similarity
and submit the data to MDS analysis Lawless et al (1995) created perceptual maps of
cheeses with the aid of MDS MDS procedures were used to asses flavor perception and
taste preferences of eight non-diet sodas judged by obese and normal weight sensory
panelists (Drewnowski 1984) Odor perception of six groups of panelists with varied
experience and training in odor evaluation were examined using MDS (Lawless and
Glatter 1990) Auditory perception of crispness crunchiness and crackliness was
examined in selected foods with the aid of MDS (Vickers and Wasserman 1979) Zraick
et al (2000) demonstrated through MDS studies of voice perception that perception of
normal voice quality is multidimensional
MDS is a statistical procedure that provides a perceptual map of differences and
similarities of stimuli based on the perceptions and interpretations of sensory panelists
8
MDS is a powerful methodology that is valuable in assisting scientists to gain important
unique understanding of human behavior
4 Texture of Fresh Fruit
41 Fruit Texture
Szczesniak (1963) divides textural parameters into three categories mechanical
geometrical and other characteristics (moisture and fat) Studies of fruit texture focus
primarily on the mechanical properties of the fruit tissue The few studies on the
geometric properties of fruit tissues such as grittiness in pear were conducted by fruit
breeders (Bell and Janick 1990) or as part of sensory studies (Diehl and Hamann 1979
Stec et al 1989) An increasing emphasis on the assessment of juiciness in fruits was
also reported recently (Szczesniak and Ilker 1988 Harker et al 2006)
The complex nature of fruit is related to the variety of attributes required to fully
describe textural properties of fruits and the textural changes that occur as fruit ripens
The lexicon for sensory texture attributes for fruits include crispness crunchiness ease
of breakdown fibrousness flouriness graininess grittiness hardness juiciness
mealiness pastiness pulpiness and starchiness (Harker et al 1997) The physiological
genetic biochemical nature of living tissues is important to an understanding of the
complexity of the ripening process in fruit (Dilley et al 1993)
42 Fruit Anatomy
The flesh in fruits is primarily composed of parenchyma cells that exhibit thin
non-lignified cell walls and large vacuoles that contain 90 of the water in the cell (Pitt
1982) The walls of the adjacent cells are separated by the middle lamella rich in pectin
9
(Huber 1993) The texture of the fruit depends of the cell size cell shape and packing
cell wall thickness cell wall strength cell turgor pressure and cell-cell adhesion (Harker
et al 1997)
The skin in fruits varies in size and complexity depending on the mechanical
properties of each fruit In fruits such as apples and pears the skin is consumed and
imparts different textural characteristics than other fruits with inedible skins Edible
skins are considered simple and are composed of tightly fitting epidermal cells coated
with wax layers Beneath epidermal layers of cells are layers of hypodermis cells which
are smaller than the epidermal cells In other fruits such as melons or oranges the skin is
inedible due to the thickness and presence of collenchyma sclerenchyma and lignin
impregnated cells (Harker et al 1997)
Seeds in apples and pears are located in the interior of the flesh called the core
The core is associated with the central tissue and contains seeds seed cavities and
sclerified lining and vascular strands Seeds associated with the core tissue are inedible
and are avoided during eating (Harker et al 1997)
Cell size and packing patters determine the volume of intercellular space which
influence cell adhesion by determining the extent of cell to cell contact Very limited cell
to cell contact occurs in ripen apples (Reeve 1953) An increased cell wall thickness and
decrease in cell size increase the strength of the fruit tissue Cell size and cell wall
thickness influence juiciness through their effect on packing of liquids There is a good
correlation between large cells and increased juiciness in fruits (Szczesniak and Ilker
1988)
10
The strength and texture of fruit tissues are related to the mechanical properties of
cell walls the turgor of cells and the strength of bonds between adjacent cells The
mechanical properties of cell walls of fresh fruit are determined by a mixture of pectic
hemocellulosic and fibrous cellulose polysaccharides Also cell wall properties differ
depending on the calcium content enzymatic hydrolysis and turgor of the cells Cell wall
properties confer plasticity enabling a cell to expand as the cell enlarges during
maturation and rigidity confers strength and cell shape to the fruit Cell wall breakdown
results in a marked effect on texture changes such as fruit softening (Harker et al 1997)
The excess of turgor or internal pressure of cells imparts a hydrostatic component
to cell tissue strength and increases the brittleness of the cell wall Turgor pressure is
influenced by the membrane permeability the osmotic gradient across the primary cell
wall and the cell wall expansion and contraction (Harker et al 1997) Cell turgor is an
integral part of fruit softening As turgor decreases during the maturations process the
fruit softens The turgor of cells in freshly harvested apples may contribute to the
softening of fruit associated with the increasing separation of individual cells during
storage (Harker and Hallett 1992)
The way cells separate or break open and release cell contents is one of the most
critical mechanical factors influencing fruit texture Cell disruption and release is
determined by the strength of the cell wall relative to the strength of the bonds between
adjacent cells Both are expected to decline as fruit ripens and softens The strength of
the bonds between cells is influenced by the strength of the middle lamella the area of
cell to cell contact and the extent of plasmodesmatal connections (Harker et al 1997)
11
43 Food-Mouth Interactions
An understanding of the physiology of the mouth and the occurrence of food
breakdown during chewing is important to the perception food texture The shape size
texture orientation and mechanical properties of food are perceived by the lips tongue
teeth and jaw When food is placed in the mouth the teeth reduce the food to a size and
shape that allows flow to the gut which allows for bacterial hydrolysis (Harker et al
1997) Additionally saliva that is released and mixed with the food initiates digestion
and alters overall texture of the food to facilitate swallowing (Jenkins 1978)
The mouth is very sensitive to textural properties of food during biting and
chewing The speeds of the mouth determined during chewing are faster than speeds
used during instrumental testing Texture determinations alone performed by instruments
may not simulate biting or chewing events occurring in the mouth well (Harker et al
1997) During biting and chewing the mandible moves in three directions opening and
lateral movement protrusion and retrusion The tongue is assisted by the muscles of the
inner surface of the check and the lips manipulate the food and aid sensory perception of
food As food is chewed saliva is induced to form a bolus for swallowing (Beyron
1964) Food is chewed and crushed by the molars The forces necessary to chew
decrease as moisture increases
44 Consumer Awareness and Reasons to Determine Texture in Fruit
Consumer awareness and attitudes towards texture are affected by various factors
Szczesniak and Kahn (1971) reported that socioeconomic status culture gender flavor
intensity and eating occasion influence consumersrsquo perceptions of texture Blindfolded
panelists given pureed foods exhibited difficulty identifying pureed apples strawberries
12
and bananas Difficulty in identifying pureed foods demonstrates that texture structures
are essential for accurate food identification (Bourne 2002) However for most foods
texture is considered a minor component of sensory quality unless the texture does not
meet expectations Unexpected textures usually signal poor food quality (Szczesniak and
Kahn 1971)
Texture is very important to quality perception of food The implication that fresh
fruit is a flavor-predominant characteristic is no longer accepted A consumer study
conducted in the United Kingdom with 12 apple cultivars demonstrated that panelists
preferred either a sweet hard apple or an acidic juicy apple (Daillant-Spinnler et al
1996) In a study profiling aroma flavor and texture of Royal Gala apples an increase
in acceptability was observed when juiciness and crispness increased between 16 and 20
weeks of controlled atmosphere storage (Harker et al 1997) Textural recognition with
fruit is of critical importance to marketers of fruit and there is a need for more research
in this area
45 Methods of Determining Texture in Fruits
A wide selection of fundamental empirical and imitative methods are available
for determining fruit texture (Bourne 2002)
bull Puncture tests Involve penetrating the fruit with a cylindrical probe with a
convex tip Examples are the Magness-Taylor Effegi Ballauf Chatillon
Penetrometers are characterized by using a force determination instrument rate of
penetrometer movement into the food and a standard distance (Bourne 2002)
13
bull Whole-Fruit Deformation Involves compressing an intact fruit between two
parallel flat plates This method involves deforming the fruit at a fixed distance
and determining the force required to achieve the deformation (Bourne 2002)
bull Tactile Assessment Squeezing fruit by hand is an important method for
evaluation of texture quality Human tactile sense is sensitive when fruits are
relatively soft However as fruit firmness increases beyond a threshold
individualsrsquo discrimination among fruits becomes difficult Tactile approach is
not recommended with hard fruits such as apples and pears (Batten 1990)
bull Shear and Extrusion A shear test for fruits can be conducted by obtaining a plug
of tissue from a thin slice held between two rigid plates The Kramer shear cell is
the most frequently used method for determining the shear or extrusion properties
of fruit tissue (Mohsenin 1977)
bull Compression Tests Compression tests are usually applied to tissue excised from
the whole fruit A common test is the texture profile analysis where a bite size
cube of tissue is compressed through two cycles between two plates or probes
The resulting force-distance curve is used to differentiate a number of food
attributes hardness cohesiveness adhesiveness springiness gumminess and
chewiness (Bourne 2002)
bull Beam Tests A cylindrical or rectangular fruit tissue is supported by pivots at both
ends A blunt blade located between pivots descends at constant speed so the
fruit tissue bends and breaks Beam tests are used to determine rupture force
shear and elastic modulus of foods (Vincent et al 1991)
14
bull Wedge Tests A sharp wedge is driven into a block of tissue and many elements
can be determined from the force-distance curves (Vincent et al 1991)
bull Tensile Tests Consist of securely fixing both ends of a fruit tissue into an
instrument by either using clamps cutting tissue into a shape which slots between
sets of claws or by gluing Tensile tests allow scientists to examine fracture
surfaces using a scanning electron microscope (Harker and Hallett 1992)
bull Dynamic Tests Consists of deforming a tissue by applying a sinusoidal stress
usually between 01 and 500 Hz (Mohsenin 1970)
bull Twist Test Consists of a rectangular blade fixed radially at its axis to a sharpened
spindle The fruit is impaled onto the spindle until the blade completely enters the
flesh The fruit is then twisted by hand or by an automated system The twist
tests allow scientists to determine tissue strength in different tissue zones by
altering the length of the spindle (Studman and Yuwana 1992)
bull Tissue Juiciness Generally juiciness is characterized as percentage of juice
released from a fixed weight of fruit tissue A number of methods were
developed utilizing homogenization centrifugation or juice extractors
(Szczesniak 1987)
bull Auditory Recordings of Chewing Sounds Sound produced during biting and
chewing can be recorded using a microphone pressed firmly against the ear and
analyzed from amplitude-time plots (Edmister and Vickers 1985)
bull Sensory Evaluations There are two types of sensory assessments consumer and
analytical panels Consumer panels indicate preference or acceptability of a food
Analytical panels involve individuals trained to describe aroma taste and texture
15
attributes of a product Analytical sensory panels can be either difference tests or
descriptive analysis techniques (Harker et al 1997)
bull Electrical Impedance Electrical impedance spectroscopy is used to investigate
the resistance of intracellular and extracellular compartments within plant tissue
At 50 Hz the resistance of the extracellular pathway is determined Weakening of
the cell wall is associated with changes in texture (Zhang and Willison 1991)
46 Relationship between Instrumental and Sensory Determinations of Texture
Szczesniak (1987) recommended that instrumental determinations of texture may
be established depending on the accuracy and precision of the selected instrument to
predict sensory texture attributes Szczesniak (1987) determined correlations between
instrumental and sensory measurements of food texture to satisfy the desire of the food
industry for quality assurance instruments to predict consumer responses to understand
the textures being perceived in sensory assessment and to develop instrumentation that
will accurately replicate sensory evaluations Szczesniak (1987) emphasized that the
range selection and diversity of texture attributes in the assessment of food texture as
well as the scale and appropriateness of the comparison among foods must be considered
before correlating instrumental and sensory data
Numerous studies examined the relationship between instrumental and sensory
measurements on apples (Diehl and Hamann 1979 Abbott et al 1984 Richardson
1986 Paoletti et al 1993) Many studies report good correlations (r gt 08) between
firmness crispness and instrumental determination with puncture (Abbott et al 1984)
sensory evaluation (Brenan et al 1970) shear and extrusion (Hard et al 1977) whole
fruit compression (Abbott et al 1984) and tensile tests (Holt and Schoorl 1985) While
16
significant correlations were reported between many mechanical and sensory assessments
of texture variation of fruit cultivars between seasons and during the storage period
resulted in some problems due to the non-homogeneous distribution of the results
5 Sensory Perception of Crisp Crunchy and Crackly Textures
51 Structural Properties of Food with an Auditory Component
Food structure is fundamental to the production of sound during the biting and
chewing of food Food texture attributes such as crispness crunchiness and crackliness
are greatly influenced by the arrangement of the cells chemical bonds cracks and
impurities in the food (Al Chakra et al 1996) Foods producing a perceivable auditory
response may be divided into two groups dry and wet crisp foods (Edmister and Vickers
1985)
Fruits and vegetables are wet crisp foods because they contain fluid within cells
Fruits and vegetables are composed of turgid cells with elastic cell walls An increase in
turgidity is associated with an increase in crispy crunchy and crackly sounds Turgidity
occurs when the fluids inside the cell press outwards on the cell wall while the cell wall
presses inwards Turgidity in wet food is characterized by strength and elasticity During
biting or chewing of the food the contents of the cell expand rapidly and when released
a sound wave is produced The resulting sound is responsible for the perception not only
of crispness but also crunchiness and crackliness (Vickers and Bourne 1976)
Dry crisp foods are cellular foods that contain air within the cells Foods such as
chips and biscuits contain air filled cavities with brittle walls During biting or chewing
the brittle walls bend and break The remaining fragments of the cells produced during
17
breakage snap back to their original shape and emit vibrations resulting in sound
emission The sound emission results in the perceptions of crisp crunchy and crackly
sounds (Vickers and Bourne 1976)
Sound attributes in foods are at a maximum during the first bite The decline or
absence of sound is observed as chewing progresses (Lee et al 1990) Sound perception
is also influenced by length width and thickness of the food (Al Chakra et al 1996)
The perception of crispness crunchiness and crackliness for both wet and dry foods
declines as mastication and saliva hydration progresses
52 Perception of Sound
Sounds produced during biting or chewing foods are detected by air conduction
and by bone conduction Air conduction sounds are perceived directly through the ear
Air molecules vibrate across molecules producing sound waves that travel through the
auditory canal Vibrations reaching the eardrum activate the movements on the ossicles
on the drum membrane transferring the sound into the inner ear The inner ear is
responsible for the perception of loudness and pitch of the sound (Kinsler and Frey
1962)
Bone conduction sounds are transmitted through the mandible bones cheeks and
tongue into the ears Bone conducted sounds are perceived as a higher frequency when
chewing with the mouth closed rather than opened and exert a dampening effect on the
sound Because of the differences in sound contribution between air and bone the two
sounds must be combine and equalize in order to fully quantify the acoustic sensations
produced by crisp crunchy or crackly foods (Vickers and Borne 1976)
18
53 Sensory Studies
Sensory evaluations of crispness crunchiness and crackliness are reported by
Jeon et al 1975 Vickers 1984a 1984b Seymour and Hamman 1988 Szczesniak
1988 Dacremont 1995 Harker et al 1997 Vincent et al 2002 Duizer and Winger
2005 and Dijksterhuis et al 2005 Sensory evaluations were performed with trained
and untrained panelists Consumer evaluations with untrained panelists are reported
using magnitude estimation (Vickers and Wassermann 1979 Vickers 1981 Christensen
and Vickers 1981 Mohamed et al 1982 Edmister and Vickers 1985) Trained
panelistsrsquo evaluations are focused on descriptive analysis where panelists are asked to
reach a consensus about the meaning of selected texture attributes Thus in some
evaluations verbal definitions were developed to identify the attributes crispy (Table 1)
crunchy (Table 2) and crackly (Table 3) Crispy crunchy and crackly definitions
exhibit only moderate agreement and large variation in the perception of each attribute
Important aspects cited when defining crispness crunchiness and crackliness are the
structure of the intact food sounds emitted at chewing or biting force needed to crush the
food and collapse and appearance of the food at fracture (Roudaut et al 2002)
Differences in definitions among trained panelists demonstrate that the perception
and sensory evaluation of crispness crunchiness and crackliness is not an easy process
The difference between a sensory attribute concept and its definition should be
acknowledged (Roudaut et al 2002) Also studies conducted in several countries add
difficulty in comparing results among sensory studies Drake (1989) indicated that
crispness may be described as having more than one equivalent term in other languages
Also even if a term exists in more than one language the phrase may not express
19
equivalent meaning in all languages The lack of standardization in the procedures
implementing sensory studies adds difficulty to the understanding of crispness
crunchiness and crackliness Further research must standardize sensory evaluations to
improve consistency in the outcomes of the studies
Table 1 Definitions of Crispness
Definition Technique Reference
Relative force required to bite through the food Biting with front teeth
Jeon et al 1975
Foods that produce a high pitched sound Biting with front teeth
Vickers 1984b
First Bite place the food between the incisors bite through and evaluate the level of high pitched noise
Biting with front teeth
Seymour and Hamman 1988
Firm and brittle snaps easily emitting a typical frequency sound upon deformation
NA Szczesniak 1988
The perceived relative force used by crunching the food in the mouth
Molars Onwulata and Heymann 1994
The perceived force with which the food separates into two or more distinct pieces during a single bite with the incisors An abrupt and complete failure of the food is required
Incisors first bite
Barrett 1994
Foods that produce a high pitched sound with a frequency higher than 5 kHz especially for air conduction sounds
Only incisors or bitten and chewed
Dacremont 1995
Harker et al 1997 The amount and pitch of sound generated when the sample is first bitten with the front teeth
Front teeth bite
A combination of the noise produced and the breakdown of the food as bitten through entirely with the back molars
Biting with the back molars
Duizer et al 1998
20
Fractures in an abrupt manner after applying a relatively small force on the food
Front teeth first bite
Vincent et al 2002
Fracture in an abrupt brittle manner after applying a relatively small force on the food on the first chew with the molars
Molars second bite
Vincent et al 2002
Cracks you can force your teeth through slowly more airy than crackling
At first bite Dijksterhuis et al 2005
Soft sound more airy than crackling Association with freshness Disintegrates into pieces smaller than when crackling
During chewing
Dijksterhuis et al 2005
A combination of the type of sound ie short snapping and longer cracking sounds and the force to bite and chew as perceived on the first bite
First bite Duizer and Winger 2005
21
Table 2 Definitions of Crunchiness
Definition Technique Reference
The perceived hardness of a food after it is crushed and chewed in the mouth 2-3 times Also defined as the amount of force necessary to crush and grind the cube during the second and subsequent chews
Chewing with molars
Moskowitz et al 1974
Foods that produce low pitched sounds are less loud and last longer than for crisp Firm and brittle Snaps easily with typical sound
Chewing with molars
Vickers 1984b
Degree of low pitched noise (with respect to crisp sounds) but above threshold pitch considered too low
Place sample between molar teeth
Seymour and Hamman 1988
Complex failure mechanism that involves repetitive deformation and fracturing of cell structure Necessary are structural subunits especially with cells with brittle cell walls Continuous fracture during chewing Sensory description the perceived intensity of repeated incremental failures of the food during a single complete bite with the molar teeth
First bite with molars
Barrett 1994
The perceived cumulative intensity of force required for repeated incremental failures of the food by chewing up to five times with the molars
Chewing with molars
Guraya and Toledo 1996
Harker et al 1997 The amount of noise generated when the food is chewed at a fast rate with the back teeth
Chewing with back teeth
Products that produce low pitched sounds with a characteristic peak on frequency range 125 to 2 kHz for air conduction
Only incisors or bitten and chewed
Dacremont 1995
22
Temporal aspects of the sensory feedback during mastication are important for the crunchy sensation Crunchiness is independent from hardness
Chewing with molars
Brown et al 1998
Crunchy would be associated with a hard and dense texture that fractures without prior deformation producing a loud low-pitch sound that is repeated during several chews It was suggested that crunchy is more relevant to fruits and vegetables than crispness
Mainly during chewing
Fillion and Kilcast 2001
Fractures after applying a higher force on the food than for crispness
Front teeth first bite
Vincent et al 2002
Fractures after applying a higher force on the food than for crispness on the first chew with the molars
Molars second bite
Vincent et al 2002
High pitched sound light sound longer sounding
During chewing Dijksterhuis et al 2005
Table 3 Definitions of Crackliness
Definition Technique Reference To make small sharp sudden and repeated noises
At first bite or during chewing
Vickers 1984a
Foods that generate low pitched sounds with a high level of bone conduction Discrimination between crackly and crunchy foods could be due to vibrations propagated by bone conduction that also generate vibrotactile sensations
Only incisors Dacremont 1995
Combination of sound and bite force Clip between the teeth and it breaks Crackling is harder than crispy
At first bite Dijksterhuis et al 2005
Audible for a long period during chewing large pieces of food mainly of the crust
During chewing Dijksterhuis et al 2005
23
54 Acoustic Studies
The association that acoustic sensations have with the perception of texture was
reported for crisp crunchy and crackly foods (Drake 1963 Kapur 1971 Vickers and
Bourne 1976 Vickers and Wasserman 1979 Vickers and Christensen 1980 Vickers
1981 1983 1984a 1984b 1987a 1987b Dacremont et al 1991 1995 Zampini and
Spence 2004) Two primary approaches were developed to study the relationships
between texture of food and sound The first approach involves recording the sounds
produced during application of a force to a food to obtain quantitative information
regarding the crisp and crunchy sounds (Drake 1963 Kapur 1971 Vickers and Bourne
1976 Edmister and Vickers 1985 Vickers 1985 Seymour and Hamann 1988
Dacremont et al 1991) The second approach consists of assessing the panelistsrsquo
perceptions of air-conducted sounds to study the involvement of sounds produced when
eating food to perceptions of crispness crunchiness or crackliness (Christensen and
Vickers 1981 Vickers and Wasserman 1979 Vickers 1980 1981 1984a 1984b) Both
acoustic approaches combined with mechanical force-deformation techniques more
adequately describe the sounds resulting from biting or chewing foods than either
approach alone (Vickers 1987a Szczesniak 1988)
In the first approach acoustic recordings are used to record sounds associated
with crispness crunchiness and crackliness of eating foods Numerous studies using
amplitude-time plots are reported and correlated to sensory determinations of crispness
crunchiness and crackliness Drake (1965) inferred that the higher the amplitude of the
amplitude time plot the crisper the food Drake (1965) concluded the amplitude of the
sound emitted during biting toasted bread increased as the degree of toasting increased
24
Edmister and Vickers (1985) concluded that a combination of the mean height of the
peaks x the number of peaks is a better predictor of crispness for dry and wet crisp foods
than other parameters such as number of sound bursts duration mean height peaks x
number of sound bursts mean height peaks x number of sound burststhickness
Seymour and Hamann (1988) studied the effect of sound pressure in the perception of
crispness and crunchiness in potato chips and reported that potato chips with a low water
activity exhibited a higher mean sound pressure than potato chips with a high water
activity Seymour and Hamann (1988) concluded the sound produced during chewing of
the potato chips was louder at low water activities than at higher water activities
The Fast Fourier Transform (FFT) method is used to characterize the most evident
frequencies during biting and chewing of foods Comparison of the predominant
frequencies resulting from biting and chewing crisp crunchy and crackly is possible with
FFT The biting or chewing of crunchy and crackly foods is characterized by a sound in
frequency range between 125 and 2 kHz A large volume of bone conduction is evident
when eating crackly foods and absent when eating crunchy foods Consumption of crispy
foods is characterized by sound with frequencies greater than 2 kHz (Dacremont 1995)
Tesch et al (1995) determined the role of fractal analysis in mechanical and acoustical
perception of crunchy foods and reported mechanical acoustical signatures of cheese
balls and croutons concluding that fractal analysis is potentially useful in calculations to
assess auditory and mechanical perception of crunchy foods
The second approach focuses on the contribution of air conducting sounds to
crisp crunchy and crackly textures resulting from biting and chewing selected foods
There are currently two techniques used oral determination of air conducting sounds
25
(Vickers and Christensen 1980 Christensen and Vickers 1984) and auditory
determination of air conducting sounds (Vickers and Wasserman 1979 Vickers 1985)
The oral technique consists of asking panelists to bite or chew the food and evaluate the
sound produced The auditory technique involves playing prerecorded sounds of food
and asking panelists to evaluate the food sound properties Techniques are sometimes
used together (Edmister and Vickers 1985 Vickers 1981) The information obtained
from air conducting eating sounds is useful for development of standardized terms to
describe crisp crunchy and crackly foods (Szczesniak 1988)
Even though air-conducting sounds impact the perceptions of crispness
crunchiness and crackliness it is possible to evaluate them without the contribution of air
conducting noise Christensen and Vickers (1981) reported that panelists differentiated
crisp foods when an auditory block was put in place during tasting foods Christensen
and Vickers (1981) concluded that accurate perceptions of crispness involved a vibro
tactile acoustic sensation
Snap compression and puncture tests are used as instruments to objectively
determine the stimuli that produce textural sensations during food mastication (Al Chakra
et al 1996 Vickers and Christensen 1980 Seymour and Hamann 1988 Vickers 1987
Mohamed et al 1982) Although correlations exist between acoustic determinations and
crispness crunchiness and crackliness better relationships were observed when objective
mechanical testing was combined with acoustic determinations of sounds produced
during biting or chewing (Mohamed et al 1982 Vickers 1987 Seymour and Hamann
1988)
26
Acoustic determinations are important for the appreciation of crispness
crunchiness and crackliness in foods Through the use of a combination of acoustic and
instrumental techniques or either technique alone sensory science may potentially
improve the understanding of the perceptions evolving from biting or chewing crisp
crunchy and crackly foods (Duizer 2001)
27
References
Abbott JA Watada AE and Massie DR 1984 Sensory and instrument
measurement of apple texture J Am Soc Hort Sci 109 221-228
Al Chakra W Allaf K and Jemai AB 1996 Characterization of brittle food
products Application of acoustical emission method J Text Stud 27 327-
348
Batten DJ 1990 Effect of temperature on ripening and postharvest life of fruit of
atemoya cv lsquoAfrican Pridersquo Scientia Hort 45129-136
Barrett AH Cardello AV Lesher LL and Taub IA 1994 Cellularity mechanical
failure and textural perception of corn meal extrudates J Text Stud 25 77-95
Bell R L and Janick J 1990 Quantitative genetic analysis of fruit quality in pears J
Am Soc Hort Sci 115 829-834
Beyron H 1964 Occlusal relations and mastication in Autralian aborigines Acta
Odontol Scand 22 597-678
Borg I and Groenen P 1997 Modern multidimensional scaling theory and
applications 1st ed Springer-Verlag New York 471 p
Bourne M 2002 Texture Viscosity and Food Ch 1 In Food Texture and Viscosity
Concept and Measurement 2nd Ed Academic Press Geneva NY
Brandt MA Skinner EZ and Coleman JA 1963 Texture Profile Method J Food
Sci 28404-9
Brennan JG Jowitt GR and Mughsi OA 1970 Some experiences with the general
foods Texturometer J Text Stud 1 167-184
28
Brown WE Langley KR and Braxton D 1998 Insight into consumer assessments
of biscuit texture based on mastication analysis-hardness versus crunchiness J
Text Stud 29 481-497
Christensen CM and Vickers ZM 1981 Relationships of chewing sounds to
judgments of crispness J Food Sci 46 574-578
Civille GV and Szczesniak AS 1973 Guidelines to training a texture profile panel
J Text Stud 4204-223
Dacremont C Colas B and Sauvageot F 1991 Contribution of the air and bone
conduction to the creation of sounds perceived during sensory evaluation of
foods J Text Stud 22 443-456
Dacremont C 1995 Spectral composition of eating sounds generated by crispy
crunchy and crackly foods J Text Stud 26 27-43
Daillant-Spinnler B MacFie JH Beyts PK and Hedderley D 1996 Relationships
between perceived sensory properties and major preference directions of 12
varieties of apples from the southern hemisphere Food Qual Prefer 7 113-126
Diehl K C Hamann DD Whitfield J K 1979 Structural failure in selected raw
fruits and vegetables J Text Stud 10371-400
Dijksterhuis G Hannemieke L De Wijk R and Mojet J 2005 A new sensory
vocabulary for crisp and crunchy dry model foods Food Qual Pref 18 37-50
Dilley LA Wilson ID Kuai J Poneleit L Zhu Y and Pekker Y 1993
Molecular biology of pome fruit ripening and senescence concepts status
perspectives and future prospects Acta Hort 326 325-334
Drake BK 1963 Food crushing sounds- An introductory study J Food Sci 28 233
29
Drake BK 1965 Food crushing sounds- comparison of objective and subjective data
J Food Sci 30 556-559
Drake DK 1989 Sensory texture rheological properties ndash a polyglot list J Text
Stud 20 1-27
Drewnowski A 1984 New techniques multidimensional analyses of taste
responsiveness Int J Obesity 8599-607
Duizer LM Campanella OH and Barnes GRG 1998 Sensory instrumental and
acoustic characteristics of extruded snack food products J Text Stud 29 397-
411
Duizer LM and Winger RJ 2006 Instrumental measures of bite forces associated
with crisp products J Text Stud 37 1-15
Edmister JA and Vickers ZA 1985 Instrumental acoustical measures of crispness in
foods J Text Stud 16 153-167
Fillion L and Kilcast D 2001 Consumer perception of crispness and crunchiness in
fruits and vegetables Food Qual Pref 13 23-29 General Foods Corp 1967
Sensory Texture Profiling
Guraya HS and Toledo RT 1996 Microstructural characteristics and compression
resistance as indices of sensory texture in a crunchy snack product J Text
Stud 27 687-701
Hard MM Zaebringer MV Bowman F and Mackey AC 1977 Predicting texture
of fresh fruit and vegetables by chemical and physical methods College of Agr
Washington State Univ Bul 836
30
Harker FR and Hallet IC 1992 Physiological changes associated with development
of mealiness of apple fruit during cool storage HortSci 271291-1294
Harker FR Redgwell RJ Hallet IC and Murray SH 1997 Text in fresh fruit
Hort Rev 20 121-224
Harker FR Amos RL Echeverria G Amdgunson FA 2006 Influence of texture
on taste insights gained during studies of hardness juiciness and sweetness of
apple fruit J Food Sci 71(2) S77-S82
Holt JE and Schoorl D 1985 Mechanical properties and texture of stored apples J
Text Stud 15377-394
Huber DJ 1983 The role of cell wall hydrolases in fruit softening Hort Rev 5 169-
219
Jeon IJ Breene WM and Munson ST 1975 Texture of fresh pack whole
cucumber pickles correlations of instrumental and sensory measurements J
Text Stud 5 399-409
Jenkins GN 1978 The physiology and biochemistry of the mouth Blackwell Oxford
Kapur KK 1971 Frequency spectrographic analysis of bone conducting chewing
sounds in persons with natural and artificial dentitions J Text Stud 2 50-61
Kinsler LE and Frey AR 1962 Fundamentals of acoustics 2nd Ed John Wiley amp
Sons New York p 392-400
Kruskal JB and Wish M 1978 Multidimensional scaling 2nd ed Sage Publications
Beverly Hills CA 93 p
Lashly KS 1916 Reflex secretion of the human parotid gland J Expt Psychol 1
461-493
31
Lawless HT and Glatter S 1990 Consistency of multidimensional scaling models
derived from odor sorting J Sens Stud 5217-30
Lawless HT Sheng N and Knoops SSC 1995 Multidimensional scaling of sorting
data applied to cheese perception Food Qual Pref 691-98
Lee III WE Schweitzer MA Morgan GM and Shepherd DC 1990 Analysis of
food crushing sounds during mastication total sound level studies J Text
Stud 21 165-178
Mohamed AAA Jowitt R and Brennan JG 1982 Instrumental and sensory
evaluation of crispness 1 in friable foods J Food Eng 155-75
Mohsenin NN 1970 Physical properties of plant and animal materials structure
physical characteristics and mechanical properties Gordan and Breach Science
Publ New York
Mohsenin NN 1977 Characterization and failure of solid foods with particular
reference to fruits and vegetables J Text Stud 8 169-193
Moskowitz HR Segars RA Kapsalis JG and Kluter RA 1974 Sensory ratio
scales relating hardness and crunchiness to mechanical properties of space cubes
J Food Sci 39 200-202
Muller HG 1969 Mechanical properties rheology and haptaesthesis of food J
Text Stud 138-42
Onwulata C and Heymann H 1994 Sensory properties of extruded corn meal related
to the spatial distribution of process conditions J Sens Stud 9 101-112
32
Paoletti F Moneta E Bertone A and Sinesio F 1993 Mechanical properties and
sensory evaluation of selected apple cultivars Lebensm-Wiss Technol 26
721-726
Pitts RE 1982 Models for the rheology and statistical strength of uniformly stressed
vegetative tissue Trans Am Soc Agr Eng 26 1776-1784
Reeve RM 1953 Histological investigations of texture in apples II Structure and
intercellular spaces Food Res 18604-617
Richardson A 1986 The effects of herbicide soil management systems and nitrogen
fertilizer on the eating quality of Coxrsquos Orange Pippin apples J Hort Sci 61
447-456
Roudaut G Dacremont C and Le Meste M 1998 Influence of water on the
crispness of cereal-based foods acoustic mechanical and sensory studies J
Text Stud 29 199-213
Schiffman S Reynolds ML and Young FW 1981 Introduction to
multidimensional scaling 1st ed Academic Press New York 413 p
Seymour SK and Hamann DD 1988 Crispness and crunchiness of selected low
moisture foods J Text Stud 19 79-95
Stec M G H Hodgson JA MacRae EA and Triggs CM 1989 Role of fruit
firmness in sensory evaluation of kiwifruit (Actinidia deliciosa cv Hayward) J
Sci Food Agr 47 417-433
Studman CJ and Yuwana 1992 Twist test for measuring fruit firmness J Text
Stud 23 215-227
Szczesniak AS 1963 Classification of textural characteristics J Food Sci 28385-9
33
Szczesniak AS and Kahn EL 1971 Consumer awareness of and attitudes to food
texture I Adults J Text Stud 2 280-295
Szczesniak AS 1987 Correlating sensory with instrumental texture measurements -
an overview of recent developments J Text Stud 181-15
Szczesniak AS 1988 The meaning of textural characteristics ndash crispness J Text
Stud 19 51-59
Szczesniak AS and Ilker R 1988 The meaning of textural characteristics ndash juiciness
in plant foodstuff J Text Stud 19 61-78
Szczesniak AS 1990 Texture It is still an overlooked food attribute Food Technol
44(9)8688909295
Tesch R Normand MD and Peleg M 1995 The apparent fractal dimension of
sound bursts in acoustic signature of two crunchy foods J Text Stud 26
685-694
Tesch R Normand MD and Peleg M 1996 Comparison of the acoustic and
mechanical signatures of two cellular crunchy cereal foods at various water
activity levels J Sci Food Agric 70 347-354
Vickers Z M and Bourne MC 1976 A psycho acoustical theory of crispness J
Food Sci 41 1158-1164
Vickers ZM and Wasserman SS 1979 Sensory qualities of food sounds based on
individual perceptions J Text Stud 10 319-332
Vickers Z M and Christensen CM 1980 Relationships between sensory crispness
and other sensory instrumental parameters J Text Stud 11 291-307
34
Vickers ZM 1980 Food sounds how much information do they contain J Food Sci
45 1494-1496
Vickers ZM 1981 Relationship of chewing sounds to judgments of crispness
crunchiness and hardness J Food Sci 47 121-124
Vickers ZM 1983 Pleasantness of food sounds J Food Sci 48 783-786
Vickers ZM 1984a Crackliness relationships of auditory judgments to tactile
judgments and instrumental acoustical measurements J Text Stud 15 49-
58
Vickers ZM 1984b Crispness and crunchiness- a difference in pitch J Text Stud
15 157-163
Vickers ZM 1985 The relationship of pitch loudness and eating technique to
judgments of crispness and crunchiness of food sounds J Text Stud 16 85-
95
Vickers ZM 1987a Instrumental measures of crispness and their correlation with
sensory assessment J Text Stud 19 1-14
Vickers ZM 1987b Sensory acoustical and force deformation measurements of
potato chips crispness J Food Sci 52138-140
Vincent JFV 1991 Texture of plants and fruits p19-33 In JFV Vincent and PJ
Lillford (eds) Feeding and the texture of food Cambridge Univ Press
Cambridge
Vincent JFV and Saunders DEJ 2002 The use of critical stress intensity factor to
quantify hardness and crunchiness objectively J Text Stud 33 149-159
Yurkstas AA 1965 The masticatory act J Prosthet Dent 15 248-260
35
Zraick RI Liss JM Dorman MF and Case J L 2000 Multidimensional scaling
of nasal voice quality J Speech Hear Res 43989-96
Zhang M I N and JHM Willison 1991 Electrical impedance analysis in plant
tissues A double shell model J Exp Bot 421465-1475
36
Chapter Two
MULTIDIMENSIONAL REPRESENTATION OF THE
STANDARD SCALES OF FOOD TEXTURE
M A CHAUVIN C PARKS C ROSS and BG SWANSON
Department of Food Science and Human Nutrition
Washington State University
Pullman WA 99164-6376 USA
Corresponding author Dr Barry G Swanson
Department of Food Science and Human Nutrition
Washington State University Pullman WA 99164-6376 USA
Tel 1-509-335-3793
Fax 1-509-335-4815
Email swansonbwsuedu
(Multidimensional scaling of texture)
37
ABSTRACT
The use of standard terminology standard reference foods and standard
evaluation procedures for utilizing standard scales in texture profile methods makes them
effective objective tools for assessing panelists in descriptive analysis However their
use is often limited due to lack of availability of foods and the drift of scales over time
The objective of this study was to evaluate the standard texture scales developed by
Szczesniak et al (1963) for the classification of the textural characteristics of foods
through the use of multidimensional scaling (MDS) The texture perceptions of foods by
eleven panelists were evaluated using the standard texture scales of Szczesniak et al
(1963) Each scale was anchored by a series of representative standard foods that
illustrated the intensity gradation of the subjective magnitude of the texture dimension
under study hardness chewiness gumminess viscosity adhesiveness and fracturability
MDS was highly instructive in quantitatively assessing the qualitative textural difference
perceptions of naive panelists (r gt 089) The selected foods were rated similarly using
MDS and standard texture scales
PRACTICAL APPLICATIONS
MDS is an efficient tool for the analysis of sensory perception data Using MDS
it is possible to corroborate food texture standard scales published many years ago and
assay food texture more accurately today Caution is necessary when assuming that
standard scales developed in the past are as useful today as when were developed The
item drift theory hypothesizes that questions become less reflective of a concept over
time for natural reasons The purpose of this study was to use Multidimensional Scaling
38
to reproduce the original dimensions and original order of stimuli to analyze existing
food textural scales for hardness chewiness gumminess viscosity adhesiveness and
fracturability
Key Words Multidimensional scaling MDS texture standard scales sensory
perception
39
INTRODUCTION
Szczesniak et al (1963) developed a series of standard food texture scales for the
mechanical properties of texture using common foods to represent selected textures
within the entire range of characteristic texture intensities encountered in foods (Table 1)
Using the standard texture scales developed by Szczesniak et al (1963) Brandt et al
(1963) developed the descriptive analysis technique for food texture designated as the
General Foods Texture Profile The General Foods Texture Profile technique uses
terminology to describe basic categories or classifications of food texture characteristics
developed by Szczesniak (1963) for training texture profile panelists The primary
characteristics of the food texture profile technique are standardization reproducibility
and correlation of texture attributes with instrumental determinations of food texture
(Civille and Liska 1975) The General Foods Texture Profile represents experimental
design of an organized and structured study of food texture specifically to ldquostudy the
sensory analysis of the texture complex of a food in terms of its mechanical geometrical
fat and moisture characteristics the degree of each present and the order in which they
appear from first bite through complete masticationrdquo (General Foods 1967)
Evaluation of the mechanical characteristics of food texture is both qualitative and
quantitative and may be assessed by the standard texture scales Texture standard scales
use category scaling to designate differences in textural attributes In texture analysis
the category scale is used to represent intensity of the attribute with the number of
categories varying with the texture attribute scaled For each texture attribute scale the
full range of the textural attribute is demonstrated using foods that possess a given texture
attribute as a major property The standard texture scales developed by Szczesniak et al
40
(1963) are practical tools to demonstrate the principal range of texture for each specific
texture attribute Szczesniak scales are evolving and were modified throughout the years
by a number of researchers including General Foods (1967) Civille and Liska (1975)
Szczesniak (1975) and Munoz (1986) However the initial publication by Szczesniak
(1963) is considered a highly standardized reference system for food texture
Szczesniak (1963) concluded that texture is a discernible sensory attribute of
foods and that in some foods such as meat potato chips cornflakes and celery texture
may be more important than flavor The effectiveness of sensory panelists to distinguish
and articulate mechanical texture characteristics such as hardness viscosity
adhesiveness fracturability gumminess and chewiness of foods varies among
individuals The complexity of the human masticatory apparatus cultural diversity
health status age sex and food preferences influence texture perception of foods among
individuals The use of Multidimensional Scaling (MDS) may elucidate differences
among panelists by developing configurations of attributesrsquo cognitive grouping and
describing multidimensional plots that illustrate similarity and differences in attribute
observations
MDS is a mathematical technique that describes proximities among objects on a
spatial representation or map (Schiffman 1981) The MDS method assumes that
subjective estimates of similarity or dissimilarity represent individual estimates of spatial
comparisons between the two stimuli in a selected geometrical space of relatively small
dimensions (Moskowitz 1977) Foods assessed as similar are closer together on the
spatial representation (map) than foods assessed as dissimilar The MDS spatial
configuration may provide insights into important textural dimensions of foods that may
41
exist MDS may also minimize experimenter influence and provide fewer constraints to
sensory panelists than panelistsrsquo data from attribute rating scales (Schiffman 1981)
MDS was previously used in visual auditory taste and olfactory research of
foods (Moskowitz 1976a and 1976b Schiffman 1976 Drewnowski 1984 Hellemann
et al 1987 Lawless and Glatter 1990 Bertino and Lawless 1993 Lawless et al 1994
Zraick et al 2000) However little research is published using MDS to interpret
assessment of food texture
Magnitude estimation and category scaling are frequently compared for the
determination of sensory intensity for a variety of stimuli Controversy in the literature
exists regarding the relationship between both scaling techniques Some studies suggest
that magnitude estimation may provide a more accurate depiction of the true underlying
psychophysical function than category scaling (Mcdaniel and Sawyer 1981 Moskowitz
1982 Cardello et al 1982a) However Birnbaum (1982) and Vickers (1983) report no
particular advantage for magnitude estimation or category scaling techniques Category
scaling was selected over magnitude estimation in the present study to avoid confusion
among panelists resulting from the large number of foods presented
The objective of this study was to evaluate through MDS the standard food
texture scales for hardness chewiness gumminess viscosity adhesiveness and
fracturability developed by Szczesniak et al (1963)
42
MATERIALS AND METHODS
Panelists were recruited from Washington State University staff students and
members of the community and screened for allergies dental conditions and interest in
participating in the study Minimal information about the study was provided to the
panelists to reduce potential bias Eleven panelists five males and six females between
the ages of 23-54 years participated in the study Panelists were awarded a small
compensation for participation in the experiment None of the panelists expressed
previous experience with texture evaluation of foods and were considered naive panelists
Experimental foods were selected to represent the complete standard texture
scales for hardness chewiness gumminess viscosity adhesiveness and fracturability
(Szczesniak et al 1963) Due to unavailability of some foods substitutions were
selected as described in Cardello et al (1982a 1982b) Food items source size and
serving temperatures are presented in Table 1
Two four-hour sessions were conducted At the beginning of each session
panelists were required to sign a written consent form to participate in the study
Panelists were also given a demographic questionnaire and oral and written instructions
The written instructions included both an operational definition of the textural attribute
judged (Table 2) as well as instructions on the use of similarity judgments scales As
explained in the sensory texture profiling manual (General Food Corp 1967) the first 30
min of each session were devoted to familiarizing the panelists with the scales and the
technique used for assessing texture of experimental foods
There were N(N-1)2 possible pairs of foods to compare for a set of N foods in
each scale Representative food pairs were presented to panelists in a room fitted with
43
individual tables Three standard texture scales were analyzed in each session The
standard scales for hardness viscosity and adhesiveness were evaluated in session one
The fracturability gumminess and chewiness standard scales were evaluated in session
two
Two standard foods were presented as paired comparisons together with a ballot
asking each panelist to quantitatively judge the textural similarity between the two foods
A similarity scale consisting of a 9-point scale with the words ldquoexactly the samerdquo at the
high end (9) and ldquocompletely differentrdquo at the low end (1) was presented to each
panelist A separate ballot was provided for each paired comparison Panelists rinsed
their mouths with distilled water andor unsalted crackers between foods and were
permitted to take as many breaks as necessary to avoid fatigue Once each panelist was
finished with the first comparison shehe was instructed to advance to the next
comparison The panelists were instructed to wait one minute between each pair of
texture evaluations Panelists were advised not to go back to review or modify any
previous responses A mandatory 15-minute break was imposed between standard
scales
Food pairs were presented in a random order identified with three digit codes
Each food was presented uniformly as established by Szczesniak et al (1963) and placed
inside a 3 oz souffleacute cup (Solo Cup Company Urbana IL) Each food pair was
evaluated once by each panelist A total of 36 paired comparisons for hardness 28 for
viscosity and 10 for adhesiveness were assessed in the first session A total of 21 paired
comparisons for fracturability 10 for gumminess and 15 for chewiness were assessed in
the second session
44
Data Analysis
For each of the eleven panelists one individual matrix was constructed from the
pairwise similarity scores for each of the standard texture scales hardness chewiness
gumminess viscosity adhesiveness and fracturability Each cell within each individual
matrix yielded a similarity score ranging from 1 to 9 quantifying perceived similarities in
texture on the 9-point scale
The eleven panelistsrsquo matrices were combined to yield one matrix for each
standard food texture scale reflective of the mean group pairwise similarity scores
Every cell within each group matrix yielded a mean score for all foods on each standard
food texture scale reflective of the 9-point scale
Data were analyzed as similarity estimates using SPSS Version 120 statistical
analysis software (SPSS Inc Chicago IL) and on XLSTAT 754 (Addinsoft Paris-
France) MDS algorithm ALSCAL module for nonmetric multidimensional scaling was
employed using the option for minimizing Kruskalrsquos stress Formula 1 two-dimensional
solutions Output from the scaling software program included an assessment of stress
quantifying the fit among the data and the scaling model and R2 values calculating the
variance among underlying data that accounted for the scaling solution (Zraick 2000)
45
RESULTS AND DISCUSSION
Multidimensional scaling was performed on each paired comparison for the six
standard texture scales Stress and R2 values were calculated on the two-dimensional
configuration Stress and R2 results are presented in Table 3 Stress values for the
three-dimensional configuration of the six standard texture scales slightly improved
compared with the two-dimensional configuration Thus further analyses of the six
standard texture scales were performed in the two-dimensional configuration only The
mean stress values were small (lt 013) for hardness viscosity adhesiveness
fracturability gumminess and chewiness R2 values were correspondingly large (gt 089)
Small stress values and large R2values reflect the accuracy of the MDS algorithm to fit
calculated distances to the texture results in two dimensions Well organized two-
dimensional structures and agreement among the panelists for food texture analyses were
observed
MDS two-dimensional graphical representation of mean hardness of standard
foods on the hardness scale (Figure 1) illustrated agreement with the original standard
hardness scale (Table 4) Cream cheese was located at the softest point (smallest scale
value) and lemon drops were located at the hardest point (largest scale value) The
remaining foods were distributed between the soft and hard extremes with a cluster
observed at the ldquosofterrdquo end of the scale Specifically the texture of cream cheese egg
whites frankfurters cheese and olives were perceived as very similar to each other
potentially resulting in perceptual confusion by the panelists during evaluation Good
separation of peanuts carrots almonds and lemon drops were observed similar to the
original standard scale Confusion in assessing the similarity among softer foods may be
46
attributed to changes in the standard foodsrsquo formulations over time However with
further training confusion among softer textures could be minimized
Figure 2 presents two-dimensional perceived means of the viscosity standard
scale Agreement between perceived viscosity means and the original viscosity standard
scale was observed (Table 5) However distinctions among the viscosities of heavy
cream light cream and evaporated milk were difficult among panelists as they were
perceived to be very similar to each other Unfamiliarity of the panelists with the foods
may account for these results For instance today evaporated milk is mainly used as an
ingredient for numerous recipes and very few people know what it tastes like on its own
On the other hand in the early 1960rsquos when the original scales were developed
evaporated milk was marketed as a coffee creamer and evaporated milk taste was more
familiar Using standard scales generated a number of years ago may result in the
assumption that foods consumed many years ago are still in use or of equivalent use
today
MDS two-dimensional graphical representation of means of adhesiveness
standard scale (Figure 3) presented little variability from the original standard scale
(Table 6) The only inconsistency from the original standard adhesiveness scale was
between the perception of Crisco as less adhesive than Velveeta processed cheese The
discrepancy was attributed to taste preference and inability of the panelists to hold the
Crisco inside their mouths for a required amount of time
Figure 4 illustrates the means of fracturability standard scale which agreed with
almost all points of the original fracturability scale (Table 7) Only peanut brittle was an
47
outlier in the MDS graphical representation Differences in peanut brittle formulation
may be a source of variation in fracturability assessment
MDS two-dimensional graphical representations for gumminess (Figure 5) and
chewiness (Figure 6) coincide with their standard original scale equivalent at all points
(Tables 8 and 9)
The gumminess standard scale comprised of selected concentrations of white
flour and water were well discerned by the panelists Controlled food systems may
reduce problems related to continuous changes or unavailability of food standards
Nonetheless the advantage of multi-food standard scales is that frequently a given
characteristic is perceived differently in selected foods Converting food texture scales
to a one-dimensional series may be undesirable because a simple dimension may distort
illustration of diversified sensory perceptions of the mechanical parameters (Civille and
Liska 1975)
For many years research with food texture implied that texture was a single
concept and did not actively recognize that the perceptions of texture are the result of a
number of parameters Szczesniak (1963) categorized the textural parameters of foods
as mechanical geometrical and other (fat moisture) Furthermore terms identified as
primary food texture attributes include hardness adhesiveness cohesiveness and
springiness Secondary food texture attributes are described as perceived combinations
of two or more primary food textures and include fracturability chewiness and
gumminess
The first dimension of MDS analyses or food texture attribute calculated for all
standard texture scales represents specific mechanical parameters as a main textural
48
property For example hardness represents the first dimension on the hardness scale
This is demonstrated by the fact that food items that represented the strength of a specific
stimulus are located in similar geometrical space as their location on the standard food
texture scale The second dimension can be credited to hedonics or liking because
panelists were considered naiumlve consumers Panelists generally respond to odor and
taste of food pleasantness or unpleasantness first prior to classifying the texture
parameter or intensity (Moskowitz 1976b) The second dimension is also defined by
texture descriptive terms containing perceived fractions of several attributes As a result
secondary terms describe texture as combinations of two or more primary texture
attributes Perhaps no descriptor term relates to a ldquopurerdquo texture attribute but rather
each term is a mixture of primary textural attributes to a greater or lesser degree
(Moskowitz and Kapsalis 1975) Food items selected for the standard scales of texture
possessed sensory attributes other than texture that may affect the perception of texture
The spatial MDS representation for each standard texture scale coincided with the
arrangement of each point presented on the food texture standard scales (Szczesniak et
al 1963) Occasional deviant points were observed and are attributed to factors such as
sensory panelist adaptation fatigue or carry-over effects (Lawless et al 1995 Also
depending on the geographical location of the panel distribution of selected foods is
limited making it difficult for people to recognize the standard foods Familiarity with
the standard foods may also change over time and cultural differences may also influence
the results Other factors to consider when employing standard food scales is that many
foods initially designated as standards are no longer available or the textural character
changed as a result of reformulation or processing alterations (Civille and Liska 1974)
49
In addition procedures for texture evaluation adhere to rigid experimental controls to
minimize variation in texture perception The preparation serving and presentation of
the experimental foods must be consistent Techniques for biting chewing and
swallowing experimental foods must also be standardized (Civille and Szczesniak 1973)
Panelists with limited training and with little sensory evaluation experience may
also influence the results in the MDS output Cardello et al (1982) demonstrated that
trained and consumer panel judgments of texture differ significantly primarily due to
expanded perceptual ranges of trained panelists
CONCLUSIONS
The contribution of Szczesniak (1963) to food texture evaluation constituted the
first step in creating a rational tool for scientific description of food texture A
modification of the standard food texture scales may be necessary as challenges are
encountered in its practical use including the change of food formulations over time and
food distribution limitations However more than forty years later the initial standard
texture scales are still in use and Szczesniak (1963) represents a highly standardized and
well defined reference system for training texture profile panels
Multidimensional scaling is a strong exploratory statistical and graphical
technique effectively producing a graphical representation of overall similarity in food
texture perceptions from sensory panelists MDS is highly instructive in assessing naive
panelistsrsquo perceptions of qualitative textural similarities of food and provides a high-
quality statistical instrument to graphically validate existing standard scales
50
Scale value Product Brand or Type Manufacturer Sample size Temp
1 Cream Cheese Philadelphia Kraft Foods 1 cm cube 45-55 ordmF
2 Egg white hard cooked (5 min) 1 cm tip room
3 Frankfurters large uncooked Oscar Mayers Beef 1 cm slice 50-65 ordmF
4 Cheese mild Cheddar Kraft Foods 1 cm cube 50-65 ordmF
5 Olives stuffed Safeway 1 olive pimento removed room
6 Peanuts cocktail type in vacuum tin Planters Peanuts 1 nut room
7 Carrots fresh uncooked 1 cm slice room
8 Almonds 1 nut room
9 Hard Candy lemon drops Safeway 1 piece room
1 Corn muffin made from mix Jiffy 1 cm cube room
2 Shortbread Shortcake Keebler 1 cm cube room
3 Graham crackers Nabisco National Biscuit Corp 12 square room
4 Melba toast plain Old London 12 square room
5 Wheat thins Nabisco National Biscuit Corp 1 cm square room
6 Ginger snaps Nabisco National Biscuit Corp 12 square room
7 Peanut brittle candy part Safeway 12 square room
1 Hydrogenated vegetable oil Crisco Proctor amp Gamble Co 12 tsp 45-55 ordmF
2 Velveeta unsliced Kraft Foods 1 cm cube 45-55 ordmF
3 Cream cheese Philadelphia Kraft Foods 1 cm cube 45-55 ordmF
4 Marshmallow topping Kraft Foods 12 tsp 45-55 ordmF
5 Peanut Butter Skippy Smooth Best Foods 12 tsp 45-55 ordmF
1 40 flour paste Gold Medal General Mills 1 tbs room
2 45 flour paste Gold Medal General Mills 1 tbs room
3 50 flour paste Gold Medal General Mills 1 tbs room
4 55 flour paste Gold Medal General Mills 1 tbs room
5 60 flour paste Gold Medal General Mills 1 tbs room
1 Water distilled 12 tsp 45-55 ordmF
2 Light cream half and half Lucerne 12 tsp 45-55 ordmF
3 Heavy cream table cream Lucerne 12 tsp 45-55 ordmF
4 Evaporated Milk Carnation Co 12 tsp 45-55 ordmF
5 Maple Syrup natural maple syrup Wheelers Maple Products 12 tsp 45-55 ordmF
6 Chocolate Syrup Hershey Chocolate Corp 12 tsp 45-55 ordmF
7 Mixture 1 12 cup condensed milk Nestle 12 tsp 45-55 ordmF
amp1 tbl heavy cream
8 Condensed milk sweetened Nestle 12 tsp 45-55 ordmF
1 White bread fresh center cut Safeway 1 12 cm cube room
2 Frankfurter large uncooked skinless Oscar Mayers Beef 1 12 cm cube 50-70 ordmF
3 Gum drops spice drops Safeway 1 piece room
4 Licorice candy red vines American Licorice Co 1 piece room
5 Caramel Kraft 12 piece room
6 Tootsie Rolls midget size Sweet Co of America 1 piece room
Substitute item Reference Cardello 1982 Munoz 1986
Table 1 Standard Scales of Texture
Standard Viscosity Scale
Standard Chewiness Scale
Standard Hardness Scale
Standard Fracturability scale
Standard Adhesiveness Scale
Standard for Gumminess Scale
Szczesniak et al 1967
51
Table 2 Definitions of the textural attributes of hardness chewiness viscositygumminess adhesiveness and fracturability (General Foods Corp 1967)Hardness
Chewiness
ViscosityGumminess
Adhesiveness
Fracturability
Perceived force required to compress a substance between the molar teethTotal perceived work required to masticate a sample to reduce it toa consistency suitable for swallowing
after complete compression of the sample between tongue and palateForce with which sample ruptures when placing sample between molars and biting down completely at a fast rate
Perceived force required to draw a liquid from a spoon over the tongueEnergy required to disintegrate a semisolid food product to a state ready for swallowingForce required to remove product completely from palate using tongue
52
Table 3 MDS Stress and R2 for paired comparisons of texture scales
Stress R2
Hardness 006 099Viscosity 009 097Adhesiveness 013 089Fracturability 010 096Gumminess 004 099Chewiness 013 091
53
Scale value Product
1 Cream Cheese2 Egg white3 Frankfurters4 Cheese (Medium Cheddar)5 Olives6 Peanuts7 Carrots8 Almonds9 Hard Candy
Figure1 MDS representation of hardness textural perceptions of standard foods (n=11)
Table 4 Standard hardness scale as described by Szczesniak et al 1967
Substitute item Reference Cardello 1982 Munoz 1986
Cream cheeseEgg white
FrankfurtersCheese
Olives
PeanutsCarrots
Almonds
Lemon Drops
-8
-6
-4
-2
0
2
4
6
8
-8 -6 -4 -2 0 2 4 6 8
--D
im2
--gt
-- Dim1 --gt
Configuration in space Dim1 times Dim2 (stress 0113)
54
Table 5 Standard viscosity scale as described by Szczesniak et al 1967
Scale value Product1 Water2 Light cream3 Heavy cream4 Evaporated Milk5 Maple Syrup6 Chocolate Syrup7 Mixture 1 12 cup condensed milk
amp1 tbl heavy cream8 Condensed milk
Figure 2 MDS representation of viscosity textural perceptions of standard foods (n=11)
Substitute item Reference Cardello 1982 Munoz 1986
Water
Light Cream
Heavy CreamEvaporated Milk
Maple Syrup
Chocolate Syrup
Mixture
Condensed Milk
-5-4-3-2-1012345
-5 -4 -3 -2 -1 0 1 2 3 4 5
--D
im1
--gt
-- Dim2 --gt
Configuration in space Dim1 times Dim2 (stress 0088)
55
Table 6 Standard adhesiveness scale as described by Szczesniak et al 1967
Scale value Product1 Crisco2 Velveeta 3 Cream cheese4 Marshmallow topping5 Peanut Butter
Substitute item Reference Cardello 1982 Munoz 1986
Figure 3 MDS representation of adhesiveness textural perceptions of standard foods(n=11)
Crisco
VelveetaCream Cheese
Marshmallow Topping
Peanut Butter
-4
-3
-2
-1
0
1
2
3
4
-4 -3 -2 -1 0 1 2 3 4
--D
im2
--gt
-- Dim1 --gt
Configuration in space Dim1 times Dim2 (stress 0099)
56
Table 7 Standard fracturability scale as described by Szczesniak et al 1967
Scale value Product1 Corn muffin2 Shortbread3 Graham crackers4 Melba toast5 Wheat thins6 Ginger snaps7 Peanut brittle
Figure 4 MDS representation of fracturability textural perceptions of standard foods(n=11)
Substitute item Reference Cardello 1982 Munoz 1986
Corn Muffin ShortbreadGraham Crackers
Melba toast
Wheat Thins
Ginger Snaps
Peanut Brittle
-6
-4
-2
0
2
4
6
-6 -4 -2 0 2 4 6
--D
im1
--gt
-- Dim2 --gt
Configuration in space Dim1times Dim2 (stress 0118)
57
Table 8 Standard gumminess scale as described by Szczesniak et al 1967
Scale value Product1 40 flour paste2 45 flour paste3 50 flour paste4 55 flour paste5 60 flour paste
Figure 5 MDS representation of gumminess textural perceptions of standard foods(n=11)
40 flour paste
45 flour paste
50 flour paste
55 flour paste
60 flour paste
-5
-4
-3
-2
-1
0
1
2
3
4
5
-5 -4 -3 -2 -1 0 1 2 3 4 5
--D
im1
--gt
-- Dim2 --gt
Configuration in space Dim1 times Dim2 (stress 0068)
58
Table 9 Standard chewiness scale as described by Szczesniak et al 1967
1 White bread2 Frankfurter3 Gum drops4 Licorice candy5 Caramel6 Tootsie Rolls
Figure 6 MDS representation of chewiness textural perceptions of standard foods(n=11)
Substitute item Reference Cardello 1982 Munoz 1986
White Bread
Frankfurters
Gum Drops
Licorice Candies
Caramels
Tootssie Rolls
-5
-4
-3
-2
-1
0
1
2
3
4
5
-5 -4 -3 -2 -1 0 1 2 3 4 5
--D
im2
--gt
-- Dim1 --gt
Configuration in space Dim1 times Dim2 (stress 0107)
59
REFERENCES
BERTINO M and LAWLESS HT 1993 Understanding mouthfeel attributes A
multidimensional scaling approach J Sens Stud 8101-114
BRANDT MA SKINNER EZ and COLEMAN JA 1963 Texture Profile Method
J Food Sci 28404-9
BIRNBAUM MH 1982 Problems with so-called ldquodirectrdquoscaling In Selected Sensory
Methods Problems and Approaches to Hedonicsrdquo (Ed) JT Kuznicki RA
Johnson and AF Rutkievic ASTM STP 773 p 32 American Society for
Testing and Materials
CARDELLO AV MALLER O KAPSALIS JG SEGARS RA SAWYER FM
MURPHY C and MOSKOWITZ HR 1982a Perception of texture by trained
and consumer panelists J Food Sci 471186-97
CARDELLO AV MATAS A and SWEENEY J 1982b The Standard Scales of
Texture Rescaling by Magnitude Estimation J Food Sci 471738-1740 1742
CIVILLE GV and SZCZESNIAK AS 1973 Guidelines to training a texture profile
panel J Text Stud 4204-223
CIVILLE GV and LISKA IH 1975 Modifications and applications to foods of the
General Foods sensory texture profile techniques J Text Stud 619-31
DREWNOWSKI A 1984 New techniques multidimensional analyses of taste
responsiveness Int J Obesity 8599-607
HELLEMANN U TUORILA H SALOVAARA H and TARKKONEN L 1987
Sensory profiling and multidimensional scaling of selected Finnish rye bread Int
J Food Sci Technol 22693-700
60
GENERAL FOODS CORP 1967 Sensory Texture Profiling
LAWLESS HT and GLATTER S 1990 Consistency of multidimensional scaling
models derived from odor sorting J Sens Stud 5217-30
LAWLESS HT SHENG N and KNOOPS SSC 1995 Multidimensional scaling of
sorting data applied to cheese perception Food Qual Pref 691-8
McDANIEL MR and SAWYER FM 1981 Preference testing of whiskey-sour
formulations Magnitude estimation versus the 9-point hedonic J Food Sci
46182
MOSKOWITZ HR 1972 Psychophysical measures of texture JText Stud 3135-
45
MOSKOWITZ HR and KAPSALIS JG 1975 The texture profile its foundations
and outlook J Text Stud 6157-166
MOSKOWITZ HR 1976a Psychometric analysis of food aromas by profiling and
multidimensional scaling J Food Sci 41567-71
MOSKOWITZ HR 1976b Multidimensional scaling of odorants and mixtures
Lebensm-Wiss Technol 9232-8
MOSKOWITZ HR 1977 Psychophysical and Psychometric approaches to sensory
evaluation Crit Rev Food Sci Nutr 441-79
MOSKOWITZ HR 1982 Utilitarian benefits of magnitude estimation scaling for
testing product acceptability In In Selected Sensory Methods Problems and
Approaches to Hedonicsrdquo (Ed) JT Kuznicki RA Johnson and AF Rutkievic
ASTM STP 773 p 11 American Society for Testing and Materials
61
MUNOZ AM 1986 Development and application of texture reference scales J Sens
Stud 155-83
VICKERS Z 1983 Magnitude estimation vs category scaling of the hedonic quality of
food sounds J Food Sci 481183-1186
SCHIFFMAN S REYNOLDS ML and YOUNG FW 1981 Introduction to
multidimensional scaling 1st Ed New York Academic Press 413 p
SCHIFFMAN S 1976 Multidimensional Scaling A useful tool to measure flavor
Cereal Food World 2164-68
SZCZESNIAK AS BRANDT MA and FRIEDMAN HH 1963 Development of
standard rating scales for mechanical parameters of texture and correlation
between the objective and the sensory methods of texture evaluation J Food Sci
28397-403
SZCZESNIAK AS 1963 Classification of textural characteristics J Food Sci
28385-9
SZCZESNIAK AS 1975 General Foods texture profile revisited-ten years
perspective J Text Stud 65-17
ZRAICK RI LISS JM DORMAN MF and CASE JL 2000 Multidimensional
scaling of nasal voice quality J Speech Hear Res 43989-96
62
Chapter Three
Relationship between Instrumental and Sensory Determination of
Apple and Pear Texture
MAITE A CHAUVIN1 CAROLYN ROSS1 4 MARVIN PITTS2
EUGENE KUPFERMAN3 and BARRY SWANSON1
1Food Science and Human Nutrition
2Biological Systems Engineering
3WSU Wenatchee TFREC
Washington State University
Pullman WA 99164-6376 USA
4Corresponding author Dr Carolyn Ross
Food Science and Human Nutrition
Washington State University Pullman WA 99164-6376 USA
Tel 1-509-335-2438
Fax 1-509-335-4815
Email cfrosswsuedu
APPLE AND PEAR TEXTURE
Journal Section Sensory and Nutritive Qualities of Food
63
ABSTRACT
The relationship between compressive forces tensile forces and sensory analyses
of apple and pear texture was evaluated A total of twenty-seven sensory panelists were
trained to assess a wide variety of texture attributes in apples and pears including
crispness hardness fracturability juiciness and chewiness Apples from 2005 and 2006
harvest years and pears from the 2006 harvest year were evaluated by a trained sensory
panel The instrumental tests used to evaluate fruit texture were the Guss fruit texture
analyzer (compression forces) and the Sinclair iQtrade system for both apples and pears
Tensile determinations were obtained using a unique method employing both tensile and
compression elastic modulus of the fruit tissue Significant correlations (r = 080 to 090)
among the sensory texture attributes of crispness hardness and fracturability for apples
and pears was observed The correlations between juiciness and hardness differed for
apples (r = 065 to 080) and pears (r = -032) Hard apples and soft pears were perceived
as the juiciest fruits among all firmness levels When correlating sensory to instrumental
determinations the Sinclair iQtrade System texture assessment provided an acceptable
determination of apple hardness (r = 079 to 082) Guss pressure sensor provided
significant determination of apple (r = 078 to 083) and pear (r = 083) hardness Tensile
determinations predicted crispness in apples (r = 088) and pears (r = 085) well A
combination method of compressive and tensile determinations may offer the most
accurate prediction of textural properties of apples and pears
Key Words Apples pears sensory evaluation Sinclair iQtrade System Guss Fruit
Texture Analyzer tensile tests
64
INTRODUCTION
Consumers of fresh apples and pears consider fruit quality more important than
price in making purchase decisions (Market Review 1996) Fruit quality incorporates
sensory attributes such as appearance flavor aroma and texture Of these quality
attributes textural characteristics exert a strong influence on fruit acceptability Daillant-
Spinnler and others (1996) observed that in apples the texture attributes of hardness and
juiciness were the most important to consumers Using preference mapping Daillant-
Spinnler and others (1996) confirmed that purchase intent of apple consumers in the
United Kingdom tended to fall into two groups consumers that preferred hard and sweet
apples or consumers that preferred juicy and acidic apples Jaeger and others (1998)
reported that soft and mealy apples were liked less than hard and non-mealy apples
Numerous other studies also confirmed the importance of texture to consumer
acceptability of apples (Corrigan and others 1997 Thybo and others 2003) Turner and
others (2005) observed that participants preferred a sweet pear with flavor The most
important quality factors recognized by consumers were texture tartness and sourness
and juiciness Consumer attitudes and attention to apple and pear texture cannot be
ignored and are of critical importance to food marketers
Comparative and quantitative assessment of apple and pear texture involves
instrumental and subjective sensory determinations (Harker and others 1997) Sensory
determination of texture is very important in food quality because no instrumental
determinations are adequately developed to replace human evaluation Sensory
evaluation continues to be the gold standard by which the successes of instrumental
determinations are evaluated (Bourne 2002) Instrumental quality control methods
65
designed to evaluate texture are often difficult to implement because of the challenges
associated with correlating instrumental rheological determinations to perceived sensory
attributes or acceptability (Kapsalis and Moskowitz 1978)
The speeds measured during chewing are faster that those used during
instrumental testing of food Masticatory speeds and duration may result in shear
thinning that may not be replicated using instruments of lower speeds For this reason
alone textural determinations made using instruments may not represent the events
occurring in the mouth (Harker and others 1997) According to Harker and others
(2002) a reliable relationship between objective instrument-based and subjective sensory
methods is not always feasible However because of practical concerns such as the
time expertise and costs associated with sensory evaluation instrumental analysis is
often employed Many empirical and imitative instrumental tests were developed to
potentially correlate with sensory texture descriptors (Paoletti and others 1993 Peleg
1993 Harker and others 2002 Shmulevick and others 2003) However the entire
complex of actions that occur during mastication cannot be determined completely by
instruments There is no instrument available containing the complexity sensitivity and
extent of mechanical motions in the mouth or that can appropriately change the speed and
mode of mastication in response to the sensations received during the previous chew
(Bourne 2002)
Instrumental determinations of fruit texture such as Texture Profile Analysis
(TPA) are the accepted foundation of fruit quality assessment In apples many studies
demonstrate satisfactory relationships between sensory texture attributes such as firmness
and crispiness and instrumental texture measurements including TPA Kramer shear
66
disk compression vibration and tension instruments (Harker and others 1997) Puncture
tests using instruments such as the penetrometer are the most widely used instrumental
texture methods in the apple industry (Harker and others 1997) Puncture tests determine
the force required to push a cylindrical probe with a convex tip into the flesh of the fruit
Even with extensive replication of the penetrometer ambiguity exists in the literature as
to the relevance of penetrometer determinations as predictors of perceived apple firmness
(Abbott and others 1976 Bongers 1992 Harker and others 1996)
In response to the need to develop an instrumental determination of texture with a
strong correlation to sensory evaluation a new methodology was developed whereby the
tensile properties of apples and pears were measured Analysis of apple tissue failure
during biting or cutting with a knife suggests that dominant failure mode is a combination
of tensile and shear failure resulting in the wedge action of the knife blade or teeth One
difficulty associated with tensile properties determination is food manipulation during
measurement Previous research in tensile determination was dependent on securely
fixing both ends of a fruit tissue in the instrument designed to apply the test Tensile
determination was achieved using clamps (Schoorl and Holt 1983) cutting tissue into a
shape with slots between sets of claws (Stow1983 Harker and Hallet 1992) or by gluing
(Harker and Hallet 1994) However the short amount of time available to mount and test
the tissue before the tissue decay begins and the amount of moisture loss proved to make
tensile determinations very difficult
A new method to determine tensile properties based on recording the force
deflection values and compressive elastic modulus to determine the tensile elastic
modulus and failure stress in fruit is proposed To assess the usefulness of this method
67
comparisons between results from the tensile determinations and sensory evaluation of
texture were performed Therefore the objective of this study was to evaluate the new
method and instrumentation of tensile properties and compare the results with human
texture perception (trained texture panel) puncture test (Guss pressure sensor) and non-
destructive test (Sinclair) Specifically the relationships between tensile material
properties and hardness and human sensory perception of apples and pears were studied
To determine the most effective instrumental parameter for prediction of apple and pear
texture the relationships between the sensory textural attributes of apples and pears were
also examined
MATERIALS AND METHODS
Fruit Selection
lsquoRed Deliciousrsquo lsquoGranny Smithrsquo lsquoPink Ladyrsquo lsquoCameorsquo and lsquoGalarsquo apples
(Wenatchee WA) from selected sources were harvested in 2005 and 2006 at commercial
maturity Harvest times varied from mid-September to early November lsquoAnjoursquo
lsquoBartlettrsquo and lsquoBoscrsquo pears (Wenatchee WA) were harvested in 2006 To effectively
compare the performance of analytical methods to sensory measurement determinations
apples and pears with a diverse range of textures were presented to the sensory panel
The range of apple and pear textures was generated through use of a number of selected
cultivars of each fruit and selected maturity levels
Harvested apples were sorted into three predetermined groups soft (lt 11 lb)
intermediate (14-16 lb) and hard (gt18 lb) as identified by the Fruit Texture Analyzer
The range of apple firmness was identified as the apples were placed into storage at
68
harvest from values seen historically in hard and soft cultivar lots The range of hardness
in the harvested pears was adjusted by holding the pears at room temperature (22degC) for a
selected number of days (4 6 8 days or more) prior to evaluation Pears were
categorized in three selected groups for soft (lt5 lb) intermediate (9-12 lb) and hard (gt 15
lb)
Apple or pear firmness was evaluated using the nondestructive method Sinclair
iQtrade (Sinclair Systems International- Fresno CA) and a destructive method
computerized Fruit Texture Analyzer (Guss Strand Western Cape South Africa)
Sensory Panel
The sensory panel was composed of ten panelists in 2005 and seventeen panelists
in 2006 all between the ages of 21 and 62 Panelists were recruited from the
WSUPullman community The panel was composed of two males and eight females in
2005 and three males and fourteen females in 2006 The panelists were regular apple and
pear consumers (at least once a week) All panelists signed an Informed Consent Form
and the sensory evaluation protocols were approved by the Washington State University
Institutional Review Board for human subjects participation Panelists were screened for
dental problems and other conditions that may have affected their performance in this
panel A minimum amount of information on the nature of the study was provided to
reduce potential bias panelists were informed they were expected to assess the texture of
apples and pears
Sensory Panel Training
The panelists performed the Texture Profile Method following the procedures of
texture profile analysis described in Civille and Szczesniak (1973) The texture attributes
69
were selected based upon previous literature (Paoletti and others 1993) Panelists were
trained to recognize apple texture attributes of hardness juiciness crispness and
fracturability as defined in Table 1 In 2005 the panelists were also trained to recognize
chewiness however chewiness attribute was excluded from evaluations in 2006 as it did
not yield significant results in the 2005 study In 2005 the sensory properties of apples
were evaluated by biting or chewing in an orientation parallel to the core of the fruit In
2006 sensory properties of apples and pears were evaluated by biting or chewing the
fruit in an orientation perpendicular to the core of the fruit Published texture scales
(Table 2) were used to train the selected texture attributes Panelists were trained to
recognize attributes using specific evaluative techniques (Table 3) and to assign intensity
ratings on a 15 cm line scale indented 1 cm at both ends of the line Fruits of selected
texture maturities and selected cultivars were used for training Panelists trained with
selected apple cultivars may more clearly focus on texture attributes of the fruit
Panelists received 30 to 40 hours of training each year learning the definition and
technique for each texture descriptor with the goal of reducing panelist variability and
increasing reliability Validity of the panel was assessed by analyzing the number of
correct responses over time Reliability was assessed by using duplicate test fruits and
replicating the tests Panelists were provided with feedback of individual and group
evaluations following each training session and additional training was provided if
necessary
Firmness Evaluation of Fruit
Apples and pears were equilibrated at room temperature for one day prior to
testing Firmness determinations were performed on the whole apple or pear with the
70
Sinclair iQtrade system (Sinclair Systems International- Fresno CA) The results were a
mean of three replications Fruit firmness was also determined on two peeled sides of
each fruit (sunny and shady) using a Fruit Texture Analyzer (Guss Strand Western
Cape South Africa) Results were expressed as lb of pressure and the mean value of the
two replicates was recorded
Sensory Panel Evaluations
Following apple or pear groupings for hardness by instrumental determinations
apples or pears from the soft intermediate and hard groupings were halved Half of the
fruit was utilized for tensile property determination while the other half was utilized for
sensory evaluation The apples or pears were labeled such that the tensile data and the
sensory data for each apple or pear were correlated The fruit half that was utilized in the
sensory testing was split in half Two fruit quarters were obtained from each fruit half
and presented to two panelists thus each panelist was presented with frac14 of the apple for
evaluation During each formal evaluation session panelists were presented with six
quarters of apples or pears Three replicated sessions were conducted over one week
with each session at a similar time each day Within each session each apple or pear
grouping (soft intermediate and hard) was evaluated twice in a randomized complete
block design (3 x 2 x 3 = 18 fruit quarters)
Sensory evaluation took place in individual sensory booths equipped with laptop
computers for entering and recording data The apple quarters were randomly presented
to the panelists at room temperature Apple quarters were identified using three-digit
codes and presented one at a time to panelists The fruits were scored for intensity of
each texture attribute using a 15 cm unstructured line scale with an indent 1 cm at the left
71
end of the scale corresponding to the lowest intensity (0 cm= extremely low) and an
indent 1 cm at the right end corresponding to the highest intensity (15 cm=extremely
high) Evaluations were conducted under normal light conditions Panelists were
presented with water and expectoration cups to cleanse the palate between fruit A knife
was provided to peel each fruit quarter
Results were collected and analyzed using Compusense 60 software (Guelph
ON) and sensory data were quantified by determining the distance in cm of the mark
along the line
Instrumental Analysis
Tensile properties were determined using a new methodology developed by Pitts
and others (httpwwwbsysewsueduMainPeoplefacultypittshtm) Tensile properties
were determined through a destructive test in which a slab of fruit tissue was removed
from the apple or pear and placed in a bending apparatus The bending created a
combination of compressive and tensile loads on the fruit A second tissue slab was
removed from the apple or pear to determine the compressive elastic modulus required to
determine the tensile material properties from the bending test During the bending test
the force applied and the deflection of the block were recorded in triplicate The force
and deflection values were utilized together with the compressive elastic modulus to
determine the tensile elastic modulus and failure stress of each fruit slab In the first
harvest year the tensile properties were determined in an orientation parallel to the core
of the fruit In the second harvest year tensile properties were evaluated in an orientation
perpendicular to the core (for apples and pears)
72
Data Analysis
The sensory data were subjected to two-way analysis of variance (ANOVA) using
panelist and firmness grouping as the main effects The interaction between panelists and
firmness levels were also determined for evaluation of crispness hardness fracturability
juiciness and chewiness The instrumental data was subjected to a one-way ANOVA to
determine how well the instrument differentiated the apples and pears among the three
firmness groupings Tukeyrsquos HSD was calculated to interpret the significant differences
among selected fruit firmness and sensory texture attributes (Version 753 XLSTAT
Addinsoft France) Significance was predetermined at p lt 005 Correlation analysis
was conducted to identify correlations between sensory texture and instrumental
determinations Principal component analysis was applied to sensory and instrumental
terms as a function of procedure means to compare sensory and instrumental methods
differentiation of apple and pear texture (Version 753 XLSTAT Addinsoft France)
RESULTS AND DISCUSSION
Sensory attribute ANOVA results for apple firmness groupings characterization
as determined by instrumentals determinations panelists and interaction between apples
and panelists are presented in Table 4 Differences among panelists and interaction
between apples and panelists were not significant (pgt005) This reveals consistency
among panelists and a small level of error In 2005 there were no significant differences
between intermediate and hard apples for selected texture sensory parameters However
significant textural differences between the apples were observed for the selected sensory
parameters of crispness hardness fracturability and juiciness in the 2006 cultivars
73
Panelists were able to differentiate apples harvested in 2006 based on firmness level
(Figure 1)
A logarithmic relationship between the physical properties of apples and
associated sensory response is observed in our 2005 data When apples are soft the
consumers might be expected to be more sensitive to texture differences than available
instruments are capable of determining When apples are hard the ability of consumers
to sense texture differences may decrease due to fatigue and thus instrumental
determination is more reliable than the consumer at discriminating between hard and very
hard fruit (Harker and others 1998) Figure 2 presents a summary of panelistsrsquo ability to
distinguish between soft and hard apples from the 2005 and 2006 combined harvest
years However differentiating between intermediate to hard apple cultivars was more
difficult than differentiating between soft and hard apples PC1 describes 9647 of
variation and is primarily defined by soft intermediate and hard firmness PC2 describes
only 353 of the variation and is primarily defined by intermediate firmness Similar
patterns are observed for pears in 2006 (Figure 4) Increased panelists training resulted in
a significant improvement in differentiating between intermediate and hard apples as
observed in the 2006 results
Table 5 presents the two-way ANOVA sensory attribute F values for pear texture
parameters panelists and interaction between pears and panelists Significant differences
were observed between pears for all attributes with the exception of juiciness indicating
that the sensory training received was adequate and panelists were able to differentiate
pears with selected firmness groupings (Figure 3) Significant differences were not
74
observed among the panelists demonstrating consistency within the panel Also no
significant interactions were observed among pears and panelists for selected attributes
Table 6 and Table 7 present the one-way ANOVA results of instrumental
determinations and relationships with apple and pear groupings respectively
Significant differences between apple and pear groupings were observed indicating that
selected instrumental determinations differentiated between soft intermediate and hard
apples and pears Instrumental determinations were originally selected to characterize the
apples and pears and the objective texture assessment of harvested apples and pears
supported the initial groupings
Correlation matrices for sensory texture attributes of apples are presented in Table
8 Strong correlations (rgt 080) were observed among crispiness hardness fracturability
and juiciness for apples harvested in 2005 Chewiness assessment resulted in weak
correlations with the other sensory attributes indicating that was not a strong predictor of
apple firmness Thus chewiness was removed from the apple texture profiling in 2006
In the 2006 harvest year correlations between sensory attributes were slightly smaller
especially the juiciness correlation to crispness hardness and fracturability as compared
to apples harvested in 2005
Correlation matrices for textural sensory attributes for pears are presented in
Table 9 Strong correlations (r gt 086) were observed among crispness hardness and
fracturability of pears However juiciness of pears was weakly correlated to crispness
hardness and fracturability sensory texture attributes These observations demonstrated
that the mechanism for releasing juice in the mouth is not the same among apples and
pears with the release of cell fluids depending upon the physiology of the fruit
75
Harker and others (2006) observed that juice release in apples is dependent on the
breakdown of individual cells and varies between firm and soft apples In firm apples
tissue fracture is associated with breakage of individual cells and results in the release of
cytoplasm fluids In soft apples fracture occurs as a result of cell-to-cell debonding
Individual cells do not always break open and release their contents and this result in a
mealy apple Harker and othersrsquo (2006) observations are supported by the present study
for both harvest years of apples as an increase in juiciness was observed with an increase
in apple firmness Pears behaved differently from apples as evaluated by the sensory
panel in that increased fruit firmness resulted in a small amount of juice released from
the fruit The relationship between firmness and juice release for pears is attributed to
cell-to-cell debonding and little juice is released from cells Soft pear texture is
associated with breakage of individual cells resulting in the release of juice and often a
juicy pear (Harker and others 1997) Differences between apples and pears in the way
juice contents are released may be attributed to fruit physiology and starch hydrolysis
during ripening
Correlation analysis of the degree of association between instrumental and
sensory determinations of apples is provided in Table 10 Large positive or negative
values indicate a strong association Strong to moderate correlations were observed
among the Guss Sinclair and compressive elastic modulus and the sensory attributes of
crispness hardness fracturability and juiciness Weak correlations were observed
between the tensile elastic modulus and selected sensory texture attributes in 2005
Strong correlations were observed between the Guss Sinclair compressive elastic
modulus tensile elastic modulus and the sensory attributes of crispness hardness and
76
fracturability in 2006 Guss Sinclair and compressive elastic modulus provided
determinations that did not significantly differ (p gt005) in their relationship to sensory
attributes for both harvest years However tensile elastic modulus determinations
differed significantly (p lt 005) between apples from 2005 and 2006
An increased predictability of apple crispness hardness and fracturability was
observed in 2006 Also small variability in correlations between instrumental and
sensory determinations was observed in apples between both harvest years In 2005
correlations between the Sinclair and the Guss determinations and sensory attributes were
higher than the 2006 correlations This variability may be attributed to structural
differences in selected varieties of apples and the different location of fruit harvest when
collecting the fruit Harker and others (2002) suggested that possible reasons for the
range of correlations obtained over different harvest years include the range of firmness
of fruit presented to panelists the variability between the texture of apples at the point of
instrumental determination and region of the fruit eaten by each panelist and the range of
sensory acuities and cognitive abilities of individual panelists Paoletti and others (1993)
also suggested that the mechanical and texture characteristics of apples and pears are
influenced by the structural features of the flesh and are affected by storage conditions
that result in great structural variability
Correlation analysis of the degree of association between instrumental and
sensory determinations for pears is provided in Table 11 Strong correlations were
observed between the Guss tensile elastic modulus and the texture sensory attributes of
crispness hardness and fracturability of pears Determinations made using the Sinclair
and the average elastic modulus by compression demonstrated poor correlations for
77
predicting sensory texture attributes in pears Evaluation of juiciness was negatively and
poorly correlated to instrumental determinations
Tensile elastic modulus varied significantly between apples from the 2005 and
2006 harvest years Differences of tensile determinations between harvest years may be
attributed to the distinction in how the measurement was made between the two years In
2005 the tensile elastic modulus and failure modulus were determined in a direction
parallel to the core line However in 2006 the determinations were perpendicular to the
core line due to redesign of the experimental technique Sensory evaluation techniques
and training did not differ between harvest years Tensile material properties are highly
orthotropic in that the properties change with orientation of the tissue with respect to the
core line of the fruit Paoletti and others (2003) observed that significant relationships
between flesh density and stiffness measured in torsion of apples is limited to radial
orientation (perpendicular to the core line) and not to the tangential orientation of the
apples (parallel to the core)
The current study results affirmed Paolettirsquos (2003) observations Strong
correlations of tensile determinations and crispness for apples and pears were observed
when samples were taken perpendicular to the core line as opposed to parallel to the core
line These observations are associated with the fact that tissue failure from biting with
the front teeth is crack-related Tensile material properties play a dominant role when a
crack propagates and the length of the crack propagation In the current study
fracturability and hardness were determined with the molars where compressive material
properties dominated The observations indicate that tensile material properties are
78
correlated to compressive properties and compressive properties are correlated to
fracturability and hardness
Fruit firmness or strength is a function of the mechanical properties of the cell
wall cell turgor and bonding among cells Another factor that impacts fruit firmness is
the contents of the cell Cell strength is a hydrostatic phenomenon that is diminished in
the reduction or absence of cell contents (Harker and others 1997) Studies on fruits
using pressure probes as a measure of compressive forces demonstrate that the cell wall
elastic modulus increases with increasing turgor pressure in the cell (Harker and others
1997) The results indicate that tensile material properties in fruits are attributed to the
strength of the pectin bonds between cells and the cell wall strength The compressive
material properties are attributed to the turgor pressure in the cell and to a lesser extent
on pectin bonds and cell wall strength Under selected storage environments the fruit
may mature without noticeably changing cellular turgor pressure
An advantage of tensile tests to assess fruit texture is the opportunity to determine
the mechanism of tissue failure through the examination of the fracture surface in fruit
(Harker and others 2002) There are three forms of tissue failure cell fracture cell
rupture and cell-to-cell debonding (Harker and others 1997) Harker and others (2002)
studies demonstrated that cell fracture was dominant in high firmness apples (gt66 N) cell
rupture dominated in intermediate firm apples (45 to 66 N) and cell-to-cell debonding
dominated in low firmness apples (lt 39 N)
De Belie and others (2000) observed a curvilinear relationship between pear
firmness and the tensile strength of cells demonstrating variation of mechanical
properties of a population of cells versus individual cells The compression and shear
79
properties of the cell population is evaluated in puncture tests of whole fruits while
during tensile testing the strength of thin layers of individual cells is determined The
strength of the weakest cell may define the strength of the entire fruit in tensile
determinations Generally failure in uniaxial compression of fruit is associated with an
increase in turgor pressure involving an increase of volume in the cells and rupturing of
cell walls Rupture during tension involves breakage of the cell walls andor cell-to-cell
debonding Compressive properties may be relevant to understanding factors affecting
the development of bruises in apples and pear while tensile determinations may be
closely related to biting and chewing of fruit
CONCLUSIONS
Determination of texture provides an indication of apple and pear maturity and
acceptability and is an integral part of routine fruit quality evaluation Sensory results of
apple and pear texture indicated high correlations among the sensory texture attributes of
crispness hardness and fracturability for apples and pears Disparity in juiciness
perceptions in apples and pears was attributed to the dissimilarity in cell structure When
correlating sensory evaluation to instrumental determinations both the Sinclair iQtrade
System and the Guss pressure sensor provided a reasonable predictor of apple hardness
Most of tensile properties in apples and pears have potential in predicting crispness but
are highly dependent on the orientation of the fruit A combination approach assaying
with an instrument to determine compressive and tensile properties provides the most
accurate prediction of apples and pear textural properties compared to any existing
method
80
ACKNOWLEDGMENTS
Funding for this research was provided by the Washington Tree Fruit Research
Commission (1719 Springwater Wenatchee WA 98801)
81
Attributes DescriptionCrispness Crispiness is primarily an acoustical sensation that
is detected by the ear during the fracturing of crisp foods
HardnessFirmness Hardness is the force required to bite completely through sample placed between molars
Fracturability Fracturability is the force with which sample ruptures when placing sampbetween molars and biting completely down at a fast rate
Juiciness Juiciness is the amount of juice released on mastication
Chewiness Chewiness is defined as the energy required masticating a solid food product to a state ready for swallowing (only in spring)
Table 1 Apple and pear texture attributes and descriptors as evaluated by the trained texture panel
l
82
Table 2 Texture standards used for the evaluation of texture sensory attributes
Scale value Product Brand or Type Manufacturer Sample size Temp
1 Chewy cookies Chips Ahoy Nabisco 1 cookie room
5 Chizz Sticks Cheez-it crackers The Sunshine Biscuit Co 1 piece room
10 Potato Chips Miss Vickis Miss Vickis 1 piece room
Scale value Product Brand or Type Manufacturer Sample size Temp
1 Cream Cheese Philadelphia Kraft Foods 1 cm cube 45-55 ordmF
2 Egg white hard cooked (5 min) 1 cm tip room
3 Frankfurters large uncooked Oscar Mayers Beef 1 cm slice 50-65 ordmF
4 Cheese mild Cheddar Kraft Foods 1 cm cube 50-65 ordmF
5 Olives stuffed Safeway 1 olive pimento removed room
6 Peanuts cocktail type in vacuum tin Planters Peanuts 1 nut room
7 Carrots fresh uncooked 1 cm slice room
8 Almonds 1 nut room
9 Hard Candy lemon drops Safeway 1 piece room
Substitute item Reference Cardello et al (1982) Munoz (1986)
1 Corn muffin made from mix Jiffy 1 cm cube room
2 Shortbread Shortcake Keebler 1 cm cube room
3 Graham crackers Nabisco National Biscuit Corp 12 square room
4 Melba toast plain Old London 12 square room
5 Wheat thins Nabisco National Biscuit Corp 1 cm square room
6 Ginger snaps Nabisco National Biscuit Corp 12 square room
7 Peanut brittle candy part Safeway 12 square room
1 White bread fresh center cut Safeway 1 12 cm cube room
2 Frankfurter large uncooked skinless Oscar Mayers Beef 1 12 cm cube 50-70 ordmF
3 Gum drops spice drops Safeway 1 piece room
4 Licorice candy red vines American Licorice Co 1 piece room
5 Caramel Kraft 12 piece room
6 Tootsie Rolls midget size Sweet Co of America 1 piece room
Standard Juiciness Scale (10 = most juicy all raw)
Scale value Product
0 Banana
1 Carrots
2 Mushroom
3 Snap Bean
4 Tomatoe Wedge
5 Cucumber
6 Apple
7 Strawberry
8 Honeydew Melon
9 Orange
10 Watermenlon
Szczesniak et al (1963)
Standard Chewiness Scale
Standard Crispness
Szczesniak et al (1963)
Standard Fracturability scale
Szczesniak et al (1963)
Standard Hardness Scale
Szczesniak and Ilker (1988)
83
Table 3 Sensory texture profiling technique for apples and pears
Stage I Place the fruit between front teeth Bite through the fruit by applying steady force Evaluate for
bull Crispiness amount of sound produced on the first chew Stage II Place the fruit between molars Bite through the fruit by applying steady force Evaluate for
bull Hardness force required to bite through the piece bull Fracturability force with which the cookie shatters
Stage III Chew the whole fruit Bite through the fruit by applying steady force Evaluate for
bull Juiciness amount of fluid released on the first three chews bull Chewiness number of chews required to hydrate the fruit and
bring it to a state ready for swallowing
84
Table 4 Two-way ANOVA for sensory analysis of apple texture by the trained panel in 2005 and 2006
2005 Crispness Hardness Fracturability Juiciness Chewiness Apple (S) 24167 267663 28591 83742 17299 Panelist (P) 204 13290 1164 4873 2919 Interaction (S x P) 042 1352 213 1207 225
2006 Apple (S) 13000 41600 24047 27149 NA Panelist (P) 042 1061 127 374 NA Interaction (S x P) 018 109 063 225 NA F value and significant levels from a two-way ANOVA Significant at P lt 005
85
Table 5 Two-way ANOVA for sensory analysis of pear texture by the trained panel in 2006 Crispness Hardness Fracturability Juiciness Pear (S) 33029 25855 177190 20484 Panelist (P) 1197 805 5065 6317 Interaction (S x P) 361 226 1987 2154 F value and significant levels from a two-way ANOVA Significant at P lt 005
86
Table 6 One-way ANOVA for instrumental analysis of apples in2005 and 2006
2005 Guss Sinclair AEMC AEMT Apple (S) 76539 42093 25545 2701
2006 Apple (S) 146833 128347 19576 9863 F value and significant levels from a One-way ANOVA Significant at P lt 005
87
Table7 One-way ANOVA for instrumental analysis of pears in 2006 Guss Sinclair AEMC AEMT Pear (S) 89178 13825 7987 11012 F value and significant levels from a One-way ANOVA Significant at P lt 005
88
Table 8 Correlation matrix of sensory texture attributes of apples for 2005 and 2006 Year 1 Crispness Hardness Fracturability Juiciness Chewiness Crispness 100 088 091 082 062 Hardness 088 100 092 080 064 Fracturability 091 092 100 085 061 Juiciness 082 080 085 100 058 Chewiness 062 064 061 058 100 Year 2 Crispness Hardness Fracturability Juiciness Chewiness Crispness 100 082 079 073 NA Hardness 082 100 085 065 NA Fracturability 079 085 100 067 NA Juiciness 073 065 067 100 NA
89
Table 9 Correlation matrix of sensory texture attributes of pears for 2006 Year 1 Crispness Hardness Fracturability Juiciness Crispness 100 086 087 -025 Hardness 086 100 090 -032 Fracturability 087 090 100 -028 Juiciness -025 -032 -028 100
90
Table 10 Correlation matrix of sensory attributes and instrumental determinations of apples in 2005 and 2006 Year 1 Crispness Hardness Fracturability Juiciness ChewinessGuss 072 078 074 066 064 Sinclair 081 082 083 076 065 Compressive EM 076 078 078 070 064 Tensile EM 057 062 063 053 1 Year 2 Crispness Hardness Fracturability Juiciness ChewinessGuss 078 083 076 066 NA Sinclair 075 079 074 063 NA Compressive EM 068 073 067 057 NA Tensile EM 088 078 074 069 NA EM Elastic Modulus
91
Table 11 Correlation matrix of sensory attributes and instrumental determinations of pears for 2006 Year 1 Crispness Hardness Fracturability Juiciness Guss 079 083 081 -041 Sinclair 068 071 071 -025 Compressive EM 059 061 059 -021 Tensile EM 085 079 081 -031
92
Figure 1 Apple firmness effect on sensory texture attributes for 2005
and 2006 harvest years
a
Different letters indicate significant differences (plt005) as determined by Tukeyrsquos
HSD
93
Figure 2 Apple differentiation of soft intermediate and hard apple
firmness for 2005 and 2006 combined harvest years
Soft
Intermediate
Hard
-2
-1
0
1
2
3
-4 -3 -2 -1 0 1 2 3
PC2
(35
3
)
PC1 (9647 )
94
Figure 3 Pear firmness effect on sensory texture attributes for 2006
harvest year
Different letters indicate significant differences (plt005) as determined by Tukeyrsquos
HSD
95
Figure 4 Pear differentiation of soft intermediate and hard pear
firmness for 2006 harvest year
96
REFERENCES
Abbott JA Watada AE and Massie DR 1976 Effe-gi Magnus-Taylor and Instron
fruit pressure testing devises for apple peaches and nectarines J Am Soc Hort
Sci 101698-700
Bongers AJ 1992 Comparison of three penetrometers used to evaluate apple
firmness Washington State University Tree Fruit Postharvest J 37-9
Bourne M 2002 Sensory methods of texture and viscosity measurement Ch 7 In
Food Texture and Viscosity Concept and Measurement 2nd Ed Academic Press
Geneva NY
Cardello AV Matas MA and Sweeney J 1982 The Standard Scales of Texture
Rescaling by Magnitude Estimation J Food Sci 47 1738-1740 1742
Civille GV and Szczesniak AS 1973 Guidelines to training a texture profile panel J
Texture Stud 4 204-223
Corrigan V Hurst L and Boulton G 1997 Sensory characteristics and consumer
acceptability of lsquoPink Ladyrsquo and other late-season apple cultivars New Zeal J
Crop Hort 25 375-383
Daillant-Spinnler B Macfie HJH Beyts PK and Hedderley D 1996 Relationships
between perceived sensory properties and major preference directions of 12
varieties of apples from the southern hemisphere Food Qual Prefer 7 113-126
DeBelie N Hallett IC Harker FR and Baerdemaeker J 2000 Influence of ripening and
turgor on the tensile properties of pears a microscopic study of cellular and tissue
changes J Am Soc Hort Sci 125(3) 350-356
Jaeger SR Andani Z Wakeling IN and Macfie HJH 1998 Consumer preference for
97
fresh and aged apples a cross cultural comparison Food Qual Pref 9 355-366
Harker FR and Hallett IC 1992 Physiological changes associated with development of
mealiness of apple fruit during storage HortSci 27 1291-1294
Harker FR and Hallett IC 1994 Physiological and mechanical properties of
kiwifruit tissue associated with texture change during cold storage J Am Soc
Hort Sci 119 987-993
Harker FR Maindonald JH and Jackson PJ 1996 Measurement of kiwifruit texture
operator and instrument differences J Am Soc Hort Sci 121 927-936
Harker FR Redgwell RJ Hallett IC Murray SH and Carter G 1997 Texture of fresh
fruit Hort Rev 20 121-224
Harker FR Hallett IC Murray SH and Carter G 1998 Food-Mouth interactions
towards a better understanding of fruit texture Acta Hort 464461-466
Harker FR Maindonald J Murray SH Gunson FA Hallett IC and Walker SB 2002
Sensory interpretation of instrumental measurements 1 texture of apple fruit
Postharvest Biol Tec 24 225-239
Harker FR Amos RL Echeverria G and Amdgunson FA 2006 Influence of texture on
taste insights gained during studies of hardness juiciness and sweetness of apple
fruit J Food Sci 71(2)S77-S82
Kapsalis JG and Moskowitz HR 1978 Views on relating instrumental tests to
sensory assessment of food texture J Texture Stud 9 371-393
Market Review 1996 UK fruit and vegetable market review 1995-1996 Fresh Fruit
and Vegetable information Bureau London
Meilgaard M Civille GV and Carr BT 1999 Descriptive analysis techniques Ch 10
98
In Sensory Evaluation Techniques 3rd Ed CRC Press Boca Raton FL
Munoz AM 1986 Development and application of texture reference scales J Sens
Stud 155-83
Paoletti F Moneta E Bertone A and Sinesio F 1993 Mechanical properties and
sensory evaluation of selected apple cultivars LWT 26 264-270
Peleg K 1993 Comparison of non-destructive and destructive measurement of apple
firmness J Agr Eng Res 55 227-238
Schoorl D and Holt JE 1983 A practical method for tensile testing of apple tissue J
Texture Stud 14 155-164
Shmulevich I Galili N and Howarth MS 2003 Nondestructive dynamic testing of
apples for firmness evaluation Postharvest Biol Tec 29 287-299
Stow J 1989 The involvement of calcium ions in maintenance of apple fruit tissue
structure J Exp Bot 40 1053-1057
Szczesniak AS Brandt MA and Friedman HH 1963 Development of standard rating
scales for mechanical parameters of texture and correlation between the objective
and the sensory methods of texture evaluation J Food Sci 28 397-403
Szczesniak AS and Ilker R 1988 The meaning of textural characteristics-
juiciness in plant food stuffs J Texture Stud 19 61-78
Thybo AK Kuhn BF and Martens H 2003 Explaining Danish childrenrsquos
preferences for apples using instrumental sensory and demographicbehavioral
data Food Qual Pref 15 53-63
Turner J Bai J Marin A and Colonna A 2005 Consumer sensory evaluation of pear
cultivars in the Pacific Northwest USA Acta Hort 671 355-360
99
Chapter Four
STANDARD SCALES FOR CRISPNESS CRACKLINESS AND
CRUNCHINESS IN DRY AND WET FOODS RELATIONSHIP
WITH ACOUSTICAL DETERMINATIONS
MAITE A CHAUVIN1 FRANK YOUNCE1 CAROLYN ROSS1 and
BARRY SWANSON12
1Food Science and Human Nutrition
Washington State University
Pullman WA 99164-6376 USA
2Corresponding author Dr Barry Swanson
Food Science and Human Nutrition
Washington State University Pullman WA 99164-6376 USA
Tel 1-509-335-3793
Fax 1-509-335-4815
Email swansonbwsuedu
STANDARD SCALES OF TEXTURE
100
ABSTRACT
To quantitatively evaluate food texture a trained panel developed rating scales for
crispness crunchiness and crackliness for dry and wet foods based on the auditory
perception of selected foods The newly developed scales were then evaluated by forty
untrained panelists and the sound perception of standard foods was assessed through the
analysis of the root mean square (RMS) of the 5 s audio waveforms and multidimensional
scaling (MDS) The RMS was highly correlated to auditory sensory perception of
crispness (r = 083 and 096) crunchiness (r = 099 and 099) and crackliness (r = 088
and 096) for dry and wet foods respectively MDS technique applied for the 40
untrained panelists was instructive in assessing auditory textural differences of naive
panelists and a good statistical instrument to graphically validate selected scales
Auditory perception of the selected foods were rated similarly using standard auditory
texture scales for crispness crunchiness and crackliness developed by the trained panel
and MDS results from the consumer panel
PRACTICAL APPLICATIONS
Crispness crunchiness and crackliness are not only important and useful
descriptors of food texture but are desirable textural qualities in many foods The lack of
consistency in the procedures used for evaluation of crunchy crispy and crackly in
sensory studies often results in confusion when training expert panels Research will
benefit textural studies through an improvement of consistent textural definitions
development of standard scales and evaluation techniques
The crispness crunchiness and crackliness scales developed and applied in the
current study represent a new potential standard frame of reference that may be used for
101
training panelists in texture parameters related to food auditory perception The scales
may be considered illustrations demonstrating full and practical ranges for each texture
attribute with regards to analyzing auditory parameters of foods The root mean square
(RMS) of the audio waveform is a reliable fast and convenient tool to analyze auditory
texture parameters in food while MDS is an effective means of analysis for comparing
auditory data generated by untrained panelists
KEY WORDS crispness crunchiness crackliness auditory perception MDS wet
foods dry foods RMS
102
INTRODUCTION
Textural properties are key drivers in food acceptability Texture in food is
perceived through a combination of visual tactile kinesthetic and auditory sensations
Crispy and crunchy properties are the main texture attributes affecting acceptability of
food with regard to auditory sensations (Roudaut et al 2002 Szczesniak 2002)
Although crispness and crunchiness are commonly used terms in sensory studies there is
little agreement among experts regarding their definitions and evaluation techniques
The association of acoustic sensations with the perception of texture was
previously studied for crisp crunchy and crackly foods (Drake 1963 Kapur 1971
Vickers and Bourne 1976 Vickers and Wasserman 1979 Vickers and Christensen
1980 Vickers 1981 1983 1984a 1984b 1987a 1987b Dacremont et al 1991 1995
Lee et al 1990 De Belie et al 2002 Luyten and Van Vliet 2006) The acoustic
sensations of a food are affected by the arrangements of cells chemical bonds fruit or
vegetable maturity and moisture (Al Chakra et al 1996) The noise production resulting
from biting is attributed to the rupture of the cell wall Few too many cells may rupture
at any point during the mastication process to produce an irregular series of sounds
resulting from crushing the cellular structure of foods (Vickers and Bourne 1976)
Cellular foods that contain only air within their cells such as biscuits or chips are
designated dry crisp foods while foods that contain fluids within their cells such as fruits
and vegetables are called wet crisp foods Edmister and Vickers (1985) believe that
although dry crisp and wet crisp foods differ in cellular composition both foods produce
similar auditory cues for crispness perception Vickers and Bourne (1976) suggested that
the mechanism of sound production for dry and wet foods is different but the consumer
103
perception while chewing either food is similar However Jowith (1974) Vickers and
Christensen (1980) and Mohamed et al( 1982) suggest that the loudness of panelistsrsquo
chewing sounds perception of crispness andor instrumental crispness determinations
may differ between dry and wet crisp foods
The sensory evaluation of crispness crunchiness and crackliness is a complex
process The use of the same descriptor in different studies with trained panelists is not a
guarantee that an equivalent sensory perception is observed For example ldquocrispyrdquo is
employed to illustrate the same parameters described by other panelists as ldquocrunchyrdquo
(Brown et al 1998 Guraya and Toledo 1996) Whether crispy and crunchy refer to a
similar sensory concept remains unresolved Seymour and Hamann (1988) and Vickers
(1981 1985) reported a strong positive correlation between crispness and crunchiness
which favors the hypothesis of two descriptors for a unique sensory perception
parameter However other research suggests that crispy and crunchy refer to different
sensory parameters (Dacremont 1991 1995) Moreover studies on crispness
crunchiness and crackliness conducted in several countries contribute additional
complexities in comparing the results (Roudaut et al 2002)
Descriptive analysis training of panelists for crispness crunchiness and
crackliness evaluation focuses on parameters such as the structure of the intact food
sounds emitted at fracture the force needed to crush the food the collapse of the food at
fracture and the appearance of pieces observed and perceived following fracture
(Roudaut et al 2002) However little agreement exists on definitions and techniques of
oral manipulation during chewing in determining crispness crunchiness and crackliness
104
Depending on the definitions (Tables 1 2 and 3) some parameters for crispy crunchy
and crackly foods are emphasized more than others (Roudaut et al 2002)
For acoustic studies of crisp crunchy and crackly food products two approaches
are generally followed The first acoustic approach determines the contribution of the
perception of air-conducted sounds to the sensation of crispness and crunchiness
(Christensen and Vickers 1981 Vickers 1979 1980 1981 1984a) The second acoustic
approach involves recording sounds produced during the application of force to a food to
obtain quantitative acoustic information regarding the crisp crunchy or crackly sounds
(Drake 1963 Kapur 1971 Vickers and Bourne 1976 Edmister and Vickers 1985
Vickers 1985 Seymour and Hamann 1988 Dacremont et al 1991) Acoustic
determinations are also combined with mechanical determinations (force-deformation) to
predict crispness and crunchiness (Vickers 1987 Szczesniak 1988) A combination of
acoustic and mechanical techniques more adequately describes food sound perception
than either technique alone (Vickers 1987)
The association that acoustic sensations exhibit with the perception of texture
provides the opportunity to develop a standard scale composed of crispy crunchy and
crackly food sounds that can be recorded and be free of changes with time The standard
scales will also be useful for texture comparison of foods among laboratories (Vickers
and Bourne 1976) and for descriptive analysis by trained panelists The objective of this
study was to establish a standard reference scale for selected dry and wet crisp crunchy
and crackly foods The relationship between acoustical and oral perception of crispness
crunchiness and crackliness was also developed in order to distinguish between sensory
evaluations of crispness crunchiness and crackliness sensory parameters
105
MATERIALS AND METHODS
DEVELOPMENT OF NEW TEXTURE REFERENCE SCALES
Panelists
Eight panelists from Washington State University participated in the development
of texture references for dry and wet crispness crunchiness and crackliness scales
Panelists included 8 females 21 to 63 years of age who were trained for 80 hours in a
previous study using the Texture Profile method (Civille and Szczesniak 1973)
Panelists were screened for normal hearing ability dental problems and other conditions
that may have affected their performance on the panel All panelists signed an Informed
Consent Form and the sensory evaluation protocols were approved by the Washington
State University Institutional Review Board for human subjects participation Panelists
received a small compensation for their participation in the study
Training Procedure
The first stage of training involved extensive instruction about methods and
descriptors of interest Literature regarding the techniques and definitions of crispness
crunchiness and crackliness was examined by the trained panel through a summary of
existing literature presented by the facilitator (Tables 1 2 and 3) A crispness scale
developed previously for descriptive training with dry foods (Meilgaard et al 1999) was
presented as a starting point of discussion and a modification of the scale was suggested
by the panelists in a focus group setting The facilitator took notes and the summary of
the discussion was distributed to each panelist following each session Due to the
variability in procedures and texture definitions the panelists agreed to establish a
comprehensive evaluation technique and definition of crispness crunchiness and
106
crackliness for texture evaluation of foods A variety of foods were selected for
consideration by the panelists as preliminary evaluation Foods were selected after
review of previous studies of crispness crunchiness and crackliness The objective was
to guide panelists in establishing the textural attribute of interest and standardization of
corresponding evaluation procedures to characterize crispness crunchiness and
crackliness The use of a 15 cm unstructured line scale indented 1 cm at both ends was
introduced during this stage of training Individual evaluations were marked on the
unstructured line scales anchored at the ends with the terms ldquononerdquo and ldquoextremerdquo This
rating method was used throughout the entire training period and during texture
evaluation sessions
Immediately following the initial orientation the panel met for a total of twenty
hours four hours per week for five weeks to practice the techniques developed during
the orientation training session Throughout this second stage of training the crispness
crunchiness and crackliness standard scales for dry and wet foods were developed and
definitions and evaluation techniques were discussed The development of each scale
started with a group discussion to suggest food items representing the texture
characteristic under study For the subsequent evaluations the potential reference
materials were purchased by the facilitator and evaluated by each panelist Group
discussion followed individual evaluations for each standard scale development
Consensus approval of each item and size was required before a food was accepted as a
standard Within each standard scale a range of commercial foods was selected to
develop the final standard scale Once the range of the standard scale was established
three replicate samples within a product type were evaluated Texture data for each
107
attribute were collected analyzed and uniformity and appropriateness of each food were
discussed by the panel
In the third stage of training two 2 hour sessions were held following scale
development for each standard scale The biting or chewing sounds generated by the
facilitator from each food along the newly developed standard scales were recorded in
triplicate The objective was to compare the recorded sounds generated by biting or
chewing every food on each standard scale by evaluation of the root mean square (RMS)
of all recorded sounds RMS was used as an instrumental method to compare the results
from perceptual texture assessment of the trained panel The RMS of the voltage output
was determined from the microphone which was proportional to the RMS of the sound
pressure Based on the RMS results of the recordings during subsequent sessions several
foods were eliminated by consensus of the panelists and new standard foods were
considered in order to include the entire range of intensities for every attribute When the
panelists considered that a range of standard foods was representative of a specific
intensity the food was included in the standard scale The final intensity of each
reference food on the scale was established by individual judgments followed by group
discussion to reach consensus The final foods selected for each standard scale are
presented in Tables 5 to 10
Acoustic Analysis of the Standard Scales
Foods for the developed standard scales (Tables 5 to 10) were purchased in a local
supermarket Fruits and vegetables were inspected visually and manipulated by hand to
determine freshness Sound recordings of an individual biting or chewing of the foods in
each standard scale were produced by employing the technique presented in Table 4 To
108
avoid recording the clacking of teeth when biting during the crispiness test a 158 mm
thick piece of FDA compliant silicone rubber sheet (Durometer 50A firmness) was
placed between the incisors in the mouth opposite of the food standard During both the
biting and chewing an AKG condenser microphone (model C577 Nashville Tennessee)
was held inside a Koss headphone (model Ur29 Milwaukee Wisconsin) and against the
outer ear immediately above the opening of the ear canal Chewing or biting sounds were
recorded on a personal computer using Syntrillium Cool Edit (Syntrillium Software
Corporation Phoenix Arizona) A Radio Design Labs low noise microphone
preamplifier (model STM 2 Prescott Arizona) with a Power One 24 volt linear DC
power supply (model HB24-12A) which was connected between the microphone and
the personal computer Six recordings of each food were recorded at 44100 kHz mono
in replicate and saved as 5 s ldquowavrdquo files Recorded sounds were analyzed using root
mean square (RMS) calculated from the voltage signal of the entire 5 s waveform by
means of Cool Edit program (Syntrillium Software Corporation Phoenix Arizona)
Data Analysis
Correlation analysis was conducted to identify correlations between auditory
determinations and the sensory panel evaluations Principal component analysis (PCA)
was applied to instrumental and sensory terms as a function of procedure means to
compare how the instrumental and sensory methods differentiated the texture attributes
(Version 753 XLSTAT Addinsoft France) Significance was established at p lt 005
109
CONSUMER PANEL
Panelists
Panelists were recruited from Washington State University staff students and members
of the community Panelists were screened for auditory conditions and interest in
participating in the study Minimal information about the study was given to the
panelists to reduce bias Panelists consisted of 27 women and 13 men between the ages
of 21 to 60 years All panelists signed an Informed Consent Form and the sensory
evaluation protocols were approved by the Washington State University Institutional
Review Board for human subjects participation Panelists received compensation for
participation in the study Panelists were also given a demographic questionnaire and
oral and written instructions before their participation in the study None of the panelists
expressed previous experiences with auditory evaluation of foods and were considered
naive panelists
Preparation of Recordings
The audio recordings from the acoustic analysis of the standard scales containing
minimal background noise were selected for the consumer panel
Multidimensional Scaling Test
Test foods consisted of the audio recordings representing the standard scales for
crispness crunchiness and crackliness for dry and wet foods Foods source and size of
all standard scales are presented in Tables 5 to 10 Multidimensional scaling (MDS) was
used to examine panelistsrsquo auditory perceived similarities among foods
Panelists participated in a single one hour test session Each panelist evaluated
the sound files individually in the presence of the facilitator Instructions to the panelists
110
included both an operational definition of each attribute to be presented to the panelists
(Table 4) as well as instructions on the utilization of similarity judgments scales
There were N(N-1)2 possible pairs to compare for a set of N foods in each
standard scale Panelists listened to the audio recordings through a Koss Ur29
headphones connected to a personal computer Panelists were instructed that a person
was biting or chewing a food and were asked to compare the loudness (the degree of
volume of the sound) of each pair of audio recordings
Audio recordings were presented as paired comparisons together with a ballot
asking panelists to quantitatively rate the similarity between the two audio recordings of
food being bitten or chewed A similarity 9-point scale with the words ldquoexactly the
samerdquo at the high end (9) and ldquocompletely differentrdquo at the low end (1) was presented to
the panelists Similarity judgments were formulated by writing a number describing
quantitatively the perceived similarity between each pair Once each panelist was
finished with the first comparison shehe was instructed to advance to the second
comparison A separate ballot was provided for each standard scale and all panelists
were instructed to wait one minute between each standard scale Panelists were not
permitted to go back review or change previous responses
Pairs of foods audio recordings were presented in a random order labeled with a
three digit code Each audio recording pair was analyzed once by each panelist A total
of 10 paired comparisons for crispness of dry and wet foods crunchiness of wet foods
and crackliness of dry and wet food sounds were analyzed A total of 15 paired
comparisons for crunchiness of dry food sounds were also evaluated
111
Data Analysis
One matrix was constructed from the pairwise similarity scores for each standard
scale for crispness crunchiness or crackliness of dry and wet foods for each of the forty
panelists Every cell within each matrix yielded a similarity score ranging from 1 to 9
quantifying perceived differences in auditory perception on the 9-point scale
The forty individual matrices were combined to yield one matrix for each
standard scale illustrating the mean group pairwise similarity scores Each cell within
the group matrices yielded a mean score for each standard food on every scale reflective
of the 9-point scale
Data were analyzed as similarity estimates with XLSTAT 754 (Addinsoft Paris-
France) MDS algorithm ALSCAL module for nonmetric multidimensional scaling
using the option for minimizing Kruskalrsquos stress Formula 1 two-dimensional solutions
was applied Outputs included an assessment of stress quantifying the fit between the
data and the scaling model and R2 values calculating the variability among underlying
data that accounted for the MDS solution (Zraick 2000)
RESULTS and DISCUSSION
Tables 5 to 10 present the standard scales developed for crispness crunchiness
and crackliness of dry and wet foods The standard scales include the range of intensity
of a selected textural auditory characteristic observed with biting and chewing in food
products as perceived by panelists Each point on the scale is represented by a specific
food product allowing the designation of a numerical rating to an unknown food by
comparing it to a known food Within each scale a range of specific auditory textural
112
parameters is demonstrated using foods that have the attribute under study as a major
property The advantage of a multi-food standard scale is that frequently a given
attribute is perceived differently in selected foods Converting food texture standard
scales to a one-dimensional series may be undesirable because a single dimension may
distort illustration of diversified sensory perceptions of the textural parameters (Civille
and Liska 1975) The standard scales are not intensity scales against which foods are
compared to obtain a rating Rather the standard scales are illustrations that demonstrate
the principal range of selected textural characteristics The standard scales for crispness
crunchiness and crackliness of dry and wet products are offered as a means of helping the
food researcher obtain descriptive and quantitative sensory data on textural characteristics
related to sound emitted during chewing or biting of food The use of a descriptive panel
over a compression instrument is preferred when working with masticatory sounds
because it includes changes during mastication particularly its hydration with saliva
(Dacremont et al1991)
The procedures for texture sensory evaluation must adhere to rigid testing
controls Table 4 presents the methods used in this study to assess crispness crunchiness
and crackliness Attention to preparation serving presentation biting and chewing
techniques must be standardized (Civille and Szczesniak 1973) The entire panel must
receive consistent training in the principles and evaluation methods of crispness
crunchiness and crackliness of foods Many factors may be responsible for the large
variation in crisp crunchy or crackly sounds the size shape and orientation of the food
in the mouth the amount of contact surface between the teeth and the food the degree to
which the mouth is opened variations within the food the rate and force of biting or the
113
way the food breaks down A properly trained panel will minimize variation (Vickers
and Bourne 1976) The appropriate use of auditory textural scales will yield data
reproducible among panelists panels and locations The reproducibility of the trained
panel is related to establishment of common frames of reference among panelists and
panels
The consumer study conducted was analyzed through Multidimensional Scaling
(MDS) MDS was performed for the newly developed standard scales for crispness
crunchiness and crackliness of dry and wet foods Analyses of the six standard auditory
texture scales were performed in the two-dimensional configuration The mean stress
values were small (lt01) and reflected the ability of the MDS algorithm to fit calculated
distances to the texture results in two dimensions MDS two-dimensional graphical
representation of crispness crunchiness and crackliness for dry and wet foods are
presented in Figures 1 to 6 All figures illustrate agreement with the newly developed
standard scales for all attributes Every food in the consumer MDS graphical
representation is located in a similar location as presented in all standard scales
developed by the trained panel
The first dimension in the MDS output for auditory crispness of dry foods is
attributed to the texture characteristic of crispness (Figure 1) The food items that
represented the intensity of a specific stimulus are located in similar geometrical space as
their location on the standard food texture scale The second dimension may be credited
to other auditory cues because the panelists were not trained and were considered naiumlve
consumers Similar trends were observed for crispness in wet foods (Figure 2) and
crunchiness in dry and wet foods (Figures 3 and 4 respectively) The second dimension
114
in the MDS output for crackliness in dry and wet foods (Figures 5 and 6) is attributed to
the texture characteristic of crackliness and the first dimension to other auditory cues
The consumer study confirms the perceptual differences identified by the panelists
among crispness crunchiness and crackliness The consumer results indicate that the
standard scales were appropriately developed and are useful for further training of
panelists for texture evaluation
Jowith (1974) Vickers and Christensen (1980) and Mohamed et al (1982)
suggested that sensory crispness andor instrumental crispness determination may differ
between wet and dry crisp foods The results of the current study support this theory
Figure 7 from the MDS analysis illustrates the separation on wet and dry foods along the
three attributes Panelists were able to differentiate between auditory crispness
crunchiness and crackliness and also between wet and dry foods Three independent
clusters between each texture attribute of crispness crunchiness and crackliness are
observed and within each cluster a clear distinction between dry and wet foods is seen
The difference between dry and wet foods and its relationship with auditory
perception presented in Figure 7 can be explained by the fact that most wet foods are
comprised of living cells and contribute turgidity A sound is generated whenever a
turgid cell is ruptured Strong cell walls can withstand more pressure and release more
moisture on chewing or biting producing a louder noise Soft cell walls exhibit little or
no accompanying sounds during chewing or biting therefore a decrease in sound is
observed (Vickers and Bourne 1976) The mechanism of sound production in dry foods
is different In dry foods the cells are filled with air and the cell walls are brittle The
sounds are produced from the collective breaking of individual cells when biting or
115
chewing is applied to a brittle cell wall When the cell wall bends and breaks the
residual of the cell wall and any fragments snap back to the original shape generating a
sound Loudness in dry foods is influenced by the velocity of which the broken cell wall
vibrates The decrease of cell wall stiffness resulting from an increase in moisture
content is accompanied by a decrease in sound production (Vickers and Bourne 1976)
The assessment of wet foods standard scales could be problematic during training
due to cultivar and regional differences of fruits and vegetables Szczesniak and Ilker
(1988) successfully developed a standard scale for juiciness analysis consisting of
selected fruits Using wet foods Munoz (1986) also developed standard scales for
adhesiveness to lip cohesiveness of mass adhesiveness to teeth and wetness analysis
Although work went into the selection of the foods representing the various points in
each scale in the present study some foods may not be readily available due to
seasonality or location It is feasible to substitute foods in each standard scale depending
on specific needs circumstances and availability When an appropriate food substitute is
identified it should be evaluated objectively to ensure that the food is similar to the
original reference food Evaluation is important to make certain that the food substitute
exhibits the proper intensity of the desired auditory textural characteristic (Civille and
Liska 1974)
The newly developed standard scales for crispness crunchiness and crackliness
for dry and wet foods were validated instrumentally by calculating the average power
estimated from the RMS of the voltage signal Table 11 presents strong correlations (r =
083 to 099) between the average power and sensory evaluations of crispness
crunchiness and crackliness for wet and dry foods The average RMS power is a strong
116
measure of the overall loudness of the waveform selection Vickers and Bourne (1976)
observed less total sound produced in the less crisp foods and louder sound production in
more crisp foods The difference in perceived crispness was associated with a difference
in the number of sounds produced in a given biting distance and the loudness of the
sounds produced Vickers and Christensen (1980) evaluated how crispness loudness and
firmness were perceived by panelists by both biting and chewing the food concluding
that the chewing or biting technique made no difference in the sensory judgments The
relationship between crispness and loudness suggested that crispness judgments were
more highly correlated to the auditory sensation of loudness than to the tactile sensation
of firmness Snap loud and crackly were other sensory attributes closely associated with
crispness
Moskowitz and Kapsalis (1974) Vickers (1979) Vickers and Wasserman (1980)
Vickers (1984b) Szczesniak and Kahn (1971) and Vickers (1981) produced evidence to
indicate that crispness crunchiness and crackliness are closely related attributes and are
not descriptors of one attribute alone In the current research perceptual sensory
differences among crispness crunchiness and crackliness were found (Figure 7)
Untrained panelists separated auditory sensations when judgments were made on the
basis of loudness only Vickers (1981) observed high correlations between crispness
crunchiness and hardness and between oral and auditory perception of foods Vickers
(1984a) evaluated crackliness and hardness of food under three selected conditions
normal biting and chewing with biting and chewing sounds blocked and by listening to
recorded biting and chewing sounds Vickers (1984) concluded that either oral tactile
cues or auditory cues can be used to make crackliness judgments The current study
117
research demonstrates that auditory cues are adequate to identify crispness crunchiness
and crackliness perception of foods
CONCLUSIONS
The developed standard scales for crispness crunchiness and crackliness for dry
and wet foods provide individuals interested in auditory texture evaluation a starting
point to assist in training descriptive analysis of food texture Although future
modifications in reference material attribute definition or evaluation procedures are
expected this study represents a first step in the generation of reproducible auditory
sensory data using standard scales MDS output demonstrated that crispness crunchiness
and crackliness are distinguishable sensory texture parameters belonging to selected
distinguishable concepts and can be analyzed by the sole presence of auditory cues
Also it was demonstrated that there is a perceptual difference between texture attributes
for dry and wet foods and that differentiating between both is essential for descriptive
analysis training
ACKOWLEDGMENTS
A special recognition to the expert panel from Washington State University for
their enthusiastic participation and contribution to this study C Armfield E Giesbers
MJ Hamilton P Konomos S Lee M Sanborn D Setiady
118
TABLES AND FIGURES
Table 1 Literature citations of crispness Definition Technique Reference
Relative force required to bite through the product
Biting with front teeth
Jeon et al 1975
Products that produce a higher pitched sound Biting with front teeth
Vickers 1984b
First Bite place the product between the incisors bite through and evaluate the level of higher pitched noise
Biting with front teeth
Seymour and Hamman 1988
Firm and brittle snaps easily emitting a typical sound upon deformation
NA Szczesniak 1988
The perceived relative force used by crunching the product in the mouth
Molars Onwulata and Heymann 1994
The perceived force with which the product separates into two or more distinct pieces during a single bite with the incisors An abrupt and complete failure of the product is required
Incisors first bite
Barrett 1994
Products that produce a high pitched sound that show high level of frequency higher than 5 kHz especially for air conduction sounds
Only incisors or bitten and chewed
Dacremont 1995
The amount and pitch of sound generated when the product is first bitten with the front teeth
Front teeth bite
Harker et al 1997
A combination of the noise produced and the breakdown of the product as it is bitten entirely through with the back molars
Biting with the back molars
Duizer et al 1998
Fractures in an abrupt manner after applying a relatively small force on the product
Front teeth first bite
Vincent et al 2002
Fracture in an abrupt brittle manner after applying a relatively small force on the product on the first chew with the molars
Molars second bite
Vincent et al 2002
Cracks you can force your teeth through slowly more airy than crackling
At first bite Dijksterhuis et al 2005
119
Soft sound more airy than crackling Association with fresh disintegrates into pieces smaller than when crackling
During chewing
Dijksterhuis et al 2005
A combination of the type of sound ie short snapping and longer cracking sounds and the force to bite and chew as perceived on the first bite
First bite Duizer and Winger 2006
120
Table 2 Literature citation of crunchiness Definition Technique Reference
Is the perceived hardness of a food after it is crushed and chewed in the mouth 2-3 times Also defined as the amount of force necessary to crush and grind the cube during the second and subsequent chews
Chewing with molars
Moskowitz et al 1974
Products that produce lower pitched sounds are less loud and last longer than for crisp Firm and brittle Snaps easily with typical sound
Chewing with molars
Vickers 1984b
Degree of low pitched noise (with respect to crisp sounds) but above threshold pitch considered too low
Place product between molar teeth
Seymour and Hamman 1988
Complex failure mechanism that involves repetitive deformation and fracturing of cell structure Necessary are structural subunits especially with cells with brittle cell walls Continuous fracture during chewing Sensory description the perceived intensity of repeated incremental failures of the product during a single complete bite with the molar teeth
First bite with molars
Barrett 1994
The perceived cumulative intensity of force required for repeated incremental failures of the product by chewing up to five times with the molars
Chewing with molars
Guraya and Toledo 1996
Harker et al 1997 The amount of noise generated when the product is chewed at a fast rate with the back teeth
Chewing with back teeth
Products that produce a low-pitched sound with a characteristic peak on frequency range 125 to 2 kHz for air conduction
Only incisors or bitten and chewed
Dacremont 1995
Temporal aspects of the sensory feedback during mastication are important for the crunchy sensation Independent from hardness
Chewing with molars
Brown et al 1998
121
Crunchy would be associated with a hard and dense texture that fractures without prior deformation producing a loud low-pitch sound that is repeated during several chews Crunchy is more relevant to fruits and vegetables when compared to crispness
Mainly during chewing
Fillion and Kilcast 2001
Fractures after applying a higher force on the product than for crispness
Front teeth first bite
Vincent et al 2002
Fractures after applying a higher force on the product than for crispness on the first chew with the molars
Molars second bite
Vincent et al 2002
High-pitched sound light sound long sounding During chewing Dijksterhuis et al 2005
122
Table 3 Literature citations of crackliness Definition Technique Reference
To make small sharp sudden and repeated noises
At first bite or during chewing
Vickers 1984a
Products that generate low-pitched sounds with a high level of bone conduction Discrimination between crackly and crunchy foods could be due to vibrations propagated by bone conduction that also generated vibrotactile sensations
Only incisors Dacremont 1995
Combination of sound and bite force Clip between the teeth and it breaks Crackling is harder than crispy It snaps
At first bite Dijksterhuis et al 2005
Audible for a long period during chewing bigger pieces mainly of the crust
During chewing Dijksterhuis et al 2005
123
Table 4 Technique for the evaluation of crispness crunchiness and crispness developed by seven trained panelists Crispness Place the product between the incisors (front
teeth) bite through the product and evaluate the intensity of the sound after the first bite using as near as possible the same biting rate and force for all products in the scale
Crunchiness Place products between molars bite down with low pressure (regular eating pattern) Chew product 2 to 3 times and listen to the sound produced and how the sound diminishes (intensity and duration of the sound)Place product between molars and bite once with a lot of force without grinding the products Snap down
Crackliness Place product between molars and bite once with a lot of force without grinding the products Snap down
124
Table 5 Crispness standard scale for dry foods developed by seven trained panelists Scale value Reference BrandManufacturer Sample Size
2 Rice Krispies Treats Kelloggs 16 bar 5 Fiber Rye Wasa 13 slice 8 Multigrain Mini Rice Cakes (Honey Graham) Quaker 1 cake
10 Tortilla Chips (Bite size Tostitos) Frito Lay 1 chip 15 Kettle Chips Frito Lay 1 chip
125
Table 6 Crispness standard scale for wet foods developed by seven trained panelists Scale value Reference BrandManufacturer Sample Size
0 Banana Supermarket 12 thick slice 4 Gala Apple Supermarket 12 thick slice
75 Granny Smith Apple Supermarket 12 thick slice 10 Jicama Supermarket 12 thick slice 15 Carrots Supermarket 1 mini peeled carrot
126
Table 7 Crunchiness standard scale for dry foods developed by seven trained panelists Scale value Reference BrandManufacturer Sample Size
1 Rice Krispies Treats Kelloggs 16 bar 4 Goldfish Baked Crackers Pepperidge Farm 1 cracker 7 Cheez-it Baked Snack Crackers Sunshine 1 cracker 9 Tortilla Chips (Bite size Tostitos) Frito Lay 1 chip
12 Honey Maid Graham Honey Sticks Nabisco 1 stick 15 Melba Toast Old London 12 toast
127
Table 8 Crunchiness standard scale for wet foods developed by seven trained panelists
Scale value Reference BrandManufacturer Sample Size 0 Banana Supermarket 12 thick slice 4 Gala Apple Supermarket 12 thick slice
10 Jicama Supermarket 12 thick slice 125 Banquet Baby Dill Nalley 12 thick slice 15 Green Pepper Supermarket 12 thick slice
128
Table 9 Crackliness standard scale for dry foods developed by seven trained panelists Scale value Reference BrandManufacturer Sample Size
2 Club Cracker Keebler 12 cracker 7 Multigrain Mini Rice Cakes Quaker 12 cake 9 Le Petit Beurre Tea Cookie Lu 18 square
12 Triscuit Nabisco 14 broken with the grain 15 Ginger Snap Archway 12 cookie
129
Table 10 Crackliness standard scale for wet foods developed by seven trained panelists Scale value Reference BrandManufacturer Sample Size
1 Medium Black Olives Canned 1 olive 5 Daikon Radish Supermarket 14 thick slice
75 Turnip Supermarket 14 thick slice 10 Jicama Supermarket 14 thick slice 15 Carrots Supermarket 12 mini peeled carrot
130
Table 11 Correlation between auditory recordings (average RMS) and sensory evaluation by untrained panel r Crispness Dry Foods 083Crispness Wet Foods 096Crunchiness Dry Foods 099Crunchiness Wet Foods 099Crackliness Dry Foods 088Crackliness Wet Foods 096
131
Figure 1 MDS representation of auditory crispness for dry foods
Rice Krispie Treats
Fiber Rye
Mini Rice Cakes
Tortilla Chips
Kettle Chips
-5
-4
-3
-2
-1
0
1
2
3
4
5
-5 -4 -3 -2 -1 0 1 2 3 4 5
--D
im1
--gt
-- Dim2 --gt
Configuration in space Dim2 times Dim1 (stress 0076)
132
Figure 2 MDS representation of auditory crispness for wet foods
Banana
Gala Apple
Granny Smith Apple
Jicama
Carrots
-6
-4
-2
0
2
4
6
-6 -4 -2 0 2 4 6
--D
im1
--gt
-- Dim2 --gt
Configuration in space Dim2 times Dim1 (stress 0090)
133
Figure 3 MDS representation for auditory crunchiness for dry foods
Rice Krispies Treats
Goldfish Baked Crackers
Cheez-it Crackers
Graham Honey Sticks
Tortilla Chips
Melba Toast
-5
-4
-3
-2
-1
0
1
2
3
4
5
-5 -4 -3 -2 -1 0 1 2 3 4 5
--D
im1
--gt
-- Dim2 --gt
Configuration in space Dim2 times Dim1 (stress 0087)
134
Figure 4 MDS representation of auditory crunchiness for wet foods
135
Figure 5 MDS representation of auditory crackliness for dry foods
136
Figure 6 MDS representation of auditory crackliness for wet foods
137
Figure 7 MDS representation for overall auditory crispness crunchiness and
crackliness for dry and wet foods
138
REFERENCES
AL CHAKRA W ALLAF K and JEMAI AB 1996 Characterization of brittle food
products Application of acoustical emission method J Text Stud 27 327-
348
BARRETT AH CARDELLO AV LESHER LL and TAUB IA 1994
Cellularity mechanical failure and textural perception of corn meal extrudates J
Text Stud 25 77-95
BROWN WE LANGLEY KR and BRAXTON D 1998 Insight into consumer
assessments of biscuit texture based on mastication analysis-hardness versus
crunchiness J Text Stud 29 481-497
CHRISTENSEN CM and VICKERS ZM 1981 Relationships of chewing sounds to
judgments of crispness J Food Sci 46 574-578
CIVILLE GV and SZCZESNIAK AS 1973 Guidelines to training a texture profile
panel J Text Stud 4 204-223
CIVILLE GV and LISKA IH 1975 Modifications and applications to foods of the
general foods sensory texture profile technique J Text Stud 6 19-31
DACREMONT C COLAS B and SAUVAGEOT F 1991 Contribution of the air
and bone conduction to the creation of sounds perceived during sensory
evaluation of foods J Text Stud 22 443-456
DACREMONT C 1995 Spectral composition of eating sounds generated by crispy
crunchy and crackly foods J Text Stud 26 27-43
DE BELIE N HARKER FR and DE BAERDEMAEKER J 2002 Crispness
139
judgments of royal gala apples based on chewing sounds Biosystems Eng 81
297-303
DIJKSTERHUIS G HANNEMIEKE L DE WIJK R and MOJET J 2005 A new
sensory vocabulary for crisp and crunchy dry model foods Food Qual Pref 18
37-50
DRAKE BK 1963 Food crushing sounds- An introductory study J Food Sci 28
233
DUIZER LM CAMPANELLA OH and BARNES GRG 1998 Sensory
instrumental and acoustic characteristics of extruded snack food products J
Text Stud 29 397-411
DUIZER LM and WINGER RJ 2006 Instrumental measures of bite forces
associated with crisp products J Text Stud 37 1-15
EDMISTER JA and VICKERS ZA 1985 Instrumental acoustical measures of
crispness in foods J Text Stud 16 153-167
FILLION L and KILCAST D 2001 Consumer perception of crispness and
crunchiness in fruits and vegetables Food Qual Pref 13 23-29
GURAYA HS and TOLEDO RT 1996 Microstructural characteristics and
compression resistance as indices of sensory texture in a crunchy snack product
J Text Stud 27 687-701
HARKER FR REDGWELL RJ HALLET IC and MURRAY SH 1997 Texture
in fresh fruit Hort Rev 20 121-224
140
JEON IJ BREENE WM and MUNSON ST 1975 Texture of fresh pack whole
cucumber pickles correlations of instrumental and sensory measurements J
Text Stud 5 399-409
JOWITT R 1974 The terminology of food texture J Text Stud 5 351-358
KAPUR KK 1971 Frequency spectrographic analysis of bone conducting chewing
sounds in persons with natural and artificial dentitions J Text Stud 2 50-61
LEE III WE SCHWEITZER MA MORGAN GM and Shepherd DC 1990
Analysis of food crushing sounds during mastication total sound level studies J
Text Stud 21 165-178
LUYTEN H and VAN VLIET T 2006 Acoustic emission fracture behavior and
morphology of dry crispy foods a discussion article J Text Stud 37 221-
240
MEILGAARD M CIVILLE GV and CARR BT 1999 The Spectrumtm descriptive
analysis method Ch 11 In Sensory Evaluation Techniques 3rd Ed CRC Press
Boca Raton FL
MOHAMED AAA JOWITT R and BRENNAN JG 1982 Instrumental and
sensory evaluation of crispness 1 in friable foods J Food Eng 1 55-75
MOSKOWITZ HR SEGARS RA KAPSALIS JG and KLUTER RA 1974
Sensory ratio scales relating hardness and crunchiness to mechanical properties
of space cubes J Food Sci 39 200-202
MUNOZ AM 1986 Development and application of texture reference scales J Sens
Stud 1 55-83
ONWULATA C and HEYMANN H 1994 Sensory properties of extruded corn meal
141
related to the spatial distribution of process conditions J Sens Stud 9 101-112
ROUDAUT G DACREMONT C VALES PAMIES B COLAS B and MESTE M
2002 Crispness A critical review on sensory and material science approaches
Trends Food Sci Technol 13 217-227
SEYMOUR SK and HAMANN DD 1988 Crispness and crunchiness of selected
low moisture foods J TextStud 19 79-95
SZCZESNIAK AS 1988 The meaning of textural characteristics ndash crispness J
Text Stud 19 51-59
SZCZESNIAK AS and ILKER R 1988 The meaning of textural characteristics-
juiciness in plant food stuffs J Text Stud 19 61-78
SZCZESNIAK AS 2002 Texture is a sensory property Food Qual Prefer 13 215-
225
VICKERS Z M and BOURNE MC 1976 A psycho acoustical theory of crispness
J Food Sci 41 1158-1164
VICKERS ZM and WASSERMAN SS 1979 Sensory qualities of food sounds
based on individual perceptions J Text Stud 10 319-332
VICKERS Z M and CHRISTENSEN CM 1980 Relationships between sensory
crispness and other sensory instrumental parameters J Text Stud 11 291-307
VICKERS ZM 1981 Relationship of chewing sounds to judgments of crispness
crunchiness and hardness J Food Sci 47 121-124
VICKERS ZM 1984a Crackliness relationships of auditory judgments to tactile
judgments and instrumental acoustical measurements J Text Stud 15 49-
58
142
VICKERS ZM 1984b Crispness and crunchiness- a difference in pitch J Text
Stud 15 157-163
VICKERS ZM 1985 The relationship of pitch loudness and eating technique to
judgments of crispness and crunchiness of food sounds J Text Stud 16 85-
95
VICKERS ZM 1987a Instrumental measures of crispness and their correlation with
sensory assessment J Text Stud 19 1-14
VICKERS ZM 1987b Sensory acoustical and force deformation measurements of
potato chips crispness J Food Sci 52138-140
VINCENT JFV and SAUNDERS DEJ 2002 The use of critical stress intensity
factor to quantify hardness and crunchiness objectively J Text Stud 33 149-
159
143
Chapter Five
Conclusions and Future Work
1 Conclusions
bull Multidimensional scaling is a robust exploratory statistical and graphical
technique effectively producing a graphical representation of overall similarity in
food texture perceptions from selected sensory panelists MDS significance in
validating existing scales is to visually evaluate if scales created in the past retain
their properties and functions as when they were originally developed
bull Sensory results of apples and pears texture indicate strong correlations among the
sensory texture attributes of crispness hardness and fracturability for apples and
pears Disparity in juiciness perceptions in apples and pears were attributed to the
differences in cell structure
bull When correlating sensory evaluation to instrumental determinations both the
Sinclair iQtrade System and the Guss pressure sensor provided a reasonable
predictor of apple hardness The tensile properties of apples and pears may
potentially predict crispness but accurate predictions are highly dependent on the
orientation of the fruit when analyzed by an instrument or in the mouth A
combination approach assaying with an instrument to determine compressive and
tensile properties provides the most accurate prediction of apple and pear textural
properties compared to any existing method
bull The developed standard texture scales for crispness crunchiness and crackliness
for dry and wet foods provides individuals interested in auditory texture
evaluation a starting point to assist in training sensory panelists for descriptive
144
analysis of food texture Although future modifications in reference foodsrsquo
attribute definitions or evaluation procedures are expected this study represents a
first step in the generation of reproducible auditory sensory data using food
standard texture scales
bull The average power calculated from the RMS voltage signal is a reliable rapid
and straightforward tool to analyze auditory texture parameters in food
bull MDS output demonstrates that crispness crunchiness and crackliness are
distinguishable sensory texture parameters belonging to selected distinguishable
concepts and may be analyzed solely by auditory cues Also a perceptual
difference is observed between texture attributes for dry and wet foods
Differentiating between both is essential for more accurate descriptive analysis
training
145
2 Future Work
bull There is a need for improved training of sensory texture panelists
selection for panelists sensitive to texture notes and more attention
devoted to understanding texture nomenclature Developing official
international standards for sensory texture testing procedures will allow
for normalized results among panelists laboratories and countries
bull More studies are needed to obtain improved correlations between sensory
texture profile analysis and instrumental texture profile analysis
bull The knowledge base of the psychological factors influencing perception
and individualsrsquo choices should be integrated with physiological factors
This can be integrated with the use of multivariate statistical techniques
widely used in sensory science Interactions between texture and other
sensory modalities must be taken into account in understanding texture
influences
bull There is a fundamental lack of understanding of physiological factors
influencing texture perception mechanisms and mastication processes
Dental research must be integrated into sensory research studies for
example dental researchers are focused on mastication while sensory
scientists are focused on first bite The integration of both sciences can
complement each other and offer great opportunity of fully understanding
the perception of textural properties in foods
146
bull A new generation of texture assessment instrumentation is needed that can
operate at greater compression speeds especially for foods that are strain
rate sensitive
bull Understanding the influence of saliva on the texture of food may be
valuable because knowledge may provide a better understanding of the
full sequence of the mastication process More studies are needed on the
chemical composition and rheological properties of saliva and how
selected foods affect the amount or type of saliva induced in the mouth
Also more studies regarding the interactions of saliva with foods and the
effects on the structure of foods are needed to fully understand food
texture
147
- m_chauvin_10029078_ Part I
- m_chauvin_10029078_Part II
-