food security research rojectageconsearch.umn.edu/record/56803/files/fsrpwp42.pdf · ·...
TRANSCRIPT

FOOD SECURITY RESEARCH PROJECT
Staple Food Consumption Patterns in Urban Zambia: Results from the 2007/2008
Urban Consumption Survey
By
Nicole M. Mason and T.S. Jayne
WORKING PAPER No. 42 FOOD SECURITY RESEARCH PROJECT LUSAKA, ZAMBIA November 2009 (Downloadable at: http://www.aec.msu.edu/agecon/fs2/zambia/index.htm )

ii
Staple Food Consumption Patterns in Urban Zambia: Results from the 2007/2008 Urban Consumption Survey
by
Nicole M. Mason and T.S. Jayne
FSRP Working Paper No. 42
November, 2009
Nicole M. Mason is a graduate research assistant in the Department of Agricultural, Food, and Resource Economics, Michigan State University (MSU). T.S. Jayne is professor, International Development, Department of Agricultural, Food, and Resource Economics, Michigan State University.

iii
ACKNOWLEDGMENTS
The Food Security Research Project (FSRP) is a collaborative program of research, outreach, and local capacity building, between the Agricultural Consultative Forum, the Ministry of Agriculture and Cooperatives, and Michigan State University’s Department of Agricultural, Food, and Resource Economics. We wish to acknowledge the financial and substantive support the Swedish International Development Agency and the United States Agency for International Development in Lusaka. Research support from the Global Bureau, Office of Agriculture and Food Security, and the Africa Bureau, Office of Sustainable Development at the United States Agency for International Development (USAID)/Washington also made it possible for MSU researchers to contribute to this work. We also wish to acknowledge Alicia Carriquiry, Helen Jensen, and Sandra Clarke at the Iowa State University Center for Agricultural and Rural Development (CARD) for their assistance in obtaining CARD reports and documentation on the 1991 Zambian Household Expenditure and Incomes Survey. We also wish to thank Michael Weber, Antony Chapoto, and David Tschirley for helpful comments on earlier drafts of this report, Margaret Beaver for technical assistance, and Patricia Johannes for editorial assistance. The views expressed in this document are exclusively those of the authors. Comments and questions should be directed to the In-Country Coordinator, Food Security Research Project, 86 Provident Street, Fairview, Lusaka: tel: 234539; fax: 234559; email: [email protected]

iv
FOOD SECURITY RESEARCH PROJECT TEAM MEMBERS
The Zambia FSRP field research team is comprised of Antony Chapoto, Munguzwe Hichaambwa, Chance Kabaghe, Stephen Kabwe, Auckland Kuteya, Jan Nijhoff, and Solomon Tembo. MSU-based researchers in the Food Security Research Project are Margaret Beaver, Joey Goeb, Steve Haggblade, Thomas Jayne, Nicole Mason, Robert Richardson, James Shaffer, David Tschirley, and Michael Weber.
v
EXECUTIVE SUMMARY
After two decades of de-urbanization, Zambia is again becoming increasingly urban. While the urban share of the population fell to 35% in 2000 due primarily to the decline of the copper industry, over half of Zambia’s people will be residing in urban areas by 2040. Given this urbanization trajectory, to be effective, policies to promote smallholder agriculture and improved urban food marketing system performance in Zambia will need to take into consideration the demand patterns of urban food consumers. Urban consumption patterns will increasingly determine the opportunities available to small-scale farmers. Accurate information on urban consumer preferences can also help identify key leverage points and investment priorities to improve the performance of the food marketing system. The last major survey of Zambian urban consumers’ behavior was conducted in 1991 (the Zambian Household Expenditure and Incomes Survey). Current consumption patterns in Zambia may differ markedly from those of the early 1990s. To obtain updated information on urban consumers’ behavior, the Zambia Urban Consumption Survey (UCS) was conducted in August 2007 and February 2008 in Lusaka, Kitwe, Kasama, and Mansa by the Central Statistical Office (CSO) in collaboration with the Zambia Food Security Research Project. This working paper highlights the major findings of the UCS, particularly as they relate to staple food consumption patterns. Seven findings with important policy implications emerge from the analysis. First, urban Zambian households spent a lower fraction of their total expenditures on food in 2007/8 (46-55%) than they did in 1991 (61%). This finding indicates that urban households in general have more disposable income to spend on non-food items than they did in the early 1990s and is consistent with the decline in the extreme poverty headcount rate in urban Zambia from 32% in 1991 to 20% in 2006. The finding of a lower food share in total consumption pertains to a period in which food prices were at unprecedentedly high levels during the 2007/08 food crisis in the southern Africa region. Nevertheless, food budget shares among relatively poor households in Lusaka, Kitwe, Mansa, and Kasama remain very high at 60-73%. Policies and programs to reduce marketing costs from farmers to urban consumers will be important to reduce food prices for consumers and improve their disposable incomes and living standards. Second, the food group with the largest consumption share among Zambian urban households is meat and eggs, accounting for roughly 15-17% of the value of food consumption in the four cities covered in the survey. Other food groups with large consumption shares are vegetables (10.1-12.6%) and fish (7.1-11.6%), maize products (7.6-11.1%), wheat products (5.9-10.5%), and sugar and oil (6.7-8.4%). Third, among the staple carbohydrates, although maize budget shares in 2007/8 exceeded those for other staple foods among relatively poor urban consumers, wheat was the most important staple carbohydrate in value of consumption terms among urban consumers overall in Lusaka and Kitwe, and among the wealthiest quintile of consumers in Mansa and Kasama. Maize is no longer the dominant staple food in urban Zambia, except among the poor. This is also the case in some urban areas in Mozambique, Kenya, and South Africa where recent surveys have been conducted. The increasing diversification of urban staple food diets may allow for greater inter-commodity substitution potential during maize production shortfalls.

vi
Fourth, retail grocers and market stands/stalls account for approximately 60% of the total value of staple purchases by urban households in Zambia. These retail outlets are commonly used by households across all consumption quintiles. In contrast, supermarkets have only 5-17% of the market share for staple foods and are frequented mainly by households in the wealthier consumption quintiles. This shows the staying power of small-scale, more ‘traditional’ retailers and that urban consumers are heavily dependent upon non-supermarket, informal retail outlets for their staple food purchases. Policies and public investments to support these traditional retailers, help them operate more efficiently, and reduce the transaction costs they face may have higher payoffs for most urban consumers as well as smallholder farmers than policies presupposing the rapid takeover of supermarkets and other more formal retail channels. That being said, a substantial share of commercially-milled maize meal purchases are made at supermarkets across all consumption quintiles in the two smaller cities, Mansa and Kasama. Overall supermarket market shares for commercially-milled maize meal are 30.1% and 53.4% for Mansa and Kasama, respectively; for the poorest consumption quintile, these market shares are 23.4% and 29.6%, respectively. Supermarkets may be gaining market share in these smaller cities by offering commercially-milled maize meal prices that are comparable to or lower than those in traditional retail outlets such as grocers and open air markets. Fifth, urban consumers’ access to hammermilling services improved markedly between 1997 and 2007 and in most cases, urban households’ cheapest maize meal option is to obtain maize grain and have it custom-milled for a fee. However, maize grain is not consistently available in public markets during the lean season, from December through March, and many households who would otherwise rely on custom-milled maize meal are forced to switch to (more expensive) commercially-milled maize meal and maize meal substitutes. A crucial strategy, therefore, for GRZ to promote its objectives of improving access to food for low-income urban consumers is to ensure that maize grain is available in public markets at all times, rather than respond to national production shortfalls by supporting import contracts for large milling companies. This could be achieved through a combination of supporting regional trade and/or releases of imported grain from South Africa onto local markets. The Food Reserve Agency (FRA) could also release maize from domestic production onto local markets rather than only channeling it to large millers. Because custom-milled maize meal can be procured by consumers at roughly 60% to 85% of the cost of commercial packaged breakfast meal, policies that can effectively promote the consistent availability of grain in local markets can contribute to urban food security. A sixth and related finding is that many urban households that consume mainly commercially-manufactured mealie meal expressed a willingness to consume maize meal from hammermills, which is generally less expensive. However, inconsistent availability of maize grain during the lean season prevents many households from pursuing this cost-saving option, as do concerns about the quality and packaging of mugaiwa (hammermilled maize meal) sold by vendors. There appears to be an unmet demand for hammer-milled breakfast meal (i.e., double dehulled maize meal). Therefore, policies and programs to improve the hygienic conditions at hammermills, to improve the quality of mugaiwa itself as well as its packaging, and to offer more types of mugaiwa (e.g., double dehulled) could help hammermills gain a larger share of the maize meal market and offer a cost-saving alternative to commercially-milled maize meal. Finally, in Kasama and Mansa, and particularly among relatively poor households in those cities, cassava is an important consumption item and that it serves as a buffer against high maize prices and poor maize grain availability during the lean season. Policies to support own production of cassava by urban households and to promote the availability of cassava products in public markets could therefore contribute to improved urban food security.

vii
TABLE OF CONTENTS EXECUTIVE SUMMARY .......................................................................................................v LIST OF FIGURES ..................................................................................................................ix ACRONYMS.............................................................................................................................x 1. INTRODUCTION ...............................................................................................................1 2. URBANIZATION IN ZAMBIA AND THE CITIES COVERED IN THE UCS...............2 3. DATA AND METHODS ....................................................................................................3 3.1. Sampling Frame and Survey Design............................................................................3 3.2. Methods........................................................................................................................4 3.2.1.Analytical Methods.............................................................................................4 3.2.2.Per Adult Equivalent Value of Consumption Quintiles......................................5 3.2.3.Weights and Attrition..........................................................................................6 4. FOOD AND NON-FOOD SHARES OF HOUSEHOLDS’ TOTAL VALUE OF
CONSUMPTION.................................................................................................................7 5. FOOD ITEM SHARES OF HOUSEHOLDS’ TOTAL VALUE OF CONSUMPTION....9 6. SOURCES AND RETAIL CHANNELS FOR STAPLE FOODS....................................14 7. MAIZE CONSUMPTION PATTERNS............................................................................20 7.1. Maize Consumption Shares .......................................................................................20 7.2. Maize Meal Prices and Consumers’ Reasons for Preferring Different Types of Maize Meal ................................................................................................................23 7.3. Custom-milled Mealie Meal: Maize Grain Availability, Substitutes, and Hammermill Accessibility ........................................................................................28 7.4. Households’ Willingness to Consume More Hammermilled Maize Meal Products......................................................................................................................30 8. CONCLUSIONS AND POLICY IMPLICATIONS .........................................................33 APPENDIX..............................................................................................................................35 REFERENCES ........................................................................................................................40
viii
LIST OF TABLES 1. Populations of Major Urban Centers in Zambia, 1990 and 2000 ........................................2 2. Number of Urban Seas Enumerated by District and Residential Area Stratum ..................3 3. Number of Urban Households Interviewed, Analytical Sample, and Weighted Number of
Urban Households, August 2007 and February 2008 Urban Consumption Surveys ..........3 4. Consumption Shares by Broad Category, February 1, 2007 to January 30, 2008...............7 5a. Food Consumption Shares during the Last 30 Days, July/August 2007 and
January/February 2008 (Percentage of Total Value of Food Consumption over the Two 30-Day Periods) .................................................................................................................10
5b. Food Consumption Shares during the Last 30 Days, July/August 2007 (Percentage of Total 30-Day Value of Food Consumption) ......................................................................11
5c. Food Consumption Shares during the Last 30 Days, January/February 2008 (Percentage of Total 30-Day Value of Food Consumption)..................................................................12
6. Expenditure Shares for Different Foods Eaten Away from Home during the Last 24 Hours (%), July/August 2007 and January/February 2008................................................13
7. Sources of Main Staple Foods during the Last 30 Days, July/August 2007 and January/February 2008 (Percentage of Total Monthly Value of Consumption of Each Staple Food) .......................................................................................................................14
8. Retail Channels Used for Staple Food Purchases during the Last 30 Days, July/August 2007 and January/February 2008 (Percentage of Total Monthly Purchases of Staples for Home Consumption)..........................................................................................................18
9. Retail Channels Used for Commercially-milled Maize Meal Purchases during the Last 30 Days, July/August 2007 and January/February 2008 (Percentage of Total Monthly Purchases for Home Consumption) ...................................................................................19
10a. Maize Consumption Shares during the Last 30 Days, July/August 2007 and January/February 2008....................................................................................................21
10b. Maize Consumption Shares during the Last 30 Days, July/August 2007........................22 10c. Maize Consumption Shares during the Last 30 Days, January/February 2008 ...............23 11. Mean and Median Prices for Different Types of Maize Meal (ZMK/Kg), August 2007
and February 2008 .............................................................................................................25 12. Percentage of Households That Primarily Used Different Types of Maize Meal during
the Last 30 Days (July/August 2007 and January/February 2008)....................................26 13. Reasons for Preferring Breakfast Meal to Other Types of Maize Meal among House-
holds That Used Primarily Breakfast Meal during the Last 30 Days (July/August 2007 and January/ February 2008 Surveys)................................................................................27
14. Reasons for Preferring Roller Meal to Other Types of Maize Meal among Households That Used Primarily Roller Meal during the Last 30 Days (July/August 2007 and January/February 2008 Surveys) .......................................................................................27
15. Reasons for Preferring Consumer-made Maize Meal to Other Types of Maize Meal among Households That Used Primarily Consumer-made Maize Meal during the Last 30 Days (Responses from August 2007 and February 2008 Surveys) ...................................28
16. Maize Grain Availability (Responses from February 2008 Survey) .................................29 17. Staple Substitutes When Maize Grain Is Unavailable or Too Expensive (for Households
That Mainly Use Consumer-made Maize Meal) (Responses from August 2007 Survey)...............................................................................................................................29 18. Number of Hammermills within 15 Minutes Walk of Home in 1997 and 2007 (Responses
from August 2007 Survey) ................................................................................................30 19. Willingness of Households That Consume Mainly Breakfast or Roller Meal to Consume
More Maize Meal Products from Hammermills (Responses from August 2007 Survey)...............................................................................................................................31
ix
A1. Household-level Reinterview Model Results (Probit) ......................................................36 A2. Most Common Package Size in which Commercially-manufactured Mealie Meal Is
Purchased by City and Consumption Quintile (during the Last 30 Days, January/February 2008) ..................................................................................................................................37
A3a-A3d. Staple Substitutes Used by Households in Lusaka, Kitwe, Mansa, and Kasama When Maize Grain is Unavailable (for Households That Mainly Use Consumer-made Maize Meal) (Responses from August 2007 Survey)........................................................38
A4. Willingness of Households That Consume Mainly Breakfast or Roller Meal to Consume More Maize Meal Products from Hammermills (Responses from August 2007 Survey Disaggregated by Specific Type of Hammermilled Maize Meal) .....................................39
LIST OF FIGURES
1. Kilograms of Maize Grain and Maize Meal and Loaves of Bread Affordable Per Daily Wage, Lusaka, January 1994-January 2009 ........................................................................8
2. Most Common Package Size in which Commercially-Manufactured Mealie-Meal (Breakfast and Roller) Is Purchased (during the Last 30 Days, January/February
2008) ..................................................................................................................................26
x
ACRONYMS
CARD Center for Agricultural and Rural Development, Iowa State University CSO Central Statistical Office FSRP Food Security Research Project GDP Gross Domestic Product GRZ Government of the Republic of Zambia HEIS Zambian Household Expenditure and Incomes Survey HH Household IPW Inverse Probability Weight Kg Kilogram Km Kilometer MATEP Market Access, Trade, and Enabling Policies Program MSU Michigan State University SEA Standard Enumeration Area SSA Sub-Saharan Africa UCS Urban Consumption Survey UNPD Population Division of the Department of Economic and Social Affairs of the
United Nations Secretariat USAID United States Agency for International Development

1
1. INTRODUCTION To be effective, policies to promote demand-driven smallholder agriculture and improved urban food marketing system performance in Sub-Saharan Africa (SSA) will need to take urban food consumption patterns into consideration, especially given the rapid rate of urbanization in many SSA countries. Governments, donors, and other policymakers require an up-to-date understanding of urban consumption patterns because they largely determine the opportunities available to small-scale farmers, and because such information can help identify key leverage points to improve urban food marketing system performance. In Zambia, urban dwellers accounted for 34.7% of the total population in 2000 (CSO 2003a). Projections suggest that 41.5% of Zambians will live in urban areas by 2025 and that by 2040, more than half of the population will be urban (UNPD n.d.). Given this urbanization trajectory, urban preferences and habits will be increasingly important drivers of food consumption patterns in Zambia in the coming decades. At the same time, agriculture is a mainstay of the Zambian economy: 72% of the workforce was engaged in agriculture in 2000 and agriculture accounted for 22% of Gross Domestic Product (GDP) in 2007 (CSO 2003a; CSO 2008). The last major survey of Zambian urban consumers’ behavior was conducted in 1991 (the Zambian Household Expenditure and Incomes Survey, (HEIS)). Current consumption patterns in Zambia may differ markedly from those of the early 1990s. To obtain updated information on urban consumers’ behavior, the Zambia Urban Consumption Survey (UCS) was conducted in August 2007 and February 2008 in Lusaka, Kitwe, Kasama, and Mansa by the Central Statistical Office in collaboration with the Zambia FSRP. The purpose of this paper is to report some of the key findings of the UCS, with a focus on staple food consumption patterns. The objectives of the report are: (1) to describe staple food consumption patterns in the four cities covered in the 2007/2008 UCS; and (2) to discuss the implications of the results for policies to promote urban food security, food marketing system performance, and smallholder agriculture.1 The remainder of the working paper is organized as follows. We begin by providing background information on the four urban areas covered in the UCS. Next, we describe the UCS design and sampling frame as well as the methods used in the paper. We then present the findings of the study and, finally, discuss the conclusions and policy implications.
1 Initially, an additional objective of the study was to examine changes over time in urban staple food consumption patterns in Zambia by comparing the 2007/8 UCS results to those of the 1991 HEIS. However, the comparability of the two surveys is weak due to differences in methodologies used and in the urban centers and consumption items covered. We therefore limit our discussion of differences between the two surveys’ results to changes in urban households’ food versus non-food budget shares.

2
2. URBANIZATION IN ZAMBIA AND THE CITIES COVERED IN THE UCS The four urban areas covered in the UCS are Lusaka, Kitwe, Kasama, and Mansa. The rationale for selecting these four cities is that Lusaka and Kitwe are representative of heavily populated urban areas in Zambia, while Kasama and Mansa are representative of northern urban centers where cassava is a key staple food (FSRP/MATEP 2007). The populations of these and other major urban areas in Zambia based on the 1990 and 2000 censuses are listed in Table 1. As indicated in Table 1, Zambia actually became less urbanized between 1990 and 2000, with the urban percentage of the total population dropping from 38.0% to 34.7%. The country was even more urbanized in the 1980s, with 39.9% of the population residing in urban areas (CSO 2003b). A key driver of this decrease in urbanization was net out-migration from many mining towns in the Copperbelt region as a result of falling copper prices and the decline of the copper industry (Potts 2006). More general economic decline and the elimination of major consumer food subsidies in the early 1990s also contributed to significant urban-to-rural migration in Lusaka, Central, and Southern Provinces and the observed relative decrease in the urban population between 1980 and 2000 (CSO 2003a). Nonetheless, population projections suggest that this trend is likely reversing back: by 2025, the urban population in Zambia is expected to account for 41.5% of the population, and by 2040, that figure is likely to surpass 50% (UNPD n.d.). Detailed information on the four urban centers covered in the UCS is provided in Hichaambwa et al. (2009). Table 1. Populations of Major Urban Centers in Zambia, 1990 and 2000
Population (‘000)
Urban Center (Province) 1990 2000
Average Annual
Growth Rate, 1990-2000 (%)
Lusaka (Lusaka) 769.4 1,084.70 3.5 Ndola (Copperbelt) 329.2 374.8 1.3 Kitwe (Copperbelt) 288.6 363.7 2.3 Kabwe (Central) 154.3 176.8 1.4 Chingola (Copperbelt) 142.4 147.4 0.4 Mufulira (Copperbelt) 123.9 122.3 -0.1 Luanshya (Copperbelt) 118.1 115.6 -0.2 Livingstone (Southern) 76.9 97.5 2.4 Kasama (Northern) 47.7 74.2 4.5 Chipata (Eastern) 52.2 73.1 3.1 Chililabombwe (Copperbelt) 48.1 54.5 1.3 Kalulushi (Copperbelt) 31.5 52.8 5.3 Mazabuka (Southern) 32 47.1 3.9 Kafue (Lusaka) 43.8 45.9 0.5 Mongu (Western) 29.3 44.3 4.2 Mansa (Luapula) 37.9 41.1 0.8 Choma (Southern) 30.1 40.4 3.0 Total urban population 2,948.9 3,426.9 1.5 Total population – Zambia 7,759.2 9,885.6 2.4 Urban % of total population 38.0 34.7 –
Source: CSO (2003b) Note: Urban centers covered in the UCS in bold.

3
3. DATA AND METHODS 3.1. UCS Sampling Frame and Survey Design The UCS was carried out by Zambia’s CSO in collaboration with the Food Security Research Project. As discussed above, the UCS covered urban households in Lusaka, Kitwe, Kasama, and Mansa districts. In total, 140 urban Standard Enumeration Areas (SEAs) were enumerated.2 In each urban area, SEAs were stratified into low-cost residential areas and medium/high-cost residential areas. Table 2 shows the number of urban SEAs enumerated in each stratum and district. The 120 SEAs to be enumerated were selected with probability proportional to estimated size from the eight strata (four districts, two strata per district), with the size measure based on the 2000 Zambia Census of Population and Housing. All households in selected SEAs were listed, then 18 households were randomly selected and interviewed in each SEA. The UCS was a two-wave survey; households were interviewed in both August 2007 and February 2008, the former period being several months after the main harvest and the latter month being at the height of the hungry season. Population weights were constructed to correct for the differential representation of the sample at district and sub-district levels. UCS-based estimates are valid at the district and stratum levels. For additional information on the UCS sample design methodology, see Hichaambwa et al. (2009). Table 3 summarizes the number of households interviewed in August 2007 and February 2008 as well as the number of weighted households.
Table 2. Number of Urban SEAs Enumerated by District and Residential Area Stratum Number of urban SEAs enumerated
District Low Cost Medium/
High Cost Total
Lusaka 28 12 40 Kitwe 30 10 40 Kasama 14 6 20 Mansa 16 4 20 Total 88 32 120
Source: CSO/FSRP Urban Consumption Survey 2007/2008
Table 3. Number of Urban Households Interviewed, Analytical Sample, and Weighted Number of Urban Households, August 2007 and February 2008 Urban Consumption Surveys
Number of households Lusaka Kitwe Mansa Kasama Total Number of households interviewed in August 2007 720 720 360 360 2,160 Number of households reinterviewed in February 2008 610 632 322 301 1,865 Analytical sample for panel data analysis* 607 627 322 300 1,856 Weighted number of households 225,637 68,153 8,277 17,105 319,171
Source: CSO/FSRP Urban Consumption Survey 2007/2008 Note: *Nine households that were interviewed in both August 2007 and February 2008 were dropped from the analytical samples due to data problems related to expenditure on takeaway foods. 2 SEAs are the lowest geographical sampling unit used by CSO and were the primary sampling units in the UCS. An SEA typically contains 100-200 households.

4
The UCS survey instrument used during the August 2007 data collection gathered information on households’ consumption and expenditure patterns during the last six months (February through July 2007). Information on food purchased and/or grown for home preparation was collected for the prior 30-day period. The main sections of the survey covered: (1) the household demographic roster and questions on recently deceased household members; (2) the household’s consumption of 77 common food and non-food items during the last thirty days, including the total value of consumption of each item, how the item was obtained (purchased, gift, or own production), the type and location of retail outlets used for purchases, and the frequency of purchases; (3) food bought and consumed away from home (takeaway/street food consumption) by household members during the last 24 hours; (4) recurring monthly non-food expenditures during the last 30 days and other large expenditures made during the last six months; (5) additional details on the household’s consumption of maize grain and maize meal in the last 30 days and how these consumption patterns compare to the household’s behavior 10 years prior; (6) the household’s participation in urban agriculture (growing crops, raising livestock/poultry, and farming fish); and (7) the household’s linkages with rural areas, asset ownership, and food security status. The survey instrument used in the February 2008 reinterview of households (which covered households’ consumption and expenditure patterns during the six month period from August 2007 through January 2008) was, by and large, the same as the August 2007 instrument. Additional questions appearing in the February 2008 instrument covered: (1) the most common package sizes in which food items were purchased; (2) the household’s acquisition of fertilizer; and (3) the household’s willingness to consume more hammermilled maize meal. Together, the August 2007 and February 2008 interviews captured information on households’ overall consumption and expenditure patterns over the 12-month period from February 2007 through January 2008.3 However, information on food purchases was based on a 30-day recall. Hence, the August survey was designed to capture staple food consumption patterns during a typical post-harvest month, while the February survey was designed to capture hungry season consumption patterns when food prices are generally at their highest. In addition to the household interviews, CSO enumerators collected price information on key food and non-food items included in the UCS. During the August 2007 round of the survey, prices for staple foods, cooking oil, rape, tomato, onion, beans, fish, meat, and charcoal were collected from a variety of retail outlets in and around public markets and in the SEAs covered by the UCS household survey. During the February 2008 round of the survey, the range of items for which prices were collected was expanded to cover additional vegetables and paraffin. Prices were also collected for a broader range of package sizes in February 2008 relative to August 2007. 3.2. Methods 3.2.1. Analytical Methods The methods used in this working paper are mainly descriptive statistics. Results of the UCS survey are summarized and presented in tables and/or figures. The two main types of descriptives reported are consumption shares and the percentage of households responding in a certain way to a given question. An example of the former is the share of food in 3 The survey instrument used during data collection in February 2008 as well as the enumerator manual are available on-line at http://www.aec.msu.edu/fs2/zambia/survey.htm#fsrp-s.

5
households’ total value of consumption from February 2007 through January 2008. An example of the latter is the percentage of households reporting that there are months of the year when they would wish to buy maize grain to mill into mealie meal but grain is not available in their area. Consumption shares are computed, for example, by applying population weights and summing the value of consumption of food across all households and then dividing it by the weighted sum of the total value of consumption of all food and non-food items across all households (and expressing the resulting value as a percentage). The percentage of households responding in a certain way to a given question is simply computed by applying population weights and running frequencies or cross-tabulations. 3.2.2. Per Adult Equivalent Value of Consumption Quintiles Numerous tables and figures in the paper report descriptive statistics for each city overall and for five “quintiles” of households stratified by total consumption (food plus non-food), in order to determine how food consumption patterns vary across such groups. Household consumption is considered to be highly correlated with income and living standards. These consumption quintiles were expressed on a per adult equivalent basis and were constructed as follows. First, households’ total value of consumption during each six-month period covered in the survey was computed by summing the six-month values of consumption of five categories of items: (1) foods purchased and/or grown for preparation at home, (2) non-food groceries, (3) routine non-food monthly items, (4) other intermittent non-food items, and (5) food bought and consumed away from home. For foods purchased and/or grown for preparation at home, non-food groceries, and non-food routine monthly items, the reference period was the last 30 days, so the six-month value of consumption of such items was calculated as the 30-day value of consumption times six. For non-food intermittent items, the reference period was the last six months so no adjustments were necessary. For food bought and consumed away from home, the reference period was the last 24 hours. We assume that households spend roughly the same amount on ‘takeaway’ food during weekdays, and estimate a household’s monthly expenditure on takeaway food by multiplying their expenditure in the last 24 hours by (5/7)*30. The estimated monthly expenditure on takeaway foods was then multiplied by six to give the estimated six-month value of consumption.4 Second, households’ estimated annual value of consumption was calculated by summing the total value of consumption during the two six-month periods. Third, each household’s per adult equivalent annual value of consumption was computed by dividing the household’s annual value of consumption by the average number of adult equivalents in the household across the two rounds of the survey. Finally, household per adult equivalent annual values of consumption were weighted by attrition-adjusted population weights (discussed further below) and then ranked and divided into quintiles in each city. We refer to these per adult equivalent value of consumption quintiles as ‘consumption quintiles’ throughout the rest of the report.
4 Households’ expenditures on takeaway foods in the two rounds of the survey were compared to check for outliers. For nine households, the share of takeaway foods in their total six-month value of consumption exceeded 50% in round 1 of the survey but was zero in round 2. These nine cases were not used in any subsequent analysis of the survey results.
6
3.2.3. Weights and Attrition In this report, we are interested in annual estimates of households’ consumption patterns and in differences in these consumption patterns between February-July and August-January. In the analysis, we therefore focus on households that were interviewed in both rounds of the UCS survey and use the two rounds of data collected as a panel. As noted in Table 3, of the 2,160 households interviewed in August 2007, only 1,865 (86.3%) were successfully re-interviewed in February 2008. If there are systematic differences between attriting and non-attriting households, then attrition bias might be a problem in our analysis. We test for systematic differences between attriting and non-attriting households by estimating separate reinterview probit models for each city: Prob(Revisitij ) = f j (Η ij , Assetsij , Lowcostij ,Hicostij ,Supervisorij ) (3.1) where i indexes the household; j indexes the city; Revisit is a binary variable equal to one if the household was reinterviewed in February 2008; H is a vector of household characteristics including household size, log of total value of household consumption during the six-month period from February through July 2007, the educational attainment, age, and gender of the household head, and a dummy variable equal to one if a household member died in the last 12 months; Assets is a vector of 11 dummy variables indicating the household’s ownership of 10 assets and whether the household rents or owns their home; Lowcost (Hicost) is a binary variable equal to one if the household lives in a low cost (high cost) residential area, with medium cost residential areas as the reference group; and Supervisor is a vector of dummy variables indicating the supervisor responsible for deciding if/when an enumerator stopped trying to relocate and reinterview a given household.5 All variables in Eq. 3.1 are observable for both attriting and non-attriting households. Results from the reinterview models indicate that, in each city, households that were successfully reinterviewed differ systematically from households that were not reinterviewed (see Table A1 in the Appendix). For example, in all four cities, households that own their homes were more likely to be reinterviewed than households that rent their homes; in Kitwe and Kasama, households with older household heads had a higher probability of being re-interviewed; and in Lusaka and Kasama, larger households were more likely to be successfully revisited. To deal with the potential attrition bias problem in our panel data analysis, we adjust the population weights by the inverse probability weight (IPW) of being reinterviewed, which is simply one over the predicted probability of reinterview from Eq. 3.1, Pr ˆ o b(Revisitij ): Weightij
panel =Weightij1856 /Pr ˆ o b(Revisitij ) =Weightij
1856 * IPWij (3.2) where Weightij
panel is the weight for household i used in the panel data analysis and Weightij1856
is the population weight for the panel data analytical sample of 1,856 households (1,865 re-interviewed households minus nine takeaway expenditure outlier households that were dropped from the analysis).
5 Supervisor dummies were used in the Lusaka and Kitwe reinterview models only. There was only one supervisor each in Mansa and Kasama.

7
4. FOOD AND NON-FOOD SHARES OF HOUSEHOLDS’ TOTAL VALUE OF CONSUMPTION
Urban households in Zambia spend a large percentage of their incomes on food. Food budget shares, or the share of food items in the total value of households’ consumption, range from 46.2% and 46.6% in the heavily populated urban centers of Lusaka and Kitwe, to 50.7% and 54.6% in the smaller northern towns of Mansa and Kasama, during the period February 1, 2007 to January 30, 2008 (Table 4). In all four cities, food budget shares are much higher for relatively poor households (i.e., those in the lower consumption quintiles) compared to relatively better-off households (i.e., those in the higher consumption quintiles).6 Table 4. Consumption Shares by Broad Category, February 1, 2007 to January 30, 2008 (Percentage of Total Annual Value of Consumption)
Share of total annual value of consumption (%) Consumption quintile
Food Non-food groceries
Non-food routine monthly items
Other non-food intermittent items
Lusaka 1 lowest 60.8 12.1 19.7 7.4 2 60.0 8.8 22.2 9.0 3 55.5 5.6 25.7 13.2 4 48.3 4.6 32.2 14.9 5 highest 34.8 2.4 31.6 31.3 Total 46.2 5.0 28.6 20.3
Kitwe 1 lowest 62.7 13.3 16.5 7.5 2 61.4 10.2 19.8 8.7 3 58.1 8.3 21.5 12.1 4 52.2 6.5 27.1 14.3 5 highest 33.6 2.5 34.4 29.5 Total 46.6 6.0 27.8 19.6
Mansa 1 lowest 67.7 13.7 9.3 9.3 2 68.3 11.4 10.7 9.5 3 58.2 8.1 17.4 16.2 4 52.3 6.4 21.9 19.3 5 highest 40.0 3.3 26.4 30.3 Total 50.7 6.4 21.1 21.8
Kasama 1 lowest 73.1 14.5 5.0 7.5 2 69.8 12.0 9.7 8.4 3 63.9 9.6 16.7 9.9 4 59.1 6.9 22.0 11.9 5 highest 41.0 3.6 26.1 29.3 Total 54.6 7.1 20.2 18.2
Source: CSO/FSRP Urban Consumption Survey 2007/2008 Notes: Non-food groceries are charcoal, firewood, paraffin, candles, batteries, soap for bathing, soap for washing, toilet paper and jelly (Vaseline). Non-food routine monthly items include housing rent, transportation, utilities, personal care products, cell phone talk-time, and medication. Other non-food intermittent items include consumer durables, clothing, medical expenses excluding medication, funeral and ceremonial expenses, educational expenses, land/home purchases, leisure and recreation expenditures, and gifts/remittances/cash out. Rows sum to 100% +/- 0.1%.
6 Assuming that the value of consumption is correlated with income, this finding is consistent with Engel’s law, which states that the budget share of food declines as incomes rise.
8
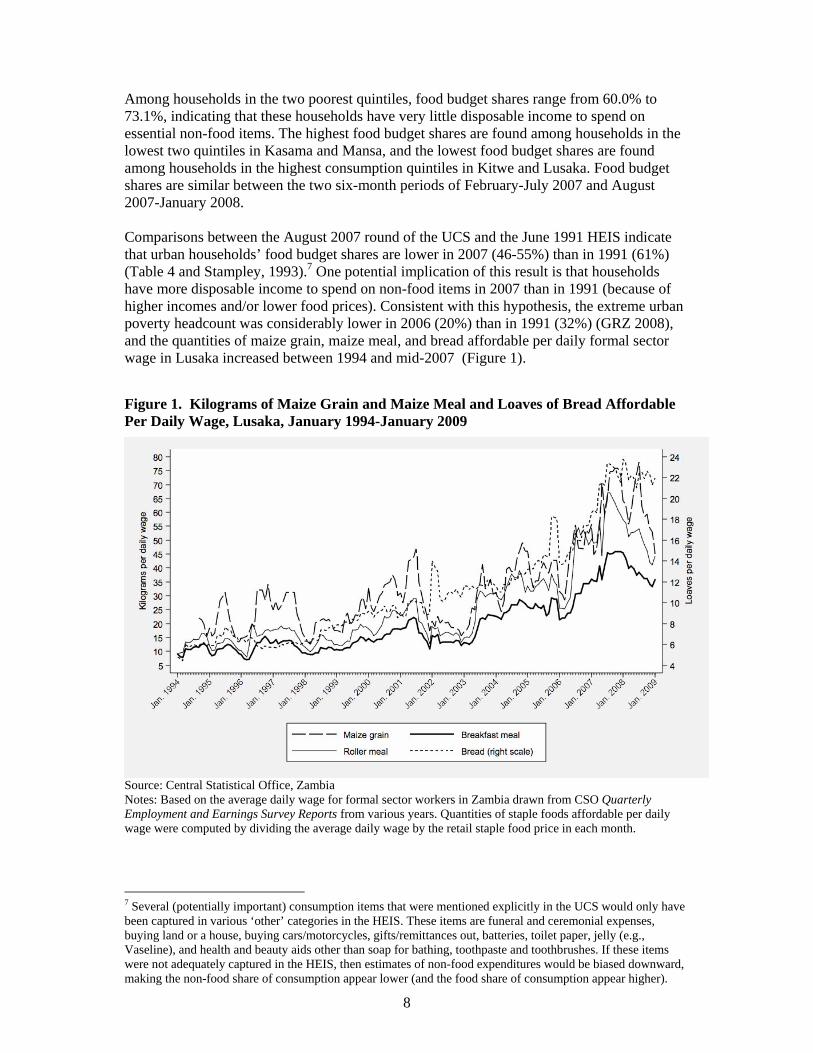
Among households in the two poorest quintiles, food budget shares range from 60.0% to 73.1%, indicating that these households have very little disposable income to spend on essential non-food items. The highest food budget shares are found among households in the lowest two quintiles in Kasama and Mansa, and the lowest food budget shares are found among households in the highest consumption quintiles in Kitwe and Lusaka. Food budget shares are similar between the two six-month periods of February-July 2007 and August 2007-January 2008. Comparisons between the August 2007 round of the UCS and the June 1991 HEIS indicate that urban households’ food budget shares are lower in 2007 (46-55%) than in 1991 (61%) (Table 4 and Stampley, 1993).7 One potential implication of this result is that households have more disposable income to spend on non-food items in 2007 than in 1991 (because of higher incomes and/or lower food prices). Consistent with this hypothesis, the extreme urban poverty headcount was considerably lower in 2006 (20%) than in 1991 (32%) (GRZ 2008), and the quantities of maize grain, maize meal, and bread affordable per daily formal sector wage in Lusaka increased between 1994 and mid-2007 (Figure 1). Figure 1. Kilograms of Maize Grain and Maize Meal and Loaves of Bread Affordable Per Daily Wage, Lusaka, January 1994-January 2009
Source: Central Statistical Office, Zambia Notes: Based on the average daily wage for formal sector workers in Zambia drawn from CSO Quarterly Employment and Earnings Survey Reports from various years. Quantities of staple foods affordable per daily wage were computed by dividing the average daily wage by the retail staple food price in each month.
7 Several (potentially important) consumption items that were mentioned explicitly in the UCS would only have been captured in various ‘other’ categories in the HEIS. These items are funeral and ceremonial expenses, buying land or a house, buying cars/motorcycles, gifts/remittances out, batteries, toilet paper, jelly (e.g., Vaseline), and health and beauty aids other than soap for bathing, toothpaste and toothbrushes. If these items were not adequately captured in the HEIS, then estimates of non-food expenditures would be biased downward, making the non-food share of consumption appear lower (and the food share of consumption appear higher).

9
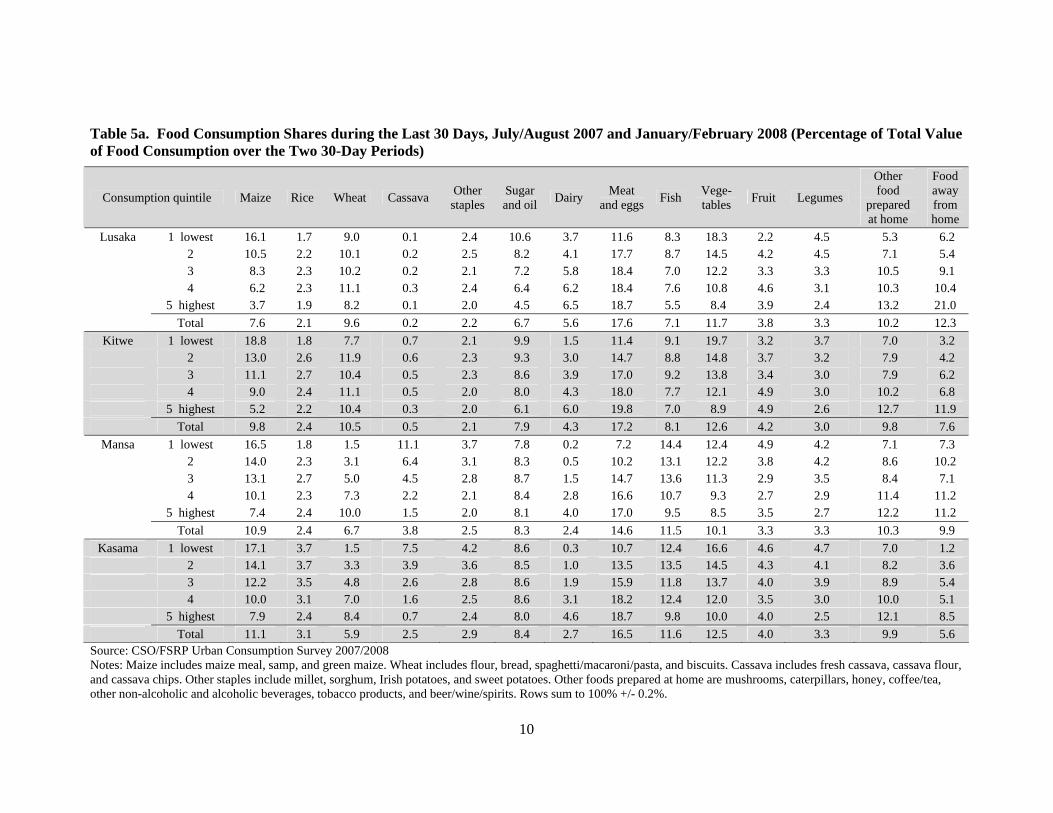
5. FOOD ITEM SHARES OF HOUSEHOLDS’ TOTAL VALUE OF CONSUMPTION Among the food items consumed by urban households in Zambia, the food group with the largest consumption share is meat and eggs (Table 5a). The share of meat and eggs in the total value of food consumption in July/August 2007 and January/February 2008 is 17.6% in Lusaka, 17.2% in Kitwe, 16.5% in Kasama, and 14.6% in Mansa. Other food groups with large consumption shares are vegetables (10.1-12.6%), fish (7.1-11.6%), maize products (7.6-11.1%), wheat products (5.9-10.5%), and sugar and oil (6.7-8.4%). Consistent with Bennett’s Law, staples account for a greater share of the total value of food consumption for households in the lower consumption quintiles than those in the higher consumption quintiles. Although the conventional wisdom is that maize is the dominant staple food in both urban and rural Zambia, UCS results indicate that wheat consumption shares exceed those for maize in Lusaka and Kitwe when all households in those cities are pooled; these shares are 9.6% for wheat and 7.6% for maize in Lusaka, and 10.5% for wheat and 9.8% for maize in Kitwe. The importance of wheat products is not limited to wealthy households or to the large urban centers. In fact, wheat consumption shares exceed those for maize in the top three consumption quintiles in Lusaka and in the top two consumption quintiles in Kitwe. Even in the smaller northern towns of Kasama and Mansa, wheat shares are higher than maize among households in the highest consumption quintile. Maize consumption shares are slightly higher in Mansa and Kasama than in Lusaka and Kitwe. As expected, cassava is a relatively more important consumption item in the cassava belt towns of Mansa and Kasama than it is in Lusaka and Kitwe. Cassava consumption shares are highest among households in the poorer consumption quintiles and during the lean season (January/February) when maize prices are high and grain stocks are low (Tables 5b and 5c). This suggests that cassava may act as a consumer shock absorber to buffer against high maize prices and low grain availability (Haggblade and Nyembe 2008). Comparisons of food item consumption shares during the harvest/post-harvest period (July/August) versus the lean season (January/February) indicate that maize and wheat consumption shares are generally higher during the lean season in all four cities (Tables 5b and 5c). Maize consumption shares are likely higher during the lean season because of higher commercial maize meal and maize grain prices, and lower availability of maize grain for custom-milling into maize meal. Similar quantities of maize would have a higher value in the lean season due to higher prices and the (potentially cheaper) option of custom-milling maize grain into maize meal is less available in the lean season due to shortages of maize grain on local markets. (This is discussed further in section 7.) For some households, wheat products substitute for maize products when maize products become expensive, which explains the higher wheat consumption shares in January/February.8 Higher staple food shares in January/February are somewhat offset by lower expenditures on food away from home during that period. Higher staple food prices during that period could mean that households have less disposable income to spend on food away from home. Food purchased and consumed away from home, or ‘takeaway food’, accounts for between 5-12% of urban households’ total value of food consumption, depending on the city (Table 5a). Expenditures on takeaway food are relatively more important among households in Lusaka and Mansa. The importance of takeaway foods also varies by consumption group, being between 1-7% of total food consumption for the poorest group while being as high as 21% among the top consumption group in Lusaka. Among takeaway foods, nshima with relish and alcoholic beverages have the two highest consumption shares in all four cities. Together, expenditures on these two items account for 47-63% of households’ total expenditures on food away from home (Table 6).
8 See Table 17 and Tables A3a-d in the Appendix for details on staple food substitutes consumed by urban households when maize grain for custom-milling is unavailable or too expensive.
10
Table 5a. Food Consumption Shares during the Last 30 Days, July/August 2007 and January/February 2008 (Percentage of Total Value of Food Consumption over the Two 30-Day Periods)
Consumption quintile Maize Rice Wheat Cassava Other staples
Sugar and oil Dairy Meat
and eggs Fish Vege-tables Fruit Legumes
Other food
prepared at home
Food away from home
Lusaka 1 lowest 16.1 1.7 9.0 0.1 2.4 10.6 3.7 11.6 8.3 18.3 2.2 4.5 5.3 6.2 2 10.5 2.2 10.1 0.2 2.5 8.2 4.1 17.7 8.7 14.5 4.2 4.5 7.1 5.4 3 8.3 2.3 10.2 0.2 2.1 7.2 5.8 18.4 7.0 12.2 3.3 3.3 10.5 9.1 4 6.2 2.3 11.1 0.3 2.4 6.4 6.2 18.4 7.6 10.8 4.6 3.1 10.3 10.4 5 highest 3.7 1.9 8.2 0.1 2.0 4.5 6.5 18.7 5.5 8.4 3.9 2.4 13.2 21.0 Total 7.6 2.1 9.6 0.2 2.2 6.7 5.6 17.6 7.1 11.7 3.8 3.3 10.2 12.3
Kitwe 1 lowest 18.8 1.8 7.7 0.7 2.1 9.9 1.5 11.4 9.1 19.7 3.2 3.7 7.0 3.2 2 13.0 2.6 11.9 0.6 2.3 9.3 3.0 14.7 8.8 14.8 3.7 3.2 7.9 4.2 3 11.1 2.7 10.4 0.5 2.3 8.6 3.9 17.0 9.2 13.8 3.4 3.0 7.9 6.2 4 9.0 2.4 11.1 0.5 2.0 8.0 4.3 18.0 7.7 12.1 4.9 3.0 10.2 6.8 5 highest 5.2 2.2 10.4 0.3 2.0 6.1 6.0 19.8 7.0 8.9 4.9 2.6 12.7 11.9 Total 9.8 2.4 10.5 0.5 2.1 7.9 4.3 17.2 8.1 12.6 4.2 3.0 9.8 7.6
Mansa 1 lowest 16.5 1.8 1.5 11.1 3.7 7.8 0.2 7.2 14.4 12.4 4.9 4.2 7.1 7.3 2 14.0 2.3 3.1 6.4 3.1 8.3 0.5 10.2 13.1 12.2 3.8 4.2 8.6 10.2 3 13.1 2.7 5.0 4.5 2.8 8.7 1.5 14.7 13.6 11.3 2.9 3.5 8.4 7.1 4 10.1 2.3 7.3 2.2 2.1 8.4 2.8 16.6 10.7 9.3 2.7 2.9 11.4 11.2 5 highest 7.4 2.4 10.0 1.5 2.0 8.1 4.0 17.0 9.5 8.5 3.5 2.7 12.2 11.2 Total 10.9 2.4 6.7 3.8 2.5 8.3 2.4 14.6 11.5 10.1 3.3 3.3 10.3 9.9
Kasama 1 lowest 17.1 3.7 1.5 7.5 4.2 8.6 0.3 10.7 12.4 16.6 4.6 4.7 7.0 1.2 2 14.1 3.7 3.3 3.9 3.6 8.5 1.0 13.5 13.5 14.5 4.3 4.1 8.2 3.6 3 12.2 3.5 4.8 2.6 2.8 8.6 1.9 15.9 11.8 13.7 4.0 3.9 8.9 5.4 4 10.0 3.1 7.0 1.6 2.5 8.6 3.1 18.2 12.4 12.0 3.5 3.0 10.0 5.1 5 highest 7.9 2.4 8.4 0.7 2.4 8.0 4.6 18.7 9.8 10.0 4.0 2.5 12.1 8.5 Total 11.1 3.1 5.9 2.5 2.9 8.4 2.7 16.5 11.6 12.5 4.0 3.3 9.9 5.6
Source: CSO/FSRP Urban Consumption Survey 2007/2008 Notes: Maize includes maize meal, samp, and green maize. Wheat includes flour, bread, spaghetti/macaroni/pasta, and biscuits. Cassava includes fresh cassava, cassava flour, and cassava chips. Other staples include millet, sorghum, Irish potatoes, and sweet potatoes. Other foods prepared at home are mushrooms, caterpillars, honey, coffee/tea, other non-alcoholic and alcoholic beverages, tobacco products, and beer/wine/spirits. Rows sum to 100% +/- 0.2%.

11
Table 5b. Food Consumption Shares during the Last 30 Days, July/August 2007 (Percentage of Total 30-Day Value of Food Consumption)
Consumption quintile Maize Rice Wheat Cassava Other staples
Sugar and oil Dairy Meat
and eggs Fish Vege-tables Fruit Legumes
Other food
prepared at home
Food away from home
Lusaka 1 lowest 14.9 1.6 8.8 0.2 3.7 10.7 3.7 12.2 8.9 16.3 1.9 4.3 5.1 7.8 2 9.9 1.8 10.0 0.4 3.7 8.0 4.3 18.6 9.0 12.9 4.8 4.6 7.4 4.6 3 7.8 2.3 9.7 0.2 2.8 7.1 5.5 19.2 8.0 10.4 3.4 3.1 10.0 10.5 4 6.0 2.3 11.3 0.4 2.9 6.3 5.9 18.0 7.9 9.9 5.4 3.0 9.9 11.0 5 highest 3.0 1.7 7.3 0.1 1.9 3.9 5.9 18.2 5.5 7.1 3.8 2.2 13.4 26.0 Total 6.9 1.9 9.1 0.2 2.8 6.4 5.4 17.8 7.3 10.2 4.0 3.1 10.2 14.8
Kitwe 1 lowest 17.3 2.0 7.1 0.6 3.5 10.3 2.0 11.7 9.3 17.8 1.9 4.0 7.2 5.2 2 12.3 2.6 10.1 0.9 3.5 9.7 2.6 15.1 9.4 13.5 3.1 3.4 7.7 6.1 3 9.8 2.7 9.6 0.7 3.1 8.1 4.5 16.8 9.2 11.4 2.8 3.0 7.4 11.0 4 7.7 2.3 10.3 0.9 2.6 7.5 4.5 19.1 7.7 10.4 5.1 3.0 10.9 8.1 5 highest 4.6 2.0 9.7 0.4 2.2 5.7 6.2 19.2 6.7 8.3 4.8 2.6 11.8 15.8 Total 8.8 2.3 9.6 0.6 2.8 7.7 4.5 17.3 8.1 11.2 3.9 3.0 9.6 10.6
Mansa 1 lowest 15.4 1.8 1.8 7.6 5.0 8.5 0.3 9.4 18.7 11.3 2.0 4.4 5.5 8.3 2 12.8 1.9 2.5 5.8 4.5 9.3 0.6 10.3 15.2 12.0 1.9 5.2 6.0 12.1 3 10.7 3.0 5.4 4.9 4.0 9.0 2.0 14.3 18.0 10.6 2.1 3.5 6.7 5.8 4 8.6 2.2 6.9 2.1 2.2 8.2 2.9 15.7 13.4 8.4 2.1 2.8 11.6 12.8 5 highest 6.5 2.1 8.6 1.6 2.2 8.2 4.4 17.6 10.9 8.1 3.1 2.3 10.4 14.0 Total 9.5 2.2 6.1 3.5 3.1 8.5 2.7 14.7 14.2 9.5 2.4 3.2 8.9 11.3
Kasama 1 lowest 15.3 4.6 1.4 6.0 7.9 9.7 0.3 9.9 12.3 18.1 1.8 5.6 5.8 1.3 2 11.0 3.6 2.5 3.0 5.7 8.9 1.3 13.4 15.1 16.3 2.0 4.6 8.4 4.1 3 10.3 3.8 4.8 2.0 4.6 8.9 2.4 15.2 11.6 14.1 2.2 4.4 9.0 6.8 4 7.6 2.9 6.3 1.3 3.3 8.7 3.3 18.0 13.3 12.5 2.5 3.3 10.9 6.0 5 highest 6.7 2.3 8.7 0.7 2.2 8.0 4.8 17.8 11.0 10.5 2.7 2.5 10.5 11.5 Total 9.1 3.2 5.7 2.0 4.0 8.6 3.0 15.9 12.4 13.3 2.3 3.7 9.5 7.1
Source: CSO/FSRP Urban Consumption Survey 2007 Notes: Maize includes maize meal, samp and green maize. Wheat includes flour, bread, spaghetti/macaroni/pasta, and biscuits. Cassava includes fresh cassava, cassava flour, and cassava chips. Other staples include millet, sorghum, Irish potatoes, and sweet potatoes. Other foods prepared at home are mushrooms, caterpillars, honey, coffee/tea, other non-alcoholic and alcoholic beverages, tobacco products, and beer/wine/spirits. Rows sum to 100% +/- 0.2%.

12
Table 5c. Food Consumption Shares during the Last 30 Days, January/February 2008 (Percentage of Total 30-Day Value of Food Consumption)
Consumption quintile Maize Rice Wheat Cassava Other staples
Sugar and oil Dairy Meat
and eggs Fish Vege-tables Fruit Legumes
Other food
prepared at home
Food away from home
Lusaka 1 lowest 17.2 1.9 9.3 0.1 1.1 10.5 3.6 11.0 7.8 20.3 2.4 4.7 5.4 4.5 2 11.0 2.5 10.3 0.1 1.5 8.3 4.0 16.8 8.4 15.9 3.6 4.5 6.8 6.1 3 8.8 2.3 10.8 0.2 1.5 7.2 6.1 17.6 6.0 14.0 3.3 3.5 11.0 7.8 4 6.4 2.2 10.9 0.1 1.9 6.5 6.5 18.8 7.4 11.6 3.8 3.3 10.7 9.8 5 highest 4.5 2.2 9.2 0.1 2.0 5.2 7.3 19.3 5.6 9.9 4.0 2.5 13.0 15.2 Total 8.3 2.2 10.1 0.1 1.7 7.0 5.9 17.5 6.8 13.3 3.6 3.5 10.2 9.8
Kitwe 1 lowest 20.3 1.7 8.2 0.7 0.8 9.6 1.1 11.1 8.9 21.4 4.3 3.5 6.9 1.4 2 13.7 2.6 13.7 0.3 1.1 8.8 3.3 14.3 8.3 16.1 4.2 3.1 8.1 2.4 3 12.4 2.6 11.2 0.3 1.5 9.0 3.4 17.3 9.3 16.3 4.0 3.1 8.3 1.4 4 10.3 2.6 11.8 0.2 1.5 8.4 4.1 17.0 7.6 13.6 4.8 3.0 9.5 5.7 5 highest 5.8 2.5 11.2 0.1 1.9 6.5 5.8 20.4 7.4 9.4 4.9 2.6 13.6 8.0 Total 10.9 2.5 11.4 0.3 1.5 8.1 4.1 17.1 8.1 14.0 4.5 2.9 10.0 4.6
Mansa 1 lowest 17.6 1.7 1.1 14.8 2.2 7.1 0.1 4.7 9.8 13.7 8.1 3.9 8.9 6.2 2 15.1 2.7 3.6 7.0 1.9 7.4 0.5 10.1 11.4 12.3 5.4 3.4 10.9 8.5 3 15.3 2.5 4.7 4.2 1.8 8.5 1.1 15.1 9.6 12.0 3.6 3.5 9.9 8.2 4 11.5 2.5 7.7 2.3 2.0 8.6 2.7 17.5 8.0 10.3 3.3 3.0 11.1 9.5 5 highest 8.1 2.6 11.3 1.4 1.8 8.0 3.6 16.5 8.3 8.9 3.8 3.2 13.8 8.6 Total 12.1 2.5 7.2 4.1 1.9 8.1 2.2 14.5 9.1 10.7 4.2 3.3 11.6 8.5
Kasama 1 lowest 18.7 2.9 1.6 8.8 0.9 7.6 0.3 11.3 12.5 15.2 7.3 3.8 8.1 1.1 2 16.8 3.8 4.0 4.8 1.8 8.1 0.6 13.6 12.1 12.9 6.5 3.7 8.1 3.2 3 13.8 3.3 4.8 3.1 1.2 8.4 1.4 16.5 11.9 13.4 5.6 3.4 8.8 4.3 4 12.4 3.2 7.7 1.9 1.7 8.6 2.9 18.5 11.5 11.5 4.4 2.6 9.0 4.2 5 highest 8.9 2.5 8.1 0.7 2.5 8.1 4.4 19.5 8.8 9.4 5.3 2.4 13.5 5.8 Total 12.9 3.1 6.1 2.9 1.8 8.2 2.5 17.0 10.9 11.8 5.5 3.0 10.2 4.2
Source: CSO/FSRP Urban Consumption Survey 2008 Notes: Maize includes maize meal, samp and green maize. Wheat includes flour, bread, spaghetti/macaroni/pasta, and biscuits. Cassava includes fresh cassava, cassava flour, and cassava chips. Other staples include millet, sorghum, Irish potatoes, and sweet potatoes. Other foods prepared at home are mushrooms, caterpillars, honey, coffee/tea, other non-alcoholic and alcoholic beverages, tobacco products, and beer/wine/spirits. Rows sum to 100% +/- 0.2%.

13
Table 6. Expenditure Shares for Different Foods Eaten Away from Home during the Last 24 Hours (%), July/August 2007 and January/February 2008
Source: CSO/FSRP Urban Consumption Survey 2007/2008 Notes: Fresh produce includes fruit, cucumbers and green maize. Other foods include sausage, groundnuts, non-alcoholic beverages, sugar cane, boiled eggs, pizza/sandwich/ pie, meat, sweets, popcorn, macaroni/potatoes/rice, polony/chikanda, and salad. Rows sum to 100% +/- 0.2%.
Consumption quintile Nshima w/ relish
Rice w/ relish
Chips/ Chicken and chips
Bread/ buns/ pies/
fritters/ biscuits
Cassava Sweet potatoes
Fresh produce
Alcoholic beverages
Money spent by adults on snacks/meals
Money spent by school children on snacks/meals
Other foods
Lusaka 1 lowest 66.6 0.0 1.4 3.9 0.0 0.0 4.9 12.1 2.6 1.5 6.9 2 56.3 4.5 0.4 7.7 0.0 0.0 3.0 13.4 3.0 6.8 5.0 3 47.8 0.0 4.0 3.7 0.3 0.0 1.9 28.6 0.3 4.5 8.8 4 41.3 2.5 16.6 3.2 0.0 0.0 1.7 13.7 2.6 9.5 8.8 5 highest 23.9 1.9 13.7 3.4 0.0 0.0 1.2 21.2 8.2 6.2 20.3 Total 35.1 1.8 11.2 3.8 0.1 0.0 1.7 19.9 5.4 6.3 14.8
Kitwe 1 lowest 53.2 0.0 0.0 1.5 3.3 1.1 0.0 24.2 2.6 7.8 6.4 2 47.5 0.0 0.0 3.3 1.6 0.7 0.9 18.7 5.6 16.3 5.4 3 33.8 4.0 18.4 6.9 2.6 0.7 0.3 11.3 5.3 9.6 7.0 4 44.9 0.0 6.1 4.0 0.5 0.0 3.5 21.9 2.1 8.7 8.4 5 highest 15.0 0.5 18.0 4.4 0.2 0.0 0.9 19.9 21.9 4.0 15.2 Total 28.3 0.9 13.4 4.5 0.9 0.2 1.3 19.0 13.2 7.0 11.3
Mansa 1 lowest 41.2 2.8 0.0 12.3 1.6 1.2 0.0 30.1 0.0 5.1 5.8 2 68.3 0.0 0.0 1.8 1.5 1.2 0.0 24.7 0.0 0.4 1.9 3 55.2 0.6 0.0 4.7 0.4 2.3 0.6 16.2 1.1 2.4 16.5 4 55.3 1.8 4.2 4.0 0.7 0.0 1.0 20.1 1.0 1.2 10.6 5 highest 23.8 3.9 24.7 2.6 0.1 0.0 0.6 15.6 4.6 2.4 21.9 Total 44.3 2.2 10.6 3.8 0.6 0.6 0.6 19.1 2.2 1.9 14.2
Kasama 1 lowest 0.0 0.0 0.0 57.9 0.0 0.0 3.2 18.0 0.0 0.0 20.8 2 33.2 4.7 0.0 12.6 1.4 0.0 2.4 38.9 0.0 4.8 2.0 3 27.9 0.0 0.0 3.2 0.3 0.0 3.3 41.4 0.0 7.8 16.1 4 35.1 0.0 0.8 1.4 3.5 0.0 0.0 40.1 4.9 4.1 10.0 5 highest 23.0 0.0 4.3 6.0 1.4 0.2 0.8 15.1 0.3 13.5 35.4 Total 27.1 0.5 2.2 6.2 1.7 0.1 1.3 27.7 1.2 9.2 22.7
14
6. SOURCES AND RETAIL CHANNELS FOR STAPLE FOODS Urban households in Zambia acquire staple foods from several different sources: purchases, own production, and gifts/transfers, which include food grown by relatives in rural areas and transported to urban areas for consumption by respondent households. For staple foods as a group, as well as for maize, rice, and wheat when considered separately, purchases account for the lion’s share of households’ total value of consumption (Table 7). Own production of staple foods is generally higher among households in the smaller, less densely populated towns of Kasama (15%) and Mansa (9%) relative to the more densely populated cities of Kitwe (3%) and Lusaka (1%). Own production accounts for a substantial share of households’ maize consumption in Kasama, where 19% of the total value of maize consumed comes from own production. The cassava consumed by urban households also comes mainly from purchases but own production and gifts/transfers are important sources as well (Table 7). In Lusaka, gifts/transfers account for 25% of households’ total value of cassava consumption but own production is minimal at 2%. In Kitwe, 62% of cassava consumed is from purchases, and the remaining 38% is split nearly equally between own production and gifts/transfers. Gifts/transfers of cassava received by households in Lusaka and Kitwe may be coming from relatives in rural or peri-urban areas. Own production of cassava is most important in the cassava belt towns of Mansa and Kasama. In Mansa, own production and purchases each account for approximately 45% of the total value of cassava consumed. And in Kasama, about 64% and 31% of households’ cassava consumption comes from purchases and own production, respectively. Across the various staple foods, purchase shares are generally higher among upper quintile households compared to lower quintile households, and own production shares are generally higher among lower quintile households. There are three noteworthy seasonal differences in the sources from which urban Zambian households obtain their staple foods. First, own production accounts for a greater share of the total value of consumption of staple foods in general and of maize in particular in July/August (the period just after maize is harvested) than in January/February (the lean season for maize). Second, in Kitwe and Mansa, cassava shares from own production are higher in the lean season (January/February) than in July/August. A likely explanation for this is that households cope with higher maize prices and lower maize availability in the lean season by pulling more cassava out of the ground. Third, in Kasama, the opposite is observed: cassava shares from own production are higher in July/August than in January/February. One potential explanation for this is that since Kasama is a high potential area for maize production and many households grow maize,9 some households might sell their maize shortly after harvest and instead consume cassava during that period. Given that most staple foods consumed by urban Zambian households are purchased, the next question one might ask is at what types of retail outlets are these transactions made? Although there is a large and growing literature on ‘the rise of supermarkets’ in developing countries including several in SSA,10 the UCS results reveal that the majority of staple food purchases in Zambian urban centers are made in the traditional retail sector (i.e., retailers other than mini-marts and supermarkets) (Table 8). 9 UCS results indicate that approximately 70% of urban households in Kasama grow maize, be it at the homestead, in the residential area or town in which they live, or outside of town. 10 See, for example, Weatherspoon and Reardon (2003) and Reardon et al. (2003).

15
Table 7. Sources of Main Staple Foods during the Last 30 Days, July/August 2007 and January/February 2008 (Percentage of Total Monthly Value of Consumption of Each Staple Food)
Staples Maize Rice Wheat Cassava Consumption quintile Purch-
ases Own prod.
Gifts/ Transfers
Purch- ases
Own prod.
Gifts/ Transfers
Purch- ases
Own prod.
Gifts/ Transfers
Purch- ases
Own prod.
Gifts/ Transfers
Purch- ases
Own prod.
Gifts/ Transfers
Lusaka 1 lowest 94.7 3.4 2.0 92.2 5.5 2.4 97.7 0.2 2.1 99.9 0.0 0.1 71.0 1.5 27.5 2 97.5 0.6 1.9 96.2 1.3 2.4 98.4 0.0 1.6 99.8 0.0 0.2 61.0 0.3 38.7 3 97.2 1.1 1.8 95.7 2.2 2.1 97.5 0.3 2.2 98.9 0.0 1.0 91.7 0.0 8.3 4 96.2 0.9 2.9 92.7 2.2 5.0 96.0 0.0 4.0 99.7 0.0 0.2 62.0 6.1 31.9 5 highest 97.7 0.7 1.5 95.2 2.0 2.7 97.8 0.1 2.1 99.7 0.0 0.3 78.6 0.7 20.7
Total 96.8 1.2 2.0 94.5 2.6 2.9 97.4 0.1 2.5 99.6 0.0 0.4 72.8 2.1 25.1
Kitwe 1 lowest 91.1 6.3 2.6 89.6 7.7 2.8 95.3 0.0 4.7 99.5 0.0 0.5 46.4 37.4 16.1 2 95.6 2.4 1.9 94.3 3.8 2.0 99.4 0.0 0.6 99.5 0.0 0.5 59.5 6.7 33.8 3 95.1 3.3 1.6 94.8 4.0 1.3 98.3 0.0 1.7 97.9 0.3 1.8 71.7 17.2 11.1 4 95.9 2.6 1.5 93.7 3.8 2.4 100.0 0.0 0.0 99.1 0.7 0.2 65.2 17.3 17.5 5 highest 96.8 1.7 1.5 92.9 4.7 2.4 98.4 0.0 1.6 99.5 0.0 0.4 60.6 19.5 20.0
Total 95.4 2.9 1.7 93.2 4.7 2.1 98.6 0.0 1.4 99.1 0.2 0.7 61.9 18.9 19.3
Mansa 1 lowest 71.6 24.9 3.4 81.1 16.1 2.9 98.8 0.0 1.1 99.4 0.0 0.6 38.6 56.1 5.3 2 84.1 14.0 2.0 94.3 4.2 1.5 99.5 0.0 0.5 98.3 0.0 1.7 39.4 56.3 4.3 3 88.9 9.4 1.7 94.7 4.5 0.8 98.8 0.0 1.2 98.2 1.6 0.2 50.8 41.9 7.3 4 94.0 3.5 2.5 95.3 3.6 1.1 96.6 0.0 3.3 99.6 0.0 0.4 62.6 19.3 18.1 5 highest 93.3 4.2 2.4 89.6 6.8 3.6 97.9 0.0 2.1 99.7 0.0 0.3 49.5 36.0 14.4
Total 88.9 8.8 2.3 92.1 6.0 1.9 98.1 0.0 1.9 99.3 0.2 0.4 46.5 44.9 8.6
Kasama 1 lowest 65.1 30.3 4.6 70.1 26.1 3.8 90.6 0.0 9.4 98.2 0.0 1.8 48.1 48.1 3.8 2 77.0 21.4 1.6 73.9 25.4 0.7 99.0 0.0 1.0 98.4 0.0 1.6 68.5 27.4 4.1 3 78.2 20.0 1.9 73.5 25.2 1.3 96.9 0.0 3.1 99.8 0.0 0.2 59.0 39.1 1.8 4 86.0 11.0 3.0 78.2 19.7 2.1 97.6 0.0 2.4 97.7 0.0 2.2 75.3 13.4 11.3 5 highest 94.6 2.7 2.7 93.5 5.1 1.4 100.0 0.0 0.0 95.0 1.0 4.0 86.4 2.8 10.8
Total 82.9 14.5 2.7 79.1 19.1 1.8 97.4 0.0 2.6 96.9 0.4 2.7 63.6 30.8 5.5 Source: CSO/FSRP Urban Consumption Survey 2007/2008 Notes: Purchases includes foods purchased for use in home-prepared meals and foods purchased and consumed away from home. Own prod. = own production. Gifts = received as gift. Maize category includes maize meal, samp, and green maize for home consumption and nshima with relish and green maize purchased and consumed away from home. Rice category includes rice for home consumption and rice with relish purchased and consumed away from home. Wheat category includes wheat flour, bread, biscuits and spaghetti/macaroni/pasta for home consumption and bread/buns/fritters/biscuits purchased and consumed away from home. Cassava category includes fresh cassava, cassava chips and cassava flour for home consumption and cassava purchased and consumed away from home. Staples category includes the aforementioned maize, rice, wheat, and cassava items, as well as millet, sorghum, Irish potatoes, sweet potatoes, chips/chicken and chips, and macaroni/potatoes/rice. Purchases, Own production, and gifts sum to 100% +/- 0.1%.
16
In Lusaka, Kitwe, and Kasama, approximately 60% of staple food purchases are from retail grocers/general dealers/shops and market stands/stalls. These two retail channels are also the top two in Mansa, but account for slightly less of total staple purchases (53%). Purchases from grocers exceed purchases from market stands/stalls in Lusaka and Kitwe but the opposite is true in Kasama and Mansa. The retail channel with the third highest staple food market share in the large cities of Lusaka and Kitwe is the ‘ka channel’ (ka tables, kantembas, ka shops/kiosks).11 Modern retail outlets (i.e., mini-marts, small supermarkets, and large independent and chain supermarkets) account for only 12% and 6% of staple food purchases in Lusaka and Kitwe, respectively, underscoring the staying power of the traditional retailing sector in these cities. In the smaller towns of Mansa and Kasama, large supermarkets have the third highest staple food market share (17% and 15%, respectively), and these market shares exceed those for large supermarkets in Lusaka and Kitwe. Consistent with these results, Tschirley et al. (2009) find that, after controlling for other factors, the probability of a given food item being purchased in a supermarket (as opposed to another type of retail outlet) is higher in the smaller towns of Mansa and Kasama than in the larger cities of Lusaka and Kitwe. One possible explanation for these findings is that the average distance to the nearest supermarket is lower for households in Mansa and Kasama than it is for households in Lusaka and Kitwe. Results from the August 2007 UCS support this hypothesis: the mean distance to the supermarket where households made a purchase in the last 30 days is 1.7 km for Mansa, 2.9 km for Kasama, 3.9 km for Lusaka, and 7.0 km for Kitwe.12 Nearly all staple food purchases from supermarkets in all four cities are from chain stores (e.g., Shoprite, Spar) as opposed to from independent supermarkets (Table 8). Comparing the staple food retail channels used by households in different consumption quintiles, UCS results indicate that market shares for market stands/stalls tend to be higher among relatively poor households and that market shares for supermarkets, mini-marts, and wholesale/wholesale-retail outlets tend to be higher among relatively wealthy households. Staple food purchases from retail grocers/general dealers/shops are common across all consumption quintiles. There are no major seasonal differences for Lusaka, Kitwe, or Kasama in the retail channels used for staple food purchases. However, in Mansa, supermarket market shares are much higher in July/August (23%) than in January/February (13%), and retail grocer/general dealer/shop market shares are much lower in July/August (10%) than in January/February (31.6%). 11 “Ka” means “small” in Nyanja, a common local language in Zambia. The definition of kantemba given in the UCS enumerator manual is “a small scale retailer with a makeshift selling structure, where the owner brings his/her merchandise in the morning and removes them when closing in the evening. Can be along a street or in a yard or other location away from a public market” (CSO/FSRP 2007, p. 28). Ka table is defined as “a small scale retail vender selling from a table on a street or in the yard of a house. These venders pay no levy or fee for use of their selling space” (CSO/FSRP 2007, p. 27). Ka shops/kiosks are defined as “a retailer with a small shop or building where a customer buys merchandise through the window of the building. These are more permanent structures which permit the owner to leave the inventory of goods in the shop overnight without fear of theft” (CSO/FSRP 2007, p. 28). See the enumerator manual for photographs of these different types of retail outlets. 12 Distance to the supermarket was only recorded for households that made purchases from a supermarket in the last 30 days. The estimated average distances are likely biased downwards because households that live farther away from the supermarket are less likely to have actually purchased something at a supermarket in the last 30 days, so these distances would not have been collected in the survey. Furthermore, for households that did make purchases at a supermarket, this supermarket may not necessarily have been the closest supermarket to the homestead.

17
Although supermarkets’ share of consumers’ staple food expenditures in general is only 5-17% in a given urban center (Table 8), for commercially-milled maize meal, supermarkets’ market shares are substantially higher. As will be discussed further in Section 7, maize meal from commercial mills accounts for more than 73% of consumers’ maize value of consumption in Lusaka and Kitwe (across all consumption quintiles). This is also the case for consumers in the wealthier consumption quintiles in Mansa and Kasama. Poorer households in Mansa and Kasama tend to consume custom-milled maize meal, which is not available in supermarkets. Table 9 shows the retail channels used by urban consumers for their commercially-milled maize meal purchases by city and consumption quintile. Although supermarkets account for a relatively small share of consumers’ commercially-milled maize meal expenditures in Lusaka (9.3%) and Kitwe (2.6%), supermarkets are the dominant retail channel for commercially-milled maize meal purchases by Kasama consumers (53.4%) and are the second most important retail channel for Mansa consumers (30.1%) (Table 9). Supermarket market shares for commercially-milled maize meal are relatively higher for Kasama and Mansa consumers in the highest consumption quintile but supermarket market shares are also significant among households in the lower consumption quintiles. UCS price survey results indicate that chain supermarket prices for 25-kg bags of commercially-milled breakfast and roller meal are typically comparable to or slightly lower than those in grocers and open air markets.

18
Table 8. Retail Channels Used for Staple Food Purchases during the Last 30 Days, July/August 2007 and January/February 2008 (Percentage of Total Monthly Purchases of Staples for Home Consumption)
Supermarket Consumption quintile Market
stand/stall
Mobile vendor/
street vendor
Ka table/ kantemba/
ka shop (kiosk)
Retail grocer/ general
dealer/ shop
Wholesale or wholesale-retail
grocer/ general dealer/
shop
Mini-mart/ small super-market Independent Chain
Bakery Private household Other
Lusaka 1 lowest 20.7 3.1 21.8 47.5 1.9 0.1 0.0 1.1 0.7 2.7 0.4 2 18.5 4.2 22.8 42.4 3.2 0.5 0.0 4.0 3.1 1.1 0.3 3 20.4 4.3 20.3 40.8 2.5 0.6 0.1 5.6 3.1 1.7 0.4 4 21.5 3.4 16.6 40.1 2.3 2.8 0.5 10.2 1.1 0.7 0.8 5 highest 17.2 3.0 14.6 28.4 6.0 5.8 1.8 20.7 1.6 0.7 0.2 Total 19.6 3.6 18.9 39.0 3.3 2.2 0.5 9.2 2.0 1.3 0.4
Kitwe 1 lowest 25.7 4.0 17.0 43.6 3.3 0.2 0.0 0.2 1.7 1.6 2.6 2 26.7 7.0 18.6 34.8 3.2 0.3 0.6 0.7 6.5 1.4 0.2 3 25.7 3.8 12.9 42.7 3.6 0.2 0.0 2.1 6.5 1.1 1.3 4 24.6 3.1 15.2 39.6 3.3 0.2 0.0 4.5 7.1 1.4 1.0 5 highest 20.2 2.9 15.2 33.9 3.4 1.5 0.3 13.1 7.3 1.1 1.1 Total 24.2 4.0 15.6 38.3 3.4 0.6 0.2 5.0 6.3 1.3 1.1
Mansa 1 lowest 51.9 15.8 3.0 13.3 3.7 0.0 0.0 5.1 2.3 4.9 0.0 2 44.8 11.6 4.8 21.6 4.4 0.0 0.0 7.0 4.0 1.7 0.2 3 36.5 4.8 5.4 26.4 4.7 0.0 0.0 14.1 5.6 2.4 0.3 4 26.1 4.5 5.2 25.4 5.8 0.0 0.0 19.1 12.6 1.0 0.4 5 highest 19.9 3.6 4.7 20.0 6.0 0.1 0.0 25.0 20.0 0.8 0.0 Total 31.3 6.3 4.8 22.2 5.2 0.0 0.0 16.9 11.3 1.7 0.2
Kasama 1 lowest 67.2 16.0 3.6 2.5 1.0 0.0 0.0 1.9 0.3 6.5 1.0 2 56.5 12.9 5.2 11.2 1.6 0.0 0.0 5.3 1.6 4.9 0.7 3 52.8 7.4 6.2 10.9 1.2 0.0 0.0 9.7 1.8 9.6 0.4 4 39.6 8.6 9.1 22.1 3.4 0.5 0.5 10.5 3.5 1.9 0.4 5 highest 26.2 9.4 4.5 18.1 3.3 0.9 0.2 29.3 6.2 0.7 1.2 Total 43.3 10.1 6.0 15.1 2.4 0.4 0.2 14.5 3.4 3.8 0.8 Source: CSO/FSRP Urban Consumption Survey 2007/2008 Note: Staples included are maize meal, green maize, samp, rice, wheat flour, bread, spaghetti/macaroni/pasta, sugar, millet flour, sorghum flour, fresh cassava, cassava flour, cassava chips, Irish potatoes, sweet potatoes, and biscuits. Other retail channels are hammermill, butchery, milk bar/container, restaurant, and bar/tavern. Rows sum to 100% +/- 0.2%.

19
Table 9. Retail Channels Used for Commercially-milled Maize Meal Purchases during the Last 30 Days, July/August 2007 and January/February 2008 (Percentage of Total Monthly Purchases for Home Consumption)
Commercially-milled maize meal
Consumption
quintile 1
(low) 2 3 4 5
(high) All
quintiles City Market outlet Lusaka (A) Chain supermarkets 1.7 4.9 7.3 5.7 21.0 7.2 (B) Independent supermarkets and mini-marts 0.2 0.8 0.4 3.0 8.9 2.1 (C) All supermarkets (A+B) 1.9 5.7 7.7 8.7 29.9 9.3 (D) Grocers 62.1 62.4 61.9 62.1 46.5 59.9 (E) Open air markets 16.0 10.4 12.4 11.2 13.6 12.8 (F) Ka table/kantemba/ka shop (kiosk) 17.5 20.9 17.9 17.1 9.5 17.1 (G) Other outlets 2.4 0.5 0.0 1.0 0.4 0.9 Kitwe (A) Chain supermarkets 0.0 0.0 1.2 1.0 9.4 2.1 (B) Independent supermarkets and mini-marts 0.5 0.0 0.1 0.6 1.6 0.5 (C) All supermarkets (A+B) 0.5 0.0 1.3 1.6 11.0 2.6 (D) Grocers 76.6 74.8 83.3 74.7 77.4 77.5 (E) Open air markets 15.0 14.7 11.8 19.5 4.0 13.2 (F) Ka table/kantemba/ka shop (kiosk) 7.4 10.5 3.6 3.1 7.5 6.3 (G) Other outlets 0.4 0.1 0.0 1.1 0.0 0.3 Mansa (A) Chain supermarkets 23.4 13.3 28.3 34.5 37.0 30.1 (B) Independent supermarkets and mini-marts 0.0 0.0 0.0 0.0 0.0 0.0 (C) All supermarkets (A+B) 23.4 13.3 28.3 34.5 37.0 30.1 (D) Grocers 76.6 82.9 70.1 65.5 63.0 69.0 (E) Open air markets 0.0 2.4 0.7 0.0 0.0 0.5 (F) Ka table/kantemba/ka shop (kiosk) 0.0 1.4 1.0 0.0 0.0 0.4 (G) Other outlets 0.0 0.0 0.0 0.0 0.0 0.0 Kasama (A) Chain supermarkets 29.6 39.3 56.6 30.4 70.6 53.4 (B) Independent supermarkets and mini-marts 0.0 0.0 0.0 0.0 0.0 0.0 (C) All supermarkets (A+B) 29.6 39.3 56.6 30.4 70.6 53.4 (D) Grocers 57.0 55.4 30.6 57.1 21.9 37.2 (E) Open air markets 7.0 5.3 12.8 10.3 7.5 8.6 (F) Ka table/kantemba/ka shop (kiosk) 0.0 0.0 0.0 2.2 0.0 0.6 (G) Other outlets 6.4 0.0 0.0 0.0 0.0 0.2 Source: CSO/FSRP Urban Consumption Survey 2007/2008 Notes: Other outlets are bakeries, butcheries, milk bars, restaurants, bars/taverns, private households, hammermills, and filling stations. For each column and city, rows (C) to (G) sum to 100% +/- 0.2%.

20
7. MAIZE CONSUMPTION PATTERNS In this section, we delve into urban consumers’ maize consumption patterns and preferences in more detail. Although wheat consumption shares exceed those for maize in Lusaka and Kitwe overall and for households in the highest consumption quintile in Mansa and Kasama, maize is the dominant staple food in total value of consumption terms among relatively poor households in all four cities covered in the UCS. Maize is also the main crop grown by smallholder farmers in Zambia. Thus urban households’ maize consumption patterns and preferences have important implications not only for policies to improve staple food marketing systems and food security in urban areas, but also for policies to promote smallholder agriculture. 7.1. Maize Consumption Shares The maize share of urban households’ total value of food consumed in home-prepared meals ranges from 9% to 12% in the four urban centers covered in the UCS (Table 10a). Maize consumption shares are higher among relatively poor households: maize consumption shares among households in the lowest quintile are roughly two to three times the shares of those of households in the highest consumption quintiles. The UCS collected information on five different maize products consumed in home-prepared meals: (1) maize meal from commercial mills, (2) consumer-made maize meal via taking grain to the grinding mill, (3) maize meal made at the grinding mill and sold by a vendor/retailer, (4) samp, and (5) green maize. Table 10a shows maize product consumption shares for the overall period covered by the two surveys. Among the three different types of maize meal, commercially-milled meal has the highest market share for households in all consumption quintiles in Lusaka and Kitwe, and market shares for this type of maize meal are similar across quintiles in these two cities (73-88%). Commercially-milled maize meal also dominates for the top four quintiles in Mansa but only for the top two quintiles in Kasama. Consumer-made maize meal is the most important form of maize meal in value of consumption terms for the poorest quintile households in Mansa and the poorest three quintiles in Kasama. Consumer-made maize meal shares are higher among relatively poor households in Lusaka and Kitwe than among relatively wealthy households in those cities, and consumer-made maize meal shares are significantly lower in the large cities (Lusaka and Kitwe) than in the smaller towns (Mansa and Kasama). Market shares for maize meal made at the grinding mill and sold by a vendor/retailer are small in all four cities and highest among relatively poor households in Kitwe and Mansa. Samp and green maize together only account for 7-11% of the total monthly value of maize consumed in home-prepared meals in each of the four cities overall. Tables 10b and 10c contain maize consumption shares in July/August 2007 and January/February 2008, respectively. These two tables reveal seasonal differences in the types of maize products consumed by urban households in Zambia. Most importantly, results indicate that custom-milling of maize meal by consumers in Mansa and Kasama is much less common in the lean season (January/February) than in the period shortly after maize is harvested (July/August); the opposite is true of market shares for maize meal from commercial mills. This is because maize grain becomes scarce and expensive in local markets during the lean season, and because households’ access to grain from rural relatives dwindles

21
during the lean season.13 As a result, custom-milling is no longer an option for many households and their only maize meal option is to purchase commercially-milled maize meal (which is relatively more expensive – see Table 11).14 If maize grain were more readily available throughout the year (including during the lean season), then grinding mills might retain their market shares among the poor, similarly to the July/August 2007 results. Other seasonal differences in maize consumption patterns are that green maize consumption shares are higher and samp consumption shares are lower in the lean season (January/February) compared to shortly after harvest (July/August). Table 10a. Maize Consumption Shares during the Last 30 Days, July/August 2007 and January/February 2008
Share (%) of total monthly value of maize for home consumption (shares sum to 100% +/- 0.2%)
Consumption quintile
Maize share (%) of total monthly
value of food for home
consumption
Maize meal from
commercial mills
Consumer- made maize
meal via taking grain
to grinding mill
Maize meal made at
grinding mill and sold by
a vendor/retailer
Samp Green maize
Lusaka 1 lowest 17.1 83.5 9.4 0.5 2.5 4.1 2 11.1 86.2 3.4 0.7 3.6 6.1 3 9.1 84.1 3.7 1.1 4.2 7.0 4 6.9 80.3 6.5 0.2 4.9 8.2 5 highest 4.6 78.6 3.5 0.3 3.6 14.1 Total 8.7 82.9 5.4 0.6 3.7 7.4 Kitwe 1 lowest 19.5 73.1 15.2 6.9 1.6 3.2 2 13.6 83.9 9.4 1.8 2.5 2.4 3 11.8 86.6 7.5 0.1 2.8 3.0 4 9.7 88.2 4.0 0.2 1.6 6.0 5 highest 5.9 83.8 6.2 0.0 2.9 7.1 Total 10.7 83.1 8.6 1.8 2.3 4.2 Mansa 1 lowest 17.7 29.2 60.5 5.4 2.8 2.0 2 15.6 46.9 46.6 2.2 2.9 1.4 3 14.1 69.7 17.9 5.0 3.8 3.6 4 11.3 79.3 13.2 0.0 3.4 4.1 5 highest 8.3 82.6 9.5 0.0 2.8 5.2 Total 12.1 65.3 25.8 2.3 3.2 3.5 Kasama 1 lowest 17.3 5.9 87.6 0.2 2.2 4.1 2 14.6 19.8 71.4 0.8 1.9 6.1 3 12.9 18.9 75.0 0.0 3.0 3.1 4 10.5 50.3 38.7 0.0 5.3 5.8 5 highest 8.6 81.2 10.1 0.0 3.2 5.5 Total 11.7 38.2 53.4 0.2 3.2 5.0 Source: CSO/FSRP Urban Consumption Survey 2007/2008
13 As noted in Table 16, 60-76% of households that primarily use consumer-made maize meal report that there are months of the year when they would wish to buy maize grain to mill into mealie meal, but grain is unavailable in their area. December through March are the most commonly cited months during which grain is unavailable. 14 Results in Table 17 and Tables A3a-d in the Appendix indicate that commercially-manufactured maize meal is an important substitute for custom-milled maize meal when maize grain is unavailable or too expensive.
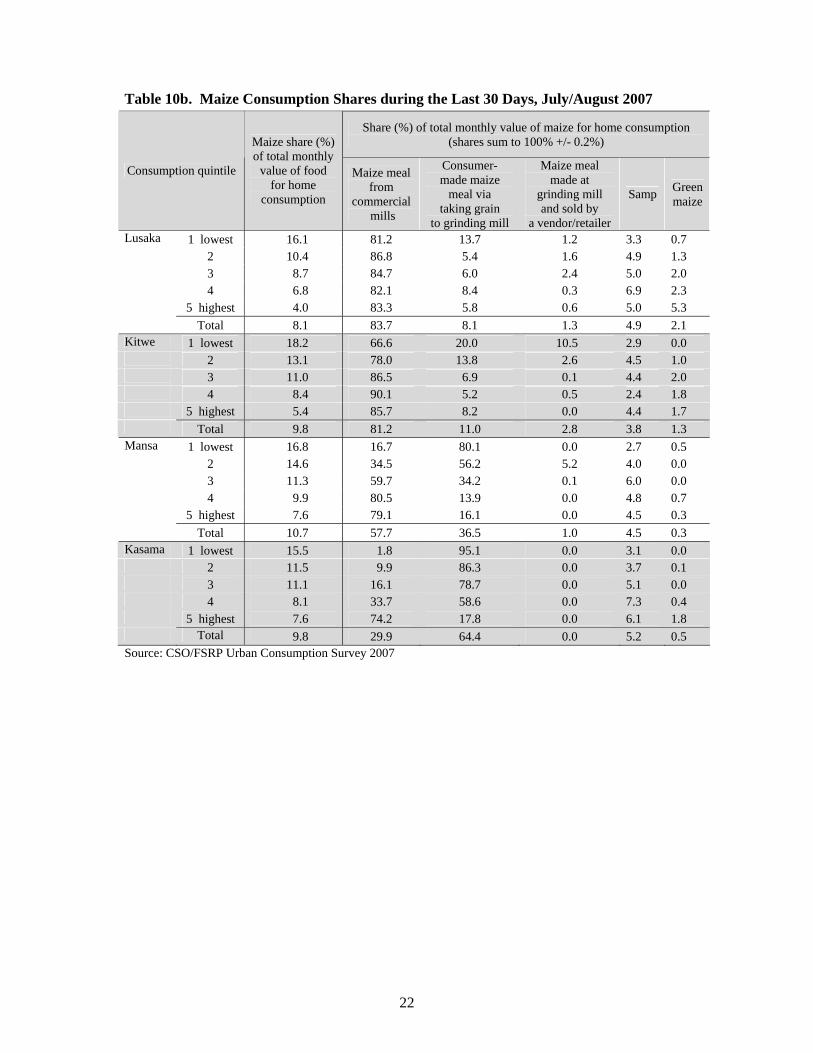
22
Table 10b. Maize Consumption Shares during the Last 30 Days, July/August 2007
Share (%) of total monthly value of maize for home consumption (shares sum to 100% +/- 0.2%)
Consumption quintile
Maize share (%) of total monthly
value of food for home
consumption
Maize meal from
commercial mills
Consumer- made maize
meal via taking grain
to grinding mill
Maize meal made at
grinding mill and sold by
a vendor/retailer
Samp Green maize
Lusaka 1 lowest 16.1 81.2 13.7 1.2 3.3 0.7 2 10.4 86.8 5.4 1.6 4.9 1.3 3 8.7 84.7 6.0 2.4 5.0 2.0 4 6.8 82.1 8.4 0.3 6.9 2.3 5 highest 4.0 83.3 5.8 0.6 5.0 5.3 Total 8.1 83.7 8.1 1.3 4.9 2.1 Kitwe 1 lowest 18.2 66.6 20.0 10.5 2.9 0.0 2 13.1 78.0 13.8 2.6 4.5 1.0 3 11.0 86.5 6.9 0.1 4.4 2.0 4 8.4 90.1 5.2 0.5 2.4 1.8 5 highest 5.4 85.7 8.2 0.0 4.4 1.7 Total 9.8 81.2 11.0 2.8 3.8 1.3 Mansa 1 lowest 16.8 16.7 80.1 0.0 2.7 0.5 2 14.6 34.5 56.2 5.2 4.0 0.0 3 11.3 59.7 34.2 0.1 6.0 0.0 4 9.9 80.5 13.9 0.0 4.8 0.7 5 highest 7.6 79.1 16.1 0.0 4.5 0.3 Total 10.7 57.7 36.5 1.0 4.5 0.3 Kasama 1 lowest 15.5 1.8 95.1 0.0 3.1 0.0 2 11.5 9.9 86.3 0.0 3.7 0.1 3 11.1 16.1 78.7 0.0 5.1 0.0 4 8.1 33.7 58.6 0.0 7.3 0.4 5 highest 7.6 74.2 17.8 0.0 6.1 1.8 Total 9.8 29.9 64.4 0.0 5.2 0.5 Source: CSO/FSRP Urban Consumption Survey 2007
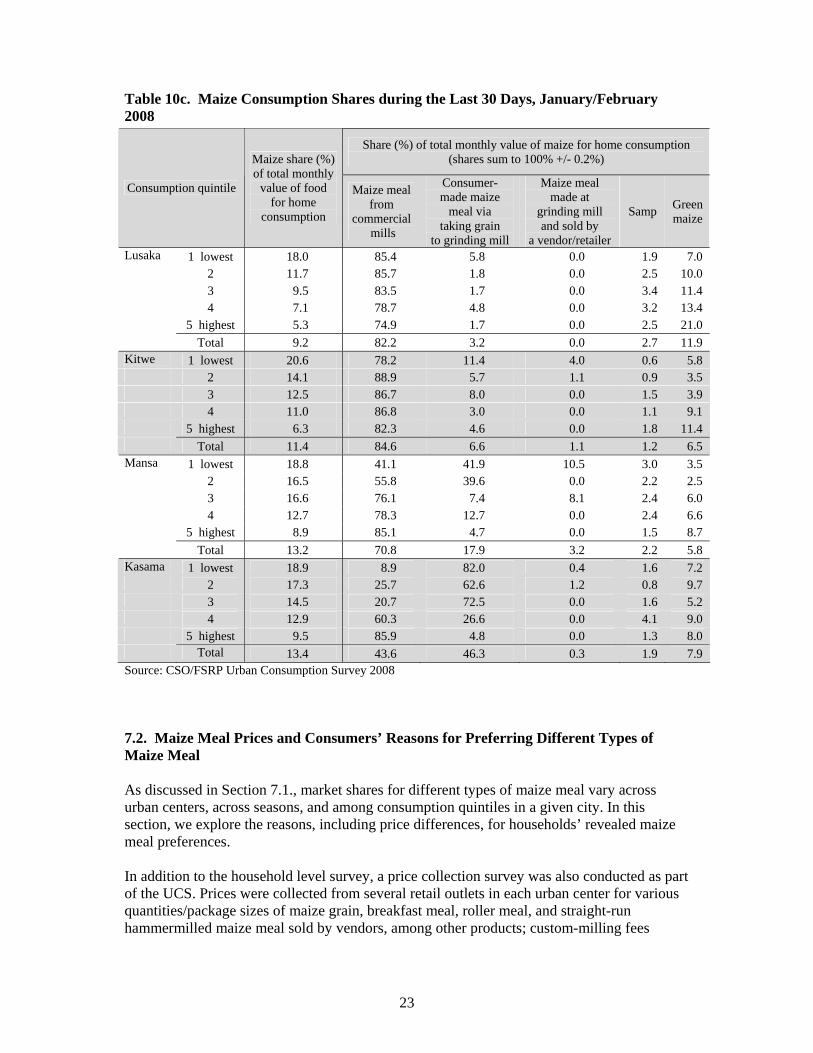
23
Table 10c. Maize Consumption Shares during the Last 30 Days, January/February 2008
Share (%) of total monthly value of maize for home consumption (shares sum to 100% +/- 0.2%)
Consumption quintile
Maize share (%) of total monthly
value of food for home
consumption
Maize meal from
commercial mills
Consumer- made maize
meal via taking grain
to grinding mill
Maize meal made at
grinding mill and sold by
a vendor/retailer
Samp Green maize
Lusaka 1 lowest 18.0 85.4 5.8 0.0 1.9 7.0 2 11.7 85.7 1.8 0.0 2.5 10.0 3 9.5 83.5 1.7 0.0 3.4 11.4 4 7.1 78.7 4.8 0.0 3.2 13.4 5 highest 5.3 74.9 1.7 0.0 2.5 21.0 Total 9.2 82.2 3.2 0.0 2.7 11.9 Kitwe 1 lowest 20.6 78.2 11.4 4.0 0.6 5.8 2 14.1 88.9 5.7 1.1 0.9 3.5 3 12.5 86.7 8.0 0.0 1.5 3.9 4 11.0 86.8 3.0 0.0 1.1 9.1 5 highest 6.3 82.3 4.6 0.0 1.8 11.4 Total 11.4 84.6 6.6 1.1 1.2 6.5 Mansa 1 lowest 18.8 41.1 41.9 10.5 3.0 3.5 2 16.5 55.8 39.6 0.0 2.2 2.5 3 16.6 76.1 7.4 8.1 2.4 6.0 4 12.7 78.3 12.7 0.0 2.4 6.6 5 highest 8.9 85.1 4.7 0.0 1.5 8.7 Total 13.2 70.8 17.9 3.2 2.2 5.8 Kasama 1 lowest 18.9 8.9 82.0 0.4 1.6 7.2 2 17.3 25.7 62.6 1.2 0.8 9.7 3 14.5 20.7 72.5 0.0 1.6 5.2 4 12.9 60.3 26.6 0.0 4.1 9.0 5 highest 9.5 85.9 4.8 0.0 1.3 8.0 Total 13.4 43.6 46.3 0.3 1.9 7.9 Source: CSO/FSRP Urban Consumption Survey 2008 7.2. Maize Meal Prices and Consumers’ Reasons for Preferring Different Types of Maize Meal As discussed in Section 7.1., market shares for different types of maize meal vary across urban centers, across seasons, and among consumption quintiles in a given city. In this section, we explore the reasons, including price differences, for households’ revealed maize meal preferences. In addition to the household level survey, a price collection survey was also conducted as part of the UCS. Prices were collected from several retail outlets in each urban center for various quantities/package sizes of maize grain, breakfast meal, roller meal, and straight-run hammermilled maize meal sold by vendors, among other products; custom-milling fees

24
charged by hammermills were also noted. Based on these price data, we calculate mean and median per kilogram prices for breakfast meal, roller meal, consumer-made maize meal, and straight-run hammermilled maize meal from vendors in each urban center in August 2007 and February 2008. These prices are summarized in Table 11.15 For both breakfast and roller meal, the package size most commonly purchased by urban households in Lusaka, Kitwe, Mansa, and Kasama is a 25 kg bag (Figure 2 and Table A2 in the Appendix). However, households in the lower consumption quintiles in Lusaka and Kitwe also purchase commercially-milled maize meal in smaller units such as pamelas or plastics (Table A2 in the Appendix); furthermore, commercially-milled maize meal is commonly available for purchase by the ka plate or ka BP in Mansa and Kasama. Therefore, for both breakfast and roller meal, we calculate mean and median per kilogram prices for 25 kg bags in all four cities, for pamelas/plastics in Lusaka and Kitwe, and for ka plates/ka BPs in Mansa and Kasama. For consumer-made maize meal via taking grain to the grinding mill, per kilogram prices were estimated based on the price and weight per MEDA of maize grain and on the per-MEDA custom milling fee. Results in Table 11 indicate that in Kitwe, Mansa, and Kasama in August 2007, consumer-made maize meal via taking grain to the grinding mill was the cheapest maize meal option for households (of the options examined).16 By contrast, the cheapest maize meal option for Lusaka households in August 2007 was to purchase roller meal by the 25 kg bag. In the lean season (e.g., February 2008) when grain is more expensive and less readily available, consumer-made maize meal and commercial roller meal purchased by the 25 kg bag are the two cheapest options available to urban households in Lusaka, Mansa, and Kasama. In Kitwe, straight-run hammermilled maize meal from vendors is also a relatively inexpensive option. Another insight gleaned from Table 11 is that households that buy breakfast or roller meal in repacks (e.g., pamelas, ka plates, ka BPs) pay a large premium per kilogram relative to households that purchase the same maize meal in 25 kg bags. For example, in Lusaka in August 2007, at K1,799 per kg, breakfast meal purchased in pamelas was 29% more expensive than breakfast meal purchased in 25 kg bags (K1,391 per kg). Having examined the price differentials among various maize meal options available to urban consumers in Zambia, which types of maize meal do households primarily consume and why? Table 12 summarizes the percentage of households that primarily used breakfast meal, roller meal, and consumer-made maize meal during the last 30 days. The vast majority of households in Lusaka and Kitwe primarily use breakfast meal. In Mansa, consumer-made is the most commonly used type of maize meal in the post-harvest period (July/August) but in the lean season, more households primarily use breakfast meal (42.8%) and roller meal (26.2%) than consumer-made maize meal (21.8%). In Kasama, the majority of households primarily use consumer-made maize meal throughout the year, but the percentage of households using primarily consumer-made maize meal is lower in the lean season (54.2%) than in July/August (73.4%). The observed lower (higher) percentages of households relying on consumer-made (commercially-manufactured) maize meal in the lean season is most likely due to the lower availability (and higher price) of maize grain in public markets during the lean season. This means that fewer households can obtain maize grain and have it custom-milled into maize meal; instead, they must rely on commercially-manufactured maize meal (and other substitutes).
15 Some caution is warranted when interpreting the results in Table 11 because for some types of maize meal in certain cities, only one price observation was recorded. 16 Note, however, that no adjustment was made to the consumer-made maize meal price to account for the opportunity cost of household members’ time spent taking grain to the grinding mill.

25
Table 11. Mean and Median Prices for Different Types of Maize Meal (ZMK/kg), August 2007 and February 2008
August 2007 February 2008 Type of maize meal
Price / Number of locations
Lusaka Kitwe Mansa Kasama Lusaka Kitwe Mansa Kasama
Mean price (ZMK/kg)
1,391 1,412
1,505 1,373 1,536 1,562 1,760 1,706
Median price (ZMK/kg)
1,373 1,399 1,530 1,360 1,520 1,560 1,767 1,723
Breakfast meal – commercially packaged (based on price per 25 kg bag) Number
of locations
53 23 6 6 44 27 5 12
Mean price (ZMK/kg)
1,799 2,379 2,040 2,643 2,004 2,263 4,071 2,290
Median price (ZMK/kg)
1,807 1,989 1,887 2,643 1,957 2,095 4,300 2,394
Breakfast meal – repackaged (based on price per pamela in Kitwe/Lusaka; per ka BP/plate in Mansa/Kasama) Number
of locations
38 20 8 2 40 12 5 7
Mean price (ZMK/kg)
915 975 1,093 1,000 1,188 1,261 1,408 1,408
Median price (ZMK/kg)
900 1,020 1,027 1,000 1,147 1,247 1,413 1,400
Roller meal – commercially Packaged (based on price per 25 kg bag) Number
of locations
33 8 6 2 21 16 5 5
Mean price (ZMK/kg)
1,656 1,721 1,927 – 1,838 1,370 3,057 2,123
Median price (ZMK/kg)
1,795 1,721 1,933 – 1,968 1,201 2,978 2,123
Roller meal – repackaged (based on price per pamela in Kitwe/Lusaka and per ka BP/ka plate in Mansa) Number
of locations
4 2 26 – 7 5 8 1
Mean price (ZMK/kg)
1,063 912 910 941 1,185 1,138 1,336 1,455
Median price (ZMK/kg)
1,047 911 898 952 1,138 1,138 1,333 1,433
Consumer-made maize meal (based on per MEDA custom-milling fee and price of maize grain*) Number
of locations
7 6 21 7 4 1 5 5
Mean price (ZMK/kg)
926 1,781 1,823 1,955 1,231 1,133 2,555 3,333
Median price (ZMK/kg)
926 1,667 1,667 1,963 1,231 1,133 2,591 3,333
Straight-run hammermilled maize meal from vendor/retailer (based on price per ka BP/ka plate) Number
of locations
1 3 42 8 1 1 8 1
Source: CSO/FSRP Urban Consumption Survey 2007/2008 Note: *Assumed extraction rate of 0.98 kg straight-run maize meal per kg of maize grain. – Not available in markets in this city at the time of price collection.

26
Figure 2. Most Common Package Size in which Commercially-manufactured Mealie-meal (Breakfast and Roller) Is Purchased (during the Last 30 Days, January/February 2008)
Source: CSO/FSRP Urban Consumption Survey 2008 Table 12. Percentage of Households That Primarily Used Different Types of Maize Meal during the Last 30 Days (July/August 2007 and January/February 2008)
% of households that primarily used each type of maize meal during the last 30 days
City Period Breakfast meal Roller meal Consumer-made
maize meal
Hammermilled maize meal
from vendor or household
does not consume maize meal Total
Lusaka Jul./Aug. 2007 81.0 9.3 9.0 0.7 100.0 Jan./Feb. 2008 87.8 8.0 3.3 0.9 100.0 Kitwe Jul./Aug. 2007 72.4 11.0 15.6 1.0 100.0 Jan./Feb. 2008 78.8 11.0 8.8 1.4 100.0 Mansa Jul./Aug. 2007 32.4 16.9 48.1 2.6 100.0 Jan./Feb. 2008 42.8 26.2 21.8 9.2 100.0 Kasama Jul./Aug. 2007 22.7 1.6 73.4 2.3 100.0 Jan./Feb. 2008 39.0 1.6 54.2 5.2 100.0 Source: CSO/FSRP Urban Consumption Survey 2007/2008

27
Among households that primarily use breakfast meal, what are their reasons for this preference? The number one reason why households prefer breakfast meal to other types of maize meal is because breakfast meal “tastes better” (Table 13). The second and third most frequently reported reasons for preferring breakfast meal are because it is “very white” and because households are in the habit of using it. Among households that primarily use roller meal, the most common reasons reported for this preference are because roller meal is cheaper or healthier/more nutritious or because they are in the habit of using it (Table 14). Households prefer consumer-made maize meal to other types of maize meal for reasons similar to those of roller meal consumers (cheaper, healthier/more nutritious) but also because many of these households produce maize and then have it milled into mealie meal (Table 15). Table 13. Reasons for Preferring Breakfast Meal to Other Types of Maize Meal among Households That Used Primarily Breakfast Meal during the Last 30 Days (July/August 2007 and January/ February 2008 Surveys)
% of households citing this as one of top three reasons Reason for preferring breakfast meal
Jul/Aug 2007 Jan/Feb 2008 Tastes better 57.3 51.9 Very white 41.6 43.1 Habit 34.9 39.3 Need to use less mealie meal when cooking 24.5 15.7 It mixes faster 24.0 26.5 More convenient 21.7 26.8 Fills up the stomach better 16.7 13.2 Cleaner, more hygienic 12.7 19.6 Cheaper 12.2 7.6 Healthier, more nutritious 11.5 10.1 Eliminates stomach problems 3.3 0.1 Can't source maize grain, so must use packaged meal 2.3 2.4 Very fine/smooth 2.1 0.4 Source: CSO/FSRP Urban Consumption Survey 2007/2008 Table 14. Reasons for Preferring Roller Meal to Other Types of Maize Meal among Households That Used Primarily Roller Meal during the Last 30 Days (July/August 2007 and January/February 2008 Surveys)
% of households citing this as one of top three reasons Reason for preferring roller meal
Jul/Aug 2007 Jan/Feb 2008 Cheaper 77.3 76.5 Healthier, more nutritious 37.1 70.9 Habit 33.5 27.6 More convenient 29.0 24.3 Tastes better 28.4 16.5 Fills up the stomach better 14.7 16.9 Cleaner, more hygienic 10.4 3.6 Need to use less mealie meal when cooking 9.2 2.4 Can't source maize grain, so must use packaged meal 6.5 9.2 Eliminates stomach problems 4.3 3.0 It mixes faster 3.8 1.5 Very white 3.4 2.5 Very fine/smooth 1.0 0.0 Source: CSO/FSRP Urban Consumption Survey 2007/2008
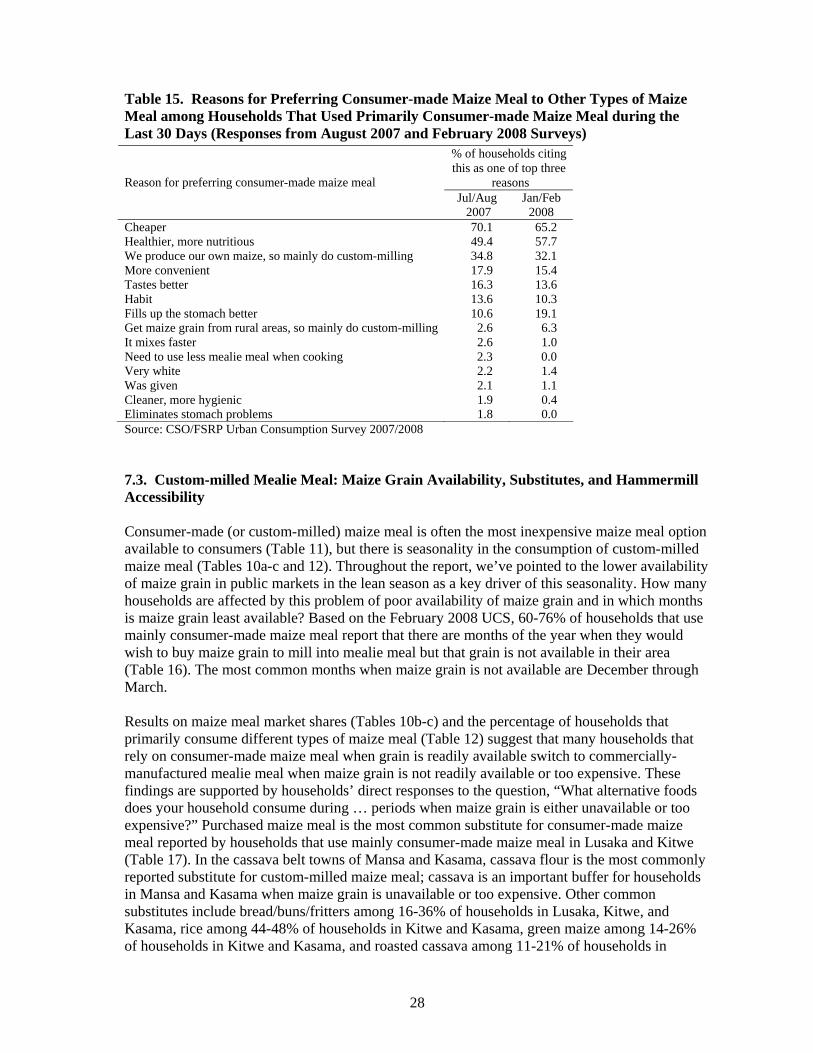
28
Table 15. Reasons for Preferring Consumer-made Maize Meal to Other Types of Maize Meal among Households That Used Primarily Consumer-made Maize Meal during the Last 30 Days (Responses from August 2007 and February 2008 Surveys)
% of households citing this as one of top three
reasons Reason for preferring consumer-made maize meal Jul/Aug 2007
Jan/Feb 2008
Cheaper 70.1 65.2 Healthier, more nutritious 49.4 57.7 We produce our own maize, so mainly do custom-milling 34.8 32.1 More convenient 17.9 15.4 Tastes better 16.3 13.6 Habit 13.6 10.3 Fills up the stomach better 10.6 19.1 Get maize grain from rural areas, so mainly do custom-milling 2.6 6.3 It mixes faster 2.6 1.0 Need to use less mealie meal when cooking 2.3 0.0 Very white 2.2 1.4 Was given 2.1 1.1 Cleaner, more hygienic 1.9 0.4 Eliminates stomach problems 1.8 0.0 Source: CSO/FSRP Urban Consumption Survey 2007/2008 7.3. Custom-milled Mealie Meal: Maize Grain Availability, Substitutes, and Hammermill Accessibility Consumer-made (or custom-milled) maize meal is often the most inexpensive maize meal option available to consumers (Table 11), but there is seasonality in the consumption of custom-milled maize meal (Tables 10a-c and 12). Throughout the report, we’ve pointed to the lower availability of maize grain in public markets in the lean season as a key driver of this seasonality. How many households are affected by this problem of poor availability of maize grain and in which months is maize grain least available? Based on the February 2008 UCS, 60-76% of households that use mainly consumer-made maize meal report that there are months of the year when they would wish to buy maize grain to mill into mealie meal but that grain is not available in their area (Table 16). The most common months when maize grain is not available are December through March. Results on maize meal market shares (Tables 10b-c) and the percentage of households that primarily consume different types of maize meal (Table 12) suggest that many households that rely on consumer-made maize meal when grain is readily available switch to commercially-manufactured mealie meal when maize grain is not readily available or too expensive. These findings are supported by households’ direct responses to the question, “What alternative foods does your household consume during … periods when maize grain is either unavailable or too expensive?” Purchased maize meal is the most common substitute for consumer-made maize meal reported by households that use mainly consumer-made maize meal in Lusaka and Kitwe (Table 17). In the cassava belt towns of Mansa and Kasama, cassava flour is the most commonly reported substitute for custom-milled maize meal; cassava is an important buffer for households in Mansa and Kasama when maize grain is unavailable or too expensive. Other common substitutes include bread/buns/fritters among 16-36% of households in Lusaka, Kitwe, and Kasama, rice among 44-48% of households in Kitwe and Kasama, green maize among 14-26% of households in Kitwe and Kasama, and roasted cassava among 11-21% of households in

29
Kitwe, Mansa, and Kasama (Table 17).17 The finding of the importance of cassava flour and roasted cassava as substitutes for custom-milled maize meal in Mansa and Kasama is consistent with the results in Tables 5b and 5c, which indicate higher cassava consumptions shares in those cities during the lean season relative to the months just after maize harvest. Table 16. Maize Grain Availability (Responses from February 2008 Survey) Lusaka Kitwe Mansa Kasama % of households reporting that there are months of the year when they would wish to buy maize grain to mill into mealie meal, but grain is not available in their area
61.5 67.2 59.9 75.9
% of households citing this as one of three most common months Months when maize grain not available
Lusaka Kitwe Mansa Kasama January 85.3 70.6 90.1 76.1 February 94.6 67.8 78.1 92.2 March 77.0 24.4 26.3 74.8 April 14.7 8.6 2.4 0.3 May 0.0 20.6 0.0 0.8 June 0.0 24.8 0.0 0.8 July 0.0 16.9 0.0 0.8 August 0.0 7.9 0.0 0.0 September 0.0 2.0 0.0 0.0 October 0.0 2.0 1.8 0.0 November 5.4 3.0 19.5 4.9 December 23.0 48.8 65.2 19.4 Source: CSO/FSRP Urban Consumption Survey 2008 Note: This question was only asked of households that use mainly consumer-made maize meal Table 17. Staple Substitutes When Maize Grain Is Unavailable or Too Expensive (for Households That Mainly Use Consumer-made Maize Meal) (Responses from August 2007 Survey) % of households that consume ___ when maize grain is unavailable or too expensive Lusaka Kitwe Mansa Kasama
Purchased maize meal 78.1 84.5 28.3 38.5 Cassava flour 0.9 10.1 87.1 73.3 Rice 9.8 47.9 16.1 43.8 Bread / buns / fritters 16.1 35.9 2.7 21.5 Green maize 4.3 25.6 4.7 13.5 Roasted cassava 0.9 11.2 12.2 20.6 Spaghetti / macaroni / pasta 5.3 3.5 0.0 0.0 Source: CSO/FSRP Urban Consumption Survey 2007 Note: A small number of households mentioned sweet potatoes, sorghum flour, millet flour, soybeans, mangoes, and imyungu (similar to a pumpkin) as additional staple substitutes.
17 See Tables A3a-A3d in the Appendix for results on custom-milled maize meal substitutes disaggregated by consumption quintile in each city.
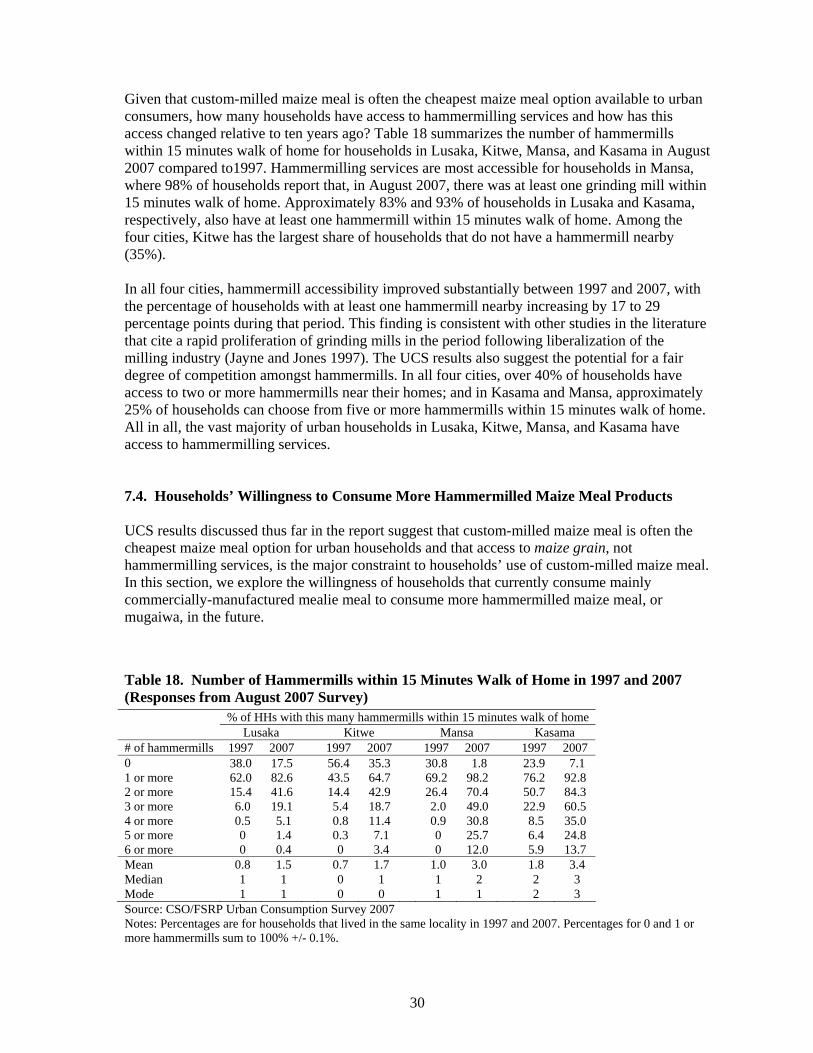
30
Given that custom-milled maize meal is often the cheapest maize meal option available to urban consumers, how many households have access to hammermilling services and how has this access changed relative to ten years ago? Table 18 summarizes the number of hammermills within 15 minutes walk of home for households in Lusaka, Kitwe, Mansa, and Kasama in August 2007 compared to1997. Hammermilling services are most accessible for households in Mansa, where 98% of households report that, in August 2007, there was at least one grinding mill within 15 minutes walk of home. Approximately 83% and 93% of households in Lusaka and Kasama, respectively, also have at least one hammermill within 15 minutes walk of home. Among the four cities, Kitwe has the largest share of households that do not have a hammermill nearby (35%). In all four cities, hammermill accessibility improved substantially between 1997 and 2007, with the percentage of households with at least one hammermill nearby increasing by 17 to 29 percentage points during that period. This finding is consistent with other studies in the literature that cite a rapid proliferation of grinding mills in the period following liberalization of the milling industry (Jayne and Jones 1997). The UCS results also suggest the potential for a fair degree of competition amongst hammermills. In all four cities, over 40% of households have access to two or more hammermills near their homes; and in Kasama and Mansa, approximately 25% of households can choose from five or more hammermills within 15 minutes walk of home. All in all, the vast majority of urban households in Lusaka, Kitwe, Mansa, and Kasama have access to hammermilling services. 7.4. Households’ Willingness to Consume More Hammermilled Maize Meal Products UCS results discussed thus far in the report suggest that custom-milled maize meal is often the cheapest maize meal option for urban households and that access to maize grain, not hammermilling services, is the major constraint to households’ use of custom-milled maize meal. In this section, we explore the willingness of households that currently consume mainly commercially-manufactured mealie meal to consume more hammermilled maize meal, or mugaiwa, in the future. Table 18. Number of Hammermills within 15 Minutes Walk of Home in 1997 and 2007 (Responses from August 2007 Survey) % of HHs with this many hammermills within 15 minutes walk of home Lusaka Kitwe Mansa Kasama # of hammermills 1997 2007 1997 2007 1997 2007 1997 2007 0 38.0 17.5 56.4 35.3 30.8 1.8 23.9 7.1 1 or more 62.0 82.6 43.5 64.7 69.2 98.2 76.2 92.8 2 or more 15.4 41.6 14.4 42.9 26.4 70.4 50.7 84.3 3 or more 6.0 19.1 5.4 18.7 2.0 49.0 22.9 60.5 4 or more 0.5 5.1 0.8 11.4 0.9 30.8 8.5 35.0 5 or more 0 1.4 0.3 7.1 0 25.7 6.4 24.8 6 or more 0 0.4 0 3.4 0 12.0 5.9 13.7 Mean 0.8 1.5 0.7 1.7 1.0 3.0 1.8 3.4 Median 1 1 0 1 1 2 2 3 Mode 1 1 0 0 1 1 2 3 Source: CSO/FSRP Urban Consumption Survey 2007 Notes: Percentages are for households that lived in the same locality in 1997 and 2007. Percentages for 0 and 1 or more hammermills sum to 100% +/- 0.1%.

31
Table 19. Willingness of Households That Consume Mainly Breakfast or Roller Meal to Consume More Maize Meal Products from Hammermills (Responses from August 2007 Survey) Among all HHs that consume mainly breakfast or roller meal: Lusaka Kitwe Mansa Kasama A) % of HHs that would consume mugaiwa if it were easier to source maize grain and/or milling services 67.5 80.5 96.3 83.3
B) % of HHs that would buy mugaiwa if it were available in the retail markets they mainly use 62.8 72.4 84.9 69.0
C) % of HHs that are aware of there being retailers/vendors of mugaiwa in the retail markets they mainly use 22.1 57.7 95.1 94.6
Among HHs that consume mainly breakfast or roller meal AND are aware of there being retailers/vendors of mugaiwa in the retail markets they mainly use:
Lusaka Kitwe Mansa Kasama
D) % of HHs that buy mugaiwa 28.0 31.7 59.1 21.0 E) Reasons for not buying mugaiwa (% reporting each reason among those not buying mugaiwa)
Prefer other products 65.0 78.5 33.0 60.9 Product quality not good 36.5 16.8 38.6 21.2 Price too high 1.0 3.5 17.4 12.3 Vendor location not convenient 4.7 3.5 0.0 0.0 Product packaging not good 7.8 5.3 11.0 3.2 Get mugaiwa for free so no need to buy 0.0 0.0 0.0 2.4 Among HHs that are not aware of any retailers/vendors of mugaiwa in the retail markets they mainly use OR that are aware of such retailers but do not buy mugaiwa:
Lusaka Kitwe Mansa Kasama
F) % of HHs that would buy mugaiwa from a vendor in the market if it were well packaged and distributed, as is done for commercial roller and/or breakfast meal
72.1 64.0 86.1 60.1
Source: CSO/FSRP Urban Consumption Survey 2007 Notes: In the survey, the questions in this table were asked separately for three specific types of mugaiwa: #1 semi-dehulled/super roller, #2 double-dehulled/breakfast, and #3 straight run/roller. In this table, responses have been aggregated to the household level i.e., if a household responded affirmatively to a given question for at least one of the three types of mugaiwa, responses were coded as ‘yes’ at the household level. See Table A4 in the Appendix for responses disaggregated by the specific type of mugaiwa. Results from the August 2007 UCS indicate that in all four cities, the vast majority of households that consume mainly commercial breakfast or roller meal would consume more mugaiwa if it were easier to source maize grain and/or milling services and would buy mugaiwa if it were available in the retail markets they mainly use (Table 19, rows A and B). Commercial maize meal consumers are generally more keen to consume more double-dehulled mugaiwa (which is comparable in its degree of refinement to commercial breakfast meal) than less refined mugaiwa (Table A4 in the Appendix). As of August 2007, approximately 95% of households in Mansa and Kasama that consume mainly commercial maize meal had access to retailers of mugaiwa in the markets they mainly use (Table 19, row C). Far fewer such households in Kitwe (58%) and Lusaka (22%) are aware of there being vendors of mugaiwa in the retail markets they frequent. Among households that do have access to mugaiwa from vendors/retailers in nearby markets, 59% of them in Mansa actually buy it – a much higher percentage than in Kitwe (32%), Lusaka (28%), and Kasama (21%) (Table 19, row D). What is preventing households from buying mugaiwa even when it is sold by retailers in the markets where they typically shop? The most common reasons are because households simply prefer other maize meal products (i.e., commercial breakfast and roller meal) and because the quality of mugaiwa is perceived to be poor (Table 19, Section E). Many households in Mansa

32
and Kasama also cited high prices as their main reason for not buying mugaiwa. Poor packaging and distribution of mugaiwa may be another reason why households with access to it are not purchasing it. Indeed, over 60% of households in all four cities indicated that they would be willing to buy mugaiwa from vendors in the markets they mainly use if it were well packaged and distributed, as is done for commercial breakfast and roller meal (Table 19, row F). UCS results further indicate that current commercial breakfast/roller meal users would be more likely to buy well packaged and distributed double-dehulled mugaiwa than less refined mugaiwa (Table A4 in the Appendix, Section F). This makes sense given that commercial maize meal users mainly consume breakfast meal: if a hammermilled breakfast meal equivalent were available, presumably at a lower price than commercial breakfast meal, they would be interested in buying it.

33
8. CONCLUSIONS AND POLICY IMPLICATIONS After two decades of de-urbanization, population projections suggest that Zambia is again becoming increasingly urban, with the majority of the population expected to live in urban areas by 2040. In this context of rapid urbanization, urban consumption patterns are important drivers of the opportunities available to smallholder farmers in the rural areas. Policy makers, therefore, need up-to-date information on urban consumption patterns and how they are evolving over time in order to effectively promote urban food security and smallholder agriculture. Information on consumer food purchasing behavior can also assist in guiding policy aimed to modernize the retail food system and anticipate the ways that urban marketing systems are likely to evolve. To that end, an Urban Consumption Survey was conducted in Lusaka, Kitwe, Mansa, and Kasama in August 2007 and February 2008 by the Central Statistical Office in collaboration with the Food Security Research Project. This working paper highlights some of the key results of the UCS, particularly as they relate to staple food consumption patterns. Seven findings with important policy implications emerge from the analysis. First, urban Zambian households’ food budget shares appear to be lower in 2007/8 (46-55%) than they were in 1991 (61%), indicating that some urban households may have more disposable income to spend on non-food items than they did in the early 1990s. This is consistent with a decline in the extreme poverty headcount in urban Zambia from 32% in 1991 to 20% in 2006 (GRZ 2008). Still, food budget shares among relatively poor households in Lusaka, Kitwe, Mansa, and Kasama remain high at 60-73%. Thus, although some urban households may have more disposable income in 2007/8 compared to 1991, relatively poor households still spend the vast majority of their incomes on food. Policies and programs are needed to improve the efficiency of urban food marketing systems, as well as agricultural productivity, in order to lower food prices for consumers, and to increase urban households’ incomes in order to boost purchasing power. Second, the food group with the largest consumption share is meat and eggs, accounting for roughly 15-17% of food consumption in the four cities covered in the survey. Other food groups with large consumption shares are vegetables (10.1-12.6%) and fish (7.1-11.6%), maize products (7.6-11.1%), wheat products (5.9-10.5%), and sugar and oil (6.7-8.4%). Consistent with Bennett’s Law, staples account for a greater share of the total value of food consumption for households in the lower consumption quintiles than those in the higher consumption quintiles. Third, among the staple carbohydrates, although maize budget shares in 2007/8 exceeded those for other staple foods among relatively poor urban consumers, wheat was the most important staple carbohydrate in value of consumption terms among urban consumers overall in Lusaka and Kitwe, and among the wealthiest quintile of consumers in Mansa and Kasama. Maize is no longer the dominant staple food in urban Zambia, except among the poor. This is also the case in some urban areas in Mozambique, Kenya, and South Africa where recent surveys have been conducted (Mason et al., 2009). The increasing diversification of urban staple food diets may allow for greater inter-commodity substitution potential during maize production shortfalls. Fourth, retail grocers and market stands/stalls account for approximately 60% of the total value of staple purchases by urban households in Zambia. These retail outlets are commonly used by households across all consumption quintiles. In contrast, supermarkets have only 5-17% of the market share for staple foods and are frequented mainly by households in the wealthier consumption quintiles. This shows the staying power of small-scale, more traditional retailers and that urban consumers are heavily dependent upon non-supermarket, informal retail outlets

34
for their staple food purchases. Policies and public investments to support these traditional retailers and to help them operate more efficiently and to lower their costs may have higher payoffs to most urban consumers as well as smallholder farmers than policies presupposing the rapid takeover of supermarkets and other more formal retail channels. That being said, a substantial share of commercially-milled maize meal purchases are made at supermarkets across all consumption quintiles in the two smaller cities, Mansa and Kasama. Overall supermarket market shares for commercially-milled maize meal are 30.1% and 53.4% for Mansa and Kasama, respectively; for the poorest consumption quintile, these market shares are 23.4% and 29.6%, respectively. Supermarkets may be gaining market share in these smaller cities by offering commercially-milled maize meal prices that are comparable to or lower than those in traditional retail outlets such as grocers and open air markets. Fifth, urban consumers’ access to hammermilling services improved markedly between 1997 and 2007 and in most cases, urban households’ cheapest maize meal option is to obtain maize grain and have it custom-milled for a fee. However, maize grain is not consistently available in public markets during the lean season, from December through March, and many households who would otherwise rely on custom-milled maize meal are forced to switch to the more expensive commercially-milled maize meal and maize meal substitutes. A crucial strategy, therefore, for GRZ to promote its objectives of improving access to food for low-income urban consumers is to ensure that maize grain is available in public markets at all times, rather than respond to national production shortfalls by supporting import contracts for large milling companies. This could be achieved through a combination of supporting regional trade and/or releases of imported grain from South Africa onto local markets. The FRA could also release maize from domestic production onto local markets rather than only channeling it to large millers. Because custom-milled maize meal can be procured by consumers at roughly 60% to 85% of the cost of commercial packaged breakfast meal, policies that can effectively promote the consistent availability of grain in local markets can contribute to urban food security. A sixth and related finding is that many urban households that currently consume mainly commercially-manufactured mealie meal expressed an interest in consuming more maize meal from hammermills. However, inconsistent availability of maize grain for custom-milling and concerns about the quality and packaging of mugaiwa sold by vendors prevent many households from consuming hammermilled maize meal at this time. Many of these households are more keen to consume breakfast meal from hammermills (i.e., double dehulled maize meal) than straight-run mugaiwa. Therefore, policies and programs to improve the hygienic conditions at hammermills, to improve the quality of mugaiwa itself as well as its packaging, and to offer more types of mugaiwa (e.g., double dehulled) could help hammermills gain a larger share of the maize meal market and offer a competitive alternative to commercially-milled maize meal. Finally, UCS results indicate that in Kasama and Mansa, and particularly among relatively poor households in those cities, cassava is an important consumption item and that it serves as a buffer against high maize prices and poor maize grain availability during the lean season. Policies to support own production of cassava by urban households and to promote the availability of cassava products in public markets could therefore contribute to improved urban food security.

35
APPENDIX

36
Table A1. Household-level Reinterview Model Results (Probit) 1=Household interviewed in August 2007 and February 2008
0=Household interviewed in August 2007 only Explanatory variables Lusaka Kitwe Kasama Mansa Household characteristics in August 2007 Household size 0.014 -0.001 0.022 0.006 (2.23)* (0.21) (2.31)* (0.95) Log (total household expenditure) -0.012 -0.000 -0.046 -0.005 (0.48) (0.02) (1.28) (0.20) Years of education of household head -0.009 0.005 0.015 0.007 (2.08)* (1.13) (2.18)* (1.46) Female-headed household (=1) 0.024 -0.049 0.025 -0.006 (0.80) (1.48) (0.53) (0.18) Age of household head 0.002 0.004 0.004 0.002 (1.51) (3.26)** (2.25)* (1.34) Low cost residential area (=1) -0.059 0.026 -0.088 0.027 (1.48) (0.49) (1.32) (0.52) Medium cost residential area (=1) (reference group) High cost residential area (=1) -0.097 -0.018 -0.046 0.036 (1.73)+ (0.31) (0.54) (0.51) Household owns home (=1) 0.127 0.117 0.165 0.087 (3.90)** (4.11)** (3.78)** (2.73)** Main house has electricity (=1) 0.059 0.032 0.067 0.070 (1.63) (0.84) (1.10) (1.16) Main house has modern plumbing -0.060 0.026 -0.002 -0.040 (1.55) (0.79) (0.02) (0.73) Own a refrigerator/freezer (=1) 0.061 -0.029 -0.148 -0.157 (1.67)+ (0.82) (1.66)+ (1.97)* Own a car (=1) 0.019 -0.038 -0.074 0.014 (0.44) (0.86) (0.71) (0.24) Own a bicycle (=1) -0.041 0.009 -0.015 -0.022 (1.00) (0.31) (0.39) (0.69) Own a motorcycle (=1) -0.115 -0.009 --a -- a (0.63) (0.09) Own a standard well (=1) 0.036 -0.019 -0.196 0.053 (0.34) (0.34) (1.72)+ (1.40) Own a farm or smallholding (=1) -0.037 -0.048 -0.006 0.001 (0.65) (1.38) (0.18) (0.03) Own a landline telephone or cell phone 0.028 -0.003 -0.097 -0.069 (0.84) (0.08) (1.97)* (1.90)+ Own a television 0.009 0.018 0.132 0.139 (0.28) (0.58) (2.46)* (2.54)* Household member died in the last 12 months (=1) -0.054 0.043 -0.250 -0.002 (0.90) (1.02) (2.30)* (0.05) Dummy variables for February 2008 supervisor Lusaka Supervisor #1 -0.048 (1.60) Lusaka Supervisor #2 0.048 (1.77)+ Kitwe Supervisor #1 -0.048 (1.40) Kitwe Supervisor #2 -0.028 (0.90) Observations 717 715 359 350 Source: CSO/FSRP Urban Consumption Survey 2007/2008 Notes: Reported estimates are marginal effects (dF/dx). Absolute value of z-statistics in parentheses. ** significant at 1% level, * significant at 5% level, + significant at 10% level. aDropped because it perfectly predicts reinterview.
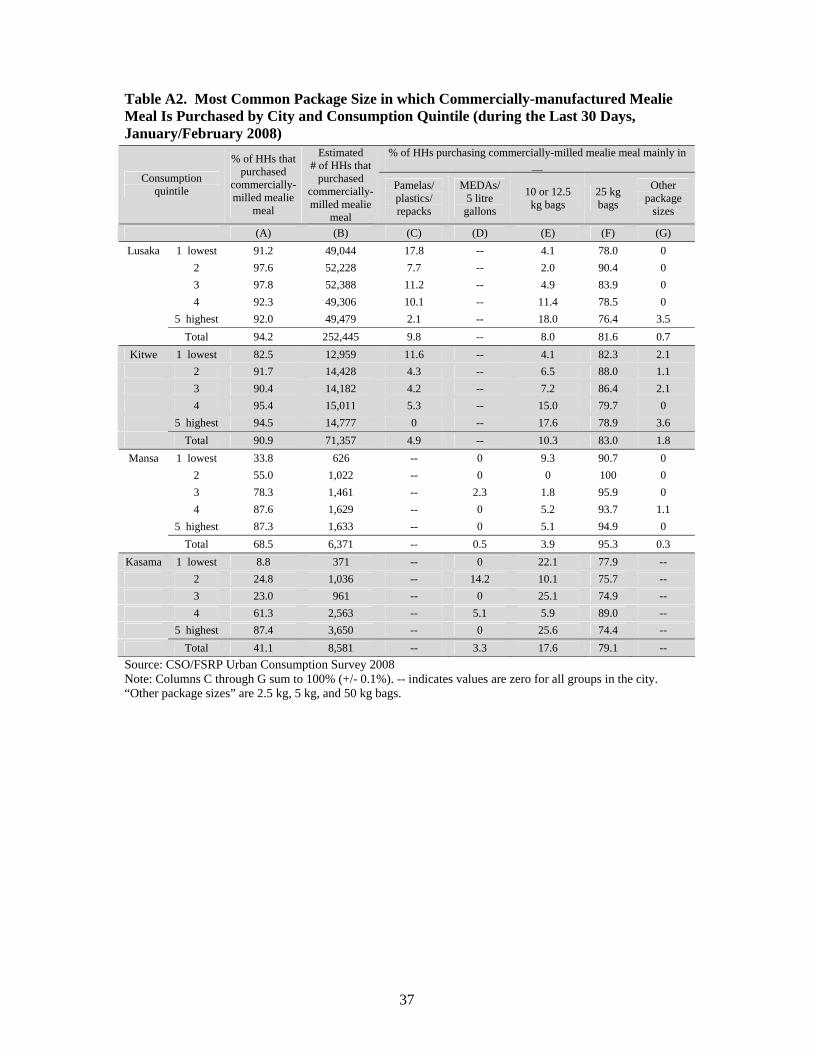
37
Table A2. Most Common Package Size in which Commercially-manufactured Mealie Meal Is Purchased by City and Consumption Quintile (during the Last 30 Days, January/February 2008)
Source: CSO/FSRP Urban Consumption Survey 2008 Note: Columns C through G sum to 100% (+/- 0.1%). -- indicates values are zero for all groups in the city. “Other package sizes” are 2.5 kg, 5 kg, and 50 kg bags.
% of HHs purchasing commercially-milled mealie meal mainly in __
Consumption quintile
% of HHs that purchased
commercially- milled mealie
meal
Estimated # of HHs that
purchased commercially- milled mealie
meal
Pamelas/ plastics/ repacks
MEDAs/ 5 litre
gallons
10 or 12.5 kg bags
25 kg bags
Other package
sizes
(A) (B) (C) (D) (E) (F) (G) Lusaka 1 lowest 91.2 49,044 17.8 -- 4.1 78.0 0
2 97.6 52,228 7.7 -- 2.0 90.4 0 3 97.8 52,388 11.2 -- 4.9 83.9 0 4 92.3 49,306 10.1 -- 11.4 78.5 0 5 highest 92.0 49,479 2.1 -- 18.0 76.4 3.5 Total 94.2 252,445 9.8 -- 8.0 81.6 0.7
Kitwe 1 lowest 82.5 12,959 11.6 -- 4.1 82.3 2.1 2 91.7 14,428 4.3 -- 6.5 88.0 1.1 3 90.4 14,182 4.2 -- 7.2 86.4 2.1 4 95.4 15,011 5.3 -- 15.0 79.7 0 5 highest 94.5 14,777 0 -- 17.6 78.9 3.6 Total 90.9 71,357 4.9 -- 10.3 83.0 1.8
Mansa 1 lowest 33.8 626 -- 0 9.3 90.7 0 2 55.0 1,022 -- 0 0 100 0 3 78.3 1,461 -- 2.3 1.8 95.9 0 4 87.6 1,629 -- 0 5.2 93.7 1.1 5 highest 87.3 1,633 -- 0 5.1 94.9 0 Total 68.5 6,371 -- 0.5 3.9 95.3 0.3
Kasama 1 lowest 8.8 371 -- 0 22.1 77.9 -- 2 24.8 1,036 -- 14.2 10.1 75.7 -- 3 23.0 961 -- 0 25.1 74.9 -- 4 61.3 2,563 -- 5.1 5.9 89.0 -- 5 highest 87.4 3,650 -- 0 25.6 74.4 -- Total 41.1 8,581 -- 3.3 17.6 79.1 --

38
Table A3a-A3d. Staple Substitutes Used by Households in Lusaka, Kitwe, Mansa, and Kasama When Maize Grain is Unavailable (for Households That Mainly Use Consumer-made Maize Meal) (Responses from August 2007 Survey) Table A3a. Lusaka
Consumption quintile % of households that consume ___ when maize grain is unavailable or too expensive 1 lowest 2 3 4 5 highest Purchased maize meal 67.6 70.3 100.0 84.5 83.8 Cassava flour 0.0 0.0 0.0 0.0 6.7 Rice 10.8 18.1 0.0 0.0 20.3 Bread / buns / fritters 15.4 8.8 12.9 10.0 36.4 Green maize 0.0 0.0 0.0 10.0 20.3 Roasted cassava 0.0 0.0 0.0 0.0 6.7 Spaghetti / macaroni / pasta 0.0 0.0 0.0 10.0 27.0 Source: CSO/FSRP Urban Consumption Survey 2007 Table A3b. Kitwe
Consumption quintile % of households that consume ___ when maize grain is unavailable or too expensive 1 lowest 2 3 4 5 highest Purchased maize meal 89.3 88.4 87.0 39.4 87.8 Cassava flour 15.6 12.1 0.0 0.0 4.7 Rice 26.1 56.9 56.4 80.5 75.1 Bread / buns / fritters 25.7 45.6 46.5 43.4 35.5 Green maize 32.3 23.2 9.9 47.4 9.3 Roasted cassava 10.3 11.7 8.2 35.5 0.0 Spaghetti / macaroni / pasta 0.0 0.0 5.7 0.0 23.2 Source: CSO/FSRP Urban Consumption Survey 2007 Table A3c. Mansa
Consumption quintile % of households that consume ___ when maize grain is unavailable or too expensive 1 lowest 2 3 4 5 highest Purchased maize meal 24.4 33.0 16.8 36.2 46.3 Cassava flour 89.2 85.4 80.8 95.9 91.5 Rice 5.7 17.1 27.8 18.3 23.4 Bread / buns / fritters 0.0 3.6 7.8 0.0 0.0 Green maize 1.6 3.9 15.0 0.0 0.0 Roasted cassava 13.0 12.2 12.9 10.3 8.5 Spaghetti / macaroni / pasta 0.0 0.0 0.0 0.0 0.0 Source: CSO/FSRP Urban Consumption Survey 2007 Table A3d. Kasama
Consumption quintile % of households that consume ___ when maize grain is unavailable or too expensive 1 lowest 2 3 4 5 highest Purchased maize meal 30.3 22.9 59.8 50.3 21.3 Cassava flour 79.2 73.1 70.3 80.8 39.3 Rice 32.1 50.1 36.3 51.4 69.9 Bread / buns / fritters 7.7 20.5 32.6 18.4 49.1 Green maize 27.4 12.8 4.9 8.5 5.9 Roasted cassava 36.8 11.9 17.6 9.6 31.5 Spaghetti / macaroni / pasta 0.0 0.0 0.0 0.0 0.0 Source: CSO/FSRP Urban Consumption Survey 2007
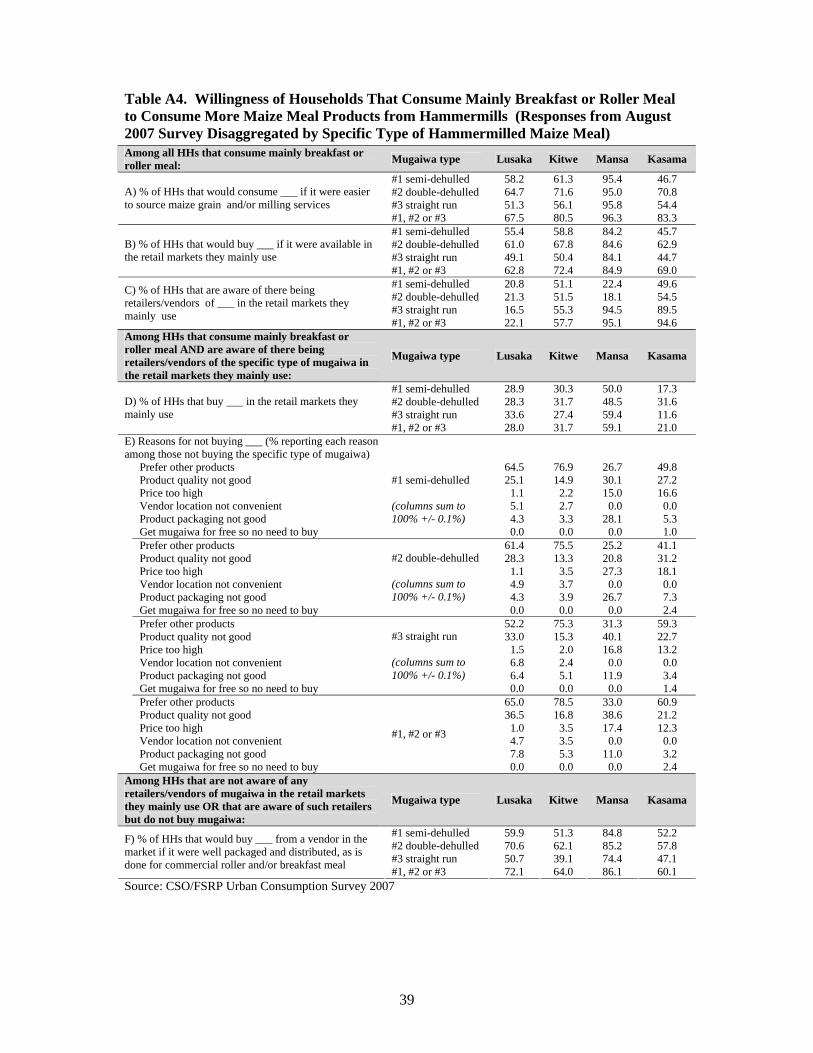
39
Table A4. Willingness of Households That Consume Mainly Breakfast or Roller Meal to Consume More Maize Meal Products from Hammermills (Responses from August 2007 Survey Disaggregated by Specific Type of Hammermilled Maize Meal) Among all HHs that consume mainly breakfast or roller meal: Mugaiwa type Lusaka Kitwe Mansa Kasama
#1 semi-dehulled 58.2 61.3 95.4 46.7 #2 double-dehulled 64.7 71.6 95.0 70.8 #3 straight run 51.3 56.1 95.8 54.4
A) % of HHs that would consume ___ if it were easier to source maize grain and/or milling services
#1, #2 or #3 67.5 80.5 96.3 83.3 #1 semi-dehulled 55.4 58.8 84.2 45.7 #2 double-dehulled 61.0 67.8 84.6 62.9 #3 straight run 49.1 50.4 84.1 44.7
B) % of HHs that would buy ___ if it were available in the retail markets they mainly use
#1, #2 or #3 62.8 72.4 84.9 69.0 #1 semi-dehulled 20.8 51.1 22.4 49.6 #2 double-dehulled 21.3 51.5 18.1 54.5 #3 straight run 16.5 55.3 94.5 89.5
C) % of HHs that are aware of there being retailers/vendors of ___ in the retail markets they mainly use #1, #2 or #3 22.1 57.7 95.1 94.6 Among HHs that consume mainly breakfast or roller meal AND are aware of there being retailers/vendors of the specific type of mugaiwa in the retail markets they mainly use:
Mugaiwa type Lusaka Kitwe Mansa Kasama
#1 semi-dehulled 28.9 30.3 50.0 17.3 #2 double-dehulled 28.3 31.7 48.5 31.6 #3 straight run 33.6 27.4 59.4 11.6
D) % of HHs that buy ___ in the retail markets they mainly use
#1, #2 or #3 28.0 31.7 59.1 21.0 E) Reasons for not buying ___ (% reporting each reason among those not buying the specific type of mugaiwa)
Prefer other products 64.5 76.9 26.7 49.8 Product quality not good 25.1 14.9 30.1 27.2 Price too high 1.1 2.2 15.0 16.6 Vendor location not convenient 5.1 2.7 0.0 0.0 Product packaging not good 4.3 3.3 28.1 5.3 Get mugaiwa for free so no need to buy
#1 semi-dehulled (columns sum to 100% +/- 0.1%)
0.0 0.0 0.0 1.0 Prefer other products 61.4 75.5 25.2 41.1 Product quality not good 28.3 13.3 20.8 31.2 Price too high 1.1 3.5 27.3 18.1 Vendor location not convenient 4.9 3.7 0.0 0.0 Product packaging not good 4.3 3.9 26.7 7.3 Get mugaiwa for free so no need to buy
#2 double-dehulled (columns sum to 100% +/- 0.1%)
0.0 0.0 0.0 2.4 Prefer other products 52.2 75.3 31.3 59.3 Product quality not good 33.0 15.3 40.1 22.7 Price too high 1.5 2.0 16.8 13.2 Vendor location not convenient 6.8 2.4 0.0 0.0 Product packaging not good 6.4 5.1 11.9 3.4 Get mugaiwa for free so no need to buy
#3 straight run (columns sum to 100% +/- 0.1%)
0.0 0.0 0.0 1.4 Prefer other products 65.0 78.5 33.0 60.9 Product quality not good 36.5 16.8 38.6 21.2 Price too high 1.0 3.5 17.4 12.3 Vendor location not convenient 4.7 3.5 0.0 0.0 Product packaging not good 7.8 5.3 11.0 3.2 Get mugaiwa for free so no need to buy
#1, #2 or #3
0.0 0.0 0.0 2.4 Among HHs that are not aware of any retailers/vendors of mugaiwa in the retail markets they mainly use OR that are aware of such retailers but do not buy mugaiwa:
Mugaiwa type Lusaka Kitwe Mansa Kasama
#1 semi-dehulled 59.9 51.3 84.8 52.2 #2 double-dehulled 70.6 62.1 85.2 57.8 #3 straight run 50.7 39.1 74.4 47.1
F) % of HHs that would buy ___ from a vendor in the market if it were well packaged and distributed, as is done for commercial roller and/or breakfast meal #1, #2 or #3 72.1 64.0 86.1 60.1 Source: CSO/FSRP Urban Consumption Survey 2007

40
REFERENCES CSO. 2003a. Zambia 2000 Census of Population and Housing: Zambia Analytical Report 10.
Lusaka: CSO. CSO. 2003b. Zambia 2000 Census of Population and Housing: Migration and Urbanization
2000 Census Report. Lusaka: CSO. http://www.zamstats.gov.zm/media/mig_rpt.pdf CSO. 2008. The Monthly. 68. Lusaka: CSO.
http://www.zamstats.gov.zm/media/vol_68_2008_the_monthly_november_final.pdf CSO. Various. Quarterly Employment and Earnings Survey Report. Lusaka: CSO. CSO/FSRP. 2007. Urban Food Consumption/Expenditure Survey 2007/2008 Interviewers
Instruction Manual, August 2007. http://www.aec.msu.edu/fs2/zambia/UCS_Round2_EnumeratorTraining_Manual.pdf
FSRP/MATEP. 2007. CSO/FSRP Zambia Urban Food Consumption/Expenditure Survey
Summary of Organization, Objectives, and Key Concepts. http://www.aec.msu.edu/fs2/zambia/CSO_FSRP_Urban_Food_Survey_Overview_ July17_2007.pdf
GRZ. 2008. Zambia Millennium Development Goals: Progress Report 2008.
http://www.amblusaka.um.dk/NR/rdonlyres/86D06545-9707-44EA-9692-8061A6108B9C/0/UNDPrapportZambia.pdf
Jayne, T.S. and S. Jones. 1997. Food Marketing and Pricing Policy in Eastern and Southern
Africa: A Survey. World Development 25.9: 1505-27. Haggblade, S. and M. Nyembe. Commercial Dynamics in Zambia’s Cassava Value Chain.
FSRP Working Paper No. 32. Lusaka, Zambia: Food Security Research Project. http://www.aec.msu.edu/fs2/zambia/wp_32.pdf
Hichaambwa, M., M. Beaver, M. Weber, and A. Chapoto. 2009. Patterns of Urban
Consumption and Expenditure in Zambia: A General Report Based on the CSO/MACO/FSRP Urban Consumption Survey in Urban Areas of Lusaka, Kitwe, Mansa, and Kasama, 2007-2008. FSRP Draft Working Paper. Lusaka, Zambia: Food Security Research Project.
Mason, N.M., T.S. Jayne, C. Donovan, and A. Chapoto. 2009. Are Staple Foods Becoming
More Expensive for Urban Consumers in Eastern and Southern Africa? Trends in Food Prices, Marketing Margins, and Wage Rates in Kenya, Malawi, Mozambique, and Zambia. MSU International Development Working Paper No. 98. East Lansing, Michigan: Michigan State University Department of Agricultural, Food, and Resource Economics. http://www.aec.msu.edu/fs2/papers/idwp98.pdf
Potts, D. 2006. Urban Growth and Urban Economies in Eastern and Southern Africa: Trends and Prospects. In African Urban Economies: Viability, Vitality or Vitiation?, ed. D.F. Bryceson and D. Potts. New York: Palgrave MacMillan.

41
Reardon, T., C.P. Timmer, C.B. Barrett, and J. Berdegué. 2003. The Rise of Supermarkets in Africa, Asia, and Latin America. American Journal of Agricultural Economics 85.5: 1140-46.
Stampley, G.L. 1993. Demographic and Expenditure Profiles of Zambian Households: Evidence from the June 1991 Zambian Household Expenditure and Income Survey. Iowa State University Staff Report 93-SR 63. Ames, Iowa: Iowa State University. http://www.card.iastate.edu/publications/DBS/PDFFiles/93sr63.pdf
Tschirley, D., M. Ayieko, M. Hichaambwa, J. Goeb, and W. Loescher. 2009. Modernizing
Africa’s Fresh Produce Supply Chains without Rapid Supermarket Takeover: Towards a Definition of Research and Investment Priorities. Paper prepared for the International Livestock Research Institute conference Towards Priority Actions for Market Development for African Farmers, 15-17 May. Nairobi, Kenya. http://www.agmarketsafrica.org/docs/conference%20papers/Break%20Out%20Sessions%27papers/Tschirley%20et%20al-9june09.doc
UNPD. World Population Prospects: The 2006 Revision and World Urbanization Prospects:
The 2007 Revision. New York: Population Division of the Department of Economic and Social Affairs of the United Nations Secretariat. http://esa.un.org/unup
Weatherspoon, D.D. and T. Reardon. 2003. The Rise of Supermarkets in Africa: Implications
for Agrifood Systems and the Rural Poor. Development Policy Review 21.3: 333-55.