food prices and inflation - brookings institution e. hathaway international division, the ford...
TRANSCRIPT
DALE E. HATHAWAY
International Division, The Ford Foundation
Food Prices and Infation
EVERY ADMINISTRATION SINCE WORLD WAR II has worried about in- flation or recession at one time or another during its term in office-some- times simultaneously. But except for the period immediately after World War II and the Korean War year, 1951, the price record of the United States was admirable by world standards until the mid-1960s, when the pressures of expenditures on the Vietnam War again made inflation a serious economic and political issue.
By the end of 1971 the inflation rate had subsided and "full employment without inflation" was once again a reasonable promise if not quite a real- ity. Meanwhile discussion of macroeconomic issues focused on monetary versus fiscal policy, shifting Phillips curves, and the use of public employ- ment programs to avoid "stagflation."
But suddenly professors and policy makers alike were confronted with a new phenomenon, which originated in the late 1960s and exploded in 1972-73. For the first time since the Korean War farm and food prices began to contribute substantially to inflationary pressures in the economy. Food prices have significance even beyond the 25 percent of the cost of living index they represent. Politically, they probably are the most sensitive item in the index inasmuch as people buy food far more frequently than services and other commodities, and these other items change in form if not in function over time.
Note: I have benefited from the comments of James Bonnen, Carroll Brunthaver, Lowell Hardin, Glenn Johnson, Vernon Sorenson, John Schnittker, and participants in the Brookings panel.
63
64 Brookings Papers on Economic Activity, 1:1974
Economic advisers were surprised, if not confused, by this new turn of events, for they understood neither its causes nor its cure. Their ignorance and confusion arose partly from the fact that the legislative and executive branches tend to make food policy in isolation, even though, as contempo- rary events amply demonstrate, it is deeply significant to total national and international economic policy.
As visible evidence of this isolation, the last full-blown hearings on agri- culture and the nonfarm economy by the Joint Economic Committee of the Congress were held in 1957; Gary L. Seevers, appointed in June 1973, is the first card-carrying agricultural economist to be a member of the Council of Economic Advisers since 1961 and only the fourth in the history of the council; and the White House and State Department have aban- doned any serious attempts to liberalize agricultural provisions in the last three GATT negotiations.
Agricultural price, income, and trade policies have rested largely in the hands of farmer-oriented congressional committees; the U.S. Department of Agriculture, which views commercial farmers as its primary clients; and the director of the Bureau of the Budget, whose major concern is to hold down expenditures on programs to support farm prices and incomes. The Council of Economic Advisers has injected itself into the agricultural policy process only sporadically, primarily on issues relating to subsidy costs, and with limited success.
This neglect of farm policy has now ended, temporarily at least, as the events since late 1972 have made food and fiber prices the leader in the worst inflationary march since the late 1940s. This paper examines several questions. First, what has been the role of farm and food prices in the cur- rent inflation? Second, what short-term events and long-term policies led to the serious rise in these prices? Third, are recent and current food prices merely a temporary aberration arising from bad policy and bad luck or do they represent a new and permanent source of inflationary pressure in the economy? Finally, what are the economic implications of what has already occurred and is likely to occur in the next year or two?
Food Prices and Inflation
The sudden and unusual contribution that retail food prices have made to inflation is shown in Table 1, which presents simple ratios of the index of these prices to that for all other items in the consumer price index.

Dale E. Hathaway 65
Table 1. Ratio of Consumer Price Index for Food to Index for All Items Less Food, Annually, 1954-73, Monthly, 1972-74 Based on indexes, 1967 = 100
Annual ratio Monthly ratio
Year Ratio Month 1972 1973 1974
1954 1.04 1955 1.02 1956 1.01 January 0.97 1.01 1.13 1957 1.01 February 0.98 1.03 1.15 1958 1.03 March 0.98 1.05 1.15 1959 1.00 April 0.98 1.06 1960 0.99 May 0.98 1.06 1961 0.99 June 0.98 1.07 1962 0.99 July 0.99 1.08 1963 0.99 August 0.99 1.14 1964 0.99 September 0.99 1.13 1965 1.00 October 0.98 1.11 1966 1.02 November 0.98 1.12 1967 1.00 December 0.99 1.13 1968 0.99 1969 0.99 1970 0.98 1971 0.97 1972 0.98 1973 1.08
Sources: Economic Report of the President, February 1974, p. 301; U.S. Bureau of Labor Statistics, News Release, USDL-74-188 (April 19, 1974), Table 2.
From 1954 to 1972, the ratio moved in the narrow range from 97 to 104. Only in 1958 and 1966 did it rise as much as 0.02. On the whole, food prices rose a bit less rapidly than nonfood prices. However, the ratio of food prices to all other prices took off in January 1973. Rising at an increasingly rapid rate throughout much of the year, food prices turned into a torch that fueled the worst inflation in more than two decades. Thus, compared with a year earlier, the CPI at the end of 1973 was up 8.8 percent and its food component was up 20.1 percent. Food prices rose four times as rap- idly during 1973 as did nonfood items; and economic policy makers con- fronted a source of inflation that traditional monetary and fiscal tools were impotent to cap.
One shift involved in the recent rise in retail food prices was especially significant. Basically, from 1955 to 1965 the prices of food and fiber at the farm level were stable-especially in the crop component of the index, which averaged less in 1970 than in 1955 (Table 2). But starting in 1965, in

I- cso In I o
m t- iOoooo OOOCNO
-t
I- knC4WI0 t- e V ~ q k
C71 .X
'i 0-- "- N 1 00 )e
0' I
A ~~~~E (ON 0 ON(N I 0NO C N NC
~~~~~~~~"t q oo (N m O I^N O
A S oo oo ooX t N N o~a No0oo
o~~~~~~~~c tt CX c N oo ^ mt O oeo
1. 00a ON N ~ N
\0 000
riA
^~~ ~~~~~~~~ . . . ...
X~~~~~~~~~~~0 OC 00 Ct O N C? o N Co (3 C
Y~~~~~~~~~~~" C 1o< 01 0oC l
Po OC 0 00 0 00 0 00 OC CN C
s- - tON
v~~~~~~~~~~~i tn tni A o , ,
oN oo C 00 o oo oo a
II 1001 s? c to Cooo

-ct-0 0W 0 t- W 0 -
r-.q ~ ~ ~ ~ ~ ~ ~ ~ ~ ~ ~ ~ -
0-
00 C~~ 00 0 (0~~ ~c 00 en ~~c 10
IS,
r-.q ~ ~ ~ ~ ~ ~ ~ .
OC) W) en 00 eq 00 N C)~~~~~~00~
0 0
--- -- 00~ Zl0 0
--- - --- 00- N- 0
:
C - '.- r .- . - -. en -- N - i - - t- -0 0- oo
N en W 00 0 r-14 r-.q r--o .
ota~~~0efoo OtOOef- ~~~~~-~~CMot'r ) e o.0
0~~0~~000 -~~~~CMM ICMCM ~~~~ene j- 'r ~
- - - - - - - - - ,-4 - - -~~~~~~~ c- oo-
en 00 0~ r4 r4 cli 14 W; r4 0~ 116 C; o o6 C' C, 0 0 1,1 N N N enen Zl Jo W
CM ~ ~~~i- ~~~ 0

68 Brookings Papers on Economic Activity, 1:1974
every year but 1967 and 1971 the prices received by farmers for livestock and products increased, with a resulting slow but fairly steady increase in the index of all farm prices. In 1971 the index moved further upward even though the livestock production cycle led to a slight reduction in livestock prices. The index continued upward irregularly throughout 1972, marking advances in eight of the twelve months, including a 5 percent advance in December alone. This acceleration gathered even greater momentum in 1973, with crop prices leading the way. Furthermore, farm prices were in the van of inflation: from December 1972 to December 1973, they rose 34 percent, while wholesale and retail food prices were up 23 percent and 20 percent, respectively.
Thus, in essence, the last twenty years comprise three distinct periods: (1) stable farm prices were a stabilizing force on the consumer price index from the mid-1950s until about 1969; (2) from 1969 to 1972 farm and food prices essentially matched the nonfood rate of inflation; and (3) beginning in late 1972 and continuing into early 1974, farm and food prices have been a major source of the rise in the cost of living. From 1972:4 to 1973:4 food prices accounted for 55 percent of the rise in the CPI.1
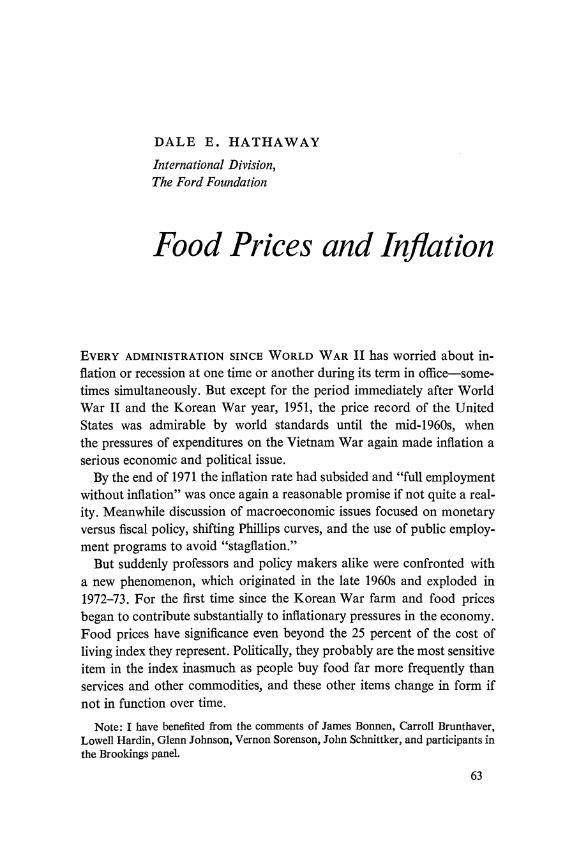
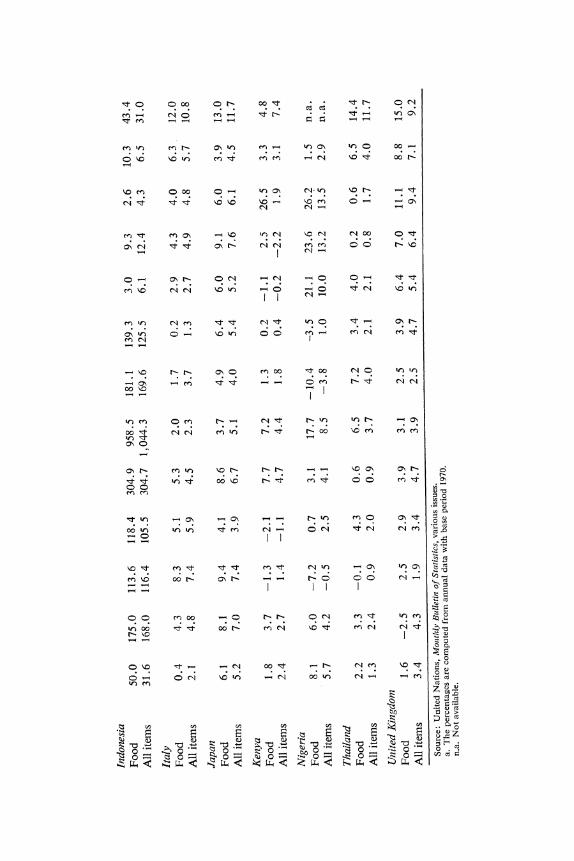
Recently, other countries have been caught in the same squeeze or worse, as Table 3 demonstrates. Various types of countries experienced different patterns of behavior of food prices. First, the major developed and food- exporting countries, such as the United States, Canada, Australia, and France, enjoyed a decade of relatively stable food prices in the 1960s; a modest rise occurred in 1966 because the great drought in India exerted pressure on grain exports and hence on prices.
Second, the major developed food-importing nations-Japan, Germany, the United Kingdom, and Italy-experienced much the same stability in food prices during the sixties, as these prices were dependent on their internal supports, which were usually above world markets, and on the ready availability of imported food and feed grains at or below these internal prices. Generally, the rise in prices of nonfood items exceeded that for food at retail; in that sense farm prices held down the overall rate of inflation. In Japan, however, the rise in the index of food prices exceeded that in the overall CPI in eight of the nine years, 1961-69.
Finally, a number of less developed countries-whether self-sufficient
1. Joel Popkin, "Commodity Prices and the U.S. Price Level," this issue, p. 256.
Dale E. Hathaway 69
or net exporters, like Brazil, or net importers, like India and Indonesia- were not as fortunate as the richer ones. In India food prices have risen faster than the total consumer price index in about three-fourths of the years since 1961. Brazil and Indonesia are classic examples of runaway in- flation in the early 1960s, which pushed prices for food and all other items up at rates that are incomprehensible to most economists. Thailand, nor- mally a food grain exporter, experienced increases in food prices that exceeded the rate for nonfood items in nine of the past thirteen years.
In this light, an "it can't happen here" attitude on the part of economic advisers in the United States and other developed countries was not sur- prising. Given the record of 1961-72, they saw food price inflation as the product of backward agriculture and inadequate foreign exchange, and felt that they could safely ignore food prices as potential fuel on the infla- tionary fires in their own economies.
The awakening came in 1973. Economic advisers in the United States and other rich countries found that it can happen here and with a ven- geance! By December 1973 retail prices for meat, poultry, and fish in the United States were 26.4 percent above a year earlier, cereals and bakery products were up 28.2 percent, dairy products 22.5 percent, and all food at retail 20.1 percent; wholesale prices rose even more. At that point, the end to the rise in retail food prices was not in sight. For one thing, the lag in adjustment of meat animal prices to higher feed prices was not completed. For another, the spread between farm and retail prices had yet to adjust to the higher costs in the marketing sector of the food system as the past increases in the CPI were reflected in new labor and materials contracts.
INFLATION AND FOOD PRICES
The relationship of food prices and inflation works in both directions. Nonfood inflation has an important effect on the supply and cost of food in the United States. First, U.S. farmers are heavily dependent upon pur- chased inputs-fertilizers, chemicals, tractors, petroleum products, capital, and labor. Maintaining or expanding output has become more expen- sive; and it was inevitable that, sooner or later, some upward shift in the nominal prices of farm products would be required to spur farm output as demand expanded. The reasons this rise did not occur until the early 1970s will be discussed below.
all .s t tn N N t . tn ~~~W) to cn Wo CN eno
ON - - - M.
tN ten~ 00 00 -00 ~c 00 ON M t-1 Nt en
Po ON .
4) ~~~~~~~~~CM C
F ON O N ON
ON >
Po r- en 0 0o en W) en oN ON tn
ON 1- 00 Ot NO C 10 .Cec t1010
4- Po C., (7010 - en 0 t t oc en 0
Q ~ ~ ~~~C 00 r- C) C) t- I'l t- t- ^ N *) *) W
o 00
en~~~~W W) *0 * im s c N o
eo~~~~O N 00e N e nC
- ~ ~ ~ ~ e C ) -~ CN )e
; ^t NN Not ^t ^t o ^NC;r4 C
X t o 10CM ( f 00~ N CMC 0B '-B ^
o > m N N ^ t t B ^ N N o o V CMQ 00O 101 X-e o b^ t1 Ce N^ t
; 8N CMn 10 0'-n CMC CMC eNe 0^?O~
ce~~ Oz O^ ~OO ~ t eo 00 Bt^
Q 10e m1 ^ -m t CMI -0 OX -
> O CM ooei ̂ b -e eBO 101 ^ CtMn
> (2 I CMo Or B F OO~ 0n 0 0CM
a ofi bi )C O0 -0 t biOb
n n: irT8 ? Xr?_4r
S r? S Sr' r?S Nr ?
t0 0 00 0 t- 0OOi C ~,I 1 C t
* . . . . U ' * * *
t -- - - - -q -
o o 0- m CN* 0t- m cf
0- Ot - OCN -i _0 ( n 01 0? O
rt cc ~o'f - No -o trci .c'
I >, ~~I ~c 0
00 ~~~~~~~~~~~~~0~0 o~~~~~~0 C9 I" n noo
CTI
oo zt N N e n o) - co en en en
W - zj r o~ -- - -q ~
ON~~~~~ I N
to tnO O ^N
* * . . * * * *
00 0
00
I I I
m ^ ~~~~~~~~~~~~~~o ^N :t :3 0
0 0
Oo 00 t_: C"l to tn b t b co XD
-~~~~~~~~~~~~~~~~~~~~~~~~~~~~~~~~~~~~~~~~~~~~~~~~~~~~~~~~~-
*-4!
awz
O t t tX XO 1
Ncol C, 4
.t gi
72 Brookings Papers on Economic Activity, 1:1974
A second element in food prices is the transportation and marketing of farm products. These services are performed off the farm by large- and small-scale businesses whose costs steadily rise under inflation and who have some ability to pass these costs through to consumers.
Thus, a spiral may be in the making. In 1973 the rise in retail food prices became an important source of inflation in the United States for the first time since the Korean War; and now, the past and current inflation has significant implications for current and future food prices. This situation poses several questions: What set off the worldwide explosion in farm product prices? Is it likely to continue, level off, or recede to 1972 levels? What, if any, policy actions can be taken to alleviate the situation?
A review of some of the fundamental economics of the agricultural industry may help to explain what happened and why.
How the Agricultural Economy Works
Numerous incorrect statements and wrong decisions relating to food prices emanate from persons with great professional reputations and major policy responsibilities. Apparently the economics of agriculture is not fully understood by ministers of agriculture and is even less well perceived by economic advisers and ministers of finance. Agricultural economists have found no eager audience for their subject except in unusual times, and they have contributed little to the public's education.
AGRICULTURAL DEMAND
Understanding begins with the basic elements of demand-(1) popula- tion growth and (2) changes in personal income. In the rich countries, the increases in demand for farm products arising from population growth have been small and declining over the past two decades. But in all but a few poor countries, despite family planning programs, population grows at an appalling pace. I shall come back to this matter in another context.
The second element in demand is growth in per capita income, which operates through the income elasticity of demand for food. In rich coun- tries like the United States, the income elasticity of demand for protein from animal sources-red meat, poultry, and fish-is high; and so is the income elasticity for food-related services-packaging, convenience foods,
Dale E. Hathaway 73
and eating out.2 Moreover, food consumed in the form of animal products requires four to seven times as many calories of grain per person as are required to achieve the same human calorie intake from grain eaten directly.
In poor countries the income elasticity for food grains is positive and relatively high.3 Thus, in less developed countries any real growth in per capita income is translated directly into intensified demand for food grains and, progressively, into demand for animal products to improve the diet, raise protein intake, and supplant vegetable protein.
The final element on the demand side is the extremely low price elasticity of demand for food in the aggregate in both rich and poor countries. Thus, given demand, a modest reduction in supplies will produce sharp price increases, and a modest increase in supplies induces a sharp decline in prices.
AGRICULTURAL SUPPLY
On the supply side, agriculture in the developed countries is generally a capital-intensive, labor-saving, high-energy, high-technology industry. Western Europe uses more labor than the United States and Canada; and in Japan, the industry is characterized by labor intensity and small scale, although it also relies heavily on technology. In the developing world, agriculture is primarily a labor-intensive, capital-poor, low-technology industry still carried on largely by subsistence units producing relatively little marketable surplus beyond family needs.
Asset fixity. Another characteristic of agricultural supply is that, once committed to agricultural production, resources are likely to remain there even though returns to them vary widely and may be quite low for extended periods. The specialized nature of these resources is in part responsible:
2. The income elasticities of selected meats are as follows:
United States Western Europe Japan
Beef and veal 0.50 0.51 0.70 Poultry 0.30 0.72 0.90 Pork -0.20 0.32 0.90 All meat 0.24 0.44 0.79
These data are from Food and Agriculture Organization of the United Nations, Agri- cultural Commodity Projections, 1970-1980 (Rome: FAO, 1971), Vol. 2, Table B.
3. For India FAO estimates the income elasticity for rice at 0.40; for wheat, 0.50; for coarse grains, - . 17; and for all grains 0. 25.

74 Brookings Papers on Economic Activity, 1:1974
What is the alternative value (opportunity cost) of ground-tilling equip- ment elsewhere in an economy, whether it be an $18,000 John Deere tractor and plow in the United States or a wooden plow and rice-puddling equipment in India? Even in the United States and other developed economies, the same kind of question can be asked about agricultural labor, especially that of family members on owner-operated farms. This characteristic is called "asset fixity," and significantly affects the output response to changes in product prices.4
In advanced economies both the public and private sectors constantly develop new technologies that, when adopted, increase farm output; given low price elasticities for farm products, their adoption lowers farm prices and returns on many resources employed in the industry, and disgruntles farmers. In general this situation can be termed overcapacity, inasmuch as the industry has too many resources to permit all of them to earn satisfac- tory returns in a free market. Also implied by overcapacity is a kinked or even discontinuous supply curve that is highly inelastic with respect to falling prices; relatively elastic over a certain range of production with rising prices; and highly inelastic beyond a point determined by both technical and economic conditions.
Competitive structure. In both developed and less developed countries, agriculture meets most of the conditions economic theory sets out for a competitive industry. It has many producers, each of whom faces a com- pletely elastic demand, even though the aggregate demand for its total output is highly inelastic. This structure provides an incentive for the rapid adoption of output-increasing technology by the individual farmer where it is available and other constraints do not interfere. One important element of the underlying conditions for a competitive industry is lacking, how- ever-perfect knowledge on the part of producers regarding future output prices at the time production and investment decisions are made.5
4. Asset fixity characterizes resources in agriculture that earn an amount that, if capitalized, exceeds their salvage value outside the industry (opportunity cost) and is less than their acquisition value (the cost of currently acquiring similar assets to enter the industry). This concept was developed by Glenn L. Johnson in "Supply Function- Some Facts and Notions," in Agricultural Adjustment Problems in a Growing Economy (Iowa State College Press, 1958), pp. 74-93, and is discussed at length in Dale E. Hatha- way, Government and Agriculture: Public Policy in a Democratic Society (Macmillan, 1963), Chap. 4.
5. Futures markets of a year's duration do little to reduce this uncertainty, because most capital investments are for much longer periods and the production period for most livestock products substantially exceeds this period.

Dale E. Hathaway 75
It is this combination of inelastic aggregate demand, asset fixity, rapid availability and adoption of new technology, and competitive structure that resulted in continuing overcapacity in agriculture in the United States, Canada, and other developed countries from the mid-1950s until about 1970. This situation meant low farm prices; low food prices despite rising marketing costs; and on the average, low incomes for farmers relative to nonfarmers, except in countries with extraordinary government subsidies or protective measures.6 The agricultural policies of both rich and poor countries were made in this context over the past two decades, bringing them to the situation of 1973.
Calorie conversion. Animal agriculture in the United States and most other rich countries is essentially a process by which calories in the form of grain, protein supplement, and in some cases forage, are converted into calories that are consumed in the form of red meat and poultry. Perhaps the purest conversion is in the modern broiler and egg industry, where the price of feed grains and protein supplements make up 70 percent of total production costs and are reflected almost immediately in the prices of the final products. If, as in the case of the United States in the summer of 1973, the retail price of broilers or eggs is suddenly frozen, production drops precipitously and the products disappear from the retail store.
Much the same holds true for milk and pork production in the United States, although the longer production process retards the adjustment somewhat. In Western Europe, where milk and beef are still largely joint products from a dairy industry, using more forage (grass) and less feed grains, the adjustment of meat and milk output and prices to altered prices of feed grains and protein supplements is somewhat smaller and slower, assuming no change in demand.
Excess capacity in grain production in the United States and other devel- oped countries in the 1960s brought low grain prices, and government intervention kept them stable. Such prices in turn encouraged the expan- sion of livestock and poultry production based upon the heavy feeding of grains and protein supplements, at the same time that low prices and rising consumer incomes were stimulating heavier consumption of poultry and meats.
6. Developed countries that import farm products also were contributors to the excess capacity problem. In all cases they used some kind of import barriers or income supple- ments to maintain high internal prices. Thus, the resources employed in agriculture in those countries could not earn acquisition costs in the absence of such protection.

76 Brookings Papers on Economic Activity, 1:1974
Supply in the LDCs. In the underdeveloped countries the agricultural supply situation is even more complex. The industry is plagued with massive underemployment, human and capital resources with low pro- ductivity, and antiquated technology. Thus, the supply curve for farm products is highly inelastic due to physical constraints, and increases in supply can come only from the expansion of cultivated area or adoption of new technology by millions of illiterate or semiliterate peasant farmers. Moreover, since most of the new technologies are land saving but capital using (high-yielding seeds, fertilizers, pesticides, and so on) and require skilled management, they are in most cases adopted slowly and only in the few areas where credit, risk, and management conditions allow. Thus, the Green Revolution, as it is commonly understood, is not won. The battle plans are still being formed.
Despite their difficulties in expanding agricultural output, the under- developed countries have sacrificed the price incentive needed to speed the adoption of new technology to pursue a cheap food policy for their urban consumers. Over much of the period from 1955 to 1970, the leaders in the LDCs were abetted in those policies by the large-scale provision of "sur- plus" grains generated by the excess capacity in developed countries, which was provided generously by the United States under the Food for Peace program of the Agricultural Trade Development and Assistance Act of 1954 (Public Law 480), and by other countries via various price- cutting devices.
Thus, in both rich and poor countries the price of grain largely deter- mines the price of food: in the former, because the prices of grains and protein supplements are major determinants of the prices of meat, poultry, and dairy products, and in the latter because grain is the primary food for humans. Moreover, there is a high elasticity of substitution between grains used for animal feed in the United States and other developed countries and the grain consumed directly in poor countries. Thus, in world markets there is a cross elasticity between food and feed grains that means that world shifts in the supply or demand of either affect U.S. prices.
Dealing with Excess Capacity
In the United States and other industrial countries, a combination of excess capacity in agriculture with full employment in the nonfarm econ-
Dale E. Hathaway 77
omy emerged soon after World War II, but was temporarily masked by the Korean War. Farm prices in the United States began to fall in 1952 and continued their decline through much of the decade. The decline in prices and income was mitigated, however, by the policies instituted before and during World War II, which required the U.S. government to intervene through the Commodity Credit Corporation (CCC) by purchasing key farm commodities-wheat, feed grains, cotton, and manufactured dairy products-at prices well above market-clearing levels.
The U.S. system of agricultural price supports and production controls is extremely complicated. An outgrowth of the New Deal, it survived the war in the form of floor prices guaranteed by government purchases of grains, cotton, tobacco, peanuts, soybeans, and manufactured dairy prod- ucts. The postwar prices were the wartime prices set to encourage maximum agricultural output, and the level was tied to, and moved up with, nonfarm prices.
These support programs were supplemented by acreage controls de- signed in the thirties to prevent an untoward accumulation of surpluses. Even so, throughout the fifties and early sixties, the acreage of individual crops could not be reduced below certain minimums; thus with rising yields per acre, the supply of supported products exceeded demand at the supported price, and the U.S. government had to acquire and hold the excess. Throughout the Eisenhower administration, the chief agricultural policy makers, supported by many agricultural economists, argued that excessively high support prices were the chief stimulus to excessive farm output; and major policy efforts were made to lower government support prices so as to hold down the steadily rising stocks of grains bought and held by the government.
This policy stirred a continuous battle between the administration and Congress over price support levels, the latter slowly retreating under the pressure of rising costs for acquiring, carrying, and disposing of the mount- ing stocks of farm commodities. To halt the rapid rise of stocks of grains, cotton, and manufactured dairy products during the mid-1950s, a special land-retirement program was introduced in the Agricultural Act of 1956 providing payments to induce farmers to plant less than their allotted acreages of cotton, wheat, and tobacco.7 Not until the early 1960s did Congress finally pass a program to control farm output effectively with- out building stocks.
7. 70 Stat. 188.

78 Brookings Papers on Economic Activity, 1:1974
Support programs priced U.S. farm products above world market prices, and to maintain export markets, the United States resorted to export sub- sidies in two forms. One was a straight government payment to commercial exporters to make up the difference between domestic market prices and the world price, which in turn was strongly influenced by the size of U.S. export subsidies.
The second was the famous P.L. 480. It allowed sales of U.S. farm prod- ucts to developing countries for foreign currencies; donations to meet emergencies; and later, sales for long-term credits with low interest rates and long repayment schedules. These commodities came at first from CCC stocks, but later from commercial supplies; the government paid U.S. ex- porters and accepted foreign currencies, which were held to pay U.S. gov- ernment costs overseas, in-country development programs, and the like. Thus, from the mid-1950s until the early 1970s, the United States was run- ning a three-price system for most commodities: (1) a domestic price; (2) a lower, subsidized, price for commercial exports for several crops; and (3) an even lower subsidized price for noncommercial exports to less devel- oped countries.
Importers had varied emotions toward U.S. policies. The European Eco- nomic Community used U.S. export subsidies as an argument to build its variable levy system. The United Kingdom and Japan presumably were pleased with U.S. willingness to subsidize their low-cost imports, as were LDCs that were short of food and thus importing.
Countries that competed with the United States for export markets, including some LDCs, were more of one mind, especially about P.L. 480, because they believed-probably correctly-that part of these sales de- prived them of commercial exports. But, since the United States is by far the world's largest grain exporter, they accepted its control of world prices for commercial exports of grains, if not always without protest.
Professional agricultural economists (including myself) were virtually unanimous in their condemnation of U.S. price and income policies. They had argued for years that U.S. farm prices should be allowed to drop toward market-clearing levels to permit exports without subsidies and to reduce the incentives for expanding U.S. agricultural capacity. In their con- cern for farmers' welfare, however, they supported limited direct payments to compensate for lower prices; and most agreed that these payments should aim to induce land retirement as a method of controlling output and prices at stable levels. These professionals were joined by the prestigious

Dale E. Hathaway 79
business group, the Committee for Economic Development, in a 1962 re- port.8 This and similar statements were vigorously opposed by the admin- istration, which at the time was attempting to push through a program to ensure high prices, production controls on individual farmers, and export subsidies.
Members of the new Democratic administration fought many battles on agricultural policy during 1961-64. They correctly assessed the problem as one of overcapacity and immediately set a goal of easing the budget burden occasioned by the acquiring, carrying, and disposing of "excessive" stocks of farm products. But their cure was unacceptable to a majority of the profession, the farmers, and the Congress. Defeated in its attempt to take a comprehensive restrictive approach in 1962, and again in 1963 (with respect to wheat), the USDA turned in 1964 and 1965 to the policy of low prices and direct income supplements that it had earlier opposed.
The new program, initiated under President Kennedy and finally passed in the early months of the Johnson administration, had three major fea- tures: (1) the drastic lowering of support prices on wheat, feed grains, and cotton; (2) the inauguration of direct cash payments to the producers of these crops in lieu of the higher market prices; and (3) a large-scale land- retirement program to reduce the excess capacity for grain. The land- retirement program combined the carrot of lucrative payments for the acreage reductions with the stick of withholding the direct payments from nonparticipants. Acreage withheld under government programs jumped from 28.7 million in 1960 to 53.7 million in 1961 and then varied between 55 million and 65 million over the next five years (Table 4). Except for 1967 and 1971, acreage withheld hovered in or near this range through 1972. In addition, the P.L. 480 sales were continued.
This program had several impacts. First, the acres planted to grains in the United States fell from about 200 million in 1954 to around 150 million in the sixties, mirroring the rise in land withheld under government pro- grams (Table 4). Second, the lower support prices ended the need for export subsidies on feed grains and cotton and lowered the subsidy for wheat. The lower domestic prices also fostered major increases in U.S. poultry and live- stock output by reducing one of its main costs, as well as encouraging an expanding poultry and livestock industry in Japan and several other coun- tries. Thus, much of U.S. policy was aimed at expansion of export demand.
8. An Adaptive Program for Agriculture, A Statement on National Policy by the Re- search and Policy Committee of the Committee for Economic Development (CED, 1962).

80 Brookings Papers on Economic Activity, 1:1974
Table 4. U.S. Harvested Acreage of Wheat and Feed Grains, and Acreage Withheld under Government Programs, Marketing Years 1954-55 to 1974-75 Millions of acres
Acres withheld
Harvested acreage under Marketing government
year" Total Wheat Feed grainsb programs
1954-55 200.2 54.4 145.8 0.0 1955-56 193.1 47.3 145.8 0.0 1956-57 180.4 49.8 130.6 13.6 1957-58 184.2 43.8 140.5 27.8 1958-59 187.8 53.0 134.8 27.1
1959-60 191.7 51.7 139.9 22.5 1960-61 188.6 51.9 136.7 28.7 1961-62 156.9 51.6 105.3 53.7 1962-63 145.6 43.7 101.9 64.7 1963-64 150.6 45.5 105.1 56.1
1964-65 146.9 49.8 97.1 55.1 1965-66 145.5 49.6 96.0 56.3 1966-67 147.7 49.9 97.8 63.2 1967-68 159.6 58.8 100.8 40.7 1968-69 152.4 55.3 97.1 49.4
1969-70 143.2 47.6 95.6 58.0 1970-71 142.6 43.6 99.0 57.0 1971-72 154.0 47.7 106.3 37.1 1972-73 141.3 47.3 94.0 61.5 1973-74 156.2 53.9 102.3 19.5 1974-75 171.4 64.3 107.1 2.6
Sources: Harvested acreage, U.S. Department of Agriculture, Agricultural Statistics, various years, and USDA, Foreign Agriculture Circular, FG6-74 (March 1974), p. 18; acres withheld, provided by USDA, Agricultural Stabilization and Conservation Service. The figures are rounded and may not add to totals.
a. The text frequently refers to only the first calendar year designated, although the marketing year spans portions of two successive calendar years.
b. Feed grains are corn, sorghum, barley, and oats.
With the advent of a Republican administration in 1969, the drive for less government intervention in agriculture and for expanded export markets was vigorously renewed, building upon the legislation enacted in the 1960s. The previous Democratic administration had finally espoused an export- oriented agriculture, but the Democrats had sought to manage supply through land retirement and moderate government stocks, while Repub- licans hoped to avoid government management of supply and reserve stocks of any kind. Like farmers, Republicans were convinced that govern- ment stocks, rather than excess capacity, were depressing farm prices.

Dale E. Hathaway 81
One factor militating against the effects of these export expansion poli- cies was the protectionist stance of the EEC. With its variable levy on grains, the EEC protected its producers by maintaining internal prices at high levels-twice the U.S. support price in the 1960s-and thereby made imports of wheat and feed grains a residual. The EEC also provided sub- sidies for surplus wheat to be used either as domestic feed or exports. The high internal grain prices discouraged intensive feeding of livestock and thus reduced the need for imports of feed grains and, by implication, the opportunity for U.S. exports.
The other major grain-exporting countries followed policies different from those of the United States. Both Canada and Australia operate na- tionalized marketing boards designed, in the case of wheat, to deal with the export trade. Acting as state trading units, the boards sell their wheat for what it will bring in world markets, thus subjecting their farmers to market forces, although both countries have an interest in grain prices that will satisfy their producers. Neither country imposes acreage controls, but in both, the wheat marketing boards can and do set delivery quotas for indi- vidual farmers. Since farm storage capacity is limited, this practice effec- tively deters output, although the farmer can use the land to raise either wheat for feed or feed grains that are not so controlled.
Throughout the developed world the psychology of farmers, political leaders, and agricultural economists for the decade and a half after the mid-fifties consequently was influenced by overcapacity, surpluses, and the search for markets, especially export markets. With the advent of the Green Revolution in the mid-1960s, fears of world surpluses worsened. Both the Food and Agriculture Organization of the United Nations (FAO) and the USDA projected that the food-deficit LDCs would become surplus grain producers; and it was proposed that exporting advanced economies restrict their agricultural output even more to provide export markets for LDCs in deficit developed countries.
However, slowly but surely several forces emerged to allay these fears. First, during the 1960s, the demand for farm products, especially grains, was rising, as world grain consumption, as inferred from "disappearance," rose every year, increasing from less than 900 million metric tons in 1960- 61 to 1,100 million metric tons in 1969-70.9
9. Disappearance is production minus the increase in stocks: since not all stocks are measured and recorded, it is not a precise measure of actual consumption.
Hereafter, all tonnage data refer to metric tons.

82 Brookings Papers on Economic Activity, 1:1974
Second, excess capacity was slowly absorbed in the developed countries. The reduction of cropland planted was a major element in the United States. Excess labor also was slowly disappearing, especially from the mod- ern commercial farms that account for most agricultural output. A com- bination of retirements, a sharp drop in new entrants, and a steady shift to nonagricultural employment gradually reduced the labor "trapped" in commercial agriculture. This was true even in the United States, although its nonfarm unemployment rate was high relative to other developed coun- tries,10 for that high average rate was concentrated among young, non- white, urban dwellers, some of whom were migrants from agriculture but many of whom had neither the experience nor desire to work on or manage farms. This decline was first manifested in the livestock industry, which is more labor intensive than crop production. It probably accounts for the slowdown in the growth of livestock output that began in 1969 and caused prices of livestock products to rise relative to those of feed grains. In general, labor mobility rates were highest near large metropolitan areas, which also tend to be the centers of U.S. livestock production, especially milk. More- over, as the Hathaway and Perkins study showed, the mobility rates were not inversely related to farm income, suggesting that outmigration from commercial farms was as high as or higher than that from the small farms that contribute little to U.S. output.
Third, despite the optimism of the late 1960s the Green Revolution in the LDCs did not spread as widely or as rapidly as expected; and the result was a rising gap between food output and consumption over much of the developing world, which was filled by increasing imports from the devel- oped countries.
Finally, the discovery of environmental and health problems by the United States in the late 1960s had a special impact on agriculture. DDT and several other low-cost pesticides were banned, forcing farmers to higher-cost substitutes. The Food and Drug Administration prohibited the use of certain feed additives, which raised the poundage of feed grains in a pound of beef. Moreover, numerous antipollution laws relating to disposal of animal wastes prevented the expansion of, or in some cases actually
10. For a discussion of the effects of unemployment rates on farm-nonfarm mobility, see Dale E. Hathaway and Brian E. Perkins, "Occupational Mobility and Migration from Agriculture," in Rural Poverty in the United States, A Report by the President's National Advisory Commission on Rural Poverty (U.S. Government Printing Office, 1968).

Dale E. Hathaway 83
closed, large-scale animal feeding operations, and raised production costs without increasing output. In the main, these probably were good policies, but consumers have had to pay for them in the cost of food.
What Caused the 1972-73 Explosion in Food Prices?
In 1972-73 almost every nation in the world experienced inflationary pressures due to increases in food prices. While this has been a serious problem for the United States and other developed countries, it has meant near disaster for poor countries forced to import food grains. The explana- tions currently put forth for this alarming state of affairs fall into four categories: (1) the weather, (2) the Russian wheat deal, (3) the influence of affluence, and (4) the return of Malthus.
THE WEATHER
Crop production throughout the world is still dependent upon the weather, particularly the timing and adequacy of rainfall, since most of the world's crops are grown without irrigation. Because of basic climatic fac- tors, some regions of the earth are subject to greater annual variations in weather than others. Two regions with large populations-the USSR and Asia, which is dependent upon the monsoons-are subject to wide year-to- year variations in rainfall and crop output.
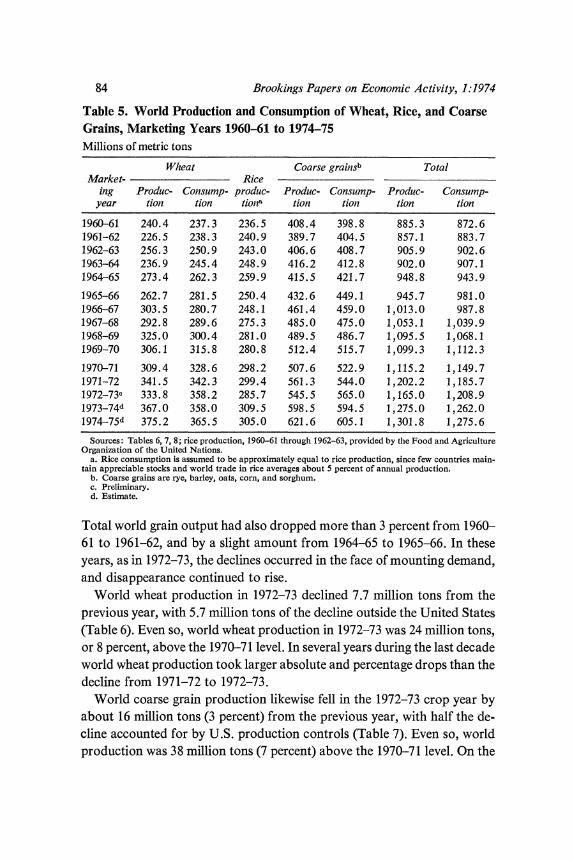
Economists tend to view the weather as a probability function with a random distribution. Climatologists do not do so, and if they are correct, the climatic shifts and accompanying weather pattern help to explain both the two decades of surplus capacity and the problems the world is now experiencing. Some of them argue that the world had better than "normal" weather from the mid-1950s to the early 1970s, thus accounting for the sur- pluses. Regardless of the underlying cause, there is no question that the weather in 1972 was adverse over large areas with huge populations. Most of South and Southeast Asia suffered from inadequate monsoon rains. The USSR had one of the most severe droughts in recent history and sub- Sahara Africa was similarly afflicted. The net result was a decline in world grain production (Table 5). Reflecting the unfavorable weather, the world output of grains declined some 40 million tons, or more than 3 percent from the previous year's high. But world declines in grain output are not new.
84 Brookings Papers on Economic Activity, 1:1974
Table 5. World Production and Consumption of Wheat, Rice, and Coarse Grains, Marketing Years 1960-61 to 1974-75 Millions of metric tons
Wheat Coarse grainsb Total Market- Rice
ing Produc- Consump- produc- Produc- Consump- Produc- Consump- year tion tion tiona tion tion tion tion
1960-61 240.4 237.3 236.5 408.4 398.8 885.3 872.6 1961-62 226.5 238.3 240.9 389.7 404.5 857.1 883.7 1962-63 256.3 250.9 243.0 406.6 408.7 905.9 902.6 1963-64 236.9 245.4 248.9 416.2 412.8 902.0 907.1 1964-65 273.4 262.3 259.9 415.5 421.7 948.8 943.9
1965-66 262.7 281.5 250.4 432.6 449.1 945.7 981.0 1966-67 303.5 280.7 248.1 461.4 459.0 1,013.0 987.8 1967-68 292.8 289.6 275.3 485.0 475.0 1,053.1 1,039.9 1968-69 325.0 300.4 281.0 489.5 486.7 1,095.5 1,068.1 1969-70 306.1 315.8 280.8 512.4 515.7 1,099.3 1,112.3
1970-71 309.4 328.6 298.2 507.6 522.9 1,115.2 1,149.7 1971-72 341.5 342.3 299.4 561.3 544.0 1,202.2 1,185.7 1972-73c 333.8 358.2 285.7 545.5 565.0 1,165.0 1,208.9 1973-74d 367.0 358.0 309.5 598.5 594.5 1,275.0 1,262.0 1974-75d 375.2 365.5 305.0 621.6 605.1 1,301.8 1,275.6
Sources: Tables 6, 7, 8; rice production, 1960-61 through 1962-63, provided by the Food and Agriculture Organization of the United Nations.
a. Rice consumption is assumed to be approximately equal to rice production, since few countries main- tain appreciable stocks and world trade in rice averages about 5 percent of annual production.
b. Coarse grains are rye, barley, oats, corn, and sorghum. c. Preliminary. d. Estimate.
Total world grain output had also dropped more than 3 percent from 1960- 61 to 1961-62, and by a slight amount from 1964-65 to 1965-66. In these years, as in 1972-73, the declines occurred in the face of mounting demand, and disappearance continued to rise.
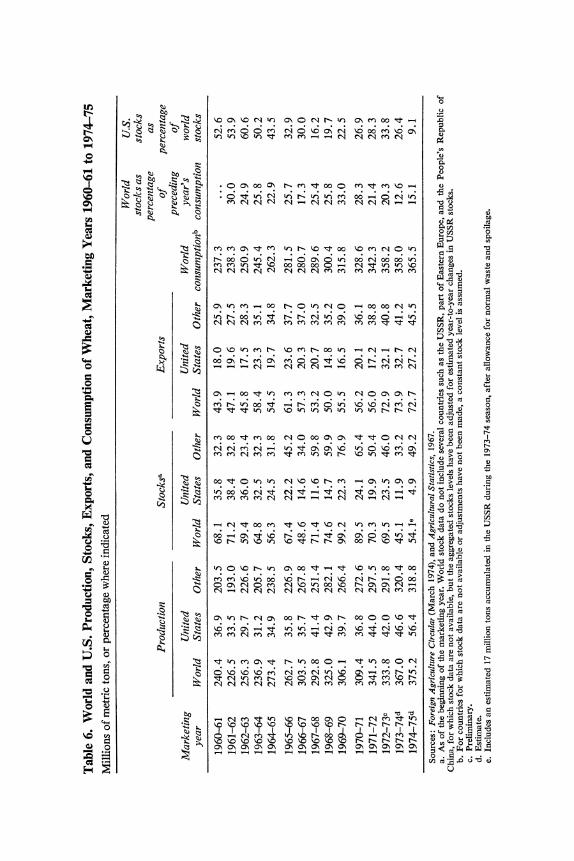
World wheat production in 1972-73 declined 7.7 million tons from the previous year, with 5.7 million tons of the decline outside the United States (Table 6). Even so, world wheat production in 1972-73 was 24 million tons, or 8 percent, above the 1970-71 level. In several years during the last decade world wheat production took larger absolute and percentage drops than the decline from 1971-72 to 1972-73.
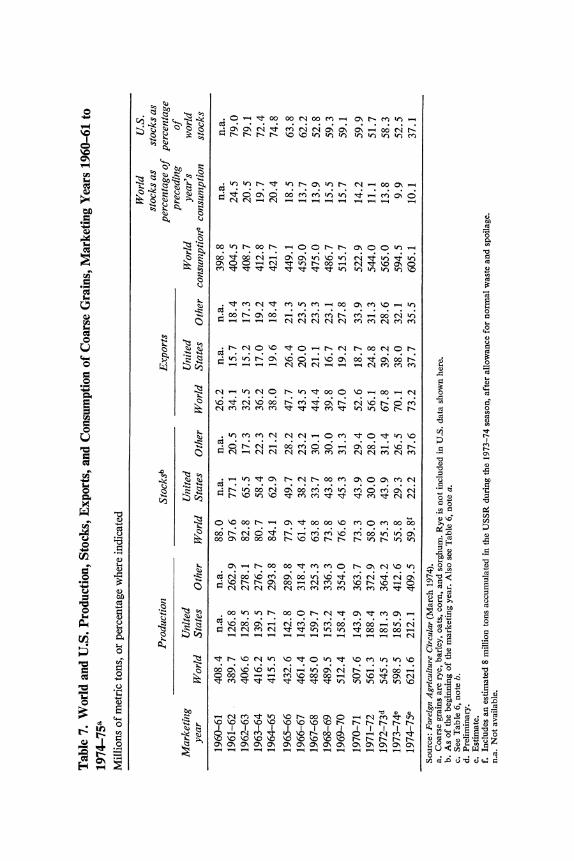
World coarse grain production likewise fell in the 1972-73 crop year by about 16 million tons (3 percent) from the previous year, with half the de- cline accounted for by U.S. production controls (Table 7). Even so, world production was 38 million tons (7 percent) above the 1970-71 level. On the

Dale E. Hathaway 85
other hand, the 1972-73 drop followed almost a decade of steadily rising world production, interrupted only by the U.S. corn blight in 1970 and held down in part by U.S. production controls.
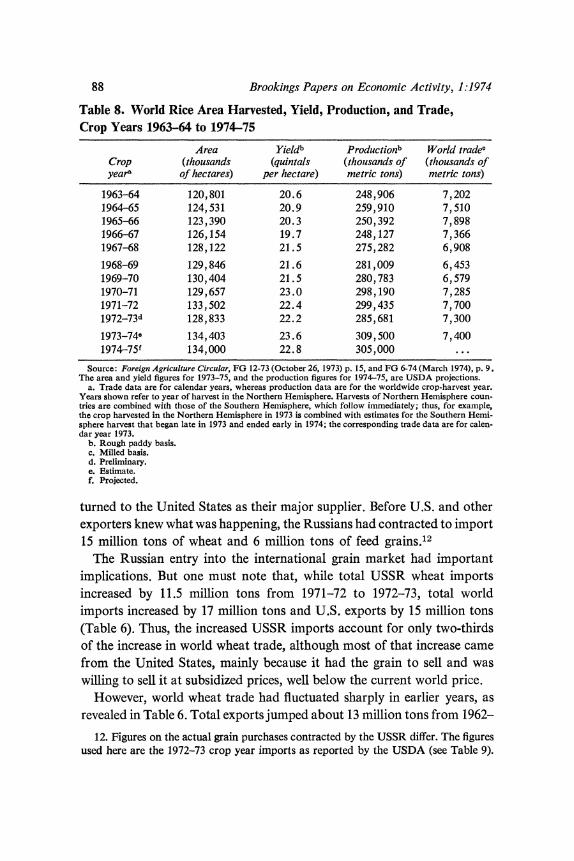
World rice production also declined in 1972-73, by about 14 million tons, or 5 percent of the previous year's output (Table 8). But again, world production was still the highest except for the two preceding crop years, although the longer-term growth for this staple has been much slower than that for either wheat or coarse grains. Moreover, world rice output had fallen 12 million tons, or 5 percent, between 1964 and 1966.
Thus, in the perspective of a decade rather than the centuries preferred by climatologists, the 1972-73 weather was bad for crop production. The decline in output was not unprecedented for wheat and rice; but it was un- usual for coarse grains, and it marked the first time in the 1960s or 1970s that the output of all three grains dropped in the same year. Still, bad weather is bound to occur in some years, and is accounted for in most ex- pectations; so that blaming it for the unprecedented rise in food prices implies that current production should bear the full burden of meeting demand with no assistance from stocks.
THE RUSSIAN WHEAT DEAL
Probably more has been written on the sale of wheat to the USSR than on any other episode in modern agricultural history. Critics have called it everything from stupid to dishonest, and defenders everything from good business to detente. Because of its weather variations, the USSR has experi- enced large year-to-year variations in grain output. Indeed, the 1972 decline was not the largest on record, and there are indications that Russian pur- chases exceeded their 1972 shortfall.11
In the past the Russians had sometimes tightened their belts and used reserves or liquidated their livestock herds when grain output fell short. But not always; they imported significant amounts in some earlier bad years-nearly 10 million tons in 1963-64 and 8.5 million tons in 1965-66 (Table 9). In 1972, for reasons known only to them, they made a political decision to enter the international grain markets, in a sudden, secretive, and massive way, to make up for their short crop. And for the first time they
11. For an intriguing version of the Russian grain sale, see James Trager, Amber Waves of Grain (Arthur Fields Books, 1973). Among other things, Trager advances the thesis that the Russians bought the extra grain to keep the Chinese from getting it.
F < o u X o o ON
o N W) O
N C) N t,
tn cP
m 0
o ^
w w E k w m m B m t m m N N N M
so~~~~~~~~~~~~~~C co k o, ; o tmN m t m 0c Coo m _,I-: ^ k ? EE O m NN N N NN m N NN a o
cx A X o>>2 mo~~~t: . >~~~~~~~~~~~~: Co sui CD 0AC C X . m m o t m m b B t X B m N O m N S a~~~~~~~~~~~~~~~~~~~~~~~~~~~~~~~~~~~~~~~~~~~I
_ O k b X O m N O o O m X N X X m OB Y~~~~~~~~~~~~~~~~~~b
.~~~~~~~~~~~~~c S n cP N cn Nn r- Nc "t 0c mc cn C) m f1
S X o ~~~~~~~~~~~m m tn t oc 0c 0c oc C) -4 C, 't W) O.
S
cx z ~~~~~~~~~~~N N N N N CA N N M M M M ot M M C's C' 1 C'
z w D~~~~~~~~~~~~~~~~~~~~~~~~~~~~~~~~~~~~~~~~~~~~~~~' >-, C'
O ~~~~~~~~~~~~CN n M "q OC C) W N oo 0c N e-S 0, .
! k t t t ~~~~~~~~~~~~~m enB m m m m m m cl > to..er
< mGmt
m Oc M m o t n CI
4- Oz 0 ON t- m ONt m ) CD It Bc c; r- C- . I^ " 0
o~~~~~~~~~~~~~". ".. ". Um o N --- N N N N ".. m M - o ..0 -tl
v~~~~~~~~~~~~~~P OC "t t m M N C n N C ON ON u C'sa
X~~~~~~~~~~~~~~~~~~~~~~~~~~~~~~~~~~~1 r wSr3 ^~~~~~~~~~~~~~~~~0 4 -4 r- Ct c; v; t6 B6 (, CB (, 0 MS
._ 3~~~~~~~~~~~~Cf o o Clf oC N C) OC CPN CP lt C) N N d _
O = .o > S Me Y E~~~~~~~~~m>
v~~~~~~~~~~~~~~ . . . . . . . . . to , > )
XQ~~~~~~~~~~~~~t OC s? Uo N llz C1 "Z - " t N Cm 0 e
X > t~~~~~~~~~~~ m m m N o - - - o N 3 N
oo~~~~~~~~~~~~~~ zto tU - - CIeS
F C~~~~~~~~~~~~~o .t B Nc tn t-) t- c PbobN OC t- bc zf v) *= 0
B~~~~~~~~~~~~~~~~~~, u:8 X6 U i^ 4 ( AIi O6 (i r i 4 c; C 0 f C . g =~~~~~~~~~~~C N CD m N Bc tn 0c Bc t- CP CP N - 0; o '
i~~~~~~~~~~~~~~~~~~~~~~~~~~~~~~~~c c -n Or F~~~~~~~~~~~~~~~~~~~~~~~~~~~~~~~~~~~~~' C'sU
^~~~~~~~~~~~~ O;? OC C1 O ooo m ON
crA
-4~ ~ ~~~~~~~c CU tn r- *o- 0
*E ~ ~~~~~~~~~ NN N
r ;S t o o o
~~~~~~~~~~~~~~~N tn < oNt
CX Y~~~~~~~~~~~~~~~~~~~~~~~~~~~~~~~~~~~~~~~~~~~~~~~~~~~~~~~~~~~~~~~~~~~~~' N * ) o0-o O Immmt O0N m ac
rA O Z c N N N N N m m N m m
o ~~~~~~~~~~~~~~~~N N N "- N Cf cn cn L.
*s;~~~~~~~~~ - tn N O t- tn zt 0o OC) oo 0 CB
0~ ~ ~~~~~~~~~~~~' o8C sv
;0 4 Y6r e
O = ~~~~~~~~~N N N N N m m m N N m N m .
;~~~~~~~~~~C W) Z Yt ON r N - OC Cf ON C) O m N
X c~~~~~~~~~~~~t OC C' cP OC)X m Om W) 0; c O
X~~~~~~~~~~~C 0 O o N O0 00 b m C)B m OCo OC > on
o < < Y ~~~~~~~~N OC O Co m
m C) r ON
W) 0 0
8 < $ < =~~N N N N O
X~~~~~~S C' 0 to C's omtB^m
-
= o X o B B m ~~~~~~~~~~~~~N m O N o.
r~~~~~~~~~~~~~ o8 0; o 'i oc o8 oo ; t o N C' X .S
o~~~~~~~~~~~~~~~~~t tn tn OC OC OC 0
?
W k
~~~~~~~~~~~N ^c "t C) Xoo t . n llz tf a F~~~~~~~~~~0 0; m? .6 t i ~ "4 tr C4 r- tl CA i4 _t: d ; 0 o;g =
0 o 0 - -1 m oc m "- 0 oc It ON N to, o e?X8 ~~~~~~~~~~~~~ W W) Wo .) .) C's~ F o S m eD Or O; W~~~~~~~~~~~~~~~~~~~~~~~~~~~~~~~~~~~~~~~~~~~~~~~~~~~~~~~~~~~~~~~~~~~~~~~~~~~~~~c,
88 Brookings Papers on Economic Activity, 1:1974
Table 8. World Rice Area Harvested, Yield, Production, and Trade, Crop Years 1963-64 to 1974-75
Area Yieldb Productionb World trade? Crop (thousands (quintals (thousands of (thousands of year" of hectares) per hectare) metric tons) metric tons)
1963-64 120,801 20.6 248,906 7,202 1964-65 124,531 20.9 259,910 7,510 1965-66 123,390 20.3 250,392 7,898 1966-67 126,154 19.7 248,127 7,366 1967-68 128,122 21.5 275,282 6,908
1968-69 129,846 21.6 281,009 6,453 1969-70 130,404 21.5 280,783 6,579 1970-71 129,657 23.0 298,190 7,285 1971-72 133,502 22.4 299,435 7,700 1972-73d 128,833 22.2 285,681 7,300
1973-74e 134,403 23.6 309,500 7,400 1974-75f 134,000 22.8 305,000 ...
Source: Foreign Agriculture Circular, EG 12-73 (October 26, 1973) p. 15, and EG 6-74 (March 1974), p. 9. The area and yield figures for 1973-75, and the production figures for 1974-75, are USDA projections.
a. Trade data are for calendar years, whereas production data are for the worldwide crop-harvest year. Years shown refer to year of harvest in the Northern Hemisphere. Harvests of Northern Hemisphere coun- tries are combined with those of the Southern Hemisphere, which follow immediately; thus, for example, the crop harvested in the Northern Hemisphere in 1973 is combined with estimates for the Southern Hemi- sphere harvest that began late in 1973 and ended early in 1974; the corresponding trade data are for calen- dar year 1973.
b. Rough paddy basis. c. Milled basis. d. Preliminary. e. Estimate. f. Projected.
turned to the United States as their major supplier. Before U.S. and other exporters knew what was happening, the Russians had contracted to import 15 million tons of wheat and 6 million tons of feed grains.'2
The Russian entry into the international grain market had important implications. But one must note that, while total USSR wheat imports increased by 11.5 million tons from 1971-72 to 1972-73, total world imports increased by 17 million tons and U.S. exports by 15 million tons (Table 6). Thus, the increased USSR imports account for only two-thirds of the increase in world wheat trade, although most of that increase came from the United States, mainly because it had the grain to sell and was willing to sell it at subsidized prices, well below the current world price.
However, world wheat trade had fluctuated sharply in earlier years, as revealed in Table 6. Total exports jumped about 13 million tons from 1962-
12. Figures on the actual grain purchases contracted by the USSR differ. The figures used here are the 1972-73 crop year imports as reported by the USDA (see Table 9).
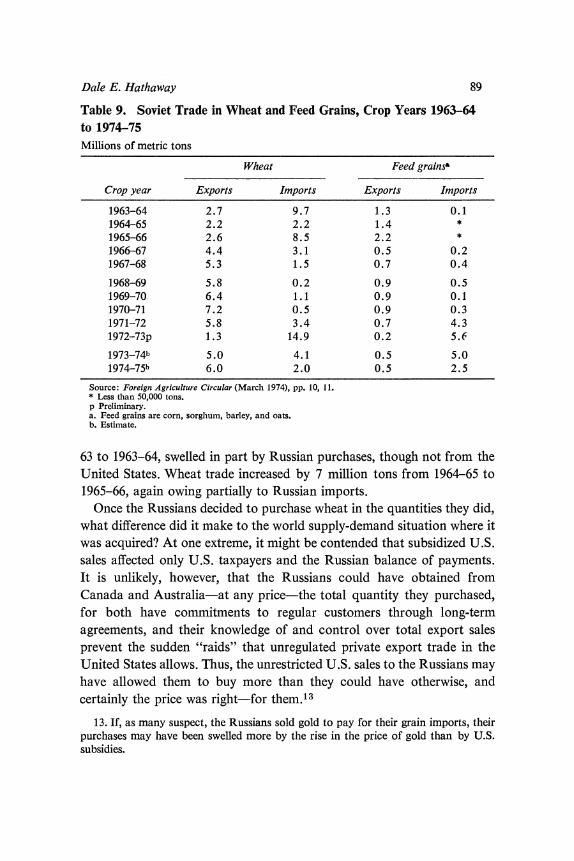
Dale E. Hathaway 89
Table 9. Soviet Trade in Wheat and Feed Grains, Crop Years 1963-64 to 1974-75 Millions of metric tons
Wheat Feed grains"
Crop year Exports Imports Exports Imports
1963-64 2.7 9.7 1.3 0.1 1964-65 2.2 2.2 1.4 *
1965-66 2.6 8.5 2.2 *
1966-67 4.4 3.1 0.5 0.2 1967-68 5.3 1.5 0.7 0.4
1968-69 5.8 0.2 0.9 0.5 1969-70 6.4 1.1 0.9 0.1 1970-71 7.2 0.5 0.9 0.3 1971-72 5.8 3.4 0.7 4.3 1972-73p 1.3 14.9 0.2 5.6
1973-74b 5.0 4.1 0.5 5.0 1974-75b 6.0 2.0 0.5 2.5
Source: Foreign Agriculture Circular (March 1974), pp. 10, 11. * Less than 50,000 tons. p Preliminary. a. Feed grains are corn, sorghum, barley, and oats. b. Estimate.
63 to 1963-64, swelled in part by Russian purchases, though not from the United States. Wheat trade increased by 7 million tons from 1964-65 to 1965-66, again owing partially to Russian imports.
Once the Russians decided to purchase wheat in the quantities they did, what difference did it make to the world supply-demand situation where it was acquired? At one extreme, it might be contended that subsidized U.S. sales affected only U.S. taxpayers and the Russian balance of payments. It is unlikely, however, that the Russians could have obtained from Canada and Australia-at any price-the total quantity they purchased, for both have commitments to regular customers through long-term agreements, and their knowledge of and control over total export sales prevent the sudden "raids" that unregulated private export trade in the United States allows. Thus, the unrestricted U.S. sales to the Russians may have allowed them to buy more than they could have otherwise, and certainly the price was right-for them.'3
13. If, as many suspect, the Russians sold gold to pay for their grain imports, their purchases may have been swelled more by the rise in the price of gold than by U.S. subsidies.
90 Brookings Papers on Economic Activity, 1:1974
In the case of feed grains, Russian imports could not have had a marked effect upon prices. From 1963-64 to 1970-71, the USSR was a net exporter of these grains (Table 9). In 1971-72 it became a net importer of 3.6 million tons, and in 1972-73 of 5.4 million. But these shifts are less than half of the 12 million ton rise in total world exports of coarse grains from 56 million to 68 million tons in the 1972-73 crop year. And they are an even smaller part of the increase in U.S. exports of coarse grains from 25 million tons in 1971-72 to 39 million tons in 1972-73.
Thus, while Russian purchases may have pushed U.S. and world wheat prices up to some degree, they could not have had a significant influence in the case of feed grains. The explanation of the grain price explosion must be sought elsewhere.
THE INFLUENCE OF AFFLUENCE
For food as a whole, the income elasticity of demand is low in wealthy countries. For all foods at the farm gate the estimates for the United States range from 0.15 to about 0.20. This, of course, is an average derived from combining relatively high elasticities for meats with low or negative figures for grains and potatoes. The low overall elasticity masks the fact that as people get more income, the nature of their diet changes. In poor countries, the diet consists largely of grains consumed directly-rice, wheat, and maize. As consumers become more affluent, however, they obtain a lower proportion of calories from grain sources and a higher proportion from animal proteins-poultry, fish, and red meats.
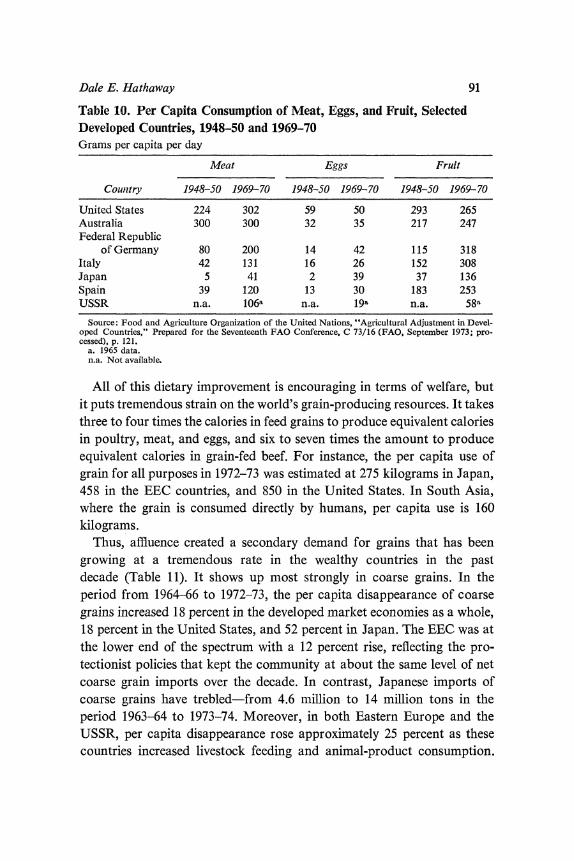
In terms of index numbers this trend does not appear important, but in terms of the demand for grain products, it is very important indeed. Table 10 shows the change in per capita consumption of selected foods in the major developed countries from the late forties to 1970. For instance, per capita consumption of meats in the United States has risen by 35 percent over the past two decades. But consumption has more than doubled in the Federal Republic of Germany and has increased eightfold in Japan, More- over, in 1970 Germany was consuming below the 1948-50 level in the United States, and Japan was consuming at one-sixth that level. Western Europe and Japan will probably continue to move toward U.S. con- sumption levels of red meat and poultry, unless other events halt or depress their industrial growth or unless the rising costs of these products offset the effects of the higher per capita income.
Dale E. Hathaway 91
Table 10. Per Capita Consumption of Meat, Eggs, and Fruit, Selected Developed Countries, 1948-50 and 1969-70 Grams per capita per day
Meat Eggs Fruit
Country 1948-50 1969-70 1948-50 1969-70 1948-50 1969-70
United States 224 302 59 50 293 265 Australia 300 300 32 35 217 247 Federal Republic
of Germany 80 200 14 42 115 318 Italy 42 131 16 26 152 308 Japan 5 41 2 39 37 136 Spain 39 120 13 30 183 253 USSR n.a. 106a n.a. 19a n.a. 58a
Source: Food and Agriculture Organization of the United Nations, "Agricultural Adjustment in Devel- oped Countries," Prepared for the Seventeenth FAO Conference, C 73/16 (FAO, September 1973; pro- cessed), p. 121.
a. 1965 data. n.a. Not available.
All of this dietary improvement is encouraging in terms of welfare, but it puts tremendous strain on the world's grain-producing resources. It takes three to four times the calories in feed grains to produce equivalent calories in poultry, meat, and eggs, and six to seven times the amount to produce equivalent calories in grain-fed beef. For instance, the per capita use of grain for all purposes in 1972-73 was estimated at 275 kilograms in Japan, 458 in the EEC countries, and 850 in the United States. In South Asia, where the grain is consumed directly by humans, per capita use is 160 kilograms.
Thus, affluence created a secondary demand for grains that has been growing at a tremendous rate in the wealthy countries in the past decade (Table 11). It shows up most strongly in coarse grains. In the period from 1964-66 to 1972-73, the per capita disappearance of coarse grains increased 18 percent in the developed market economies as a whole, 18 percent in the United States, and 52 percent in Japan. The EEC was at the lower end of the spectrum with a 12 percent rise, reflecting the pro- tectionist policies that kept the community at about the same level of net coarse grain imports over the decade. In contrast, Japanese imports of coarse grains have trebled-from 4.6 million to 14 million tons in the period 1963-64 to 1973-74. Moreover, in both Eastern Europe and the USSR, per capita disappearance rose approximately 25 percent as these countries increased livestock feeding and animal-product consumption.

*E i- -'~~~m r- l
E~~~~~0 (ON W) m ^FNT
00 ~ ~ ~ 00~
0%
Ofs tLt 'i 'i 4" 00 eo~
-o O t 00 eo
,Hs } /S^ 00O o-4 N o a 0c
PC~~~~~~~~~~~~~~~~~~~~~~~~~~~~C
t NX
C) U S > O ~o %C tt t- N t
*sU >
_
(ONi00O ; t
n~~~~~~~, tn _ ROTB*8
orY*! =>N ?? ?eDor
- u a
Cd ~ ~ ~ ~ ~ ~ ~ ~ ~ 0 0 to~~
0 ~ ~ ~ ~ ~ ~ COu> 0
0 0 ~~~~~~~~c
~~~~~0~~~c 0 U
CU CU 0 cu E +i + ~ w -q -0 to~
o.. u. O
~~ CO u0 .
Dale E. Hathaway 93
While less developed countries as a group did not expand in this respect, some had large gains. For instance, in East Asia the annual disappearance of coarse grains increased by more than 50 percent over the period and net imports increased fourteen times. Since the United States typically accounts for about one-half of world exports of coarse grains (Table 7), it has sup- plied much of the expansion.
Affluence, however, does not greatly spur demand for wheat in devel- oped countries. For instance, for the period 1964-66 to 1972-73 the per capita consumption of wheat rose 8 percent in total in the developed mar- ket economies, including 3 percent in the United States, 12 percent in the EEC, and 6 percent in Japan. It rose more sharply, however, in Eastern Europe and the USSR, where much more wheat is fed to animals than in the other developed economies. For less developed countries as a group, wheat consumption, although remaining low, rose a strong 20 percent per capita during the period.
The third price explosion has occurred in oilseed and fishmeal products. Here again much of the explanation appears to be the influence of affluence -as much as the widely discussed decline in the Peruvian anchovy catch. In developed countries livestock production relies on the use of protein concentrates and the two have risen together. While U.S. domestic con- sumption of these protein feeds has grown slowly, exports to Japan, Western Europe, and Eastern Europe have expanded rapidly. Unlike the situation in other grain crops, there is no large-scale stockholding for oil- seeds so that production and consumption generally balance. In some years, however, both the U.S. government and private trade have held soybean stocks into the new crop, although generally in small amounts relative to production and usage.
Total oilseed and fishmeal production in the world rose by 3 million tons, or 5 percent, from 1972 to 1973, despite the decline of nearly 2 million tons in Peruvian fishmeal exports. Obviously, this decline put pressure on U.S. supplies; but a significant push also came from the heightened demand from Japan, Western Europe, Eastern Europe, and the richer Asian coun- tries spurred by rising affluence, rather than from deterioration in supply.
The final explosion in grain prices occurred in rice, the staple food for most of Asia's population. Normally, very little rice moves in international trade (Table 8); the two largest exporters are the United States and Thai- land. In any case, the rise in rice prices did not affect U.S. food prices directly, except that the 1972-73 drop in world rice output called for heavier U.S. exports of wheat and coarse grains as substitutes.
94 Brookings Papers on Economic Activity, 1:1974
Thus, the source of much of the expanding demand for coarse grains, oilseeds, and to some extent, rice, is a rising affluence that supports the demand for better diets. How that demand manifests itself depends in part upon the state of economic development. In the poorer countries it takes the form of demand for more grains for direct consumption; the richer countries demand more feed grains and protein concentrates.
THE RETURN OF MALTHUS
Another thesis invokes the Malthusian theory that population tends to outrun food supply as an explanatory factor in the recent shift in food prices. According to this argument, food supply cannot keep up with grow- ing population and demand, despite the promise of the Green Revolution. In order to avoid widespread famine, the poor countries have been turning to the developed countries, especially the United States, for food grains, thus raising world demand in relation to supply.
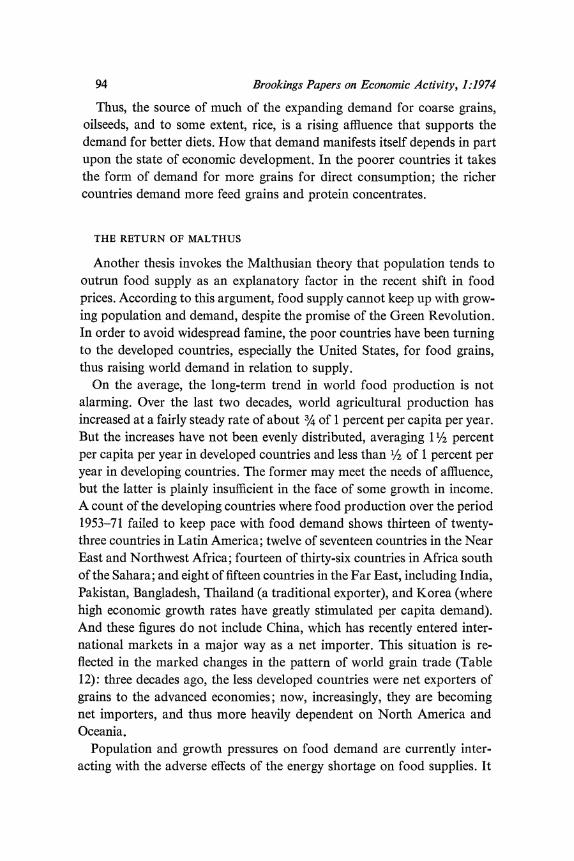
On the average, the long-term trend in world food production is not alarming. Over the last two decades, world agricultural production has increased at a fairly steady rate of about 3/4 of 1 percent per capita per year. But the increases have not been evenly distributed, averaging 11/2 percent per capita per year in developed countries and less than 1/2 of 1 percent per year in developing countries. The former may meet the needs of affluence, but the latter is plainly insufficient in the face of some growth in income. A count of the developing countries where food production over the period 1953-71 failed to keep pace with food demand shows thirteen of twenty- three countries in Latin America; twelve of seventeen countries in the Near East and Northwest Africa; fourteen of thirty-six countries in Africa south of the Sahara; and eight of fifteen countries in the Far East, including India, Pakistan, Bangladesh, Thailand (a traditional exporter), and Korea (where high economic growth rates have greatly stimulated per capita demand). And these figures do not include China, which has recently entered inter- national markets in a major way as a net importer. This situation is re- flected in the marked changes in the pattern of world grain trade (Table 12): three decades ago, the less developed countries were net exporters of grains to the advanced economies; now, increasingly, they are becoming net importers, and thus more heavily dependent on North America and Oceania.
Population and growth pressures on food demand are currently inter- acting with the adverse effects of the energy shortage on food supplies. It
Dale E. Hathaway 95
Table 12. The Changing World Pattern of Net Grain Exports (+) and Imports (-), by Region, Selected Fiscal Years, 1934-73 Millions of metric tons
Annual average
Region 1934-38 1948-52 1960 1966 1973p
North America +5 +23 +39 +59 +88 Western Europe -24 -22 -25 -27 -21 Australia and
New Zealand +3 +3 +6 +8 +7 Eastern Europe
and USSR +5 n.a. 0 -4 -27 Africa +1 0 -2 -7 -4 Asia +2 -6 -17 -34 -39 Latin America +9 +1 0 +5 -4
Sources: Lester Brown, Overseas Development Council, and U.S. Department of Agriculture. p Preliminary. n.a. Not available.
also is a sad but important fact that both agriculture in developed countries and the Green Revolution rely on high-energy technology; and, therefore, the level and cost of additional farm output everywhere will depend in part upon the cost and availability of petroleum, fertilizers, and pesticides. In- deed, the cost and shortage of fuel and fertilizers already show signs of markedly reducing crop output in some of the developing countries.14
THE CAUSES IN RETROSPECT
The various explanations of the current crisis embody a combination of factors that culminated in a "flash point" in world grain prices. First, and in my view, most important, has been the long-run growth in demand for feed grains and oilseeds resulting from the spreading affluence in both the developed and developing world. Its impact began to manifest itself in the late 1960s but was largely ignored in policy analyses. The second im- portant factor has been the prolonged failure of the LDCs, despite the Green Revolution, to increase output of food grain at rates sufficient to meet the new demands arising from both population and income growth.
14. Herdt and Barker estimate the possible decline in 1974 in Asian rice production (excluding that in the People's Republic of China) due to fertilizer shortages at 1 to 3 percent, or 3 million to 9 million tons of paddy. Robert W. Herdt and Randolph Barker, "The Rice Situation, 1973-74" (Los Bafios, Philippines: International Rice Research Institute, no date; processed), pp. 6, 12.
96 Brookings Papers on Economic Activity, 1:1974
The final factor was the bad weather in 1972-73, a short-run episode that reflects a recurring problem in agriculture.
The U.S. sales to Russia were not, in my opinion, the major cause of the price explosion either in the United States or in the rest of the world. Once the USSR decided to buy grains, where they purchased them could not have made much difference to world market conditions, although it made a lot of difference to U.S. taxpayers and to the Russian Ministry of Fi- nance. In essence, the flash point was reached because the spark of a short-run, weather-induced decline in supply ignited a volatile long-run situation created by persistently growing demand and lagging supplies.
The flash point came when the excess of world demand over supply drew down stocks, especially in the major grain-exporting countries, to a level so low that they could no longer absorb any significant shock in the world production system. In other words, the key elements were the obsession of the developed country exporters with the high carrying costs and market- depressing effects of major reserve stocks; and the failures to recognize the steadily growing world demand for grains, to reevaluate the stocks neces- sary to absorb shocks in world output, and to consider the potential price implications of inadequate stocks. These all promoted a dangerous policy of stock reduction that had inevitably to lead, sooner or later, to events like those of the past two years. Hindsight suggests that competent analysis- by the FAO, the USDA, or even some college professors-would have revealed as early as 1970 the need for a shift by major exporters away from output controls toward controlled output expansion. Instead, surpluses, market shares, and downward adjustment of production obsessed almost every policy maker and farmer.'5 More land was retired from production in the United States in 1972 (62 million acres compared with 37 million the year before), reducing grain acreage (Table 4); and the programs actually continued into 1973, with nearly 20 million acres withheld after the Russian sales and crop failures of 1972.
As a final step in documenting this ill-focused policy, Figure 1 demon- strates both when shifts in the prices of U.S. farm products began and how they were, indeed, completely unrelated to the events usually cited as the
15. In November 1973, the Seventeenth Annual Conference of the Food and Agri- culture Organization of the United Nations had agricultural adjustment (downward) as a major item on its agenda. Not surprisingly, it received little discussion. FAO, Report of the Conference of FAO, Seventeenth Session, November 1973 (Rome: FAO, 1973), pp. 18-20.

4-
40%
0%~~~~~~~~~~~~~~~~~~~~~~~~~~~~~~~W
0~~~~~~~~~~~~~~~~~~~~~~~~~~~~~~~~~~~~~~ 0 1 0
0%~~~~~~~~~~~~~~~~~~~~~~ -~~~~~~~~~~~~~~~~~~~~~~~~~~~~~~r

98 Brookings Papers on Economic Activity, 1:1974
cause of the problem. The indexes of prices received by farmers for all farm products, livestock and products, and all crops, depicted in the figure, show the postwar decline that persisted until the late 1950s, with excess capacity in U.S. agriculture and gradually lowered price supports. The figure also reveals the extreme stability in prices for crops, mainly grains, throughout the 1960s, jiggled by the cyclical movements in livestock prices.
But the shift really began in the late sixties. With supplies lagging, im- provement in income put increasing pressure on meat and poultry prices beginning in 1968. This shift occurred before feed grain and soybean prices started to rise and before the corn blight of 1970 markedly reduced U.S. output. With U.S. feed grain stocks already cut to half their postwar high, the short 1970 corn crop further destabilized the livestock industry and reduced incentives to expand output, so that livestock prices piled a 16 per- cent rise from 1971 to 1972 on top of the 12 percent rise that had occurred from 1968 to 1969 (Figure 1).
Grain stocks played a key role in stabilizing crop prices until 1972. In six of the nine years from 1960 to 1968, world grain output exceeded world disappearance. In three of the next four years (the exception was 1971) world grain disappearance exceeded production. Thus, the world depended upon stocks for part of current consumption even before the bad weather of 1972. The sharp decline in grain stocks as a percent of world consumption from 1969 to 1971 is evident in Figure 2. The decline in coarse grains was the most dramatic. Annual world disappearance in- creased on average by about 14 million tons per year from 1961-62 to 1971-72; world production outside the United States rose at an average rate of 11 million tons per year, while control programs aliowed U.S. out- put to expand only about 6 million tons per year. Meanwhile, U.S. ex- ports grew and, to the glee of U.S. policy makers, U.S. stocks declined sharply (Table 7). In the early 1960s, the nation held 80 percent of the world's coarse grain stocks, but the figure had falien to 52 percent by 1971. Stocks outside the United States meanwhile rose only modestly. World coarse grain stocks as a proportion of world disappearance fell irregularly but steadily from 24 percent to the current 10 percent. Even so, coarse grain prices were virtualiy stable to mid- or late 1972. Only after the world markets realized that total output of coarse grains had declined 15.8 mil- lion tons from the previous year and that world stocks were down so low did grain prices start to skyrocket.
In one sense, then, the United States, as the world's largest coarse grain

Dale E. Hathaway 99
Figure 2. World Production and Consumption of Grain, and Stocks as Percentage of Consumption, Annually, 1960-74a
Millions of metric tons Stocks as percent of consumption
1,200
1,000 L Grain consumption 30
800 ~ ^s _ 25
_ 20 600 _
_ ,,, ~ ~' -v__ _1 % ~~~~% *0o f5 400 %~~~~~~~~~~~~~~~~~~~~~~~~~~~~' 400 _ Start-of-year stocks of wheat and coarse grains -t. o
as percentt of consumption (right scale) _ 0
200 5
0 0 1960 1965 1970 1974
Sources: Tables 5, 6, 7. a. Production and consumption are for wheat, rice, and coarse grains. See Table 5, notes a and b.
exporter, set itself and the world up for the situation that developed in late 1972 and 1973. A 3 percent decline in world output partialiy attrib- utable to U.S. production control programs, combined with low stocks and an already expanding demand pushed further by devaluation, set off a wild scramble for coarse grains. The price of corn at the farm level in November 1972-well after the Russian purchases and the shortfall due to the Asian drought were known-was $1.20 per bushel or $47.24 per ton. By August 1973, it had risen to $2.68 per bushel or $105.51 per ton, and by November 1973 it was still $2.18 per bushel or $85.82 per ton-nearly twice the year- earlier level-despite a U.S. harvest up 10 miliion tons and a world harvest up an estimated 8 percent. The rise continued into early 1974 as stocks fell to pipeline levels and importers realized that supplies hinged entirely on current output.
For some products, such as poultry, meat, and eggs, the supply response to higher feed prices takes a few weeks or months at most. As prices of feed

100 Brookings Papers on Economic Activity, 1:1974
and protein supplements rise, producers watch their profits melt into losses. They then restrict output and, with a constant or rising demand, bring on sharp rises in both farm and retail prices. For hog producers, cattle feeders, and dairy producers, the adjustment process is slower, and thus much of it is yet to come. In the first case, the number of sows bred falls, the number of pigs fed subsequently declines, and finally the retail market price rises enough to make raising and feeding pigs profitable. Cattle producers react stili more slowly. Those with steers on feed take their financial beating when feed costs exceed the margin they can obtain from feeding cattle to slaughter weights. But, having disposed of those on feed, they feed fewer or none at all until the market price for finished cattle rises enough to cover the cost of cattle and the higher feed cost.
In the dairy industry the adjustment is fairly rapid under the conditions that prevailed in 1973. First, the industry cut back on expensive protein concentrates and feed grains and substituted grass and hay. Production per cow stabilized or declined. Second, marginal animals and herds were sold for slaughter to take advantage of extremely favorable beef prices; some dairy farmers, for the first time in a decade, were able to liquidate their businesses profitably and to prosper merely by raising and selling the feed stuffs they otherwise would have fed to their cows. The decline in the number of dairy cows that had persisted for two decades steepened in 1973, and the milk production per cow declined for the first time in three decades. Total milk production for each month in 1973 was below that of 1972 and the rate of decline worsened steadily, from 1.4 percent in January to 5.8 percent in September.16 As in beef and pork, the adjustment of dairy products to the higher prices of feed grains and protein con- centrates is not over.
Thus, affluence, combined with a policy that maintained controls too long and allowed government stocks to be depleted and with a modest decline in world output of coarse grains, has set in motion an inflationary feed-livestock price cycle that wili run through 1974 and into 1975.
While bread does not loom large in the American housewife's food budget, its cost arouses emotions like nothing else, as Marie Antoinette vividly testified. The spokesman for the baking industry who announced in January 1974 that the price of a loaf of bread could reach $1 by midsummer and demanded export controls on wheat drew national news coverage and a
16. U.S. Department of Agriculture, Economic Research Service, Dairy Situation, D5-349 (March 1974), pp. 5, 6; USDA, Agricultural Statistics, 1967, p. 434.

Dale E. Hathaway 101
sharp denial from the Secretary of Agriculture. Actualiy, wheat prices did respond to the announcement of the massive Russian wheat sales and the drought in Asia by almost doubling from July to December 1972. But, even after the Russian sales were known in August, the USDA did not take prompt action to encourage all-out winter wheat production in 1973, even though they had another month before planting to do so, nor did they remove all controls on spring wheat actually planted six months later!17 By the end of the 1973 crop year, world wheat stocks were the lowest in two decades. As a result, wheat prices doubled again by December 1973 and rose even further during early 1974 despite an increase of 27 million tons in world wheat production estimated for 1973-74, including 5 million tons in the United States and a record crop in the USSR. One can attribute the 1973 price rise at least in part to the Russian purchases and the decline in world wheat production in 1972-73 of approximately 2 percent. Added to this pressure was the demand for food grains from Asia, where rice and coarse grain crops were adversely affected by weather in 1972. While world exports thus rose 17 million tons, or 30 percent, from the previous year, the rise amounted to only 5 percent of the previous year's con- sumption. But from 1962-63 to 1963-64 wheat exports rose by 12.6 million tons, also 5 percent of the previous year's world disappearance. Thus, instability in wheat exports alone does not account for the striking price rise from 1972 to 1974. The difference between these two periods lies in the ratio of world stocks of wheat to exports. In 1962-63 this ratio was 1.3 and the ratio of U.S. stocks to exports was 0.8. For 1973-74, the world ratio of stocks to exports is estimated as 0.6 and the U.S. ratio as 0.2 (Table 6).
Approximately the same situation was occurring for coarse grains, as the ratio of world stocks to exports fell below 1 in 1973-74, from 2.5 in 1962-63. At the same time the United States, which had maintained a stocks-export ratio of 1 or higher from 1961 to 1965, saw that ratio decline to about 0.4 in 1973-74, and to an estimated 0.3 entering the 1974-75 crop year.
In a sense the world set itself up for the present precarious situation by continuing to depend on the United States as the world's grain stock- holder while ignoring changes in U.S. policy. And the United States col-
17. For a discussion of the details of the administration's policy actions and their import see John Schnittker, "The 1972-73 Food Price Spiral," Brookings Papers on Economic Activity (2:1973), pp. 498-506.

102 Brookings Papers on Economic Activity, 1:1974
laborated by steadfastly insisting that even reasonable publicly held re- serves were not in the interest of the nation's farmers or of its consumers. The fixation on overcapacity, surpluses, and exports at any cost, and the dependence on free enterprise to hold sufficient reserves, blinded analysts and policy makers to the potential-and now apparent-effects of affluence and crop failures on domestic and world food prices. Thus, these failures have spawned the whirlwind of inflation, shortages, and possible mass starvation if crops fali seriously short in 1974 or in 1975.
Looking Ahead: Short-run Problems and Strategies
Economic analysis is always better looking backward than ahead, but in the current situation, only political office seekers are much interested in affixing blame. In retrospect, it is fairly clear that the United States should have relaxed production restraints on feed grains in 1972 rather than tighten them, and eased wheat restraints in 1972 and spurred all-out pro- duction in 1973. But it did not, and as a result, a world food shortage has developed that has contributed to a serious domestic and worldwide infla- tionary spiral. Errors in analysis and policies did not create bad weather, but clearly no effort was made to insulate the nation or the world from its effects when it came on top of the steady growth in world demand.
Having exhausted reserve resources of idle land and surplus labor on commercial farms, the United States is now reduced to "a wing and a prayer" for the next year or two. The wing is the ability of farmers around the world to expand output by intensifying resource utilization and im- proving productivity; and the prayer is that adverse weather and other events do not seriously curtail food output in major consuming countries and exert further pressure on the meager available supplies. Unless and until world stocks of wheat and coarse grains can be rebuilt, food prices cannot ease significantly; and for several reasons, many food products will probably become more expensive before that occurs.
The wing of sharply increased output has been clipped by the worldwide shortage of fertilizers and the shortage of fuel in some countries. Moreover, because both have a petroleum base, their prices have risen severalfold since the fall of 1973. Agricultural production in developed countries is energy intensive, and so are the practices associated with the high-yielding varieties that hold the key to expanded output in the LDCs.

Dale E. Hathaway 103
Every nation seems to be giving agriculture priority in fuel allocation, and the industry statistics indicate that the total quantity of fertilizer avail- able in the world will be greater in 1974 than in 1973. But the distribution will be uneven. Supplies of fertilizer in the United States, Canada, and Western Europe are reported to be up somewhat in 1974, but this increase is coming largely from decreased exports by the developed countries to the LDCs, especially those in Asia. This imbalance may raise some major policy issues for the United States.
Estimates made in April 1974 indicate that the United States will harvest record crops of wheat and feed grains, although the latter is far from certain until the end of summer. Even if these forecasts are realized, total avail- ability will be no greater than in 1973 because of the depletion of U.S. stocks. And the same will be true in total for the four major grain-exporting nations. There is little probability of any significant stock building because shortages and price increases in fertilizer and fuel are likely to reduce the output of food grains in the LDCs even if the weather is good.
This situation has already hit India. The shortages of fuel and fertilizer, together with adverse weather, have already lowered estimates of the winter grain crop to the extent that India has approached the United States for concessionary food imports in 1974-75 and has entered commercial mar- kets as well.18 Recent reports put the 1973-74 output of Indian food grain 8 million to 10 million tons below the goal whose achievement was necessary to maintain even current low consumption without additional imports or higher prices.
The tightness of the global situation can be seen by comparing the opti- mistic USDA projections of world grain output for the 1974-75 crop year with the estimated world disappearance reported in Table 5 (using the average annual increase over the last decade). As of mid-March the USDA projected world wheat output of 375 million tons, an increase of 8 million tons over 1973-74. It estimated an increase of 10 million tons in the United States, an increase of 2 million tons in Canada, and, by implication, a net decrease in the rest of the world. If this optimistic estimate is achieved, the exporting nations might increase stocks slightly, but only if demand else- where allows. Even under the USDA estimates of production and demand, U.S. stocks at the end of the year will remain at unusually low levels.
Much the same situation holds for coarse grains. In mid-March the
18. See New York Times, April 5, 1974.

104 Brookings Papers on Economic Activity, 1:1974
USDAprojected a rise in world output of more than 20 million tons, enough so that with normal consumption increases, world stocks would rise mod- estly over the coming year. But, again most of the gain is expected in North America and any stock building, if it occurs, will be in the major exporting countries.
These optimistic forecasts for wheat and coarse grains could easily be confounded by the expected decline in world rice production, largely due to fertilizer shortages. If, as some suggest, the rice shortfall is 9 million tons, it would more than offset the expected increase in wheat stocks. Thus, one can predict that, with good weather, world grain output will be either slightly above or slightly below world consumption, and that practically all of the increase in output will occur in the United States and the other major grain-exporting countries. Virtually all of the world's rice and a major por- tion of its coarse grain output in 1974 still depend upon the weather, upon the availability of fertilizer, and upon adequate supplies of fuel for harvest- ing and drying in the developed countries. Thus, whether world stocks are slightly rebuilt in 1974-75 or are depleted further is far from certain. The answer lies in events and policies yet to unfold.
This uncertainty brings the United States to the first policy dilemma it may face. Suppose the expected record output of the United States is real- ized in 1974, which, if export demand remains unchanged, would stabilize or even lower domestic prices. In that event, will the United States continue its policy of unrestricted exports? Or will it, by some device, restrict exports enough to stabilize or moderately reduce grain prices to avoid further infla- tion in prices of livestock products? This issue could be forced merely by the continued growth in domestic and world demand due to affluence and population growth, without assuming deep shortfalls in crops elsewhere in the world.
A more frightening policy dilemma is implied by a more pessimistic view. Suppose that, in addition to the shortfall caused by inadequate supplies of fertilizers, moderate to severe weather problems afflict heavily populated parts of the world, including Asia and the USSR, an event that could easily reduce world output by 20 million tons or more. Then, will the United States allow free exports or even divert substantial quantities of feed grains under special terms to avert food shortages abroad if it means pushing its own feed grain and livestock prices up further?
One factor might ameliorate the situation. If high oil prices persist, the drain on the balance of payments and the economic slowdown in the major

Dale E. Hathaway 105
developed importing countries might reduce consumer demand for grain- intensive livestock products and thus the demand for food grain imports. There is as yet no evidence of such a development, and it seems likely that political pressures will lend top priority to imports of food and food- related products in most countries, rich and poor.
In any case, continued inflation in food prices through 1974 and into 1975 is almost inevitable. Its magnitude, rate, and duration rest heavily on the weather and on the capacity of farmers to respond to the highly favor- able price incentives. Whether the United States and other major food- producing nations share this burden or limit their exports to avoid it is up to their policy makers. It would, however, take exceptional courage for the United States deliberately to restrict exports to control domestic food prices in the face of urgent world demand for additional food. And a nation that has relentlessly pursued agricultural export markets for two decades would find it doubly hard suddenly to abandon customers whose dependence it has so vigorously solicited.
Looking Ahead: Longer-run Issues
While short-run price forecasting for farm products is risky, these risks are small compared with those of longer-run forecasts. Nonetheless, the five-year forecast can hardly miss by more than did recent short-term pre- dictions. In part, however, the realization of the longer-run forecast will depend on events in late 1974 and early 1975.
THE LONGER-RUN SUPPLY PRICE OF FOOD
One of the major factors in determining prices of U.S. farm products and food is the long-run supply price of food grains and livestock products. The large, inexpensive means of expanding grain output in the United States and other developed countries-idle farm land of reasonable quality -will be exhausted in 1974. The variable costs of producing crops have gone up sharply in the United States along with the costs of fuel, fertilizers, herbicides, and farm machinery. Prices paid by farmers for production items were 46 percent higher in 1973 than in 1967; most of the advance came in 1972 and 1973. In March 1974, interest, taxes, and wages were 61 percent above the 1967 level and prices of farm machinery were up about

106 Brookings Papers on Economic Activity, 1:1974
half; fertilizer and fuel prices had doubled in the previous year. These costs mean that any expansion in output will carry a higher price; but how much higher relative to the late 1960s is uncertain. Moreover, other than interest, none of these costs is likely to decline appreciably; in all probability, in fact, all will increase more during 1974 and 1975.
Although economic analysis views land prices as price-determined rather than price-determining, they can establish the level of farm prices at which farmers will get into trouble and push for government intervention. Land prices have risen sharply in the past two years, and a collapse in them would bring screams that would resound through the political process.
All in all, U.S. crop prices may have to be nearly double those of 1971 in order to protect commercial farmers from severe economic problems. In other words, while wheat need not be $5.00 per bushel nor corn $3.50 to cover the variable costs of crop production, prices must be at or above the target prices established in the Agriculture and Consumer Protection Act, passed in August 1973 ($2.28 for wheat and $1.53 for corn in 1974, adjusted for changes in costs of production in subsequent years). Since the prices paid by farmers have gone up 12 percent between July 1973 and April 1974 and are likely to rise by a similar proportion during the rest of 1974, this means that the target prices per bushel for the 1975 crops will be close to $3 for wheat and to $2 for corn. Moreover, the 1973 act makes it less expensive to the government to hold market prices at or above the target levels than to make direct payments to farmers if prices fall appreciably below the targets. Both legislation and the rising costs spawned by nonfarm inflation reinforce expectations that the real cost of feed grains will remain above its level of the 1960s and the early 1970s; the current-dollar costs are likely to continue to rise with nonfarm price increases, since the target prices are tied directly to production costs.
For livestock products, consumer prices will reflect the higher costs of grain and of capital and labor. Labor is especially important inasmuch as an expansion of pork and dairy production will require more of it; and, if excess labor is indeed no longer available on commercial farms, high-cost labor and capital will have to be attracted to livestock production. Thus, the spreads between feed prices and livestock prices will have to widen even more than they have since 1969. Even if grain prices should fall off appre- ciably from their early 1974 levels to the targets of the 1973 farm legisla- tion, prices of livestock products would stabilize at or above the current levels. The reason is that, given these grain prices, sustaining or expanding

Dale E. Hathaway 107
livestock production will call for prices of about $40 per cwt. for hogs and over $10 per cwt. for fluid milk, considerably above the prices farmers re- ceived in mid-March 1974.
The final factor determining retail food prices is marketing costs, which account for more than half of the housewife's food budget. As of mid-1974, retail prices have not fully incorporated recent rises in marketing and trans- portation costs. And further cost increases-indeed, large ones-will take place as labor contracts are renewed. Any decline in farm price levels is therefore likely to be swallowed by increased wholesale and retail costs, affording consumers little if any relief.
Food prices have contributed heavily to inflation in the past two years; but inflation in turn will maintain or raise food costs for some period ahead. The temporary burst in farm prices to levels above long-run supply prices probably raises the long-run supply price at which equilibrium wili finally be reached. The recent inflation will be reflected in higher production costs for farmers, thus introducing a ratchet effect into this cost structure. Moreover, since the higher crop prices are being bid into land prices, there will be irresistible political pressure to maintain farm prices at levels neces- sary to sustain both asset values and market returns on other resources- even if it means resort to land-retirement programs from time to time over the next few years.
Thus, while the supply price of U.S. farm products has been moving to a new and higher equilibrium since about 1969, the level of that new equi- librium will be raised by the events of 1972-74, and it could be pushed even higher if serious inflation in food prices persists into 1975. The U.S. con- sumer will continue to pay for the problems of 1972-74.
THE LONGER-RUN DEMAND FOR FOOD
An equally difficult question is the long-run prospect for demand. The recent shift in world petroleum prices may affect the growth rates of devel- oped countries. In the short run, growth may be reduced and further cur- rency adjustments required. But, after the initial adjustment, the growth of the developed economies will likely be resumed, bringing with it the greater demand for animal products, and thus for feed grains and protein concen- trates, that their high income elasticities for these products imply.
A more vexing problem is the developing countries, where population is constantly crowding against food supplies and the margin between poor
108 Brookings Papers on Economic Activity, 1:1974
diets and famine is razor thin. These countries potentially need much bigger food supplies. Only a few have oil or other valuable natural resources to export; a few more, like Korea and Taiwan, have successfully fostered in- dustrial growth. The rest do not have the foreign exchange to meet their food-importing needs. Nor are they likely to benefit from a large-scale, continuous program of food aid, since, for political and economic reasons, neither the United States nor other developed countries are likely again to embark upon one. Thus, they will require greater internal effort and greater technical assistance than ever before to develop better and more productive farming, which makes fuller use of the available land, labor, and water supplies and which depends less on energy-intensive methods for increased yields.
Even if that difficult task can be accomplished, major policy issues con- front the United States and other advanced food-surplus countries. The question is whether some kind of public national or international food re- serve should be held against the violent price fluctuations arising from the deep declines in supply that so adversely affect both producers and con- sumers.
Several proposals for such emergency reserves have been put forth both in international forums and in the United States. On March 21, 1974, in testimony before a Senate subcommittee, Secretary of Agriculture Earl Butz opposed (1) the return to stockholding by the U.S. government, (2) an internationally held and managed stock program, and (3) authority for export controls to deal with sudden spurts in foreign demand of the type experienced over the past two years. He also reaffirmed his implicit faith in the ability of a free market economy to deal with the problems of food pro- duction and price instability:
Finally, government-managed reserves are not consistent with an incentive econ- omy. On the other hand government-held and government-manipulated reserves are consistent with the government supply-management approach to agriculture -which is short-sighted, restrictive, and higher cost....
We need to get over the idea that there is something evil about reasonable rises and falls in food supplies and prices.'9
Secretary Butz appears to take a position inconsistent with both the eco- nomic analysis and the policy position of most agricultural economists,
19. "Statemenit by Secretary of Agriculture Earl L. Butz before the Subcommittee on Agricultural Production, Marketing and Stabilization of Prices of the Senate Committee on Agriculture and Forestry" (March 21, 1974; processed), pp. 7, 9.

Dale E. Hathaway 109
including some in his own department. A long-accepted tenet in the theory of production economics holds that risk and uncertainty in agriculture are major deterrents to expansion of output. Indeed, they result in higher aver- age costs and lower output because they induce capital rationing and other costly actions to achieve greater flexibility in the face of large price changes. As some USDA economists have put it: "It seems that low-priced feed rather than high and unstable [sic] priced feed may be conducive to steady growth in livestock and poultry production."20
Since marked instability in farm prices is conducive neither to increased output nor to stable domestic or international prices, and since, further- more, it can intensify general inflationary pressure, the administration's current position is unlikely to satisfy politicians, economists, or consumers. As the world's most productive agricultural economy and the world's largest exporter, the United States must not disrupt the world food scene. It must instead play a leading role in organizing some kind of food reserve system, both to facilitate trade and to combat emergencies. Not to do so is to invite other periods like 1972-73, interspersed with years of tumbling farm prices and heavy burdens of government income supports.
20. "Feed Grain Outlook for 1973-74," USDA, Economic Research Service, Feed Situation, FdS-252 (February 1974), p. 7.

Comments and Discussion
Hendrik S. Houthakker: Agricultural problems have preoccupied eco- nomic policy makers for a long time. These problems are far from solved at an analytical level, but the main difficulties lie in political barriers to rational policy formulation. The agriculture committees of Congress tend to take a parochial and short-run view of farm problems, and any secretary of agriculture feels responsible primarily for keeping farmers happy. Con- sumers are thus put at the back of the line.
Basically, I agree with Hathaway's thesis that overcapacity in agriculture ended some years ago. While he dates the end at 1970, I would place it somewhat earlier-perhaps in 1966, when the Indian monsoon failed and U.S. agricultural exports grew temporarily. At that time, many spoke of the responsibility of the United States for feeding the poor nations, but the Green Revolution at least postponed that issue. From 1967 to 1970, grain inventories were approximately normal. But even after the surpluses were worked off and stocks depleted to levels too low for comfort, much of the American public and the Congress remained obsessed with the dangers of an oversupply of food. As Hathaway correctly points out, the shrinkage of inventories seems to be the major reason for the agricultural price ex- plosion of 1972-73.
In assessing the long-run outlook, I see ample reason for concern about agriculture, even though the concern that arose in some previous episodes, like that of 1966, turned out to be unjustified. Indeed, I believe that the agricultural problem of the next decade is more serious than the energy problem. Hathaway's discussion of the relatively high income elasticities for some products, red meat in particular, illuminates the nature of these forthcoming problems. They have obvious implications for feed grains, which Hathaway emphasized, and also for oilseeds, which may deserve more stress than he gave them.
110

Dale E. Hathaway 111
Evidence on supply elasticity would also be helpful for this long-run appraisal. Indeed, I would encourage agricultural economists to devote more attention to the investigation of supply elasticity. It requires detailed knowledge of the conditions for producing various crops and livestock, and therefore defies the skills and expertise of a non-agricultural economist. As Hathaway points out, for the first time in decades the United States seems to be using its full supply of land. But I wonder what effect proper incen- tives would have in drawing out now hidden supplies of land. Hathaway seems to feel that labor could become a limiting factor in any expansion of land usage, as it may already be in livestock production. In my amateur judgment, I suspect that surplus labor is still present in some branches of livestock production, and is kept there by various government policies. For example, dairy production operates under a host of restrictions. Re- strictions on foreign imports prevent healthy competition that might en- courage improved efficiency in dairying. Moreover, the notion of "foreign milk" extends to interstate commerce. An important case in Massachusetts now deals with access of New York milk to the market in that state. Given the removal of such restrictions, the dairy industry may be capable of much greater efficiency than it has achieved. These clues encourage me to believe that some scope exists for conserving labor through increased efficiency.
They also raise broader questions about possible improvements in agri- cultural policy. As Hathaway suggests, the failures of policy in recent years have been colossal. It was nothing short of scandalous that the government imposed crop restrictions in 1972, when a serious problem was clearly emerging in grains.
One important question about the future concerns the effects of the Agriculture Act of 1973. Hathaway suggests that the target prices in that act may be unreasonably low and therefore obsolete. Although I agree that that is a possibility, I would not yet take it for granted. Agricultural prices have been falling significantly in the last few months and they may come down to levels that will make the target prices once again relevant.
A second important question concerns the future role of export controls, such as those put into effect on soybeans in 1973. The basic issue is whether the United States should serve as a supplier of last resort for the whole world. I'm inclined to answer that question affirmatively. This country has a comparative advantage in agricultural production, and we gain along with the rest of the world when we trade heavily in farm products. Flirting with export limitations encourages other nations to strengthen their own agri-
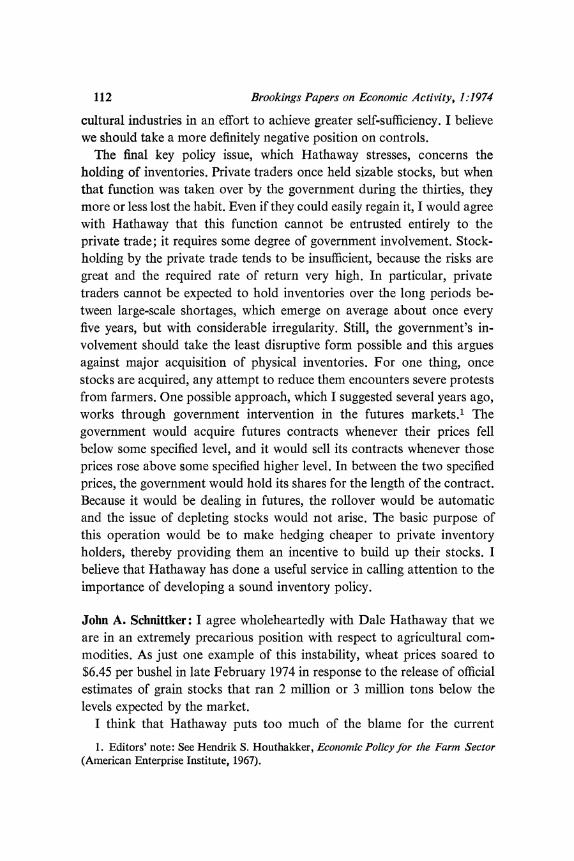
112 Brookings Papers on Economic Activity, 1:1974
cultural industries in an effort to achieve greater self-sufficiency. I believe we should take a more definitely negative position on controls.
The final key policy issue, which Hathaway stresses, concerns the holding of inventories. Private traders once held sizable stocks, but when that function was taken over by the government during the thirties, they more or less lost the habit. Even if they could easily regain it, I would agree with Hathaway that this function cannot be entrusted entirely to the private trade; it requires some degree of government involvement. Stock- holding by the private trade tends to be insufficient, because the risks are great and the required rate of return very high. In particular, private traders cannot be expected to hold inventories over the long periods be- tween large-scale shortages, which emerge on average about once every five years, but with considerable irregularity. Still, the government's in- volvement should take the least disruptive form possible and this argues against major acquisition of physical inventories. For one thing, once stocks are acquired, any attempt to reduce them encounters severe protests from farmers. One possible approach, which I suggested several years ago, works through government intervention in the futures markets.' The government would acquire futures contracts whenever their prices fell below some specified level, and it would sell its contracts whenever those prices rose above some specified higher level. In between the two specified prices, the government would hold its shares for the length of the contract. Because it would be dealing in futures, the rollover would be automatic and the issue of depleting stocks would not arise. The basic purpose of this operation would be to make hedging cheaper to private inventory holders, thereby providing them an incentive to build up their stocks. I believe that Hathaway has done a useful service in calling attention to the importance of developing a sound inventory policy.
John A. Schnittker: I agree wholeheartedly with Dale Hathaway that we are in an extremely precarious position with respect to agricultural com- modities. As just one example of this instability, wheat prices soared to $6.45 per bushel in late February 1974 in response to the release of official estimates of grain stocks that ran 2 million or 3 million tons below the levels expected by the market.
I think that Hathaway puts too much of the blame for the current
1. Editors' note: See Hendrik S. Houthakker, Economic Policy for the Farm Sector (American Enterprise Institute, 1967).
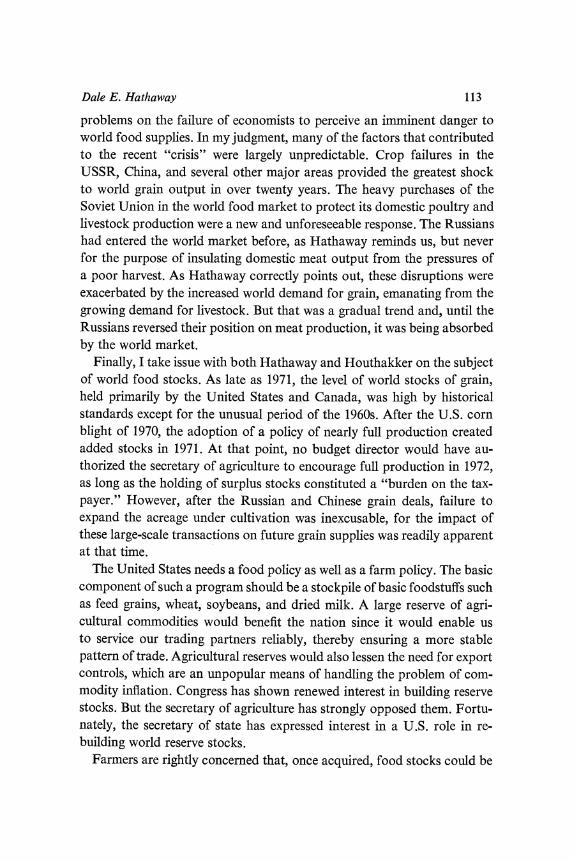
Dale E. Hathiaway 113
problems on the failure of economists to perceive an imminent danger to world food supplies. In my judgment, many of the factors that contributed to the recent "crisis" were largely unpredictable. Crop failures in the USSR, China, and several other major areas provided the greatest shock to world grain output in over twenty years. The heavy purchases of the Soviet Union in the world food market to protect its domestic poultry and livestock production were a new and unforeseeable response. The Russians had entered the world market before, as Hathaway reminds us, but never for the purpose of insulating domestic meat output from the pressures of a poor harvest. As Hathaway correctly points out, these disruptions were exacerbated by the increased world demand for grain, emanating from the growing demand for livestock. But that was a gradual trend and, until the Russians reversed their position on meat production, it was being absorbed by the world market.
Finally, I take issue with both Hathaway and Houthakker on the subject of world food stocks. As late as 1971, the level of world stocks of grain, held primarily by the United States and Canada, was high by historical standards except for the unusual period of the 1960s. After the U.S. corn blight of 1970, the adoption of a policy of nearly full production created added stocks in 1971. At that point, no budget director would have au- thorized the secretary of agriculture to encourage full production in 1972, as long as the holding of surplus stocks constituted a "burden on the tax- payer." However, after the Russian and Chinese grain deals, failure to expand the acreage under cultivation was inexcusable, for the impact of these large-scale transactions on future grain supplies was readily apparent at that time.
The United States needs a food policy as well as a farm policy. The basic component of such a program should be a stockpile of basic foodstuffs such as feed grains, wheat, soybeans, and dried milk. A large reserve of agri- cultural commodities would benefit the nation since it would enable us to service our trading partners reliably, thereby ensuring a more stable pattern of trade. Agricultural reserves would also lessen the need for export controls, which are an unpopular means of handling the problem of com- modity inflation. Congress has shown renewed interest in building reserve stocks. But the secretary of agriculture has strongly opposed them. Fortu- nately, the secretary of state has expressed interest in a U.S. role in re- building world reserve stocks.
Farmers are rightly concerned that, once acquired, food stocks could be

114 Brookings Papers on Economic Activity, 1:1974
sold to drive down market prices. But they might accept a stocks policy if an agreement were made to hold the stocks until prices were, say, double the acquisition price. Such a program would provide a margin of safety to U.S. consumers against terribly high prices and would help other nations to cope with severe shortages.
I noted above that export controls should be avoided whenever possible. But, in the face of high prices for soybeans, wheat, and corn, I would sug- gest their use again as I did last year. After a certain point, the goal of domestic price stability should override any obligation to sell the Russians, Chinese, and Japanese all the food that they want-for stock building as well as consumption. Export licensing early in the crop year would have prevented the major instability in grain and oilseed prices we experienced in the past year. We can hope to avoid resort to such measures if we main- tain adequate stockpiles of basic foodstuffs.
General Discussion
Dale Hathaway took issue with a few points made by the discussants of his paper. Responding to Schnittker, he stressed that the adequacy of stocks should be judged by their size relative to world consumption, and not in absolute terms. By the relative standard, the decline after 1969 was pronounced. In response to Houthakker, Hathaway expressed his con- viction that estimates of supply elasticities based on historical experience would be extremely unreliable, given the major changes in the structure of the agricultural economy. Furthermore, he emphasized, labor costs, rather than government restrictions, were, in his judgment, the major inhib- itor of expansion in dairying.
Much of the discussion focused on issues involving agricultural reserve stocks. Michael Wachter noted that, in a world where farm prices are expected to have an upward trend relative to the general price level, entre- preneurs would be eager to hold food stocks. However, uncertainty about the future role of government in stockpiling agricultural commodities would serve to discourage private activity to build inventories. Wachter and William Poole observed that a clear statement of the intentions of agricultural policy in this area could be vital to private tradesmen. Paul Samuelson countered that it was unrealistic ever to expect certainty about the role of government; even after the government had made up its mind,
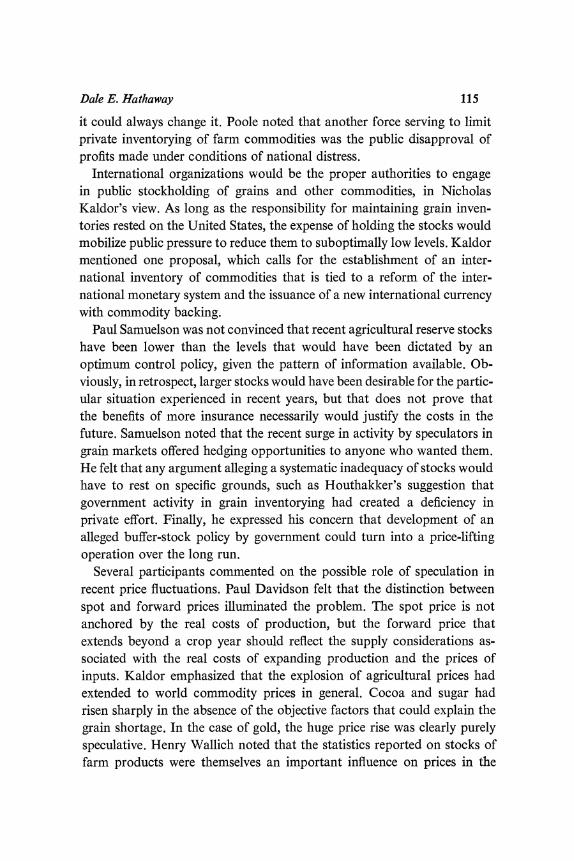
Dale E. Hathaway 115
it could always change it. Poole noted that another force serving to limit private inventorying of farm commodities was the public disapproval of profits made under conditions of national distress.
International organizations would be the proper authorities to engage in public stockholding of grains and other commodities, in Nicholas Kaldor's view. As long as the responsibility for maintaining grain inven- tories rested on the United States, the expense of holding the stocks would mobilize public pressure to reduce them to suboptimally low levels. Kaldor mentioned one proposal, which calls for the establishment of an inter- national inventory of commodities that is tied to a reform of the inter- national monetary system and the issuance of a new international currency with commodity backing.
Paul Samuelson was not convinced that recent agricultural reserve stocks have been lower than the levels that would have been dictated by an optimum control policy, given the pattern of information available. Ob- viously, in retrospect, larger stocks would have been desirable for the partic- ular situation experienced in recent years, but that does not prove that the benefits of more insurance necessarily would justify the costs in the future. Samuelson noted that the recent surge in activity by speculators in grain markets offered hedging opportunities to anyone who wanted them. He felt that any argument alleging a systematic inadequacy of stocks would have to rest on specific grounds, such as Houthakker's suggestion that government activity in grain inventorying had created a deficiency in private effort. Finally, he expressed his concern that development of an alleged buffer-stock policy by government could turn into a price-lifting operation over the long run.
Several participants commented on the possible role of speculation in recent price fluctuations. Paul Davidson felt that the distinction between spot and forward prices illuminated the problem. The spot price is not anchored by the real costs of production, but the forward price that extends beyond a crop year should reflect the supply considerations as- sociated with the real costs of expanding production and the prices of inputs. Kaldor emphasized that the explosion of agricultural prices had extended to world commodity prices in general. Cocoa and sugar had risen sharply in the absence of the objective factors that could explain the grain shortage. In the case of gold, the huge price rise was clearly purely speculative. Henry Wallich noted that the statistics reported on stocks of farm products were themselves an important influence on prices in the

116 Brookings Papers on Economic Activity, 1:1974
short run. To the extent that speculative activity has built up stocks in the hands of traders and food processors, these stocks are not accurately re- ported and hence do not depress the level of prices. An improvement of the reporting system that prevented supplies from disappearing into un- reported holdings might have a favorable effect on the stability of com- modity prices. However, Hathaway expressed doubt about the existence of large private stockpiles, particularly in the less developed countries. He felt that the Soviet Union and China were the world's largest stockholders, and the size of their stocks is officially secret.
The issue of export controls evoked several comments. William Poole expressed surprise at the public's acceptance of export controls that shielded Americans from relatively minor inconvenience and thereby thrust the burden of severe food shortages onto poor countries for which the burdens were most onerous. Lawrence Krause stated his own strong pro- clivities to oppose export controls, but conceded the possible usefulness of sophisticated policies that might permit some separation of domestic markets from foreign markets. He noted that the United States is essentially the only major seller of grain that operates without a national marketing board. Arthur Okun suggested that marketing boards seemed to be much more acceptable internationally than outright export controls, even though they could be operated to pursue the same objectives-for better or for worse.
Robert Hall viewed American opposition to rising agricultural prices as paradoxical. As a net exporter of agricultural commodities, the United States stands to benefit from higher prices. George Perry suggested that the skewed effects on the distribution of income were an issue here; rising prices benefit American farmers a lot, but they hurt the majority of Ameri- can nonfarm consumers. Okun added that the public disapproval also reflected the macroeconomic considerations that translated an agricul- tural inflation into lower levels of real aggregate demand and hence de- pressed output and employment. Hall also doubted that fluctuations in agricultural prices had important welfare costs. Hathaway argued, how- ever, that stability in agricultural prices is desirable on production grounds; historical data show that instability is a major inhibitor to the expansion of agricultural output.