food outlook november 2013 oilseeds · 2013-11-15 · november 2013 world oilcrop production could...
TRANSCRIPT
Market sum
maries
Market sum
maries
7FOOD OUTLOOKNOVEMBER 2013
World oilcrop production could climb to an all-time high, supported by record soybean crops in South America. While large soybean crops point to a healthy expansion in world supplies of meals/cakes, global supplies of oils/fats should also rise thanks to a recovery in high oil-yielding seed output and steady growth in palm oil. Moderate growth in world consumption of oils and meals is expected to continue.
Global output of oilseed products should match world utilization for the second consecutive year, although a sizeable surplus is possible in the case of meals/cakes. As a result, further replenishments in world stocks should be achievable, especially with regard to oilmeals. Based on current prospects, the stock-to-use ratio is projected to improve significantly from last season for meals, but to remain unchanged for oils/fats.
The present 2013/14 outlook suggests there is scope for international meal prices to finally come down from their record high levels. Additional downward pressure on meal prices is likely to come from rising global supplies of feedgrains. As to the oils/fats market, adequate supplies and ample stocks are expected to keep prices stable at their current relatively low level.
This season’s outlook relies heavily on the realization of bumper soybean harvests in South America. Any unexpected weather problem in the region would have a direct, strong impact on the global supply and demand situation. With traders closely monitoring weather developments in South America, prices in the oilseed complex are likely to remain volatile.
While international trade in oils/fats is expected to keep expanding moderately, growth in meal transactions should rebound after last season’s slowdown. As meal prices become more a�ordable meal import demand should increase – although the abundance of feedgrains may temper such growth.
OILSEEDS
Contact:[email protected]
FAO - Trade and Markets DivisionFood Outlook November 2013
Ma
rke
t a
sse
ssm
en
tsMM
ark
et
ass
ess
me
nnttss
38 FOOD OUTLOOKNOVEMBER 2013
1 Almost the entire volume of oilcrops harvested worldwide is crushed to obtain oils and fats for human nutrition or industrial purposes, and to obtain cakes and meals which are used as feed ingredients. Therefore, rather than referring to oilseeds, the analysis of the market situation is mainly undertaken in terms of oils/fats and cakes/meals. Hence, production data for oils (cakes) derived from oilseeds refer to the oil (cake) equivalent of the production estimates for the relevant oilseeds, i.e. they do not reflect the outcome of actual oilseed crushing. Furthermore, the data on trade in and stocks of oils (cakes) refer to the sum of trade in and stocks of oils (cakes) plus the oil (cake) equivalent of oilseed trade and stocks.
Major Oilseed Exporters and Importers
Major ExportersMajor Importers
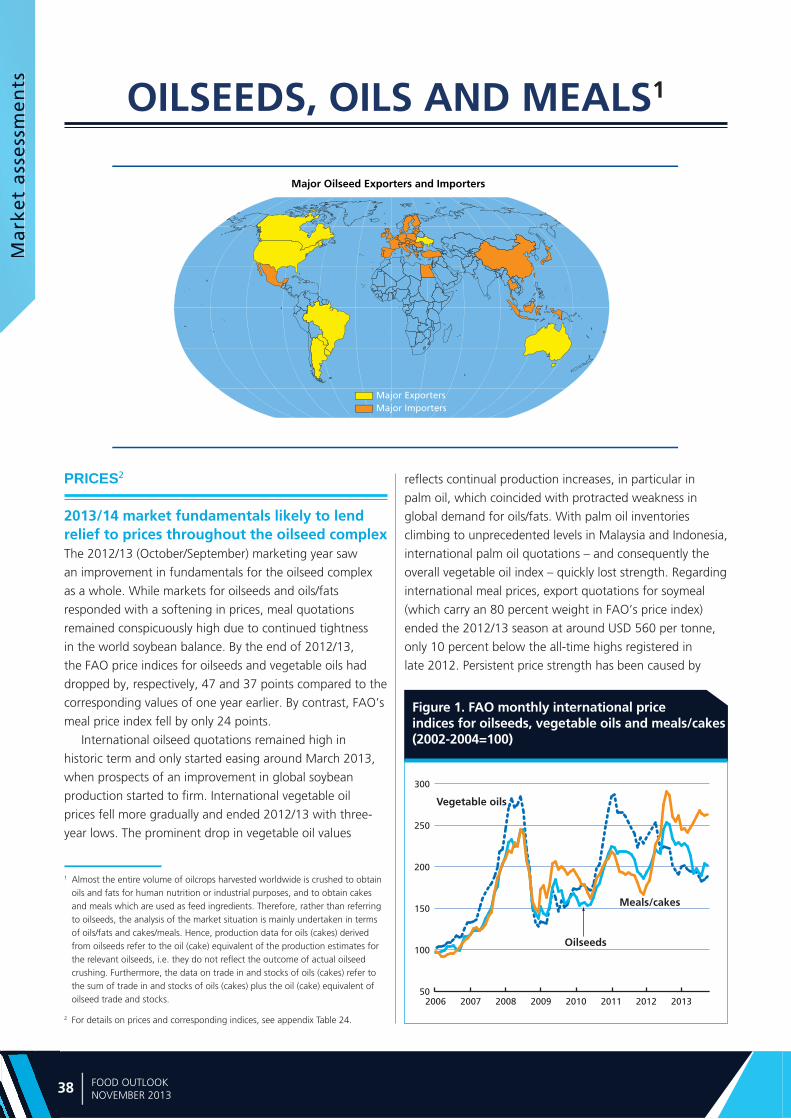
Figure 1. FAO monthly international price indices for oilseeds, vegetable oils and meals/cakes (2002-2004=100)
50
100
150
200
250
300
20132012201120102009200820072006
Meals/cakes
Vegetable oils
Oilseeds
PRICES2
2013/14 market fundamentals likely to lend relief to prices throughout the oilseed complexThe 2012/13 (October/September) marketing year saw
an improvement in fundamentals for the oilseed complex
as a whole. While markets for oilseeds and oils/fats
responded with a softening in prices, meal quotations
remained conspicuously high due to continued tightness
in the world soybean balance. By the end of 2012/13,
the FAO price indices for oilseeds and vegetable oils had
dropped by, respectively, 47 and 37 points compared to the
corresponding values of one year earlier. By contrast, FAO’s
meal price index fell by only 24 points.
International oilseed quotations remained high in
historic term and only started easing around March 2013,
when prospects of an improvement in global soybean
production started to firm. International vegetable oil
prices fell more gradually and ended 2012/13 with three-
year lows. The prominent drop in vegetable oil values
2 For details on prices and corresponding indices, see appendix Table 24.
reflects continual production increases, in particular in
palm oil, which coincided with protracted weakness in
global demand for oils/fats. With palm oil inventories
climbing to unprecedented levels in Malaysia and Indonesia,
international palm oil quotations – and consequently the
overall vegetable oil index – quickly lost strength. Regarding
international meal prices, export quotations for soymeal
(which carry an 80 percent weight in FAO’s price index)
ended the 2012/13 season at around USD 560 per tonne,
only 10 percent below the all-time highs registered in
late 2012. Persistent price strength has been caused by
OILSEEDS, OILS AND MEALS1

Ma
rke
t asse
ssme
nts
MMaa
rke
t asse
ssme
nts
39FOOD OUTLOOKNOVEMBER 2013
Figure 5. CBOT soybean futures for MarchFigure 2. FAO monthly price index for oilseeds (2002-2004=100)
Figure 3. FAO monthly price index for vegetable oils (2002-2004=100)
Figure 4. FAO monthly price index for oilmeals/cakes (2002-2004=100)
170
200
230
2602011/12
2012/13
2010/11
SAJJMAMFJDNO
150
200
250
300
2012/13
2011/12
2010/11
SAJJMAMFJDNO
150
200
250
300
2011/12
2012/13
2010/11
SAJJMAMFJDNO
350
450
550
650
USD per tonne
M A M J J A S O
2012 values 2013 values 2014 values
protracted tightness in the global soybean balance, marked
by two consecutive seasons of below average inventory
levels.
The current supply and demand outlook for 2013/14
points to a further improvement in oilcrop fundamentals.
With global output of oilseed products expected to outpace
world utilization – possibly including a sizeable surplus of
meals/cakes – a marked replenishment in global stocks
should be achievable. The resulting marked improvement in
the global stock-to-use ratio for meals suggest that there is
considerable scope for international meal prices to soften –
also because additional downward pressure is expected to
come from rising global supplies of feedgrains. The recent
easing in Chicago Board of Trade (CBOT) soybean futures
prices (from around USD 500 per tonne in end-August
to USD 460 in mid-October) seems to point in the same
direction. However, it could take some time for meal values
to ease. This is because until early next year, i.e. when
the new South American crop gets harvested, the United
States will be the world’s only main supplier of soybeans
(considering that South America’s old crop has basically
been sold out due to supply tightness in the United States
earlier this year). In other words, for a lasting relaxation
in global meal prices to occur, the market’s confidence in
the level and regional distribution of global soybean stocks
needs to be restored first.
As to the oils/fats market, the prospect of adequate
global supplies, abundant stocks and a stable stock-to-use
ratio suggests a stabilization of international prices at their
current relatively low level.
As the outlook for 2013/14 relies heavily on the
realization of a bumper soybean harvest in South America,
any unexpected weather (or disease) problem in that region
Ma
rke
t a
sse
ssm
en
tsMM
ark
et
ass
ess
me
nnttss
40 FOOD OUTLOOKNOVEMBER 2013
2011/12 2012/13estim.
2013/14 f’cast
Change 2013/14
over 2012/13
%
million tonnes
Soybeans 240.0 267.0 281.6 5.5
Rapeseed 61.7 64.1 67.6 5.5
Cottonseed 47.2 45.2 43.7 -3.4
Groundnuts (unshelled) 37.2 38.3 39.6 3.5
Sunflower seed 39.0 36.1 38.7 7.2
Palm kernels 13.3 13.9 14.4 4.1
Copra 5.3 5.5 5.5 -0.2
Total 443.8 470.1 491.1 4.5
Note: The split years bring together northern hemisphere annual crops harvested in the latter part of the first year shown, with southern hemisphere annual crops harvested in the early part of the second year shown. For tree crops, which are produced throughout the year, calendar year production for the second year shown is used.
Table 1. World production of major oilseeds
would have a direct, strong impact on the global supply-
and-demand situation. With the trade closely monitoring
weather developments in South America, prices in the
oilseed complex can be expected to remain volatile during
the coming months.
OILSEEDS
Oilseed production likely climbing to all-time record in 2013/14In 2013/14, global oilseed production is projected to rise
by 4 percent, possibly exceeding 500 million tonnes for the
first time. Production should expand markedly for all major
oilcrops except cottonseed. In volume terms, soybeans are
expected to lead the expansion, followed by rapeseed and
sunflowerseed.
After last year’s record-breaking output, 2013/14
global soybean production is tentatively forecast to rise
another 5–6 percent, to an all-time high of 282 million
tonnes. The forecast largely rests on prospective production
increases in Argentina, Brazil and the United States, which,
combined, are projected to harvest 15 million tonnes more
than last season. In the United States, where harvesting
is still underway, prolonged spells of dry weather have
compromised the crop yield potential. Despite a relatively
modest average yield level of 2.75 tonnes/ha, US output
should still rise – thanks to record high plantings. If
confirmed, the latest available production estimate of 85.7
million tonnes (3.7 million tonnes more than last year)
would end the downward trend of the last three years.
For South America, where sowings have only just started,
another record-breaking crop is possible: aggregate output
is tentatively set at 156 million tonnes, a sweeping 7–8
percent above 2012/13. With average yield levels projected
on-trend at 2.8–2.9 tonnes/ha (assuming normal weather
conditions throughout the growing season), the production
boost would be driven by a hefty rise in area planted.
The region’s total soybean area is tentatively put at 54
million ha, 5 percent up from last season – and 40 percent
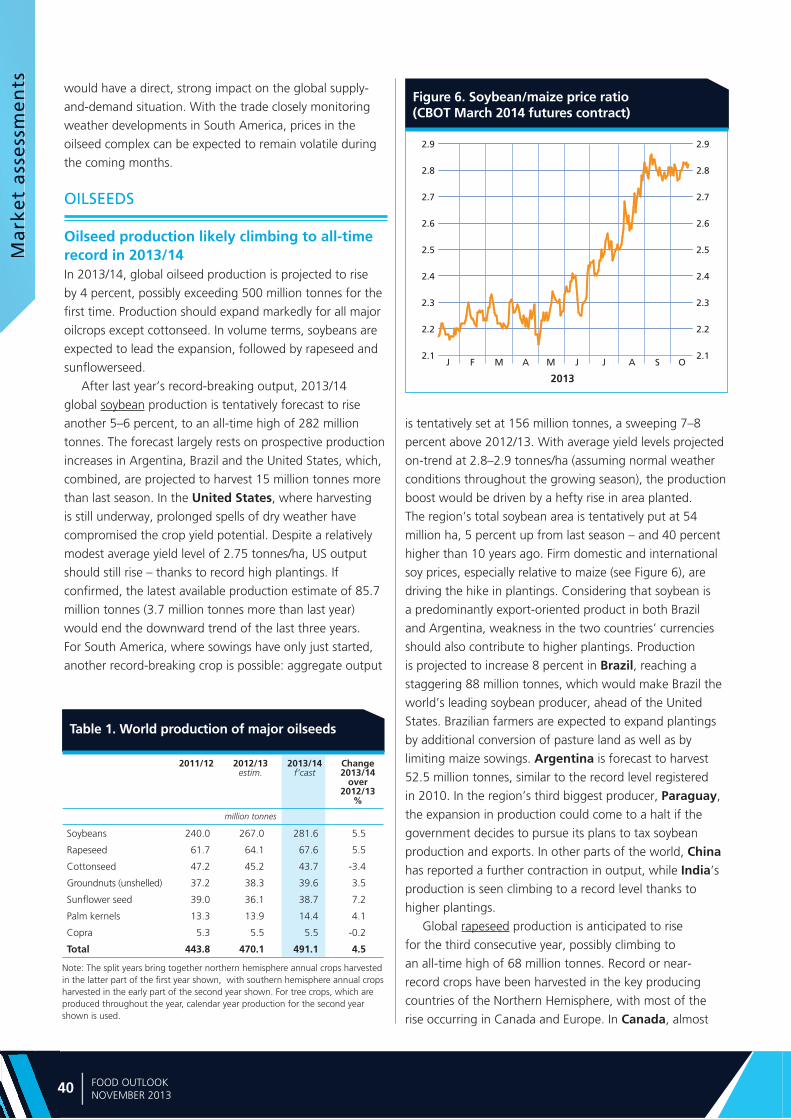
higher than 10 years ago. Firm domestic and international
soy prices, especially relative to maize (see Figure 6), are
driving the hike in plantings. Considering that soybean is
a predominantly export-oriented product in both Brazil
and Argentina, weakness in the two countries’ currencies
should also contribute to higher plantings. Production
is projected to increase 8 percent in Brazil, reaching a
staggering 88 million tonnes, which would make Brazil the
world’s leading soybean producer, ahead of the United
States. Brazilian farmers are expected to expand plantings
by additional conversion of pasture land as well as by
limiting maize sowings. Argentina is forecast to harvest
52.5 million tonnes, similar to the record level registered
in 2010. In the region’s third biggest producer, Paraguay,
the expansion in production could come to a halt if the
government decides to pursue its plans to tax soybean
production and exports. In other parts of the world, China
has reported a further contraction in output, while India’s
production is seen climbing to a record level thanks to
higher plantings.
Global rapeseed production is anticipated to rise
for the third consecutive year, possibly climbing to
an all-time high of 68 million tonnes. Record or near-
record crops have been harvested in the key producing
countries of the Northern Hemisphere, with most of the
rise occurring in Canada and Europe. In Canada, almost
Figure 6. Soybean/maize price ratio (CBOT March 2014 futures contract)
2.1
2.2
2.3
2.4
2.5
2.6
2.7
2.8
2.9
2.1
2.2
2.3
2.4
2.5
2.6
2.7
2.8
2.9
J F AM M J J A S O
2013
Ma
rke
t asse
ssme
nts
MMaa
rke
t asse
ssme
nts
41FOOD OUTLOOKNOVEMBER 2013
1 Includes oils and fats of vegetable, animal and marine origin.2 Production plus opening stocks.3 Residual of the balance.4 Trade data refer to exports based on a common October/September marketing
season and relate to the sum of trade in oils (meals) plus the oil (meal) equivalent of oilcrops traded.
5 Major exporters include Argentina, Brazil, Canada, Indonesia, Malaysia and the United States.
6 All meal figures are expressed in protein equivalent; meals include all meals and cakes derived from oilcrops as well as meals of marine and animal origin.
7 Major exporters include Argentina, Brazil, Canada, India, Indonesia, Malaysia, Paraguay and the United States.
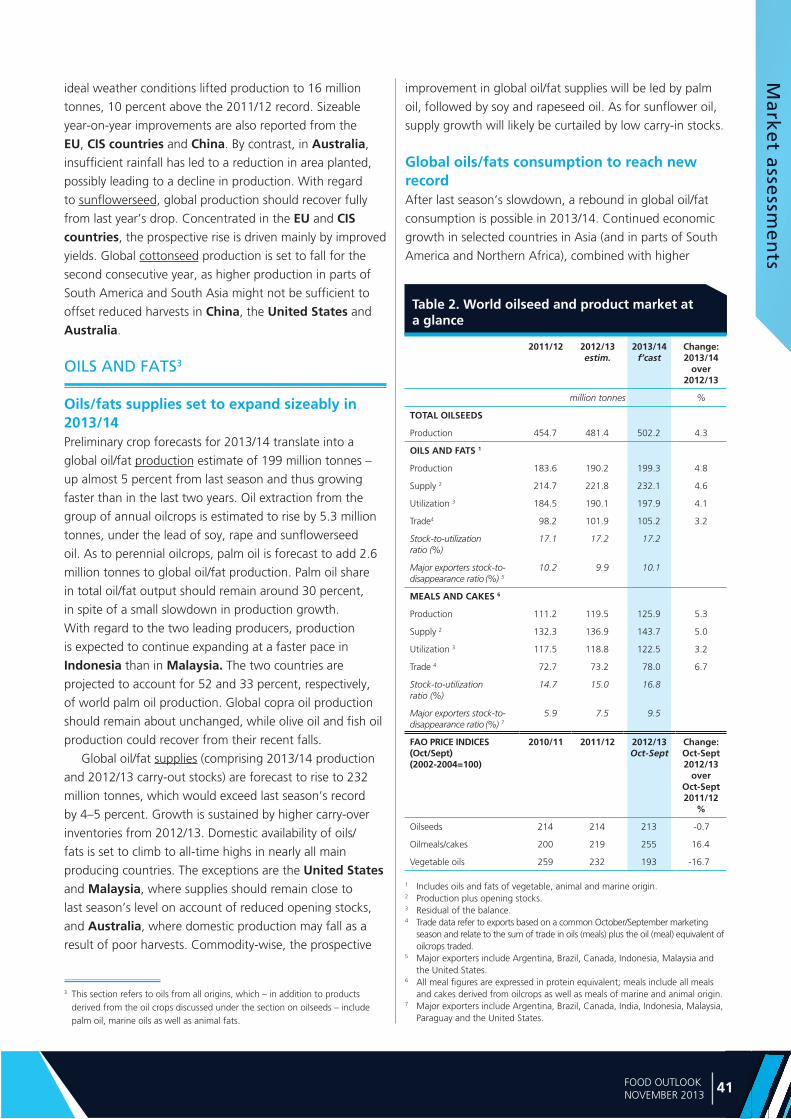
Table 2. World oilseed and product market ata glance
2011/12 2012/13 estim.
2013/14 f’cast
Change: 2013/14
over 2012/13
million tonnes %
TOTAL OILSEEDS
Production 454.7 481.4 502.2 4.3
OILS AND FATS 1
Production 183.6 190.2 199.3 4.8
Supply 2 214.7 221.8 232.1 4.6
Utilization 3 184.5 190.1 197.9 4.1
Trade4 98.2 101.9 105.2 3.2
Stock-to-utilization ratio (%)
17.1 17.2 17.2
Major exporters stock-to-disappearance ratio (%) 5
10.2 9.9 10.1
MEALS AND CAKES 6
Production 111.2 119.5 125.9 5.3
Supply 2 132.3 136.9 143.7 5.0
Utilization 3 117.5 118.8 122.5 3.2
Trade 4 72.7 73.2 78.0 6.7
Stock-to-utilization ratio (%)
14.7 15.0 16.8
Major exporters stock-to-disappearance ratio (%) 7
5.9 7.5 9.5
FAO PRICE INDICES (Oct/Sept) (2002-2004=100)
2010/11 2011/12 2012/13 Oct-Sept
Change: Oct-Sept 2012/13
overOct-Sept 2011/12
%
Oilseeds 214 214 213 -0.7
Oilmeals/cakes 200 219 255 16.4
Vegetable oils 259 232 193 -16.7
ideal weather conditions lifted production to 16 million
tonnes, 10 percent above the 2011/12 record. Sizeable
year-on-year improvements are also reported from the
EU, CIS countries and China. By contrast, in Australia,
insufficient rainfall has led to a reduction in area planted,
possibly leading to a decline in production. With regard
to sunflowerseed, global production should recover fully
from last year’s drop. Concentrated in the EU and CIS countries, the prospective rise is driven mainly by improved
yields. Global cottonseed production is set to fall for the
second consecutive year, as higher production in parts of
South America and South Asia might not be sufficient to
offset reduced harvests in China, the United States and
Australia.
OILS AND FATS3
Oils/fats supplies set to expand sizeably in 2013/14 Preliminary crop forecasts for 2013/14 translate into a
global oil/fat production estimate of 199 million tonnes –
up almost 5 percent from last season and thus growing
faster than in the last two years. Oil extraction from the
group of annual oilcrops is estimated to rise by 5.3 million
tonnes, under the lead of soy, rape and sunflowerseed
oil. As to perennial oilcrops, palm oil is forecast to add 2.6
million tonnes to global oil/fat production. Palm oil share
in total oil/fat output should remain around 30 percent,
in spite of a small slowdown in production growth.
With regard to the two leading producers, production
is expected to continue expanding at a faster pace in
Indonesia than in Malaysia. The two countries are
projected to account for 52 and 33 percent, respectively,
of world palm oil production. Global copra oil production
should remain about unchanged, while olive oil and fish oil
production could recover from their recent falls.
Global oil/fat supplies (comprising 2013/14 production
and 2012/13 carry-out stocks) are forecast to rise to 232
million tonnes, which would exceed last season’s record
by 4–5 percent. Growth is sustained by higher carry-over
inventories from 2012/13. Domestic availability of oils/
fats is set to climb to all-time highs in nearly all main
producing countries. The exceptions are the United States
and Malaysia, where supplies should remain close to
last season’s level on account of reduced opening stocks,
and Australia, where domestic production may fall as a
result of poor harvests. Commodity-wise, the prospective
3 This section refers to oils from all origins, which – in addition to products derived from the oil crops discussed under the section on oilseeds – include palm oil, marine oils as well as animal fats.
improvement in global oil/fat supplies will be led by palm
oil, followed by soy and rapeseed oil. As for sunflower oil,
supply growth will likely be curtailed by low carry-in stocks.
Global oils/fats consumption to reach new record After last season’s slowdown, a rebound in global oil/fat
consumption is possible in 2013/14. Continued economic
growth in selected countries in Asia (and in parts of South
America and Northern Africa), combined with higher
Ma
rke
t a
sse
ssm
en
tsMM
ark
et
ass
ess
me
nnttss
42 FOOD OUTLOOKNOVEMBER 2013
Figure 8. World stocks and ratios of oils/fats (including the oil contained in seeds stored)
0
10
20
30
40
2013/142012/132011/122010/112009/106
9
12
15
18
Million tonnes Percent
Major Exporters Rest of the World
World Stock-to-use ratioStock-to-disappearance ratio of Major Exporters
estim. f’cast
supplies and the gradual fall in international prices for oils/
fats should stimulate demand. Total consumption is pegged
at a record 198 million tonnes in 2013/14, up 4 percent
year-on-year. Given its competitive price relative to other
oils, palm oil would remain the growth leader, followed by
soy, rape and sunflowerseed oil.
Among developing countries, which together account
for two-thirds of global demand, utilization should
expand by another 4–5 percent. Growth would remain
concentrated in Asia under the lead of China, but
consumption gains are also expected in India, Indonesia
and other Asian nations, where steady economic and
population growth keeps stimulating demand for food
and oleochemical products. In Africa and Latin America,
annual consumption growth is expected to remain below 3
percent. Among developed nations, demand could improve
after several years of subdued growth, driven by a recovery
in supplies.
Regarding the uptake of oils/fats by the biodiesel
industry, demand growth is expected to remain below that
recorded in recent years. In several biodiesel producing
countries, factory utilization rates are likely to remain well
below nominal capacity levels. Growth potential is mostly
limited to developing countries where national policies
continue to encourage production for either domestic use
or export. Countries that may implement higher biodiesel
consumption targets next year include Brazil, Indonesia, Malaysia and the Philippines, which may raise the
importance of palm oil and other tropical oils as feedstock.
Among developed countries – which include the world’s
leading producers and consumers of biodiesel – longer term
prospects for oils/fats as biodiesel feedstock remain bleak,
given growing concerns about the overall sustainability of
crop-based biofuels. The EU, for instance, is considering
lowering its medium-term consumption targets for crop-
based biofuels from the levels that were announced in
2009. In the meantime, national biofuel regulations, border
measures and certification requirements will continue to
influence markets for biodiesel and their feedstock. EU
measures regarding the importation of biodiesel from
certain origins are one case in point. Biodiesel production
levels also continue to depend on the vegetable/mineral oil
price relation; a further narrowing in the crude oil/palm oil
discount, for instance, would make palm-oil-based biodiesel
production more profitable.
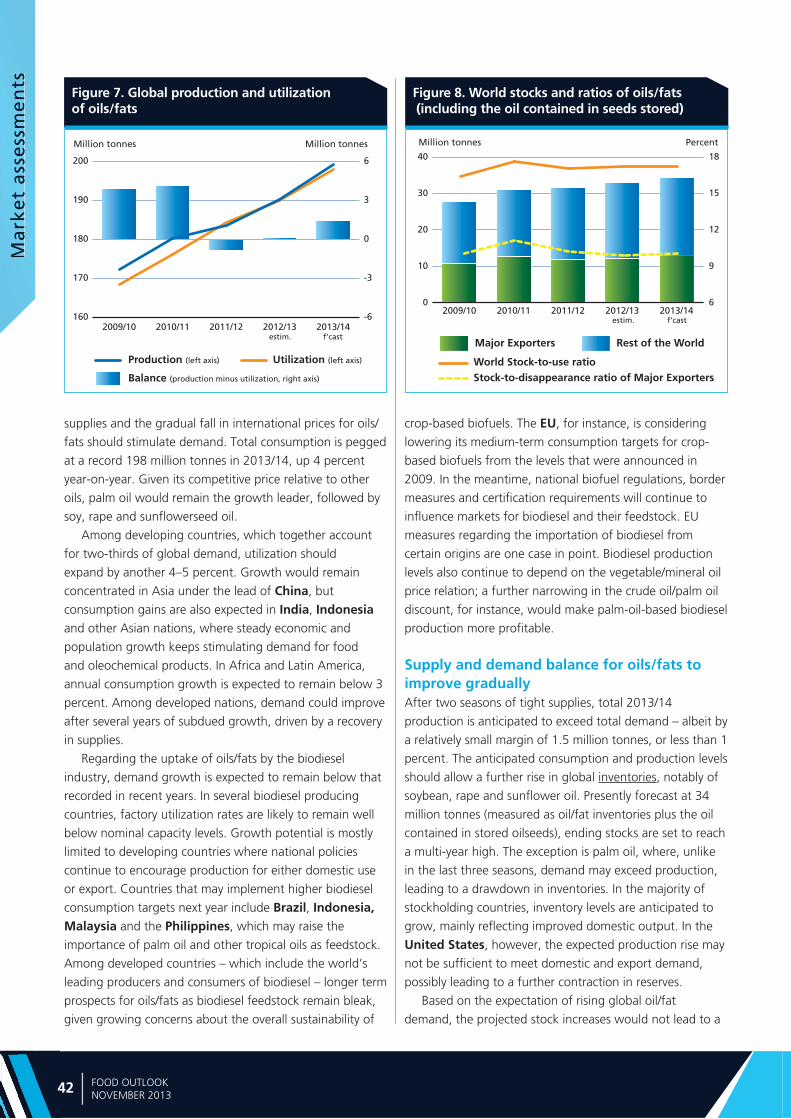
Supply and demand balance for oils/fats to improve gradually After two seasons of tight supplies, total 2013/14
production is anticipated to exceed total demand – albeit by
a relatively small margin of 1.5 million tonnes, or less than 1
percent. The anticipated consumption and production levels
should allow a further rise in global inventories, notably of
soybean, rape and sunflower oil. Presently forecast at 34
million tonnes (measured as oil/fat inventories plus the oil
contained in stored oilseeds), ending stocks are set to reach
a multi-year high. The exception is palm oil, where, unlike
in the last three seasons, demand may exceed production,
leading to a drawdown in inventories. In the majority of
stockholding countries, inventory levels are anticipated to
grow, mainly reflecting improved domestic output. In the
United States, however, the expected production rise may
not be sufficient to meet domestic and export demand,
possibly leading to a further contraction in reserves.
Based on the expectation of rising global oil/fat
demand, the projected stock increases would not lead to a
Figure 7. Global production and utilizationof oils/fats
-6
-3
0
3
6
160
170
180
190
200
2013/142012/132011/122010/112009/10
Million tonnes Million tonnes
estim. f’cast
Balance (production minus utilization, right axis)
Production (left axis) Utilization (left axis)
Ma
rke
t asse
ssme
nts
MMaa
rke
t asse
ssme
nts
43FOOD OUTLOOKNOVEMBER 2013
Figure 9. Oil/fat exports by major exporters (including the oil contained in seed exports)
0
5
10
15
20
252012/13 estimate
2013/14 forecast
Million tonnes
UnitedStates
IndonesiaCanada MalaysiaArgentina Brazil
Figure 10. Total oil/fat imports by region or major country (including the oil contained in seed imports)
0
10
20
30
40
2013/142011/122009/102007/082005/06
Latin America
Asia excl. China (total) Europe
China (total)
Million tonnes
United States & Canada Africa
f’cast
noticeable improvement in global stock-to-use ratios. Year-
on-year, the global stock-to-use ratio is forecast to remain
unchanged, whereas a minimal increase is expected in the
stock-to-disappearance ratio for major exporters.
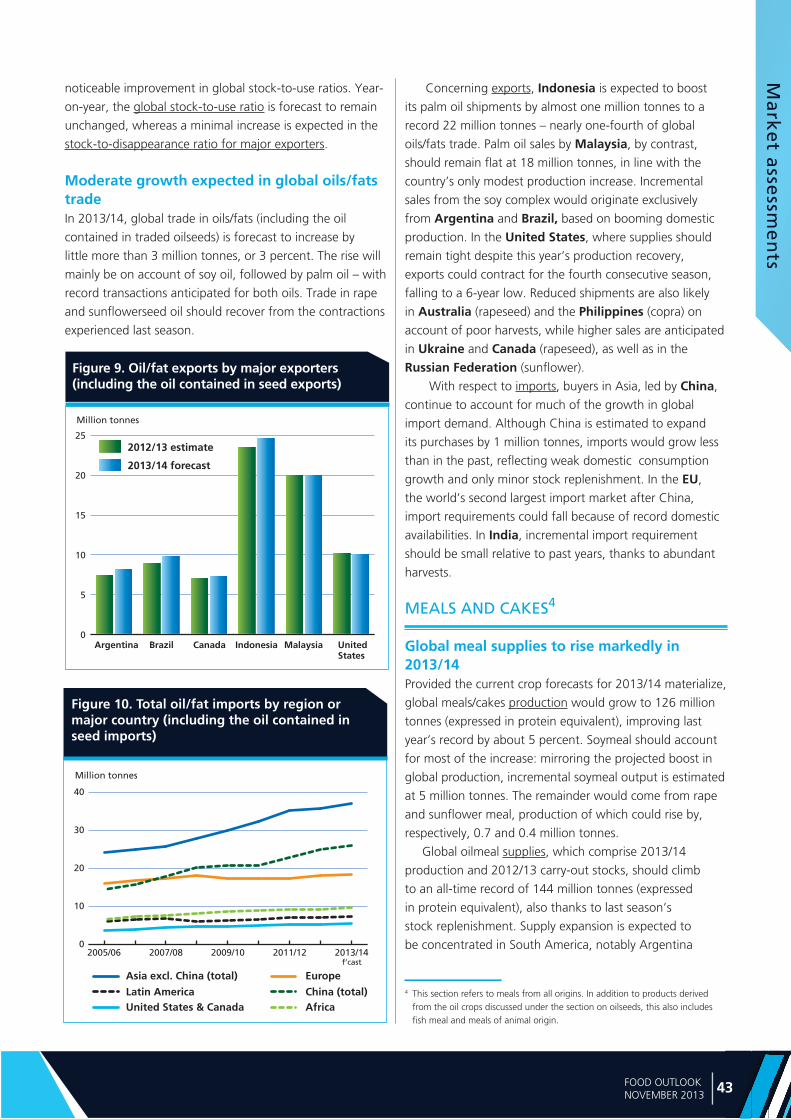
Moderate growth expected in global oils/fats tradeIn 2013/14, global trade in oils/fats (including the oil
contained in traded oilseeds) is forecast to increase by
little more than 3 million tonnes, or 3 percent. The rise will
mainly be on account of soy oil, followed by palm oil – with
record transactions anticipated for both oils. Trade in rape
and sunflowerseed oil should recover from the contractions
experienced last season.
Concerning exports, Indonesia is expected to boost
its palm oil shipments by almost one million tonnes to a
record 22 million tonnes – nearly one-fourth of global
oils/fats trade. Palm oil sales by Malaysia, by contrast,
should remain flat at 18 million tonnes, in line with the
country’s only modest production increase. Incremental
sales from the soy complex would originate exclusively
from Argentina and Brazil, based on booming domestic
production. In the United States, where supplies should
remain tight despite this year’s production recovery,
exports could contract for the fourth consecutive season,
falling to a 6-year low. Reduced shipments are also likely
in Australia (rapeseed) and the Philippines (copra) on
account of poor harvests, while higher sales are anticipated
in Ukraine and Canada (rapeseed), as well as in the
Russian Federation (sunflower).
With respect to imports, buyers in Asia, led by China,
continue to account for much of the growth in global
import demand. Although China is estimated to expand
its purchases by 1 million tonnes, imports would grow less
than in the past, reflecting weak domestic consumption
growth and only minor stock replenishment. In the EU,
the world’s second largest import market after China,
import requirements could fall because of record domestic
availabilities. In India, incremental import requirement
should be small relative to past years, thanks to abundant
harvests.
MEALS AND CAKES4
Global meal supplies to rise markedly in 2013/14Provided the current crop forecasts for 2013/14 materialize,
global meals/cakes production would grow to 126 million
tonnes (expressed in protein equivalent), improving last
year’s record by about 5 percent. Soymeal should account
for most of the increase: mirroring the projected boost in
global production, incremental soymeal output is estimated
at 5 million tonnes. The remainder would come from rape
and sunflower meal, production of which could rise by,
respectively, 0.7 and 0.4 million tonnes.
Global oilmeal supplies, which comprise 2013/14
production and 2012/13 carry-out stocks, should climb
to an all-time record of 144 million tonnes (expressed
in protein equivalent), also thanks to last season’s
stock replenishment. Supply expansion is expected to
be concentrated in South America, notably Argentina
4 This section refers to meals from all origins. In addition to products derived from the oil crops discussed under the section on oilseeds, this also includes fish meal and meals of animal origin.
Ma
rke
t a
sse
ssm
en
tsMM
ark
et
ass
ess
me
nnttss
44 FOOD OUTLOOKNOVEMBER 2013
Figure 12. World stocks and ratios of meals/cakes (in protein equivalent and including the meal contained in seeds stored)
0
7
14
21
28
2013/142012/132011/122010/112009/100
5
10
15
20
Million tonnes Percent
Major Exporters Rest of the World
World Stock-to-use ratioStock-to-disappearance ratio of Major Exporters
estim. f’cast
and Brazil. In the region, total supplies could surge by
10 percent (year-on-year), climbing to an all-time record
and propelling the region’s share in global supplies to
41 percent. In the United States, domestic availabilities
should partially recover from the massive drops of the last
two years but remain well below past records. Sizeable
improvements in meal supplies are also expected in
Canada, the EU, India and Ukraine. By contrast, marked
drops are likely in China, where supplies could fall for the
third consecutive season, reflecting both low 2012/13
carry-out stocks and a further decline in domestic soy
production. Also in Australia, domestic availabilities could
fall as a result of poor harvests.
Global meal consumption expected to expand in 2013/14After stagnating in 2012/13, world meal consumption is
forecast to resume growing, possibly reaching a record
122.5 million tonnes (expressed in protein equivalent).
Soymeal should be the growth leader, followed by rape and
sunflower meal.
Current forecasts rest on the assumption that demand
by the livestock sector could grow based on improved
economic growth in some countries and a softening in
international meal prices. It should be noted, however,
that improved global grain availabilities, notably maize and
feed-quality wheat, could limit the growth in meal demand.
Among developing countries, where about two-thirds of
global consumption takes place, growth in meal demand
should go on, albeit at a lower rate than in the past five
years. In China and the rest of Asia, which is the world’s
top consuming region, consumption is projected to rise by
3–4 percent. In developed countries, meal demand should
recover almost entirely from the sizeable fall recorded last
season. Although meal use is expected to recover in both
the United States and the EU, consumption levels could
remain well below the respective historic records.
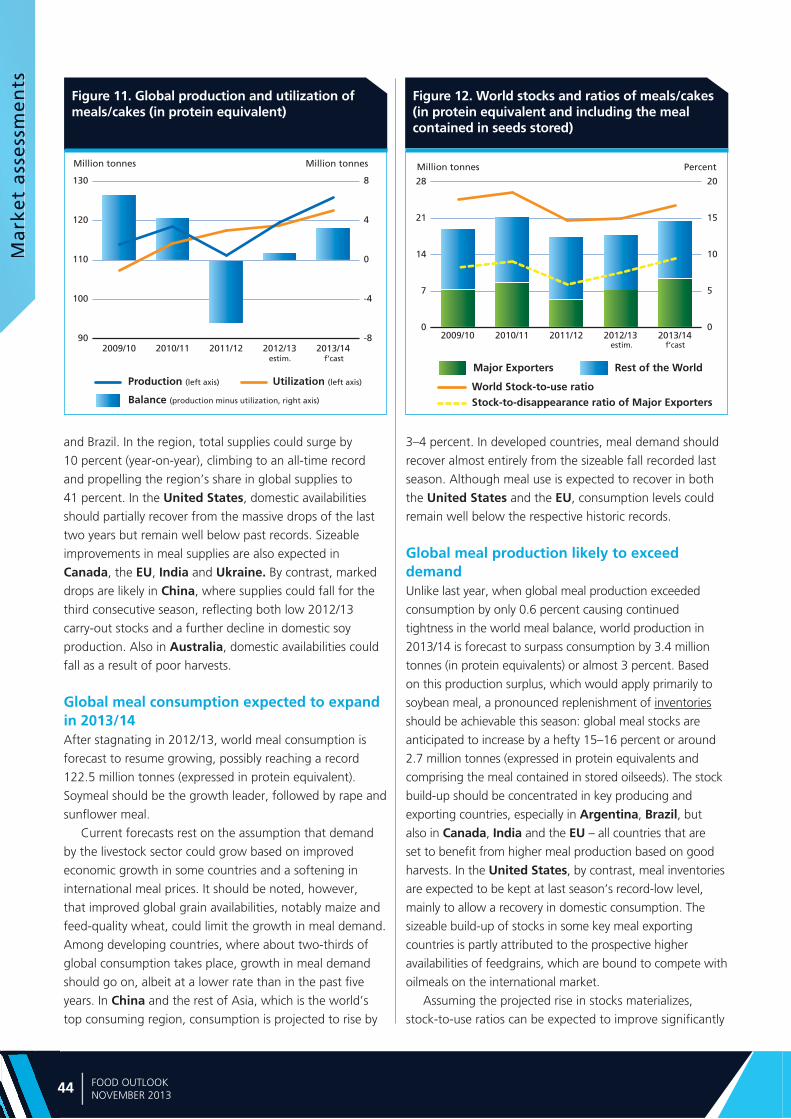
Global meal production likely to exceed demand Unlike last year, when global meal production exceeded
consumption by only 0.6 percent causing continued
tightness in the world meal balance, world production in
2013/14 is forecast to surpass consumption by 3.4 million
tonnes (in protein equivalents) or almost 3 percent. Based
on this production surplus, which would apply primarily to
soybean meal, a pronounced replenishment of inventories
should be achievable this season: global meal stocks are
anticipated to increase by a hefty 15–16 percent or around
2.7 million tonnes (expressed in protein equivalents and
comprising the meal contained in stored oilseeds). The stock
build-up should be concentrated in key producing and
exporting countries, especially in Argentina, Brazil, but
also in Canada, India and the EU – all countries that are
set to benefit from higher meal production based on good
harvests. In the United States, by contrast, meal inventories
are expected to be kept at last season’s record-low level,
mainly to allow a recovery in domestic consumption. The
sizeable build-up of stocks in some key meal exporting
countries is partly attributed to the prospective higher
availabilities of feedgrains, which are bound to compete with
oilmeals on the international market.
Assuming the projected rise in stocks materializes,
stock-to-use ratios can be expected to improve significantly
Figure 11. Global production and utilization of meals/cakes (in protein equivalent)
-8
-4
0
4
8
90
100
110
120
130
2013/142012/132011/122010/112009/10
Million tonnes Million tonnes
estim. f’cast
Balance (production minus utilization, right axis)
Production (left axis) Utilization (left axis)
Ma
rke
t asse
ssme
nts
MMaa
rke
t asse
ssme
nts
45FOOD OUTLOOKNOVEMBER 2013
Figure 13. Meals/cake imports by region or major country (in protein equivalent and inclduing the meal contained in seed imports)
0
7
14
21
28
2013/142011/122009/102007/082005/06
Latin America Asia excl. China (total) Europe
China (total)
Million tonnes
United States & Canada Africa
f’cast
Figure 14. Meal/cake exports by major exporters (in protein equivalent and including the meal contained in seed exports)
0
5
10
15
20
252012/13 estimate
2013/14 forecast
Million tonnes
UnitedStates
Canada India ParaguayArgentina Brazil
in 2013/14: the global stock-to-use ratio and the
major exporters stock-to-disappearance ratio are set to
jump to 3 and 6-year highs, respectively. With these
improvements, especially among the leading exporting
countries, international meal prices can be expected to lose
some of their recent strength.
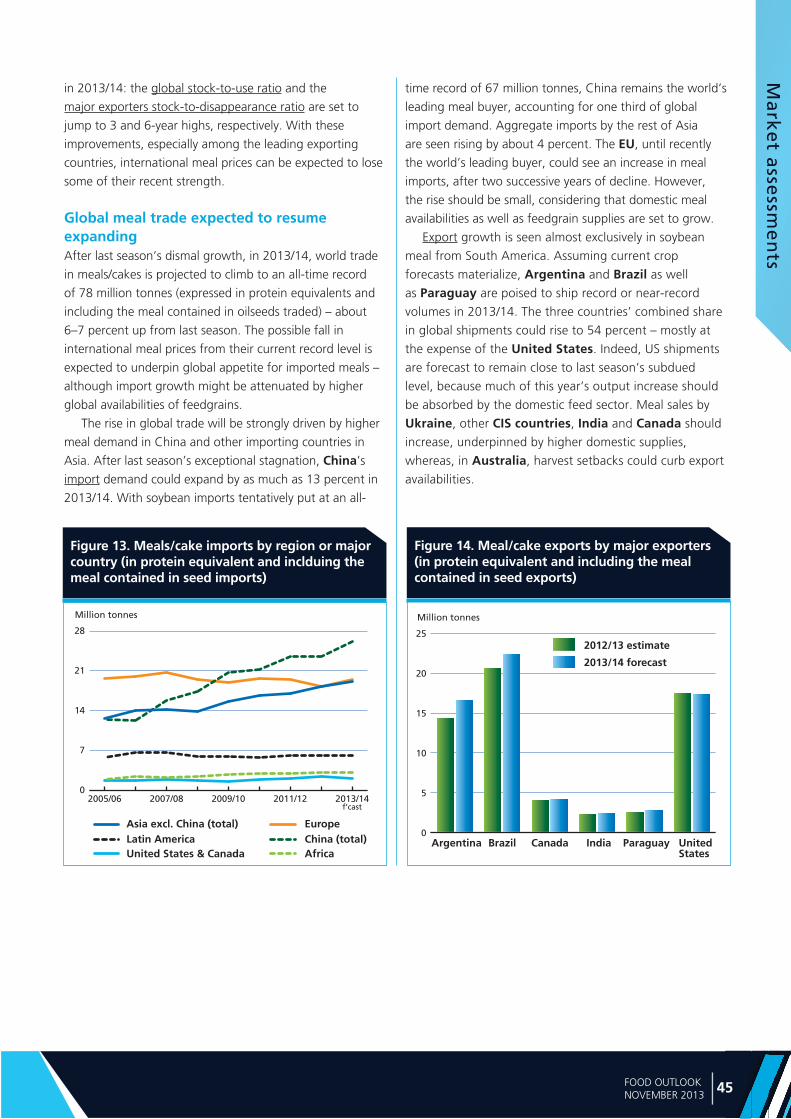
Global meal trade expected to resume expanding After last season’s dismal growth, in 2013/14, world trade
in meals/cakes is projected to climb to an all-time record
of 78 million tonnes (expressed in protein equivalents and
including the meal contained in oilseeds traded) – about
6–7 percent up from last season. The possible fall in
international meal prices from their current record level is
expected to underpin global appetite for imported meals –
although import growth might be attenuated by higher
global availabilities of feedgrains.
The rise in global trade will be strongly driven by higher
meal demand in China and other importing countries in
Asia. After last season’s exceptional stagnation, China’s
import demand could expand by as much as 13 percent in
2013/14. With soybean imports tentatively put at an all-
time record of 67 million tonnes, China remains the world’s
leading meal buyer, accounting for one third of global
import demand. Aggregate imports by the rest of Asia
are seen rising by about 4 percent. The EU, until recently
the world’s leading buyer, could see an increase in meal
imports, after two successive years of decline. However,
the rise should be small, considering that domestic meal
availabilities as well as feedgrain supplies are set to grow.
Export growth is seen almost exclusively in soybean
meal from South America. Assuming current crop
forecasts materialize, Argentina and Brazil as well
as Paraguay are poised to ship record or near-record
volumes in 2013/14. The three countries’ combined share
in global shipments could rise to 54 percent – mostly at
the expense of the United States. Indeed, US shipments
are forecast to remain close to last season’s subdued
level, because much of this year’s output increase should
be absorbed by the domestic feed sector. Meal sales by
Ukraine, other CIS countries, India and Canada should
increase, underpinned by higher domestic supplies,
whereas, in Australia, harvest setbacks could curb export
availabilities.

Ma
jor
po
licy
de
velo
pm
en
tsM
ajo
r p
oli
cy d
eve
lop
me
nts
848 FOOD OUTLOOKNOVEMBER 2013
OIL
SEED
S:
MA
JOR
POLI
CY D
EVEL
OPM
ENTS
: APR
IL -
MID
OCT
OBE
R 20
13 *
CO
UN
TRY
PRO
DU
CT
DA
TEPO
LIC
Y C
ATE
GO
RY
/INST
RU
MEN
TD
ESC
RIP
TIO
N
Bra
zil
Soyb
ean
sJu
l-13
Phyt
osa
nit
ary
mea
sure
sC
on
tin
ued
imp
lem
enta
tio
n o
f 90
-day
so
ybea
n-f
ree
per
iod
, mea
nt
to c
hec
k sp
read
of
dis
ease
s.
Ara
ble
cro
ps,
incl
ud
ing
o
ilsee
ds
Au
g-1
3A
gri
cult
ura
l po
licy
Ren
ewed
ag
ricu
ltu
ral s
up
po
rt p
rog
ram
me
for
the
2013
/14
cam
pai
gn
, fo
cusi
ng
on
inve
stm
ent
aid
, su
pp
ort
to
fam
ily-b
ased
far
min
g, m
arke
tin
g lo
ans,
an
d t
he
exp
ansi
on
of
pu
blic
an
d p
riva
te w
areh
ou
se
faci
litie
s.
Bu
lgar
iaA
ll ed
ible
oils
Jul-
13C
om
pet
itio
n p
olic
ySa
nct
ion
ed g
rou
p o
f ve
get
able
oil
pro
du
cers
an
d r
etai
lers
fo
r cr
eati
ng
a p
rice
car
tel.
Can
ada
Rap
esee
d a
nd
So
ybea
ns
Jul-
13Se
cto
r d
evel
op
men
t as
sist
ance
Sup
po
rted
R&
D p
rog
ram
mes
to
en
han
ce c
om
pet
itiv
enes
s an
d s
ust
ain
abili
ty o
f th
e co
un
try'
s ra
pes
eed
an
d s
oyb
ean
ind
ust
ries
.
Cam
elin
a se
ed a
nd
m
ust
ard
see
d
Sep
t-13
Sect
or
dev
elo
pm
ent
assi
stan
ceSu
pp
ort
ed r
esea
rch
an
d d
evel
op
men
t o
f n
ew v
arie
ties
of
min
or
oils
eed
s.
Ch
ina
Soyb
ean
sA
pr
and
A
ug
to
Oct
20
13St
ate
rese
rves
Rel
ease
d s
tate
res
erve
s w
ith
vie
w t
o e
ase
sup
ply
tig
htn
ess,
th
us
chec
kin
g t
he
rise
in d
om
esti
c o
il/m
eal
pri
ces.
Rap
esee
dJu
l-13
Stat
e re
serv
esTi
gh
ten
ed p
rocu
rem
ent
po
licie
s to
pre
ven
t im
po
rted
rap
esee
d o
il fr
om
en
teri
ng
pu
blic
res
erve
s.
Soyb
ean
sJu
l-13
GM
O t
rad
e an
d m
arke
tin
g p
olic
ies
Ap
pro
ved
th
ree
vari
etie
s o
f g
enet
ical
ly m
od
ified
so
ybea
ns
for
imp
ort
atio
n.
Rap
esee
dJu
n-1
3St
ate
rese
rves
Res
um
ed p
rocu
rem
ent
of
rap
esee
d t
o r
eco
nst
itu
te s
tate
res
erve
s fo
r fu
ture
mar
ket
inte
rven
tio
ns
and
to
su
pp
ort
do
mes
tic
farm
gat
e p
rice
s.
Rap
esee
dM
ay-1
3Im
po
rt p
olic
yR
elax
ed r
estr
icti
on
s o
f im
po
rtat
ion
of
rap
esee
d f
rom
Can
ada.
Rap
esee
dM
ay-1
3Im
po
rt p
olic
yA
gre
ed o
n n
ew s
tric
t sh
ipm
ent
pro
toco
l th
at a
llow
ed r
esu
mp
tio
n o
f In
dia
’s r
apes
eed
mea
l exp
ort
s to
C
hin
a.
Rap
esee
dSe
pt-
13Im
po
rt p
olic
yLi
ber
aliz
ed im
po
rts
of
rap
esee
d f
rom
Ru
ssia
wit
h a
vie
w t
o h
elp
mee
t d
om
esti
c d
eman
d.
Egyp
t Su
nfl
ow
er o
ilM
ay-1
3So
uth
-So
uth
co
op
erat
ion
Sig
ned
a jo
int
agri
cult
ura
l pro
ject
wit
h S
ud
an t
hat
wo
uld
sec
ure
Eg
ypt'
s im
po
rt r
equ
irem
ent
in
sun
flo
wer
oil.
Euro
pea
n U
nio
n
Ara
ble
cro
ps,
incl
ud
ing
o
ilsee
ds
Jul-
13A
gri
cult
ura
l po
licy
Ag
reed
on
th
e d
irec
tio
n o
f th
e b
lock
's c
om
mo
n a
gri
cult
ura
l po
licy
du
rin
g 2
014–
2020
, in
clu
din
g
the
con
tin
uat
ion
of
dir
ect
pay
men
ts t
o f
arm
ers
and
th
e ap
plic
atio
n o
f st
rin
gen
t en
viro
nm
enta
l re
qu
irem
ents
.
Bio
fuel
Au
g-1
3En
viro
nm
enta
l po
licy
Co
nsi
der
ed p
rop
osa
l to
cap
th
e u
se o
f cr
op
-bas
ed f
uel
s fo
r tr
ansp
ort
atio
n a
t 6
per
cen
t (a
s o
pp
ose
d t
o
the
10 p
erce
nt
rate
set
in 2
009)
, wit
h a
vie
w t
o s
pu
r th
e d
evel
op
men
t o
f ‘c
lean
fu
els’
der
ived
fro
m n
on
-fo
od
so
urc
es.
Bio
die
sel
Oct
-13
Imp
ort
po
licy
Dec
ided
to
imp
ose
defi
nit
ive
anti
-du
mp
ing
du
ties
on
bio
die
sel i
mp
ort
s fr
om
Arg
enti
na
and
Ind
on
esia
fr
om
No
vem
ber
201
3.
Fran
cePa
lm o
ilJu
l-13
Sale
s ta
xes
Pro
vid
ed a
ssu
ran
ce t
hat
do
mes
tic
pal
m o
il sa
les
wo
uld
no
t b
e su
bje
ct t
o t
ax h
ikes
on
en
viro
nm
enta
l or
hea
lth
gro
un
ds.
Ind
ia
Ara
ble
cro
ps,
incl
ud
ing
o
ilsee
ds
Jul-
13Su
pp
ort
pri
ces
Rai
sed
min
imu
m s
up
po
rt p
rice
s fo
r o
ilsee
ds
and
oth
er a
rab
le c
rop
s, w
ith
a v
iew
to
sti
mu
late
pro
du
ctio
n
and
pro
tect
far
m in
com
es.
Co
con
ut
Jul-
13Se
cto
r d
evel
op
men
t as
sist
ance
Exte
nd
ed s
up
po
rt f
or
rep
lan
tin
g a
nd
rej
uve
nat
ion
of
coco
nu
t p
alm
to
en
tire
co
un
try,
wit
h a
vie
w t
o
rais
e p
rod
uct
ivit
y le
vels
an
d t
hu
s fa
rm in
com
es.
Co
con
ut
Jul-
13Se
cto
r d
evel
op
men
t as
sist
ance
Co
nsi
der
ed m
easu
res
to in
crea
se f
arm
er u
pta
ke o
f th
e co
un
try'
s C
oco
nu
t Pa
lm In
sura
nce
Sch
eme.
Bas
ic f
oo
dst
uff
sA
ug
-13
Foo
d s
ub
sid
y sc
hem
eA
pp
rove
d a
fo
od
bill
th
at r
enew
s an
d e
xpan
ds
the
dis
trib
uti
on
of
sub
sid
ized
wh
eat,
ric
e an
d c
oar
se
gra
ins;
ed
ible
oils
rem
ain
exc
lud
ed, b
ut
cou
ld b
e ad
ded
in t
he
futu
re.

Ma
jor p
olicy d
eve
lop
me
nts
Ma
jor p
olicy d
eve
lop
me
nts
8585FOOD OUTLOOKNOVEMBER 2013
CO
UN
TRY
PRO
DU
CT
DA
TEPO
LIC
Y C
ATE
GO
RY
/INST
RU
MEN
TD
ESC
RIP
TIO
N
Ind
ia
Edib
le o
ils a
nd
oils
eed
sSe
pt-
13C
on
sum
er p
rote
ctio
nEx
ten
ded
res
tric
tio
ns
on
pri
vate
sto
ck h
old
ing
un
til S
epte
mb
er 2
014
by
1 ye
ar, i
n a
bid
to
cu
rb s
urg
es in
re
tail
pri
ces.
Oils
eed
s an
d o
il p
alm
Oct
-13
Sect
or
dev
elo
pm
ent
assi
stan
ceEs
tab
lish
ed N
atio
nal
Mis
sio
n o
n O
ilsee
ds
and
Oil
Palm
ch
arg
ed t
o p
rom
ote
oils
eed
pro
du
ctio
n a
nd
b
rin
g a
dd
itio
nal
are
a u
nd
er o
il p
alm
.
Edib
le o
ilsO
ct-1
3Ex
po
rt p
olic
yA
dju
sted
min
imu
m e
xpo
rt p
rice
fo
r b
ran
ded
/pac
kag
ed e
dib
le o
il to
refl
ect
dev
elo
pm
ents
in
inte
rnat
ion
al m
arke
t p
rice
s
Ind
on
esia
Palm
oil
Ap
r to
Oct
20
13Ex
po
rt t
axC
on
tin
ued
imp
lem
enta
tio
n o
f sl
idin
g e
xpo
rt t
ax r
egim
e u
sed
to
sti
mu
late
gro
wth
in d
ow
nst
ream
pal
m
oil
pro
cess
ing
an
d t
o r
egu
late
do
mes
tic
sup
plie
s an
d p
rice
s.
Soyb
ean
sJu
l-13
Stat
e re
serv
esR
esu
med
sta
te p
urc
has
es w
ith
a v
iew
to
sta
bili
ze d
om
esti
c p
rice
s o
f so
y fo
od
pro
du
cts.
Ag
ricu
ltu
ral l
and
May
-13
Envi
ron
men
tal p
olic
yA
pp
rove
d a
tw
o-y
ear
exte
nsi
on
of
cou
ntr
y-w
ide
ban
on
cle
arin
g p
rim
ary
rain
fo
rest
an
d c
arb
on
-ric
h
pea
t la
nd
.
Palm
oil
Au
g-1
3Pr
efer
enti
al t
rad
e ag
reem
ent
Imp
lem
ente
d f
ree
trad
e ag
reem
ent
wit
h P
akis
tan
th
at r
edu
ces
Paki
stan
's im
po
rt d
uty
on
Ind
on
esia
n
pal
m o
il.
Bio
die
sel
Au
g-1
3En
viro
nm
enta
l po
licy
Co
nfi
rmed
pla
ns
to r
aise
th
e m
and
ato
ry b
iod
iese
l ble
nd
ing
rat
e fo
r tr
ansp
ort
atio
n f
uel
s fr
om
cu
rren
tly
7.5
per
cen
t to
10
per
cen
t.
Ag
ricu
ltu
ral c
rop
sA
ug
-13
Ag
ricu
ltu
ral p
olic
yA
pp
rove
d a
co
mp
reh
ensi
ve b
ill a
imed
at
stim
ula
tin
g a
gri
cult
ura
l pro
du
ctio
n a
nd
imp
rovi
ng
inco
mes
fr
om
ag
ricu
ltu
re.
Soyb
ean
Sep
t-13
Imp
ort
po
licy
Lib
eral
ized
imp
ort
atio
n o
f so
ybea
ns
to e
nsu
re d
om
esti
c d
eman
d is
met
.
Mal
aysi
a
Palm
oil
Ap
r to
Oct
20
13Ex
po
rt t
axC
on
tin
ued
imp
lem
enta
tio
n o
f sl
idin
g e
xpo
rt t
ax r
egim
e u
sed
to
sti
mu
late
gro
wth
in d
ow
nst
ream
pal
m
oil
pro
cess
ing
an
d t
o r
egu
late
do
mes
tic
sup
plie
s an
d p
rice
s.
Bio
fuel
Au
g-1
3En
viro
nm
enta
l po
licy
Co
nfi
rmed
pla
ns
to r
aise
man
dat
ory
bio
die
sel b
len
din
g r
ate
firs
t to
7.5
per
cen
t an
d t
hen
to
10
per
cen
t,
wit
h a
vie
w t
o s
pu
r d
om
esti
c d
eman
d f
or
pal
m o
il an
d t
o p
reve
nt
sto
ckp
iles
fro
m r
isin
g.
Palm
oil
Au
g-1
3En
viro
nm
enta
l po
licy
Co
nfi
rmed
intr
od
uct
ion
of
nat
ion
al c
erti
fica
tio
n s
chem
e fo
r su
stai
nab
le p
alm
oil
pro
du
ctio
n in
201
4;
init
ially
on
a v
olu
nta
ry b
asis
bu
t w
ith
cer
tifi
cati
on
bo
un
d t
o b
eco
me
man
dat
ory
at
stag
es.
Mo
rocc
oA
ll o
ilsee
ds
May
-13
Sect
or
dev
elo
pm
ent
assi
stan
ceSi
gn
ed a
gre
emen
t w
ith
th
e n
atio
nal
oils
eed
s in
du
stry
fed
erat
ion
aim
ed a
t tr
iplin
g t
he
cou
ntr
y’s
area
se
eded
wit
h o
ilsee
ds
by
2020
.
Paki
stan
Rap
esee
dJu
l-13
Imp
ort
po
licy
Intr
od
uce
d t
ax o
n r
apes
eed
imp
ort
s w
ith
a v
iew
to
en
cou
rag
e d
om
esti
c p
rod
uct
ion
of
oils
eed
s.
Palm
oil
Au
g-1
3Pr
efer
enti
al t
rad
e ag
reem
ent
Imp
lem
ente
d f
ree
trad
e ag
reem
ent
wit
h In
do
nes
ia t
hat
red
uce
s Pa
kist
an's
imp
ort
du
ty o
n In
do
nes
ian
p
alm
oil.
Para
gu
aySo
ybea
ns
May
-13
Exp
ort
tax
Co
nsi
der
ed in
tro
du
ctio
n o
f ex
po
rt t
axat
ion
fo
r so
ybea
ns,
so
yoil,
so
ymea
l an
d o
ther
gra
ins.
Peru
Fish
mea
l an
d fi
sh o
ilO
ct-1
3R
eso
urc
e m
anag
emen
tIn
crea
sed
fish
ing
qu
ota
s fo
r 20
13/1
4, t
hu
s ra
isin
g t
he
cou
ntr
y's
exp
ort
ava
ilab
iliti
es.
Ru
ssia
All
oils
eed
sA
ug
-13
Exp
ort
tax
Imp
lem
ente
d r
edu
ctio
ns
in e
xpo
rt t
axes
on
oils
eed
s in
lin
e w
ith
th
e co
un
try'
s W
TO a
cces
sio
n
agre
emen
t.
Sen
egal
All
edib
le o
ilsJu
l-13
Mar
ket
reg
ula
tio
nIm
po
sed
cap
s o
n e
dib
le o
il re
tail
pri
ces
in t
he
Dak
ar r
egio
n t
o p
rote
ct c
on
sum
ers.
Sou
th A
fric
aB
iod
iese
lO
ct-1
3R
enew
able
en
erg
ySe
t O
cto
ber
201
5 as
beg
inn
ing
dat
e fo
r m
and
ato
ry b
len
din
g o
f p
etro
l an
d d
iese
l wit
h b
iofu
els.
Sud
an
Sun
flo
wer
oil
May
-13
Sou
th-S
ou
th c
oo
per
atio
nA
gre
ed t
o im
ple
men
t a
join
t ag
ricu
ltu
ral p
roje
ct w
ith
Eg
ypt
that
wo
uld
hel
p m
eeti
ng
Eg
ypt'
s im
po
rt
req
uir
emen
t in
su
nfl
ow
er o
il.
Turk
eyR
apes
eed
May
-13
GM
O im
po
rts
Susp
end
ed e
ntr
y o
f se
lect
ed g
enet
ical
ly m
od
ified
pro
du
cts,
incl
ud
ing
rap
esee
d, i
nto
th
e co
un
try,
bas
ed
on
co
nce
rns
abo
ut
pro
du
ct s
afet
y.
Vie
tnam
Soy
and
pal
m o
ilM
ay-1
3Im
po
rt p
olic
yA
pp
lied
tem
po
rary
du
ty s
urc
har
ges
to
imp
ort
s o
f re
fin
ed s
oy
and
pal
m o
il im
po
rts.
Soy
and
pal
m o
ilSe
p-1
3Im
po
rt p
olic
yIm
po
sed
an
ti-d
um
pin
g d
uty
on
imp
ort
s o
f re
fin
ed s
oya
an
d p
alm
oil,
so
as
to p
rote
ct lo
cal p
rod
uce
rs
fro
m c
om
pet
itio
n f
rom
imp
ort
ed p
rod
uct
s.
* A
col
lect
ion
of m
ajor
pol
icy
deve
lopm
ents
sta
rtin
g in
Jan
uary
201
1 is
ava
ilabl
e at
: ht
tp://
ww
w.f
ao.o
rg/e
cono
mic
/est
/est
-com
mod
ities
/com
mod
ity-p
olic
y-ar
chiv
e/en
/?gr
oupA
ND
com
mod
ity=
Oils
eeds
,%20
oils
%20
and%
20m
eals

Statistica
l ap
pe
nd
ixSta
tistical aa
pppp
en
dix
10707FOOD OUTLOOKNOVEMBER 2013
APPENDIX TABLE 10: TOTAL OILCROPS STATISTICS (million tonnes)
Production1 Imports Exports
09/10-11/12 2012/13 2013/14
09/10-11/12 2012/13 2013/14
09/10-11/12 2012/13 2013/14
average average average estim. f’cast estim. f’cast estim. f’cast
ASIA 130.1 134.8 138.0 79.4 87.3 96.1 2.5 2.4 2.5 China 59.4 60.5 60.1 59.1 66.2 73.8 1.1 1.0 0.9 of which Taiwan Prov. 0.1 0.1 0.1 2.4 2.4 2.4 - - - India 36.6 38.0 40.9 0.2 0.1 0.1 0.7 0.6 0.8 Indonesia 9.4 10.4 10.9 2.0 2.3 2.5 0.1 0.1 0.1 Iran, Islamic Republic of 0.8 0.9 0.9 0.7 0.8 0.9 - - - Japan 0.3 0.3 0.3 5.7 5.5 5.6 - - - Korea, Republic of 0.2 0.2 0.2 1.6 1.4 1.4 - - - Malaysia 4.7 4.9 5.1 0.7 0.8 0.9 - - 0.1 Pakistan 5.2 5.3 5.4 1.3 1.0 1.4 0.1 - - Thailand 0.7 0.8 0.8 2.0 2.4 2.5 - - - Turkey 2.4 2.7 2.8 2.4 2.0 1.9 0.1 0.1 0.1
AFRICA 17.1 17.3 17.5 3.2 3.3 3.5 0.9 0.8 0.8 Nigeria 4.8 5.0 5.0 - - - 0.2 0.1 0.2
CENTRAL AMERICA 1.2 1.3 1.3 6.2 6.0 6.3 0.2 0.2 0.2 Mexico 0.8 0.8 0.8 5.5 5.4 5.6 - - -
SOUTH AMERICA 137.9 154.3 165.5 1.3 1.7 1.7 49.2 59.4 66.8 Argentina 51.8 53.1 57.3 0.1 0.3 0.3 10.4 9.4 12.8 Brazil 73.7 84.5 91.7 0.2 0.3 0.3 31.7 41.2 45.0 Paraguay 7.0 9.6 9.3 - - - 4.7 5.3 5.3
NORTH AMERICA 116.5 113.6 116.0 2.0 2.3 2.0 52.0 48.0 50.0 Canada 18.8 20.4 22.2 0.6 0.5 0.6 11.3 11.6 12.1 United States of America 97.7 93.2 93.8 1.3 1.8 1.4 40.8 36.4 37.8
EUROPE 52.7 54.2 58.8 18.9 18.5 18.9 4.2 4.1 4.9 European Union 29.5 28.0 31.0 17.2 17.6 16.6 0.9 0.7 1.0 Russian Federation 9.4 11.4 11.8 1.1 0.9 1.0 0.3 0.3 0.2 Ukraine 11.6 12.5 14.7 - - - 2.7 2.8 3.6
OCEANIA 4.3 6.0 5.2 0.1 - - 2.2 4.2 3.3 Australia 3.9 5.6 4.8 - - - 2.1 4.1 3.2
WORLD 459.9 481.4 502.2 111.1 119.0 128.4 111.1 119.0 128.4 Developing countries 281.1 302.3 316.9 83.4 91.8 100.9 52.6 62.6 70.1 Developed countries 178.8 179.2 185.4 27.7 27.3 27.5 58.6 56.4 58.3 LIFDCs 133.7 138.2 141.3 63.9 70.9 79.4 3.3 3.1 3.1 LDCs 11.0 11.1 11.0 0.5 0.3 0.4 0.4 0.5 0.5
1 The split years bring together northern hemisphere annual crops harvested in the latter part of the first year shown, with southern hemisphere annual crops harvested in the early part of the second year shown; for tree crops which are produced throughout the year, calendar year production for the second year shown is used.

Sta
tist
ica
l a
pp
en
dix
Sta
tist
iccaa
ll a
pp
en
dix
1081 FOOD OUTLOOKNOVEMBER 2013
APPENDIX TABLE 11: TOTAL OILS AND FATS STATISTICS (million tonnes)
Imports Exports Utilization
09/10-11/12 2012/13 2013/14
09/10-11/12 2012/13 2013/14
09/10-11/12 2012/13 2013/14
average average average estim. f’cast estim. f’cast estim. f’cast
ASIA 38.4 43.5 44.1 43.3 48.7 49.9 87.7 98.1 102.7 Bangladesh 1.4 1.6 1.6 - - - 1.7 1.8 1.8 China 10.5 12.4 12.1 0.6 0.7 0.7 32.1 36.5 38.1 of which Taiwan Prov. 0.4 0.4 0.4 - - - 0.8 0.9 0.9 India 9.4 11.0 11.3 0.5 0.6 0.7 18.9 20.4 21.3 Indonesia 0.1 0.1 0.1 20.0 23.4 24.6 7.7 9.6 10.4 Iran 1.4 1.9 1.7 0.2 0.2 0.3 1.7 2.0 2.1 Japan 1.2 1.3 1.3 - - - 3.1 3.1 3.2 Korea, Republic of 1.0 1.0 1.0 - - - 1.3 1.3 1.4 Malaysia 2.5 1.7 2.1 18.7 20.0 20.0 3.9 4.2 4.4 Pakistan 2.3 2.5 2.6 0.1 0.1 0.1 4.0 4.1 4.4 Philippines 0.6 0.7 0.7 1.1 1.1 0.9 1.1 1.2 1.4 Singapore 0.8 0.8 0.9 0.3 0.2 0.2 0.6 0.7 0.7 Turkey 1.3 1.6 1.8 0.4 0.6 0.7 2.4 2.6 2.7
AFRICA 8.4 8.6 9.0 1.7 1.8 1.8 13.9 14.4 14.8 Algeria 0.6 0.5 0.7 - - - 0.7 0.6 0.7 Egypt 1.9 1.8 1.9 0.3 0.4 0.4 2.0 2.0 2.1 Nigeria 1.0 1.0 1.1 0.1 0.1 0.2 2.7 2.8 2.9 South Africa 0.8 0.9 0.9 0.1 0.1 0.1 1.2 1.3 1.4
CENTRAL AMERICA 2.4 2.5 2.5 0.7 1.0 1.0 4.7 4.9 5.0 Mexico 1.3 1.4 1.4 0.1 0.1 0.1 3.1 3.2 3.4
SOUTH AMERICA 2.6 2.9 3.0 8.7 8.7 9.2 14.3 15.8 16.2 Argentina 0.1 0.1 - 5.5 5.5 5.7 2.8 3.3 3.4 Brazil 0.5 0.6 0.6 1.9 1.6 1.8 7.4 8.0 8.1
NORTH AMERICA 4.5 4.7 4.9 6.8 6.8 6.4 18.2 18.8 19.7 Canada 0.5 0.6 0.6 3.1 3.2 3.3 1.1 1.2 1.3 United States of America 3.9 4.1 4.3 3.8 3.6 3.1 17.1 17.6 18.4
EUROPE 13.1 13.8 14.0 6.9 7.9 8.0 36.5 37.1 38.2 European Union 10.6 10.9 10.9 2.5 3.2 2.7 30.1 29.6 30.8 Russian Federation 1.1 1.2 1.2 1.0 1.5 1.7 4.0 4.4 4.5 Ukraine 0.4 0.4 0.4 3.0 3.2 3.5 1.0 1.1 1.2
OCEANIA 0.6 0.7 0.7 1.8 1.9 1.9 1.0 1.1 1.1 Australia 0.4 0.6 0.6 0.7 0.7 0.7 0.7 0.7 0.8
WORLD 69.9 76.7 78.2 70.0 76.8 78.2 176.4 190.1 197.9 Developing countries 49.4 55.0 56.1 55.0 60.8 62.6 115.4 127.8 133.3 Developed countries 20.5 21.7 22.2 15.0 16.0 15.7 61.0 62.3 64.6 LIFDCs 32.9 37.6 38.0 24.5 28.5 29.7 80.0 89.0 93.1 LDCs 5.0 5.3 5.5 0.5 0.4 0.5 8.0 8.5 8.6
1 Includes oils and fats of vegetable, marine and animal origin.
Statistica
l ap
pe
nd
ixSta
tistical aa
pppp
en
dix
10909FOOD OUTLOOKNOVEMBER 2013
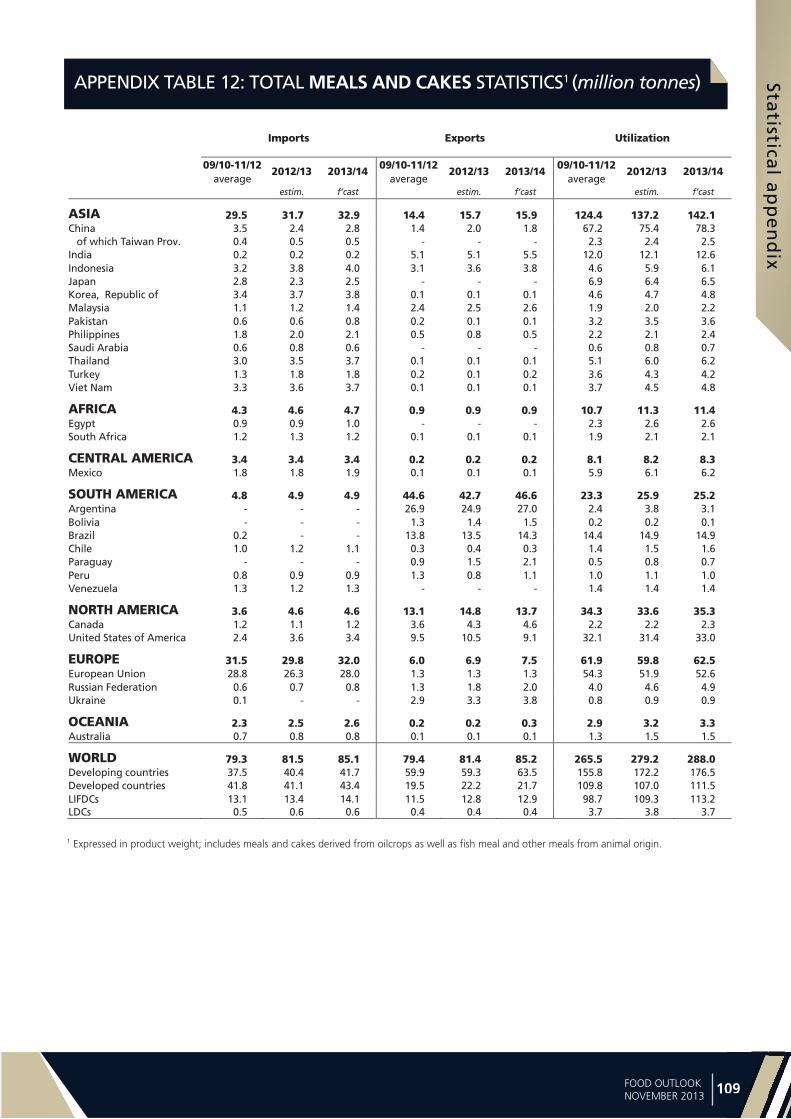
APPENDIX TABLE 12: TOTAL MEALS AND CAKES STATISTICS1 (million tonnes)
Imports Exports Utilization
09/10-11/12 2012/13 2013/14
09/10-11/12 2012/13 2013/14
09/10-11/12 2012/13 2013/14
average average average estim. f’cast estim. f’cast estim. f’cast
ASIA 29.5 31.7 32.9 14.4 15.7 15.9 124.4 137.2 142.1 China 3.5 2.4 2.8 1.4 2.0 1.8 67.2 75.4 78.3 of which Taiwan Prov. 0.4 0.5 0.5 - - - 2.3 2.4 2.5 India 0.2 0.2 0.2 5.1 5.1 5.5 12.0 12.1 12.6 Indonesia 3.2 3.8 4.0 3.1 3.6 3.8 4.6 5.9 6.1 Japan 2.8 2.3 2.5 - - - 6.9 6.4 6.5 Korea, Republic of 3.4 3.7 3.8 0.1 0.1 0.1 4.6 4.7 4.8 Malaysia 1.1 1.2 1.4 2.4 2.5 2.6 1.9 2.0 2.2 Pakistan 0.6 0.6 0.8 0.2 0.1 0.1 3.2 3.5 3.6 Philippines 1.8 2.0 2.1 0.5 0.8 0.5 2.2 2.1 2.4 Saudi Arabia 0.6 0.8 0.6 - - - 0.6 0.8 0.7 Thailand 3.0 3.5 3.7 0.1 0.1 0.1 5.1 6.0 6.2 Turkey 1.3 1.8 1.8 0.2 0.1 0.2 3.6 4.3 4.2 Viet Nam 3.3 3.6 3.7 0.1 0.1 0.1 3.7 4.5 4.8
AFRICA 4.3 4.6 4.7 0.9 0.9 0.9 10.7 11.3 11.4 Egypt 0.9 0.9 1.0 - - - 2.3 2.6 2.6 South Africa 1.2 1.3 1.2 0.1 0.1 0.1 1.9 2.1 2.1
CENTRAL AMERICA 3.4 3.4 3.4 0.2 0.2 0.2 8.1 8.2 8.3 Mexico 1.8 1.8 1.9 0.1 0.1 0.1 5.9 6.1 6.2
SOUTH AMERICA 4.8 4.9 4.9 44.6 42.7 46.6 23.3 25.9 25.2 Argentina - - - 26.9 24.9 27.0 2.4 3.8 3.1 Bolivia - - - 1.3 1.4 1.5 0.2 0.2 0.1 Brazil 0.2 - - 13.8 13.5 14.3 14.4 14.9 14.9 Chile 1.0 1.2 1.1 0.3 0.4 0.3 1.4 1.5 1.6 Paraguay - - - 0.9 1.5 2.1 0.5 0.8 0.7 Peru 0.8 0.9 0.9 1.3 0.8 1.1 1.0 1.1 1.0 Venezuela 1.3 1.2 1.3 - - - 1.4 1.4 1.4
NORTH AMERICA 3.6 4.6 4.6 13.1 14.8 13.7 34.3 33.6 35.3 Canada 1.2 1.1 1.2 3.6 4.3 4.6 2.2 2.2 2.3 United States of America 2.4 3.6 3.4 9.5 10.5 9.1 32.1 31.4 33.0
EUROPE 31.5 29.8 32.0 6.0 6.9 7.5 61.9 59.8 62.5 European Union 28.8 26.3 28.0 1.3 1.3 1.3 54.3 51.9 52.6 Russian Federation 0.6 0.7 0.8 1.3 1.8 2.0 4.0 4.6 4.9 Ukraine 0.1 - - 2.9 3.3 3.8 0.8 0.9 0.9
OCEANIA 2.3 2.5 2.6 0.2 0.2 0.3 2.9 3.2 3.3 Australia 0.7 0.8 0.8 0.1 0.1 0.1 1.3 1.5 1.5
WORLD 79.3 81.5 85.1 79.4 81.4 85.2 265.5 279.2 288.0 Developing countries 37.5 40.4 41.7 59.9 59.3 63.5 155.8 172.2 176.5 Developed countries 41.8 41.1 43.4 19.5 22.2 21.7 109.8 107.0 111.5 LIFDCs 13.1 13.4 14.1 11.5 12.8 12.9 98.7 109.3 113.2 LDCs 0.5 0.6 0.6 0.4 0.4 0.4 3.7 3.8 3.7
1 Expressed in product weight; includes meals and cakes derived from oilcrops as well as fish meal and other meals from animal origin.
Sta
tist
ica
l a
pp
en
dix
Sta
tist
iccaa
ll a
pp
en
dix
1201 FOOD OUTLOOKNOVEMBER 2013
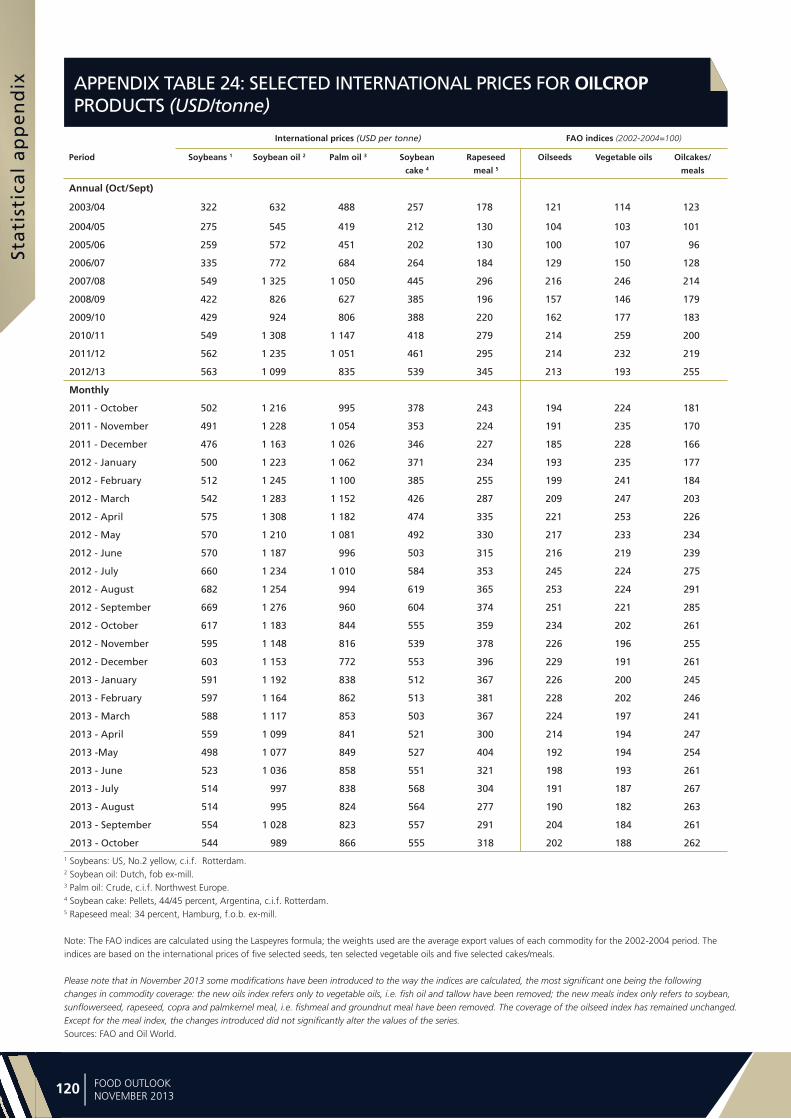
APPENDIX TABLE 24: SELECTED INTERNATIONAL PRICES FOR OILCROP PRODUCTS (USD/tonne)
International prices (USD per tonne) FAO indices (2002-2004=100)
Period Soybeans 1 Soybean oil 2 Palm oil 3 Soybean
cake 4
Rapeseed
meal 5
Oilseeds Vegetable oils Oilcakes/
meals
Annual (Oct/Sept)
2003/04 322 632 488 257 178 121 114 123
2004/05 275 545 419 212 130 104 103 101
2005/06 259 572 451 202 130 100 107 96
2006/07 335 772 684 264 184 129 150 128
2007/08 549 1 325 1 050 445 296 216 246 214
2008/09 422 826 627 385 196 157 146 179
2009/10 429 924 806 388 220 162 177 183
2010/11 549 1 308 1 147 418 279 214 259 200
2011/12 562 1 235 1 051 461 295 214 232 219
2012/13 563 1 099 835 539 345 213 193 255
Monthly
2011 - October 502 1 216 995 378 243 194 224 181
2011 - November 491 1 228 1 054 353 224 191 235 170
2011 - December 476 1 163 1 026 346 227 185 228 166
2012 - January 500 1 223 1 062 371 234 193 235 177
2012 - February 512 1 245 1 100 385 255 199 241 184
2012 - March 542 1 283 1 152 426 287 209 247 203
2012 - April 575 1 308 1 182 474 335 221 253 226
2012 - May 570 1 210 1 081 492 330 217 233 234
2012 - June 570 1 187 996 503 315 216 219 239
2012 - July 660 1 234 1 010 584 353 245 224 275
2012 - August 682 1 254 994 619 365 253 224 291
2012 - September 669 1 276 960 604 374 251 221 285
2012 - October 617 1 183 844 555 359 234 202 261
2012 - November 595 1 148 816 539 378 226 196 255
2012 - December 603 1 153 772 553 396 229 191 261
2013 - January 591 1 192 838 512 367 226 200 245
2013 - February 597 1 164 862 513 381 228 202 246
2013 - March 588 1 117 853 503 367 224 197 241
2013 - April 559 1 099 841 521 300 214 194 247
2013 -May 498 1 077 849 527 404 192 194 254
2013 - June 523 1 036 858 551 321 198 193 261
2013 - July 514 997 838 568 304 191 187 267
2013 - August 514 995 824 564 277 190 182 263
2013 - September 554 1 028 823 557 291 204 184 261
2013 - October 544 989 866 555 318 202 188 2621 Soybeans: US, No.2 yellow, c.i.f. Rotterdam.2 Soybean oil: Dutch, fob ex-mill.3 Palm oil: Crude, c.i.f. Northwest Europe.4 Soybean cake: Pellets, 44/45 percent, Argentina, c.i.f. Rotterdam.5 Rapeseed meal: 34 percent, Hamburg, f.o.b. ex-mill. Note: The FAO indices are calculated using the Laspeyres formula; the weights used are the average export values of each commodity for the 2002-2004 period. The indices are based on the international prices of five selected seeds, ten selected vegetable oils and five selected cakes/meals.
Please note that in November 2013 some modifications have been introduced to the way the indices are calculated, the most significant one being the following changes in commodity coverage: the new oils index refers only to vegetable oils, i.e. fish oil and tallow have been removed; the new meals index only refers to soybean, sunflowerseed, rapeseed, copra and palmkernel meal, i.e. fishmeal and groundnut meal have been removed. The coverage of the oilseed index has remained unchanged. Except for the meal index, the changes introduced did not significantly alter the values of the series. Sources: FAO and Oil World.