food maker and shopkeeper · food maker and shopkeeper. annual report and financial statements...
TRANSCRIPT

Food maker and shopkeeper
Wm Morrison Supermarkets PLCAnnual report & Financial Statements
2015/16
i

Throughout the Directors’ report and Strategic report: (1) Unless otherwise stated, 2015/16 refers to the 52 week period ended 31 January 2016 and 2014/15 refers to the 52 week period ended 1 February 2015. 2015 and 2016 refer to calendar years. (2) Underlying profit is defined as profit before impairment, provision for onerous contracts and other items that do not relate to the Group’s principal activities on an ongoing basis, profit/loss arising on disposal and exit of properties and sale of businesses and IAS 19 pension interest, at a normalised tax rate, as reconciled in note 1.4 of the Group financial statements. Underlying operating profit is operating profit before impairment, provision for onerous contracts and other items that do not relate to the Group’s principal activities and profit/loss arising on disposal and exit of properties and sale of businesses. (3) Like-for-like (LFL) sales reflects the percentage change in year-on-year store sales (excluding VAT and fuel), stripping out the impact of new store openings and closures in the current or previous financial year.
Strategic reportChairman’s statement 2
Our business model 4
Chief Executive’s statement 6
Our six priorities 8
Chief Financial Officer’s review 10
Relationships 14
Risk 17
Corporate Responsibility 20
GovernanceCorporate governance report 22
Directors’ remuneration report 33
Directors’ report 44
Financial statementsIndependent auditors’ report 47
Consolidated statement of comprehensive income 55
Consolidated balance sheet 56
Consolidated cash flow statement 57
Consolidated statement of changes in equity 58
General information 59
Notes to the Group financial statements 60
Company balance sheet 98
Company statement of changes in equity 99
Company accounting policies 100
Notes to the Company financial statements 103
Investor informationFive year summary 116
Supplementary information 118
Investor relations and financial calendar 119
Information at your fingertips 121

Online Annual report 2015/16For more information visit:
www.morrisons-corporate.com/annual-report-2016
We are listening hard to our key stakeholder groups – customers, colleagues,
suppliers and shareholders – and have developed six priorities to help shape our plan
to turnaround Morrisons.
This journey will be a long one, but there are some early signs of improvement and customers are
beginning to notice.
We will continue to invest to improve the customer shopping trip and fix, rebuild and grow Morrisons –
food maker and shopkeeper.
1Annual report and financial statements 2015/16

“We have the team to turnaround Morrisons and create value for all stakeholders.”
Delivering the turnaround
Chairman’s statement
It has been a busy first year as your new Chairman, both in the stores and on the Board.
David Potts joined as Chief Executive in March. He very quickly formed a new senior Executive Committee that combines the best of Morrisons home grown and externally recruited talent. That team set about injecting a new pace into the turnaround. By listening hard to customers and responding quickly wherever possible, the team are rebuilding Morrisons around its key strengths – good quality fresh food, great value for money, good customer service and authentically British.
It will take time, and we are not assuming the trading environment will improve, but I am confident that we have made the right changes to simplify and focus the business, and to begin to drive sales volumes and deliver improved profits and returns for shareholders.
As your new Chairman, I was keen to ensure a smooth succession of the Non-Executive team, replacing the skill sets of those coming to the end of their tenure.
I was delighted to welcome five new Non-Executive members to the Board during the year – Irwin Lee, Belinda Richards, Neil Davidson, Paula Vennells and Rooney Anand.
They bring us a wealth of executive and non-executive experience across a broad range of areas that will prove invaluable to Morrisons. I am confident we now have a Board well equipped to deliver all aspects of the challenging turnaround ahead. I wish to express our gratitude to the outgoing Non-Executives for their considerable contribution to Morrisons over the years.
A highlight of the year was once again cash generation, with year end net debt of £1.75bn particularly pleasing and well below our initial target range. The strong balance sheet, together with our commitment to retain a predominantly freehold store property portfolio and well-funded pension schemes in surplus, means we have firm foundations on which to build Morrisons turnaround.
Strong and sustained cash flow also provides good visibility for future dividend payments. For 2015/16, we committed to an annual dividend for shareholders of not less than 5p per share and the 3.5p announced at the time of the preliminary results takes the full year dividend to 5p per share.
The Board recognises the importance of sustainable dividends to shareholders. From 2016/17, subject to AGM approval, we will be paying a dividend covered around two times by underlying earnings per share.
In addition, we remain committed to returning surplus capital to shareholders. At the moment, our focus continues to be on delivering the cash improvement programmes and reducing debt. This will remain so until trading is stable for a sustained period, profitability starts to rebuild and debt is lower.
HIGHLIGHTS
Net debt
£1.75bn£594m reduction year on year
5p dividend in line with guidance
What is right for our customers
is also right for colleagues, suppliers and shareholders
Andrew Higginson Chairman
2 Wm Morrison Supermarkets PLC Strategic report

I believe that all stakeholders’ interests are aligned. What is right for our customers is also right for colleagues, suppliers and shareholders. As I said last year, it all starts with simplifying and focusing the business, improving the customer offer and driving volume growth, which, in turn, will drive like-for-like sales, operational leverage, cost efficiencies and profitability.
David and his new team have started that journey and we are aligning remuneration to this value-creation virtuous circle. The new 2016 LTIP will reward long-term cash generation, sales growth and earnings per share.
Governance highlights
Board composition and membership• The Board comprises six independent
Non-Executive Directors and two Executive Directors.
• All Directors stand for re-election annually at the AGM.
• Rooney Anand has been appointed as the Board’s Senior Independent Director and a Non-Executive.
• As Audit Committee Chair, the Board is satisfied that Belinda Richards has recent and relevant experience appropriate to her position.
• There is clear division of responsibilities between the roles of Chairman and the Chief Executive.
Board effectiveness• The Directors have all attended an acceptable
number of Board and Committee meetings.• The Board is satisfied that Non-Executive
Directors commit sufficient time to the Group and contribute to its governance and operations.
External auditor• The Audit Committee is satisfied that the
Company’s statutory auditor PwC, who were appointed in 2014/15 are performing effectively.
• The Board has a policy on the engagement of the external auditor to supply non-audit services.
Accountability• The Board is satisfied with the effectiveness of
internal control and that risk is being managed effectively across the Group.
• Consideration has been given to financial reporting matters with sufficient challenge provided to management relating to judgemental areas.
• The Group’s internal audit function perform periodic reviews of the key areas of the business, including the recognition of commercial income.
See Corporate governance report on pages 22 to 32
Looking forward to 2016/17, we have another busy year ahead and there is still much to do. However, the team are stabilising like-for-like sales and have started some good work to begin the turnaround, which David describes over the next few pages of this report. I am confident that we are on the right track to begin to improve all aspects of the customer shopping trip and create value for all stakeholders.
Andrew HigginsonChairman
3Annual report and financial statements 2015/16

We care about food
Our business model
At Morrisons we are passionate about providing good quality fresh food at great value for money.
Then we move them
We make things
Manufacturing sites
15And we buy things
Morrisons own brand fresh meat is British sourced
100%
National distribution centre
1 Regional
distribution centres
7
We have expanded our range of products in response to customer feedback,
to offer products such as Free From, World Foods, Food To Go and Nutmeg
clothing in more stores
We work directly with suppliers to reduce the length of our supply chain
and build long term relationships
Our high manufacturing standards are also expected of our suppliers, ensuring the
integrity and quality of the products we sell
We operate regional distribution centres and a national centre, servicing
our supermarkets
Our fleet consists of over 550 tractors and nearly 1,700 trailers that cover around 100m kilometres per year. This has been streamlined
to make it more efficient in terms of delivery time and frequency, reducing
the amount of kilometres travelled and our carbon emissions
Continued investment in the chilled supply chain provides even greater freshness
of the products we sell
The personal relationships we have with farmers and other suppliers means we can ensure sustainable and ethical
sourcing to guarantee the integrity and quality of the products we sell
Morrisons.com home deliveries are supported through our service agreement
with Ocado, allowing us to utilise best in class technology and provide industry
leading customer service online
We have 15 well run and well-invested manufacturing sites, making half of the
fresh food we sell
Running our own sites gives greater control over the supply chain and
quality of the food we sell
The craft skills of in-store colleagues provides customers with
what they want, when they want it, in a way they can trust
We have more butchers, bakers, fishmongers and other in-store skilled
colleagues than anywhere else in UK food retail
WHAT WE DO
4 Wm Morrison Supermarkets PLC Strategic report
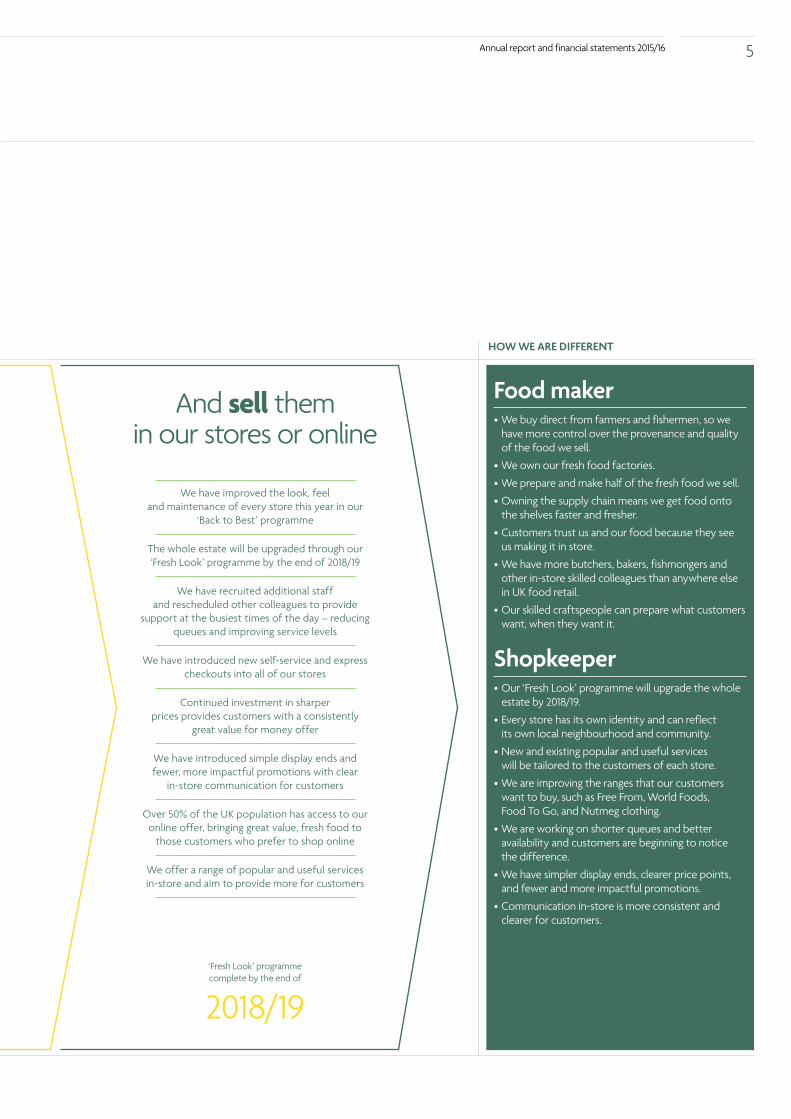
HOW WE ARE DIFFERENT
Food maker• We buy direct from farmers and fishermen, so we
have more control over the provenance and quality of the food we sell.
• We own our fresh food factories.
• We prepare and make half of the fresh food we sell.
• Owning the supply chain means we get food onto the shelves faster and fresher.
• Customers trust us and our food because they see us making it in store.
• We have more butchers, bakers, fishmongers and other in-store skilled colleagues than anywhere else in UK food retail.
• Our skilled craftspeople can prepare what customers want, when they want it.
Shopkeeper• Our ‘Fresh Look’ programme will upgrade the whole
estate by 2018/19.
• Every store has its own identity and can reflect its own local neighbourhood and community.
• New and existing popular and useful services will be tailored to the customers of each store.
• We are improving the ranges that our customers want to buy, such as Free From, World Foods, Food To Go, and Nutmeg clothing.
• We are working on shorter queues and better availability and customers are beginning to notice the difference.
• We have simpler display ends, clearer price points, and fewer and more impactful promotions.
• Communication in-store is more consistent and clearer for customers.
And sell them in our stores or online
‘Fresh Look’ programme complete by the end of
2018/19
We have improved the look, feel and maintenance of every store this year in our
‘Back to Best’ programme
The whole estate will be upgraded through our ‘Fresh Look’ programme by the end of 2018/19
We have recruited additional staff and rescheduled other colleagues to provide
support at the busiest times of the day – reducing queues and improving service levels
We have introduced new self-service and express checkouts into all of our stores
Continued investment in sharper prices provides customers with a consistently
great value for money offer
We have introduced simple display ends and fewer, more impactful promotions with clear
in-store communication for customers
Over 50% of the UK population has access to our online offer, bringing great value, fresh food to
those customers who prefer to shop online
We offer a range of popular and useful services in-store and aim to provide more for customers
5Annual report and financial statements 2015/16

Improving the customer shopping trip“We are listening to customers and they are informing the plan
to rebuild Morrisons.”
Chief Executive’s statement
I have just completed my first year as your Chief Executive. It has been a year of listening hard to customers, responding quickly wherever possible, and improving the business.
Morrisons is a business I have admired for many years. It was clear from listening to our four key stakeholders (customers, colleagues, suppliers and shareholders), that it has many strengths.
First and foremost our colleagues are our greatest asset – highly skilled and passionate about their company. This turnaround will be employee-led.
Customers appreciate that we are a British grocer, with a strong heritage. We are a food maker and shopkeeper. Good quality fresh food and great value for money are our key strengths, and Market Street is special. Half of what we sell is fresh food and half our fresh food we produce ourselves, providing unrivalled provenance from our own manufacturing capacity.
Our financial strength is also important. We have a strong cash flow, a strong and improving balance sheet, a largely freehold property portfolio and pension schemes in surplus. So, we have much to be optimistic about and firm foundations on which to build the turnaround. That turnaround will have three phases – fix, rebuild and grow.
Our first aims during the year were to begin to stabilise sales, and lower costs. To do this we identified the management talent we required and built a leaner, more focused team at our head office, in Bradford. The smaller Executive Committee is complete and many other important senior appointments have been made from inside and outside Morrisons.
We have started to deliver on our initial aims. Trading has begun to stabilise and volume growth is returning. This has been achieved while continuing the journey of lowering everyday prices for customers. This means more price deflation and significantly fewer coupons, both of which have created headwinds for like-for-like sales but have improved the clarity of our offer for customers.
We have continued our programme to remove wasted effort and reduce costs, albeit with some changes to some components, and remain confident of saving £1bn in the period 2014/15 – 2016/17. This has involved some difficult choices, particularly around restructuring head office and closing or selling some underperforming stores, but these were necessary to start to create a cost effective and more responsive organisation.
This turnaround is a journey that has now started. It has been informed by a listening programme that identified six priorities – to be more competitive, to serve customers better, to find local solutions, to develop popular and useful services, to simplify and speed up the organisation, and to make the core supermarkets strong again. We go through the details of these on the following pages.
If we execute successfully, I am confident we can grow volumes, improve like-for-like sales, rebuild profits and improve our return on capital, while continually generating cash.
HIGHLIGHTS OF THE YEAR
We have introduced new self-service and express
checkouts into all of our stores.
We are showcasing ‘Made by Morrisons’ products.
Customer satisfaction
1612 24 2820 32 36 40 44 48 52 4841
This yearLast year
Weeks of the yearDavid Potts
Chief Executive
6 Wm Morrison Supermarkets PLC Strategic report
Morrisons as food makerOur food manufacturing capabilities – in Meat, Fish, Bakery, Fruit & Veg, Deli, and Flowers – make us unique as a British food maker as well as a shopkeeper. We operate from 15 manufacturing sites across Britain. The business is well-run and well-invested, with plenty of capacity to grow sales both for Morrisons and others. After reviewing the business during my first year, it is clear to me that manufacturing is core for Morrisons – part of both the solution and the considerable opportunity for the business.
During the year, we began making the freshness, quality and provenance provided by our unique manufacturing capabilities more visible to our customers. ‘Made by Morrisons’ showcases some of the best in-store skills of our highly trained butchers, bakers, fishmongers and other craftspeople, and we are introducing many good quality, great value products into this important and exclusive range.
As we keep improving the shopping trip, customers will see more of Morrisons as a food maker in our stores. Those food maker skills will help to both win more customers back to Morrisons and gain new ones.
Morrisons as shopkeeperWe spent much of the year improving the shopping trip for customers. First, we recruited 5,000 new colleagues and re-scheduled the hours of others to better serve customers during the busiest times of the week.
We improved the look, feel and maintenance of every store inside and out through a programme called ‘Back to Best’. Store layouts improved, especially in Beers, Wines & Spirits and Fruit & Veg. We also started a ‘Fresh Look’ refit programme that will upgrade the entire store estate by 2018/19, including 200 stores that have not been freshened up in more than five years.
We also introduced new self-service and express checkouts into all our stores, and improved all our point-of-sale material to be clearer for customers.
Our promotions are now better and easier to shop, and our prices lower, more consistent and well communicated. We simplified our ‘Match & More’ card so customers could use it on every shopping trip, and invested in everyday round pound and sharper pricing, to begin to cut every penny we can for customers.
OutlookTo begin the turnaround, we made some tough choices during the year – the head office restructuring and some particularly difficult decisions around underperforming store closures and the sale of the M local chain. These were necessary steps for the long term benefit of all stakeholders.
I am optimistic for the future. As the Chairman said, we are not planning for the trading environment to improve. Despite improving consumer confidence, the return of real wage increases, and higher disposable income, we are not assuming changing shopping habits will reverse. Deflation will persist in our business as we continue to invest in lower prices for our customers and strive to improve the value for money we offer.
Despite this tough backdrop, I am convinced we are doing the right things to begin the turnaround. Customer satisfaction levels are significantly up and we are beginning to welcome customers back to Morrisons.
And, as I said, it will be Morrisons skilled and passionate colleagues who will make the difference and are key to our future success. I would like to thank all of our colleagues, particularly those helping to improve the shopping trip for customers every day, for all the hard work and dedication so far.
Our manufacturing facilities have capacity to grow. Whilst we sold the M local stores, the broader convenience market remains a sizeable opportunity for Morrisons and we are currently trialling a franchise petrol forecourt convenience offer. We also have many new ideas of how to provide popular and useful services at our stores. With our partner, Ocado, we have expanded the reach of Morrisons.com to over 50% of British households and online losses are reducing. There are wholesale opportunities as the recent partnership with Amazon shows. And there are plenty of new growth opportunities, such as Nutmeg clothing that we can further explore. All of these have the common feature of being capital light which is the future growth route for Morrisons.
David PottsChief Executive
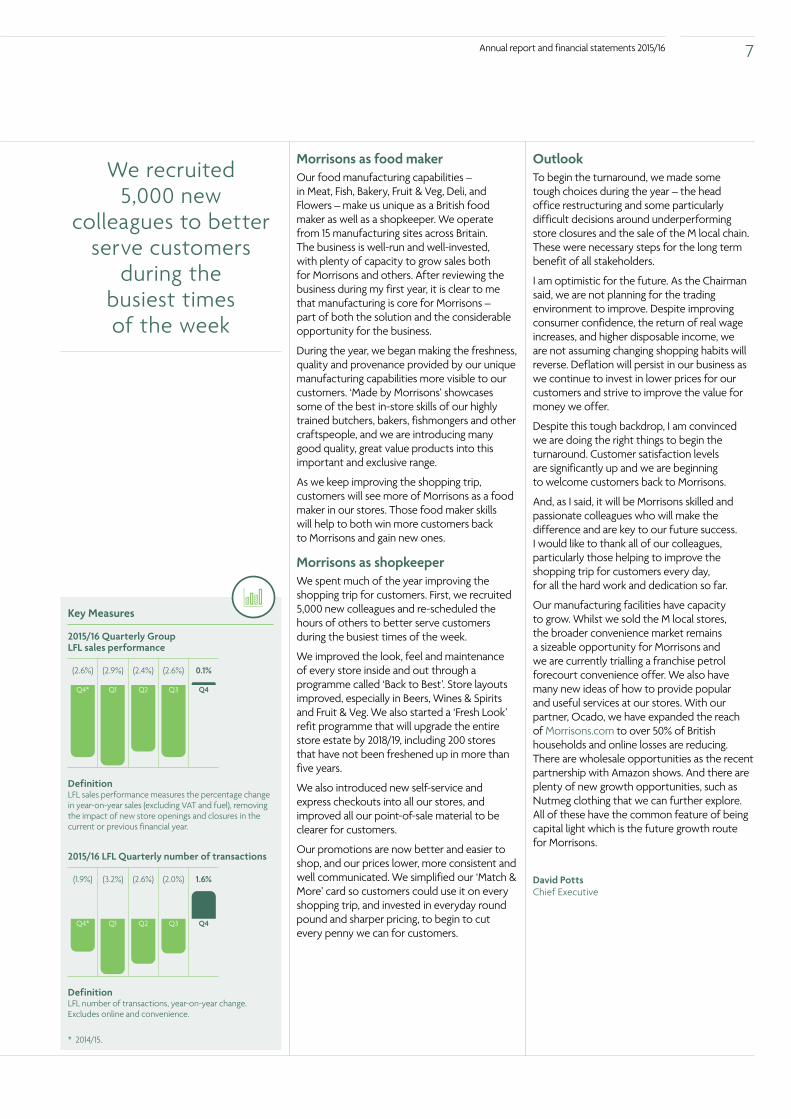
Key Measures
2015/16 Quarterly Group LFL sales performance
Q4* Q1 Q2 Q3 Q4
(2.9%) (2.6%)(2.4%) 0.1%(2.6%)
Definition LFL sales performance measures the percentage change in year-on-year sales (excluding VAT and fuel), removing the impact of new store openings and closures in the current or previous financial year.
2015/16 LFL Quarterly number of transactions
Q4* Q1 Q2 Q3 Q4
(3.2%) (2.0%)(2.6%) 1.6%(1.9%)
Definition LFL number of transactions, year-on-year change. Excludes online and convenience.
* 2014/15.
We recruited 5,000 new
colleagues to better serve customers
during the busiest times of the week
7Annual report and financial statements 2015/16
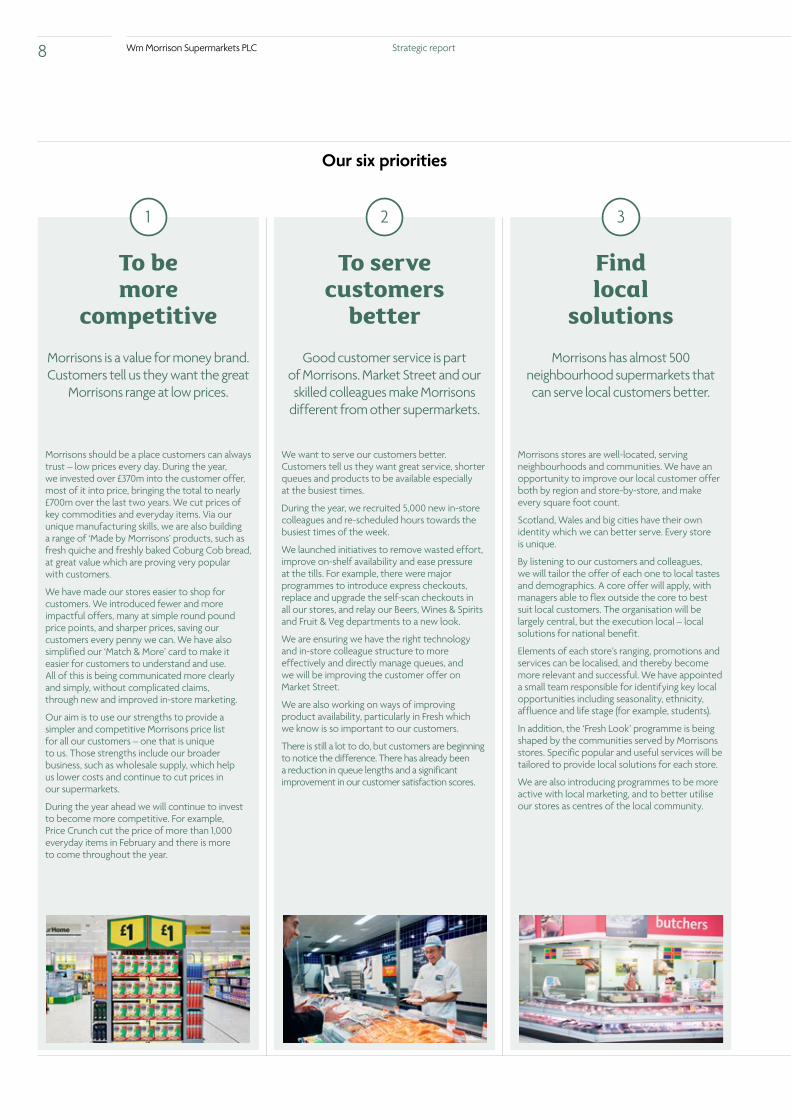
To be more
competitiveMorrisons is a value for money brand. Customers tell us they want the great
Morrisons range at low prices.
Morrisons should be a place customers can always trust – low prices every day. During the year, we invested over £370m into the customer offer, most of it into price, bringing the total to nearly £700m over the last two years. We cut prices of key commodities and everyday items. Via our unique manufacturing skills, we are also building a range of ‘Made by Morrisons’ products, such as fresh quiche and freshly baked Coburg Cob bread, at great value which are proving very popular with customers.
We have made our stores easier to shop for customers. We introduced fewer and more impactful offers, many at simple round pound price points, and sharper prices, saving our customers every penny we can. We have also simplified our ‘Match & More’ card to make it easier for customers to understand and use. All of this is being communicated more clearly and simply, without complicated claims, through new and improved in-store marketing.
Our aim is to use our strengths to provide a simpler and competitive Morrisons price list for all our customers – one that is unique to us. Those strengths include our broader business, such as wholesale supply, which help us lower costs and continue to cut prices in our supermarkets.
During the year ahead we will continue to invest to become more competitive. For example, Price Crunch cut the price of more than 1,000 everyday items in February and there is more to come throughout the year.
To serve customers
betterGood customer service is part
of Morrisons. Market Street and our skilled colleagues make Morrisons
different from other supermarkets.
We want to serve our customers better. Customers tell us they want great service, shorter queues and products to be available especially at the busiest times.
During the year, we recruited 5,000 new in-store colleagues and re-scheduled hours towards the busiest times of the week.
We launched initiatives to remove wasted effort, improve on-shelf availability and ease pressure at the tills. For example, there were major programmes to introduce express checkouts, replace and upgrade the self-scan checkouts in all our stores, and relay our Beers, Wines & Spirits and Fruit & Veg departments to a new look.
We are ensuring we have the right technology and in-store colleague structure to more effectively and directly manage queues, and we will be improving the customer offer on Market Street.
We are also working on ways of improving product availability, particularly in Fresh which we know is so important to our customers.
There is still a lot to do, but customers are beginning to notice the difference. There has already been a reduction in queue lengths and a significant improvement in our customer satisfaction scores.
Find local
solutionsMorrisons has almost 500
neighbourhood supermarkets that can serve local customers better.
Morrisons stores are well-located, serving neighbourhoods and communities. We have an opportunity to improve our local customer offer both by region and store-by-store, and make every square foot count.
Scotland, Wales and big cities have their own identity which we can better serve. Every store is unique.
By listening to our customers and colleagues, we will tailor the offer of each one to local tastes and demographics. A core offer will apply, with managers able to flex outside the core to best suit local customers. The organisation will be largely central, but the execution local – local solutions for national benefit.
Elements of each store’s ranging, promotions and services can be localised, and thereby become more relevant and successful. We have appointed a small team responsible for identifying key local opportunities including seasonality, ethnicity, affluence and life stage (for example, students).
In addition, the ‘Fresh Look’ programme is being shaped by the communities served by Morrisons stores. Specific popular and useful services will be tailored to provide local solutions for each store.
We are also introducing programmes to be more active with local marketing, and to better utilise our stores as centres of the local community.
Our six priorities
1 2 3
8 Wm Morrison Supermarkets PLC Strategic report
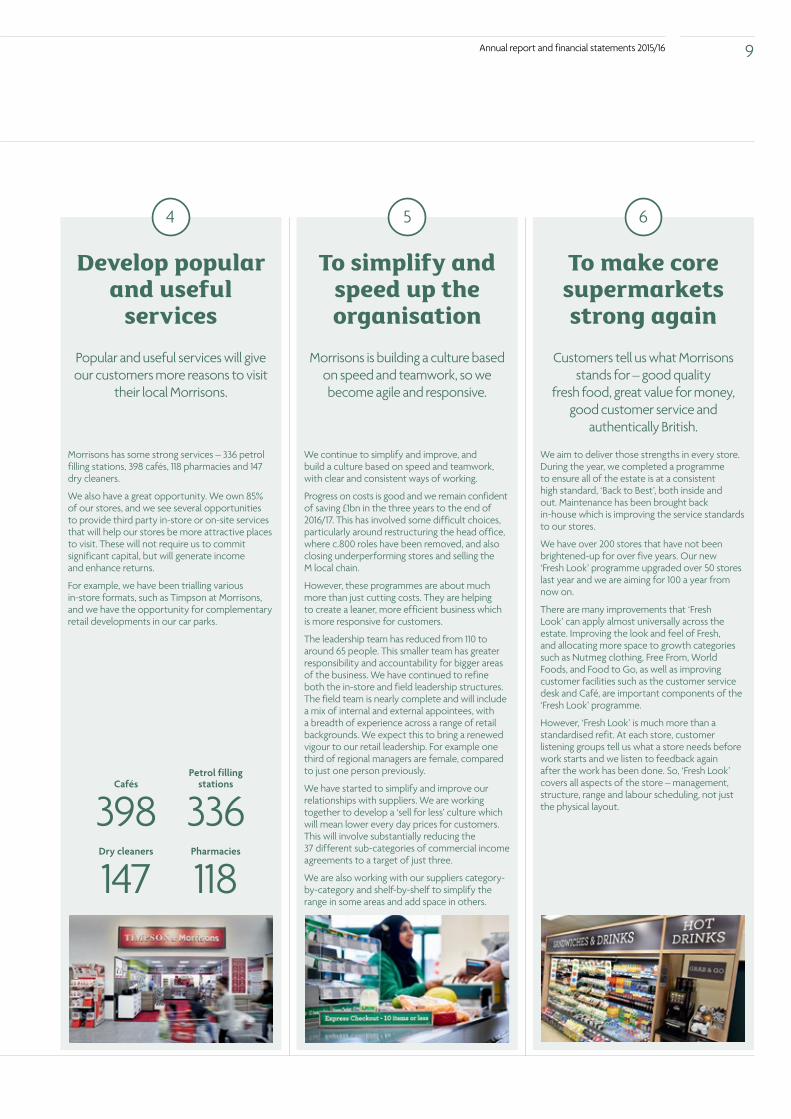
To simplify and speed up the organisation
Morrisons is building a culture based on speed and teamwork, so we become agile and responsive.
We continue to simplify and improve, and build a culture based on speed and teamwork, with clear and consistent ways of working.
Progress on costs is good and we remain confident of saving £1bn in the three years to the end of 2016/17. This has involved some difficult choices, particularly around restructuring the head office, where c.800 roles have been removed, and also closing underperforming stores and selling the M local chain.
However, these programmes are about much more than just cutting costs. They are helping to create a leaner, more efficient business which is more responsive for customers.
The leadership team has reduced from 110 to around 65 people. This smaller team has greater responsibility and accountability for bigger areas of the business. We have continued to refine both the in-store and field leadership structures. The field team is nearly complete and will include a mix of internal and external appointees, with a breadth of experience across a range of retail backgrounds. We expect this to bring a renewed vigour to our retail leadership. For example one third of regional managers are female, compared to just one person previously.
We have started to simplify and improve our relationships with suppliers. We are working together to develop a ‘sell for less’ culture which will mean lower every day prices for customers. This will involve substantially reducing the 37 different sub-categories of commercial income agreements to a target of just three.
We are also working with our suppliers category-by-category and shelf-by-shelf to simplify the range in some areas and add space in others.
Develop popular and useful
servicesPopular and useful services will give our customers more reasons to visit
their local Morrisons.
Morrisons has some strong services – 336 petrol filling stations, 398 cafés, 118 pharmacies and 147 dry cleaners.
We also have a great opportunity. We own 85% of our stores, and we see several opportunities to provide third party in-store or on-site services that will help our stores be more attractive places to visit. These will not require us to commit significant capital, but will generate income and enhance returns.
For example, we have been trialling various in-store formats, such as Timpson at Morrisons, and we have the opportunity for complementary retail developments in our car parks.
To make core supermarkets strong again
Customers tell us what Morrisons stands for – good quality
fresh food, great value for money, good customer service and
authentically British.
We aim to deliver those strengths in every store. During the year, we completed a programme to ensure all of the estate is at a consistent high standard, ‘Back to Best’, both inside and out. Maintenance has been brought back in-house which is improving the service standards to our stores.
We have over 200 stores that have not been brightened-up for over five years. Our new ‘Fresh Look’ programme upgraded over 50 stores last year and we are aiming for 100 a year from now on.
There are many improvements that ‘Fresh Look’ can apply almost universally across the estate. Improving the look and feel of Fresh, and allocating more space to growth categories such as Nutmeg clothing, Free From, World Foods, and Food to Go, as well as improving customer facilities such as the customer service desk and Café, are important components of the ‘Fresh Look’ programme.
However, ‘Fresh Look’ is much more than a standardised refit. At each store, customer listening groups tell us what a store needs before work starts and we listen to feedback again after the work has been done. So, ‘Fresh Look’ covers all aspects of the store – management, structure, range and labour scheduling, not just the physical layout.
4 5 6
Cafés
398Dry cleaners
147Pharmacies
118
Petrol filling stations
336
9Annual report and financial statements 2015/16
Creating value for all stakeholders.
Financial review of the year
Chief Financial Officer’s review
Introduction 2015/16 was another year of strong cash flow generation for Morrisons. We achieved our initial aim of beginning to stabilise sales whilst operating from a lower cost base.
For the second consecutive year we generated cash after dividends and before property disposals. In the last two years we have delivered £1.6bn of free cash flow, and net debt at the end of the year was £1.75bn. We are focused on delivery of our cash improvement programmes and are committed to capital discipline with strong cost control. We are working to reduce debt further and are targeting a range of £1.4bn to £1.5bn by the end of 2016/17.
During 2016/17, we will continue to invest in the business, specifically in our six priorities. We can also become a stronger, broader business.
The turnaround and the broader business opportunities aim to improve sales, margin and asset intensity, which in turn will improve returns for shareholders. Growth will be capital light, disciplined and sustainable.
Summary income statement2015/16
£m2014/15
£m
Turnover 16,122 16,816
Operating profit/(loss) 314 (696)
Net finance costs (99) (98)Share of profit of joint ventures 2 2
Profit/(loss) before tax 217 (792)Underlying profit before tax 242 345One-off restructuring costs 60 68Underlying profit before restructuring costs and tax 302 413
Underlying earnings per share 7.8p 10.9p
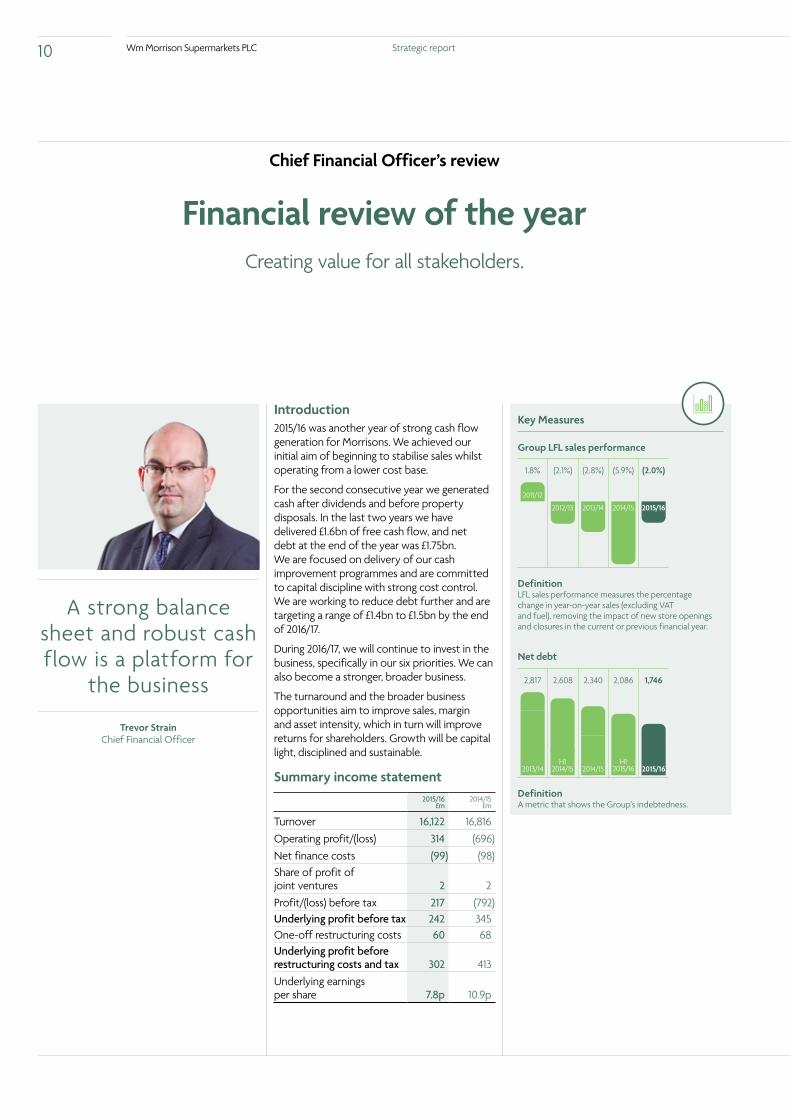
A strong balance sheet and robust cash flow is a platform for
the business
Trevor Strain Chief Financial Officer
Key Measures
Group LFL sales performance
2011/12
2012/13 2013/14 2014/15 2015/16
(2.1%) (5.9%)(2.8%) (2.0%)1.8%
Definition LFL sales performance measures the percentage change in year-on-year sales (excluding VAT and fuel), removing the impact of new store openings and closures in the current or previous financial year.
Net debt
2013/14H1
2014/15 2014/15H1
2015/16 2015/16
2,608 2,0862,340 1,7462,817
Definition A metric that shows the Group’s indebtedness.
10 Wm Morrison Supermarkets PLC Strategic report

TurnoverTotal turnover during the period was £16.1bn, down 4.1% year-on-year. Store turnover of £12.8bn, excluding fuel, was down by 1.4%. This comprised like-for-like (LFL) down 2.0% (including a contribution of 1.0% from online) and 0.6% contribution from new space.
We were pleased with the improvement in sales towards the end of the year. In line with our aim to begin to stabilise trade, fourth quarter LFL ex-fuel was up 0.1%, despite deflation remaining above 3%, and lower coupon activity having an impact on basket size. The LFL number of customer transactions were also positive in the fourth quarter. Overall in the second half of the year, LFL was down 1.3%, an improvement on the first half which was down 2.7%.
Fuel sales fell by 12.6% to £3.1bn, with the impact of deflation becoming more severe through the year. Towards the end of the year we led the market lower on fuel prices, and volumes responded. In the fourth quarter, despite deflation of nearly 20%, fuel LFL was almost flat.
Cost savingsWe achieved full year cost savings of £423m, bringing the two year total to £647m. We remain focused on costs and are on track to deliver our target of £1bn of savings over the three years to the end of 2016/17.
Operating profit2015/16
£m2014/15
£m
Operating profit/(loss) 314 (696)Underlying adjustments:– Impairment and
provision for onerous contracts 87 1,273
– Profit/loss on disposal and exit of properties (131) (131)
– Pension scheme set-up costs 35 –
– Loss/(profit) arising disposal of businesses 34 (4)
Underlying operating profit 339 442
Operating profit was £314m (2014/15: loss of £696m). Underlying operating profit, which excludes impairment and provision for onerous contracts, property disposal profits, losses on the disposal of M local, and the one-off set-up cost of the defined contribution pension scheme, was £339m (2014/15: £442m). The year on year reduction reflects our ongoing investment in being more competitive and serving customers better with £373m invested this year.
Underlying profit2015/16
£m2014/15
£m
Reported profit/(loss) before tax 217 (792)Underlying adjustments:– Impairment and
provision for onerous contracts 87 1,273
– Profit/loss arising on disposal and exit of properties (131) (131)
– Pension scheme set-up costs 35 –
– Loss/(profit) on disposal of businesses 34 (4)
– Net pension interest income – (1)
Underlying profit before tax 242 345Underlying profit margin 1.5% 2.1%
Reported profit before tax was £217m (2014/15: loss of £792m), and underlying profit before tax was £242m (2014/15: £345m), or £302m (2014/15: £413m) after adjusting for £60m (2014/15: £68m) store closure and restructuring costs. Underlying basic earnings per share reduced to 7.8p (2014/15: 10.9p), reflecting the reduction in underlying profit before tax.
Debt, cash flow and working capital
Summary cash flow2015/16
£m2014/15
£m
Cash generated from operations before onerous capital payments 1,055 1,044Onerous capital payments (29) (74)Cash generated from operations 1,026 970Proceeds from sale of plant, property and equipment and sale of businesses 320 450Capital expenditure (365) (520)Dividends paid (260) (308)Dividends received 8 –Purchase of shares in subsidiary (3) –Purchase of own shares (13) (8)Tax and interest (136) (92)Other non-cash movements 17 (15)Net cash flow 594 477Opening net debt (2,340) (2,817)
Closing net debt (1,746) (2,340)
Group net debt fell to £1.75bn, down £594m year on year.
Our plans to improve free cash flow are progressing very well with £854m delivered during the year. We now expect to exceed our target of generating £2bn of free cash flow over the three years to 2016/17.
Continued strong cash generation meant our committed working capital facilities were called upon only temporarily in the second half. We made good progress in all areas of working capital, delivering an operating working capital improvement of £348m, taking the two year improvement to £554m.
11Annual report and financial statements 2015/16

Chief Financial Officer’s review continued
During the year we realised net proceeds relating to property and businesses of £320m, generating a profit on disposal of £131m, before the £34m loss on disposal of the M local business. Over the last two years, we have realised £750m of property disposal proceeds. We remain committed to a predominantly freehold store portfolio. At year end, we owned 85% of our stores, a ratio that is broadly unchanged since the start of our disposal and underperforming store closure programmes.
InterestNet finance costs were £99m (2014/15: £98m). In February 2016, we agreed to redeem our $250m US private placement (USPP) notes, which were due to mature in 2026 generating an annual interest benefit of around £8m. The one-off payment of £17m was half of the contracted ‘make whole’ cost. We will recognise this cost outside of underlying profit before tax for 2016/17.
TaxThe management of our tax affairs is focused on ensuring that we pay the tax we are obliged to pay in accordance with the law and that our tax affairs are consistent with our broader corporate objectives. We regard this as being important in protecting our reputation and brand, and have a tax management framework which ensures that the needs of all of our stakeholders are considered.
The Group is committed to paying all of its taxes in full and on time. It is a major contributor across a wide range of UK taxes. In 2015/16, Morrisons made net payments of £1,109m to the UK government of which £538m was borne by Morrisons and the remaining £571m was collected on behalf of our colleagues, customers and suppliers.
Optimise assetsWe are committed to optimising our assets, addressing underperformance and improving returns. We closed 21 underperforming supermarkets and exited the M local business during the year, and in January announced a proposal to close a further seven supermarkets. In total, these closures represent 5% of Morrisons space. We have no further plans for a programme of store closures.
We opened one new store during 2015/16 and will open one during 2016/17. Looking forward to 2016/17, the sales contribution from net new space will be negative as a result of the impact of the store closures.
SpaceAt 2
February 2015
New stores Transfers
Store closures
At 31 January
2016
Number of core stores 514 1 4 (21) 498Number of convenience stores 153 5 (5) (153) –Total number of stores 667 6 (1) (174) 498Total area in square feet (000) 14,732 38 – (628) 14,142Number of petrol filling stations 335 – 1 – 336
Summary balance sheet2015/16
£m2014/15
£m
Fixed assets and investments 7,775 8,023
Working capital (1,710) (1,324)Provisions and tax (749) (726)Net pension asset/ (liability) 186 (39)Net debt (1,746) (2,340)Net assets 3,756 3,594
PensionOur pension schemes remain well-funded and we recognised a £186m surplus at year end. The planned launch of our new defined contribution pension scheme has resulted in a charge of £35m being incurred in the second half of the year. This has been excluded from underlying earnings.
Capital expenditureCapital expenditure fell to £365m, from £520m in 2014/15. This was lower than the planned c.£400m, as some projects moved into 2016/17.
A large part of our expenditure was spent on refreshing our stores. We completed over 50 ‘Fresh Look’ refits during the year and expect to complete around 100 per annum going forward, with the aim of having the whole estate updated by the end of 2018/19.
In addition, we incurred £29m of capital payments on onerous contracts in 2015/16, which were previously provided for.
Key Measures
Capital expenditure (£m)
1,016 5201,086 365901
2011/12 2012/13 2013/14 2014/15 2015/16
Definition Measured as additions to property, plant and equipment, investment properties, intangible assets and investments.
12 Wm Morrison Supermarkets PLC Strategic report

Return on Capital EmployedReturn on Capital Employed at 5.3%, remains a key measure. We are focused on improving returns through the work we are doing on the operational performance drivers, specifically volume and costs. We are also optimising existing assets and dealing with assets which are underperforming.
Key Measures
Return on capital employed (ROCE)
2011/12 2012/13 2013/14 2014/15 2015/16
9.8% 5.6%8.2% 5.3%10.4%
Definition ROCE is a relative profit measure showing the return generated from investments in assets.
Key balance sheet metrics
2015/16 2014/15
Interest cover 4 times 5 timesNet debt/EBITDA 2.2 2.6Gearing 46% 65%
ROCE 5.3% 5.6%
Financial strategy
Approval of the Strategic reportPages 2 to 21 of the Annual report form the Strategic report. The Strategic report was approved by the Board on 9 March 2016 and signed on its behalf by:
Mark Amsden Company Secretary 9 March 2016
Our capital allocation framework is set out above and is unchanged. Our first priority is to invest in our stores and infrastructure, and to reduce costs. Second, we will seek to maintain debt ratios that support our target of an investment grade credit rating. Third, we will invest in profitable growth opportunities. Fourth, we will pay dividends in line with our stated policy and; finally, any surplus capital will be returned to shareholders.
Shareholder returnsThe 2015/16 dividend was re-aligned to reflect the Board’s commitment to the capital allocation framework described above, whilst providing the necessary financial resources to invest in delivering the turnaround. In line with the guidance we set out last year, the final dividend will be 3.50p per share, bringing the total for the year to 5.00p.
The business is profitable. It is deleveraging rapidly and generating positive cash, before disposals and after dividend. The balance sheet is strong and getting stronger. The Board therefore feels well-placed to set a future dividend policy that provides an appropriate balance between continued investment in our business and shareholder returns. The Board believes that total annual dividends should be covered around two times by underlying earnings.
We remain committed to returning surplus capital to shareholders, and will do so at an appropriate time. However, our focus has been – and continues to be – delivering robust free cash flow to reduce debt.
Trevor Strain Chief Financial Officer
CAPITAL ALLOCATION FRAMEWORK
Investing in maintaining estate and reducing cost
Maintaining debt ratios to support investment grade rating
Investing for profitable growth
Paying dividends in line with stated policy
Returning surplus capital to shareholders
1
2
3
4
5
13Annual report and financial statements 2015/16

“We continue to focus on getting the right people in the right place at the right time to support our customers’ needs
and to deliver our priorities.”
Our colleagues and partners
Relationships
Restructuring our colleague base
We have completed significant structural change during the year across all areas of the business to ensure we have the right number of people, with the right skills in the right place to serve our customers. During this process and the closure of 21 supermarkets we have worked hard to retain the skills and talents of our colleagues with over 40% being redeployed into different roles.
The restructuring in head office has resulted in over c.800 roles being removed which have allowed us to reinvest in frontline colleague hours on smaller, flexible contracts, creating 5,000 in-store roles. In addition over 2,000 store colleagues were successfully transferred across to My Local following the sale of M local.
We have agreed significant changes to how we pay and reward our colleagues
Hourly pay rates in retail have been increased to £8.20 which is £1 above the National Living Wage and highly competitive in the market. This has positioned us well for the implementation of the living wage in April 2016 and the legislated increases in subsequent years.
Salaried pay has also been reviewed with pay bands identified for all salaried roles. Our organisational structure has been redesigned and simplified to ensure a maximum of eight levels from colleague to Executive Committee, every role has an updated job description linking to our business priorities.
Listening hard and responding quickly
During 2015/16 we’ve completed customer and colleague listening programmes across the business. This included listening groups at 110 of our stores as part of our ‘Fresh Look’ programme. Customers and colleagues have shared their feedback to enable us to improve their store with the right local solutions for them. We follow up on all actions raised and run weekly action meetings where senior managers across the business come together to listen and respond to the issues raised. We’ve seen both local and national improvements as a result of this work, for example, a redesign of our colleagues’ uniform which following further colleague feedback and involvement will be in all stores by the Autumn.
Our two colleague engagement surveys during the year received a record level of responses, including over 142,000 unique free text responses to each survey. We continue to see a high response rate with over 70% of our colleagues taking time to participate. We’ve continued to make it easier for colleagues to have their say online via their mobile or tablet. This insight has been used to shape our corporate engagement plan.
During 2015/16 our measure of overall colleague engagement has improved from 75% to 76% which is pleasing in the context of the difficult decisions we have needed to make on restructuring of the business.
Store colleague engagement index has increased by 3.5%, with the key drivers being:
• increased confidence in the future of Morrisons;
• good reasons for customers to shop at Morrisons; and
• strong links to the local community.
Head office engagement index fell by 14.3% impacted by the restructuring programme during the year.
HIGHLIGHTS
People progressing from the shop floor to more senior
positions in 2015/16
1,4652015: 1,650
Percentage of colleagues who participated in
the engagement surveys
72%2015: 79%
Colleague Engagement Index: How engaged
are colleagues?
76%2015: 75%
Key Measures
Colleague Engagement
Colleague feedback
72% 73%75% 76%73%
2012/13 2013/14 2014/15 2015/16 2015/16Q1 Q3
Definition Colleague engagement is measured through our two annual surveys in Spring and Autumn.
14 Wm Morrison Supermarkets PLC Strategic report

Talent, training and development
To help our colleagues find opportunities to get on in the business we offer a number of programmes focusing on developing core skills, craft skills, technical skills and leadership skills. Over 550 store colleagues have completed retail or craft apprenticeships.
Accelerated learning programmes were launched in stores and logistics as a new way of fast tracking colleagues to gain new skills they need at pace to secure promotion at the next level.
Following the restructure in our retail stores we supported development into new roles by training c.9,500 team managers and c.3,500 duty managers on job specific functional and behavioural skills.
We continue to build our talent pipeline from within by equipping trainees with the knowledge and skills needed to be successful in a dynamic retail environment.
This year we recruited 62 graduates and have 133 graduate trainees completing operational; retail and head office functions schemes. In July, 22 colleagues graduated from Bradford University achieving a BSc. (Hons) in Management & Business in addition to 54 colleagues completing a foundation degree in logistics and supply chain from Hull University.
Within our senior leader population, managers with potential to become Directors participated in a future business leader programme including a business placement in a local charity.
Human rights and diversity
We pride ourselves on being a diverse organisation. We respect the human rights of all individuals as well as the communities in which we work and are committed to providing a workplace free from harassment and offering equal opportunities for promotion and advancement. During 2015/16, Morrisons employed 54,013 men and 66,900 women. In addition, 54 of our senior managers and six of our Board Directors were men, while 12 of our senior managers and two of our Board Directors were women. The retail field team now includes seven female regional managers, up from just one previously.
This year we have continued our work to build a workforce representative of the communities we serve.
Progress has been made against our diversity strategy which operates across all our talent activities, and will focus on addressing the identified gaps in our pipeline, will ensure a balanced slate for all senior promotion and hiring decisions, and adopt a standard assessment process so that our talent is assessed on an unbiased basis.
Our suppliers
At Morrisons, we pride ourselves on good quality fresh food. We work closely with farmers and suppliers to shorten our supply chains and make them more efficient to ensure our food reaches our stores in the freshest possible condition. Our uniquely vertically integrated business model means we own more of our fresh food supply chain. This ensures we have greater control over supply chain visibility, quantity and quality, and reduces risk as we know where our food comes from.
We take pride in our heritage – British born and bred – so we buy British wherever possible. 100% of our Morrisons branded beef, lamb, pork, chicken, milk and eggs are sourced in the UK. Buying British reduces food miles, adds to the national economy, strengthens agricultural industries and supports our rural communities.
We have listened hard to our suppliers, and taken action wherever possible. For example, we recognised the challenges in the dairy industry. In October we launched ‘Milk for Farmers’ giving customers the choice to buy a brand of milk and cheese where a clear element of the proceeds goes back to dairy farmers.
During the year, we conducted a supplier conference where we launched 12 commitments which laid out our ways of working with our wider supplier base. These commitments are now at the centre of our supplier relationships, ensuring we are more competitive and simplify the way we work, with the aim of building trust and ultimately serving our customers better. We will continue to monitor ourselves against these commitments. We work closely with our suppliers to encourage and promote responsible practices throughout the supply chain, helping to ensure sustainable supply for future generations. We are also a participant in the Advantage survey, a comprehensive and independent survey of over 400 suppliers’ views on the status of their relationship with major grocery retailers in the UK.
This year we have focused on how we buy our products including simplifying our agreements. Our supply chain financing option also continues to be popular with our suppliers, with take up continuing to exceed our expectations.
Our ambition is always to have strong, mutually beneficial arrangements with our suppliers, responsible and fair trading terms and practices in line with the Groceries Supply Code of Practice.
Mastercraft competition Our annual competition, which challenges the specialist knowledge and practical skills of our colleagues in our specialist craft areas from our
Market Street, was a huge success this year. The competition included colleagues from our eight craft trades – butchery, bakery, fishbar, delicatessen,
wine, flowers, cakeshop and produce.
15Annual report and financial statements 2015/16

The Groceries Supply Code of PracticeThe Groceries Supply Code of Practice (GSCOP) (the ‘Code’) applies to all grocery retailers with an annual turnover in excess of £1bn. Essentially, the Code creates certain specific rights and obligations that regulate our trading relationship with suppliers.
We actively engage with the relevant regulatory bodies, the Office of the Groceries Code Adjudicator (GCA) and the Competition & Markets Authority (CMA), to build best practice in relation to the Code. We have regular meetings with the GCA and provide updates on our activity, challenges in relation to the Code and details on specific areas of interest for the Adjudicator.
During the year, we continued to build on our training programme for all supplier-facing colleagues. This year we ran two face-to-face briefing and feedback sessions for all buyers and relevant trading colleagues. In addition, we ran bespoke sessions for colleagues in our supply chain team and a further session for finance colleagues who work closely with our trading function. We undertook a further detailed review of relevant processes utilising our Internal Audit team. Building on audits in previous years, additional actions were identified for continued process improvement including the strengthening of the compliance and monitoring team through the addition of a dedicated and independent resource.
Enquiries from suppliers on Code related matters were dealt with in accordance with the regulations. Any matter not resolved directly with a buyer is escalated to the relevant Category Director and, if requested, to our appointed Code Compliance Officer (CCO). Additional day-to-day guidance and advice on the Code is provided by the Group’s legal function.
During 2015/16 we have successfully worked with suppliers to resolve the majority of complaints that have arisen with reference to the provisions of the Code. In summary nine new complaints were made by suppliers which were notified to our CCO. In total, eight of those were either resolved or withdrawn during the course of the year. The remaining matter at the financial year end has subsequently been resolved.
Relationships continued
Group GHG emissions for year ending 31 December
Emission source
2004/05 Baseline
Year
2014/15 Prior Year
2015/16 Current
YearChange vs.
Baseline
Combustion of fuel and operation of facilitiesNatural Gas 102,470 146,911 155,087 51.3%Haulage 139,847 109,990 114,989 (17.8%)Business miles 4,511 3,643 3,743 (17.0%)Fugitive EmissionsRefrigerant 455,929 105,173 237,863 (47.8%)Energy purchased for own useElectricity 798,596 756,595 672,451 (15.8%)OtherStaff travel 37,282 24,162 34,266 (8.1%)Waste 36,730 22,197 20,876 (43.2%)Total 1,575,365 1,168,671 1,239,275 (21.3%)Intensity ratio: kg CO2e per ft² GIA 50.4 29.5 32.0 (36.5%)
For overall governance, routine reports and updates are provided to our Corporate Compliance and Responsibility Committee, Audit Committee and Executive Committee on all aspects of the Code including developments about its operation or regulation. We formally report details of activity over the year and specific complaints made by the suppliers to our CCO, to the GCA, and the CMA at the financial year end.
Contact details and further information can be found at www.morrisons.co.uk/gscop.
Reducing emissions
MethodologyThe information below is taken from our Group Carbon Footprint report, prepared internally and independently verified by Jacobs. We have reported for the calendar year 1 January to 31 December for all years in order to remain consistent with our historical footprint reports.
We have used the UK Government’s Environmental Reporting Guidance (2013 version) to prepare these numbers, and the latest emissions factors from DEFRA/DECC’s GHG Conversion Factors for Company Reporting.
We have revised our historical emissions figures following the sale of a number of sites and revisions to carbon conversion factors.
We have identified some possible inaccuracies with some of the refrigeration emissions figures from the previous year and are working to ensure these numbers are corrected in future reports.
The Carbon Footprint report includes all major sources of carbon emissions from the operation of the Group’s supermarkets, manufacturing and distribution sites and operation of its haulage fleet. Some minor exemptions are:
Subsidiaries• Bos Brothers Fruit and Vegetables B.V. –
Dutch vegetable packer that deals with energy locally;
• Wm Morrison (HK) Limited – Hong Kong office that deals with energy locally;
• Wm Morrison Bananas Limited – a subsidiary that during the year was operated by the minority shareholder Global Ripeners Limited; and
• Neerock Farming Limited.
Sites• A number of distribution sites are operated
by third parties who are responsible for the energy and carbon, including Dordon, Birstall, Feltham, Bury, Willand, Droitwich, Clipper, Northfleet, Bathgate and Bunzl.
Sources• Fuel oil – only four sites have fuel oil, which is
estimated to account for less than 0.1% of the total footprint.
16 Wm Morrison Supermarkets PLC Strategic report

Recognising the effect of uncertainty on our business means that we are in a better position to achieve our objectives,
respond to emerging risks and create opportunities.
Managing our risks
Risk
Risk management approach
The achievement of our six priorities depends on our ability to make sound, risk-informed decisions. Managing risk and uncertainty is an integral part of doing business. We manage increasing uncertainty as we respond to changes in our industry by maintaining a business wide understanding of our key risks and how to manage them. This assists in delivering our promises to customers and shareholders.
The risk management process
Our risk management framework has been built to identify, evaluate, mitigate and monitor those risks which threaten the achievement of our six priorities. The framework incorporates both a top down approach to identify the Group’s principal risks and a bottom up approach to identify operational risks.
At the core of the risk management process are the risk registers for each function. These detail the key operating risks and are used to assess the gross level of risk (likelihood and impact), mitigating controls, the resultant net level of risk, risk mitigation plans and target level of risk. The risk registers are owned and managed by operational management, with the head of each function certifying annually that these have been reviewed and action plans are in place where required. The risk registers are formally reviewed by a sub group of the Executive Committee.
A Group risk register is reviewed and updated at least twice a year by the Executive Committee. It details the Group’s principal risks, owners, the level of risk and mitigating actions. The Executive Committee’s assessment of these risks takes into account the operating risks, strategic risks, external factors and any emerging risks.
The principal risks are monitored every month by the Executive Committee using key risk indicator reporting, supplemented by specific deep dive reviews as appropriate.
The Risk and Internal Audit function facilitates the preparation of both functional and Group risk registers. It supports the Audit Committee in reviewing the effectiveness of risk management and internal control systems. Where weaknesses are identified, Risk and Internal Audit work with the business to agree actions to mitigate these.
The Audit Committee supports the Board in establishing a robust risk management framework by approving the risk management process and reviewing the Group’s principal risks and key risk indicator reporting.
Read more on risk governance in the Audit Committee report on pages 28 to 31.
Principal risks
The Directors have carried out a robust assessment of the principal risks facing the Group, including those that would threaten its business model, future performance, solvency or liquidity.
This assessment of principal risks has resulted in some changes from those risks disclosed last year. Business strategy has been removed as a separate risk but the key elements are included in the other risks listed, notably the newly added risks of customer and supplier relationships. The supply chain management and integrity risk has been removed and incorporated into the supplier relationships and food and product integrity risks. The IT systems upgrade risk has been removed as this project is substantially complete. The regulation risk has also been removed and key elements of it are covered in the health and safety, food safety and product integrity and supplier relationships risks.
The principal risks identified by the Board and corresponding mitigating controls are set out (on the next page) in no order of priority.
Key areas of focus
Key activities and developments during 2015/16 include:
• update of the Group risk register by the Executive Committee;
• embedding of risk register reviews by functions and sub group of Executive Committee;
• development of Group risk reporting using key risk indicators; and
• alignment with recent changes to the UK Corporate Governance Code, including development of a viability statement.
Our priorities for 2016/17 include:
• reviewing and updating the controls framework to further develop key controls monitoring and performance at a functional level; and
• developing the Group’s risk appetite framework.
17Annual report and financial statements 2015/16

RISK TYPE DESCRIPTION MITIGATION
Business interruption
#
There is a risk that a major incident, such as a natural disaster or strike action, could cause significant disruption to business operations. The Group’s response must be appropriate to minimise disruption and reputational damage.
• We have recovery plans in place covering our stores, depots, factories and offices;
• These plans include, where appropriate, secondary locations which would be used as backup in case of an incident;
• A Crisis Management Group is in place to oversee these plans and to manage and respond to any major incidents; and
• We conduct supplier risk assessments and have contingency plans in place, where possible, to manage the risk of loss of supply.
Competition 1
If we do not effectively manage our trade plan to remain competitive there is a risk that we will not achieve our financial targets.
The Grocery sector continues to be challenging with high levels of competitive activity, food price deflation and enhancement of service through technology. This leads to an increase in this risk.
• We have continued to invest heavily in price and to emphasise Morrisons’ point of difference through the ‘Made by Morrisons’ campaign;
• We review and actively manage our price points, sales proposition, and promotional and marketing campaigns;
• Competitor pricing positions and market trends are reviewed on a weekly basis; and
• Our strong balance sheet and proven ability to generate cash will allow us to further invest in our proposition.
Customer 1 2 3
4 6
There is a risk that we don’t meet the needs of our customers in respect of price, range, quality and service. If we don’t provide the shopping trip that the customer wants, we could lose sales and market share.
• We have focused the business on six priorities (see pages 8 to 9) which puts the customer at the centre of our decision making;
• We have implemented a large scale programme of customer listening groups to gain a deep understanding of what our customers want and, where we can improve, these have informed our store refresh programme;
• We closely monitor customer perceptions research and respond quickly where possible; and
• We have continued to expand the geography covered by our online offering meaning more people are able to shop online with us.
Data #
A security breach leading to loss of customer, colleague or Group confidential data is a key aspect of this principal risk. A major data security breach could lead to significant reputational damage and fines.
Increased regulation and financial penalties in addition to increased incidents of cyber attacks on corporates has led to the increase in this risk.
• We have an Information Management Steering Group which has the responsibility for overseeing data management practices, policies, awareness and training;
• Information security policies and procedures are in place, including encryption, network security, systems access and data protection; and
• This is supported by ongoing monitoring, reporting and rectification of vulnerabilities.
Financial and treasury
#
The main areas of this principal risk are the availability of funding and management of cash flow to meet business needs. In addition, fluctuations in commodity prices and foreign exchange rates could impact the Group’s profitability.
• The Group’s treasury function is responsible for the forward planning and management of funding, interest rate, foreign currency exchange rate and commodity price risks (see note 7). They report to the Treasury Committee and operate within clear policies and procedures which are approved by the Board; and
• For livestock and produce, we track prices and forecasts and enter into long term contracts where appropriate to ensure stability of price and supply.
Food safety and product integrity
#
There is a risk that the products we sell are unsafe or not of the integrity that our customers expect. It is of utmost importance to us and to the confidence that customers have in our business that we meet the required standards. If we do not do this it could impact business reputation and financial performance.
• Strict standards and monitoring processes are in place to manage food safety and product integrity throughout the Group and supply chain;
• Regular assessments of our suppliers and own manufacturing facilities are undertaken by a dedicated team to ensure adherence to standards;
• Our vertical integration model gives us control over the integrity of a significant proportion of our fresh food;
• Management regularly monitors food safety and product integrity performance and compliance as well as conducting horizon scanning to anticipate emerging issues; and
• The process is supported by external accreditation and internal training programmes.
Principal risks
18 Wm Morrison Supermarkets PLC Strategic report

RISK TYPE DESCRIPTION MITIGATION
Health and safety #
The main aspect of this principal risk is of injury or harm to customers or colleagues. Failure to prevent incidents could impact business reputation and customer confidence and lead to financial penalties.
• We have clear policies and procedures detailing the controls required to manage health and safety risks across the business;
• An ongoing training programme is in place for frontline operators and management;
• A programme of health and safety audits is in place across our stores, depots, factories and offices with resource dedicated to manage this risk effectively; and
• Management regularly monitors health and safety performance and compliance.
People #
Our colleagues are key to the achievement of our plan, particularly as we make changes to the business. There is a risk that if we fail to attract, retain or motivate talented colleagues, we will not provide the quality of service that our customers expect.
Business change and the challenging trading environment may impact on colleagues leading to an increase in this risk.
• We have competitive employment policies, remuneration and benefits packages;
• A new Group wide reward framework has been introduced and roles are evaluated against an external framework, driving stronger consistency of rewards;
• Our training and development programmes are designed to give colleagues the skills they need to do their job and support their career aspirations;
• Line managers conduct regular talent reviews and processes are in place to identify and actively manage talent (see more in our people section on page 14); and
• Colleague engagement surveys, listening sessions and networking forums are used to understand and respond to our colleagues’ needs.
Supplier relationships
1 5
There is a risk that if we fail to engage effectively with our suppliers we will not be able to deliver the right proposition for our customers.
Maintaining strong and effective relationships with our suppliers will be key as we develop a ‘sell for less culture’ and simplify our ranges. Additionally we need to ensure compliance with Groceries Supply Code of Practice (GSCOP) regulation.
• We work closely with our suppliers to build joint business plans, ensuring a competitive customer offer and a resilient supply base;
• We have a GSCOP compliance framework in place including training for relevant colleagues and processes to monitor compliance; and
• Additionally we have a channel for suppliers to provide feedback and a Code Compliance Officer.
Link to six priorities
1 To be more competitive 5 To simplify and speed up the organisation
2 To serve customers better 6 To make the core supermarkets strong again
3 To find local solutions # Underpins all six priorities
4 To develop popular and useful services
Key
Increase in residual risk
No change
Decrease in residual risk
Viability statement
The Directors have assessed the viability of the Group over a three year period to January 2019.
The Group’s business model is not dependent on any particular contract or resource with fixed end dates; the period was selected because the Group’s forecasts associated with the detailed strategic and financial plans are prepared over this period and were considered to be the most robust and appropriate means to support its viability statement.
As part of the strategic planning process, the Directors make a number of assumptions about business performance and the ability of the Group to raise debt financing. The Group carefully plans and reviews the maturity profile of debt facilities to avoid coterminous maturity dates and liquidity forecasting gives visibility of headroom under committed facilities over the period of the financial plans.
Key metrics in the plan, such as cash flow, interest cover, liquidity and ability to raise debt financing, were subject to sensitivity testing by flexing a number of the main financial assumptions in order to assess the impact of principal risks in severe but plausible scenarios.
Based on this assessment, and taking into account the Group’s current position, the Directors have a reasonable expectation that the Group will be able to continue in operation and meet its liabilities as they fall due over the three year period of their assessment.
19Annual report and financial statements 2015/16

Corporate Responsibility
OUR PRIORITIES WHAT WE’VE DONE WHY IT MATTERS WHAT WE WILL DO NEXT
Sustainable supply chains
With the population set to increase to nine billion people by 2050, and the impacts of climate change impacting on agricultural yields, food security issues are becoming a growing concern for us as a food business and for our customers. We operate a complex and fast paced business. Decisions we take about how we operate and where we buy from must be taken with care.
• Continue to focus on time bound commitments for the responsible sourcing of own brand seafood; and
• Work with own brand suppliers to ensure compliance of our palm oil sourcing policy. We source only Roundtable on Sustainable Palm Oil certified mass balance or segregated palm oil and derivatives within own brand products.
Responsible sourcing
With thousands of products sold in our stores, our supply chain and the people within it span the globe. Effective management of our complex supply chains is key to ensuring brand integrity, risk management and sustainable supply for our own brand products. Our approach combines a risk-based monitoring programme to track suppliers’ compliance with our ethical trading standards, alongside training of suppliers and internal teams to deliver continuous improvement. Media coverage of serious incidents concerning working conditions and hidden exploitation remains topical.
• Work with suppliers in 2016 to meet the updated requirements of the Ethical Trading Policy;
• Deliver further training to relevant technical and commercial teams to build understanding of ethical trading issues, impacts on workers, and our policies and procedures;
• Continue to promote Stronger Together training to raise awareness of modern slavery risks with our suppliers and relevant internal colleagues; and
• Continue to build engagement and influence in relevant external ethical trading networks.
Managing our environmental footprint
The issue of climate change is one of the greatest challenges to the global community. As well as the clear moral case for emissions and water use reduction, changing climate patterns are a material issue for our business as they are a major threat to food security. Effective resource management relating to energy use, transport, refrigeration and waste, all contribute to emissions and are fundamental to managing our costs.
• Continued progress towards 30% absolute reduction in operational carbon emissions by 2020 target;
• Firmly embed and monitor the unsold food to charity programme in all stores; and
• Look at opportunities for further food waste reduction and redistribution of surplus food to provide social benefit across the estate.
Healthy eating and obesity
Childhood obesity is a key focus for the Government and public health organisations. Children consume more sugar than is recommended, with soft drinks the single biggest contributor. Reformulation is one of the most effective ways to reduce sugar consumption. Our ongoing product reformulation, removal of confectionery from the checkout and partnership with Change 4 Life shows our commitment to improving child health.
• Seek supplier partners for sugar reduction projects in key categories and reformulate to maintain our position on salt and to lower sugar levels where possible; and
• Continue to support Change 4 Life, especially its Sugar Swaps campaign.
Community engagement
It’s important that we play a positive role in the communities we serve. We want our stores to be deeply integrated into the local area, supporting community groups, developing local partnerships and helping charities. With the majority of customers and colleagues from local neighbourhoods, we want our stores to actively engage with the local area and be a force for good in the community.
• Ensure a local approach to community and charity activity, working to deliver local solutions in our stores. Celebrating events and supporting local causes that matter in our regions, through our community champion programme;
• Support colleague fundraising and registered charities through the Morrisons Foundation, making a positive difference to people’s lives; and
• Maximise the final year of our national charity partnership with Sue Ryder.
Responsible retailing
1bnfewer calories in
our customers’ baskets over a year
£2.5mraised for Sue Ryder
partnership
£2.5mgiven to support local
causes through Morrisons Charitable Foundation
£15mraised in our stores for
charities and community groups through colleague fundraising and customer
donations
100%British own
brand fresh meat sold in our stores
Continued support of the Change 4 Life campaign
Reported
54%compliance with 2017
salt targets
All stores can now donate unsold food
to charity
Published Ocean Disclosure Project detailing the fisheries we buy from, catch method and issues
KPIs
Updated Ethical Trading Policy, in line with industry best practice, launched in October 2015 with training and practical guidance for
all suppliers
Waste to landfill reduction2.0% 2.0%2.2%3.2%Definition
Measured as our waste from our stores that we are unable to recycle or have processed.
2013 2014 2015 2016
Actively supporting Responsible Fishing
Scheme, ensuring high crew welfare standards
on fishing vessels
Actively promoting the Stronger Together initiative to
suppliers to raise awareness of the risks of worker exploitation and
human trafficking
Removed sweets and chocolate
from checkouts
Three out of three trees in WWF’s UK Timber Sourcing Scorecard
Carbon footprint reduction
2013 2014 2015 2016
24% 21%26%19%Definition Includes energy, waste, refrigeration and transport for our stores, offices, manufacturing and packing facilities.
20 Wm Morrison Supermarkets PLC Strategic report

The full Corporate Responsibility 2015/16 Review will be available for you to download at www.morrisons.co.uk/cr
OUR PRIORITIES WHAT WE’VE DONE WHY IT MATTERS WHAT WE WILL DO NEXT
Sustainable supply chains
With the population set to increase to nine billion people by 2050, and the impacts of climate change impacting on agricultural yields, food security issues are becoming a growing concern for us as a food business and for our customers. We operate a complex and fast paced business. Decisions we take about how we operate and where we buy from must be taken with care.
• Continue to focus on time bound commitments for the responsible sourcing of own brand seafood; and
• Work with own brand suppliers to ensure compliance of our palm oil sourcing policy. We source only Roundtable on Sustainable Palm Oil certified mass balance or segregated palm oil and derivatives within own brand products.
Responsible sourcing
With thousands of products sold in our stores, our supply chain and the people within it span the globe. Effective management of our complex supply chains is key to ensuring brand integrity, risk management and sustainable supply for our own brand products. Our approach combines a risk-based monitoring programme to track suppliers’ compliance with our ethical trading standards, alongside training of suppliers and internal teams to deliver continuous improvement. Media coverage of serious incidents concerning working conditions and hidden exploitation remains topical.
• Work with suppliers in 2016 to meet the updated requirements of the Ethical Trading Policy;
• Deliver further training to relevant technical and commercial teams to build understanding of ethical trading issues, impacts on workers, and our policies and procedures;
• Continue to promote Stronger Together training to raise awareness of modern slavery risks with our suppliers and relevant internal colleagues; and
• Continue to build engagement and influence in relevant external ethical trading networks.
Managing our environmental footprint
The issue of climate change is one of the greatest challenges to the global community. As well as the clear moral case for emissions and water use reduction, changing climate patterns are a material issue for our business as they are a major threat to food security. Effective resource management relating to energy use, transport, refrigeration and waste, all contribute to emissions and are fundamental to managing our costs.
• Continued progress towards 30% absolute reduction in operational carbon emissions by 2020 target;
• Firmly embed and monitor the unsold food to charity programme in all stores; and
• Look at opportunities for further food waste reduction and redistribution of surplus food to provide social benefit across the estate.
Healthy eating and obesity
Childhood obesity is a key focus for the Government and public health organisations. Children consume more sugar than is recommended, with soft drinks the single biggest contributor. Reformulation is one of the most effective ways to reduce sugar consumption. Our ongoing product reformulation, removal of confectionery from the checkout and partnership with Change 4 Life shows our commitment to improving child health.
• Seek supplier partners for sugar reduction projects in key categories and reformulate to maintain our position on salt and to lower sugar levels where possible; and
• Continue to support Change 4 Life, especially its Sugar Swaps campaign.
Community engagement
It’s important that we play a positive role in the communities we serve. We want our stores to be deeply integrated into the local area, supporting community groups, developing local partnerships and helping charities. With the majority of customers and colleagues from local neighbourhoods, we want our stores to actively engage with the local area and be a force for good in the community.
• Ensure a local approach to community and charity activity, working to deliver local solutions in our stores. Celebrating events and supporting local causes that matter in our regions, through our community champion programme;
• Support colleague fundraising and registered charities through the Morrisons Foundation, making a positive difference to people’s lives; and
• Maximise the final year of our national charity partnership with Sue Ryder.
21Annual report and financial statements 2015/16
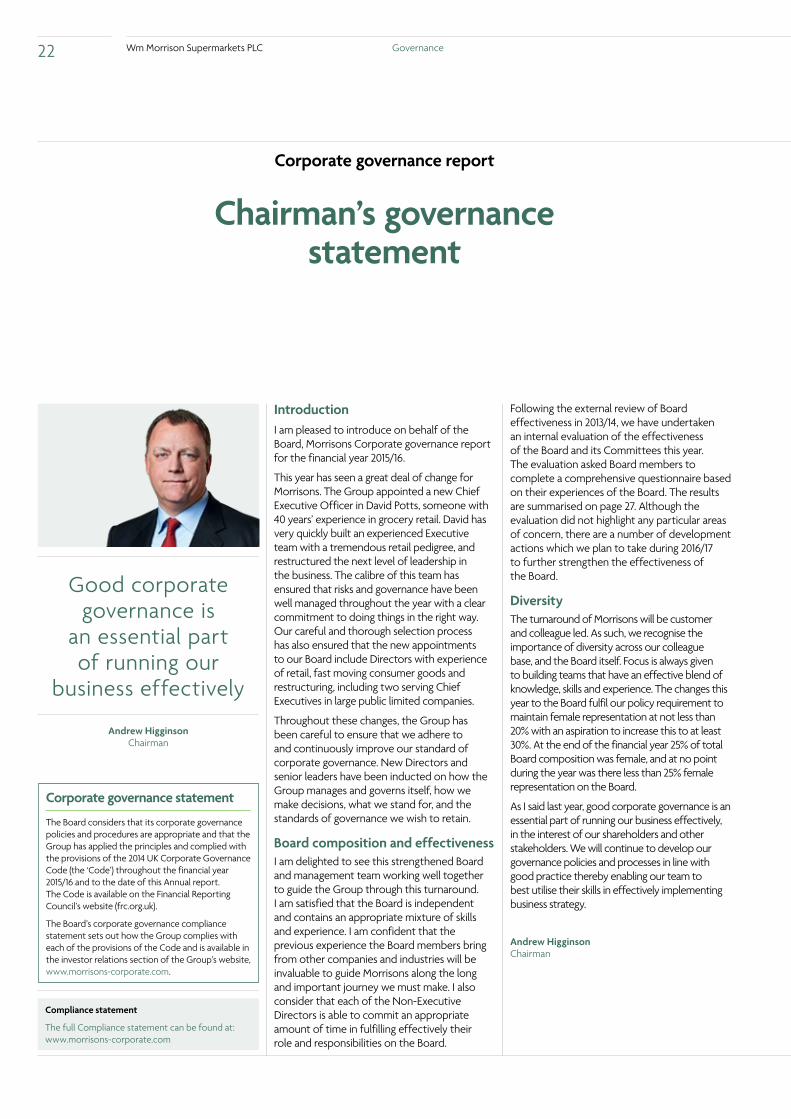
Chairman’s governance statement
Corporate governance report
Introduction
I am pleased to introduce on behalf of the Board, Morrisons Corporate governance report for the financial year 2015/16.
This year has seen a great deal of change for Morrisons. The Group appointed a new Chief Executive Officer in David Potts, someone with 40 years’ experience in grocery retail. David has very quickly built an experienced Executive team with a tremendous retail pedigree, and restructured the next level of leadership in the business. The calibre of this team has ensured that risks and governance have been well managed throughout the year with a clear commitment to doing things in the right way. Our careful and thorough selection process has also ensured that the new appointments to our Board include Directors with experience of retail, fast moving consumer goods and restructuring, including two serving Chief Executives in large public limited companies.
Throughout these changes, the Group has been careful to ensure that we adhere to and continuously improve our standard of corporate governance. New Directors and senior leaders have been inducted on how the Group manages and governs itself, how we make decisions, what we stand for, and the standards of governance we wish to retain.
Board composition and effectivenessI am delighted to see this strengthened Board and management team working well together to guide the Group through this turnaround. I am satisfied that the Board is independent and contains an appropriate mixture of skills and experience. I am confident that the previous experience the Board members bring from other companies and industries will be invaluable to guide Morrisons along the long and important journey we must make. I also consider that each of the Non-Executive Directors is able to commit an appropriate amount of time in fulfilling effectively their role and responsibilities on the Board.
Following the external review of Board effectiveness in 2013/14, we have undertaken an internal evaluation of the effectiveness of the Board and its Committees this year. The evaluation asked Board members to complete a comprehensive questionnaire based on their experiences of the Board. The results are summarised on page 27. Although the evaluation did not highlight any particular areas of concern, there are a number of development actions which we plan to take during 2016/17 to further strengthen the effectiveness of the Board.
DiversityThe turnaround of Morrisons will be customer and colleague led. As such, we recognise the importance of diversity across our colleague base, and the Board itself. Focus is always given to building teams that have an effective blend of knowledge, skills and experience. The changes this year to the Board fulfil our policy requirement to maintain female representation at not less than 20% with an aspiration to increase this to at least 30%. At the end of the financial year 25% of total Board composition was female, and at no point during the year was there less than 25% female representation on the Board.
As I said last year, good corporate governance is an essential part of running our business effectively, in the interest of our shareholders and other stakeholders. We will continue to develop our governance policies and processes in line with good practice thereby enabling our team to best utilise their skills in effectively implementing business strategy.
Andrew HigginsonChairman
Compliance statement
The full Compliance statement can be found at:www.morrisons-corporate.com
Corporate governance statement
The Board considers that its corporate governance policies and procedures are appropriate and that the Group has applied the principles and complied with the provisions of the 2014 UK Corporate Governance Code (the ‘Code’) throughout the financial year 2015/16 and to the date of this Annual report. The Code is available on the Financial Reporting Council’s website (frc.org.uk).
The Board’s corporate governance compliance statement sets out how the Group complies with each of the provisions of the Code and is available in the investor relations section of the Group’s website, www.morrisons-corporate.com.
Good corporate governance is
an essential part of running our
business effectively
Andrew Higginson Chairman
22 Wm Morrison Supermarkets PLC Governance

Board of Directors
Committee key N Nomination Committee
R Remuneration Committee
C Corporate Compliance and Responsibility Committee
A Audit Committee
Committee Chairman
Andrew HigginsonChairman
David PottsChief Executive
Trevor StrainChief Financial Officer
Rooney AnandSenior Independent Non-Executive Director
AppointmentAndrew joined the Group as Deputy Chairman and Chairman Elect in October 2014 and became Chairman at the end of January 2015.
ExperienceAndrew is currently the Chairman of N Brown Group PLC and a Non-Executive Director of Woolworths Holdings Limited (South Africa) and McCurrach UK Limited. Andrew stepped down as a Non-Executive Director of the Rugby Football Union at the end of 2015. Andrew was previously the Chairman of Poundland Group PLC and Senior Independent Director of BSkyB PLC. Andrew was an Executive Director at Tesco PLC for 15 years.
AppointmentDavid joined the Group as Chief Executive on 16 March 2015.
ExperienceDavid is a vastly experienced retailer who joined Tesco PLC at the age of 16 and worked there for 39 years. He rose to become successively CEO of its Ireland business, its UK retail stores business and then CEO of Tesco Asia. David was also on the Tesco PLC Board from 1998 until he left in 2011. Prior to his appointment as CEO of Morrisons, David held several advisory positions with a number of private equity and consultancy firms and developed his own retail concept to sell general merchandise. He also worked on two extensive retail projects in the UK.
AppointmentTrevor joined the Group in June 2009 as Commercial and Operations Finance Director. In June 2011, he became Finance Director Corporate and took responsibility for the Company’s productivity programmes. Trevor joined the Board as Chief Financial Officer on 10 April 2013.
ExperiencePrior to joining Morrisons, Trevor worked for Tesco PLC in a number of roles until his appointment as UK Property Finance Director in 2006 and subsequently UK Planning and Reporting Finance Director. Trevor began his career with Arthur Andersen and is a member of the Institute of Chartered Accountants in England and Wales.
AppointmentRooney joined the Board as a Non-Executive Director and Senior Independent Director on 1 January 2016.
ExperienceRooney is a highly experienced retail and fast moving consumer goods (FMCG) executive. Following a career with United Biscuits and then Sara Lee, he joined Greene King PLC in 2001 as Managing Director of its brewery company. He was appointed CEO in 2005. Rooney is credited with changing Greene King from a regional brewery and pub business, to a brand-led pub, restaurant and hotel operator. In 2015, he completed Greene King’s £770m takeover of the Spirit Pub Group, which made Greene King the largest managed pub group in the UK.
Committee membership
N R C
Committee membership
C
Committee membership
N R C
Neil DavidsonNon-Executive Director
AppointmentNeil joined the Board as a Non-Executive Director on 1 October 2015. He became Chair of the Corporate Compliance and Responsibility Committee on 1 January 2016.
ExperienceNeil has had an extensive career in manufacturing, starting with Northern Foods PLC where he rose to become Managing Director of its milk division. He subsequently became CEO of Express Dairies Plc and then Arla PLC. He has also been a Non-Executive Director of Persimmon PLC and Northern Recruitment Group PLC and the Chair of Leicestershire County Cricket Club. He is currently a Non-Executive Director of Produce Investments PLC.
Committee membership
N R C A
Belinda RichardsNon-Executive Director
AppointmentBelinda joined the Board as a Non-Executive Director on 1 September 2015. She became Chair of the Audit Committee on 1 January 2016.
ExperienceBelinda worked in professional services for over 25 years, where she operated as a senior adviser in corporate finance and strategy. Belinda is currently the Senior Independent Director of Grainger PLC, where she also chairs the Audit and Remuneration Committees, and a Non-Executive Director of Aviva UK Life & Pensions. Belinda serves on the Advisory Group of Audit Committee Chairmen at the Financial Reporting Council and is a member of the Governing Council of the Centre for the Study of Financial Innovation, a not for profit think-tank focused on research in financial services.
Committee membership
N R C A
Irwin LeeNon-Executive Director
AppointmentIrwin joined the Board as a Non-Executive Director on 1 September 2015. He became Chair of the Remuneration Committee on 1 February 2016.
ExperienceIrwin has had a long career in fast moving consumer goods with Procter & Gamble. He rose to Vice President and Managing Director, Procter & Gamble Northern Europe with responsibility for the UK, Ireland, Denmark, Finland, Norway and Sweden. He retired in August 2015 after 30 years with Procter & Gamble.
Committee membership
N R C A
Paula VennellsNon-Executive Director
AppointmentPaula joined the Board as a Non-Executive Director on 1 January 2016.
ExperiencePaula is currently Chief Executive of the Post Office, a role she has held since April 2012. Paula joined the Post Office in 2007. Previously she was Group Commercial Director of Whitbread PLC having started her career with Unilever and L’Oréal. Paula has held directorships in sales and marketing with a number of major retailers including Dixons Stores Group and Argos. She is Non-Executive Chair of First Rate Exchange Services Limited.
Committee membership
N R C A
23Annual report and financial statements 2015/16

Darren BlackhurstGroup Commercial Director
See Directors on page 23 See Directors on page 23
David PottsChief Executive
Trevor StrainChief Financial Officer
Committee key
CCorporate Compliance and Responsibility Committee
AppointmentGary joined Morrisons in August 2015 as Group Retail Director.
ExperienceGary has more than 30 years’ retail experience, with Stewarts Supermarkets in Northern Ireland and then with Tesco PLC where he held a variety of senior positions including Retail Director for Convenience and Retail Director for the North and Northern Ireland. Gary’s experience covers all areas of retail and all formats, including supermarkets and convenience stores.
Gary MillsGroup Retail Director
AppointmentAndy was appointed to Group Marketing and Customer Director in January 2016 having held the interim position for over five months.
ExperienceAndy has been with Morrisons for four years in a number of senior Commercial and Trading roles within the organisation. Prior to joining Morrisons, Andy held a variety of senior commercial roles within Boots, progressing to Commercial Director. Andy started at Coca Cola expanding his career to Walt Disney and then L’Oréal.
Andy AtkinsonGroup Marketing and Customer Director
AppointmentClare joined Morrisons in February 2009 and was appointed Group People Director on 1 September 2015.
ExperienceClare started her career at Asda and held a number of roles both within Head Office and the Retail division. She progressed through a variety of senior HR roles including Head of HR at HBOS/Lloyds Banking Group, where she led a number of programmes to drive differentiation in both sales and services. She joined Morrisons in 2009 holding a number of senior positions in HR. Most recently, Clare was Interim Group Retail Director.
Clare GraingerGroup People Director
Mark AmsdenGroup General Counsel and Company Secretary
AppointmentMark is a qualified lawyer who joined the Group and the Executive Committee in February 2013.
ExperiencePrior to his arrival, Mark spent 25 years with a number of law firms. Between 1998 and 2013, he was a partner in the leading national law firm Addleshaw Goddard LLP (previously Addleshaw Booth & Co), where he specialised in commercial litigation and was Head of the National IT Litigation team. Mark’s clients included many of the UK’s leading companies, including retailers, manufacturers and suppliers.
AppointmentDarren joined Morrisons in June 2015 as Group Commercial Director.
ExperienceDarren started his career at Tesco in 1988, holding a number of buying positions in fresh food and grocery. In 1994, he was seconded to Tesco’s French business Catteau before holding a number of category director positions. Darren became Commercial Director for Tesco Lotus Thailand in 2002. He joined Asda in 2006 as Executive Trading Director for Food and in 2008 was appointed Chief Merchandising Officer. In 2011, he joined Matalan as Chief Executive before moving to B&Q as Commercial Director in 2014.
Committee membership
C
Executive Committee
Committee membership
C
24 Wm Morrison Supermarkets PLC Governance

Corporate governance report continued
Leadership
Structure of the Board and its Committees
PLC BoardKey objectives: Overall conduct of the business and strategy setting
PLC Board ChairmanKey objective: Governance of the Board
Remuneration Committee
Key objectives
Development and implementation of the Group’s
remuneration framework and policies for Directors and colleagues including all incentives, bonuses
and pensions.
Corporate Compliance and Responsibility
Committee
Key objectives
Development and implementation of the
Group’s policies on corporate compliance and corporate
responsibility. Reviewing and ensuring compliance with
those policies and ethical and governance standards.
Audit Committee
Key objectives
Effective governance of financial reporting, internal controls
and risk management systems; review of significant accounting judgements, assumptions and estimates; management of the
relationship and appointment of the external auditor; monitoring and review of the effectiveness of the Group’s Risk and Internal
Audit function.
Executive Committee
Key objectives
Implementation of strategy and actions in respect of financial planning and performance; day-to-day management
of operations.
Nomination Committee
Key objectives
Advice to the Board on Board and senior management
appointments and succession planning; monitoring of the
composition of the Board and its Committees.
PLC Board
MEMBERS1,2 Andrew Higginson, David Potts, Trevor Strain, Irwin Lee, Belinda Richards, Neil Davidson, Paula Vennells, Rooney Anand
KEY OBJECTIVE Overall conduct of the business and strategy setting.
RESPONSIBILITIES • Development and approval of the strategy and key policies of the Group;
• Management of culture and values;
• Monitoring of progress towards achieving all Board objectives;
• Monitoring of financial performance, critical operational issues and risks by reviewing of performance against strategy, objectives, business plans and budgets;
• Formal approval of the Group’s Risk Register;
• Approval of all communications to shareholders, including the Annual report and financial statements, half-yearly financial report and interim management statements;
• Approval of changes to the Group’s capital structure, external financial reports, major expenditure; and
• Approval of membership of the Board on recommendation of the Nomination Committee.
1 All Non-Executive Directors are independent.2 The Board changed through the year as per the attendance at meetings table on page 26.
Throughout the year, the majority of the Board consisted of independent Non-Executive Directors. There were five Non-Executive appointments made to the Board (Irwin Lee, Belinda Richards, Neil Davidson, Paula Vennells and Rooney Anand) to replace the four Non-Executive Directors who stepped down (Richard Gillingwater, Philip Cox, Penny Hughes and Johanna Waterous).
Board responsibilities
The formal schedule of matters reserved for the Board remains unaltered from 2014/15 and is set out in the corporate governance compliance statement which can be found in the investor relations section of the Group’s website, www.morrisons-corporate.com.
The Board is committed to a clear division of responsibilities between the Chairman and the CEO. This has been reviewed by the Board during the year and is also set out in the Corporate governance compliance statement.
25Annual report and financial statements 2015/16

Senior Independent Director
Rooney Anand, who is the current Chief Executive of Greene King Plc, replaced Philip Cox in the role of Senior Independent Director on 1 January 2016.
Rooney Anand was appointed to the Board on 1 January 2016 and has extensive knowledge of the retail and fast moving consumer goods industries.
The Senior Independent Director provides shareholders with an alternative contact to the Chairman, the CEO and the CFO.
Board activities in 2015/16
The Board’s focus in this financial year was:
• review of results and forecasts and approval of regulatory announcements;
• the conduct of the business in accordance with its values;
• review of the recommendation from the Nomination Committee in respect of the appointment of David Potts;
• approving the restructure of the Executive Committee following the appointment of David Potts;
• approving new Non-Executive Director appointees to the Board;
• review of the performance of the CEO;
• review of the governance structure and activities of the subcommittees of the Board;
• review of the annual business plan and monthly updates from the Executive Committee regarding its delivery; and
• review of the 2016/17 budget and commercial plans regarding our core supermarkets, including productivity savings required to invest in the core offer.
Attendance at meetingsBoard Nomination Remuneration Audit CCR
Andrew Higginson 8/8 7/7 7/7 – 6/6Dalton Philips1 – – – – –David Potts2 6/6 – – – 4/4Trevor Strain 8/8 – – – –Irwin Lee3 3/3 2/2 2/2 2/2 2/2Belinda Richards4 3/3 2/2 2/2 2/2 2/2Neil Davidson5 2/2 1/1 2/2 2/2 2/2Paula Vennells6 1/1 – 1/1 1/1 1/1Rooney Anand7 1/1 – 1/1 – 1/1Richard Gillingwater8 2/4 2/3 3/3 2/3 1/2Philip Cox9 7/7 6/6 7/7 5/5 3/3Penny Hughes10 7/7 6/6 7/7 5/5 5/5Johanna Waterous11 7/8 6/7 7/7 5/6 4/51 Dalton Philips stepped down from the Board, Remuneration Committee and CCR Committee in February 2015.2 David Potts was appointed to the Board in March 2015 and appointed as a member of the CCR Committee in September 2015. 3 Irwin Lee was appointed to the Board, Nomination, Remuneration, Audit and CCR Committees in September 2015. He took over Chair of the Remuneration Committee in February 2016. 4 Belinda Richards was appointed to the Board, Nomination, Remuneration, Audit and CCR Committees in September 2015. She took over Chair of the Audit Committee in January 2016. 5 Neil Davidson was appointed to the Board in October 2015. He was appointed to the Nomination, Remuneration, Audit and CCR Committees in November 2015. He took over Chair of the CCR
Committee in January 2016.6 Paula Vennells was appointed to the Board, Nomination, Remuneration, Audit and CCR Committees in January 2016.7 Rooney Anand was appointed to the Board, Nomination, Remuneration and CCR Committees in January 2016.8 Richard Gillingwater stepped down from the Board, Nomination, Remuneration, Audit and CCR Committees in June 2015.9 Philip Cox was appointed to the CCR Committee in July 2015. He stepped down from the Board, Nomination, Remuneration, Audit and CCR Committees in December 2015.10 Penny Hughes stepped down from the Board, Nomination, Remuneration, Audit and CCR Committees in December 2015.11 Johanna Waterous stepped down from the Board, Nomination, Remuneration Audit and CCR Committees in January 2016.
Corporate governance report continued
From 1 January 2016, Belinda Richards succeeded Philip Cox as Chair of the Audit Committee and Neil Davidson succeeded Penny Hughes as Chair of the Corporate Compliance and Responsibility Committee. Irwin Lee succeeded Johanna Waterous as Chair of the Remuneration Committee on 1 February 2016.
Board Committees
The decisions delegated by the Board to its Committees and the activities of those Committees during the financial year 2015/16 are described within each Committee’s report below.
During the year, the Company considered the changes recommended by the 2014 UK Corporate Governance Code (the ‘Code’) and implemented those changes, as appropriate throughout the Group.
The corporate governance compliance statement contains the terms of reference of the Committees and these have been updated during this year to take into account changes in the Code.
26 Wm Morrison Supermarkets PLC Governance

Effectiveness
Non-Executive Directors The Non-Executive Directors bring a varied range of skills and experience to the Group. Details of their experience outside the Group are set out in their respective biographies on page 23.
The Board is satisfied that all Non-Executive Directors, including the Non-Executive Chairman, remain independent according to the definition contained in the Code. The criteria used to determine independence are set out in the corporate governance compliance statement, which can be found in the investor relations section of the Group’s website, www.morrisons-corporate.com.
The minimum time commitment expected of the Non-Executive Directors is 12 days per year, including attendance at the AGM, Board away days and site visits, plus adequate preparation time. The Board is satisfied that each of the Non-Executive Directors commits sufficient time to the business of the Group and contributes to the governance and operations of the Group. This has been confirmed by the Board effectiveness evaluation referred to below.
The Chairman arranges regular discussions between all the Non-Executive Directors (including himself) as a group without management present.
Board evaluationThe Board arranges for its own performance, and that of its Committees and Directors, to be reviewed annually. This is usually facilitated by an external agency every three years with the most recent external review taking place in 2013/14.
In 2015/16, the Board’s effectiveness, and that of its Committees, was the subject of an internal review led by the Chairman and the Company Secretary.
The evaluation asked each member of the Board to complete a comprehensive questionnaire based on their experiences covering the following key areas:
• overall Board and committee effectiveness;
• the work of the Board, including the approach to control, risk, strategy and transactions, and the regulatory environment;
• organisation and conduct of Board meetings;
• timing and content of Board papers;
• maximising its use of time;
• Board and senior management succession;
• training and awareness; and
• overall Director performance.
Responses were collated by the Company Secretary and discussed with the Chairman.
The review concluded that the Board operates well and cohesively, although it was appreciated that there had been considerable change to the composition of the Board, towards the end of the year.
The agreement to move to fewer but more efficient Board meetings came into full effect in 2015/16. As part of their induction programme for all new Board appointees, they visited numerous stores, distribution centres and manufacturing sites. They have and will continue to spend time with customers through customer listening groups to understand their views.
The length and tone of Board papers will continue to be the subject of focus during 2016/17 with a view to further improvement and ensuring that papers provide insightful and quality data in a concise manner.
The performance of the Chairman is evaluated annually by the Directors. Appraisals of the Non-Executive Directors’ performance are conducted by the Chairman following discussion with Board members.
Executive Directors are included in the Group’s performance appraisal process, which includes setting clear and measurable objectives and reviewing performance against those objectives on a bi-annual basis. The Chairman and Non-Executive Directors are responsible for monitoring and reviewing the performance of the CEO, who in turn is responsible for monitoring the performance of the CFO.
During the year the Board also reviewed and considered the effectiveness of its principal advisers.
MembershipAs described earlier in this report, the Board has been strengthened by five carefully selected and highly experienced appointments. The Nomination Committee considers that the Board and Executive Committee contain the skills and experience necessary in light of the Group’s current activities and strategic direction.
Re-election of DirectorsAll the current Directors submit themselves for re-election at the AGM to be held on 9 June 2016. After reviewing the outcome of performance evaluations, the Board confirms that the contributions made by the Directors offering themselves for re-election at the AGM in June 2016, continue to be effective and that the Company supports their re-election.
Directors’ interestsThe interests of the Executive and Non-Executive Directors of the Company, and their immediate families, in the shares of the Company, along with share options, are contained in the Directors’ remuneration report set out on pages 33 to 43. At no time during the year did any of the Directors have a material interest in any significant contract with the Company or any of its subsidiaries.
27Annual report and financial statements 2015/16
Executive Committee activities in 2015/16The Executive Committee’s focus in this financial year was:
• driving trading performance;
• reducing the cost base of the organisation;
• identifying the Group’s six priorities;
• restructuring the Leadership Team;
• approval of capital budgets;
• determining the draft budget and long term plan;
• periodic review of performance against strategic objectives;
• determination of principal risks for the Group;
• disposal of the M local convenience chain;
• approval of the pilot scheme with Motor Fuel Group;
• review of changes to speed up and simplify the business; and
• review of IT development as the business rolled out the Oracle software upgrade.
Executive Committee
MEMBERS6
David Potts1, Trevor Strain, Mark Amsden, Darren Blackhurst2, Gary Mills3, Clare Grainger4, Andy Atkinson5
KEY OBJECTIVES
Implementation of strategy and actions in respect of financial planning and performance; day-to-day management of operations.
RESPONSIBILITIES
• Development and implementation of strategy;• Oversight of:
– financial performance, reporting and control; – risk management; – operational improvement programmes; and – review and supervision of operational activities.
• Making recommendations to the Board in respect of:
– budgets and long term plans; – dividend levels; and – ad-hoc events;
• Succession planning for senior management.
1 David Potts was appointed as CEO in March 2015. 2 Darren Blackhurst was appointed in June 2015.3 Gary Mills was appointed in August 2015.4 Clare Grainger was appointed in September 2015.5 Andy Atkinson was appointed in January 2016.6 Dalton Philips stepped down in February 2015, Neal Austin,
Nick Collard, Martyn Fletcher, Mark Harrison, Gordon Mowat and Nigel Robertson stepped down in March 2015. Casper Meijer stepped down in April 2015, Emily Lawson stepped down in June 2015 and Martyn Jones stepped down in October 2015.
The previously named Management Board was renamed as the Executive Committee on the 13 April 2015. The roles and responsibilities of this body remained unchanged.
Audit Committee report
MEMBERS1
Belinda Richards (Chair), Irwin Lee, Neil Davidson, Paula Vennells
KEY OBJECTIVES
Effective governance of financial reporting, internal controls and risk management systems; review of significant accounting judgements, assumptions and estimates; management of the relationship and appointment of the external auditor; monitoring and review of the effectiveness of the Group’s Risk and Internal Audit function.
RESPONSIBILITIES
The Board has delegated to the Audit Committee the responsibility for reviewing on its behalf and making recommendations to the Board as to:• the integrity of financial reports, including
reviewing significant financial reporting issues and considering how these issues have been addressed;
• whether the Annual report is fair, balanced and understandable;
• the effectiveness of the Group’s internal control and risk management system;
• the effectiveness of the Risk and Internal Audit function; and
• the independence and appointment of the external auditor and approval of their fees.
1 The Committee membership changed through the year as per the attendance at meetings table on page 26.
Corporate governance report continued
28 Wm Morrison Supermarkets PLC Governance
Financial reporting matters
Summarised below are the financial reporting matters and key accounting judgements reviewed by the Committee during the year:
Impairment of property, plant and equipment, intangible assets and onerous property commitmentsThe Group assesses impairment on an annual basis, or where changes in circumstances result in a risk of impairment, as disclosed in note 3.1 of the financial statements. The impairment review includes non-financial assets, principally the Group’s property portfolio, IT assets and goodwill.
The Group’s trading performance and evidence of the market value for properties disposed of during the year were factors considered by the Group as part of the annual impairment review. Management also estimated the recoverable amount of all impacted assets to determine the extent of any impairment charge or whether a reversal of a previous impairment charge was applicable. This assessment confirmed the carrying value of assets remained appropriate with no changes to the previous impairment, as disclosed in note 1.4 in the financial statements.
The Committee reviewed the Group’s assessment of recoverable value and reassessed the key assumptions and judgements made in the light of current market conditions and trading performance. The Committee has understood management’s key assumptions including the market valuations of the stores. It has also reviewed the methodology and approach to forecast store cash flows, which remains consistent with the prior year.
In addition, for leasehold arrangements where the expected future benefits from a store are less than the future lease commitment, the Committee reviewed the judgements required in recognising onerous lease provisions.
The Committee discussed the sensitivity of key assumptions along with their impact on the impairment and onerous lease provisions and is satisfied the assumptions applied by management are appropriate.
Audit Committee ChairThe Board is satisfied that Belinda Richards has recent and relevant financial experience appropriate to her position as Chair of the Audit Committee. Belinda is considered to have sufficient financial experience, having been a corporate finance partner at Deloitte for over ten years. Additionally, she serves on the Advisory Group of the Audit Committee Chairmen at the Financial Reporting Council and is a member of the Governing Council of the Centre for the Study of Financial Innovation.
Audit Committee activities in 2015/16During the year, the Committee has:
• considered the appropriateness of the Group’s Annual report and financial statements and Half-yearly report;
• reviewed the effectiveness of the internal controls and the work of Risk and Internal Audit and discussed key risks (described in more detail on pages 17 to 19);
• considered systems design, implementation and related project management in respect of changes to the Group’s financial reporting systems and processes;
• reviewed key policies including those governing tax, treasury, expenses and corporate hospitality;
• reviewed and discussed the recognition of commercial income and the controls in place over compliance with Groceries Supply Code of Practice; and
• discussed the new Governance Code and reporting requirements.
In respect of financial reports, the Committee’s focus was:
• the accounting judgements made by management that could have a significant effect on the Group’s financial results;
• oversight of IT changes affecting financial systems and controls;
• the clarity of disclosure of financial information; and
• whether the Annual report, taken as a whole, is fair, balanced and understandable – the Directors’ statement on this can be found on page 46 of this Annual report.
Commercial incomeCommercial income is a deduction from the cost of purchase and it is recognised in accordance with signed supplier agreements, with most of this income subject to little or no subjectivity or judgement.
The Group’s definition of commercial income is disclosed in note 1.1 of the financial statements and is consistent with the definition in the prior year.
Commercial income continues to be an area of focus for the committee – both recognition and compliance with the Groceries Supply Code of Practice.
During the year, the Committee has considered the judgements made by management over accounting for commercial income, including reviewing the level of commercial income recognised. In addition, the Committee continues to ensure the Group looks to provide disclosure on the various types of commercial income, accounting policies and judgements. The Group provides detailed balance sheet disclosure in this area including specific reference to the level of accrued and deferred income. The Committee is satisfied with management’s clarity and transparency in this area.
In considering the appropriateness of commercial income recognised in the year and the financial position at the year end, the Committee has reviewed reports from management outlining the accounting judgements and the control environment. In reviewing the assumptions made by management, the Committee challenged and understood the key assumptions and judgements.
The Committee considered the effectiveness of the operation of key controls, through review of management’s work and that of Internal Audit. The Committee considered the frequency of the operation of controls, the size of samples and discussed with management how controls could be further improved. The Committee has had regular updates from both management and Internal Audit regarding the operational effectiveness of controls.
29Annual report and financial statements 2015/16

IT systemsThe Group has completed a multi-year programme of upgrading and developing its core IT systems, the cost of which is a material element of capital expenditure for the current year.
There have been a number of key implementations this year which will support the delivery of the Group’s strategy and provide improved data and insight. The Committee has monitored progress against system implementation plans and also reviewed an assessment of the implementations during the year to evaluate the success of the systems migration.
The Committee has considered the nature of costs being capitalised and is satisfied that costs have been capitalised in line with the Group’s policy as disclosed in note 3.1 in the financial statements.
The Committee has considered the risk of impairment and assumptions made by management supporting the carrying value and concluded that these are appropriate.
StockStock is a material balance in the Group’s financial statements, with stock held across a large number of locations. Stock count procedures have remained consistent with prior year.
Judgement is required in determining provisions for shrinkage and other stock provisioning and the Committee reviews these judgements as part of the annual policy review.
The Committee has reviewed and understood the impact the IT systems implementation has had on the margin and stock processes.
The Committee has reviewed the level of stock provisioning and key assumptions underpinning the provisions and consider these to be appropriate.
Internal control and risk managementThe Board has overall accountability for ensuring that risk is effectively managed across the Group. Risks are reviewed by the Executive Committee for all functions annually and results are brought to the Board. On behalf of the Board, the Audit Committee has responsibility for reviewing the effectiveness of internal control including financial, operational and compliance controls.
The Group’s principal risks are set out on pages 18 to 19.
In order to do this, as a matter of course in any one year, the Committee:
• receives and agrees appropriate actions in response to regular reports from the Risk and Internal Audit function on:
– the status of internal control and risk management systems across the Group;
– the department’s findings, annual plan and the resources available to it to perform its work; and any concerns expressed by colleagues about possible malpractice or wrongdoing;
• reviews financial whistle-blowing reports from colleagues;
• reviews the external auditor’s management letter on internal financial control;
• seeks reports from senior management on the effectiveness of the management of key risk areas; and
• monitors the adequacy and timeliness of management’s response to identified audit issues.
These systems and processes have been in place throughout the period and up to the date of approval of this Annual report.
The main features of the Group’s internal control and risk management systems relating to the accuracy and reliability of financial reporting, including the process for preparing consolidated accounts, are:
• recruitment of suitably qualified and experienced finance colleagues;
• segregation of duties, clear lines of accountability and delegation of authority;
• policies and procedures that cover financial planning and reporting, preparation of financial information, and capital expenditure;
• a robust period end review process including review and commentary from process owners;
• a tiered review process for external financial reports involving internal stakeholders from relevant areas of the business;
• information and data security policies and procedures; and
• self certification by each section of the business.
The Audit Committee regularly reviews the Group’s process for risk management and internal control and annually conducts a formal review of these processes. No significant failings or weaknesses of internal control were identified during these reviews. Limited weaknesses and areas where controls could be further automated were identified, clear action plans are in place to address
Corporate governance report continued
these weaknesses and are captured as part of functional risk registers with defined management responsibility. The Committee understands the importance of a robust risk management process and control environment and look to progressively strengthen it over time.
Effectiveness and independence of the external auditor The Committee considered the effectiveness of PricewaterhouseCoopers LLP (PwC) as auditor over the last year. In making this assessment the Audit Committee has considered the information presented by the auditors, management responses to the auditor’s findings, including any adjustments and the level of non-audit fees.
The Committee holds meetings with the auditor without management present. The purpose of these meetings is to understand the auditor’s views on the control and governance environment and management’s effectiveness within it. To fulfil its responsibilities in respect of the independence and effectiveness of the external auditor, the Committee reviewed:
• the terms, areas of responsibility, duties and scope of work of the external auditor as set out in the engagement letter;
• the audit work plan for the Group;
• the detailed findings of the audit, including a discussion of any major issues that arose during the audit;
• the letter from the external auditor confirming its independence and objectivity; and
• the audit fee and the extent of non-audit services provided during 2015/16.
The policy on the engagement of the external auditor to supply non-audit services is set out in the investor relations section of the Group’s website (see www.morrisons-corporate.com). PwC has continued to provide non-audit services throughout the year. In the year the ratio of audit to non-audit services was within the 1:0.7 limit set in the policy.
The Committee believe that this non-audit activity carried out by the statutory auditors is subject to safeguards to avoid a threat to the auditor’s independence or objectivity. These safeguards comprise separate teams for audit versus non-audit work.
30 Wm Morrison Supermarkets PLC Governance

Nomination Committee’s activities in 2015/16Selection processThe Nomination Committee is responsible for succession planning and the recommendation of Director appointments to the Board. The Committee considers the size and composition of the Board on an ongoing basis.
The Committee will consider the skills of outgoing and remaining Board members to assess any gaps and develop a candidate profile. The Board uses external search consultancies to source suitable candidates. The Committee recommend appointments on merit against the criteria applied in developing the candidate profile and taking into account the mix of skills, experience and diversity on the Board.
Appointment of Chief Executive Officer and Non-Executive DirectorsFollowing the decision to search for a new CEO, the Committee discussed and approved a job role. For selection of both the CEO and Non-Executive Directors, the Company appointed Ridgeway Partners to assist in identifying a long list of candidates with the requisite skills and experience for the role. Ridgeway were deemed independent with no other connections to the Group.
After an extensive and international search, four candidates were shortlisted and interviewed by the Board, resulting in the appointment of David Potts who joined the Board as CEO on 16 March 2015.
The Board used the same rigorous approach to recommend potential Non-Executive Directors for the Board’s approval.
InductionAll Directors are provided with a comprehensive, formal and tailored induction to the business.
The programme is designed to provide the joining Director with a comprehensive introduction to the business and included the following:
• review of Board/Committee minutes and supporting papers for recent meetings;
• meeting with the Company Secretary to provide a briefing on Board/Committee processes and procedures and governance structure;
• store and other site visits; and
• meetings with senior management.
CCR activities in 2015/16The Committee’s focus in this financial year was a review of:
• cyber and IT security risk;
• health and safety incidents and actions taken and progress of health and safety initiatives;
• energy strategy and carbon reduction measures;
• ethical trading;
• redistribution of food waste;
• food safety and improvements;
• food integrity and testing;
• Groceries Supply Code of Practice compliance including training and results of internal reviews; and
• non-financial whistle-blowing reports.
Remuneration Committee report
The report from the Remuneration Committee is contained in the Directors’ remuneration report on pages 33 to 43.
Nomination Committee report
MEMBERS1
Andrew Higginson, Irwin Lee, Belinda Richards, Neil Davidson, Rooney Anand, Paula Vennells
KEY OBJECTIVES
Advice to the Board on Board and senior management appointments and succession planning; monitoring of the composition of the Board and its Committees.
RESPONSIBILITIES
• Evaluating the current and required mixture of skills and experience on the Board; and
• Sourcing and selecting candidates.
1 The Committee membership changed through the year as per the attendance at meetings table on page 26.
External audit tender As noted in last year’s Annual report, the Board appointed PwC as external auditor in June 2014. The Company confirms that it has complied with the provisions of the Competition and Markets Authority’s Order in respect of The Statutory Audit Services for Large Companies Market Investigation (Mandatory Use of Competitive Tender Processes and Audit Committee Responsibilities) Order 2014 – statement of compliance.
Corporate Compliance and Responsibility (CCR) Committee
MEMBERS1,4
Neil Davidson (Chair), Andrew Higginson, David Potts, Irwin Lee, Belinda Richards, Paula Vennells, Rooney Anand, Mark Amsden, Andrew Clappen2, Darren Blackhurst3
KEY OBJECTIVES
Development and implementation of the Group’s policies on corporate compliance and corporate responsibility. Reviewing and ensuring compliance with these policies and ethical and governance standards.
RESPONSIBILITIES
Oversight that the business is doing the right thing in areas of corporate responsibility, including:
• food safety;
• health and safety;
• ethical trading;
• environmental and competition compliance;
• Groceries Supply Code of Practice;
• governance and reputation; and
• Morrisons Foundation.
Generally ensuring that the Company is acting as a good corporate citizen.
1 The Committee membership changed through the year as per the attendance at meetings table on page 26.
2 Andrew Clappen (Group Corporate Services Director) was appointed to this Committee in September 2015.
3 Darren Blackhurst was appointed to this Committee in September 2015.
4 Martyn Jones stepped down from this Committee in October 2015.
31Annual report and financial statements 2015/16
DiversityThe Board recognise the benefits of a diverse colleague base across the Group and is supportive of initiatives with the business to improve diversity at all levels.
The Company still seek to increase female representation in the Leadership Team to at least 30%. This target has not yet been achieved and the Board recognise that more work is needed in this area. Recruitment and promotion policies have been reviewed with a view to attracting candidates with a wide range of backgrounds and experience, ensuring that the best individual for the role is appointed. Specific targets have not been set as it is considered that they may drive the wrong behaviours. However, guidelines are in place to ensure that the longlist for any particular vacancy at management level includes a balanced profile of candidates.
Particular focus has been given throughout the year on increasing female representation in the Retail Team. This work has seen a 13% rise in female representation in Regional Managers or above.
Progress on the diversity agenda is measured through regular functional talent reviews. These reviews consider the ethnicity, gender, age and length of service of all colleagues in Morrisons.
At the end of the 2015/16 financial year the Board included two women members, 25% of its total composition. The Board’s policy is that female representation should be maintained at not less than 20% and aspires that this should be higher than 30%. This policy will continue to be considered as part of the Nomination Committee’s regular review of the Board’s composition and skills.
Other areas of focusThe Committee also spent time reviewing succession planning for both the Board and Executive Committee as well as of the talent pool for levels below Executive Committee.
Matters dealt with elsewhere in the Strategic report
The way the Group generates value and the Board’s strategy for delivering the Group’s objectives are described in the Business model on pages 4 to 5, and the Six priorities section on pages 8 to 9. The information regarding the Takeover Directive disclosures are on page 44. The consideration of Going Concern is described on page 44. The Viability statement is on page 19.
Annual General Meeting
All Executive Directors and Non-Executive Directors attend the AGM unless unable to do so due to circumstances outside of their control.
Notice of the 2016 AGM of the Company is to be sent to shareholders with an accompanying letter from the Chair. The AGM will be held at the Company’s headquarters at Gain Lane in Bradford on 9 June 2016. Format of the meeting:
• a summary presentation of results is provided before the Chairman deals with the formal business;
• all shareholders present can question the Chairman, Chairmen of the Committees and the Board during the meeting and informally afterwards;
• the Board encourages participation of individual investors at the AGM; and
• following the meeting, details of the voting on the resolutions will be made available on the website www.morrisons-corporate.com/Investor-centre/generalmeetings/
The Directors recommend shareholders vote in favour of each resolution, believing them to be in the best interests of the Group. Shareholders will be notified of the availability of the Annual report and financial statements on the website unless they have elected to receive a printed version.
Relations with shareholders
The Board is committed to communicating the strategy to analysts, investors and shareholders on a regular basis through a planned programme.
The Investor Relations programme includes:
• formal presentations of full and half year results;
• interim management statements;
• regular meetings between institutional investors, the CEO, the CFO and the Investor Relations team in the UK and the US following the full and half year results;
• regular meetings between the Chairman and major shareholders to discuss any aspect of the Group or its governance arrangements;
• attending key investor conferences;
• communication between the Chairman of the Remuneration Committee and major shareholders on remuneration policy and significant changes in remuneration arrangements;
• responding to enquiries from shareholders and analysts through the Investor Relations team; and
• dedicated shareholder and investor sections on the website.
In addition, the Investor Relations team provides a regular update to the Board and feedback from meetings held between executive management and institutional shareholders. The Group’s brokers seek independent feedback from analysts and investors following the full and half year results meetings which is reported to the Board.
Corporate governance report continued
32 Wm Morrison Supermarkets PLC Governance

Annual statement by the Chairman of the Remuneration Committee
How we are rewarded
Directors’ remuneration report
Irwin LeeChairman of the Remuneration
Committee
Dear Shareholder
On behalf of the Remuneration Committee and the Board, I am pleased to present the Directors’ remuneration report for the financial year 2015/16, my first as Chairman of the Remuneration Committee.
Our remuneration policy was approved by shareholders at the 2015 AGM following extensive engagement with major shareholders and investor representative bodies.
The Committee believe that this framework continues to support and promote the link between pay and performance and there are no changes proposed at this time. Key features of our current framework are summarised in the sidebar.
The Committee intend to carry out a comprehensive review of the remuneration policy framework during the year to present to shareholders for approval. We will be consulting with major shareholders on these proposals and I look forward to your input and feedback.
The Committee noted the significant number of votes against the Directors’ remuneration report for last year and during the year discussions took place with a number of institutional shareholders who didn’t support the remuneration report. We continue to try to incorporate the feedback we receive and this year we have sought to significantly improve the level of retrospective bonus target disclosure so that investors can clearly see the link between pay outcomes and the performance delivered.
In the remainder of this introductory statement, I have set out the key features and principles of our executive remuneration framework, a summary of the out-turns in respect of 2015/16 performance, and how we intend to implement the policy in 2016/17.
Key features of our executive framework
Salary• Market competitive fixed remuneration
reflecting skills and expertise.
Benefits and pension• Market competitive benefits package. • Executive Directors may receive a maximum
cash pension allowance of 25% of salary.
Annual bonus• Maximum opportunity 200% of salary.• Performance-related remuneration based
on targets aligned to our annual financial and operational strategic objectives.
2016/17
Underlying PBT 50%
Strategic measures 30%
Personal performance 20%
• 50% of any bonus deferred for three years• Malus and clawback apply.
LTIP• An opportunity to earn Morrisons shares based
on performance against key strategic metrics over a three year performance period.
• Maximum normal award opportunity 240% of salary.
• Awards made in 2016 will be subject to the following performance measures:
2016
Free cash flow 60%
Underlying EPS 20%
Total sales 20%
• Malus and clawback apply.
Shareholding guidelines• 200% of salary.
33Annual report and financial statements 2015/16

Remuneration principles and alignment to strategyOur remuneration framework continues to be based on the following key principles:
• The structure of our incentives is designed to align with the delivery of the short and long term objectives set out in our strategy, which also aligns with the creation of sustainable long term shareholder value.
• We encourage a strong and rigorous performance culture through a remuneration package heavily weighted towards performance-related pay, with stretching performance targets calibrated to appropriately reflect the challenging environment.
• Pay must be positioned competitively in our key talent markets to ensure we can attract people of the calibre needed to execute the strategy for shareholders.
Incentive out-turns for 2015/16
Annual bonus The annual bonus targets for 2015/16 reflected our strategic objectives for the year in the context of a challenging and transitional environment for UK retailers.
We entered 2015 in the context of a declining market and the big four grocers losing further market share. To address these challenges, a new Executive team was put together under the leadership of David Potts, head office costs were reduced, the business was refocused on core supermarkets, and many changes were made to our customer offer and ways of working.
These changes have begun to show some stabilisation effect, with improving customer satisfaction, and positive Christmas trading results for the first time in four years.
Performance was based 50% on underlying profit before tax, 30% on a strategic scorecard and 20% on personal objectives. Strategic scorecard measures focused on objectives in the areas of like-for-like sales (20%) and cost reduction (10%) and were underpinned by personal objectives.
As discussed in more detail on page 11 of the Annual report, performance against these measures was strong. Underlying PBT, adjusted for restructuring one-off costs, of £302m was above the target set in the context of the current environment.
Like-for-like sales growth of (2%) (more than double our achievement for 2014/15) was also above target; and operational cost savings of £227m significantly exceeded target. This performance resulted in annual bonus awards of 73% of maximum for David Potts and Trevor Strain.
LTIPNo LTIP awards vested in respect of the reporting year. Performance for the 2013/16 LTIP awards was based 75% on underlying EPS growth and 25% on like-for-like non-fuel sales growth, relative to the Institute of Grocery Distribution (IGD) index over a three year period. Performance against both measures was below threshold and therefore no vesting will occur.
Actions in 2015/16
LTIP targets for 2015 awards As explained in last year’s Directors’ remuneration report, the Committee decided to wait to set performance targets for LTIP awards made in April 2015 to allow David Potts, who joined in March 2015, time to assess the business and the wider market and provide his input into the formation of a long term business plan.
The targets were agreed in Autumn and published on the corporate website. Full details of the targets for the 2015/18 awards can be found on page 40.
Decisions for 2016/17
Base salaryDavid Potts was appointed as Chief Executive on 16 March 2015 on a base salary of £850,000. Following the salary review, the Committee proposed an increase of 2.5% which was broadly in line with the increase across the business. However, David Potts waived the increase and his salary for the year ahead will remain unchanged.
Trevor Strain was promoted to the role of CFO in April 2013 on a base salary below that of his predecessor. In reviewing his salary, the Committee has continued to take into account the considerable progress made by the CFO in the period since his appointment, his substantial contribution to the business during this time of significant transition and the addition of Property, Popular and Useful services and Strategy to his responsibilities.
As flagged last year, and with our major investors during consultation in the year, the Committee’s preference has been to stage increases over time. Therefore, following the increase awarded last year, a second phased increase of 9.5% has been agreed, effective 1 February 2016, taking his salary to £575,000.
IncentivesAnnual bonus The performance measures and weightings will be the same as for the 2015/16 annual bonus. The performance targets will be disclosed in next year’s report.
LTIP Awards will be 240% of base salary. Performance measures and weightings for LTIP awards to be granted in 2016/17 remain: cumulative free cash flow (60%); underlying EPS (20%); total sales (20%). For the underlying EPS element, the Committee has decided to move to a target range based on percentage growth in underlying EPS measured from a 2015/16 base on a compound per annum basis.
Structure of this reportThe remainder of the report is split into the following sections:
• Policy summary and operation This section (pages 35 to 37) presents an extract from the Remuneration policy table (as approved by shareholders in 2014) for information purposes and how we intend to operate the policy for 2016/17.
• Outcomes for 2015/16 This section (pages 38 to 43) describes the implementation of our policy during 2015/16, including the ‘single figure of remuneration’ and supporting narrative for our bonus and long term incentive outcomes.
Irwin Lee Chairman of the Remuneration Committee
Directors’ remuneration report continued
The Group is required to prepare a Directors’ remuneration report for the 52 weeks ended 31 January 2016. The report has been prepared in accordance with the Companies Act 2006 and the Large and Medium-sized Companies and Groups (Accounts and Reports) (Amendment) Regulations 2013.
34 Wm Morrison Supermarkets PLC Governance

Our Directors’ remuneration policy was approved at the 2014 AGM held on 5 June 2014 and applies from that date.
A summary of the remuneration policy table from the 2013/14 Directors’ remuneration policy report, is reproduced below for information only. The full Directors’ remuneration policy report is contained
on pages 61 to 66 of the 2013/14 Annual report which is available in the investor relations section of the Group’s website: www.morrisons-corporate.com
Directors’ remuneration policy: extract
Remuneration policy table
Executive Directors
ELEMENT AND HOW IT SUPPORTS STRATEGY OPERATION OPPORTUNITY
PERFORMANCE MEASURES AND PERIOD
Base salaryThe Committee’s policy is to set base salaries competitively to attract and retain the best talent, which is critical to the Group’s success and delivery of the strategy.
Base salary is part of a total remuneration package which rewards stretching performance aligned to the Group’s strategy.
Base salaries are set by the Committee on appointment and then normally reviewed annually.
In setting and reviewing salary levels, the Committee considers the responsibilities of the role, progression in the role, individual performance (including any change in responsibilities), skills, experience and pay levels and structure throughout the Group.
The Committee also has regard to rates for similar roles in comparator companies, both in FTSE 100 retailers and UK-based companies of a similar size and complexity, but seeks to avoid the automatic ratcheting effects of following benchmark levels of salary.
Salary increases will ordinarily be in line with salary increases across the Group. The Committee may award increases above this level where this is warranted due to a change in the scope or responsibilities of the role, to reflect progression in the role (e.g. staged increases for a recent appointment) or to remain competitive in the market.
Current base salary levels are disclosed on page 37.
Not applicable.
BenefitsThe Company provides a market competitive benefits package for Executive Directors to support in the ability to recruit and retain the best talent.
Executive Directors are entitled to a car allowance (or other car benefit), transport costs, private health provision, life assurance, and normal staff discount entitlement. Executive Directors are also entitled to participate in the all employee share save schemes (and any other all employee share plan which the Company may operate) on the same terms as all other UK-based employees. The Committee reviews benefit provision from time-to-time and retains flexibility to add or remove benefits if necessary to ensure that benefit provision remains market competitive or to meet the operational needs of the business (for example, through the payment of relocation expenses).
The maximum car allowance is currently £24,000. The cost to the Company of providing other benefits depends on the nature of the benefit and can vary from year-to-year. Benefit provision will be maintained at a level which is competitive.
Not applicable.
Pension benefitsThe Company provides a market competitive retirement provision for Executive Directors which is aligned with retirement benefits available throughout the Group.
Executive Directors are entitled to membership of the Group’s cash balance pension arrangement known as the Morrisons Retirement Saver Plan. Individuals contribute 5% of capped base salary and all new eligible employees are automatically enrolled into this arrangement. A 10% cash salary supplement in lieu of Company pension contributions applies on base salary above the capped amount.
A cash alternative to pension provision is provided where the Group’s standard pension provision is not appropriate, for example, where an Executive Director has reached the Lifetime Allowance. Executive Directors may elect to receive this cash salary supplement in lieu of pension of broadly the same value as would accrue on an annual basis in the pension plan.
The Morrisons Retirement Saver Plan guarantees a value of the cash balance in the plan of 24% of pensionable pay (assuming retirement at age 65 years) adjusted for inflation capped at 2% p.a.
A maximum 10% cash salary supplement applies above capped base salary.
Where an Executive Director receives a cash salary supplement only, the maximum supplement payable is 25% of salary.
Not applicable.
35Annual report and financial statements 2015/16
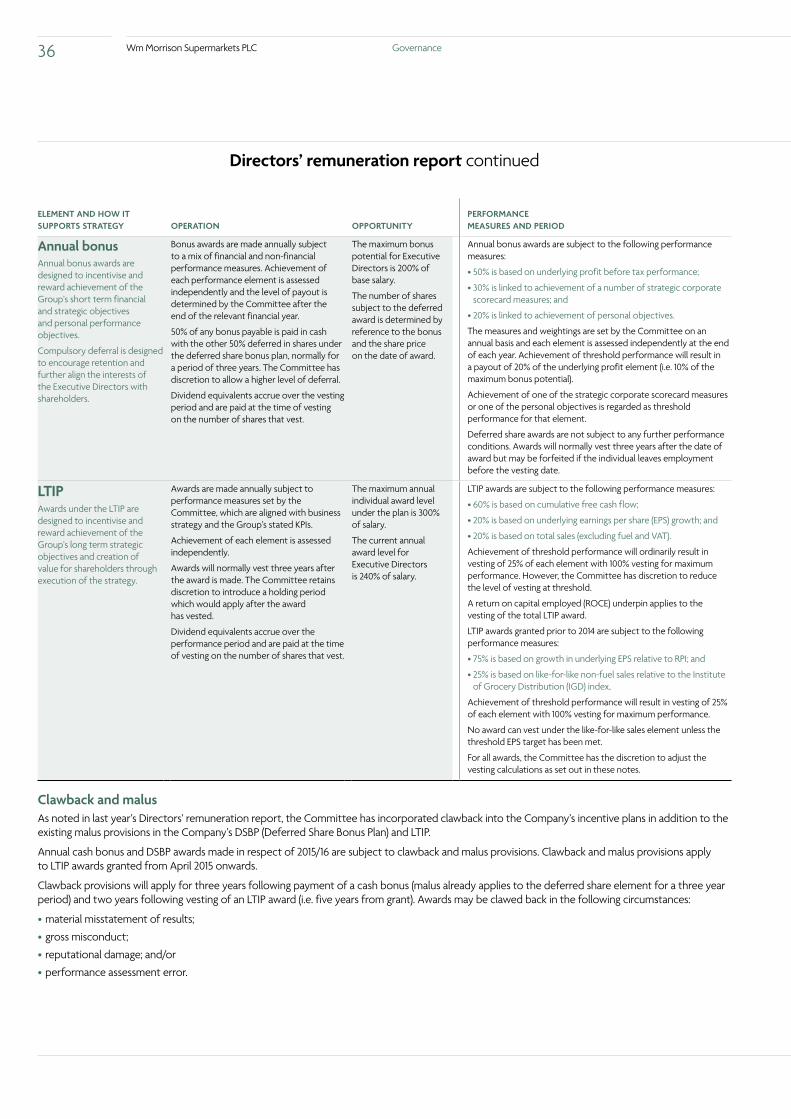
ELEMENT AND HOW IT SUPPORTS STRATEGY OPERATION OPPORTUNITY
PERFORMANCE MEASURES AND PERIOD
Annual bonusAnnual bonus awards are designed to incentivise and reward achievement of the Group’s short term financial and strategic objectives and personal performance objectives.
Compulsory deferral is designed to encourage retention and further align the interests of the Executive Directors with shareholders.
Bonus awards are made annually subject to a mix of financial and non-financial performance measures. Achievement of each performance element is assessed independently and the level of payout is determined by the Committee after the end of the relevant financial year.
50% of any bonus payable is paid in cash with the other 50% deferred in shares under the deferred share bonus plan, normally for a period of three years. The Committee has discretion to allow a higher level of deferral.
Dividend equivalents accrue over the vesting period and are paid at the time of vesting on the number of shares that vest.
The maximum bonus potential for Executive Directors is 200% of base salary.
The number of shares subject to the deferred award is determined by reference to the bonus and the share price on the date of award.
Annual bonus awards are subject to the following performance measures:
• 50% is based on underlying profit before tax performance;
• 30% is linked to achievement of a number of strategic corporate scorecard measures; and
• 20% is linked to achievement of personal objectives.
The measures and weightings are set by the Committee on an annual basis and each element is assessed independently at the end of each year. Achievement of threshold performance will result in a payout of 20% of the underlying profit element (i.e. 10% of the maximum bonus potential).
Achievement of one of the strategic corporate scorecard measures or one of the personal objectives is regarded as threshold performance for that element.
Deferred share awards are not subject to any further performance conditions. Awards will normally vest three years after the date of award but may be forfeited if the individual leaves employment before the vesting date.
LTIPAwards under the LTIP are designed to incentivise and reward achievement of the Group’s long term strategic objectives and creation of value for shareholders through execution of the strategy.
Awards are made annually subject to performance measures set by the Committee, which are aligned with business strategy and the Group’s stated KPIs.
Achievement of each element is assessed independently.
Awards will normally vest three years after the award is made. The Committee retains discretion to introduce a holding period which would apply after the award has vested.
Dividend equivalents accrue over the performance period and are paid at the time of vesting on the number of shares that vest.
The maximum annual individual award level under the plan is 300% of salary.
The current annual award level for Executive Directors is 240% of salary.
LTIP awards are subject to the following performance measures:
• 60% is based on cumulative free cash flow;
• 20% is based on underlying earnings per share (EPS) growth; and
• 20% is based on total sales (excluding fuel and VAT).
Achievement of threshold performance will ordinarily result in vesting of 25% of each element with 100% vesting for maximum performance. However, the Committee has discretion to reduce the level of vesting at threshold.
A return on capital employed (ROCE) underpin applies to the vesting of the total LTIP award.
LTIP awards granted prior to 2014 are subject to the following performance measures:
• 75% is based on growth in underlying EPS relative to RPI; and
• 25% is based on like-for-like non-fuel sales relative to the Institute of Grocery Distribution (IGD) index.
Achievement of threshold performance will result in vesting of 25% of each element with 100% vesting for maximum performance.
No award can vest under the like-for-like sales element unless the threshold EPS target has been met.
For all awards, the Committee has the discretion to adjust the vesting calculations as set out in these notes.
Clawback and malusAs noted in last year’s Directors’ remuneration report, the Committee has incorporated clawback into the Company’s incentive plans in addition to the existing malus provisions in the Company’s DSBP (Deferred Share Bonus Plan) and LTIP.
Annual cash bonus and DSBP awards made in respect of 2015/16 are subject to clawback and malus provisions. Clawback and malus provisions apply to LTIP awards granted from April 2015 onwards.
Clawback provisions will apply for three years following payment of a cash bonus (malus already applies to the deferred share element for a three year period) and two years following vesting of an LTIP award (i.e. five years from grant). Awards may be clawed back in the following circumstances:
• material misstatement of results;
• gross misconduct;
• reputational damage; and/or
• performance assessment error.
Directors’ remuneration report continued
36 Wm Morrison Supermarkets PLC Governance
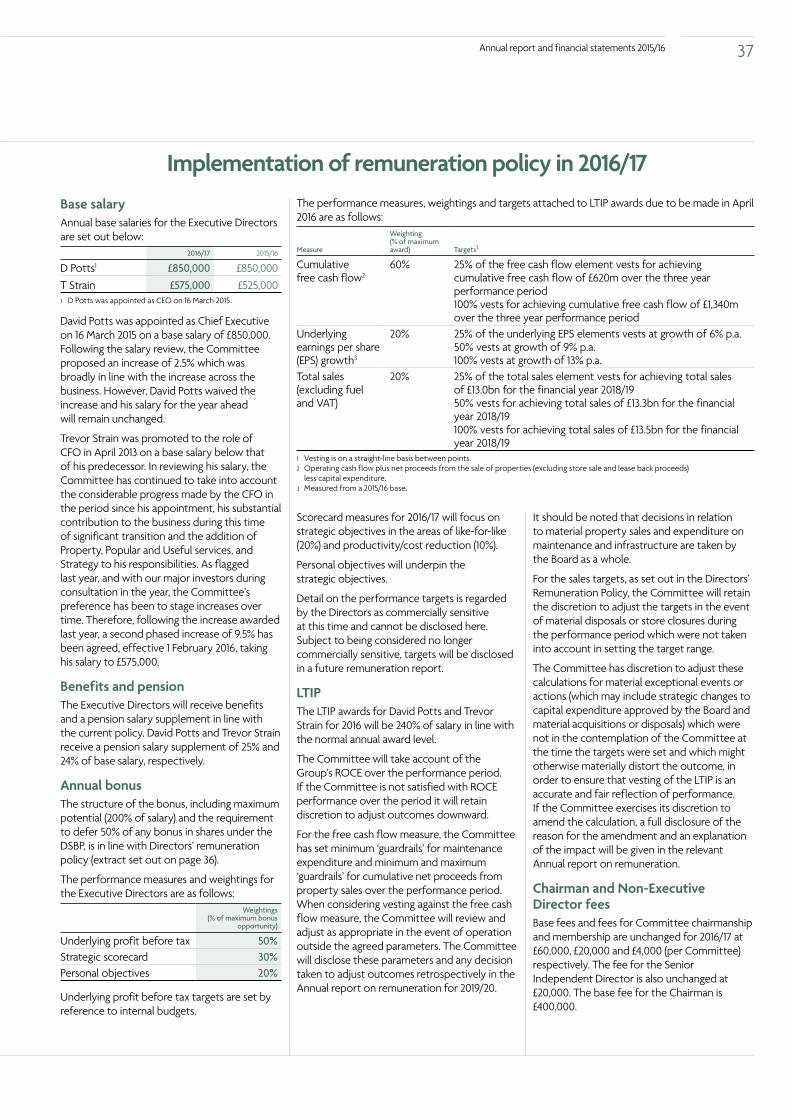
Base salaryAnnual base salaries for the Executive Directors are set out below:
2016/17 2015/16
D Potts1 £850,000 £850,000
T Strain £575,000 £525,0001 D Potts was appointed as CEO on 16 March 2015.
David Potts was appointed as Chief Executive on 16 March 2015 on a base salary of £850,000. Following the salary review, the Committee proposed an increase of 2.5% which was broadly in line with the increase across the business. However, David Potts waived the increase and his salary for the year ahead will remain unchanged.
Trevor Strain was promoted to the role of CFO in April 2013 on a base salary below that of his predecessor. In reviewing his salary, the Committee has continued to take into account the considerable progress made by the CFO in the period since his appointment, his substantial contribution to the business during this time of significant transition and the addition of Property, Popular and Useful services, and Strategy to his responsibilities. As flagged last year, and with our major investors during consultation in the year, the Committee’s preference has been to stage increases over time. Therefore, following the increase awarded last year, a second phased increase of 9.5% has been agreed, effective 1 February 2016, taking his salary to £575,000.
Benefits and pensionThe Executive Directors will receive benefits and a pension salary supplement in line with the current policy. David Potts and Trevor Strain receive a pension salary supplement of 25% and 24% of base salary, respectively.
Annual bonusThe structure of the bonus, including maximum potential (200% of salary) and the requirement to defer 50% of any bonus in shares under the DSBP, is in line with Directors’ remuneration policy (extract set out on page 36).
The performance measures and weightings for the Executive Directors are as follows:
Weightings (% of maximum bonus
opportunity)
Underlying profit before tax 50%Strategic scorecard 30%Personal objectives 20%
Underlying profit before tax targets are set by reference to internal budgets.
Scorecard measures for 2016/17 will focus on strategic objectives in the areas of like-for-like (20%) and productivity/cost reduction (10%).
Personal objectives will underpin the strategic objectives.
Detail on the performance targets is regarded by the Directors as commercially sensitive at this time and cannot be disclosed here. Subject to being considered no longer commercially sensitive, targets will be disclosed in a future remuneration report.
LTIPThe LTIP awards for David Potts and Trevor Strain for 2016 will be 240% of salary in line with the normal annual award level.
The Committee will take account of the Group’s ROCE over the performance period. If the Committee is not satisfied with ROCE performance over the period it will retain discretion to adjust outcomes downward.
For the free cash flow measure, the Committee has set minimum ‘guardrails’ for maintenance expenditure and minimum and maximum ‘guardrails’ for cumulative net proceeds from property sales over the performance period. When considering vesting against the free cash flow measure, the Committee will review and adjust as appropriate in the event of operation outside the agreed parameters. The Committee will disclose these parameters and any decision taken to adjust outcomes retrospectively in the Annual report on remuneration for 2019/20.
The performance measures, weightings and targets attached to LTIP awards due to be made in April 2016 are as follows:
Measure
Weighting (% of maximum award) Targets1
Cumulative free cash flow2
60% 25% of the free cash flow element vests for achieving cumulative free cash flow of £620m over the three year performance period100% vests for achieving cumulative free cash flow of £1,340m over the three year performance period
Underlying earnings per share (EPS) growth3
20% 25% of the underlying EPS elements vests at growth of 6% p.a.50% vests at growth of 9% p.a.100% vests at growth of 13% p.a.
Total sales (excluding fuel and VAT)
20% 25% of the total sales element vests for achieving total sales of £13.0bn for the financial year 2018/1950% vests for achieving total sales of £13.3bn for the financial year 2018/19100% vests for achieving total sales of £13.5bn for the financial year 2018/19
1 Vesting is on a straight-line basis between points.2 Operating cash flow plus net proceeds from the sale of properties (excluding store sale and lease back proceeds)
less capital expenditure.3 Measured from a 2015/16 base.
It should be noted that decisions in relation to material property sales and expenditure on maintenance and infrastructure are taken by the Board as a whole.
For the sales targets, as set out in the Directors’ Remuneration Policy, the Committee will retain the discretion to adjust the targets in the event of material disposals or store closures during the performance period which were not taken into account in setting the target range.
The Committee has discretion to adjust these calculations for material exceptional events or actions (which may include strategic changes to capital expenditure approved by the Board and material acquisitions or disposals) which were not in the contemplation of the Committee at the time the targets were set and which might otherwise materially distort the outcome, in order to ensure that vesting of the LTIP is an accurate and fair reflection of performance. If the Committee exercises its discretion to amend the calculation, a full disclosure of the reason for the amendment and an explanation of the impact will be given in the relevant Annual report on remuneration.
Chairman and Non-Executive Director feesBase fees and fees for Committee chairmanship and membership are unchanged for 2016/17 at £60,000, £20,000 and £4,000 (per Committee) respectively. The fee for the Senior Independent Director is also unchanged at £20,000. The base fee for the Chairman is £400,000.
Implementation of remuneration policy in 2016/17
37Annual report and financial statements 2015/16

Directors’ remuneration report continued
Audited information
Single total figure of remunerationThe table below sets out the single total figure of remuneration and breakdown for each Director for 2015/16 and the comparative figure for 2014/15.
2015/16 2014/15
Salary/fees £000
Benefits1
£000
Annualbonus2
£000LTIP
£000
Pensionbenefits3
£000Total £000
Salary/fees £000
Benefits1
£000
Annualbonus2
£000LTIP
£000
Pensionbenefits3
£000Total £000
Executive DirectorsD Potts4 747 226 1,092 – 187 2,252 – – – – – –T Strain 525 35 763 – 126 1,449 490 28 602 – 118 1,238
D Philips5 39 1 – – 10 50 850 28 1,010 – 213 2,101Non-Executive DirectorsA Higginson6 400 1 – – – 401 94 – – – – 94R Anand7 7 – – – – 7 – – – – – –P Cox8 102 – – – – 102 108 – – – – 108N Davidson9 25 – – – – 25 – – – – – –R Gillingwater 10 26 – – – – 26 76 – – – – 76P Hughes8 84 – – – – 84 92 – – – – 92I Lee11 32 – – – – 32 – – – – – –B Richards11 33 – – – – 33 – – – – – –P Vennells7 5 – – – – 5 – – – – – –J Waterous12 92 – – – – 92 92 – – – – 921 Taxable benefits for the Executive Directors include a car allowance (or other car benefit), transport costs, and private health provision. The Chairman has use of a car and driver for Company business
and receives private health provision. All Directors receive the Company’s normal staff discount entitlement which is not taxable. The value of Sharesave awards granted in 2015/16 is also included in this figure. D Potts’ benefits for the year included c£0.2m of relocation benefits. The company has been advised that for the Chairman, CEO and CFO, certain expenses in relation to travel should be treated as a taxable benefit. The table above includes these travel expenses and the corresponding tax contributions (restated for 2014/15).
2 50% of the annual bonus is deferred in shares for a period of three years. There are no performance conditions attached. For D Philips, the 2014/15 bonus was paid in cash.3 D Potts and D Philips received a salary supplement equal to 25% of base salary. T Strain received a salary supplement of 24% of base salary. None of the Executive Directors have a prospective
entitlement to a defined benefit pension by reason of qualifying services.4 D Potts was appointed to the Board on 16 March 2015. The figures disclosed for 2015/16 are for the period following appointment to the Board.5 D Philips stepped down from the Board on 16 February 2015. The figures disclosed for 2015/16 are for the period prior to him stepping down. Loss of office payments disclosed on page 41.6 A Higginson was appointed to the Board on 1 October 2014. The figure disclosed for 2014/15 includes fees in respect of his induction period (including legal costs) which commenced on 1 September 2014.7 R Anand and P Vennells were appointed to the Board on 1 January 2016. The figures disclosed for 2015/16 are for the period following appointment to the Board.8 P Cox and P Hughes stepped down from the Board on 31 December 2015. The figures disclosed for 2015/16 are for the period prior to them stepping down.9 N Davidson was appointed to the Board on 1 October 2015. The figure disclosed for 2015/16 is for the period following appointment to the Board.10 R Gillingwater stepped down from the Board on 4 June 2015. The figure disclosed for 2015/16 is for the period prior to him stepping down.11 I Lee and B Richards were appointed to the Board on 1 September 2015. The figure disclosed for 2015/16 is for the period following appointment to the Board.12 J Waterous retired from the Board on 31 January 2016.
Annual bonusThe table below provide a summary of the performance achieved under the annual bonus for 2015/16:
DirectorMaximum bonus
opportunityActual bonus
(% of salary) Actual bonus
(£000)
David Potts 200% 146% £1,092Trevor Strain 200% 146% £763
Annual report on remuneration
38 Wm Morrison Supermarkets PLC Governance

Group financial and strategic scorecard
Performance measure
Weighting (as a % of total annual bonus opportunity)
Achieved as a % of maximum
Threshold Target Maximum
Pay-out (as a % of total annual bonus opportunity)
Group Financial
Underlying PBT1 50%£302m
32.7% £300m
Strategic scorecard
Productivity/cost reduction 10% £227m 10% £200m
Like-for-like sales 20% (2%) 10%(2%)
Actual achievement
1 Underlying profit before restructuring one-off costs and tax, see note 1.4 for further details.
The Committee considers that the threshold and maximum targets under the Group’s financial and strategic measures remain commercially sensitive. These targets will be disclosed in a future report when no longer regarded as commercially sensitive.
Personal measures
Director
Weighting (as a % of total annual bonus opportunity) Key achievements in the year
Pay-out (as a % of maximum)
David Potts 20% During the year David secured a strong and committed executive leadership team dedicated to driving the organisation’s turnaround. His listening programme (intended to inform and shape the new strategy) made great progress during the year and enabled identification and work towards our six strategic priorities to strengthen and improve the customer experience. David has stabilised business performance and rationalised our portfolio of stores with the closure of 21 supermarkets and sale of M local stores. Work has also been completed to ‘right size’ the organisation with changes to store support structure.
20%
Trevor Strain 20% During the year Trevor exceeded goals in relation to cost savings, working capital improvements, net debt reduction, financing restructure and disposal of our underperforming stores. He has also delivered the first phase of our new internal IT strategy. Trevor contributed significantly to the development of the business’ new strategy. He has played a key role in assisting with the development of the new Executive team and communication of the financial aspects of our new business strategy.
20%
50% of any bonus payable is deferred in shares under the DSBP which vest three years after the date of award. Dividend equivalents will accrue and be paid on the shares that vest. Deferred shares are normally forfeited if the individual leaves the Company before they vest.
39Annual report and financial statements 2015/16

Directors’ remuneration report continued
LTIP awardsAwards granted under the LTIP in April 2013 are scheduled to vest in April 2016. The performance period relating to these awards ends on 31 January 2016. Details of the performance conditions and the extent to which they have been satisfied are set out below:
Weighting(25%)Threshold performance required
(100%)Maximum performance required Actual outcome
Actual LTIP vesting (% of maximum)
Performance conditionUnderlying earnings per share (EPS) growth
75% EPS growth of RPI +1% p.a.
EPS growth of RPI +10% p.a.1
EPS growth below threshold of RPI +1% p.a.
0%
Like-for-like non-fuel sales relative to the Institute of Grocery Distribution (IGD) index2
25% Matching IGD index over the three year period
Outperformance of IGD index by at least 1% over the three year period3
Below IGD index over three year period
0%
LTIP vesting (% of maximum) 0%1 Vesting is on a straight-line basis between threshold and maximum. 2 No award can vest under the like-for-like sales element unless the threshold EPS target has been met.3 Vesting is on a straight-line basis between threshold and maximum.
Share awards granted in 2015/16The table below sets out the share awards made to the Executive Directors during 2015/16 under the Company’s LTIP.
Grant date Award typeBasis on which award made
Face value of award (£)1
Percentage of award vesting at threshold performance
Performance period end date Performance conditions
D Potts 23 April 2015 Conditional award 300% of salary2 2,550,000 25% 3 February 2018 See table belowT Strain 23 April 2015 Conditional award 240% of salary 1,260,000 25% 3 February 2018 See table below1 The face value in the table above has been calculated by multiplying the maximum number of shares that could vest by the average share price used to determine the number of shares awarded.
The average share price used was £1.9716 and this was calculated over a period of five business days prior to the date of grant.2 D Potts first LTIP award was 300% of salary and was intended to provide an immediate performance driver and alignment with shareholders.
The table below sets out the performance conditions attached to the awards made during the year. These awards were granted in April 2015.Measure Weighting (% of maximum award) Targets
Cumulative free cash flow1 60% 25% of the free cash flow element vests for achieving cumulative free cash flow of £850m over the three year performance period 100% vests for achieving cumulative free cash flow of £1,600m over the three year performance period2
Underlying earnings per share (EPS)
20% 25% of the underlying EPS element vests for achieving underlying EPS of 10p for the financial year 2017/18 100% vests for achieving underlying EPS of 15p for the financial year 2017/183
Total sales (excluding fuel and VAT)
20% 25% of the total sales element vests for achieving total sales of £12.7bn for the financial year 2017/18 100% vests for achieving total sales of £13.3bn for the financial year 2017/182
1 Operating cash flow plus net proceeds from the sale of properties (excluding store sale and leaseback proceeds) less capital expenditure.2 Vesting is on a straight-line basis between threshold and maximum. 3 Intermediate vesting applies: 10p (25%); 11p (60%); 12p (80%); 15p (100%). Vesting is on a straight-line basis between these points.
The Committee will take account of the Group’s ROCE over the performance period. If the Committee is not satisfied with ROCE performance over the period it will retain discretion to adjust outcomes downward.
For the free cash flow measure, the Committee has set minimum and maximum ‘guardrails’ for maintenance expenditure and cumulative net proceeds from property sales over the performance period. When considering vesting against the free cash flow measure, the Committee will review and adjust as appropriate in the event of operation outside the agreed parameters. The Committee will disclose these parameters and any decision taken to adjust outcomes retrospectively in the relevant Annual report on remuneration. It should be noted that decisions in relation to material property sales and expenditure on maintenance and infrastructure are taken by the Board as a whole.
40 Wm Morrison Supermarkets PLC Governance

For the revenue targets, as set out in the Directors’ Remuneration Policy, the Committee will retain the discretion to adjust the targets in the event of material disposals or store closures during the performance period which were not taken into account in setting the target range. For the avoidance of doubt, the revenue targets in the table above exclude convenience stores.
The Committee has discretion to adjust these calculations for material exceptional events or actions (which may include strategic changes to capital expenditure approved by the Board and material acquisitions or disposals) which were not in the contemplation of the Committee at the time the targets were set and which might otherwise materially distort the outcome, in order to ensure that vesting of the LTIP is an accurate and fair reflection of performance. If the Committee exercises its discretion to amend the calculation, a full disclosure of the reason for the amendment and an explanation of the impact will be given in the relevant Annual report on remuneration.
Payments to past Directors and loss of office paymentsDalton Philips stepped down as CEO on 16 February 2015. The details of his termination arrangements were disclosed in detail last year.
Dalton’s notice period commenced on 13 January 2015 and he was paid his normal base salary and contractual benefits up to the date of cessation on 16 February 2015. As set out in last year’s report, in accordance with his contractual entitlements, Dalton has received phased payments in lieu of base salary, pension supplement and benefits during 2015/16 covering the remainder of his 12 month notice period. These payments were made in instalments and totalled £989,198 in respect of the financial year, including £7,000 in respect of advisory fees in connection with his loss of office arrangements.
Dalton was not eligible for a bonus in respect of 2015/16.
Dalton’s 237,592 deferred shares (including dividend equivalents) vested in full in March 2015 in accordance with the rules of the DSBP. These related to his deferred annual bonus earned in respect of 2011/12. His LTIP award which was due to vest in 2016 has lapsed in full.
No other payments (including loss of office payments) have been made during 2015/16 to any individual who was previously a Director of the Company.
Statement of Directors’ shareholding The Company has share ownership guidelines for Executive Directors of 200% of salary. Under the guidelines, Executive Directors are expected to retain 50% of vested share awards (net of tax), including shares from the deferred element of the annual bonus, until the guideline is reached. Shares held under the DSBP (calculated on a post-tax basis) which are subject only to a continuing service requirement, will be included in assessing the level of shareholding. The shareholding guideline should be reached within five years of appointment to the Board.
The Company has share ownership guidelines for Non-Executive Directors of 50% of base fees. This guideline should be reached within three years of appointment to the Board or three years after the date of adoption of the policy for incumbent Directors.
No share awards have vested for either David Potts or Trevor Strain since their appointment to the Board.
David Potts and Trevor Strain do not yet meet the 200% shareholding guideline but are both within the five year period allowed to build up their shareholding.
Directors’ shareholdings – Executive Directors
Shareholding requirement
(% salary)
Shareholdingas at
31 January 2016/16 February 2015
for D Philips1
(% salary)2Shares owned
outright
Deferred shares not subject to performance
Share save options not
subject to performance
LTIP shares subjectto performance3
Total interests in shares
Executive DirectorsD Potts 200% 182% 822,881 – – 1,293,365 2,116,246T Strain 200% 69% 97,794 196,940 7,682 1,216,069 1,518,485D Philips 200% 95% 337,919 237,592 5,487 820,6954 1,401,6931 Includes shares held under the DSBP on an after tax basis.2 For the purpose of calculating the shareholding as a percentage of salary, the share price of £1.745 as at 29 January 2016 (the last trading day of the financial year ended 31 January 2016) has been used
(other than for shares purchased in the market which are valued at the acquisition price).3 576,995 shares represent the LTIP award granted to T Strain in June 2014 which is due to vest in June 2017. 50% of the award is linked to cumulative free cash flow targets. 25% of this element vests for
achieving cumulative free cash flow of £1bn over the three year performance period and 100% vests for achieving £2bn over the three year performance period. 30% of the award is linked to underlying earnings per share (EPS) targets. 25% of this element vests for achieving underlying EPS of 17p for the financial year 2016/17 and 100% vests for achieving underlying EPS of 23p for the financial year 2016/17. 20% of the award is linked to total sales (excluding fuel and VAT) targets. 25% of this element vests for achieving total sales of £14bn for the financial year 2016/17; 50% vests for achieving total sales of £14.4bn for the financial year 2016/17 and 100% vests for achieving total sales of £15bn for the financial year 2016/17. Vesting is on a straight-line basis between each of the points. 1,293,365 shares and 639,074 shares represent LTIP awards granted to D Potts and T Strain respectively in April 2015 which are due to vest in April 2018. Performance targets for those awards are disclosed in the section headed Share Awards granted in 2015/16.
4 Maximum number of shares after reduction for time pro-rating.
41Annual report and financial statements 2015/16

Directors’ remuneration report continued
Directors’ shareholdings – Non-Executive DirectorsAll Non-Executive Directors are still within the three year period allowed to build up their shareholding. Shareholdings as at 31 January 2016 (or date of stepping down from the Board in the case of R Gillingwater, J Waterous, P Cox and P Hughes) are set out in the table below.
1 February 2016 Total (owned outright)
A Higginson 266,209R Anand 12,500P Cox 25,000N Davidson –R Gillingwater 19,695P Hughes 9,848I Lee –B Richards –P Vennels –J Waterous 20,216
There have been no changes in the Directors’ interests since the year end.
Unaudited information
Performance graph and tableThe graph below shows the Company’s total shareholder return (TSR) compared with the TSR of the FTSE 100 and FTSE Food and Drug Retailers indices over the seven year period to 31 January 2016. These indices have been selected as being appropriate in giving a broad equity view and given that the Company is or has been a constituent of these indices over the period.
Value of a £100 holding
250£
200
150
100
50
02009 2010 2011 2012 2013 2014 2015 2016
FTSE 100FTSE All Share food and drug retailersMorrisons
The table below sets out the total remuneration figure for the CEO over the same seven year period, valued using the methodology applied to the single total figure of remuneration.
Chief Executive 2009/10 2010/11 2011/12 2012/13 2013/14 2014/15 2015/163
Total remuneration (£000s)
David Potts – – – – – – 2,252Dalton Philips – 3,3281 2,502 1,089 1,089 2,101 50Marc Bolland 1,159 304 – – – – –
Annual bonus payment (% of maximum opportunity)
David Potts – – – – – – 73%Dalton Philips – 70% 90% 0% 0% 60% –Marc Bolland 0%2 – – – – – –
LTIP vesting level achieved (% of maximum opportunity)
David Potts – – – – – – –Dalton Philips – – – 0% 0% 0% 0%Marc Bolland – – – – – – –
1 Total remuneration includes value of unrestricted share award over 319,401 shares and restricted share award over 120,965 shares granted on recruitment.2 Marc Bolland was not treated as a good leaver and therefore did not receive a bonus in 2009/10.3 In 2015/16, D Potts was appointed on 16 March 2015 and D Philips stepped down from the Board on 16 February 2015.
42 Wm Morrison Supermarkets PLC Governance

Change in remuneration of CEO compared to Group employeesThe table below sets out the change in total remuneration paid to the CEO from 2014/15 to 2015/16 and the average percentage change from 2014/15 to 2015/16 for employees of the Group as a whole.
% increase in element between 2014/15 and 2015/16
Salary and fees Taxable benefits4 Annual bonus
D Potts/D Philips1 0% 0% 23%All Group employees2 2% 2% 24%3
1 Shows the percentage change between the 2014/15 data for D Philips and the annualised 2015/16 data for D Potts.2 Reflects the change in average pay for all Group employees employed in both the financial year 2014/15 and the financial year 2015/16.3 Reflects the increase in the average bonus payout for eligible employees.4 D Potts taxable benefits for the year included £0.2m relating to relocation allowance, which as a one-off payment has been excluded from the table above.
Relative importance of spend on payThe table below sets out the total spend on remuneration in the 2015/16 and 2014/15 financial years compared with distributions to shareholders.
2015/16 2014/15 Difference
Total spend on remuneration for all Group employees £1,944m £1,970m £26m
Profit distributed by way of dividends and share buyback £260m £308m £48m
The Committee and its advisersDuring the year, the following individuals were members of the Remuneration Committee:
Name of Director
Membership
From To
J Waterous (Chair) 1 Feb 2010 31 Jan 2016I Lee (Chairman designate) 2 Sep 2015 To dateR Anand 21 Jan 2016 To dateP Cox 1 Apr 2009 31 Dec 2015N Davidson 3 Nov 2015 To dateR Gillingwater 1 Mar 2013 4 Jun 2015A Higginson 22 Jan 2015 To dateP Hughes 1 Jan 2010 31 Dec 2015B Richards 2 Sep 2015 To dateP Vennells 21 Jan 2016 To date
The CEO, the Group People Director and other HR representatives also attend meetings (other than where their own remuneration is being discussed) by invitation. The Company Secretary acts as secretary to the Committee.
Deloitte LLP (Deloitte) were appointed in July 2014 by the Committee, following a competitive tender process, to provide independent external advice on market practice and Executive and Non-Executive remuneration. Fees are agreed by the Committee according to services provided. Total fees paid during 2015/16 to Deloitte for material advice and assistance in relation to remuneration matters were £74,900, on a time and expense basis.
Deloitte are also engaged from time-to-time to provide a range of unrelated human resource consulting services and advice on tax and accounting. The Chairman of the Committee monitors such engagements on an ongoing basis to ensure that there is no impact on Deloitte’s independence as adviser to the Committee. Deloitte is a member of the Remuneration Consultants Group and signatory to its Voluntary Code of Conduct. The Committee is satisfied that the advice received during the year from Deloitte is objective and independent.
Allen & Overy LLP provided legal advice to the Committee on the appointment of the new CEO. Fees paid for this advice during 2015/16 totalled £12,999.
Allen & Overy LLP also provide other legal advice and services to the Group.
Statement of voting at 2014 AGMAs disclosed in previous reports, the table below shows the voting outcome at the June 2014 AGM for approval of the Remuneration policy.
Votes for For as a % of votes cast Votes against Against as a % of votes cast Abstentions
Remuneration policy 1,142,938,356 73.46 412,940,651 26.54 35,276,870
Statement of voting at 2015 AGMThe table below shows the voting outcome at the June 2015 AGM for approval of the 2014/15 Remuneration report.
Votes for For as a % of votes cast Votes against Against as a % of votes cast Abstentions
Remuneration report 959,319,914 62.08 586,005,110 37.92 116,613,615
Irwin LeeChairman of the Remuneration Committee9 March 2016
43Annual report and financial statements 2015/16

Directors’ reportStatutory disclosures
The following disclosures have been included elsewhere within the Annual report and are incorporated into the Directors’ report by reference.
Disclosure Page
Financial instruments 85 to 87Financial risk management 86 Future developments 2 to 21Dividends 66Greenhouse gas emissions 16Corporate governance report 22 to 32Directors of the Group 23 to 24Employee involvement 14 to 15
Disclosures required pursuant to Listing Rule 9.8.4R can be found on the following pages:
Disclosure Page
Interest capitalised 71 to 74Long term incentive schemes 92 to 95Waiver of Directors’ emoluments 33 to 43
Political donations
No political donations were made in the financial year, which is Group policy.
Going concern
The Directors’ assessment of the Group and the Company’s ability to continue as a going concern is based on cash flow forecasts for the Group and the committed borrowing and debt facilities of the Group. These forecasts include consideration of future trading performance, working capital requirements, retail market conditions and the wider economy.
The Group remains able to borrow cash at competitive rates. The Group has negotiated, and has available to it, committed, competitive facilities that will meet the Group’s needs in the short and medium term.
Having assessed the principal risks as set out on pages 18 and 19 and the other matters discussed in connection with the Viability statement on page 19, the Directors considered it appropriate to adopt the going concern basis of accounting in preparing the financial statements.
Forward-looking statements
The Strategic report and Directors’ report are prepared for the members of the Company and should not be relied upon by any other party or for any other purpose. Where the Strategic report and Directors’ report include forward-looking statements, these are made by the Directors in good faith based on the information available to them at the time of their approval of the Annual report.
Consequently, such statements should be treated with caution due to the inherent uncertainties, including both economic and business risk factors, underlying such forward-looking statements and information.
The liabilities of the Directors in connection with the Strategic report, the Directors’ remuneration report and the Directors’ report shall be subject to the limitations and restrictions provided by the Companies Act 2006.
Borrowing powers
The Articles of Association of the Company restrict the borrowings of the Company and its subsidiary undertakings to a maximum amount equal to twice the share capital and consolidated reserves.
Relating to beneficial owners of shares with ‘information rights’
Beneficial owners of shares who have been nominated by the registered holder of those shares to receive information rights under section 146 of the Companies Act 2006 are required to direct all communications to the registered holder of their shares rather than to the Company’s registrar, Capita Registrars, or to the Group directly.
Directors’ and Officers’ liability insurance
The Company maintains insurance cover for the protection of Directors and senior management from personal liabilities and costs which may arise in the course of fulfilling their duties. The Company also agreed during the year to provide an indemnity to the Non-Executive Directors for such liabilities and costs to the fullest extent permitted by law.
Substantial shareholdings
The Company has been notified by the following shareholders (excluding Directors) that they have interests in 3% or more of the total voting rights in the Company. The shares relate to the number informed by the shareholders on the notification rather than the current share register:
As at 31 January 2016 As at 9 March 2016
Number of
shares% of share
capitalNumber of
shares% of share
capital
Amerprise Financial Inc 177,970,287 7.62 177,970,287 7.62Schroders PLC 155,916,196 6.68 155,916,196 6.68Deutsche Bank AG 124,717,149 5.34 105,974,097 4.54Silchester International Investors LLP 117,553,329 5.03 117,553,329 5.03Brandes Investment Partners, LP 117,121,738 5.02 117,121,738 5.02BlackRock Inc 117,012,010 5.01 117,012,010 5.01Majedie Asset Management Limited 115,708,692 4.96 115,708,692 4.96First Eagle Investment Management, LLC 114,296,273 4.89 114,296,273 4.89Invesco Limited 111,082,524 4.76 111,082,524 4.76Eleanor Marie Kernighan 98,182,396 3.95 92,182,396 3.95Andrea Shelley 92,869,309 3.98 92,869,309 3.98Zurich Financial Services 81,286,130 3.48 81,286,130 3.48
The percentage appearing above is the percentage that number represents of the issued share capital of the Company as at 31 January 2016 and 9 March 2016 respectively.
44 Wm Morrison Supermarkets PLC Governance

Additional shareholder information
Additional information for shareholders is required by the implementation of the EU Takeover Directive into UK law.
Pursuant to section 992 of the Companies Act 2006, the Company is required to disclose certain additional information. Such disclosures, which are not covered elsewhere in this report, include the following paragraphs. The disclosures set out below are in some cases a summary of the relevant provisions of the Company’s Articles of Association and the relevant full provisions can be found in the Articles which are available for inspection at the Company’s registered office.
Appointment and powers of DirectorsDirectors are appointed by ordinary resolution at a general meeting of ordinary shareholders. The Directors have the power to appoint a Director during the year, but any person so appointed must be put up for appointment at the next AGM.
Subject to its Articles of Association and relevant statutory law, and to such direction as may be given by the Company in general meeting by special resolution, the business of the Company shall be managed by the Directors, who may exercise all powers of the Company which are not required to be exercised by the Company in general meeting.
Articles of AssociationThe Company’s Articles of Association may only be amended by a special resolution at a general meeting of shareholders.
Share capitalThe authorised and called-up share capital of the Company, together with details of shares allotted and cancelled during the year, are shown in note 6.5 of the Group financial statements.
At the AGM of the Company held in June 2012, a special resolution was passed to renew the authority given at the AGM held in June 2011 for the purchase by the Company of up to 248,797,066 ordinary shares representing approximately 10% of the issued ordinary share capital at that time.
During the period, 70,480 (2015: 41,962) ordinary shares were issued to employees exercising share options, along with a further nil (2015: nil) out of the Group’s treasury shares and 3,118,702 (2015: 3,031,234) out of the Group’s trust shares.
Share capital and rights attaching to the Company’s sharesUnder the Company’s Articles of Association, any share in the Company may be issued with such rights or restrictions, whether in regard to dividend, voting, return of capital or otherwise as the Company may from time-to-time by ordinary resolution determine (or, in the absence of any such determination, as the Directors may determine).
At a general meeting of the Company, every member has one vote on a show of hands and, on a poll, one vote for each share held. The notice of general meeting specifies deadlines for exercising voting rights either by proxy or present in person in relation to resolutions to be passed at a general meeting.
No member is, unless the Board decides otherwise, entitled to attend or vote either personally or by proxy at a general meeting, or to exercise any other right conferred by being a shareholder if they or any person with an interest in shares has been sent a notice under section 793 of the Companies Act 2006 (which confers upon public companies the power to require information with respect to interests in their voting shares) and they or any interested person failed to supply the Company with the information requested within 14 days after delivery of that notice. The Board may also decide that no dividend is payable in respect of those default shares and that no transfer of any default shares shall be
registered. These restrictions end seven days after receipt by the Company of a notice of an approved transfer of the shares or all the information required by the relevant section 793 notice, whichever is the earlier.
The Directors may refuse to register any transfer of any share which is not a fully paid share, although such discretion may not be exercised in a way which the Financial Conduct Authority regards as preventing dealings in the shares of the relevant class or classes from taking place on an open or proper basis. The Directors may likewise refuse to register any transfer of a share in favour of more than four persons jointly. The Company is not aware of any other restrictions on the transfer of shares in the Company other than certain restrictions that may from time-to-time be imposed by laws and regulations (for example, insider trading laws).
The Company is not aware of any agreements between shareholders that may result in restrictions on the transfer of securities or voting rights.
Other disclosuresThe Company is not party to any significant arrangements which take effect, alter or terminate upon a change of control of the Company following a takeover bid.
The Company does not have any employee share schemes where the shares to which the scheme relates have rights with regard to the control of the Company which are not exercisable by employees.
Equal opportunities for allIntegral to a high performing culture is the concept of equal opportunity for all colleagues, which we offer regardless of race, colour, nationality, ethnic origin, gender (including gender reassignment), marital or civil partnership status, disability, religion or belief, sexual orientation, age or trade union membership.
This includes applications for employment made by people with disabilities, which are given full and fair consideration. Respect underpins our behaviour towards all disabled candidates, as well as colleagues who have a disability or become disabled in any way during the course of their employment.
A full assessment of the individual’s needs is undertaken and we will make reasonable adjustments to the work environment or practices in order to help people with disabilities.
All candidates and colleagues are treated equally in respect of recruitment, promotion, training, pay and other employment policies and conditions. The decisions we make are based on relevant merits and abilities.
Health and safety policyIt is the Group’s intention, so far as is reasonably practicable, to ensure the health, safety and welfare of all its employees, customers and visitors to its premises. In order to achieve this, a comprehensive health and safety manual is in place for each division of the Company and subsidiary companies within the Group. Each health and safety manual contains the policy and procedures for complying with the Health and Safety at Work Act 1974, including the provision, based on risk assessment, of safe working practices for all work activities across the Group. The Group’s health and safety policy is approved by the Executive Committee. The Group has adopted the national targets set by the Health and Safety Commission for the reduction of workplace accidents and work-related ill health, and is on course to meet or exceed these targets. Health and safety performance is monitored to ensure continuous improvement in all areas.
By order of the Board
Mark Amsden Company Secretary 9 March 2016
45Annual report and financial statements 2015/16

The Directors are responsible for preparing the Annual report, the Directors’ remuneration report and the Group and Company financial statements in accordance with applicable law and regulations.
Company law requires the Directors to prepare Group and Company financial statements for each financial period. Under that law they are required to prepare the Group financial statements in accordance with International Financial Reporting Standards (IFRSs) as adopted by the EU and applicable law and have elected to prepare the Company financial statements in accordance with UK Generally Accepted Accounting Practice (UK Accounting Standards and applicable law).
Under Company law the Directors must not approve the financial statements unless they are satisfied that they give a true and fair view of the state of affairs of the Group and Company and of their profit or loss for that period. In preparing each of the Group and Company financial statements, the Directors are required to:
• select suitable accounting policies and then apply them consistently;
• make judgements and estimates that are reasonable and prudent;
• for the Group financial statements, state whether they have been prepared in accordance with IFRSs as adopted by the EU;
• for the Company financial statements, state whether applicable UK Accounting Standards have been followed, subject to any material departures disclosed and explained in the Company financial statements; and
• prepare the financial statements on the going concern basis unless it is inappropriate to presume that the Group and the Company will continue in business.
The Directors are responsible for keeping adequate accounting records that are sufficient to show and explain the Company’s transactions and disclose with reasonable accuracy at any time the financial position of the Company and the Group and enable them to ensure that its financial statements and Directors’ remuneration report comply with the Companies Act 2006, and as regards the Group financial statements, Article 4 of the IAS Regulations. They are also responsible for safeguarding the assets of the Company and the Group and hence for taking reasonable steps for the prevention and detection of fraud and other irregularities.
The Directors are responsible for the maintenance and integrity of the corporate and financial information included on the Company’s website. Legislation in the UK governing the preparation and dissemination of financial statements may differ from legislation in other jurisdictions.
Disclosure of information to auditors
The Directors who held office at the date of approval of this Directors’ report confirm that, so far as they are each aware, there is no relevant audit information of which the Group’s auditor is unaware; and each Director has taken all steps that he or she ought to have taken as a Director to make himself or herself aware of any relevant audit information and to establish that the Group’s auditor is aware of that information.
Assessment of whether the Annual report is fair, balanced and understandable
As required by the Code, the Directors confirm that they consider that the Annual report, taken as a whole, is fair, balanced and understandable and provides the information necessary for shareholders to assess the Group’s position and performance, business model and strategy.
When arriving at this position the Board was assisted by a number of processes including the following:
• the Annual report is drafted by appropriate senior management with overall coordination by the Chief Financial Officer to ensure consistency across sections;
• an extensive verification process is undertaken to ensure factual accuracy; and
• comprehensive reviews of drafts of the report are undertaken by members of the Executive Committee and other senior management; and the final draft is reviewed by the Audit Committee prior to consideration by the Board.
Responsibility statement
We confirm that to the best of our knowledge:
• the financial statements, prepared in accordance with the applicable set of accounting standards, give a true and fair view of the assets, liabilities, financial position and profit or loss of the Company and its subsidiaries included in the consolidation as a whole; and
• the Strategic report includes a fair review of the development of the business and the position of the Company and its subsidiaries included in the consolidation taken as a whole, together with a description of the principal risks and uncertainties that they face.
By order of the Board
Mark AmsdenCompany Secretary9 March 2016
Directors’ report continuedStatement of Directors’ responsibilities in respect of the
Annual report and financial statements
46 Wm Morrison Supermarkets PLC Governance

Report on the financial statements
Our opinionIn our opinion:
• Wm Morrison Supermarkets PLC’s Group financial statements and Company financial statements (the “financial statements”) give a true and fair view of the state of the Group’s and of the Company’s affairs as at 31 January 2016 and of the Group’s profit and cash flows for the 52 week period (the “period”) then ended;
• the Group financial statements have been properly prepared in accordance with International Financial Reporting Standards (IFRSs) as adopted by the European Union;
• the Company financial statements have been properly prepared in accordance with United Kingdom Generally Accepted Accounting Practice; and• the financial statements have been prepared in accordance with the requirements of the Companies Act 2006 and, as regards the Group financial
statements, Article 4 of the IAS Regulation.
What we have auditedThe financial statements, included within the Annual report and Financial Statements (the “Annual report”), comprise:
• the consolidated balance sheet as at 31 January 2016;• the Company balance sheet as at 31 January 2016;• the consolidated statement of comprehensive income for the period then ended;• the consolidated cash flow statement for the period then ended;• the consolidated statement of changes in equity for the period then ended; and• the notes to the financial statements, which include other explanatory information.
Certain required disclosures have been presented elsewhere in the Annual report, rather than in the notes to the financial statements. These are cross-referenced from the financial statements and are identified as audited.
The financial reporting framework that has been applied in the preparation of the Group financial statements is applicable law and IFRSs as adopted by the European Union. The financial reporting framework that has been applied in the preparation of the Company financial statements is United Kingdom Accounting Standards, comprising FRS 101 “reduced Disclosure Framework”, and applicable law (United Kingdom Generally Accepted Accounting Practice).
Our audit approachOverview
Audit scope
Materiality
Areas of focus
Materiality• Overall Group materiality: £12m which represents 5% of Underlying profit before tax (2015: £17.25m).
Audit scope• The Group engagement team conducted the majority of our audit work in the UK, with specified procedures
undertaken by a PwC component auditor in the Isle of Man. In addition, a PwC component audit team undertook a full scope audit of the UK Manufacturing subsidiaries.
• Taken together, the territories and functions where we performed our work accounted for 99% of Group revenues.
Areas of focus• Impairment of property.• Onerous lease provisions and onerous property commitments.• Commercial income and promotional funding.• Capitalisation and impairment of intangible assets.• Stock valuation.
The scope of our audit and our areas of focusWe conducted our audit in accordance with International Standards on Auditing (UK and Ireland) (“ISAs (UK & Ireland)”).
We designed our audit by determining materiality and assessing the risks of material misstatement in the financial statements. In particular, we looked at areas where the Directors made subjective judgements, for example in respect of significant accounting estimates that involved making assumptions and considering future events that are inherently uncertain. As in all of our audits we also addressed the risk of management override of internal controls, including evaluating whether there was evidence of bias by the Directors that represented a risk of material misstatement due to fraud.
Independent auditors’ report to the members of Wm Morrison Supermarkets PLC
47Annual report and financial statements 2015/16

The risks of material misstatement that had the greatest effect on our audit, including the allocation of our resources and effort, are identified as “areas of focus” in the table below. We have also set out how we tailored our audit to address these specific areas in order to provide an opinion on the financial statements as a whole, and any comments we make on the results of our procedures should be read in this context. This is not a complete list of all risks identified by our audit.
Area of focus How our audit addressed the area of focus
Impairment of propertyRefer to note 3.1 (Accounting policies), page 59 (Critical accounting estimates and judgements) and note 3.3 (Property, plant and equipment).
The Group has a large freehold store estate (£5,966m at 31 January 2016). Given the challenging trading conditions in the UK grocery retail market in recent years and subsequent adverse impact on the market value of traditional supermarket freehold stores, the possibility of impairment of these assets is an area of focus for management.
Management considers each store to be a cash generating unit (CGU) and has calculated the recoverable amount of each CGU as the higher of value in use and fair value less costs of disposal.
Value in useValue in use is based on discounted future cash flow forecasts, requiring management to make judgements on certain key inputs including, for example, discount rates and long term growth rates.
Fair value less costs of disposalFair value less costs of disposal is estimated by management based on their knowledge of individual stores, likely demand from grocers or other retailers in the event those stores were for sale and is further informed by a valuation performed by a third party valuer. The key judgements made by the Directors in this fair value calculation relate to the estimated rental values and the yields of the stores.
In the prior year an impairment charge of £1,113m was recognised in respect of freehold property. Management has calculated that no further impairment is required in the current year. We focused on this area because of the judgemental factors involved in reaching this conclusion, and the significant carrying value of freehold property.
Value in useOur audit procedures included a detailed evaluation of the Group’s budgeting procedures (upon which forecasts underlying the value in use calculations are based) and an assessment of management’s discounted cash flow models. We tested the mathematical accuracy of the calculations derived from each forecast model and assessed key inputs in the calculations such as the discount rate of 9%, by reference to management’s forecasts, industry reports and our valuation experts. We focused on these key assumptions because small changes can have a material impact on the value in use assessment and any resultant impairment charge. We found, based on our audit work, that the key assumptions used by management were supportable and appropriate in light of the current environment.
Fair value less costs of disposalManagement has determined their own view of estimated rental values and yields for each store used in their calculation of market values. Management derived these assumptions having considered available information such as industry data on market conditions, purchase offers recently received for properties and information from an independent third party valuer. We evaluated management’s supporting information, including the third party valuation, and assessed this for reasonableness using our own Real Estate experts, with a particular focus on the assumptions and methodology used obtaining third party evidence and market data to corroborate the assumptions. We also evaluated the competency, qualifications, experience and objectivity of management’s property valuation experts and noted no issues. We determined that the valuations performed by management are reasonable.
In addition, we evaluated the adequacy of the disclosures made in note 3.3 of the financial statements, including those regarding the key assumptions and sensitivities to changes in such assumptions by comparing the disclosures against the requirements of IAS 36 ‘Impairment of assets’ and found them to be consistent.
Onerous lease provisions and onerous property commitmentsRefer to note 5.1 (Accounting policies), page 59 (Critical accounting estimates and judgements) and note 5.5.
Onerous lease provisionsAccounting standards require management to assess the Group’s leasehold properties to identify where the expected future benefits from a property are less than the future lease commitments which would indicate that an onerous lease provision is required. Under IAS 37 ‘Provisions, contingent liabilities and contingent assets’ such a provision is made for the unavoidable costs of the contract, defined in the standard as the “least net cost of exit.”
We focused on this area because of the judgements required to be made by management in identifying those stores requiring an onerous lease provision and the assumptions used in the models, such as the discount rate and those used in developing the associated cash flow forecasts.
Onerous property commitmentsThe Group has a number of sites that they are contractually committed to purchase. Where management believes that an adverse outcome would result from developing the store, a provision is made. There are judgements involved in determining the expected realisable value of these sites and therefore this has been an area of focus during our audit.
Onerous lease provisionsHaving considered the possibility of impairment in the value of freehold properties (see above), we also tested management’s calculations in respect of leasehold stores where the estimated future benefits are not expected to exceed the future lease commitments, resulting in an onerous lease.
We obtained management’s onerous lease model, which includes all their leased stores, and tested the accuracy and completeness of key data by agreeing inputs such as individual store cash flows, store locations, which helps provide an insight into store profitability, and lease expiry dates for a sample of stores to the original signed lease agreements, noting no issues.
We evaluated the Group’s budgeting procedures (upon which forecasts are based) and assessed the principles of the Group’s discounted cash flow model, noting no exceptions. We tested the mathematical accuracy of the calculation derived from each forecast model and assessed key inputs in the calculations such as revenue growth and discount rate, by reference to management’s forecasts, analyst reports and our own Real Estate experts, with no issues noted. The discount rate used is consistent with the Group’s cost of debt and the requirements of IAS 37.
Onerous property commitmentsIn respect of onerous property commitments, we obtained management’s calculations and considered the accuracy of these provisions by performing recalculations and testing key inputs such as estimates of lease exit costs. We considered the completeness of these provisions by reviewing documentation in relation to these contracts. We found no issues in this area.
Independent auditors’ report to the members of Wm Morrison Supermarkets PLC continued
48 Wm Morrison Supermarkets PLC Financial statements
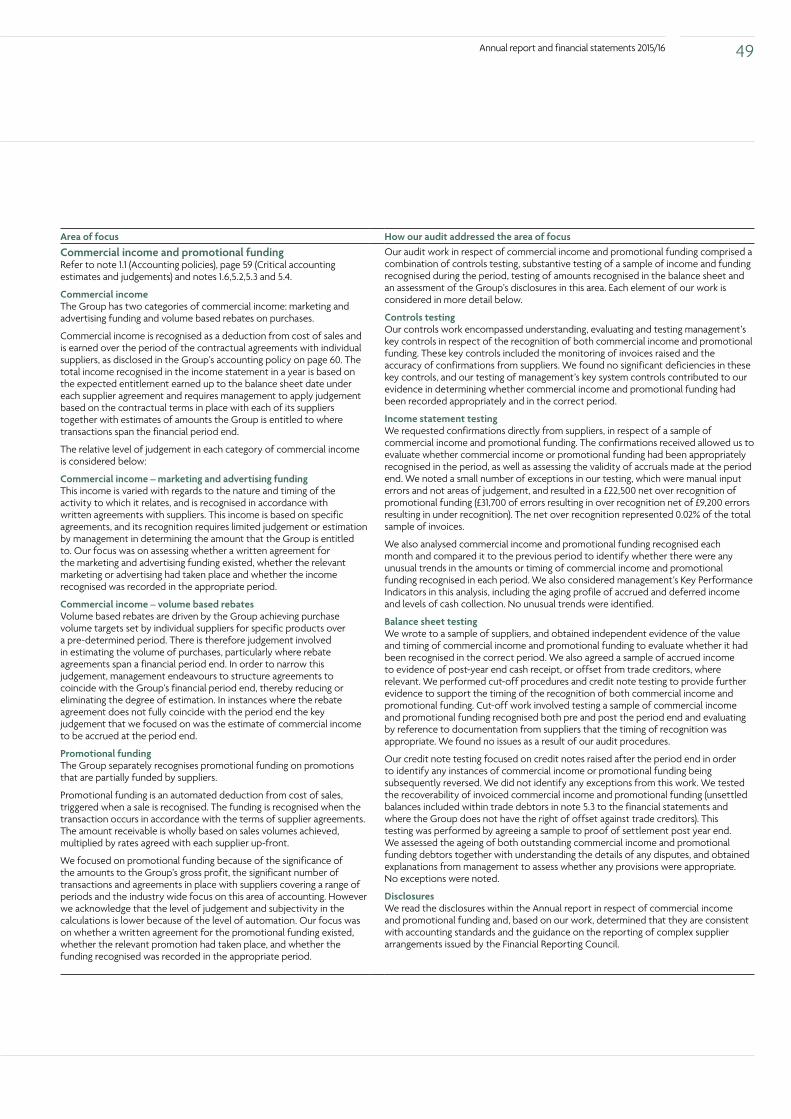
Area of focus How our audit addressed the area of focus
Commercial income and promotional fundingRefer to note 1.1 (Accounting policies), page 59 (Critical accounting estimates and judgements) and notes 1.6,5.2,5.3 and 5.4.
Commercial incomeThe Group has two categories of commercial income: marketing and advertising funding and volume based rebates on purchases.
Commercial income is recognised as a deduction from cost of sales and is earned over the period of the contractual agreements with individual suppliers, as disclosed in the Group’s accounting policy on page 60. The total income recognised in the income statement in a year is based on the expected entitlement earned up to the balance sheet date under each supplier agreement and requires management to apply judgement based on the contractual terms in place with each of its suppliers together with estimates of amounts the Group is entitled to where transactions span the financial period end.
The relative level of judgement in each category of commercial income is considered below:
Commercial income – marketing and advertising funding This income is varied with regards to the nature and timing of the activity to which it relates, and is recognised in accordance with written agreements with suppliers. This income is based on specific agreements, and its recognition requires limited judgement or estimation by management in determining the amount that the Group is entitled to. Our focus was on assessing whether a written agreement for the marketing and advertising funding existed, whether the relevant marketing or advertising had taken place and whether the income recognised was recorded in the appropriate period.
Commercial income – volume based rebates Volume based rebates are driven by the Group achieving purchase volume targets set by individual suppliers for specific products over a pre-determined period. There is therefore judgement involved in estimating the volume of purchases, particularly where rebate agreements span a financial period end. In order to narrow this judgement, management endeavours to structure agreements to coincide with the Group’s financial period end, thereby reducing or eliminating the degree of estimation. In instances where the rebate agreement does not fully coincide with the period end the key judgement that we focused on was the estimate of commercial income to be accrued at the period end.
Promotional funding The Group separately recognises promotional funding on promotions that are partially funded by suppliers.
Promotional funding is an automated deduction from cost of sales, triggered when a sale is recognised. The funding is recognised when the transaction occurs in accordance with the terms of supplier agreements. The amount receivable is wholly based on sales volumes achieved, multiplied by rates agreed with each supplier up-front.
We focused on promotional funding because of the significance of the amounts to the Group’s gross profit, the significant number of transactions and agreements in place with suppliers covering a range of periods and the industry wide focus on this area of accounting. However we acknowledge that the level of judgement and subjectivity in the calculations is lower because of the level of automation. Our focus was on whether a written agreement for the promotional funding existed, whether the relevant promotion had taken place, and whether the funding recognised was recorded in the appropriate period.
Our audit work in respect of commercial income and promotional funding comprised a combination of controls testing, substantive testing of a sample of income and funding recognised during the period, testing of amounts recognised in the balance sheet and an assessment of the Group’s disclosures in this area. Each element of our work is considered in more detail below.
Controls testing Our controls work encompassed understanding, evaluating and testing management’s key controls in respect of the recognition of both commercial income and promotional funding. These key controls included the monitoring of invoices raised and the accuracy of confirmations from suppliers. We found no significant deficiencies in these key controls, and our testing of management’s key system controls contributed to our evidence in determining whether commercial income and promotional funding had been recorded appropriately and in the correct period.
Income statement testing We requested confirmations directly from suppliers, in respect of a sample of commercial income and promotional funding. The confirmations received allowed us to evaluate whether commercial income or promotional funding had been appropriately recognised in the period, as well as assessing the validity of accruals made at the period end. We noted a small number of exceptions in our testing, which were manual input errors and not areas of judgement, and resulted in a £22,500 net over recognition of promotional funding (£31,700 of errors resulting in over recognition net of £9,200 errors resulting in under recognition). The net over recognition represented 0.02% of the total sample of invoices.
We also analysed commercial income and promotional funding recognised each month and compared it to the previous period to identify whether there were any unusual trends in the amounts or timing of commercial income and promotional funding recognised in each period. We also considered management’s Key Performance Indicators in this analysis, including the aging profile of accrued and deferred income and levels of cash collection. No unusual trends were identified.
Balance sheet testing We wrote to a sample of suppliers, and obtained independent evidence of the value and timing of commercial income and promotional funding to evaluate whether it had been recognised in the correct period. We also agreed a sample of accrued income to evidence of post-year end cash receipt, or offset from trade creditors, where relevant. We performed cut-off procedures and credit note testing to provide further evidence to support the timing of the recognition of both commercial income and promotional funding. Cut-off work involved testing a sample of commercial income and promotional funding recognised both pre and post the period end and evaluating by reference to documentation from suppliers that the timing of recognition was appropriate. We found no issues as a result of our audit procedures.
Our credit note testing focused on credit notes raised after the period end in order to identify any instances of commercial income or promotional funding being subsequently reversed. We did not identify any exceptions from this work. We tested the recoverability of invoiced commercial income and promotional funding (unsettled balances included within trade debtors in note 5.3 to the financial statements and where the Group does not have the right of offset against trade creditors). This testing was performed by agreeing a sample to proof of settlement post year end. We assessed the ageing of both outstanding commercial income and promotional funding debtors together with understanding the details of any disputes, and obtained explanations from management to assess whether any provisions were appropriate. No exceptions were noted.
Disclosures We read the disclosures within the Annual report in respect of commercial income and promotional funding and, based on our work, determined that they are consistent with accounting standards and the guidance on the reporting of complex supplier arrangements issued by the Financial Reporting Council.
49Annual report and financial statements 2015/16

Area of focus How our audit addressed the area of focus
Capitalisation and impairment of intangible assetsRefer to note 3.1 (Accounting policies) and page 59 (Critical accounting estimates and judgements).
The Group balance sheet includes capitalised intangible assets of £483m, of which the majority relates to software development costs incurred in connection with the Group’s IT improvement programme, details of which are shown on page 71 of the Annual report. The Group has developed a significant amount of its own software and systems that is used in the business.
We focused on this area because of the significance of the costs capitalised and the fact that there is judgement involved in assessing whether the criteria, set out in accounting standards, required for capitalisation of such costs have been met, including the likelihood of the project delivering sufficient future economic benefits. Where the costs incurred are internally generated (for example employee costs) there is further judgement required in the calculation, such as the accuracy of amount of time spent on the projects.
In light of the development of new software and systems, we also focused on whether the carrying value of existing capitalised software or systems was impaired.
We tested a sample of costs capitalised in the period to assess whether these had been appropriately treated in line with the Group’s accounting policy and accounting standards, most notably IAS 38 ‘Intangible assets’. We met with management responsible for particular costs to obtain an understanding of the associated projects and to independently assess whether project costs met the criteria for capitalisation as set out in accounting standards. We found the explanations obtained from management to be consistent with our understanding of developments in the business and supported management’s assessment that the costs met the relevant capitalisation criteria.
Where external third party contractors were used, we agreed the hours and charge out rates to the invoices issued by the contractor, and assessed whether the costs were directly related to a capital project, with no exceptions noted.
To determine whether internal employee costs were directly attributable to projects, we obtained listings of hours worked on individual projects for the employment costs capitalised. We selected a sample of the individual hours recorded and obtained an understanding of the work performed by the employee. We also checked that the hours charged equated to the value of costs capitalised by comparing the proportion of costs capitalised to the employee’s salary, without exception.
We obtained management’s assessment as to whether the development of new software or systems superseded or impaired any of the existing assets on the balance sheet. We also applied our own understanding of both new and existing projects and considered whether, in our view, any existing software was no longer in use or whether its life had been shortened by development activity. We found no such items.
We re-visited the expected costs budgeted by management within the cost benefit analysis and compared them to actual outcomes in the current period and we assessed the future expected benefits of the projects, with no issues identified from our work.
Overall we found that the costs capitalised were supportable and consistent with the requirements of accounting standards for capitalising such costs. No material impairment of the intangible assets was identified from our work.
Independent auditors’ report to the members of Wm Morrison Supermarkets PLC continued
50 Wm Morrison Supermarkets PLC Financial statements

Area of focus How our audit addressed the area of focus
Stock valuationRefer to note 5.1 (Accounting policies), page 59 (Critical accounting estimates and judgements) and note 5.2.
The valuation of stock of £616m (2015: £658m) was focused on because of the nature of the judgements made by management when assessing the level of provisions required. As disclosed in note 5.1 to the financial statements, provisions are held against stock for estimated losses related to shrinkage and obsolescence as well as a deduction for unearned commercial income (as the stock related to that commercial income and promotional funding has yet to be sold). When the stock is sold the commercial income and/or promotional funding is recognised in the income statement.
As stock is counted by the Group on a cyclical basis, rather than in full at the period end date, the shrinkage provision at 31 January 2016 contains a degree of estimation.
We attended stock counts throughout the period at a sample of the Group’s supermarkets, distribution centres and manufacturing locations. In addition to performing sample test counts, we assessed the effectiveness of the count controls in operation at each site. We also evaluated the results of other cycle counts performed by management and third parties throughout the period to assess the level of count variances. We found no material variances or control deficiencies across these sites.
We tested management’s shrinkage assumptions determined by the count procedures and their comparison of this to historical data. The historical data included the results of the recent counts at each location, and our analytical procedures did not identify any significant unusual fluctuations in the data.
The obsolescence provision is calculated by applying a judgemental percentage to the period end stock levels, with this judgement being informed by historical data on the levels of obsolescence as well as management’s view of the current stock profile and age. We considered this provision by assessing the accuracy of the historical data versus actual outcomes, and assessing the explanations provided by management on the current profile and age, noting no issues.
We tested the unearned commercial income deduction by performing a recalculation using the profile of period end stock and the trends of commercial income historically received, with no issues noted.
How we tailored the audit scopeWe tailored the scope of our audit to ensure that we performed enough work to be able to give an opinion on the financial statements as a whole, taking into account the geographic structure of the Group, the accounting processes and controls, and the industry in which the Group operates. Taken together, the territories and functions where we performed our work accounted for 99% of Group revenues.
The Group’s accounting process is structured around a group finance function at its head office in Bradford. Within the head office, supporting finance functions exist for each of the key business operating areas (Group, Supermarkets (including Manufacturing) and Property), and these report to the group finance team as appropriate. The Group also maintains local finance teams at each of its key manufacturing sites. Other than group reporting from a component audit team from a PwC member firm in the Isle of Man auditing specific account balances within Farock Insurance Company Limited, and from a PwC component team from the UK firm auditing the complete financial information of a UK Manufacturing subsidiary, Wm Produce Limited, both of which operated under our instructions, all work was conducted in the UK by the same Group audit team.
Where the work was performed by the component auditors, we determined the level of involvement we needed to have in their audit work to be able to conclude whether sufficient appropriate audit evidence had been obtained as a basis for our opinion on the Group financial statements as a whole. As part of our year end audit procedures, we held detailed discussions with the Isle of Man and UK Manufacturing component audit teams, including holding a detailed planning meeting with them and attending the audit clearance meeting with management by conference call (Isle of Man) or in person (UK Manufacturing).
51Annual report and financial statements 2015/16

MaterialityThe scope of our audit was influenced by our application of materiality. We set certain quantitative thresholds for materiality. These, together with qualitative considerations, helped us to determine the scope of our audit and the nature, timing and extent of our audit procedures on the individual financial statement line items and disclosures and in evaluating the effect of misstatements, both individually and on the financial statements as a whole.
Based on our professional judgement, we determined materiality for the financial statements as a whole as follows:
Overall group materiality £12m (2015: £17.25m).How we determined it 5% of Underlying profit before tax.Rationale for benchmark applied Consistent with last year, we applied this benchmark because, in our view, this is the most relevant metric
against which the performance of the Group is most commonly measured. Underlying profit is defined by management as profit before impairment, onerous lease provisions and other similar items that do not relate to the Group’s principal activities on an ongoing basis, profit/loss arising on disposal and exit of properties and sale of businesses and IAS 19 pension interest, at a normalised tax rate, as reconciled in note 1.4 of the Group financial statements.
We agreed with the Audit Committee that we would report to them misstatements identified during our audit above £600,000 (2015: £875,000) as well as misstatements below that amount that, in our view, warranted reporting for qualitative reasons.
Going concernUnder the Listing Rules we are required to review the Directors’ statement, set out on page 44, in relation to going concern. We have nothing to report having performed our review.
Under ISAs (UK & Ireland) we are required to report to you if we have anything material to add or to draw attention to in relation to the Directors’ statement about whether they considered it appropriate to adopt the going concern basis in preparing the financial statements. We have nothing material to add or to draw attention to.
As noted in the Directors’ statement, the Directors have concluded that it is appropriate to adopt the going concern basis in preparing the financial statements. The going concern basis presumes that the Group and Company have adequate resources to remain in operation, and that the Directors intend them to do so, for at least one year from the date the financial statements were signed. As part of our audit we have concluded that the Directors’ use of the going concern basis is appropriate. However, because not all future events or conditions can be predicted, these statements are not a guarantee as to the Group’s and Company’s ability to continue as a going concern.
Other required reporting
Consistency of other informationCompanies Act 2006 opinionsIn our opinion:
• the information given in the Strategic report (on pages 2 to 21) and the Directors’ report (on pages 44 to 46) for the financial period for which the financial statements are prepared is consistent with the financial statements; and
• the information given in the Corporate governance statement set out on pages 22 to 32 with respect to internal control and risk management systems and about share capital structures is consistent with the financial statements.
Independent auditors’ report to the members of Wm Morrison Supermarkets PLC continued
52 Wm Morrison Supermarkets PLC Financial statements

ISAs (UK & Ireland) reporting
Under ISAs (UK & Ireland) we are required to report to you if, in our opinion:• information in the Annual report is:
– materially inconsistent with the information in the audited financial statements; or – apparently materially incorrect based on, or materially inconsistent with, our knowledge of the Group and Company acquired in the course of performing our audit; or
– otherwise misleading.
We have no exceptions to report.
• the statement given by the Directors on page 46, in accordance with provision C.1.1 of the UK Corporate Governance Code (the “Code”), that they consider the Annual report taken as a whole to be fair, balanced and understandable and provides the information necessary for members to assess the Group’s and company’s position and performance, business model and strategy is materially inconsistent with our knowledge of the Group and Company acquired in the course of performing our audit.
We have no exceptions to report.
• the section of the Annual report on page 28, as required by provision C.3.8 of the Code, describing the work of the Audit Committee does not appropriately address matters communicated by us to the Audit Committee.
We have no exceptions to report.
The Directors’ assessment of the prospects of the Group and of the principal risks that would threaten the solvency or liquidity of the GroupUnder ISAs (UK & Ireland) we are required to report to you if we have anything material to add or to draw attention to in relation to:• the Directors’ confirmation on page 17 of the Annual report, in accordance with provision C.2.1 of the Code, that they
have carried out a robust assessment of the principal risks facing the Group, including those that would threaten its business model, future performance, solvency or liquidity.
We have nothing material to add or to draw attention to.
• the disclosures in the Annual report that describe those risks and explain how they are being managed or mitigated. We have nothing material to add or to draw attention to.
• the Directors’ explanation on page 19 of the Annual report, in accordance with provision C.2.2 of the Code, as to how they have assessed the prospects of the Group, over what period they have done so and why they consider that period to be appropriate, and their statement as to whether they have a reasonable expectation that the Group will be able to continue in operation and meet its liabilities as they fall due over the period of their assessment, including any related disclosures drawing attention to any necessary qualifications or assumptions.
We have nothing material to add or to draw attention to.
Under the Listing Rules we are required to review the Directors’ statement that they have carried out a robust assessment of the principal risks facing the Group and the Directors’ statement in relation to the longer-term viability of the Group. Our review was substantially less in scope than an audit and only consisted of making inquiries and considering the Directors’ process supporting their statements; checking that the statements are in alignment with the relevant provisions of the Code; and considering whether the statements are consistent with the knowledge acquired by us in the course of performing our audit. We have nothing to report having performed our review.
Adequacy of accounting records and information and explanations receivedUnder the Companies Act 2006 we are required to report to you if, in our opinion:
• we have not received all the information and explanations we require for our audit; or
• adequate accounting records have not been kept by the Company, or returns adequate for our audit have not been received from branches not visited by us; or
• the Company financial statements and the part of the Directors’ Remuneration Report to be audited are not in agreement with the accounting records and returns.
We have no exceptions to report arising from this responsibility.
53Annual report and financial statements 2015/16

Directors’ remunerationDirectors’ remuneration report – Companies Act 2006 opinionIn our opinion, the part of the Directors’ Remuneration Report to be audited has been properly prepared in accordance with the Companies Act 2006.
Other Companies Act 2006 reportingUnder the Companies Act 2006 we are required to report to you if, in our opinion, certain disclosures of Directors’ remuneration specified by law are not made. We have no exceptions to report arising from this responsibility.
Corporate governance statementUnder the Companies Act 2006 we are required to report to you if, in our opinion, a corporate governance statement has not been prepared by the Company. We have no exceptions to report arising from this responsibility.
Under the Listing Rules we are required to review the part of the Corporate governance statement relating to ten further provisions of the Code. We have nothing to report having performed our review.
Responsibilities for the financial statements and the audit
Our responsibilities and those of the DirectorsAs explained more fully in the Directors’ Responsibilities Statement set out on page 46, the Directors are responsible for the preparation of the financial statements and for being satisfied that they give a true and fair view.
Our responsibility is to audit and express an opinion on the financial statements in accordance with applicable law and ISAs (UK & Ireland). Those standards require us to comply with the Auditing Practices Board’s Ethical Standards for Auditors.
This report, including the opinions, has been prepared for and only for the Company’s members as a body in accordance with Chapter 3 of Part 16 of the Companies Act 2006 and for no other purpose. We do not, in giving these opinions, accept or assume responsibility for any other purpose or to any other person to whom this report is shown or into whose hands it may come save where expressly agreed by our prior consent in writing.
What an audit of financial statements involvesAn audit involves obtaining evidence about the amounts and disclosures in the financial statements sufficient to give reasonable assurance that the financial statements are free from material misstatement, whether caused by fraud or error. This includes an assessment of:
• whether the accounting policies are appropriate to the Group’s and the Company’s circumstances and have been consistently applied and adequately disclosed;
• the reasonableness of significant accounting estimates made by the Directors; and
• the overall presentation of the financial statements.
We primarily focus our work in these areas by assessing the Directors’ judgements against available evidence, forming our own judgements, and evaluating the disclosures in the financial statements.
We test and examine information, using sampling and other auditing techniques, to the extent we consider necessary to provide a reasonable basis for us to draw conclusions. We obtain audit evidence through testing the effectiveness of controls, substantive procedures or a combination of both.
In addition, we read all the financial and non-financial information in the Annual report to identify material inconsistencies with the audited financial statements and to identify any information that is apparently materially incorrect based on, or materially inconsistent with, the knowledge acquired by us in the course of performing the audit. If we become aware of any apparent material misstatements or inconsistencies we consider the implications for our report.
Andrew Paynter (Senior Statutory Auditor)for and on behalf of PricewaterhouseCoopers LLPChartered Accountants and Statutory AuditorsLeeds9 March 2016
Independent auditors’ report to the members of Wm Morrison Supermarkets PLC continued
54 Wm Morrison Supermarkets PLC Financial statements

Note2016
£m2015
£m
Revenue 1.2 16,122 16,816
Cost of sales (15,505) (16,055)
Gross profit 617 761
Other operating income 72 78
Profit on disposal and exit of properties and sale of businesses 1.4, 4.5 97 135
Administrative expenses (472) (1,670)
Operating profit/(loss) 1.6 314 (696)
Finance costs 6.2 (112) (105)
Finance income 6.2 13 7
Share of profit of joint venture (net of tax) 4.2 2 2
Profit/(loss) before taxation 217 (792)
Analysed as:
Underlying profit before tax 242 345
Adjustments for:
Impairment and provision for onerous contracts 1.4 (87) (1,273)
Profit/loss on disposal and exit of properties 1.4 131 131
44 (1,142)
Pension scheme set-up costs 1.4, 8.7 (35) –
(Loss)/profit on disposal of businesses 1.4, 4.5 (34) 4
Net pension interest income 1.4, 8.2 – 1
217 (792)
Taxation 2.2 5 31
Profit/(loss) for the period attributable to the owners of the Company 222 (761)
Other comprehensive income/(expense)
Items that will not be reclassified to profit or loss:
Remeasurement of defined benefit pension schemes 8.2 236 (31)
Tax on defined benefit pension schemes 2.3 (47) 6
189 (25)
Items that may be reclassified subsequently to profit or loss:
Cash flow hedging movement 16 (9)
Tax on cash flow hedging movement 2.3 (4) 2
Exchange differences on translation of foreign operations 1 –
13 (7)
Other comprehensive income/(expense) for the period, net of tax 202 (32)
Total comprehensive income /(expense) for the period attributable to the owners of the Company 424 (793)
Earnings per share (pence)
– basic 1.5 9.51 (32.63)
– diluted 1.5 9.47 (32.63)
Consolidated statement of comprehensive income52 weeks ended 31 January 2016
55Annual report and financial statements 2015/16

Consolidated balance sheet31 January 2016
Note2016
£m2015
£m
AssetsNon-current assetsGoodwill and intangible assets 3.2 483 520Property, plant and equipment 3.3 7,161 7,252Investment property 3.5 37 68Net pension asset 8.2 186 4Investment in joint venture 4.2 63 68Investments 4.3 31 31Derivative financial assets 7.3 30 –
7,991 7,943Current assetsStock 5.2 616 658Debtors 5.3 192 239Derivative financial assets 7.3 12 6Cash and cash equivalents 6.4 488 241
1,308 1,144Non-current assets classified as held-for-sale 3.4 – 84
1,308 1,228LiabilitiesCurrent liabilitiesCreditors 5.4 (2,518) (2,221)Short term borrowings 6.3 (201) (11)Derivative financial liabilities 7.3 (17) (18)Current tax liabilities (11) (23)
(2,747) (2,273)Non-current liabilitiesBorrowings 6.3 (2,003) (2,508)Derivative financial liabilities 7.3 (55) (50)Deferred tax liabilities 2.3 (429) (415)Net pension liabilities 8.2 – (43)Provisions 5.5 (309) (288)
(2,796) (3,304)Net assets 3,756 3,594
Shareholders’ equityShare capital 6.5 234 234Share premium 6.5 127 127Capital redemption reserve 6.6 39 39Merger reserve 6.6 2,578 2,578Retained earnings and hedging reserve 6.6 778 616Total equity attributable to the owners of the Company 3,756 3,594
The notes on pages 60 to 97 form part of these financial statements.
The financial statements on pages 55 to 97 were approved by the Board of Directors on 9 March 2016 and were signed on its behalf by:
Trevor StrainChief Financial Officer
56 Wm Morrison Supermarkets PLC Financial statements

Consolidated cash flow statement52 weeks ended 31 January 2016
Note2016
£m2015
£m
Cash flows from operating activitiesCash generated from operations 5.6 1,026 970Interest paid (99) (106)Taxation (paid)/received (41) 10Net cash inflow from operating activities 886 874
Cash flows from investing activitiesInterest received 4 4Dividends received from joint venture 10.1 8 –Proceeds from the sale of property, plant and equipment 300 448Proceeds from the sale of businesses 4.5 20 2Purchase of property, plant and equipment and investment property (266) (385)Purchase of intangible assets (99) (135)Net cash outflow from investing activities (33) (66)
Cash flows from financing activitiesPurchase of shares in subsidiary 4.4 (3) –Purchase of own shares for trust 6.5 (13) (8)New borrowings – 296Net repayment of revolving credit facility (320) (256)Repayment of other borrowings (10) (550)Dividends paid 1.8 (260) (308)Net cash outflow from financing activities (606) (826)
Net increase/(decrease) in cash and cash equivalents 247 (18)Cash and cash equivalents at start of period 240 258Cash and cash equivalents at end of period 6.4 487 240
Reconciliation of net cash flow to movement in net debt in the period
Note2016
£m2015
£m
Net increase/(decrease) in cash and cash equivalents 247 (18)Cash outflow from decrease in debt 330 806Cash inflow from increase in borrowings – (296)Non-cash movements 17 (15)Opening net debt (2,340) (2,817)Closing net debt 6.4 (1,746) (2,340)
57Annual report and financial statements 2015/16

Consolidated statement of changes in equity52 weeks ended 31 January 2016
Attributable to the owners of the Company
Note
Share capital
£m
Share premium
£m
Capital redemption
reserve£m
Merger reserve
£m
Hedging reserve
£m
Retained earnings
£m
Total equity
£m
Current period
At 2 February 2015 234 127 39 2,578 (22) 638 3,594Profit for the period – – – – – 222 222Other comprehensive income/(expense):
Cash flow hedging movement – – – – 16 – 16Exchange differences on translation of foreign operations – – – – – 1 1Pension remeasurement 8.2 – – – – – 236 236Tax in relation to components of other comprehensive income 2.3 – – – – (4) (47) (51)
Total comprehensive income for the period – – – – 12 412 424Purchase of trust shares 6.5 – – – – – (13) (13)Employee share option schemes:
Share-based payments 1.7 – – – – – 11 11Dividends 1.8 – – – – – (260) (260)Total transactions with owners – – – – – (262) (262)At 31 January 2016 234 127 39 2,578 (10) 788 3,756
Attributable to the owners of the Company
Note
Share capital
£m
Share premium
£m
Capital redemption
reserve£m
Merger reserve
£m
Hedging reserve
£m
Retained earnings
£m
Total equity
£m
Prior period At 3 February 2014 234 127 39 2,578 (15) 1,729 4,692Loss for the period – – – – – (761) (761)Other comprehensive (expense)/income:
Cash flow hedging movement – – – – (9) – (9)Pension remeasurement 8.2 – – – – – (31) (31)Tax in relation to components of other comprehensive income 2.3 – – – – 2 6 8
Total comprehensive expense for the period – – – – (7) (786) (793)Purchase of trust shares 6.5 – – – – – (8) (8)Employee share option schemes:
Share-based payments 1.7 – – – – – 11 11Dividends 1.8 – – – – – (308) (308)Total transactions with owners – – – – – (305) (305)At 1 February 2015 234 127 39 2,578 (22) 638 3,594
58 Wm Morrison Supermarkets PLC Financial statements

Company informationWm Morrison Supermarkets PLC is a public limited company incorporated in the United Kingdom under the Companies Act 2006 (Registration number 358949). The Company is domiciled in the United Kingdom and its registered address is Hilmore House, Gain Lane, Bradford, BD3 7DL, United Kingdom.
Basis of preparationThe financial statements have been prepared for the 52 weeks ended 31 January 2016 (2015: 52 weeks ended 1 February 2015) in accordance with International Financial Reporting Standards (IFRS) and International Financial Reporting Standards Interpretation Committee (IFRS IC) interpretations as adopted by the European Union and with those parts of the Companies Act 2006 applicable to companies reporting under IFRS. IFRS and IFRS IC interpretations are issued by the International Accounting Standards Board (the IASB) and must be adopted into European Union law, referred to as endorsement, before they become mandatory under the IAS Regulation.
The financial statements have been prepared on a going concern basis.
The financial statements are presented in pounds sterling, rounded to the nearest million, except in some instances, where it is deemed relevant to disclose the amounts up to two decimal places. They are drawn up on the historical cost basis of accounting, except as disclosed in the accounting policies set out within these financial statements.
The Group’s accounting policies have, unless otherwise stated, been applied consistently to all periods presented in these financial statements.
Accounting reference dateThe accounting period of the Group ends on the Sunday falling between 29 January and 4 February each year.
New IFRS and amendments to IAS and interpretationsThe following amendments to standards are mandatory for the first time for the 52 weeks ended 31 January 2016:
• IFRIC 21, ‘Levies’;
• Improvements 2011-13;
• Improvements 2010-12; and
• Amendment to IAS 19: Defined benefit plans: Employee contributions.
There are a number of standards and interpretations issued by the IASB that are effective for financial statements after this reporting period, including IFRS 9 ‘Financial instruments’ and IFRS 15 ‘Revenue from contracts with customers’, both of which are effective for annual periods beginning on or after 1 January 2018, and IFRS 16 ‘Leases’ which is effective for annual periods beginning on or after 1 January 2019.
The Group is in the process of assessing the impact that the application of these standards and interpretations will have on the Group’s financial statements.
Basis of consolidationSubsidiaries (including partnerships) are all entities over which the Group has control. The Group controls an entity when it has power over an entity, is exposed to, or has rights to, variable returns from its involvement with the entity and has the ability to affect those returns through its power over the entity. Subsidiaries are fully consolidated from the date on which control is transferred to the Group. They are deconsolidated from the date the control ceases. The financial statements of subsidiaries used in the consolidation are prepared for the same reporting period as the parent Company and are based on consistent accounting policies. Intra-group balances and any unrealised gains and losses or income and expenses arising from intra-group transactions are eliminated on consolidation.
As described in note 4.5 the Group disposed of its investment in Wm Morrison Convenience Stores Limited on 26 October 2015. This subsidiary has been deconsolidated from that date.
Foreign currencies Transactions in foreign currencies are recorded at the rates of exchange at the dates of the transactions. At each balance sheet date, monetary assets and liabilities that are denominated in foreign currency are retranslated at the rates of exchange at the balance sheet date. Gains and losses arising on retranslation are included in the income statement for the period.
Critical accounting judgements and estimates The judgements that have the most significant effect on the amounts recognised in these financial statements, and sources of estimation uncertainty that have a significant risk of resulting in material adjustment to carrying amounts in the next financial year, are:
• Impairment of property, plant and equipment and intangible assets and onerous property commitments (note 1.4, 3.1, 3.2, 3.3, 5.5);
• Commercial income (note 1.1, 1.6, 5.2, 5.3, 5.4);
• IT and intangible assets (note 3.2); and
• Stock (note 5.1, 5.2).
These are also described within the Corporate governance report on pages 29 to 30.
General information
59Annual report and financial statements 2015/16

1 Performance in the period
1.1 Accounting policiesRevenue recognitionSale of goods in-store and online, and fuelRevenue from the sale of goods in-store and online comprises cash from customers and excludes VAT. It is net of returns, colleague discounts, coupons, vouchers, ‘Match & More’ points earned in-store and online, and the free element of multi-save transactions. Sale of fuel is recognised net of VAT and ‘Match & More’ points earned on fuel. Revenue is recognised when transactions are completed in-store, or, in the case of food online, when goods are accepted by the customer on delivery.
Other revenueOther revenue includes income from concessions and commissions based on the terms of the contract, and manufacturing sales made direct to third party customers recognised on despatch of goods. Revenue collected on behalf of others is not recognised as revenue, other than the related commission. Sales are recorded net of VAT and intra-group transactions.
‘Match & More’ and other initiativesThe fair value of ‘Match & More’ points and other initiatives is determined to be the value to the customer of the points issued, adjusted for factors such as the expected redemption rate. ‘Match & More’ was launched in the prior year and the mechanism by which customers accrue points was adjusted during the year. The Group will continue to assess the appropriateness of the expected redemption rates against actual redemptions.
The fair value is treated as a deduction from revenue at the time the points are issued, and is deferred until the rewards are redeemed by the customer in a future sale.
Cost of salesCost of sales consists of all costs of the goods being sold to the point of sale, net of promotional funding and commercial income, and includes property, manufacturing, warehouse and transportation costs. Store depreciation, store overheads and store-based employee costs are also allocated to cost of sales.
Promotional funding Promotional funding refers to investment in the customer offer by suppliers by way of promotion. The calculation of funding is mechanical and system generated based on a funding level agreed in advance with the supplier. Funding is recognised as units are sold and invoiced in accordance with the specific supplier agreement. Funding is recorded effectively as a direct adjustment to the cost price of the product in the period. Funding is invoiced and collected through the year, shortly after the promotions have ended.
Commercial incomeCommercial income is recognised as a deduction from cost of sales, based on the expected entitlement that has been earned up to the balance sheet date for each relevant supplier contract. The Group only recognises commercial income where there is documented evidence of an agreement with an individual supplier and when associated performance conditions are met.
The types of commercial income recognised by the Group, and the recognition policies are:Type of commercial income Description Recognition
Marketing and advertising funding
Examples include income in respect of in-store marketing and point of sale, as well as funding for advertising.
Income is recognised over the period as set out in the specific supplier agreement. Income is invoiced once the performance conditions in the supplier agreement have been achieved.
Volume-based rebates Income earned by achieving volume or spend targets set by the supplier for specific products over specific periods.
Income is recognised through the year based on forecasts for expected sales or purchase volumes, informed by current performance, trends, and the terms of the supplier agreement. Income is invoiced throughout the year in accordance with the specific supplier terms. In order to minimise any risk arising from estimation, supplier confirmations are also obtained to agree the final value to be recognised at year end, prior to it being invoiced.
Uncollected commercial income at the balance sheet date is classified within the financial statements as follows:
• Creditors: A large proportion of the Group’s trading terms state that income due from suppliers is netted against amounts owing to that supplier. Any outstanding invoiced commercial income relating to these suppliers at the balance sheet date are included within trade payables. Any amounts received in advance of income being recognised are included in accruals and deferred income.
• Debtors: Where the trading terms described above do not exist, the Group classifies outstanding commercial income within trade debtors. Where commercial income is earned and not invoiced to the supplier at the balance sheet date, this is classified within accrued commercial income.
• Stock: The carrying value of stock is adjusted to reflect unearned elements of commercial income as the stock has not yet been sold. This income is subsequently recognised in cost of sales when the product has been sold.
Notes to the Group financial statements52 weeks ended 31 January 2016
60 Wm Morrison Supermarkets PLC Financial statements
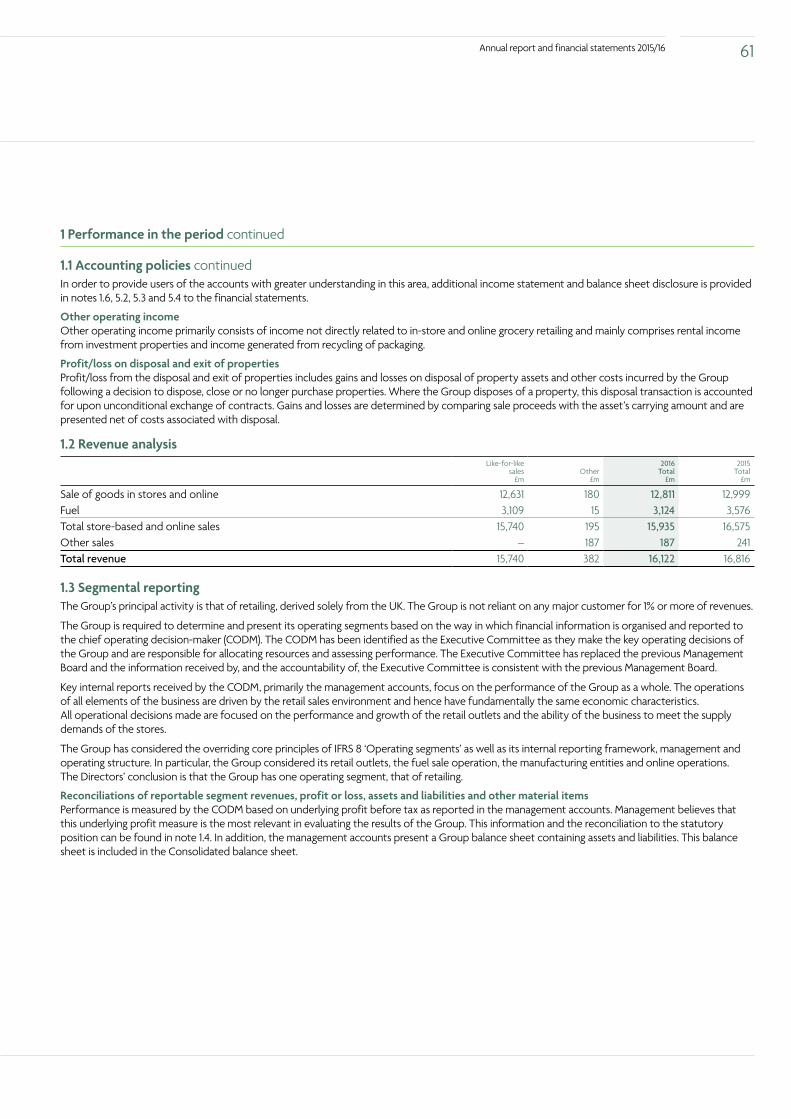
61Annual report and financial statements 2015/16
1 Performance in the period continued
1.1 Accounting policies continuedIn order to provide users of the accounts with greater understanding in this area, additional income statement and balance sheet disclosure is provided in notes 1.6, 5.2, 5.3 and 5.4 to the financial statements.
Other operating incomeOther operating income primarily consists of income not directly related to in-store and online grocery retailing and mainly comprises rental income from investment properties and income generated from recycling of packaging.
Profit/loss on disposal and exit of propertiesProfit/loss from the disposal and exit of properties includes gains and losses on disposal of property assets and other costs incurred by the Group following a decision to dispose, close or no longer purchase properties. Where the Group disposes of a property, this disposal transaction is accounted for upon unconditional exchange of contracts. Gains and losses are determined by comparing sale proceeds with the asset’s carrying amount and are presented net of costs associated with disposal.
1.2 Revenue analysisLike-for-like
sales£m
Other£m
2016 Total
£m
2015 Total
£m
Sale of goods in stores and online 12,631 180 12,811 12,999Fuel 3,109 15 3,124 3,576Total store-based and online sales 15,740 195 15,935 16,575Other sales – 187 187 241Total revenue 15,740 382 16,122 16,816
1.3 Segmental reportingThe Group’s principal activity is that of retailing, derived solely from the UK. The Group is not reliant on any major customer for 1% or more of revenues.
The Group is required to determine and present its operating segments based on the way in which financial information is organised and reported to the chief operating decision-maker (CODM). The CODM has been identified as the Executive Committee as they make the key operating decisions of the Group and are responsible for allocating resources and assessing performance. The Executive Committee has replaced the previous Management Board and the information received by, and the accountability of, the Executive Committee is consistent with the previous Management Board.
Key internal reports received by the CODM, primarily the management accounts, focus on the performance of the Group as a whole. The operations of all elements of the business are driven by the retail sales environment and hence have fundamentally the same economic characteristics. All operational decisions made are focused on the performance and growth of the retail outlets and the ability of the business to meet the supply demands of the stores.
The Group has considered the overriding core principles of IFRS 8 ‘Operating segments’ as well as its internal reporting framework, management and operating structure. In particular, the Group considered its retail outlets, the fuel sale operation, the manufacturing entities and online operations. The Directors’ conclusion is that the Group has one operating segment, that of retailing.
Reconciliations of reportable segment revenues, profit or loss, assets and liabilities and other material itemsPerformance is measured by the CODM based on underlying profit before tax as reported in the management accounts. Management believes that this underlying profit measure is the most relevant in evaluating the results of the Group. This information and the reconciliation to the statutory position can be found in note 1.4. In addition, the management accounts present a Group balance sheet containing assets and liabilities. This balance sheet is included in the Consolidated balance sheet.
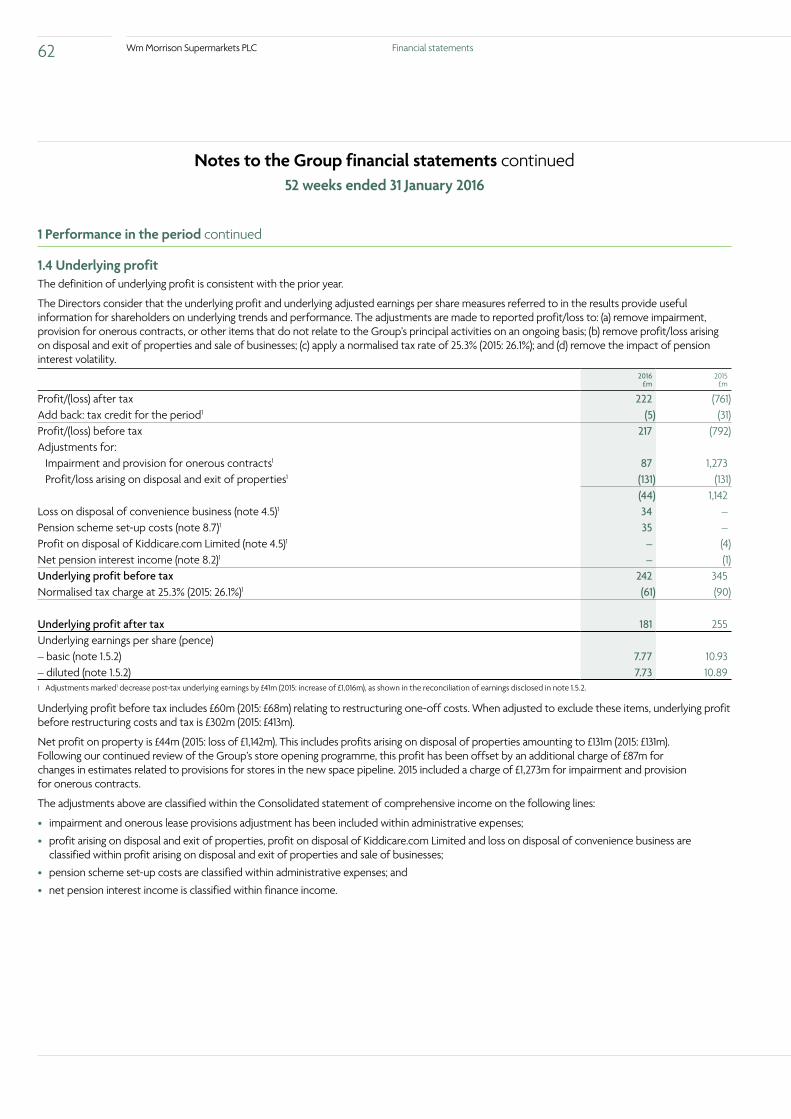
62 Wm Morrison Supermarkets PLC Financial statements
Notes to the Group financial statements continued52 weeks ended 31 January 2016
1 Performance in the period continued
1.4 Underlying profitThe definition of underlying profit is consistent with the prior year.
The Directors consider that the underlying profit and underlying adjusted earnings per share measures referred to in the results provide useful information for shareholders on underlying trends and performance. The adjustments are made to reported profit/loss to: (a) remove impairment, provision for onerous contracts, or other items that do not relate to the Group’s principal activities on an ongoing basis; (b) remove profit/loss arising on disposal and exit of properties and sale of businesses; (c) apply a normalised tax rate of 25.3% (2015: 26.1%); and (d) remove the impact of pension interest volatility.
2016 £m
2015 £m
Profit/(loss) after tax 222 (761)Add back: tax credit for the period1 (5) (31)Profit/(loss) before tax 217 (792)Adjustments for:
Impairment and provision for onerous contracts1 87 1,273Profit/loss arising on disposal and exit of properties1 (131) (131)
(44) 1,142Loss on disposal of convenience business (note 4.5)1 34 –Pension scheme set-up costs (note 8.7)1 35 –Profit on disposal of Kiddicare.com Limited (note 4.5)1 – (4)Net pension interest income (note 8.2)1 – (1)Underlying profit before tax 242 345Normalised tax charge at 25.3% (2015: 26.1%)1 (61) (90)
Underlying profit after tax 181 255Underlying earnings per share (pence)– basic (note 1.5.2) 7.77 10.93– diluted (note 1.5.2) 7.73 10.891 Adjustments marked1 decrease post-tax underlying earnings by £41m (2015: increase of £1,016m), as shown in the reconciliation of earnings disclosed in note 1.5.2.
Underlying profit before tax includes £60m (2015: £68m) relating to restructuring one-off costs. When adjusted to exclude these items, underlying profit before restructuring costs and tax is £302m (2015: £413m).
Net profit on property is £44m (2015: loss of £1,142m). This includes profits arising on disposal of properties amounting to £131m (2015: £131m). Following our continued review of the Group’s store opening programme, this profit has been offset by an additional charge of £87m for changes in estimates related to provisions for stores in the new space pipeline. 2015 included a charge of £1,273m for impairment and provision for onerous contracts.
The adjustments above are classified within the Consolidated statement of comprehensive income on the following lines:
• impairment and onerous lease provisions adjustment has been included within administrative expenses;
• profit arising on disposal and exit of properties, profit on disposal of Kiddicare.com Limited and loss on disposal of convenience business are classified within profit arising on disposal and exit of properties and sale of businesses;
• pension scheme set-up costs are classified within administrative expenses; and
• net pension interest income is classified within finance income.

63Annual report and financial statements 2015/16
1 Performance in the period continued
1.4 Underlying profit continued2015/16 Impairment and provision for onerous contractsImpairment and onerous lease provisions charge for the period of £87m includes £52m relating to onerous leases and £35m in relation to onerous commitments for changes in estimates related to provisions for stores in the new space pipeline. No impairment has been recognised during the period.
2014/15 Impairment and provision for onerous contractsImpairment and onerous lease provisions in 2014/15 consisted of £1,273m in relation to trading stores, of which £1,116m related to impairment, £118m to onerous lease provisions, £30m to onerous commitments and £9m to lease premiums.
1.5 Earnings per shareBasic earnings per share (EPS) is calculated by dividing the earnings attributable to ordinary shareholders by the weighted average number of ordinary shares in issue during the period. For diluted EPS, the weighted average number of ordinary shares in issue is adjusted to assume conversion of all potentially dilutive ordinary shares.
The Company has two (2015: two) classes of instrument that are potentially dilutive: those share options granted to employees where the exercise price is less than the average market price of the Company’s ordinary shares during the period and contingently issuable shares under the Group’s long term incentive plans (LTIP).
1.5.1 Basic and diluted EPS (unadjusted)Reconciliations of the earnings and weighted average number of shares used in the calculations are set out below:
2016 2015
Earnings £m
Weighted average number of shares
millionsEPS
penceEarnings
£m
Weighted average number of shares
millionsEPS
pence
Unadjusted EPSBasic EPSProfit/(loss) attributable to ordinary shareholders 221.8 2,332.5 9.51 (761.2) 2,332.5 (32.63)Effect of dilutive instrumentsShare options and LTIPs1 – 9.0 (0.04) – – –Diluted EPS 221.8 2,341.5 9.47 (761.2) 2,332.5 (32.63)1 In the period ended 1 February 2015, the effect of dilutive instruments would improve basic EPS as total earnings was a loss of £761m. Diluted EPS cannot exceed basic EPS, therefore the diluted EPS
disclosed above in 2015 was adjusted so that it equated to basic EPS.

64 Wm Morrison Supermarkets PLC Financial statements
Notes to the Group financial statements continued52 weeks ended 31 January 2016
1 Performance in the period continued
1.5 Earnings per share continued1.5.2 Underlying EPSBasic EPS is adjusted to more accurately show underlying business performance. The reconciliation of the earnings used in the calculations of underlying earnings per share is set out below:
2016 2015
Earnings £m
Weighted average number of shares
millionsEPS
penceEarnings
£m
Weighted average number of shares
millionsEPS
pence
Underlying EPSBasic EPSProfit/(loss) attributable to ordinary shareholders 221.8 2,332.5 9.51 (761.2) 2,332.5 (32.63)Adjustments to determine underlying profit (note 1.4) (40.6) – (1.74) 1,016.2 – 43.56
181.2 2,332.5 7.77 255.0 2,332.5 10.93Effect of dilutive instrumentsShare options and LTIPs – 9.0 (0.04) – 9.0 (0.04)
Diluted EPS 181.2 2,341.5 7.73 255.0 2,341.5 10.89
1.6 Operating profit/(loss)2016
£m2015
£m
The following items have been included in arriving at operating profit/(loss):Employee costs (note 1.7) 1,944 1,970Depreciation and impairment:– Property, plant and equipment (note 3.3) 286 315– Investment property (note 3.5) 2 2– Impairment of property, plant and equipment (note 3.3) – 1,113Amortisation and impairment (note 3.2)– Intangible assets 96 70– Impairment of goodwill and intangible assets – 3Operating lease rentals:– Land and buildings 99 87– Other 17 16– Sublease receipts (6) (6)Value of stock expensed 12,321 12,875

65Annual report and financial statements 2015/16
1 Performance in the period continued
1.6 Operating profit/(loss) continued
Value of stock expensedIn order to provide context on commercial income earned in the period, each is shown below as a percentage of the value of stock expensed (VSE) before commercial income is deducted.
2016 2015
£m % of VSE £m % of VSE
Commercial incomeMarketing and advertising funding 260 2.1 291 2.2Volume-based rebates 143 1.1 134 1.0Total commercial income 403 3.2 425 3.2
For additional disclosure see notes 5.2, 5.3 and 5.4.
Auditor remunerationDuring the period PricewaterhouseCoopers LLP, the Group’s auditor, provided the following services:
2016 £m
2015 £m
Audit servicesFees payable to the Group’s auditor for the audit of the Group and the Company financial statements 0.4 0.4Other servicesFees payable to the Group’s auditor and its associates for other services:– the audit of the Group’s subsidiaries pursuant to legislation 0.2 0.2– services relating to taxation – –– other services 0.4 0.3
1.0 0.9
The Board has a policy on the engagement of the external auditor to supply non-audit services, which is available in the Corporate governance compliance statement set out in the investor relations section of the Group’s website at www.morrisons-corporate.com.
1.7 Employees and Directors2016
£m2015
£m
Employee benefit expense for the Group during the periodWages and salaries 1,728 1,755Social security costs 116 118Share-based payments 11 11Other pension costs 89 86
1,944 1,970

66 Wm Morrison Supermarkets PLC Financial statements
Notes to the Group financial statements continued52 weeks ended 31 January 2016
1 Performance in the period continued
1.7 Employees and Directors continued2016 No.
2015 No.
Average monthly number of people, including DirectorsStores 105,024 104,047Manufacturing 8,033 7,497Distribution 5,582 5,731Centre 2,274 2,503
120,913 119,778
Directors’ remunerationA detailed analysis of Directors’ remuneration, including salaries, bonuses and long term incentives, and the highest paid Director, is provided in the Single total figure of remuneration table in the audited section of the Directors’ remuneration report, which forms part of these financial statements (page 38). There are no Executive Directors (2015: none) who have retirement benefits accruing under any of the Group’s defined benefit pension schemes.
Senior management remunerationThe table below shows the remuneration of senior managers. It excludes colleagues already included in the Directors’ remuneration report. Senior managers are considered to be key management personnel in accordance with the requirements of IAS 24 ‘Related party disclosures’, and in the context of gender disclosures required by the Companies Act 2006.
2016 £m
2015 £m
Senior managersWages and salaries 34 37Social security costs 4 5Share-based payments 4 2Other pension costs 2 2
44 46
1.8 DividendsAmounts recognised as distributed to equity holders in the period:
2016 £m
2015 £m
Interim dividend for the period ended 31 January 2016 of 1.50p (2015: 4.03p) 35 94Final dividend for the period ended 1 February 2015 of 9.62p (2015: 9.16p) 225 214
260 308
The Directors propose a final dividend in respect of the financial period ending 31 January 2016 of 3.50p per share which will absorb an estimated £82m of shareholders’ funds. Subject to approval at the AGM, it will be paid on 15 June 2016 to shareholders who are on the register on 13 May 2016.
The dividends paid and proposed during the year are from cumulative realised distributable reserves of Wm Morrison Supermarkets PLC.
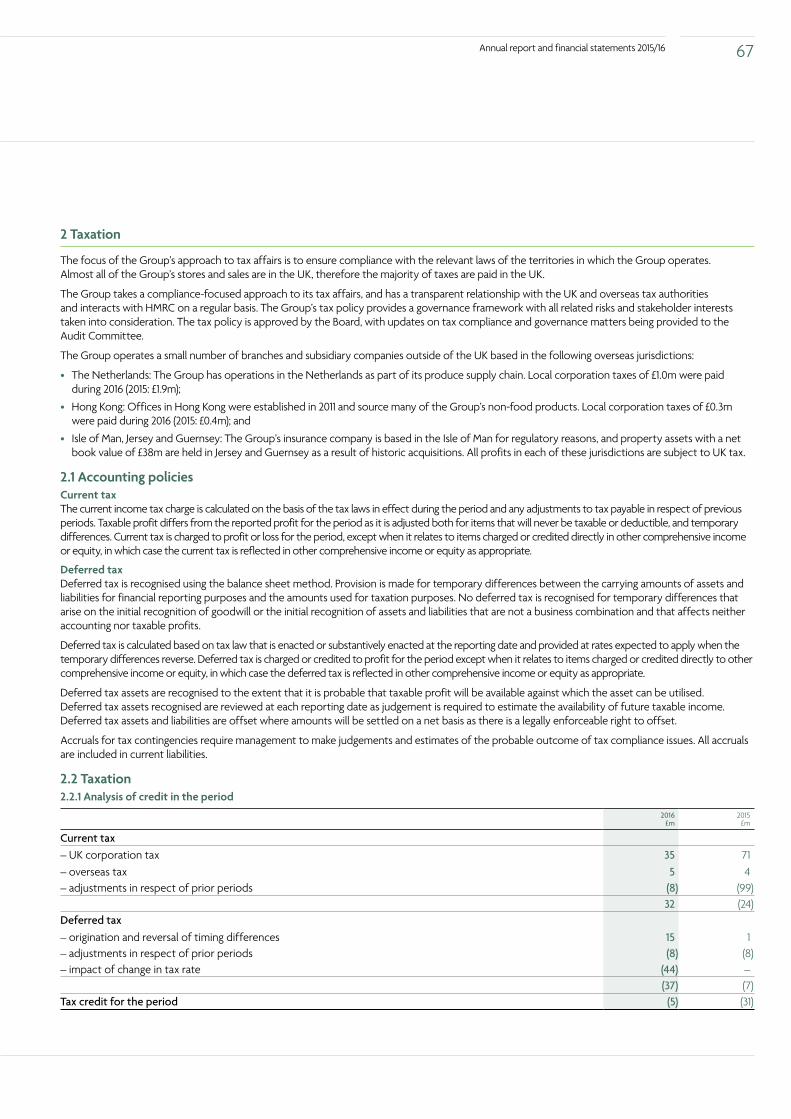
67Annual report and financial statements 2015/16
2 Taxation
The focus of the Group’s approach to tax affairs is to ensure compliance with the relevant laws of the territories in which the Group operates. Almost all of the Group’s stores and sales are in the UK, therefore the majority of taxes are paid in the UK.
The Group takes a compliance-focused approach to its tax affairs, and has a transparent relationship with the UK and overseas tax authorities and interacts with HMRC on a regular basis. The Group’s tax policy provides a governance framework with all related risks and stakeholder interests taken into consideration. The tax policy is approved by the Board, with updates on tax compliance and governance matters being provided to the Audit Committee.
The Group operates a small number of branches and subsidiary companies outside of the UK based in the following overseas jurisdictions:
• The Netherlands: The Group has operations in the Netherlands as part of its produce supply chain. Local corporation taxes of £1.0m were paid during 2016 (2015: £1.9m);
• Hong Kong: Offices in Hong Kong were established in 2011 and source many of the Group’s non-food products. Local corporation taxes of £0.3m were paid during 2016 (2015: £0.4m); and
• Isle of Man, Jersey and Guernsey: The Group’s insurance company is based in the Isle of Man for regulatory reasons, and property assets with a net book value of £38m are held in Jersey and Guernsey as a result of historic acquisitions. All profits in each of these jurisdictions are subject to UK tax.
2.1 Accounting policiesCurrent taxThe current income tax charge is calculated on the basis of the tax laws in effect during the period and any adjustments to tax payable in respect of previous periods. Taxable profit differs from the reported profit for the period as it is adjusted both for items that will never be taxable or deductible, and temporary differences. Current tax is charged to profit or loss for the period, except when it relates to items charged or credited directly in other comprehensive income or equity, in which case the current tax is reflected in other comprehensive income or equity as appropriate.
Deferred taxDeferred tax is recognised using the balance sheet method. Provision is made for temporary differences between the carrying amounts of assets and liabilities for financial reporting purposes and the amounts used for taxation purposes. No deferred tax is recognised for temporary differences that arise on the initial recognition of goodwill or the initial recognition of assets and liabilities that are not a business combination and that affects neither accounting nor taxable profits.
Deferred tax is calculated based on tax law that is enacted or substantively enacted at the reporting date and provided at rates expected to apply when the temporary differences reverse. Deferred tax is charged or credited to profit for the period except when it relates to items charged or credited directly to other comprehensive income or equity, in which case the deferred tax is reflected in other comprehensive income or equity as appropriate.
Deferred tax assets are recognised to the extent that it is probable that taxable profit will be available against which the asset can be utilised. Deferred tax assets recognised are reviewed at each reporting date as judgement is required to estimate the availability of future taxable income. Deferred tax assets and liabilities are offset where amounts will be settled on a net basis as there is a legally enforceable right to offset.
Accruals for tax contingencies require management to make judgements and estimates of the probable outcome of tax compliance issues. All accruals are included in current liabilities.
2.2 Taxation2.2.1 Analysis of credit in the period
2016 £m
2015 £m
Current tax– UK corporation tax 35 71– overseas tax 5 4– adjustments in respect of prior periods (8) (99)
32 (24)Deferred tax– origination and reversal of timing differences 15 1– adjustments in respect of prior periods (8) (8)– impact of change in tax rate (44) –
(37) (7)Tax credit for the period (5) (31)
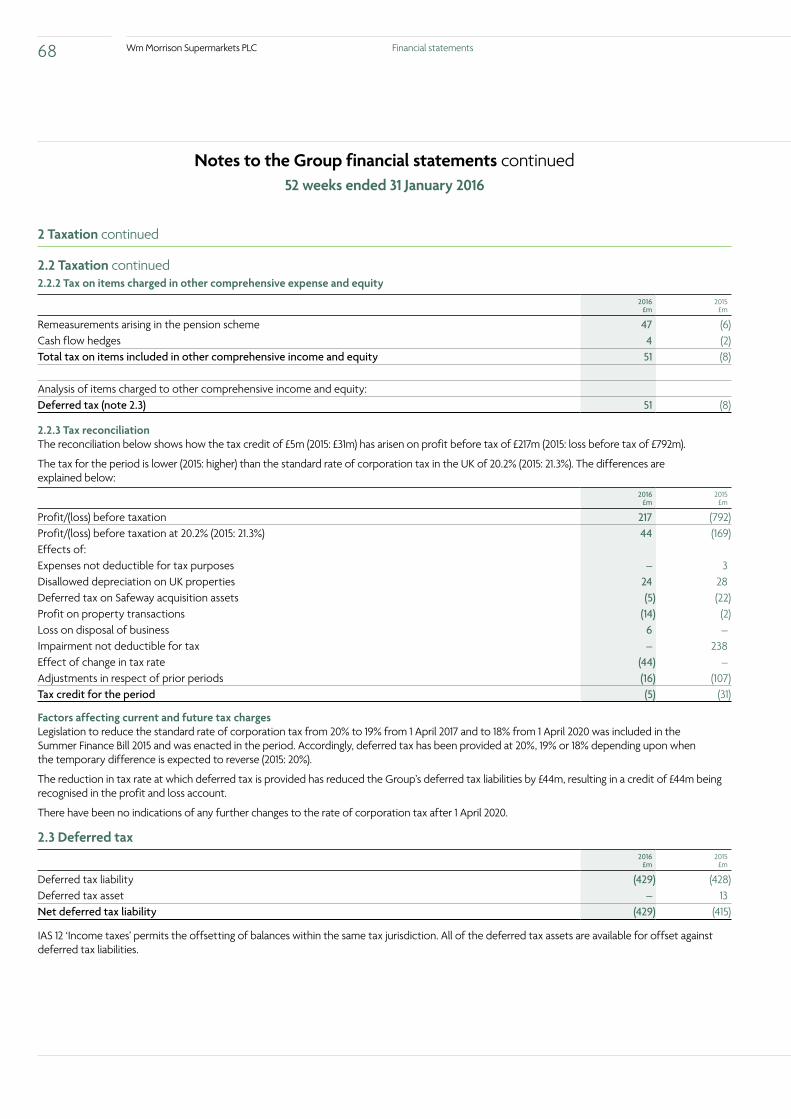
68 Wm Morrison Supermarkets PLC Financial statements
Notes to the Group financial statements continued52 weeks ended 31 January 2016
2 Taxation continued
2.2 Taxation continued2.2.2 Tax on items charged in other comprehensive expense and equity
2016 £m
2015 £m
Remeasurements arising in the pension scheme 47 (6)Cash flow hedges 4 (2)Total tax on items included in other comprehensive income and equity 51 (8)
Analysis of items charged to other comprehensive income and equity:Deferred tax (note 2.3) 51 (8)
2.2.3 Tax reconciliationThe reconciliation below shows how the tax credit of £5m (2015: £31m) has arisen on profit before tax of £217m (2015: loss before tax of £792m).
The tax for the period is lower (2015: higher) than the standard rate of corporation tax in the UK of 20.2% (2015: 21.3%). The differences are explained below:
2016 £m
2015 £m
Profit/(loss) before taxation 217 (792)Profit/(loss) before taxation at 20.2% (2015: 21.3%) 44 (169)Effects of:Expenses not deductible for tax purposes – 3Disallowed depreciation on UK properties 24 28Deferred tax on Safeway acquisition assets (5) (22)Profit on property transactions (14) (2)Loss on disposal of business 6 –Impairment not deductible for tax – 238Effect of change in tax rate (44) –Adjustments in respect of prior periods (16) (107)Tax credit for the period (5) (31)
Factors affecting current and future tax chargesLegislation to reduce the standard rate of corporation tax from 20% to 19% from 1 April 2017 and to 18% from 1 April 2020 was included in the Summer Finance Bill 2015 and was enacted in the period. Accordingly, deferred tax has been provided at 20%, 19% or 18% depending upon when the temporary difference is expected to reverse (2015: 20%).
The reduction in tax rate at which deferred tax is provided has reduced the Group’s deferred tax liabilities by £44m, resulting in a credit of £44m being recognised in the profit and loss account.
There have been no indications of any further changes to the rate of corporation tax after 1 April 2020.
2.3 Deferred tax2016
£m2015
£m
Deferred tax liability (429) (428)Deferred tax asset – 13Net deferred tax liability (429) (415)
IAS 12 ‘Income taxes’ permits the offsetting of balances within the same tax jurisdiction. All of the deferred tax assets are available for offset against deferred tax liabilities.

69Annual report and financial statements 2015/16
2 Taxation continued
2.3 Deferred tax continuedThe movements in deferred tax (liabilities)/assets during the period are shown below:
Property, plant and
equipment £m
Pensions £m
Other short term temporary
differences £m
Total £m
Current periodAt 2 February 2015 (428) 8 5 (415)Credited/(charged) to profit for the period 36 6 (5) 37Charged to other comprehensive income and equity – (47) (4) (51)At 31 January 2016 (392) (33) (4) (429)
Prior periodAt 3 February 2014 (456) 2 24 (430)Credited/(charged) to loss for the period 28 – (21) 7Credited to other comprehensive income and equity – 6 2 8At 1 February 2015 (428) 8 5 (415)
The analysis of net deferred tax liabilities are as follows:2016
£m2015
£m
Net deferred tax liabilities to be settled after more than 12 months (427) (358)Net deferred tax liabilities to be settled within 12 months (2) (57)
(429) (415)
3 Operating assets
3.1 Accounting policies Intangible assetsGoodwillGoodwill arising on a business combination is not amortised but is reviewed for impairment on an annual basis or more frequently if there are indicators that it may be impaired. Goodwill is allocated to cash generating units that will benefit from the synergies of the business combination for the purpose of impairment testing.
BrandsBrands acquired through a business combination are recognised at their fair value at the acquisition date and amortised to profit or loss on a straight-line basis over their estimated useful economic life. During the prior year the Group disposed of £15m of fully written down brands relating to Kiddicare.
Software development costsCosts that are directly attributable to the creation of identifiable software, which meet the development asset recognition criteria as laid out in IAS 38 ‘Intangible assets’ are recognised as intangible assets.
Direct costs include consultancy costs, the employment costs of internal software developers, and borrowing costs. All other software development and maintenance costs are recognised as an expense as incurred. Software development assets are held at historic cost less accumulated amortisation and impairment, and are amortised over their estimated useful lives (3 to 10 years) on a straight-line basis.
LicencesSeparately acquired pharmaceutical licences and software licences are recognised at historic cost less accumulated amortisation and impairment. Those acquired in a business combination are recognised at fair value at the acquisition date. Pharmaceutical licences and software licences are amortised over their useful lives (3 to 10 years) on a straight-line basis or over the life of the licence if shorter.

70 Wm Morrison Supermarkets PLC Financial statements
Notes to the Group financial statements continued52 weeks ended 31 January 2016
3 Operating assets continued
3.1 Accounting policies continuedProperty, plant and equipmentProperty, plant and equipment is stated at cost less accumulated depreciation and accumulated impairment losses. Costs include directly attributable costs such as borrowing costs and employment costs of those people directly working on the construction and installation of property, plant and equipment.
Depreciation rates Depreciation rates used to write off cost less residual value on a straight-line basis are:
Freehold land 0%Freehold buildings 2.5%Leasehold land Over the lease periodLeasehold buildings Over the shorter of lease period and 2.5%Plant, equipment, fixtures and vehicles 10% to 33%Assets under construction 0%
Depreciation expense is primarily charged in cost of sales with an immaterial amount in administration expenses.
Investment propertyProperty held to earn rental income is classified as investment property and is held at cost less accumulated depreciation and impairment. The depreciation policy is consistent with that described for property above.
Non-current assets classified as held-for-saleNon-current assets are classified as held-for-sale if their carrying amount is to be recovered principally through a sale transaction, rather than continuing use within the Group, and the sale is considered highly probable. The sale is expected to complete within one year from the date of classification and the assets are available for sale in their current condition. Non-current assets held-for-sale are stated at the lower of carrying amount and fair value less costs of disposal and are not depreciated.
Lessor accounting – operating leasesAssets acquired and made available to third parties under operating leases are recorded as property, plant and equipment or investment property and are depreciated on a straight-line basis to their estimated residual values over their estimated useful lives. Operating lease income is credited on a straight-line basis to the date of the next rent review.
Finance leasesAssets funded through finance leases are capitalised as property, plant and equipment and depreciated over their useful economic life or lease term, whichever is shorter. The amount capitalised is the lower of the fair value and the present value, calculated using the interest rate implicit in the lease, of the future minimum lease payments. The obligations to pay future rentals are included within liabilities. Rental payments are apportioned between the finance charge and the outstanding obligation so as to produce a constant rate of finance charge on the remaining balance.
Impairment of non-financial assetsIntangible assets with indefinite lives, such as goodwill, and those in construction that are not yet being amortised, are tested for impairment annually. Other non-financial assets are tested if events or changes in circumstances indicate that the carrying amount may not be recoverable.
Testing is performed at the level of a cash generating unit (CGU) in order to compare the CGU’s recoverable amount against its carrying value. An impaired CGU is written down to its recoverable amount, which is the higher of value in use or its fair value less costs to dispose. In assessing value in use, the estimated future cash flows are discounted to their present value using a pre-tax discount rate that reflects current market assessments of the time value of money and the risks specific to the asset.
The Group considers that each of its stores is a CGU, which together form a grocery group of CGUs supported by corporate assets such as head office and vertically integrated suppliers.
Impairment losses are reversed if there is evidence of an increase in the recoverable amount of a previously impaired asset, but only to the extent that the recoverable amount does not exceed the carrying amount that would have been determined if no impairment loss had been recognised. Impairment losses relating to goodwill are not reversed. Any reversal of impairment losses would be excluded from underlying earnings.

71Annual report and financial statements 2015/16
3 Operating assets continued
3.2 Goodwill and intangible assets
Current periodGoodwill
£m
Software development costs
£mLicences
£mTotal
£m
CostAt 2 February 2015 10 633 33 676Additions – 58 7 65Interest capitalised – 4 – 4Disposals – (14) (1) (15)Fully written down assets – (34) (8) (42)At 31 January 2016 10 647 31 688
Accumulated amortisation and impairmentAt 2 February 2015 – 138 18 156Charge for the period – 87 9 96Disposals – (4) (1) (5)Fully written down assets – (34) (8) (42)At 31 January 2016 – 187 18 205
Net book amount at 31 January 2016 10 460 13 483
Included within software development costs are assets under construction of £16m (2015: £153m).
The Group has performed its annual assessment of its amortisation policies and asset lives and deemed them to be appropriate. No changes have been made to asset lives during the year.
As in previous years, fully amortised assets have been retained in the Group’s fixed asset register and included in the table above. In order to provide greater understanding of the Group’s annual amortisation charge, these assets have been removed from both cost and accumulated amortisation.
GoodwillThe goodwill arose on the acquisition of Flower World Limited (£3m) and Farmers Boy (Deeside) Limited (£7m).
Impairment testing of goodwillGoodwill of £10m is allocated to the grocery group of CGUs. This group of CGUs has been tested for impairment via the value in use calculation described in note 3.3. The pre-tax discount rate used is 9.0% (2015: 9.0%) and the growth rate applied to the period after five years is 2% (2015: 2%).
Software development costsThe cumulative interest capitalised included within software development costs is £41m (2015: £37m). The cost of internal labour capitalised is not material for separate disclosure.

72 Wm Morrison Supermarkets PLC Financial statements
Notes to the Group financial statements continued52 weeks ended 31 January 2016
3 Operating assets continued
3.2 Goodwill and intangible assets continued
Prior periodGoodwill
£mBrands
£m
Software development costs
£mLicences
£mTotal
£m
CostAt 3 February 2014 34 15 577 40 666Additions – – 121 5 126Interest capitalised – – 9 – 9Disposals (24) (15) (30) – (69)Fully written down assets – – (44) (12) (56)At 1 February 2015 10 – 633 33 676
Accumulated amortisation and impairmentAt 3 February 2014 24 15 147 22 208Charge for the period – – 63 7 70Impairment – – 2 1 3Disposals (24) (15) (30) – (69)Fully written down assets – – (44) (12) (56)At 1 February 2015 – – 138 18 156Net book amount at 1 February 2015 10 – 495 15 520
3.3 Property, plant and equipment
Current periodFreehold
land £m
Freehold buildings
£m
Leasehold land and buildings
£m
Plant, equipment,
fixtures & vehicles £m
Total £m
CostAt 2 February 2015 3,989 4,330 1,055 1,301 10,675Additions 5 13 14 256 288Reclassifications – (8) 8 – –Transfers from investment properties – 5 – – 5Transfers to assets held-for-sale (3) (5) – (3) (11)Disposals (13) (44) (91) (90) (238)Fully written down assets – (1) (8) (158) (167)At 31 January 2016 3,978 4,290 978 1,306 10,552
Accumulated depreciation and impairmentAt 2 February 2015 660 1,576 548 639 3,423Charge for the period – 102 18 166 286Transfers from investment properties – 5 – – 5Transfers to assets held-for-sale – (4) – (3) (7)Disposals (3) (33) (48) (65) (149)Fully written down assets – (1) (8) (158) (167)At 31 January 2016 657 1,645 510 579 3,391Net book amount at 31 January 2016 3,321 2,645 468 727 7,161
Assets under construction included above 6 1 3 2 12
The Group has performed its annual assessment of its depreciation policies and asset lives and deemed them to be appropriate. No changes have been made to asset lives during the year.

73Annual report and financial statements 2015/16
3 Operating assets continued
3.3 Property, plant and equipment continuedAs in previous years, fully depreciated assets have been retained in the Group’s fixed asset register and included in the table above. In order to provide greater understanding of the Group’s annual depreciation charge, these assets have been removed from both cost and accumulated depreciation.
Included within the above are leasehold land and buildings held under finance lease with a cost of £308m (2015: £308m) and accumulated depreciation of £94m (2015: £92m).
The cost of financing property developments prior to their opening date has been included in the cost of the asset. The cumulative amount of interest capitalised in the total cost above amounts to £197m (2015: £197m).
Impairment The Group considers that each store is a separate cash generating unit (CGU) and therefore considers every store for an indication of impairment annually. The Group calculates each store’s recoverable amount and compares this amount to its book value. The recoverable amount is determined as the higher of ‘value in use’ and ‘fair value less costs of disposal’. If the recoverable amount is less than the book value, an impairment charge is recognised based on the following methodology:
‘Value in use’ is calculated by projecting individual store pre-tax cash flows over the remaining useful life of the store, based on forecasting assumptions. The methodology used for calculating future cash flows is to:
• use the actual cash flows for each store in the current year;
• allocate a proportion of the Group’s central costs to each store on an appropriate basis;
• project each store’s cash flows over the next five years by applying forecast sales and cost growth assumptions;
• project cash flows beyond year five for the remaining useful life of each store by applying a long term growth rate; and
• discount the cash flows using a pre-tax rate of 9.0% (2015: 9.0%). The discount rate takes into account the Group’s weighted average cost of capital.
‘Fair value less costs of disposal’ is estimated by the Directors based on their knowledge of individual stores and the markets they serve and likely demand from grocers or other retailers. The Directors also obtain valuations by store prepared by independent valuers and consider these in carrying out their estimate of fair value less cost of disposal for the purposes of testing for impairment. In determining their valuation, the independent valuers assume an expected rent and yield for each store based on the quality of the asset, local catchment and the store being occupied by a supermarket tenant with a similar covenant to Morrisons.
In order to reflect specific local market conditions, in particular the continued low demand from major grocery retailers for supermarket space, the Directors consider it appropriate for the purpose of testing for impairment to revise downwards the rent and yield assumptions in the independent valuation to reflect the following factors on a store by store basis:
• Whether a major grocery operator might buy the store, taking into consideration whether they are already located near the store, and whether the store size is appropriate for their business model, and then if not;
• Assessing whether a smaller store operator might buy the store, in which case the value has been updated to reflect the Directors’ assessment of the yield which would be achievable if such an operator acquired the store, and then if not;
• Assessing whether a non-food operator might buy the store, in which case the value has been updated to reflect the Directors’ assessment of the yield which would be achievable if such an operator acquired the store.
Having applied the above methodology and assumptions, the Group has recognised an impairment charge of £nil (2015: £1,116m, tangible assets: £1,113m and intangible assets: £3m) during the year. At 31 January 2016, the key assumption to which the value-in-use calculation is most sensitive to is the discount rate. Specific sensitivity analysis with regard to this assumption shows that an increase of 1% in the discount rate would result in an additional impairment charge of £140m.
Based on the methodology above, the Group considers the carrying value appropriate.

74 Wm Morrison Supermarkets PLC Financial statements
Notes to the Group financial statements continued52 weeks ended 31 January 2016
3 Operating assets continued
3.3 Property, plant and equipment continued
Prior periodFreehold
land £m
Freehold buildings
£m
Leasehold land and buildings
£m
Plant, equipment,
fixtures & vehicles £m
Total £m
CostAt 3 February 2014 4,046 4,519 1,112 2,673 12,350Additions 53 107 22 206 388Interest capitalised – 2 – – 2Transfers to investment properties – (4) – – (4)Transfers to assets held-for-sale (104) (237) (44) (28) (413)Disposals (6) (18) (7) (17) (48)Fully written down assets – (39) (28) (1,533) (1,600)At 1 February 2015 3,989 4,330 1,055 1,301 10,675
Accumulated depreciation and impairmentAt 3 February 2014 211 1,264 355 1,895 3,725Charge for the period – 116 27 172 315Impairment 449 302 214 148 1,113Transfers to investment properties – (3) – – (3)Transfers to assets held-for-sale – (50) (14) (26) (90)Disposals – (14) (6) (17) (37)Fully written down assets – (39) (28) (1,533) (1,600)At 1 February 2015 660 1,576 548 639 3,423Net book amount at 1 February 2015 3,329 2,754 507 662 7,252
Assets under construction included above 5 8 1 13 27
3.4 Non-current assets classified as held-for-sale2016
£m2015
£m
At start of period 84 –Additions – 3Transfers from property, plant and equipment at net book value 4 323Transfers from investment property at net book value 30 51 Disposals (118) (293)At end of period – 84
Assets transferred from property, plant and equipment had a cost of £11m (2015: £413m) and accumulated depreciation of £7m (2015: £90m). Assets transferred from investment property had a cost of £45m (2015: £77m) and accumulated depreciation of £15m (2015: £26m).

75Annual report and financial statements 2015/16
3 Operating assets continued
3.5 Investment property2016
£m2015
£m
CostAt start of period 108 183Additions 3 1Transfers (to)/from property, plant and equipment (5) 4Transfers to assets held-for-sale (45) (77)Disposals (2) (3)At end of period 59 108
Accumulated depreciation and impairmentAt start of period 40 64Charge for the period 2 2Transfers (to)/from property, plant and equipment (5) 3Transfers to assets held-for-sale (15) (26)Disposals – (3)At end of period 22 40
Net book amount at end of period 37 68
Included in other operating income is £12m (2015: £21m) of rental income generated from investment properties. At the end of the period the fair value of investment properties, including those held in assets held-for-sale, was £68m (2015: £200m). Investment properties are valued by independent surveyors on a vacant possession basis using observable inputs (fair value hierarchy Level 2).
3.6 Operating leases – lessorThe Group has non-cancellable agreements with tenants with varying terms, escalation clauses and renewal rights. The future minimum lease income is as follows:
2016 £m
2015 £m
Within one year 18 26More than one year and less than five years 61 85After five years 73 114
152 225
3.7 Capital commitments2016
£m2015
£m
Contracts placed for future capital expenditure not provided in the financial statements(property, plant and equipment and intangible assets) 26 149

76 Wm Morrison Supermarkets PLC Financial statements
Notes to the Group financial statements continued52 weeks ended 31 January 2016
4 Interests in other entities
4.1 Accounting policiesJoint venturesThe Group applies IFRS 11 to all joint arrangements. Under IFRS 11 investments in joint arrangements are classified as either joint operations or joint ventures depending on the contractual rights and obligations of each investor. The Group has assessed the nature of its joint arrangements and determined them to be joint ventures. Joint ventures are accounted for under the equity method and are initially recognised at cost.
The consolidated financial statements include the Group’s share of the profit or loss and other comprehensive income of the equity accounted investees, from the date that joint control commences until the date that joint control ceases.
InvestmentsInvestments comprise investments in equity instruments held for long term investment. They are measured at fair value through other comprehensive income, where the fair value can be measured reliably. Where the fair value of the instruments cannot be measured reliably, for example, when there is variability in the range of estimates, the investments are recognised at cost less accumulated impairment losses.
Business combinationsThe acquisition method is used to account for business combinations. Consideration is the fair value of the assets transferred, the liabilities incurred and the equity interests issued by the Group, including the fair value of any contingent consideration arrangement. Acquisition related costs are expensed as incurred. Identifiable assets acquired, and liabilities and contingent liabilities assumed, are measured initially at their fair values at the acquisition date. On an acquisition by acquisition basis, the Group recognises any non-controlling interest in the acquiree either at fair value or at the non-controlling interest’s proportionate share of the acquiree’s net assets.
Goodwill is the excess of consideration transferred, plus any non-controlling interest and the fair value of any previous equity interest in the acquiree, over the fair value of the identifiable net assets acquired. In the event that this excess is negative the difference is recognised directly in profit for the period.
Disposal of subsidiariesWhen the Group ceases to have control over a subsidiary, any retained interest in the entity is remeasured to its fair value at the date when control is lost, with the change in carrying amount recognised in profit or loss. The fair value is the initial carrying amount for the purposes of subsequently accounting for the retained interest as an associate, joint venture or financial asset. In addition, any amounts previously recognised in other comprehensive income in respect of that entity are accounted for as if the Group had directly disposed of the related assets or liabilities. This may mean that amounts previously recognised in other comprehensive income are reclassified to profit or loss.
4.2 Joint venturesThe Group and Ocado Group plc are sole investors in a company (MHE JV Co), which owns the plant and equipment at the Dordon Customer Fulfilment Centre (CFC). Each party owns 50% of the equity of MHE JV Co and decisions regarding MHE JV Co require the unanimous consent of both parties. The Directors have considered the impact of IFRS 11 Joint arrangements, applicable this financial year, and determined that the Group continues to jointly control MHE JV Co.
MHE JV Co2016
£m2015
£m
Current assets 7 24Non-current assets 125 117Current liabilities (7) (5)Net assets 125 136Group’s share of net assets 63 68
Profit 4 4Group’s share of profit 2 2
4.3 Investments2016
£m2015
£m
Equity investments at cost 31 31
The equity investments held for long term investment represents the Group’s 10% stake in Fresh Direct Inc, a US internet grocer. The investment was made on 9 March 2011, and at that point, the Group made available to Fresh Direct a $15m 8% unsecured seven year loan facility. The facility is undrawn at the balance sheet date.

77Annual report and financial statements 2015/16
4 Interests in other entities continued
4.4 Business combinations52 weeks ended 31 January 2016On 7 December 2015, Wm Morrison Produce Limited exercised an option to acquire the remaining 49% of the issued share capital of Wm Morrison Bananas Limited from Global Pacific Group, for a cash consideration of £3m. Due to the existence of the put and call option, the Group had previously treated Wm Morrison Bananas Limited as a 100% subsidiary.
For part of the year the Group was part of a joint venture in respect of The Morrisons Farm at Dumfries House Limited (the Farm). The Group terminated this agreement on 13 November 2015 when Wm Morrison Supermarkets PLC acquired the remaining 50% of the issued share capital of the Farm. On 6 January 2016, the Farm was renamed Neerock Farming Limited. The Farm’s results are immaterial to the Group.
52 weeks ended 1 February 2015In the 52 weeks ended 1 February 2015 there were no business combinations.
4.5 Disposals of businesses52 weeks ended 31 January 2016On 26 October 2015, the Group disposed of its subsidiary Wm Morrison Convenience Stores Limited and associated assets to MLCG Limited for cash consideration of £20m. This resulted in a loss on disposal of £34m. This loss is one-off in nature and therefore has been excluded from reported underlying earnings. Following the sale, the Group continues to guarantee leases relating to its former convenience stores. The Group has made an assessment of the likelihood and amount of future rental commitments should these leases revert, and recognised a liability on the balance sheet at 31 January 2016 reflecting the estimated cash outflow. In the event of lessee default the Group will look to minimise its liability by finding alternative occupiers as soon as possible.
52 weeks ended 1 February 2015On 11 July 2014, the Group disposed of Kiddicare.com Limited to Endless LLP receiving a consideration of £2m for the sale of the shares. This resulted in a profit on disposal of £4m following an impairment charge in the 52 weeks ended 2 February 2014. Only one of the ten leases relating to Kiddicare remains unassigned.
5 Working capital and provisions
5.1 Accounting policiesStockStock represents goods for resale and is measured at the lower of cost and net realisable value. Net realisable value is the estimated selling price in the ordinary course of business, less the estimated costs necessary to make the sale. Cost is calculated on a weighted average basis and comprises purchase price, import duties and other non-recoverable taxes, reduced by promotional funding and commercial income and a provision for estimated losses relating to shrinkage and markdowns. Losses relating to shrinkage in stores are based on historical losses verified by physical stock counts conducted by an independent third party. Provision is made for obsolete and slow moving items.
Trade and other debtorsTrade and other debtors are initially recognised at fair value, which is generally equal to face value, and subsequently held at amortised cost. Provision is made when there is objective evidence that the Group will not be able to recover balances in full, with the charge being included in administrative expenses.
Cash and cash equivalentsCash and cash equivalents for cash flow purposes includes cash-in-hand, cash-at-bank and bank overdrafts. In the balance sheet, bank overdrafts that do not have right of offset are presented within current liabilities.
Cash held by the Group’s captive insurer, Farock Insurance Company Limited, is not available for use by the rest of the Group as it is restricted for use against the specific liability of the captive. As the funds are available on demand, they meet the definition of cash in IAS 7 ‘Cash flow statements’.
Trade and other creditorsTrade and other creditors are initially recognised at fair value, which is generally equal to face value of the invoices received, and subsequently held at amortised cost. Trade creditors are presented net of commercial income due when the Group’s trading terms state that income from suppliers will be netted against amounts owing to that supplier.

78 Wm Morrison Supermarkets PLC Financial statements
Notes to the Group financial statements continued52 weeks ended 31 January 2016
5 Working capital and provisions continued
5.1 Accounting policies continuedProvisionsProvisions are created where the Group has a present obligation as a result of a past event, where it is probable that it will result in an outflow of economic benefits to settle the obligation, and where it can be reliably measured. For petrol filling station decommissioning costs this is when the filling station is first constructed and for dilapidations on leased buildings, when the lease is entered into. Provisions for onerous leases are recognised when the Group believes that the unavoidable costs of meeting the lease obligations exceed the economic benefits expected to be received under the lease. The amounts provided are based on the Group’s best estimate of the least net cost of exit. Where material, these estimated outflows are discounted to net present value using a pre-tax rate that reflects current market assumptions. The unwinding of this discount is recognised as a financing cost in the income statement.
5.2 Stock2016
£m2015
£m
Finished goods 616 658
Unearned elements of commercial income are deducted from finished goods as the stock has not been sold.
5.3 Debtors2016
£m2015
£m
Trade debtors:– Commercial income trade debtors 13 10– Accrued commercial income 26 37– Other trade debtors 99 136Less: provision for impairment of trade debtors (6) (5)
132 178Prepayments and accrued income 56 51Other debtors 4 10
192 239
The ageing analysis of trade debtors is as follows:2016
£m2015
£m
Neither past due nor impaired 132 178Past due but not impaired:Not more than three months – –Greater than three months – –Impaired debt 6 5
138 183
As at 31 January 2016 and 1 February 2015, trade debtors that were neither past due nor impaired related to a number of debtors for whom there is no recent history of default. The other classes of debtors do not contain impaired assets.
As of 8 March 2016, £10m of the £13m commercial income trade debtor balance had been settled and £16m of the £26m accrued commercial income balance had been invoiced and settled.

79Annual report and financial statements 2015/16
5 Working capital and provisions continued
5.4 Creditors – current2016
£m2015
£m
Trade creditors 1,775 1,493Less: commercial income due, offset against amounts owed (85) (96)
1,690 1,397Other taxes and social security payable 86 66Other creditors 267 271Accruals and deferred income 475 487
2,518 2,221
Included within accruals and deferred income is £5m (2015: £9m) in respect of deferred commercial income.
As of 8 March 2016, £68m of the £85m commercial income due above had been offset against payments made.
5.5 ProvisionsOnerous lease
provision £m
Other property provisions
£mTotal
£m
At 2 February 2015 258 30 288Charged to profit for the period 52 3 55Utilised/released during the period (32) (13) (45)Unwinding of discount 11 – 11At 31 January 2016 289 20 309
Part of the onerous leases relate to sublet and vacant properties, with commitments ranging from one to 57 years. The provision is revised regularly in response to market conditions. During the year, £52m has been charged to onerous lease provisions as detailed in note 1.4. The utilisation of onerous lease provisions this year relates to the assignment of Kiddicare leases, the disposal of the convenience business and the ongoing utilisation of onerous contracts.
Other property provisions include a petrol filling station decommissioning reserve for the cost of decommissioning petrol tanks, and provisions for dilapidations on leased buildings, for the cost of restoring assets to their original condition.
5.6 Cash generated from operations2016
£m2015
£m
Profit/(loss) for the period 222 (761)Net finance costs 99 98Taxation credit (5) (31)Share of profit of joint venture (2) (2)Operating profit/(loss) 314 (696)Adjustments for:Depreciation and amortisation 384 387Impairment – 1,116Profit arising on disposal and exit of properties and sale of businesses (97) (135)Adjustment for non-cash element of pension charges 11 (5)Share-based payments 11 11Other non-cash charges 1 3Decrease in stock1 40 180Decrease in debtors1 30 77Increase /(decrease) in creditors1 313 (76)Increase in provisions1 19 108Cash generated from operations 1,026 970

80 Wm Morrison Supermarkets PLC Financial statements
Notes to the Group financial statements continued52 weeks ended 31 January 2016
5 Working capital and provisions continued
5.6 Cash generated from operations continuedTotal working capital inflow (the sum of items marked1 in the table) is £402m in the year. This includes £83m as a result of the current year onerous leases charge and onerous commitments, net of £29m of onerous capital payments. When adjusted to exclude these items, the working capital inflow is £348m.
6 Capital and borrowings
6.1 Accounting policiesBorrowingsInterest-bearing loans and overdrafts are initially recorded at fair value, net of attributable transaction costs. Subsequent to initial recognition, any difference between the redemption value and the initial carrying amount is recognised in profit for the period over the period of the borrowings on an effective interest rate basis.
Borrowing costsAll borrowing costs are recognised in the Group’s profit for the period on an effective interest rate basis except for interest costs that are directly attributable to the construction of buildings and other qualifying assets, which are capitalised and included within the initial cost of the asset. Capitalisation commences when both expenditure on the asset and borrowing costs are being incurred, and necessary activities to prepare the asset for use are in progress. In the case of new stores, this is generally once planning permission has been obtained. Capitalisation ceases when the asset is ready for use. Interest is capitalised at the effective rate incurred on borrowings before taxation of 5% (2015: 5%). Capitalised interest is included within interest paid in cash flow from operating activities.
LeasesLeases in which substantially all the risks and rewards of ownership are retained by the lessor are classified as operating leases; all other leases are classified as finance leases. Property leases are analysed into separate components for land and buildings and tested to establish whether the components are operating leases or finance leases. Rental payments on operating leases in which the Group is lessee are taken to profit for the period on a straight-line basis over the life of the lease.
Sale and leaseback of propertiesThe accounting treatment of the sale and leaseback depends upon the substance of the transaction (by applying the lease classification principles described above). For sale and operating leasebacks, the assets are sold at fair value, and accordingly the profit or loss from the sale is recognised immediately in the Statement of comprehensive income. A number of new property operating leases have been entered into in the year ended 31 January 2016 (see property commitments note 6.8). When forming the conclusion of operating lease classification, consideration was given to the key lease classification indicators of IAS 17. The leases are typically for a 25 year period. The Directors have reviewed the remaining useful lives for these particular properties and concluded they are significantly longer than the period of the lease. As disclosed on page 72 a review of the useful economic lives of each of the property, plant and equipment categories has been performed in the year with no changes made. Other key indicators considered in reaching an operating lease classification were the present value of the minimum lease payments and the ownership clauses in the contracts upon expiry of the lease.
Share capital Ordinary shares are classified as equity. Incremental costs directly attributable to the issue of new shares or options are shown in equity as a deduction, net of tax, from the proceeds. Where any Group company purchases the Company’s equity share capital, the consideration paid, including directly attributable incremental costs, is deducted from retained earnings until the shares are cancelled. On cancellation, the nominal value of the shares is deducted from share capital and the amount is transferred to the capital redemption reserve.
Own shares heldThe Group has employee trusts for the granting of Group shares to executives and members of the employee share plans. Shares in the Group held by the employee share trusts are presented in the balance sheet as a deduction from retained earnings. The shares are deducted for the purpose of calculating the Group’s earnings per share.
Net debtNet debt is cash and cash equivalents, long term cash on deposit, bank and other current loans, bonds, private placement loan notes and derivative financial instruments (stated at current fair value).

81Annual report and financial statements 2015/16
6 Capital and borrowings continued
6.2 Finance costs and income2016
£m2015
£m
Interest payable on short term loans and bank overdrafts (4) (10)Interest payable on bonds (98) (96)Interest capitalised 4 11Total interest payable (98) (95)Provisions: unwinding of discount (11) (7)Other finance costs (3) (3)Finance costs (112) (105)Bank interest received 5 5Amortisation of bonds 1 1Other finance income 7 –Net pension interest income (note 8.2) – 1Finance income 13 7Net finance cost (99) (98)
6.3 BorrowingsThe Group had the following current borrowings and other financial liabilities:
2016 £m
2015 £m
CurrentBank overdraft 1 1
Short term borrowings – 10£200m Sterling bonds 6.00% January 2017 200 –
201 11

82 Wm Morrison Supermarkets PLC Financial statements
Notes to the Group financial statements continued52 weeks ended 31 January 2016
6 Capital and borrowings continued
6.3 Borrowings continuedThe Group had the following non-current borrowings and other financial liabilities:
2016 £m
2015 £m
Non-current£200m Sterling bonds 6.00% January 2017 – 201£200m Sterling bonds 6.12% December 2018 202 202£400m Sterling bonds 4.625% December 2023 398 397£400m Sterling bonds 3.50% July 2026 416 421£300m Sterling bonds 4.75% July 2029 291 291$250m US private placement loan notes (USPP) 4.4% November 2026 174 164€700m Euro bond 2.25% June 2020 527 518Total non-current bonds and loan notes 2,008 2,194Revolving credit facility (5) 314
2,003 2,508
Borrowing facilitiesBorrowings are denominated in sterling, US dollars and euros, and bear fixed interest rates, with the exception of the revolving credit facility which bears floating interest rates. All borrowings are unsecured. In September 2015 the Group extended its syndicated committed revolving credit facility of £1.35bn by a further year, effectively resetting its five year term and resulting in a maturity date of September 2020. The Group also has a bilateral revolving credit facility of £150m due to mature in May 2016. The revolving credit facility incurs commitment fees and drawdowns bear interest at a spread above LIBOR.
In the event of default of covenants on the bank facility, the principal amounts and any interest accrued are repayable on demand.
There were no drawings under these credit facilities at the balance sheet date and therefore the Group had £1,500m of undrawn committed borrowing facilities available (2015: £1,180m).
Maturity of borrowingsThe table below summarises the maturity profile of the Group’s borrowings based on contractual, undiscounted payments, which include interest payments. As a result, amounts shown below do not agree to the amounts disclosed on the balance sheet for borrowings. Creditors (note 5.4) are excluded from this analysis.
Where borrowings are subject to a floating rate, an estimate for interest has been made. 2016
£m2015
£m
Less than one year 291 100One to two years 79 290Two to three years 278 78Three to four years 67 277Four to five years 593 386More than five years 1,574 2,145
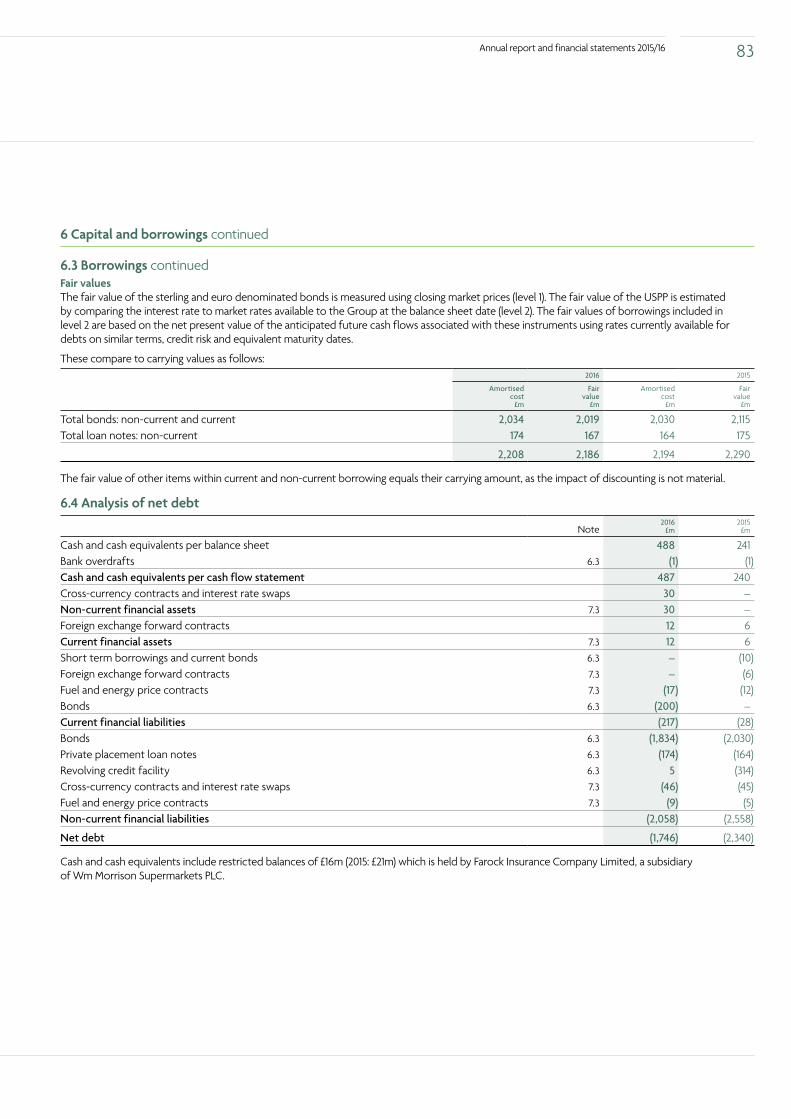
83Annual report and financial statements 2015/16
6 Capital and borrowings continued
6.3 Borrowings continuedFair valuesThe fair value of the sterling and euro denominated bonds is measured using closing market prices (level 1). The fair value of the USPP is estimated by comparing the interest rate to market rates available to the Group at the balance sheet date (level 2). The fair values of borrowings included in level 2 are based on the net present value of the anticipated future cash flows associated with these instruments using rates currently available for debts on similar terms, credit risk and equivalent maturity dates.
These compare to carrying values as follows:2016 2015
Amortisedcost
£m
Fairvalue
£m
Amortisedcost
£m
Fairvalue
£m
Total bonds: non-current and current 2,034 2,019 2,030 2,115Total loan notes: non-current 174 167 164 175
2,208 2,186 2,194 2,290
The fair value of other items within current and non-current borrowing equals their carrying amount, as the impact of discounting is not material.
6.4 Analysis of net debt
Note2016
£m2015
£m
Cash and cash equivalents per balance sheet 488 241Bank overdrafts 6.3 (1) (1)Cash and cash equivalents per cash flow statement 487 240Cross-currency contracts and interest rate swaps 30 –Non-current financial assets 7.3 30 –Foreign exchange forward contracts 12 6Current financial assets 7.3 12 6Short term borrowings and current bonds 6.3 – (10)Foreign exchange forward contracts 7.3 – (6)Fuel and energy price contracts 7.3 (17) (12)Bonds 6.3 (200) –Current financial liabilities (217) (28)Bonds 6.3 (1,834) (2,030)Private placement loan notes 6.3 (174) (164)Revolving credit facility 6.3 5 (314)Cross-currency contracts and interest rate swaps 7.3 (46) (45)Fuel and energy price contracts 7.3 (9) (5)Non-current financial liabilities (2,058) (2,558)
Net debt (1,746) (2,340)
Cash and cash equivalents include restricted balances of £16m (2015: £21m) which is held by Farock Insurance Company Limited, a subsidiary of Wm Morrison Supermarkets PLC.

84 Wm Morrison Supermarkets PLC Financial statements
Notes to the Group financial statements continued52 weeks ended 31 January 2016
6 Capital and borrowings continued
6.5 Called-up share capitalNumber of
shares millions
Share capital £m
Share premium £m
Total £m
At 1 February 2015 and 31 January 2016 2,335 234 127 361
The total authorised number of ordinary shares is 4,000 million shares (2015: 4,000 million shares) with a par value of 10p per share (2015: 10p per share). All issued shares are fully paid. The Group did not acquire any of its own shares for cancellation in the 52 weeks ended 1 February 2015 or 31 January 2016.
The holders of ordinary shares are entitled to receive dividends as declared from time-to-time and are entitled to one vote per share at the meetings of the Company.
Trust sharesIncluded in retained earnings is a deduction of £13m (2015: £6m) in respect of own shares held at the balance sheet date. This represents the cost of 8,401,491 (2015: 2,907,374) of the Group’s ordinary shares (nominal value of £0.8m (2015: £0.3m)). These shares are held in a trust and were acquired by the business to meet obligations under the Group’s employee share plans using funds provided by the Group. The market value of the shares at 31 January 2016 was £15m (2015: £5m). The trust has waived its right to dividends. These shares are not treasury shares as defined by the London Stock Exchange.
During the period the Group acquired 8,612,819 (2015: 4,000,000) of its own shares to hold in trust for consideration of £13m (2015: £8m), and utilised 3,118,702 (2015: 3,031,234) trust shares to satisfy awards under the Group’s employee share plans.
Issue of new sharesThe Group issued 70,480 (2015: 41,962) new shares to satisfy options exercised by employees during the period. Proceeds received on exercise of these shares amounted to £0.1m (2015: £0.1m).
6.6 Reserves2016
£m2015
£m
Capital redemption reserve 39 39Merger reserve 2,578 2,578Hedging reserve (10) (22)Retained earnings 788 638Total 3,395 3,233
Capital redemption reserveThe capital redemption reserve at the start of the period related to 389,631,561 of the Company’s own shares which it purchased on the open market for cancellation between 31 March 2008 and 8 March 2013 at a total cost of £1,081m.
Merger reserveThe merger reserve represents the reserve in the Company’s balance sheet arising on the acquisition in 2004 of Safeway Limited. In the opinion of the Directors, this reserve is not distributable and accordingly it will be carried forward as a capital reserve.
Hedging reserveThis represents the gains and losses arising on derivatives used for cash flow hedging.
6.7 Capital managementThe Group defines the capital that it manages as the Group’s total equity and net debt balances, as well as its lease commitments.
The Group’s capital management objectives are to safeguard its viability taking into consideration the risks that it faces whilst maintaining an investment grade credit rating and having adequate liquidity headroom. The Group manages its capital structure by managing the balance of debt and shares outstanding. It does this by seeking an effective balance between debt and equity. During the current financial year, net debt has reduced by £594m, reflecting strong operating cash flow driven by working capital management, reduced capital expenditure and £320m of property and business disposals. Throughout the year, the Group has comfortably complied with the gearing and fixed charge cover covenants attaching to its revolving credit facility, and the USPP.
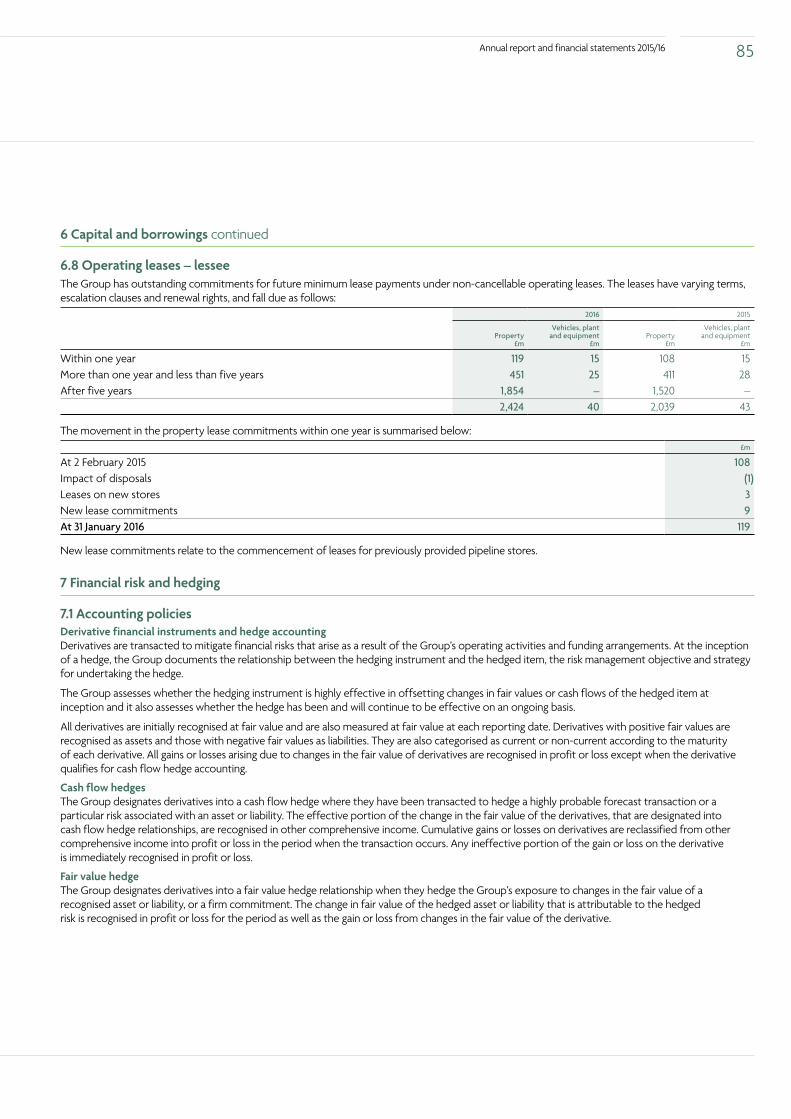
85Annual report and financial statements 2015/16
6 Capital and borrowings continued
6.8 Operating leases – lesseeThe Group has outstanding commitments for future minimum lease payments under non-cancellable operating leases. The leases have varying terms, escalation clauses and renewal rights, and fall due as follows:
2016 2015
Property £m
Vehicles, plant and equipment
£mProperty
£m
Vehicles, plant and equipment
£m
Within one year 119 15 108 15More than one year and less than five years 451 25 411 28After five years 1,854 – 1,520 –
2,424 40 2,039 43
The movement in the property lease commitments within one year is summarised below:£m
At 2 February 2015 108Impact of disposals (1)Leases on new stores 3New lease commitments 9At 31 January 2016 119
New lease commitments relate to the commencement of leases for previously provided pipeline stores.
7 Financial risk and hedging
7.1 Accounting policiesDerivative financial instruments and hedge accountingDerivatives are transacted to mitigate financial risks that arise as a result of the Group’s operating activities and funding arrangements. At the inception of a hedge, the Group documents the relationship between the hedging instrument and the hedged item, the risk management objective and strategy for undertaking the hedge.
The Group assesses whether the hedging instrument is highly effective in offsetting changes in fair values or cash flows of the hedged item at inception and it also assesses whether the hedge has been and will continue to be effective on an ongoing basis.
All derivatives are initially recognised at fair value and are also measured at fair value at each reporting date. Derivatives with positive fair values are recognised as assets and those with negative fair values as liabilities. They are also categorised as current or non-current according to the maturity of each derivative. All gains or losses arising due to changes in the fair value of derivatives are recognised in profit or loss except when the derivative qualifies for cash flow hedge accounting.
Cash flow hedgesThe Group designates derivatives into a cash flow hedge where they have been transacted to hedge a highly probable forecast transaction or a particular risk associated with an asset or liability. The effective portion of the change in the fair value of the derivatives, that are designated into cash flow hedge relationships, are recognised in other comprehensive income. Cumulative gains or losses on derivatives are reclassified from other comprehensive income into profit or loss in the period when the transaction occurs. Any ineffective portion of the gain or loss on the derivative is immediately recognised in profit or loss.
Fair value hedgeThe Group designates derivatives into a fair value hedge relationship when they hedge the Group’s exposure to changes in the fair value of a recognised asset or liability, or a firm commitment. The change in fair value of the hedged asset or liability that is attributable to the hedged risk is recognised in profit or loss for the period as well as the gain or loss from changes in the fair value of the derivative.
86 Wm Morrison Supermarkets PLC Financial statements
Notes to the Group financial statements continued52 weeks ended 31 January 2016
7 Financial risk and hedging continued
7.2 Financial risk managementThe Group has a centralised treasury function which manages funding, liquidity and other financial risk in accordance with the Board approved treasury policy. The objective of the policy and controls that are established are to mitigate the risk of an adverse impact on the performance of the Group as a result of its exposure to financial risks arising from the Group’s operations and its sources of finance. It is the Group’s policy not to engage in speculative trading of financial instruments.
The Board retains ultimate responsibility for treasury activity and is involved in key decision making. A Treasury Committee is established to provide governance and oversight to treasury activity within delegated authority limits and formally reports to the Audit Committee.
Foreign currency riskThe majority of purchases made by the Group are denominated in sterling, however some trade purchases are made in other currencies, primarily the euro and US dollar. The Group’s objective is to reduce short term profit volatility from exchange rate fluctuations. It is Group policy that a minimum of 80% of committed and highly probable exposures within the next six months are hedged and at least 40% of exposures in the following six months. At the balance sheet date, the Group had hedged 81% of its exposure within the next six months (2015: 84%).
Cross-currency interest rate swaps are used to mitigate the Group’s currency exposure arising from payments of interest and principal in relation to foreign currency funding, including the US dollar private placement (USPP) loan notes and the euro denominated bond.
At the reporting date, the sensitivity to a reasonable possible change (+/– 10%) in the US dollar and euro exchange rates would equate to a £5m post tax profit or loss exposure in relation to the euro and £4m in relation to the US dollar, for the unhedged forecast foreign currency exposures over the next 12 months. A weakening of the pound sterling by 10% against the euro and US dollar exchange rates would impact on other comprehensive income by £16m.
Liquidity riskThe Group policy is to maintain an appropriate maturity profile across its borrowings and a sufficient level of committed headroom to meet obligations. The Group finances its operations using a diversified range of funding providers including banks and bondholders.
A central cash forecast is maintained by the treasury function who monitor the availability of liquidity to meet business requirements and any unexpected variances. The treasury function seek to centralise surplus cash balances to minimise the level of gross debt. Short term cash balances, together with undrawn committed facilities, enable the Group to manage its day to day liquidity risk. Any short term surplus is invested in accordance with Treasury Policy.
The Treasury Committee compares the committed liquidity available to the Group against the forecast requirements including policy headroom. This policy includes a planning assumption that supply chain finance facilities are not available.
Interest rate riskThe Group seeks to protect itself against adverse movements in interest rates by maintaining at least 60% of its total borrowings at fixed interest rates. As at the balance sheet date 91% (2015: 79%) of the Group’s borrowings are at fixed rate.
Whilst still applying the policy described above, from time-to-time the Group enters into fixed-to-floating interest rate swaps to achieve the appropriate proportion of fixed versus floating rate borrowings.
Credit riskAs a retailer, the majority of the Group’s revenue is received in cash at the point of sale and therefore credit risk is not considered significant to the Group. Some credit risk does arise from cash and cash equivalents, deposits with banking groups and exposures from other sources of income such as commercial income and tenants of investment properties.
The Group has established appropriate credit verification procedures in respect of financial institutions. Limits on the total exposure to any counterparty or Group of connected counterparties are established within Treasury Policy taking into account credit ratings. Compliance with limits is regularly monitored.
There are no significant concentrations of credit risk within the Group.
Commodity price riskThe Group manages the risks associated with the purchase of electricity, gas and diesel consumed by its activities (excluding fuel purchased for resale to customers) by entering into hedging contracts to fix prices for expected consumption.
The Group has adopted a capital at risk model for hedging its fuel and power consumption. The Treasury Committee reviews the Group’s exposure to commodity prices and ensures it remains within policy limits. A change of +/– 10 % in the market value of the commodity price at the balance sheet date would affect other comprehensive income by £8m (2015: £9m).
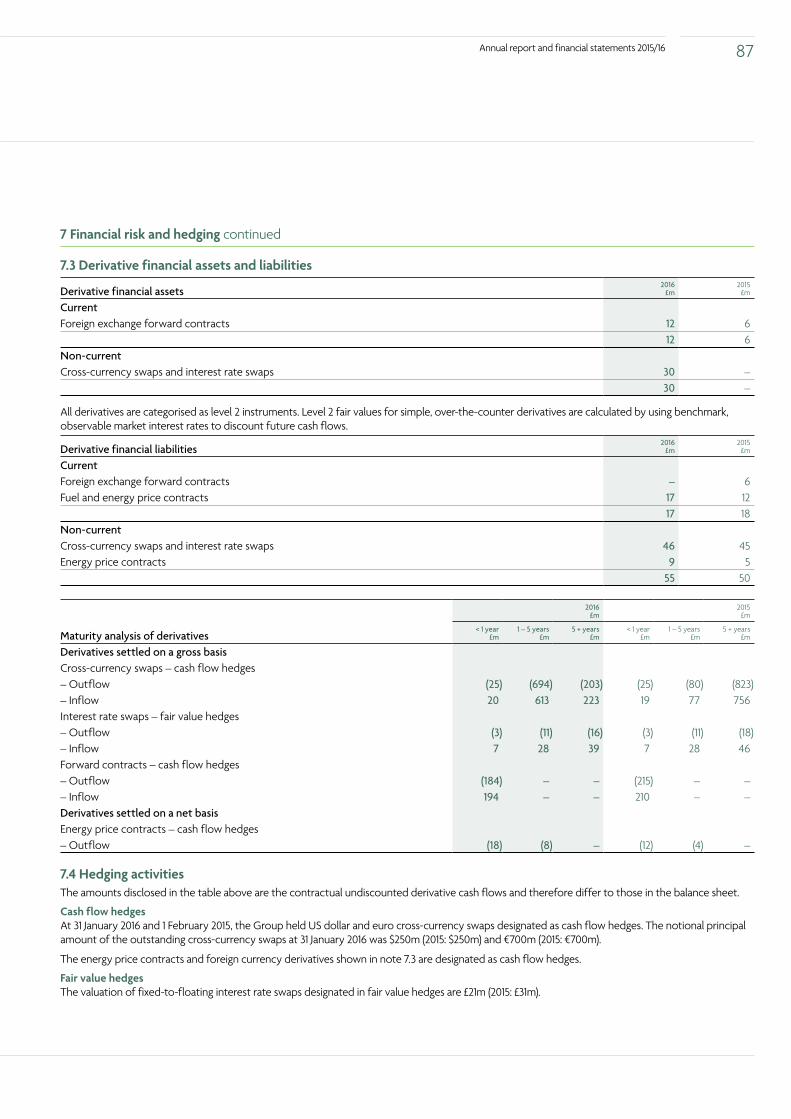
87Annual report and financial statements 2015/16
7 Financial risk and hedging continued
7.3 Derivative financial assets and liabilities
Derivative financial assets2016
£m2015
£m
CurrentForeign exchange forward contracts 12 6
12 6Non-current Cross-currency swaps and interest rate swaps 30 –
30 –
All derivatives are categorised as level 2 instruments. Level 2 fair values for simple, over-the-counter derivatives are calculated by using benchmark, observable market interest rates to discount future cash flows.
Derivative financial liabilities2016
£m2015
£m
CurrentForeign exchange forward contracts – 6Fuel and energy price contracts 17 12
17 18Non-current Cross-currency swaps and interest rate swaps 46 45Energy price contracts 9 5
55 50
2016 £m
2015 £m
Maturity analysis of derivatives< 1 year
£m1 – 5 years
£m5 + years
£m< 1 year
£m1 – 5 years
£m5 + years
£m
Derivatives settled on a gross basisCross-currency swaps – cash flow hedges– Outflow (25) (694) (203) (25) (80) (823)– Inflow 20 613 223 19 77 756Interest rate swaps – fair value hedges– Outflow (3) (11) (16) (3) (11) (18)– Inflow 7 28 39 7 28 46Forward contracts – cash flow hedges– Outflow (184) – – (215) – –– Inflow 194 – – 210 – –Derivatives settled on a net basisEnergy price contracts – cash flow hedges– Outflow (18) (8) – (12) (4) –
7.4 Hedging activitiesThe amounts disclosed in the table above are the contractual undiscounted derivative cash flows and therefore differ to those in the balance sheet.
Cash flow hedgesAt 31 January 2016 and 1 February 2015, the Group held US dollar and euro cross-currency swaps designated as cash flow hedges. The notional principal amount of the outstanding cross-currency swaps at 31 January 2016 was $250m (2015: $250m) and €700m (2015: €700m).
The energy price contracts and foreign currency derivatives shown in note 7.3 are designated as cash flow hedges.
Fair value hedgesThe valuation of fixed-to-floating interest rate swaps designated in fair value hedges are £21m (2015: £31m).
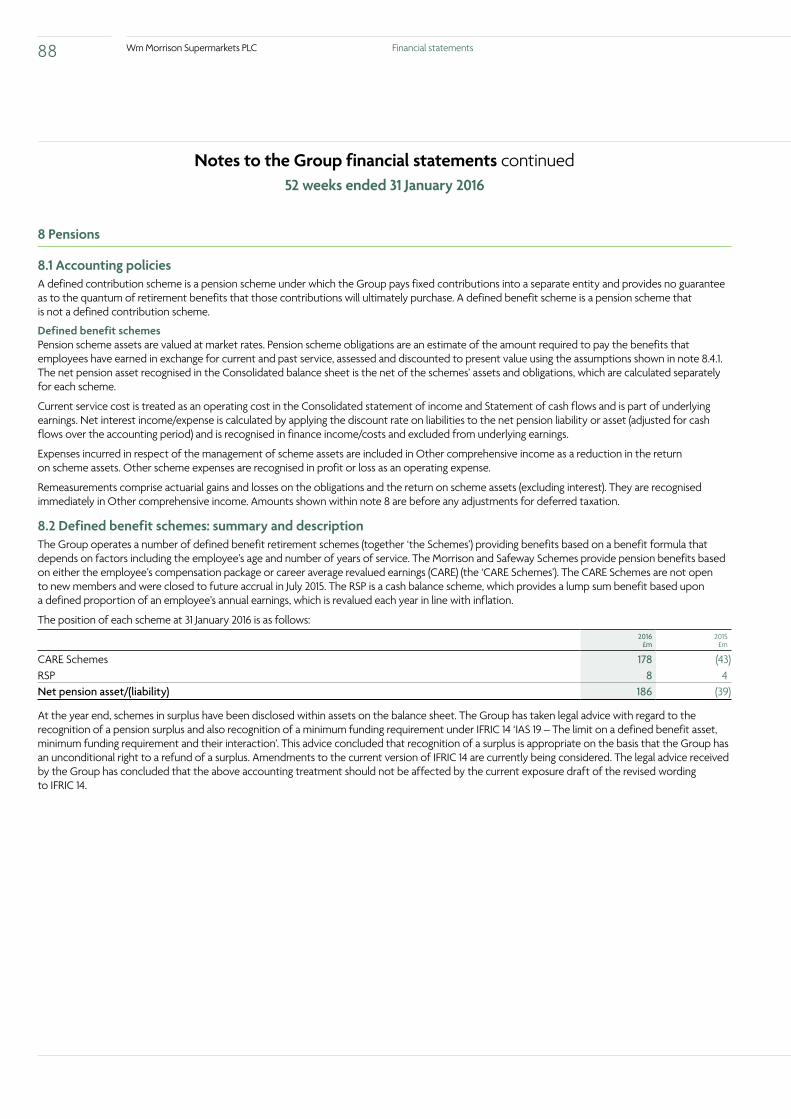
88 Wm Morrison Supermarkets PLC Financial statements
Notes to the Group financial statements continued52 weeks ended 31 January 2016
8 Pensions
8.1 Accounting policiesA defined contribution scheme is a pension scheme under which the Group pays fixed contributions into a separate entity and provides no guarantee as to the quantum of retirement benefits that those contributions will ultimately purchase. A defined benefit scheme is a pension scheme that is not a defined contribution scheme.
Defined benefit schemesPension scheme assets are valued at market rates. Pension scheme obligations are an estimate of the amount required to pay the benefits that employees have earned in exchange for current and past service, assessed and discounted to present value using the assumptions shown in note 8.4.1. The net pension asset recognised in the Consolidated balance sheet is the net of the schemes’ assets and obligations, which are calculated separately for each scheme.
Current service cost is treated as an operating cost in the Consolidated statement of income and Statement of cash flows and is part of underlying earnings. Net interest income/expense is calculated by applying the discount rate on liabilities to the net pension liability or asset (adjusted for cash flows over the accounting period) and is recognised in finance income/costs and excluded from underlying earnings.
Expenses incurred in respect of the management of scheme assets are included in Other comprehensive income as a reduction in the return on scheme assets. Other scheme expenses are recognised in profit or loss as an operating expense.
Remeasurements comprise actuarial gains and losses on the obligations and the return on scheme assets (excluding interest). They are recognised immediately in Other comprehensive income. Amounts shown within note 8 are before any adjustments for deferred taxation.
8.2 Defined benefit schemes: summary and description The Group operates a number of defined benefit retirement schemes (together ‘the Schemes’) providing benefits based on a benefit formula that depends on factors including the employee’s age and number of years of service. The Morrison and Safeway Schemes provide pension benefits based on either the employee’s compensation package or career average revalued earnings (CARE) (the ‘CARE Schemes’). The CARE Schemes are not open to new members and were closed to future accrual in July 2015. The RSP is a cash balance scheme, which provides a lump sum benefit based upon a defined proportion of an employee’s annual earnings, which is revalued each year in line with inflation.
The position of each scheme at 31 January 2016 is as follows:2016
£m 2015
£m
CARE Schemes 178 (43)RSP 8 4Net pension asset/(liability) 186 (39)
At the year end, schemes in surplus have been disclosed within assets on the balance sheet. The Group has taken legal advice with regard to the recognition of a pension surplus and also recognition of a minimum funding requirement under IFRIC 14 ‘IAS 19 – The limit on a defined benefit asset, minimum funding requirement and their interaction’. This advice concluded that recognition of a surplus is appropriate on the basis that the Group has an unconditional right to a refund of a surplus. Amendments to the current version of IFRIC 14 are currently being considered. The legal advice received by the Group has concluded that the above accounting treatment should not be affected by the current exposure draft of the revised wording to IFRIC 14.

89Annual report and financial statements 2015/16
8 Pensions continued
8.2 Defined benefit schemes: summary and description continuedThe disclosures below show the details of the schemes combined:
Balance sheet:2016
CARE £m
2016 RSP £m
2015CARE
£m
2015RSP £m
Fair value of scheme assets 3,812 138 4,050 87Present value of obligations (3,634) (130) (4,093) (83)Net pension asset/(liability) 178 8 (43) 4
Consolidated statement of comprehensive income2016
CARE £m
2016RSP £m
2015CARE
£m
2015RSP £m
Current service cost – recognised in cost of sales 21 42 39 33Current service cost – recognised in administrative expenses 3 20 4 4Administrative costs paid by Schemes – recognised in administrative expenses 3 1 3 1
Curtailment gain (3) – (1) –Net interest on net pension asset/(liability) – finance income – – – (1)Total expense charged to statement of comprehensive income 24 63 45 37Statement of other comprehensive income:Remeasurements in other comprehensive income (credit)/charge (236) – 31 –
The Schemes are registered schemes under the provisions of Schedule 36 of the Finance Act 2004 and the assets are held in legally separate, trustee-administered funds. The Board of each Scheme is required by law to act in the best interest of the Scheme participants and is responsible for setting the investment, funding and governance policies of the fund. A representative of the Group attends Trustee Investment Committee meetings in order to provide the Group’s view on investment strategy, but the ultimate power lies with the Trustees. The Deed and Rules of the Morrison Scheme gives the Trustees the power to set contributions. In the Safeway Schemes and the RSP this power is given to the Group, subject to regulatory override.
The latest full actuarial valuations have been carried out as at 1 April 2013 for the Safeway Schemes and 5 April 2013 for the Morrison Scheme and the RSP. The results of these valuations for the CARE Schemes have been used and updated for IAS 19 ‘Employee benefits’ purposes for the period to 31 January 2016 by a qualified independent actuary. For the RSP, an actuarial valuation for the purposes of IAS 19, based on member data as at 31 January 2016, has been completed by an independent actuary. The Schemes expose the Group to inflation risk, interest rate risk and market investment risk. In addition, the CARE Schemes expose the Group to longevity risk.
8.3 Scheme assetsAssets of the Schemes generate returns and ultimately cash that is used to satisfy the Schemes’ obligations. They are not necessarily intended to be realised in the short term. The Trustees of each Scheme invest in different categories of asset and in different allocations amongst those assets, according to the investment principles of that Scheme.
Currently, the investment strategy of the CARE Schemes is to maintain a balance of approximately 40% growth assets (comprising equities and diversified growth funds) and 60% bond-like-assets (comprising liability driven investments, corporate bonds and multi asset credit investments). RSP investments are currently based primarily in equities, however approximately 25% are in bond-like-assets. There are no direct investments in the parent Company’s own shares or property occupied by any member of the Group.
Fair value of Scheme assets:2016
CARE £m
2016RSP £m
2015CARE
£m
2015RSP £m
Equities (quoted) 681 98 1,403 84Corporate bonds (quoted) 833 – 1,109 –Diversified growth funds (quoted) 734 – – –Illiquid credit (unquoted) 271 – – –Liability driven investments (unquoted) 1,286 34 1,534 –Cash (quoted) 7 6 4 3Total 3,812 138 4,050 87

90 Wm Morrison Supermarkets PLC Financial statements
Notes to the Group financial statements continued52 weeks ended 31 January 2016
8 Pensions continued
8.3 Scheme assets continuedLiability driven investments (LDI)The policy in the CARE Schemes is to limit investment risk and to manage the liabilities in order to reduce fluctuations in the Schemes’ funding levels. This is achieved through the use of ‘liability driven investments’ (LDI), whose main goal is to have sufficient assets to meet all current and future liabilities as they fall due. LDI involves the use of derivatives such as swaps and other investment instruments. There are no annuities or longevity swaps.
The movement in the fair value of the Schemes’ assets over the period was as follows:2016
CARE £m
2016RSP £m
2015CARE
£m
2015RSP £m
Fair value of scheme assets at start of period 4,050 87 3,058 39Interest income 123 3 137 3Return on scheme assets excluding interest (299) (5) 879 9Employer contributions 27 49 46 39Employee contributions 1 6 1 2Benefits paid (87) (1) (68) (4)Administrative expenses (3) (1) (3) (1)Fair value of scheme assets at end of period 3,812 138 4,050 87
The Group previously entered into an agreement under which it contributed interests in a Scottish Limited Partnership (SLP) valued at £90m (as at 30 January 2013) to the CARE Schemes. During the year the Group agreed to provide an additional asset contribution of £150m.
The CARE Schemes’ interests in the SLP reduce the respective deficits on a funding basis, although the agreements do not affect the position directly on an IAS 19 accounting basis because the investments held by the CARE Schemes do not qualify as assets for IAS 19 purposes. The additional £150m assets to be contributed to the SLP do not affect the funding or accounting position.
As partners in the SLP, the CARE Schemes are entitled to receive a share of the profits of the SLP twice a year for 20 years. The profits shared with the Schemes are reflected in the Group financial statements as pension contributions. The SLP made a cash contribution of £6.6m during the year ending 31 January 2016, and may make annual contributions of £6.6m for a further 17 years, dependent on funding levels in the schemes.
8.4 Present value of obligationsThe movement in the defined benefit obligation over the period was as follows:
2016CARE
£m
2016RSP£m
2015CARE
£m
2015RSP £m
Defined benefit obligation at start of period (4,093) (83) (3,071) (37)Current service cost (24) (62) (43) (37)Interest expense (123) (3) (137) (2)Actuarial loss – demographic assumptions – – (21) –Actuarial gain/(loss) – financial assumptions 517 18 (889) (16)Actuarial gain – experience – 5 – 7Curtailment gain 3 – 1 –Employee contributions (1) (6) (1) (2)Benefits paid 87 1 68 4Defined benefit obligation at end of period (3,634) (130) (4,093) (83)
The durations of the defined benefit obligations at the end of the 2016 reporting period are: RSP 20 years; Morrisons CARE 25 years; Safeway CARE 23 years. The weighted average duration of all three schemes is 23 years.

91Annual report and financial statements 2015/16
8 Pensions continued
8.4 Present value of obligations continued8.4.1 Significant actuarial assumptions The following are the principal actuarial assumptions at the reporting date (expressed as weighted averages):
Financial assumptions2016
CARE2016RSP
2015CARE
2015RSP
Discount rate applied to scheme liabilities (% p.a.) 3.70% 3.70% 3.10% 3.10%Inflation assumption (RPI) (% p.a.) 3.20% 3.20% 3.10% 3.10%
Life expectancies2016
CARE2016RSP
2015CARE
2015RSP
Longevity in years from age 65 for current pensionersMale 22.6 n/a 22.6 n/aFemale 24.1 n/a 24.0 n/aLongevity in years from age 65 for current members aged 45Male 24.9 n/a 24.8 n/aFemale 26.5 n/a 26.4 n/a
Assumptions regarding future mortality experience are set based on actuarial advice and in accordance with published statistics. The mortality tables used at both year ends 2015 and 2016 are the S1PMA/S1PFA-Heavy tables (males/females) based on year of birth. Following analysis completed as part of the 2013 actuarial valuations a scaling factor of 110% was applied to the mortality tables used in the Morrison Scheme. Amongst the UK population, there is a continuing trend for a generation to live longer than the preceding generation. For the 2015 and 2016 year ends, and in line with the 2013 actuarial valuations the mortality projections used the CMI 2012 rates with an annual rate of improvement of 1.5% p.a.
Related actuarial assumptions (expressed as weighted averages)2016
CARE2016RSP
2015CARE
2015RSP
Rate of increases in salaries (% p.a.) – 2.20% 3.10% 2.30%Rate of increase of pensions in payment: RPI inflation capped at either 2.5% p.a. or 5% p.a. (% p.a.) 2.10%/3.20% – 2.10%/3.10% –Pre-retirement revaluation for active members (% p.a.) – 1.80% 3.10% 1.80%Rate of increase of pensions in deferment: CPI inflation capped at either 2.5% p.a. or 5% p.a. (% p.a.) –/2.20% 2.20%/– –/2.30% 2.30%/–CPI inflation (% p.a.) 2.20% 2.20% 2.30% 2.30%
8.4.2 Sensitivity analysis on significant actuarial assumptions The following table summarises the impact on the defined benefit obligation at the end of the reporting period if each of the significant actuarial assumptions listed above were changed, in isolation, assuming no other changes in market conditions at the accounting date. In practice, any movement in assumptions could be accompanied by a partially offsetting change in asset values, and the corresponding overall impact on the net asset is therefore likely to be lower than the amounts below in a number of scenarios. Extrapolation of the sensitivities shown may not be appropriate.
2016CARE
2016RSP
2015CARE
2015RSP
Discount rate applied to Scheme obligations +/– 0.1% p.a. –/+83 –/+3 –/+99 –/+2Inflation assumption (RPI and associated assumptions) +/– 0.1% p.a. +/–76 +/–2 +/–89 +/–1Longevity +/– one year +141 – +159 –

92 Wm Morrison Supermarkets PLC Financial statements
Notes to the Group financial statements continued52 weeks ended 31 January 2016
8 Pensions continued
8.5 FundingThe CARE Schemes and the RSP are funded schemes to which both employees and the Group contribute. The Morrison Scheme is entirely funded by the parent Company and the Safeway Scheme is funded by Safeway Limited and its subsidiaries. The Group’s subsidiaries participate in the RSP. There is no contractual agreement or stated policy for charging the net defined benefit cost between the parent Company and its subsidiaries. The contribution of each participating subsidiary to the RSP is calculated in proportion to the number of employees that are members of the RSP.
The current best estimate of Group contributions to be paid for the accounting period commencing 31 January 2016 is £67m. This estimate includes amounts payable from the SLP and salary sacrificed contributions from employees.
8.6 Closure of CARE Schemes to future accrualIn July 2015, the Group reached an agreement with the trustees of the CARE Schemes to close the Schemes to future accrual. The financial effect of this is to reduce the Group’s exposure to future volatility, increases in pension liabilities and cost.
Subsequently, the Group has entered into an agreement to contribute additional assets into the SLP. For further details of this agreement see note 8.3.
8.7 Defined contribution scheme set up costsAs previously announced the Group intends to open a new defined contribution pension scheme for colleagues. This scheme will become the Auto Enrolment scheme and as such the Group will be liable for backdated contributions for eligible colleagues to 1 October 2012. The estimated set up costs relating to backdated contributions for the period 1 October 2012 to 31 January 2016 is £35m.
9 Share-based payments
9.1 Accounting policyShare-based paymentsThe Group issues equity-settled share-based payments to certain employees in exchange for services rendered by them. The fair value of the share-based award is calculated at the date of grant and is expensed on a straight-line basis over the vesting period with a corresponding increase in equity. This is based on the Group’s estimate of share options that will eventually vest. This takes into account movement of non-market conditions, being service conditions and financial performance, if relevant.
The fair value of share options is measured by use of a binomial stochastic model. The expected life used in the model has been adjusted, based on management’s best estimate, for effects of non-transferability, exercise restrictions and behavioural considerations.
The charge in the period for share-based payments was £11m (2015: £11m).
9.2 Share save schemesThe Share save scheme began in May 2000 and all employees (including Executive Directors) are eligible once the necessary service requirements have been met. The scheme allows participants to save up to a maximum of £350 each month for a fixed period of three years. Options are offered at a discount to the mid-market closing price on the day prior to the offer and are exercisable for a period of six months commencing after the end of the fixed period of the contract. The exercise of options under this scheme is subject only to service conditions. The schemes that launched in May 2011 and subsequently are under the new scheme rules approved by the shareholders in June 2010.

93Annual report and financial statements 2015/16
9 Share-based payments continued
9.2 Share save schemes continuedThe fair value of options granted, and the inputs used to determine it are as follows:Grant date 19 May 2015 20 May 2014 13 May 2013 14 May 2012
Share price at grant date £1.81 £2.10 £2.83 £2.79Fair value of options granted £4.8m £11.6m £8.1m £9.1mExercise price £1.64 £1.64 £2.25 £2.36Dividend yield 5.15% 6.21% 4.17% 3.69%Annual risk free interest rate 1.06% 1.00% 0.45% 0.53%Expected volatility1 22.7% 18.3% 16.8% 19.4%1 The volatility measured at the standard deviation of expected share price returns is based on statistical analysis on weekly share prices over the past 3.37 years prior to the date of grant.
The requirement that the employee has to save in order to purchase shares under the Share save plan is a non-vesting condition. This feature has been incorporated into the fair value at grant date by applying a discount to the valuation obtained from the binomial stochastic option pricing model. The discount is determined by estimating the probability that the employee will stop saving based on expected future trends in the share price and employee behaviour.
2016 2015
Weighted average exercise price in
£ per shareOptions
thousands
Weighted average exercise price in
£ per shareOptions
thousands
Movement in outstanding optionsOutstanding at start of period 1.85 50,785 2.30 42,993Granted 1.64 21,729 1.64 41,208Exercised 1.66 (70) 2.28 (42)Forfeited 1.93 (23,617) 2.16 (33,374)Outstanding at end of period 1.72 48,827 1.85 50,785Exercisable at end of period 2.36 17 2.28 56
2016 2015
Weighted average share price at date
of exercise £
Number of shares
thousands
Weighted average share price at date
of exercise £
Number of shares
thousands
Share options exercised in the financial period 1.66 70 2.28 42
2016 2015
Share options outstanding at the end of the period
Range of exercise prices £1.64 to £2.36 £1.64 to £2.36
Weighted average remaining contractual life 2.2 years 2.5 years
9.3 Long term incentive plansIn May 2007, a discretionary LTIP for the benefit of certain employees was introduced. The awards have no exercise price and accrue the value of dividends over the vesting period.
LTIP grants issued before 2013 are subject to the performance conditions, as stated below. Since 2013, the performance conditions apply to Executive Committee members only. Senior employees eligible for LTIPs have to satisfy a service condition only. Given the size of the Executive Committee, the fair value of the LTIP grants assumes no leavers. The leavers assumptions below relate to the senior employees only.
Awards normally vest three years after the original grant date, provided the relevant performance criteria have been met.
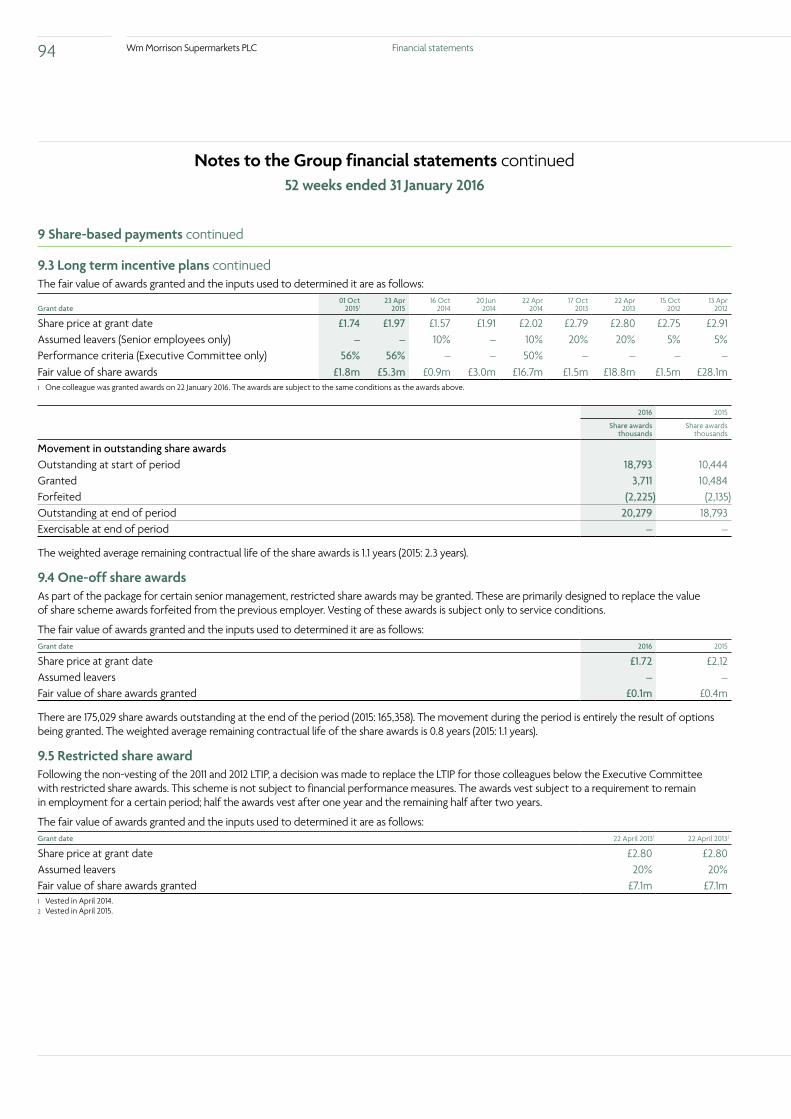
94 Wm Morrison Supermarkets PLC Financial statements
Notes to the Group financial statements continued52 weeks ended 31 January 2016
9 Share-based payments continued
9.3 Long term incentive plans continuedThe fair value of awards granted and the inputs used to determined it are as follows:
Grant date01 Oct
2015123 Apr
2015 16 Oct
201420 Jun
201422 Apr
201417 Oct
201322 Apr
201315 Oct
201213 Apr
2012
Share price at grant date £1.74 £1.97 £1.57 £1.91 £2.02 £2.79 £2.80 £2.75 £2.91Assumed leavers (Senior employees only) – – 10% – 10% 20% 20% 5% 5%Performance criteria (Executive Committee only) 56% 56% – – 50% – – – –Fair value of share awards £1.8m £5.3m £0.9m £3.0m £16.7m £1.5m £18.8m £1.5m £28.1m1 One colleague was granted awards on 22 January 2016. The awards are subject to the same conditions as the awards above.
2016 2015
Share awards thousands
Share awards thousands
Movement in outstanding share awardsOutstanding at start of period 18,793 10,444Granted 3,711 10,484Forfeited (2,225) (2,135)Outstanding at end of period 20,279 18,793Exercisable at end of period – –
The weighted average remaining contractual life of the share awards is 1.1 years (2015: 2.3 years).
9.4 One-off share awardsAs part of the package for certain senior management, restricted share awards may be granted. These are primarily designed to replace the value of share scheme awards forfeited from the previous employer. Vesting of these awards is subject only to service conditions.
The fair value of awards granted and the inputs used to determined it are as follows:Grant date 2016 2015
Share price at grant date £1.72 £2.12Assumed leavers – –Fair value of share awards granted £0.1m £0.4m
There are 175,029 share awards outstanding at the end of the period (2015: 165,358). The movement during the period is entirely the result of options being granted. The weighted average remaining contractual life of the share awards is 0.8 years (2015: 1.1 years).
9.5 Restricted share award Following the non-vesting of the 2011 and 2012 LTIP, a decision was made to replace the LTIP for those colleagues below the Executive Committee with restricted share awards. This scheme is not subject to financial performance measures. The awards vest subject to a requirement to remain in employment for a certain period; half the awards vest after one year and the remaining half after two years.
The fair value of awards granted and the inputs used to determined it are as follows:Grant date 22 April 20131 22 April 20132
Share price at grant date £2.80 £2.80Assumed leavers 20% 20%Fair value of share awards granted £7.1m £7.1m1 Vested in April 2014.2 Vested in April 2015.

95Annual report and financial statements 2015/16
9 Share-based payments continued
9.5 Restricted share award continued2016 2015
Share awards thousands
Share awards thousands
Movement in outstanding share awardsOutstanding at start of period 2,340 4,926
Exercised (1,808) (2,453)Lapsed (531) (133)Outstanding at end of period 1 2,340
9.6 Deferred share bonus planCertain members of senior management participate in the deferred share bonus plan under which 50% of any bonus payable is deferred in shares for three years from the date the deferred share award is made. Dividend equivalents accrue over the vesting period, to be paid when the shares vest. Vesting of these share awards is subject only to service conditions.
The fair value of awards granted and the inputs used to determine it:Grant date 2015/16 scheme 2014/15 scheme
Share price at grant date £2.05 £2.10Assumed leavers – –Exercise price £nil £nilFair value of share awards granted £1.1m £0.6m
2016 2015
Share awards thousands
Share awards thousands
Movement in outstanding share awardsOutstanding at start of period 815 937Granted 559 286Exercised (432) (408)Lapsed (529) –Outstanding at end of period 413 815
The weighted average remaining contractual life of the share awards is 1.9 years (2015: 0.9 years).
10 Other
10.1 Related party transactionsThe Group’s related party transactions in the period include the remuneration of the senior managers (note 1.7), and the Directors’ emoluments and pension entitlements, share awards and share options in the audited section of the Directors’ remuneration report, which forms part of these financial statements.
During the year, the Group received a dividend of £8m (2015: £nil) from MHE JVCo. The Group owns 50% of the equity of MHE JVCo.
10.2 Post balance sheet eventsFollowing IAS 10 ‘Events after the Balance Sheet Date’, the Group continues to disclose events that it considers material and non-disclosure of which can influence the economic decisions of users of the financial statements.
On 22 February 2016, the Group repaid its $250m USPP facility of £174m which was due to mature in November 2026. The Directors consider this event as a non-adjusting post balance sheet event.

96 Wm Morrison Supermarkets PLC Financial statements
Notes to the Group financial statements continued52 weeks ended 31 January 2016
10 Other continued
10.3 Full list of related undertakings
Subsidiaries of Wm Morrison Supermarkets PLC Principal activityEquity holding
%
Bos Brothers Fruit and Vegetables B.V. Acquirer of food products1 100De Mandeville Gate Management Limited Property maintenance 51Erith Pier Company Limited Property maintenance 100Farmers Boy Limited Manufacturer and distributor of fresh food products 100Farock Insurance Company Limited Insurance captive 100Firsdell Limited Property investment 100Holsa Limited Dormant 100I Morrisons.com Limited Dormant 100International Seafoods Limited Preparation and supply of seafood 100Kiddicare Properties Limited Lease company 100MHE JV Co Limited Joint venture with Ocado 50Morrisons Food Online Limited Dormant 100Morrisons-online.com Limited Dormant 100My Morrisons.com Limited Dormant 100Neerock Farming Limited Agricultural activities 100Neerock Limited Fresh meat processor 100Optimisation Developments Limited Property development 100Optimisation Investments Limited Property investment 100Perimeter Holdings Limited Property development 100Rathbone Kear Limited Manufacturer and distributor of bread 100Safeway Limited Holding company 100Wm Morrison GP 1 Limited General partner in a partnership 100Wm Morrison GP 2 Limited General partner in a partnership 100Wm Morrison GP 3 Limited General partner in a partnership 100Wm Morrison (HK) Limited Acquirer of non-food products 100Wm Morrison LP 1 Limited Limited partner in a partnership 100Wm Morrison LP 2 Limited Limited partner in a partnership 100Wm Morrison LP 3 Limited Limited partner in a partnership 100Wm Morrison Nominee 1 Limited Dormant 100Wm Morrison Nominee 2 Limited Dormant 100Wm Morrison Nominee 3 Limited Dormant 100Wm Morrison Online Limited Dormant 100Wm Morrison Pension Trustee Limited Dormant 100Wm Morrison Produce Limited Produce packer 100Wm Morrison Property Investments Limited General partner in a partnership 100Wm Morrison Supermarket Stores Limited Dormant 1001 During the year the operations of Bos Bros Fruit and Vegetables B.V. changed from a manufacturing business to a sourcing agent.
Subsidiaries of other Group companies Principal activityEquity holding
%
Alliance Property Holdings Limited Dormant 100Amos Hinton & Sons Limited Dormant 100Argyle Securities Limited Dormant 100Argyll Foods Limited Dormant 100Argyll Stores (Holdings) Limited Dormant 100Ascot Road Watford Limited Property development 100Cancede Limited Property investment 100Evermere Limited Dormant 100Cordon Bleu Freezer Food Centres Limited Dormant 100

97Annual report and financial statements 2015/16
10 Other continued
10.3 Full list of related undertakings continued
Subsidiaries of other Group companies continued Principal activityEquity holding
%
Divertigo Limited Dormant 100English Real Estates Limited Dormant 100Evermere Limited Dormant 100Farmers Boy (Deeside) Limited Dormant 100Federated Properties Limited Dormant 100Flower World Limited Dormant 100Freehold Investments Limited Property holding company 100J3 Property Limited Dormant 100Lease Securities Limited Property holding company 100Maypole Limited Holding company 100MDW (Eastbourne) Limited Dormant 100Monument Hill Properties Limited Property development 100Newincco 1072 Limited Property development 100Oldwest Limited Dormant 100Presto Stores (LC) Limited Dormant 100Presto Stores Limited Dormant 100Rathbones Bakeries Limited Dormant 100RP (No.37) Limited Property development 100Safeway (Overseas) Limited Grocery retailer 100Safeway Development Limited Dormant 100Safeway Food Stores Limited Holding company 100Safeway Pensions Trustees Company Limited Dormant 100Safeway Pension Trustees Limited Dormant 100Safeway Properties Limited Dormant 100Safeway QUEST Trustees Limited Dormant 100Safeway Stores (Gibraltar) Pension Trustees Limited Dormant 100Safeway Stores (Ireland) Limited Dormant 100Safeway Stores Limited Grocery retailer 100Safeway Trustee (FURB) Limited Dormant 100Simply Fresh Foods Holdings Limited Dormant 100Simply Fresh Foods Limited Dormant 100Stalwart Investments Limited Property holding company 100Stores Group Limited Investment company 100The Home & Colonial Stores Limited Dormant 100The Medical Hall Limited Pharmaceutical licence holder (Gibraltar) 100Tower Centre Hoddesdon Limited Property development 100Trilogy (Leamington Spa) Limited Property development 100Velligrist Limited Dormant 100Wm Morrison Bananas Limited Banana ripening 100Wm Morrison Property Partnership LP Scottish Limited Property Partnership 100Wm Morrison Property Partnership 1 Limited Partnership Property partnership 100Wm Morrison Property Partnership 2 Limited Partnership Property partnership 100Wm Morrison Property Partnership 3 Limited Partnership Property partnership 100

98 Wm Morrison Supermarkets PLC Financial statements
Wm Morrison Supermarkets PLC – Company balance sheet31 January 2016
Note2016
£m2015
£m
Fixed assets Intangible assets 11.6 465 501Property, plant and equipment1 11.7 2,149 2,359Investment property 11.8 17 32Investments 11.9 3,470 3,470Investment in joint venture 65 68 6,166 6,430Current assets
Stock 390 420Debtors 11.10 2,674 2,290Net pension asset due after more than one year 11.16 69 15Derivative financial assets due within one year 11.13 12 6Derivative financial assets due after more than one year 11.13 30 –Cash and cash equivalents 401 –
3,576 2,731Creditors – amounts falling due within one year 11.11 (2,939) (1,993)Derivative financial liabilities due within one year 11.13 (17) (18)Net current assets 620 720
Total assets less current liabilities 6,786 7,150Creditors – amounts falling due after more than one year 11.12 (1,974) (2,296)Derivative financial liabilities due after more than one year 11.13 (55) (50)Deferred tax liabilities 11.14 (132) (113)Provisions for liabilities 11.15 (254) (216)Net assets 4,371 4,475
Shareholders’ equity Share capital 11.17 234 234Share premium 11.17 127 127Capital redemption reserve 11.18 39 39Merger reserve 11.18 2,578 2,578Hedging reserve 11.18 (10) (22)Retained earnings 11.18 1,403 1,519Total shareholders’ funds 4,371 4,4751 Included in Property, plant and equipment above is £nil (2015: £12m) relating to the net book value of assets held-for-sale at the balance sheet date.
The accounting policies on pages 100 to 102 and the notes on pages 103 to 115 form part of these financial statements.
The financial statements on pages 98 to 115 were approved by the Board of Directors and authorised for issue on 9 March 2016. They were signed on its behalf by:
Trevor StrainChief Financial Officer
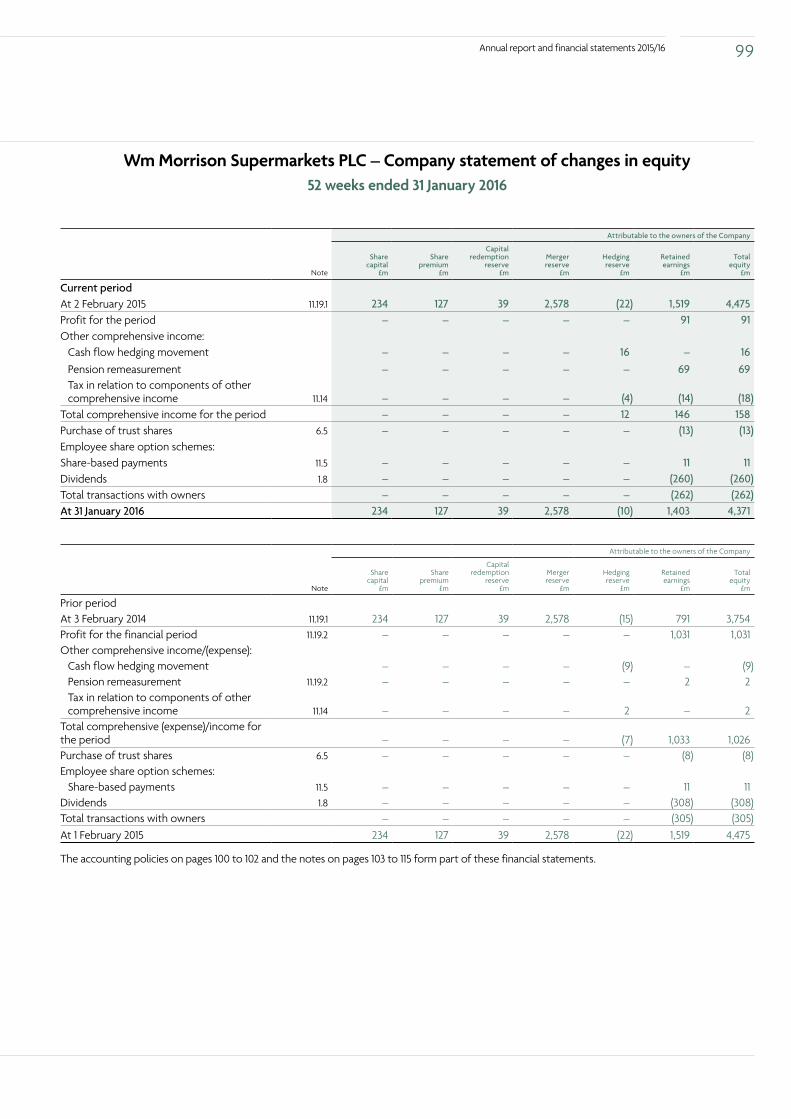
99Annual report and financial statements 2015/16
Wm Morrison Supermarkets PLC – Company statement of changes in equity52 weeks ended 31 January 2016
Attributable to the owners of the Company
Note
Sharecapital
£m
Sharepremium
£m
Capital redemption
reserve£m
Merger reserve
£m
Hedgingreserve
£m
Retained earnings
£m
Total equity
£m
Current period At 2 February 2015 11.19.1 234 127 39 2,578 (22) 1,519 4,475Profit for the period – – – – – 91 91Other comprehensive income:
Cash flow hedging movement – – – – 16 – 16Pension remeasurement – – – – – 69 69Tax in relation to components of other comprehensive income 11.14 – – – – (4) (14) (18)
Total comprehensive income for the period – – – – 12 146 158Purchase of trust shares 6.5 – – – – – (13) (13)Employee share option schemes:
Share-based payments 11.5 – – – – – 11 11Dividends 1.8 – – – – – (260) (260)Total transactions with owners – – – – – (262) (262)At 31 January 2016 234 127 39 2,578 (10) 1,403 4,371
Attributable to the owners of the Company
Note
Sharecapital
£m
Sharepremium
£m
Capital redemption
reserve£m
Merger reserve
£m
Hedgingreserve
£m
Retained earnings
£m
Total equity
£m
Prior period At 3 February 2014 11.19.1 234 127 39 2,578 (15) 791 3,754Profit for the financial period 11.19.2 – – – – – 1,031 1,031Other comprehensive income/(expense):
Cash flow hedging movement – – – – (9) – (9)Pension remeasurement 11.19.2 – – – – – 2 2Tax in relation to components of other comprehensive income 11.14 – – – – 2 – 2
Total comprehensive (expense)/income for the period – – – – (7) 1,033 1,026Purchase of trust shares 6.5 – – – – – (8) (8)Employee share option schemes:
Share-based payments 11.5 – – – – – 11 11Dividends 1.8 – – – – – (308) (308)Total transactions with owners – – – – – (305) (305)At 1 February 2015 234 127 39 2,578 (22) 1,519 4,475
The accounting policies on pages 100 to 102 and the notes on pages 103 to 115 form part of these financial statements.
100 Wm Morrison Supermarkets PLC Financial statements
Wm Morrison Supermarkets PLC – Company accounting policies 52 weeks ended 31 January 2016
11 Company financial statements
11.1 General informationThe principal activity of Wm Morrison Supermarkets PLC (the Company) is the operation of retail supermarket stores under the Morrisons brand and associated activities. The Company is incorporated and domiciled in the United Kingdom. The address of its registered office is Hilmore House, Gain Lane, Bradford, BD3 7DL, United Kingdom.
11.2 Basis of preparationThese separate financial statements of the Company have been prepared in accordance with Financial Reporting Standard 101, ‘Reduced Disclosure Framework’ (FRS 101) and the Companies Act 2006 (the Act). FRS 101 sets out a reduced disclosure framework for a ‘qualifying entity’ as defined in the standard which addresses the financial reporting requirements and disclosure exemptions in the individual financial statements of qualifying entities that otherwise apply the recognition, measurement and disclosure requirements of EU-adopted IFRS.
The Company is a qualifying entity for the purposes of FRS 101 as it is a member of a group which prepares publicly available consolidated financial statements and it is included in the consolidation for that group.
These are the first financial statements of the Company prepared in accordance with FRS 101. The Company’s date of transition to FRS 101 is 3 February 2014. As the Company is adopting FRS 101 in its own separate financial statements at a later date than it adopted EU-adopted IFRS in its consolidated financial statements, it has based the measurement of its assets and liabilities at its transition date on those used by the Group, as required by IFRS 1.
The accounting policies set out in note 11.3 have been applied in preparing the financial statements for the 52 week period ending 31 January 2016, the comparative information presented in these financial statements for the 52 week period ending 1 February 2015 and in the preparation of an opening FRS 101 balance sheet at 3 February 2014.
FRS 101 sets out amendments to EU-adopted IFRS that are necessary to achieve compliance with the Act and related Regulations. In preparing its opening FRS 101 balance sheet, the Company has adjusted the amounts reported previously in the financial statements prepared under UK GAAP. The impact of the transition to FRS 101 to the Company’s previously adopted accounting policies in accordance with UK GAAP is disclosed in note 11.19.
The Company has notified its shareholders in writing about, and they do not object to, the use of disclosure exemptions used by the Company in these financial statements.
The disclosure exemptions adopted by the Company in preparation of these financial statements in accordance with FRS 101 are as follows:
a) IFRS 2, ‘Share-based payment’ (paragraphs 45(b) and 46 to 52) – details of the number and weighted-average exercise prices of share options, and how the fair value of goods or services received was determined;
b) IFRS 7, ‘Financial Instruments: Disclosures’;
c) IFRS 13, ‘Fair value measurement’ (paragraphs 91 to 99) – disclosure of valuation techniques and inputs used for fair value measurement of assets and liabilities;
d) IAS 1, ‘Presentation of financial statements’ (paragraph 38) – comparative information requirements in respect of:
(i) paragraph 79(a)(iv) of IAS 1;
(ii) paragraph 73(e) of IAS 16, ‘Property, plant and equipment’;
(iii) paragraph 118(e) of IAS 38, ‘Intangible assets’ – reconciliations between the carrying amount at the beginning and end of the period;
(iv) paragraph 76 and 79(d) of IAS 40 ‘Investment property’;
e) The following paragraphs of IAS 1, ‘Presentation of financial statements’:
(iv) 10(d), (statement of cash flows);
(v) 111 (cash flow statement information); and
(vi) 134-136 (capital management disclosures);
f) IAS 7, ‘Statement of cash flows’;
g) IAS 8 ‘Accounting policies, changes in accounting estimates and errors’ (paragraph 30 and 31) – requirement for the disclosure of information when an entity has not applied a new IFRS that has been issued but is not yet effective;
h) The following requirements of IAS 24, ‘Related party disclosures’:
(i) paragraph 17 – key management compensation; and
(ii) the requirements to disclose related party transactions entered into with two or more wholly owned members of a group.

101Annual report and financial statements 2015/16
11 Company financial statements continued
11.2 Basis of preparation continuedIn addition to the FRS 101 exemptions above, the Company has taken advantage of the exemption available under section 408 of the Companies Act 2006 and not presented a profit and loss account for the Company.
The financial statements have been prepared on a going concern basis under the historical cost convention except as disclosed in the accounting policies in note 11.3.
The preparation of financial statements in conformity with FRS 101 requires the use of certain critical accounting estimates. It also requires management to exercise its judgement in the process of applying the Company’s accounting policies. The areas involving a higher degree of judgement or complexity, or areas where assumptions and estimates are significant to the financial statements are the same for the Company as they are for the Group. For further details, see page 59 in the Group financial statements.
Accounting reference dateThe accounting period of the Company ends on the Sunday falling between 29 January and 4 February each year.
New and amended standards adopted by the CompanyFinancial Reporting Standard 101, ‘Reduced Disclosure Framework’ has been adopted and the standard has been applied for the first time for the financial year beginning 2 February 2015. The impact of this has been disclosed in note 11.19.
11.3 Summary of accounting policiesThe accounting policies listed below are the same for the Company as for the Group. As such, for further detail see the following notes:
a) Revenue recognition (1.1);
b) Cost of sales (1.1);
c) Promotional funding and commercial income (1.1);
d) Other operating income (1.1);
e) Taxation (2.1);
f) Intangible assets (3.1);
g) Property, plant and equipment (3.1);
h) Investment property (3.1);
i) Impairment of non-financial assets (3.1);
j) Lessor accounting – operating leases (3.1);
k) Finance leases (3.1);
l) Lessee accounting – operating leases (6.1);
m) Sale and leaseback (6.1);
n) Stock (5.1);
o) Trade and other debtors (5.1);
p) Cash and cash equivalents (5.1);
q) Trade and other creditors (5.1);
r) Provisions (5.1);
s) Borrowings and borrowing costs (6.1);
t) Share capital (6.1);
u) Derivative financial instruments and hedge accounting (7.1);
v) Pensions (8);
w) Share-based payments (9); and
x) Post balance sheet events (10.2).
102 Wm Morrison Supermarkets PLC Financial statements
11 Company financial statements continued
11.3 Summary of accounting policies continuedThe following accounting policies are those policies which are specific, and which deal with items considered material, in relation to the Company’s financial statements.
InvestmentsInvestments in subsidiary undertakings and joint ventures are stated at cost less provision for impairment.
All other equity instruments are held for long term investment and are measured at fair value, where the fair value can be measured reliably. Gains or losses arising from changes in the fair value are presented in the profit and loss account within finance income or expenses in the period they arise.
Where the fair value of the instruments cannot be measured reliably, for example, when there is variability in the range of estimates, the investments are recognised at cost less accumulated impairment losses.
Impairment losses or reversals of previous impairment losses are presented in the profit and loss account in the period they arise.
Contingent liabilitiesContingent liabilities are possible obligations whose existence will be confirmed only on the occurrence or non-occurrence of uncertain future events outside the Company’s control, or present obligations that are not recognised because it is not probable that an outflow of economic benefits will be required to settle the obligation or the amount cannot be measured reliably. The Company does not recognise contingent liabilities but does disclose any such balances (see note 11.22). The disclosure includes an estimate of their potential financial effect and any uncertainties relating to the amount or timing of any outflow, unless the possibility of settlement is remote.
Financial guaranteesWhere the Company enters into financial contracts to guarantee the indebtedness of other companies within its Group, the Company considers these to be insurance arrangements, and accounts for them as such. In this respect, the Company treats the guarantee contract as a contingent liability until such time as it becomes probable that the Company will be required to make a payment under the guarantee.
11.4 Profit and loss accountThe profit after tax for the Company for the 52 week period ended 31 January 2016 was £91m (52 weeks ended 1 February 2015: restated profit after tax of £1,031m). For a reconciliation of the impact of FRS 101 on the 2015 profit after tax see note 11.19. The Company’s auditor, PricewaterhouseCoopers LLP charged £0.4m (2015: £0.4m) for audit services in the year, £nil (2015: £nil) for services related to taxation and £0.4m (2015: £0.3m) for other services.
During the period the Company disposed of its subsidiary Wm Morrison Convenience Stores Limited and associated assets to MLCG Limited. For further disclosure see note 4.5.
11.5 Share-based paymentsThe Company issues equity-settled share-based payments to certain employees in exchange for services rendered by them. The fair value of the share-based award is calculated at the date of grant and is expensed on a straight-line basis over the vesting period with a corresponding increase in equity. This is based on the Company’s estimate of share options that will eventually vest. This takes into account movement of non-market conditions, being service conditions and financial performance, if relevant.
The fair value of share options is measured by use of a binomial stochastic model. The expected life used in the model has been adjusted, based on management’s best estimate, for effects of non-transferability, exercise restrictions and behavioural considerations.
The charge in the period for share-based payments was £11m (2015: £11m).
Further details of the Company’s share schemes are disclosed in note 9, including:
a) a description of the type of share-based payment arrangements that existed during the reporting period, including general terms and conditions, maximum terms of options granted, and the method of entitlement;
b) weighted average share price information in respect of options exercised during the reporting period; and
c) the range of exercise prices and weighted average remaining contractual life of share options outstanding at the end of the reporting period.
Wm Morrison Supermarkets PLC – Company accounting policies continued52 weeks ended 31 January 2016

103Annual report and financial statements 2015/16
11 Company financial statements continued
11.6 Intangible assets
Licences£m
Softwaredevelopment
costs £m
Total£m
Cost At 2 February 2015 33 621 654Additions 6 55 61Interest capitalised – 4 4Disposals (1) (11) (12)Fully written down assets (8) (34) (42)At 31 January 2016 30 635 665Accumulated depreciation and impairment
At 2 February 2015 19 134 153Charged in the period 9 85 94Disposals (1) (4) (5)Fully written down assets (8) (34) (42)At 31 January 2016 19 181 200
Net book amount at 31 January 2016 11 454 465
The Company has performed its annual assessment of its amortisation policies and asset lives and deemed them to be appropriate. No changes have been made to asset lives during the year.
In previous years, fully amortised assets have been retained in the Company’s fixed asset register and included in the table above. In order to provide greater understanding of the Company’s annual amortisation charge, these assets have been removed from both cost and accumulated amortisation brought forward and in the current year.
Included within software development costs are assets under construction of £16m (2015: £150m).
The cost of financing asset developments prior to them being ready for use has been included in the cost of the project.
The cumulative amount of interest capitalised in the total cost above amounts to £41m (2015: £37m). Interest is capitalised at the effective interest rate of 5% (2015: 5%) incurred on borrowings.
Notes to the Company financial statements52 weeks ended 31 January 2016

104 Wm Morrison Supermarkets PLC Financial statements
11 Company financial statements continued
11.7 Property, plant and equipment
Freehold land
£m
Freehold buildings
£m
Leasehold land &
buildings £m
Plant, equipment,
fixtures & vehicles£m
Total£m
Cost At 2 February 2015 884 1,639 719 797 4,039Additions 1 – 44 105 150Transfer from investment property – 1 – – 1Transfers to other Group companies (15) (17) – (2) (34)Disposals (27) (125) (88) (77) (317)Fully written down assets – – – (84) (84)At 31 January 2016 843 1,498 675 739 3,755Accumulated depreciation and impairment At 2 February 2015 193 643 416 428 1,680Charged in the period – 37 7 96 140Transfer from investment property – 1 – – 1Transfers to other Group companies (5) (1) – (1) (7)Disposals (8) (27) (46) (43) (124)Fully written down assets – – – (84) (84)At 31 January 2016 180 653 377 396 1,606
Net book amount at 31 January 2016 663 845 298 343 2,149
The Company has performed its annual assessment of its depreciation policies and asset lives and deemed them to be appropriate. No changes have been made to asset lives during the year.
In previous years, fully depreciated assets have been retained in the Company’s fixed asset register and included in the table above. In order to provide greater understanding of the Company’s annual depreciation charge, these assets have been removed from both cost and accumulated depreciation brought forward and in the current year.
Included in the note above is an amount of £843m (2015: £884m) relating to non-depreciable land and £6m (2015: £13m) of assets under construction.
The cost of assets held under finance leases at 31 January 2016 is £353m (2015: £322m), with related accumulated depreciation of £143m (2015: £123m).
The cost of financing asset developments prior to them being ready for use has been included in the cost of the project. The cumulative amount of interest capitalised in the total cost above amounts to £73m (2015: £73m). Interest is capitalised at the effective interest rate of 5% (2015: 5%) incurred on borrowings.
The Company considers that each store is a separate cash generating unit (CGU) and therefore considers every store for an indication of impairment annually. The Company calculates each store’s recoverable amount and compares this amount to its book value. The recoverable amount is determined as the higher of ‘value in use’ and ‘fair value less costs of disposal’. If the recoverable amount is less than the book value, an impairment charge is recognised. The methodology applied by the Company is the same methodology as applied by the Group, see note 3.3 for further details.
Notes to the Company financial statements continued52 weeks ended 31 January 2016

105Annual report and financial statements 2015/16
11 Company financial statements continued
11.8 Investment propertyTotal
£m
CostAt 2 February 2015 56Transfer to property, plant and equipment (1)Disposals (25)At 31 January 2016 30Accumulated depreciation and impairmentAt 2 February 2015 24Transfer to property, plant and equipment (1)Disposals (10)At 31 January 2016 13
Net book amount at 31 January 2016 17
Included in other operating income is £8m (2015: £16m) of rental income generated from investment properties. At the end of the period the fair value of investment properties was £39m (2015: £50m). Investment properties are valued by independent surveyors on a vacant possession basis using observable inputs (fair value hierarchy Level 2).
11.9 InvestmentsInvestment
in equity instruments
£m
Investment in subsidiary
undertakings £m
Total £m
Cost At 31 January 2016 and 1 February 2015 31 3,440 3,471
Provision for impairment At 31 January 2016 and 1 February 2015 – 1 1
Net book amount at 31 January 2016 and 1 February 2015 31 3,439 3,470
A list of all of the Company’s subsidiaries is shown in note 10.3. The Directors believe that the carrying value of investments is supported by their underlying net assets.
11.10 Debtors – amounts falling due within one year2016
£m2015
£m
Trade debtors 122 118
Amounts owed by Group undertakings 2,249 1,950Other debtors – 6Current tax asset 92 57Prepayments and accrued income 211 216 2,674 2,290
Prepayments includes £182m (2015: £180m) relating to amounts falling due after more than one year. Amounts owed by Group undertakings are unsecured and repayable on demand.

106 Wm Morrison Supermarkets PLC Financial statements
11 Company financial statements continued
11.11 Creditors – amounts falling due within one year2016
£m2015
£m
Trade creditors 1,609 1,379Amounts owed to Group undertakings 740 113Other taxation and social security 124 73Other creditors 89 89Bank overdraft – 24Accruals and deferred income 377 315
2,939 1,993
Amounts owed to Group undertakings within one year are unsecured and repayable on demand.
11.12 Creditors – amounts falling due after more than one year2016
£m2015
£m
$250m US private placement loan notes (USPP) 4.4% November 2026 174 164£400m sterling bonds 4.625% December 2023 398 397£400m sterling bonds 3.50% July 2026 416 421€700m Euro bond 2.25% June 2020 527 518£300m sterling bonds 4.75% July 2029 291 291Revolving credit facility (5) 314Amounts owed to Group undertakings 173 191
1,974 2,296
Borrowings are denominated in sterling, US dollars and euros, and bear fixed interest rates, with the exception of the revolving credit facility which bears floating interest rates. All borrowings are unsecured. The revolving credit facility incurs commitment fees at market rates and drawdowns bear interest at a spread above LIBOR.
In the event of default of covenants on the bank facility, the principal amounts and any interest accrued are repayable on demand.
Finance leasesNet obligations under finance leases of £173m (2015: £191m) are payable in two to five years, and are included in amounts owed to Group undertakings in the table above.
11.13 Derivative financial assets and liabilities2016
£m2015
£m
Assets due within one yearForeign exchange forward contracts 12 6 12 6Assets due after more than one yearCross-currency swaps and interest rate swaps 30 –
30 –
Liabilities due within one yearForeign exchange forward contracts – 6Fuel and energy price contracts 17 12 17 18Liabilities due after more than one yearCross-currency swaps and interest rate swaps 46 45Energy price contracts 9 5 55 50
Notes to the Company financial statements continued52 weeks ended 31 January 2016

107Annual report and financial statements 2015/16
11 Company financial statements continued
11.13 Derivative financial assets and liabilities continuedFurther details of the derivative financial instruments are provided in note 7, including:
a) significant assumptions underlying the valuation;
b) fair value and the amounts recognised in profit and loss; and
c) significant assumptions underlying the valuation.
11.14 Deferred tax liabilities2016
£m2015
£m
Deferred tax liability 149 139Deferred tax asset (17) (26)Net deferred tax liability 132 113
IAS 12 ‘Income taxes’ permits the offsetting of balances within the same tax jurisdiction. All of the deferred tax assets are available for offset against deferred tax liabilities. The movements in deferred tax liabilities during the period are shown below:
Note
Property, plant and
equipment £m
Pensions£m
Othershort termtemporary
differences£m
Total£m
Current period At 2 February 2015 11.19.1 136 3 (26) 113Credited/(charged) to loss for the period 1 (5) 5 1Credited to other comprehensive income and equity – 14 4 18At 31 January 2016 137 12 (17) 132
Prior period At 3 February 2014 (as previously reported under UK GAAP) 114 – (27) 87Effect of changes in accounting policies 11.19.1 22 3 11 36At 3 February 2014 (under FRS 101) 11.19.1 136 3 (16) 123Charged to profit for the period – – (8) (8)Charged to other comprehensive income and equity – – (2) (2)At 1 February 2015 11.19.1 136 3 (26) 113
11.15 Provision for liabilities Onerous lease
provision£m
Other property provisions
£mTotal
£m
At 2 February 2015 205 11 216Charge recognised in profit and loss 52 – 52(Utilised)/released during the period (19) (4) (23)Unwinding of discount 9 – 9At 31 January 2016 247 7 254
Further details of the provisions are provided in note 5.5.
11.16 Pensions11.16.1 Defined benefit schemes: summary and descriptionThe Company operates a defined benefit pension scheme (CARE) and a cash balance scheme (RSP). The CARE Scheme provides benefits based on age at date of retirement, years of service and a formula using either the employee’s compensation package or career average revalued earnings (CARE). The RSP is a cash balance scheme, which provides a lump sum benefit based upon a defined proportion of an employee’s annual earnings, which is revalued each year in line with inflation. For details on the scheme rules, the closure of the CARE Scheme to future accrual and the defined contribution set up costs see note 8.

108 Wm Morrison Supermarkets PLC Financial statements
11 Company financial statements continued
11.16 Pensions continuedThe position of each scheme at 31 January 2016 is as follows:
2016 £m
2015 £m
CARE Scheme 61 11RSP 8 4Net pension asset 69 15
At the year end, schemes in surplus have been disclosed within assets on the balance sheet. The Company has taken legal advice in respect of the CARE Scheme and the RSP with regard to the recognition of a pension surplus and also recognition of a minimum funding requirement under IFRIC 14 ‘IAS 19 – The limit on a defined benefit asset, minimum funding requirement and their interaction’. This advice concluded that recognition of a surplus is appropriate on the basis that the Company has an unconditional right to a refund of a surplus. Amendments to the current version of IFRIC 14 are currently being considered. The legal advice received by the Company has concluded that the above accounting treatment should not be affected by the current exposure draft of the revised wording to IFRIC 14.
The Schemes are registered schemes under the provisions of Schedule 36 of the Finance Act 2004 and the assets are held in legally separate, trustee-administered funds. The Board of each Scheme is required by law to act in the best interest of the Scheme participants and is responsible for setting the investment, funding and governance policies of the fund. A representative of the Company attends Trustee Investment Committee meetings in order to provide the Company’s view on investment strategy, but the ultimate power lies with the Trustees. The Deed and Rules of the Morrison Scheme gives the Trustees the power to set contributions. In the RSP this power is given to the Company, subject to regulatory override.
The latest full actuarial valuations were carried out as at 5 April 2013 for the Morrison Scheme and the RSP. The results of these valuations for the CARE Scheme have been used and updated for IAS 19 ‘Employee benefits’ purposes for the period to 31 January 2016 by a qualified independent actuary. For the RSP an actuarial valuation for the purposes of IAS19, based on member data as at 31 December 2015, has been completed and updated to 1 February 2016 by a qualified independent actuary.
The Schemes expose the Company to inflation risk, interest rate risk and market investment risk. In addition, the CARE Scheme exposes the Company to longevity risk. The disclosures below show the details of the schemes combined:
Balance sheet:
2016 CARE
£m
2016RSP£m
2015 CARE
£m
2015 RSP£m
Fair value of scheme assets 1,047 138 1,106 87Present value of obligations (986) (130) (1,095) (83)
Net pension asset 61 8 11 4
11.16.2 Scheme assetsAssets of the Schemes generate returns and ultimately cash that is used to satisfy the Schemes’ obligations. They are not necessarily intended to be realised in the short term. The Trustees of each Scheme invest in different categories of asset and in different allocations amongst those assets, according to the investment principles of that Scheme.
Currently, the investment strategy of the CARE Scheme is to maintain a balance of approximately 40% equities and 60% bond-like investments. RSP investments are currently based primarily in equities. There are no direct investments in the parent Company’s own shares or property occupied by any member of the Group.
Fair value of Scheme assets:2016
CARE£m
2016RSP£m
2015 CARE
£m
2015 RSP£m
Equities (quoted) 182 98 364 87
Corporate bonds (quoted) 225 – 288 –
Government bonds (quoted) 195 – – –
Liability driven investments (unquoted) 342 34 421 –
Illiquid credit (unquoted) 72 – – –
Scottish Limited Partnership (unquoted) 29 – 32 –
Cash (quoted) 2 6 1 –
Total 1,047 138 1,106 87
Notes to the Company financial statements continued52 weeks ended 31 January 2016

109Annual report and financial statements 2015/16
11 Company financial statements continued
11.16 Pensions continued11.16.2 Scheme assets continuedLiability driven investments (LDI)The policy in the CARE Scheme is to limit investment risk and to manage the liabilities in order to reduce fluctuations in the Scheme’s funding levels. This is achieved through the use of ‘liability driven investments’ (LDI), whose main goal is to have sufficient assets to meet all current and future liabilities as they fall due. LDI involves the use of derivatives such as swaps and other investment instruments. There are no annuities or longevity swaps.
The movement in the fair value of the Schemes’ assets over the period was as follows:2016
CARE£m
2016RSP£m
2015 CARE
£m
2015 RSP£m
Fair value of scheme assets at start of period 1,106 87 817 39
Interest income 34 3 44 4
Return on scheme assets excluding interest (82) (5) 239 7
Employer contributions 12 49 21 39
Employee contributions – 6 1 2
Benefits paid (21) (1) (16) (4)
Administrative expenses (2) (1) – –Fair value of scheme assets at end of period 1,047 138 1,106 87
The Company has previously entered into an agreement under which it has contributed interests in a Scottish Limited Partnership (SLP) valued at £29m (as at 31 January 2016) to the CARE Scheme. The CARE Scheme’s interest in the SLP increases the net pension asset on an accounting basis because the investment held by the Scheme qualifies as an asset for FRS 101 purposes. The contribution of £30m (the value to the CARE Scheme as at 31 January 2013) qualified for tax relief in 2012/13, but due to the magnitude, relief is spread over four years.
As a partner in the SLP, the CARE Scheme is entitled to receive a share of the profits of the SLP twice a year for 20 years. The SLP made a contribution of £2.2m over the year ending 31 January 2016, and will make annual contributions of £2.2m for a further 17 years, dependent on funding levels in the schemes.
11.16.3 Present value of obligationsThe movement in the defined benefit obligation over the period was as follows:
2016 CARE
£m
2016RSP£m
2015 CARE
£m
2015 RSP£m
Defined benefit obligation at start of period (1,095) (83) (805) (37)Current service cost (12) (62) (24) (37)
Interest expense (34) (3) (36) (2)
Actuarial loss – demographic assumptions – – 17 –
Actuarial gain/(loss) – financial assumptions 133 18 (262) (16)
Actuarial gain – experience – 5 – 7
Curtailment gain 1 – – –
Employee contributions – (6) (1) (2)
Benefits paid 21 1 16 4
Defined benefit obligation at end of period (986) (130) (1,095) (83)
The durations of the defined benefit obligations at the end of the 2016 reporting period are: RSP 20 years and CARE 25 years. The weighted average duration of the two schemes is 24 years.

110 Wm Morrison Supermarkets PLC Financial statements
11 Company financial statements continued
11.16 Pensions continued11.16.4 Significant actuarial assumptionsThe following are the principal actuarial assumptions at the reporting date (expressed as weighted averages):
Financial assumptions2016
CARE2016RSP
2015 CARE
2015 RSP
Discount rate applied to scheme liabilities (% p.a.) 3.70% 3.70% 3.10% 3.10%
Inflation assumption (RPI) (% p.a.) 3.20% 3.20% 3.10% 3.10%
Life expectancies2016
CARE2016RSP
2015 CARE
2015 RSP
Longevity in years from age 65 for current pensioners
Male 22.0 n/a 22.0 n/a
Female 23.5 n/a 23.4 n/a
Longevity in years from age 65 for current members aged 45
Male 24.3 n/a 24.2 n/a
Female 25.9 n/a 25.8 n/a
Assumptions regarding future mortality experience are set based on actuarial advice and in accordance with published statistics. The mortality tables used at both year ends 2015 and 2016 are the S1PMA/S1PFA-Heavy tables (males/females) based on year of birth. Following analysis completed as part of the 2013 actuarial valuations a scaling factor of 110% was applied to the mortality tables used in the Morrison Scheme. Amongst the UK population, there is a continuing trend for a generation to live longer than the preceding generation. For the 2015 and 2016 year ends, and in line with the 2013 actuarial valuations the mortality projections used were the CMI 2012 rates with an annual rate of improvement of 1.5% p.a.
Related actuarial assumptions (expressed as weighted averages)2016
CARE2016RSP
2015 CARE
2015 RSP
Rate of increases in salaries (% p.a.) – 2.20% 3.10% 2.30%Rate of increase of pensions in payment: RPI inflation capped at either 2.5% p.a. or 5% p.a. (% p.a.)
2.10%/3.20% –
2.10%/ 3.10% –
Pre-retirement revaluation for active members (% p.a.) – 1.80% 3.10% 1.80%Rate of increase of pensions in deferment: CPI inflation capped at either 2.5% p.a. or 5% p.a. (% p.a.)
–/2.20%
2.20%/–
–/2.30%
2.30%/–
CPI inflation (% p.a.) 2.20% 2.20% 2.30% 2.30%
Sensitivity analysis on significant actuarial assumptions The following table summarises the impact on the defined benefit obligation at the end of the reporting period if each of the significant actuarial assumptions listed above were changed, in isolation, assuming no other changes in market conditions at the accounting date. In practice any movement in assumptions could be accompanied by a partially offsetting change in asset values, and the corresponding overall impact on the net asset/(liability) is therefore likely to be lower than the amounts below in a number of scenarios. Extrapolation of the sensitivities shown may not be appropriate.
2016 CARE
2016RSP
2015 CARE
£m
2015 RSP£m
Discount rate applied to Scheme obligations +/–0.1% p.a. –/+24 –/+3 –/+28 –/+2Inflation assumption (RPI and associated assumptions) +/–0.1% p.a. +/–21 +/–2 +/–89 +/–1Longevity +/– one year +39 – +44 –
Notes to the Company financial statements continued52 weeks ended 31 January 2016

111Annual report and financial statements 2015/16
11 Company financial statements continued
11.16 Pensions continued11.16.5 FundingThe CARE Scheme and the RSP are funded schemes to which both employees and the Company contribute. The CARE Scheme is entirely funded by the Company. The Company along with other subsidiaries of the Group participate in the RSP. There is no contractual agreement or stated policy for charging the net defined benefit cost between the Company and its subsidiaries. The contribution of each participating subsidiary to the RSP is calculated in proportion to the number of employees that are members of the RSP.
The current best estimate of Company contributions to be paid for the accounting period commencing 1 February 2016 is £59m (2015: £70m). This estimate includes salary sacrificed contributions from employees.
11.17 Share capital and other reserves2016
£m2015
£m
Authorised 4,000 million ordinary shares of 10p each (2014: 4,000 million) 400 400Issued and fully paid 2,335 million ordinary shares of 10p each (2014: 2,335 million) 234 234
For details of the share premium and shares issued in the period, see note 6.5.
11.18 Reserves2016
£m2015
£m
Capital redemption reserve 39 39Merger reserve 2,578 2,578Hedging reserve (10) (22)Retained earnings 1,403 1,519Total 4,010 4,114
Capital redemption reserveThe capital redemption reserve at the start of the period related to 389,631,561 of the Company’s own shares which it purchased on the open market for cancellation between 31 March 2008 and 8 March 2013 at a total cost of £1,081m.
Merger reserveThe merger reserve represents the reserve arising on the acquisition in 2004 of Safeway Limited. In the opinion of the Directors, this reserve is not distributable and accordingly it will be carried forward as a capital reserve.
Hedging reserveThis represents the gains and losses arising on derivatives used for cash flow hedging.

112 Wm Morrison Supermarkets PLC Financial statements
11 Company financial statements continued
11.19 Adjustments arising on the transition to FRS 101 The effects of the application of FRS 101 on the previously disclosed equity and results are as follows:
11.19.1 Shareholders’ equity Reconciliation of shareholders’ equity as at 3 February 2014
2014 under UK GAAP
£m
a)Software
development costs
£m
b)Investment
property£m
c) IAS 19
£m
d)Deferred tax
£m
e)FRS 101 presentation
changes£m
Restated 2014 under
FRS 101£m
Intangible assets 30 417 – – – – 447Property, plant and equipment 3,541 (417) (89) – – – 3,035Investment property – – 89 – – – 89Investment in joint venture 66 – – – – – 66Investments 3,470 – – – – – 3,470
Fixed assets 7,107 – – – – – 7,107
Current assets 3,467 – – – – – 3,467
Net pension assets – – – – – 12 12Creditors – amounts falling due within one year (4,291) – – – – 10 (4,281)Derivative financial liabilities – – – – – (10) (10)
Net current liabilities (824) – – – – 12 (812)
Creditors – amounts falling due after more than one year (2,320) – – – – 36 (2,284)
Derivative financial liabilities – – – – – (36) (36)Deferred tax liabilities – – – (3) (33) (87) (123)Provisions for liabilities (185) – – – – 87 (98)Net pension assets 9 – – 3 – (12) –Net assets 3,787 – – – (33) – 3,754
Shareholders’ equityShare capital and premium 361 – – – – – 361Other reserves 2,602 – – – – – 2,602Retained earnings 824 – – – (33) – 791
Total shareholders’ funds 3,787 – – – (33) – 3,754
Other reserves include capital redemption reserve of £39m and merger reserve of £2,578m offset by the hedging reserve of £15m. The application of FRS 101 has no impact on these reserves balances.
Notes to the Company financial statements continued52 weeks ended 31 January 2016

113Annual report and financial statements 2015/16
11 Company financial statements continued
11.19 Adjustments arising on the transition to FRS 101 continued11.19.1 Shareholders’ equity continuedReconciliation of shareholders’ equity as at 1 February 2015
2015 under UK GAAP
£m
a)Software
development costs
£m
b)Investment
property£m
d)Deferred tax
£m
e)FRS 101
presentation changes
£m
f)Assets
held-for-sale£m
g)Loss on
disposals£m
Restated 2015 under
FRS 101£m
Intangible assets 26 475 – – – – – 501Tangible assets 2,866 (475) (32) – – 3 (3) 2,359Investment property – – 32 – – – – 32Investment in joint venture 68 – – – – – – 68Investments 3,470 – – – – – – 3,470
Fixed assets 6,430 – – – – 3 (3) 6,430
Current assets 2,716 – – – – – – 2,716
Net pension assets – – – – 15 – – 15Creditors – amounts falling due within one year (2,011) – – – 18 – – (1,993)Derivative financial liabilities – – – – (18) – – (18)Net current assets 705 – – – 15 – – 720
Creditors – amounts falling due after more than one year (2,346) – – – 50 – – (2,296)
Derivative financial liabilities – – – – (50) – – (50)Deferred tax liabilities – – – (47) (66) – – (113)Provisions for liabilities (279) – – – 63 – – (216)Net pension assets 12 – – – (12) – – –Net assets 4,522 – – (47) – 3 (3) 4,475
Shareholders’ equityShare capital and premium 361 – – – – – – 361Other reserves 2,595 – – – – – – 2,595Retained earnings 1,566 – – (47) – 3 (3) 1,519
Total shareholders’ funds 4,522 – – (47) – 3 (3) 4,475
Other reserves include capital redemption reserve of £39m and merger reserve of £2,578m offset by the hedging reserve of £22m. The application of FRS 101 has no impact on these reserves balances.

114 Wm Morrison Supermarkets PLC Financial statements
11 Company financial statements continued
11.19 Adjustments arising on the transition to FRS 101 continued11.19.2 Comprehensive incomeReconciliation of comprehensive income for the 52 week period ended 1 February 2015
2015 under UK GAAP
£m
c) IAS 19
£m
d)Deferred tax
£m
f)Assets
held-for-sale£m
g)Loss on disposals
£m
Restated 2015 under
FRS 101£m
Profit before taxation 995 (10) – 3 (3) 985Taxation 60 – (14) – – 46Profit for the period 1,055 (10) (14) 3 (3) 1,031
Other comprehensive (expense)/incomeItems that will not be reclassified to profit or loss:Remeasurement of defined benefit pension schemes (8) 10 – – – 2Tax on defined benefit pension schemes – – – – – –
(8) 10 – – – 2Items that may be reclassified to profit or loss:Cash flow hedging movement (9) – – – – (9)Tax on cash flow hedging movement 2 – – – – 2
(7) – – – – (7)Other comprehensive (expense) for the period, net of tax (15) 10 – – – (5)Total comprehensive income for the period 1,040 – (14) 3 (3) 1,026
11.19.3 Notes to the reconciliation of UK GAAP to FRS 101a) Software development costsSoftware development costs were previously recognised under FRS 15 as a tangible asset. However, under FRS 101 software development costs meet the recognition criteria required under IAS 38 and should be recognised as intangible assets. The impact of this adjustment is to reclassify the cost and accumulated depreciation from tangible assets to intangible assets.
b) Investment propertyThe Company has investment property relating to rentals to third party tenants. Under IAS 40, investment property needs to be disclosed separately from tangible assets. The impact of this adjustment is to reclassify the cost and accumulated depreciation from tangible assets to investment property.
c) IAS 19Under FRS 17, the net pension asset is presented separately net of deferred tax in the balance sheet. Under IAS 19, the net pension asset (with no deduction for deferred tax offset) is shown separately on the balance sheet. The impact of this in the period ending 1 February 2015 was £nil (2014: £3m).
In addition, under IAS 19 the amounts charged to the income statement differ to that under FRS 17. Under IAS 19, administrative expenses are included in the charge whereas under FRS 17 they are recognised in the Statement of recognised gains and losses (STRGL). The measurement of net interest income/(expense) also differs under IAS 19. Under FRS 17, net interest income/(expense) is calculated as the net of expected returns on scheme assets less interest costs. However under IAS 19, net interest income/(expense) is calculated by applying the discount rate to the opening net pension asset/(liability) position. This difference has an offsetting effect on remeasurements recognised in other comprehensive income (IAS 19) and the actuarial gains or losses recognised in the STRGL (FRS 17). The impact of this in the period ending 1 February 2015 was £10m (2014: £6m).
d) Deferred taxRecognising deferred tax based on temporary differences under IAS 12 versus timing differences under FRS 19 has created the following adjustments applicable to the Company:
• Rolled over gains – as at 1 February 2015 the Company had £202m of rolled over gains which would give rise to a deferred tax liability of £40m (2014: £26m). The rolled over gains relate to where the taxable gain on disposal of tangible assets has been rolled over into the purchase of replacement tangible assets. No deferred tax liabilities were recognised on these items under FRS 19, but IAS 12 requires recognition on the balance sheet. The impact of this in the period ending 3 February 2015 was £15m (2014: £7m).
• Industrial Buildings Allowances (IBAs) – as at 1 February 2015 the Company had a deferred tax liability of £6m (2014: £7m) relating to IBAs claimed on its industrial buildings. The withdrawal of IBAs in 2004 results in deferred tax liabilities under IAS 12 which are not recognised under FRS 19. The impact of this in the period ending 1 February 2015 was £nil (2014: £nil).
Notes to the Company financial statements continued52 weeks ended 31 January 2016

115Annual report and financial statements 2015/16
11 Company financial statements continued
11.19 Adjustments arising on the transition to FRS 101 continued11.19.3 Notes to the reconciliation of UK GAAP to FRS 101 continued
e) FRS 101 presentation changes• Derivative financial instruments – previously derivative financial instruments had been disclosed as part of debtors or creditors under UK GAAP.
However, under IAS 39 derivative financial instruments are disclosed separately on the face of the balance sheet. See note 11.13 for further disclosure.
• Deferred tax – deferred tax was previously presented as part of provisions on the balance sheet under UK GAAP. However, under IAS 12, material deferred tax balances are disclosed separately on the face of the balance sheet. See note 11.14 for further disclosure.
• Pensions – under FRS 17, net pension assets/(liabilities) for the Company were presented under liabilities. These FRS 101 accounts adopt company law formats and as pension assets do not meet the company law definition of a fixed asset (assets of a company which are intended for use on a continuing basis in the company’s activities) net pension assets are disclosed under current assets.
f) Assets held-for-saleUnder IFRS 5, an asset is classified as held-for-sale if its carrying amount will be recovered principally through a sale transaction rather than through continuing use. Once an asset is classified as held-for-sale, the asset stops being depreciated at the point it is held-for-sale. Previously under UK GAAP, the Company had not classified assets as assets held-for-sale as this did not exist under FRS 15. This adjustment adds back the depreciation which had previously been charged under FRS 15 but should have stopped under IFRS 5 at the point the asset was held-for-sale. The impact of this in the period ending 1 February 2015 was a £3m credit to the income statement (2014: £nil).
Note that under IFRS, a separate line would be required on the face of the balance sheet (outside of other assets) for assets held-for-sale. However, this is not consistent with company law formats as required under FRS 101. As a result, assets held-for-sale have been disclosed as a memorandum underneath the balance sheet.
g) Loss on disposalsAs a result of the application of the assets held-for-sale adjustment as detailed in f) above, previous disposal calculations have been adjusted where necessary to take into account the lower depreciation charge. The impact of this in the period ending 1 February 2015 was a £3m increase to loss on disposals in the income statement (2014: £nil).
11.20 Capital commitments2016
£m2015
£m
Contracts placed for future capital expenditure not provided in the financial statements (property, plant and equipment and intangible assets) 24 144
11.21 Operating lease commitmentsTotal outstanding commitments for future minimum lease payments under non-cancellable operating leases are:
2016 2015
Land and buildings
£m
Plant, equipment, fixtures and vehicles
£m
Land and buildings
£m
Plant, equipment, fixtures and vehicles
£m
Within one year 80 15 64 15More than one year and less than five years 316 25 251 28After five years 1,341 – 1,110 – 1,737 40 1,425 43
11.22 Contingent liabilitiesThe Company has given an unlimited guarantee in respect of the overdraft of all the subsidiary undertakings within the Group’s banking offset agreement. The overdraft position at 31 January 2016 was £4m (2015: £178m). The Company has also provided a guarantee in respect of sterling bonds amounting to £426m at fair value (2015: £440m) in respect of a subsidiary undertaking. Where the Company enters into financial contracts to guarantee the indebtedness of other companies within its Group, the Company considers these to be insurance arrangements, and accounts for them as such. In this respect, the Company treats the guarantee contract as a contingent liability until such time as it becomes probable that the Company will be required to make a payment under the guarantee.
11.23 Post balance sheet eventsOn 22 February 2016, the Company repaid its $250m USPP facility of £174m which was due to mature in November 2026. The Directors consider this event as a non-adjusting post balance sheet event.

116 Wm Morrison Supermarkets PLC Investor information
Consolidated statement of comprehensive income2016
£m2015
£m2014
£m2013
£m2012
£m
Turnover 16,122 16,816 17,680 18,116 17,663Cost of sales (15,505) (16,055) (16,606) (16,910) (16,446)Gross profit 617 761 1,074 1,206 1,217Other operating income 72 78 81 80 86Profit/loss arising on disposal and exit of properties and sale of businesses 97 135 9 (1) (1)Administrative expenses (472) (1,670) (1,259) (336) (329)Operating profit/(loss) 314 (696) (95) 949 973Finance costs (112) (105) (87) (75) (47)Finance income 13 7 5 5 21Share of profit of joint venture (net of tax) 2 2 1 – –Profit/(loss) before taxation 217 (792) (176) 879 947Analysed as:
Underlying profit before tax1 242 345 719 880 948Impairment and provision for onerous contracts (87) (1,273) (903) – –Profit/loss on disposal and exit of properties 131 131 9 (1) (1)Pension scheme set-up costs (35) – – – –(Loss)/profit arising on disposal of businesses (34) 4 – – –Net pension interest income/(cost) – 1 (1) – –
217 (792) (176) 879 947
Taxation 5 31 (62) (232) (257)Profit/(loss) for the period attributable to the owners of the Company 222 (761) (238) 647 690Earnings per share (pence)– basic 9.51 (32.63) (10.23) 26.65 26.68– diluted 9.47 (32.63) (10.23) 26.57 26.03– underlying basic1 7.77 10.93 23.08 26.75 25.55Dividend per ordinary share (pence) 5.00 13.65 13.00 11.80 10.701 2013 and 2014 underlying profit restated to include new business development costs.
Five year summary52 weeks ended 31 January 2016

117Annual report and financial statements 2015/16
Five year summary continued52 weeks ended 31 January 2016
Consolidated balance sheet2016
£m2015
£m2014
£m2013
£m2012
£m
AssetsGoodwill and intangible assets 483 520 458 415 303Property, plant and equipment 7,161 7,252 8,625 8,616 7,943Investment property 37 68 119 123 259Net pension asset 186 4 – – –Investment in joint venture 63 68 66 – –Investments 31 31 31 31 31Other financial assets 30 – – – 1Non-current assets 7,991 7,943 9,299 9,185 8,537Current assets 1,308 1,144 1,430 1,342 1,322Non-current assets classified as held-for-sale – 84 – – –LiabilitiesCurrent liabilities (2,747) (2,273) (2,873) (2,334) (2,303)Other financial liabilities (2,058) (2,558) (2,516) (2,396) (1,600)Deferred tax liabilities (429) (415) (430) (471) (464)Net pension liabilities – (43) (11) (20) (11)Provisions (309) (288) (207) (76) (84)Non-current liabilities (2,796) (3,304) (3,164) (2,963) (2,159)Net assets 3,756 3,594 4,692 5,230 5,397Shareholders’ equityCalled-up share capital 234 234 234 235 253Share premium 127 127 127 107 107Capital redemption reserve 39 39 39 37 19Merger reserve 2,578 2,578 2,578 2,578 2,578Retained earnings and hedging reserves 778 616 1,714 2,273 2,440
Total equity attributable to the owners of the Company 3,756 3,594 4,692 5,230 5,397

118 Wm Morrison Supermarkets PLC Investor information
Supplementary information52 weeks ended 31 January 2016
2016%
2015%
2014 %
2013 %
2012 %
(Decrease)/increase on previous year %Turnover (4.13) (4.89) (2.41) 2.56 7.18Underlying operating (loss)/profit (23.30) (44.60) (14.86) (2.47) 7.63(Loss)/profit before taxation (127.40) 349.35 (120.02) (7.18) 8.35(Loss)/profit after taxation (129.17) 219.38 (136.79) (6.23) 9.18Underlying profit before taxation (29.86) (52.02) (18.67) (5.45) 7.56Diluted earnings per share (129.17) (218.96) (138.50) 1.92 11.10Dividend per ordinary share (18.32) 5.00 10.17 10.28 11.46
% of turnoverUnderlying operating profit 2.10 2.63 4.57 5.24 5.51Profit/(loss) before taxation 1.35 (4.71) (1.00) 4.85 5.36Profit/(loss) after taxation 1.38 (4.52) (1.35) 3.57 3.91
Retail portfolioSize 000s square feet (net sales area)0–5 4 153 102 12 35–15 57 75 76 64 6515–25 124 126 123 135 13525–40 260 260 252 239 22840+ 53 53 52 48 44Total number of stores 498 667 605 498 475Petrol filling stations 336 335 328 312 300Total sales area (000s square feet) 14,142 14,732 14,233 13,421 12,904Total sales area excluding convenience (000s square feet) 14,142 14,332 13,976 13,383 12,894Average store size (000s square feet)2 28.4 27.9 27.8 26.9 27.4Average sales area (000s square feet)1 14,532 14,442 13,640 13,396 12,456Total supermarket takings ex petrol (gross) £m2 13,700 14,033 14,593 14,875 14,585Average takings per square feet per week (£)2 18.48 19.11 20.58 21.62 22.52Average takings per store per week ex petrol (£000)2 521 531 558 591 618Average number of customers per store per week2 22,573 22,034 22,874 23,905 25,083Average take per customer (£)2 23.44 23.83 24.41 24.73 24.62
EmployeesFull time 47,925 48,519 52,315 56,177 57,169Part time 72,988 71,259 75,088 72,528 74,038Total 120,913 119,778 127,403 128,705 131,207Full time equivalent (average) 82,992 85,545 90,264 91,760 94,114
Average per FTE employee:Turnover (£000s) 194 197 196 197 188Underlying operating profit (£) 4,085 5,167 8,952 10,342 10,339Employee costs (£) 23,424 23,029 21,847 21,327 19,5301 Includes sales area of divested stores.2 Excludes convenience and online.
The impact of week 53 in the period ended 3 February 2013 was to increase turnover by £328m and increase profit before taxation by £11m.

119Annual report and financial statements 2015/16
Investor relations and financial calendar
Financial calendar 2016/17
Financial events and dividendsQuarterly management statement
5 May 2016
Final dividend record date 13 May 2016
Annual General Meeting 9 Jun 2016
Final dividend payment date 15 Jun 2016
Half year end 31 Jul 2016
Interim results announcement 15 Sep 2016
Interim dividend record date 30 Sep 2016
Interim dividend payment date 7 Nov 2016
Quarterly management statement
3 Nov 2016
Financial year end 29 Jan 2017
Company SecretaryMark Amsden
Registered officeWm Morrison Supermarkets PLC Hilmore House Gain Lane Bradford BD3 7DL Telephone: 0845 611 5000 www.morrisons.com
Investor relationsTelephone: 0845 611 5710 Email: [email protected]
Corporate responsibility enquiriesTelephone: 0845 611 5000
Annual General MeetingThe AGM will be held on 9 June 2016 at Wm Morrison Supermarkets PLC Head Office, Gain Lane, Bradford BD3 7DL.
A separate notice convening the meeting is sent to shareholders, which includes an explanation of the items of special business to be considered at the meeting.
Dividend reinvestment planThe Company has a dividend reinvestment plan which allows shareholders to reinvest their cash dividends in the Company’s shares bought in the market through a specifically arranged share dealing service. Full details of the plan and its charges, together with mandate forms, are available from the Registrars.
Morrisons websiteShareholders are encouraged to visit our website, www.morrisons.com, to obtain information on Company history, stores and services, latest offers, press information and a local store finder.
Share price informationThe investor information section of our website provides our current and historical share price data and other share price tools. Share price information can also be found in the financial press and the Cityline service operated by the Financial Times. Telephone: 0906 843 3545.
Online reports and accountsOur annual and interim Group financial statements are available to download from the website along with Corporate responsibility reports and other financial announcements. The 2015/16 Annual report is also available to view in HTML format at www.morrisons-corporate.com/ annual-report-2016
The information in the Annual report and financial statements, Strategic report, and the Interim reports is exactly the same as in the printed version.
Environmental mattersOur environmental footprint is taken very seriously. In the production of the 2015/16 Annual report, we have contributed to the reduction in environmental damage in the following ways:
a) WebsiteShareholders receive notification of the availability of the results to view or download on the Group’s website, www.morrisons-corporate.com, unless they have elected to receive a printed version of the results.
Shareholders are encouraged to view the report on the website which is exactly the same as the printed version, but using the internet has clear advantages such as lowering costs and reducing the environmental impact.
b) Recycled paperThis document has been printed on recycled paper that is manufactured in mills with ISO 14001 accreditation from 100% recycled fibre. It is totally chlorine free and is an NAPM certified recycled product.

Registrars and shareholding enquiriesAdministrative enquiries about the holding of Morrisons shares, such as change of address, change of ownership, dividend payments and the dividend reinvestment plan should be directed to:
Capita Asset Services The Registry 34 Beckenham Road Beckenham Kent BR3 4TU
Telephone: 0871 664 0300 Overseas: +44 208 639 3399 Calls cost 10p per minute plus network extras.
www.capitaassetservices.com www.ssd.capita.co.uk
SolicitorsAshurst LLP Broadwalk House 5 Appold Street London EC2A 2HA
Eversheds LLP Eversheds House 70 Great Bridgewater Street Manchester M1 JES
DWF LLP 1 Scott Place 2 Hardman Street Manchester M3 3AA
Allen & Overy LLP One Bishops Square London E1 6AD
Independent auditorsPricewaterhouseCoopers LLP Chartered Accountants and Statutory Auditors Benson House 33 Wellington Street Leeds LS1 4JP
StockbrokersJefferies Hoare Govett Vintners Place 68 Upper Thames Street London EC4V 33J
Credit Suisse One Cabot Square London E14 4QJ
Shore Capital Bond Street House 14 Clifford Street London W1S 4JU
Investment bankersNM Rothschild & Sons Limited St Swithin’s Lane London EC4N 8AL
Shareholder informationThe number of shareholders at 31 January 2016 was 45,571 (2015: 47,955) and the number of shares in issue was 2,335,154,494 (2015: 2,335,084,014).Analysis by shareholder Number of holders % holders Balances at 31 Jan 2016 % capital
Private shareholder 40,479 88.83 102,481,229 4.39Nominee companies 4,411 9.68 2,022,421,611 86.61Deceased accounts 361 0.79 658,668 0.03Limited companies 150 0.33 3,488,014 0.15Other institutions 57 0.12 4,075,199 0.17Bank and bank nominees 64 0.14 81,341,797 3.48Investment trusts 16 0.04 97,738 0.004Pension funds 15 0.03 84,954 0.003Family interests 18 0.04 120,505,284 5.163
Analysis by shareholder Number of holders % holders Balances at 31 Jan 2016 % capital
1–1,000 24,782 54.38 10,607,825 0.451,001–10,000 18,366 40.30 54,981,978 2.3610,001–1,000,000 2,253 4.95 170,684,700 7.31Over 1,000,000 170 0.37 2,098,879,991 89.88
120 Wm Morrison Supermarkets PLC Investor information
Investor relations and financial calendar continued

Throughout the Directors’ report and Strategic report: (1) Unless otherwise stated, 2015/16 refers to the 52 week period ended 31 January 2016 and 2014/15 refers to the 52 week period ended 1 February 2015. 2015 and 2016 refer to calendar years. (2) Underlying profit is defined as profit before impairment, provision for onerous contracts and other items that do not relate to the Group’s principal activities on an ongoing basis, profit/loss arising on disposal and exit of properties and sale of businesses and IAS 19 pension interest, at a normalised tax rate, as reconciled in note 1.4 of the Group financial statements. Underlying operating profit is operating profit before impairment, provision for onerous contracts and other items that do not relate to the Group’s principal activities and profit/loss arising on disposal and exit of properties and sale of businesses. (3) Like-for-like (LFL) sales reflects the percentage change in year-on-year store sales (excluding VAT and fuel), stripping out the impact of new store openings and closures in the current or previous financial year.
Strategic reportChairman’s statement 2
Our business model 4
Chief Executive’s statement 6
Our six priorities 8
Chief Financial Officer’s review 10
Relationships 14
Risk 17
Corporate Responsibility 20
GovernanceCorporate governance report 22
Directors’ remuneration report 33
Directors’ report 44
Financial statementsIndependent auditors’ report 47
Consolidated statement of comprehensive income 55
Consolidated balance sheet 56
Consolidated cash flow statement 57
Consolidated statement of changes in equity 58
General information 59
Notes to the Group financial statements 60
Company balance sheet 98
Company statement of changes in equity 99
Company accounting policies 100
Notes to the Company financial statements 103
Investor informationFive year summary 116
Supplementary information 118
Investor relations and financial calendar 119
Information at your fingertips 121
121Annual report and financial statements 2015/16
Customer
Our website, www.morrisons.com, allows you to shop online, search hundreds of inspirational recipes for the food we make, move and sell, and even find ideas for popular event-themed activities.
Morrisons.com deliveries currently service 56% of Great Britain; a postcode checker enables you to see if you are eligible for our home delivery service.
At Morrisons.com you can:• Buy over 18,000 Morrisons grocery products
• Benefit from competitive ‘one-off’ delivery charges
• Purchase a monthly, weekly or annual delivery pass for flat-fee unlimited delivery
• Check out latest promotions and seasonal events
• Review selected offline-only products
• Sign up for our latest offers by email
• Find recipes based on our ingredients and inspired by our campaigns/events
• Learn about our produce and its journey from ‘field to fork’
• Read content on healthy eating, reducing food waste and our support for various causes
You can also sign up to and manage your ‘Match & More’ account on our website. In our dedicated area, you can find out what our loyalty card scheme has to offer, check your points balance and make changes to preferences.
Not all products are available online. However, the website is an excellent vehicle for raising awareness and interest of the things we offer.
You are also able to preview selected items from ranges such as Nutmeg and Market Street, and our new café offers, in-store services, award wins, pharmacies, glass hire, flower shops and new store openings online.
We also provide an online Store Finder where you can find details of your nearest store, opening times and services.
Corporate
Our corporate website, www.morrisons-corporate.com, is a one-stop portal that exists for the benefit of our investors, the public and the media. This site has the following sections:
About MorrisonsYou will find information about the Group, its operations, strategy and structure, and past financial information.
JobsCareer opportunities and information about working for Morrisons. For our dedicated recruitment website, go to www.morrisons.jobs/
Media centreLatest releases about the growing estate of Morrisons, along with promotions and product news.
Corporate responsibilityHere you can find out about our corporate responsibility ethos, including how we take good care of our environment, society and how we go about business. www.morrisons.co.uk/cr
InvestorsPresentations, announcements and financial reports can be quickly and easily downloaded or viewed on-screen as PDFs. You can easily navigate around the Annual report and financial statements 2015/16 on-screen, viewing only the parts you want to, at www.morrisons-corporate.com/ annual-report-2016
WebcastsWebcasts of the Directors delivering the preliminary results for 2015/16 on 10 March 2016 are available.
Shareholder informationOther relevant shareholder information is available, for example share price history, dividends, financial calendar and AGM minutes.
Electronic communicationsElectronic communications (eComms) is the fastest and most environmentally friendly way to communicate with our shareholders.
Instead of receiving paper copies of the annual and interim financial results, notices of shareholder meetings and other shareholder documents, you will receive an email to let you know this information is available on our website.
Visiting our website to obtain our results reduces our environmental impact by saving on paper and also reduces our print and distribution costs.
Sign up to eComms on our website at www.morrisons-corporate.com and follow the investor eComms link.
Information at your fingertips
Designed & Produced by
Radley Yeldarry.com
Photography by
Richard Moran
Printing by
Geoff Neal GroupPaper stock: This report is printed on Amadeus Offset uncoated, a 100% recycled paper. Amadeus Offset is manufactured to the certified environmental management system ISO 14001.
019514_Morrisons_AR_Front_Cover.indd 4-6 13/04/2016 17:02

Wm Morrison Supermarkets PLCHilmore House, Gain Lane Bradford BD3 7DLTelephone: 0845 611 5000
Visit our website: www.morrisons.com