food knowledge survey 2011: preliminary report · pdf filefood knowledge survey 2011:...
TRANSCRIPT

Food Knowledge Survey 2011: Preliminary Report The Food Knowledge Survey was conducted as part of a project titled A taxonomy of Australian consumers’ knowledge of food and health funded by the Australian Research Council (ARC DP 1094993, Chief Investigators Worsley, Wang and Yeatman). The purpose of the survey was to see how much people know about the components of a healthy diet, the nutrient content and health consequences of foods, safe food practices, and a variety of environmental and ethical food issues such as animal welfare and climate change. The survey was carried out in November and December 2011 across Australia and involved 2022 adult participants, 50.4% of whom were male, 33.5% had children under 18 years of age living with them, 31.6% were university educated and 53.8% studied home economics or health at school. This report describes the preliminary results. Further analyses of these data will be reported soon. Contacts: Prof Tony Worsley (email: [email protected])
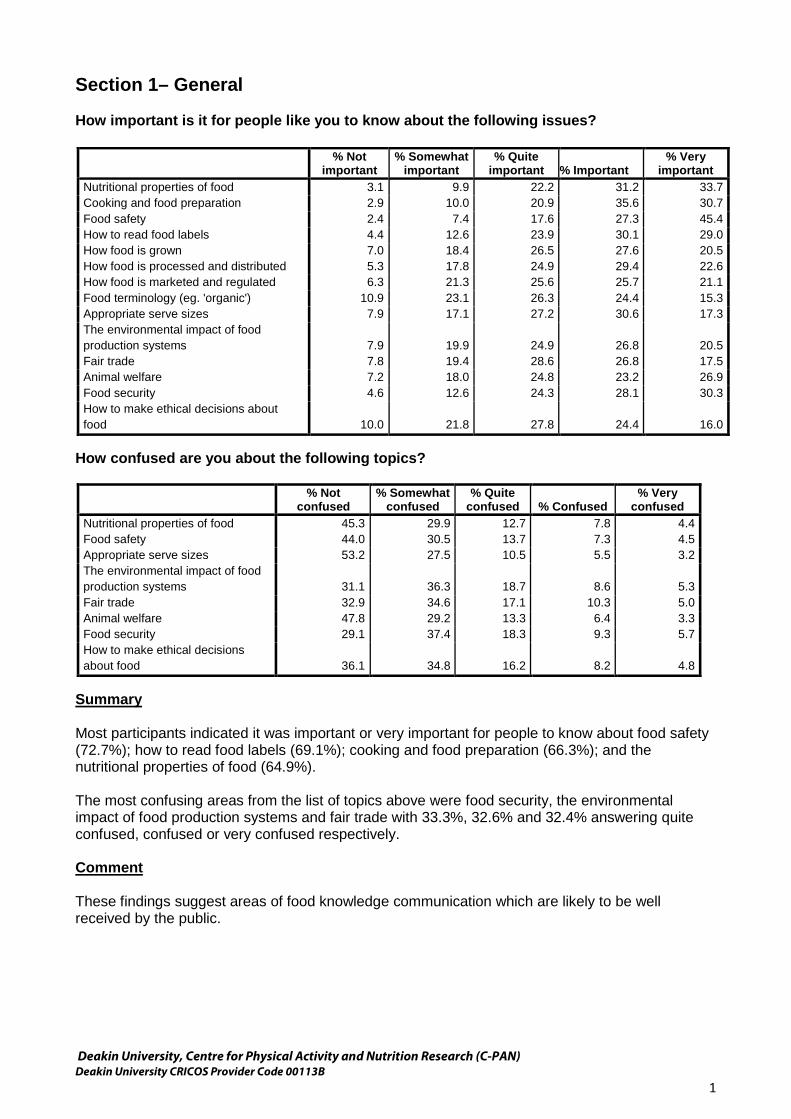
Section 1– General How important is it for people like you to know about the following issues?
% Not important
% Somewhat important
% Quite important % Important
% Very important
Nutritional properties of food 3.1 9.9 22.2 31.2 33.7 Cooking and food preparation 2.9 10.0 20.9 35.6 30.7 Food safety 2.4 7.4 17.6 27.3 45.4 How to read food labels 4.4 12.6 23.9 30.1 29.0 How food is grown 7.0 18.4 26.5 27.6 20.5 How food is processed and distributed 5.3 17.8 24.9 29.4 22.6 How food is marketed and regulated 6.3 21.3 25.6 25.7 21.1 Food terminology (eg. 'organic') 10.9 23.1 26.3 24.4 15.3 Appropriate serve sizes 7.9 17.1 27.2 30.6 17.3 The environmental impact of food production systems
7.9
19.9
24.9
26.8
20.5
Fair trade 7.8 19.4 28.6 26.8 17.5 Animal welfare 7.2 18.0 24.8 23.2 26.9 Food security 4.6 12.6 24.3 28.1 30.3 How to make ethical decisions about food
10.0
21.8
27.8
24.4
16.0
How confused are you about the following topics?
% Not confused
% Somewhat confused
% Quite confused % Confused
% Very confused
Nutritional properties of food 45.3 29.9 12.7 7.8 4.4 Food safety 44.0 30.5 13.7 7.3 4.5 Appropriate serve sizes 53.2 27.5 10.5 5.5 3.2 The environmental impact of food production systems
31.1
36.3
18.7
8.6
5.3
Fair trade 32.9 34.6 17.1 10.3 5.0 Animal welfare 47.8 29.2 13.3 6.4 3.3 Food security 29.1 37.4 18.3 9.3 5.7 How to make ethical decisions about food
36.1
34.8
16.2
8.2
4.8
Summary Most participants indicated it was important or very important for people to know about food safety (72.7%); how to read food labels (69.1%); cooking and food preparation (66.3%); and the nutritional properties of food (64.9%). The most confusing areas from the list of topics above were food security, the environmental impact of food production systems and fair trade with 33.3%, 32.6% and 32.4% answering quite confused, confused or very confused respectively. Comment These findings suggest areas of food knowledge communication which are likely to be well received by the public.
Deakin University, Centre for Physical Activity and Nutrition Research (C-PAN) Deakin University CRICOS Provider Code 00113B
1

Section 2 – Nutrition
1. Do you think the average Australian should be eating less, the same amount, or more of these foods?
% Less % Same % More % Not sure
Vegetables 2.6 7.5 87.8 2.1 Sugary foods 85.1 9.4 4.0 1.5 Meat 23.8 51.7 21.7 2.8 Starchy foods 60.9 28.0 4.7 6.3 Highly processed fatty foods 86.9 6.5 4.9 1.6 High fibre foods 2.5 18.7 75.7 3.1 Fruit 2.5 10.5 85.2 1.8 Salty foods 80.5 13.5 3.8 2.3 Dairy Products 11.4 56.3 28.4 3.9 Fish 4.1 16.5 76.5 3.0
2. About how many servings of fruit and vegetables should people eat a day?
number of servings %Fruit % Vegetables
0 0.8 0.4 1 7.3 7.9 2 44.2 14.0 3 29.0 23.3 4 6.4 8.8 5 10.5 42.0 6 0.7 1.6 7 >7
0.3 0.6
0.7 1.1
Summary Most participants thought the average Australian should eat more vegetables (87.8%), fruit (85.2%), fish (76.5%) and high fibre foods (75.7%), and less highly processed fatty foods (86.9%), sugary foods (85.1%), salty foods (80.5%) and starchy foods (60.9%). This is in accordance with the Australian dietary guidelines (National Health & Medical Research Council [NHMRC] 2011). Only 44% and 42% of participants knew that most people should eat 2 serves of fruit and 5 serves of vegetables per day, respectively. About half thought they should eat more fruit and fewer vegetables than this. Comment These results suggest that most people know which foods they should eat more of and which foods they should eat less of, except with regards to meat and dairy. Although most participants, indicated that the average Australian eats the right amount of meat and dairy, the new dietary guidelines suggest men should eat less meat, women should eat more and everyone should consume more dairy (NHMRC 2011). It is clear from these results that the 2 fruit, 5 vegetables a day message has not reached at least half the population.
Deakin University, Centre for Physical Activity and Nutrition Research (C-PAN) Deakin University CRICOS Provider Code 00113B
2

3. Do the following amounts of foods represent one serve, less than one serve or more than one serve?
% Less than 1
serve % 1 serve % More than 1
serve % Not sure Breads & Cereals - 2 slices of bread 5.7 67.7 20.5 6.2 Fruit & Vegetables - 1 medium potato 19.2 65.7 9.3 5.7 Fruit & Vegetables - 5 strawberries 21.1 60.1 11.4 7.4 Fruit & Vegetables - 20 grapes 13.0 54.8 24.7 7.6 Dairy - 150g yoghurt 7.8 71.2 12.9 8.1 Dairy - 20g (1 slice) cheese 23.3 64.5 5.2 6.9 Meat - 100g of meat, chicken or fish 15.6 67.7 9.5 7.3 Extras - 1 chocolate bar 13.3 33.5 40.5 12.8 Extras - 1 scoop of ice cream 17.2 52.4 18.1 12.3 Extras - 1 meat pie 12.6 31.3 44.2 12.0
Summary Most participants knew the appropriate serving sizes for bread (67.7%), potato (65.7%), grapes (54.8%) and meat (67.7%), however, most underestimated the serving sizes of strawberries, yoghurt and cheese, with only 21.1%, 7.8% and 23.3% correctly answering the serving size questions for these items respectively. There was general confusion about what one serve of chocolate, ice cream or a meat pie is; only 40.5%, 18.1% and 44.2% correctly answered that 1 chocolate bar, 1 scoop of ice cream and 1 meat pie is more than one serve, respectively. Comment These results demonstrate that most people underestimate dairy serve sizes. This may partially explain why people are not eating enough dairy. They don’t appear to know how much they should be eating. There was general confusion about what one serve of chocolate, ice cream or a meat pie is.
4. Which fat is most important for Australians to cut down on?
Percent Monounsaturated fat 2.5
Polyunsaturated fat 3.1 Saturated fat 44.5 Trans fat 32.9 Not sure 17.0 Total 100.0
Summary Most participants knew that saturated and trans fats are harmful for health (77.4%). Although trans fats are more harmful than saturated fats, they are not present in many foods in Australia. Therefore, saturated fat is the most important fat for Australians to cut down on (according to current recommendations, NHMRC 2011). Deakin University, Centre for Physical Activity and Nutrition Research (C-PAN) Deakin University CRICOS Provider Code 00113B
3

5. What type of dairy foods is recommended for adults to consume in a healthy diet?
Percent 6.5
Low fat 57.5 Both full fat and lower fat 24.2 None, dairy foods should be cut out 2.8 Not sure 9.0 Total 100.0
Summary The response to question 5 shows that most participants knew that low fat dairy foods are recommended for adults as part of a healthy diet (57.5%). A significant proportion of participants believed a combination of full fat and low fat is best (24.2%). Whilst some research supports this view, at this stage the recommendation is for adults to consume low fat dairy foods (German et al. 2009; Ralston et al. 2012; Elwood et al. 2008; NHMRC 2003).
6. What is the least healthy method of cooking meat, chicken or fish?
Percent Grilled-barbequed 12.2
Pan fried 67.9 Baked 6.5 Stewed-casseroled 5.7 Not sure 7.8 Total 100.0
7. What is the healthiest method of cooking vegetables?
Percent Steamed 85.8
Boiled 5.4 Stir fried 4.4 Fried-crumbed 1.5 Not sure 2.9 Total 100.0
Summary The results to questions 6 and 7 demonstrate that most participants knew the healthiest and least healthy cooking methods (85.8% and 67.9% respectively). Although pan frying is the least healthy cooking method, charring of meat from grilling or barbequing is also dangerous and has been associated with certain cancers (Alaejos, Gonzalez & Afonso 2008; Zheng & Lee 2009).
8. Do you think these foods are high or low in added sugar?
% High % Low % Not sure Bananas 13.6 77.8 8.5 Strawberry yoghurt 55.0 30.9 14.0 Orange 35% juice 78.4 12.7 8.9 Muesli bar 72.0 17.5 10.5
Deakin University, Centre for Physical Activity and Nutrition Research (C-PAN) Deakin University CRICOS Provider Code 00113B
4
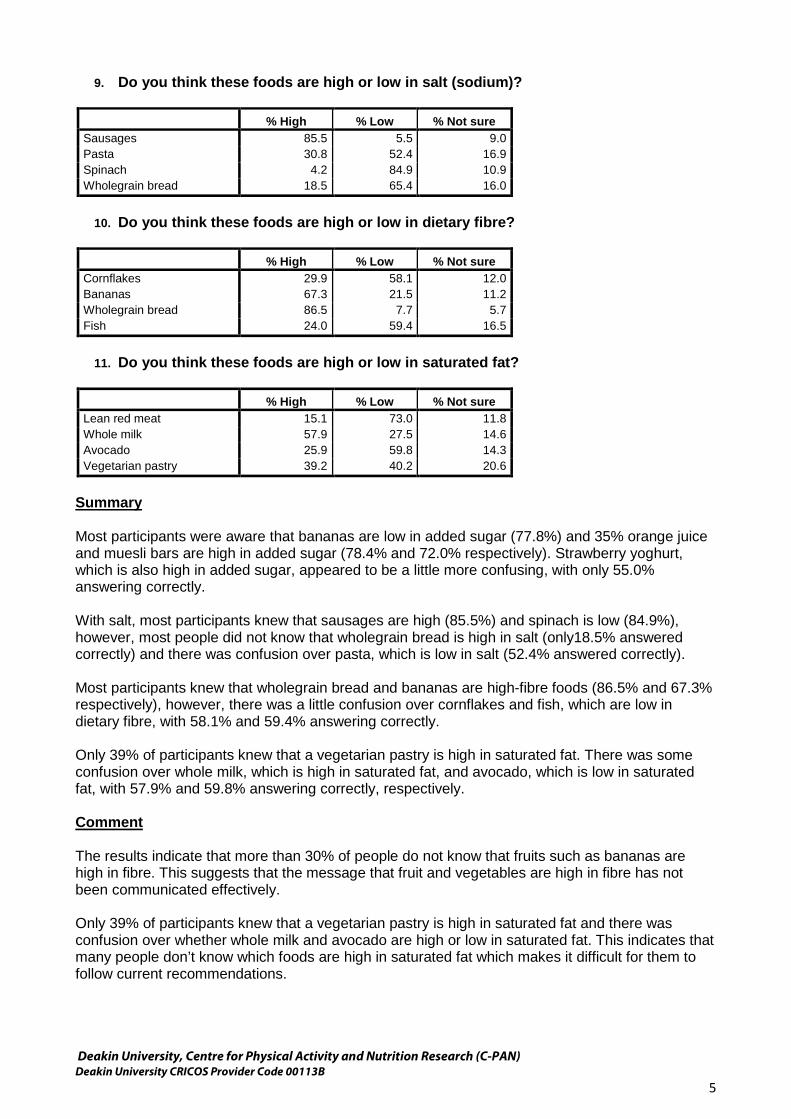
9. Do you think these foods are high or low in salt (sodium)?
% High % Low % Not sure Sausages 85.5 5.5 9.0 Pasta 30.8 52.4 16.9 Spinach 4.2 84.9 10.9 Wholegrain bread 18.5 65.4 16.0
10. Do you think these foods are high or low in dietary fibre?
% High % Low % Not sure
Cornflakes 29.9 58.1 12.0 Bananas 67.3 21.5 11.2 Wholegrain bread 86.5 7.7 5.7 Fish 24.0 59.4 16.5
11. Do you think these foods are high or low in saturated fat?
% High % Low % Not sure
Lean red meat 15.1 73.0 11.8 Whole milk 57.9 27.5 14.6 Avocado 25.9 59.8 14.3 Vegetarian pastry 39.2 40.2 20.6
Summary Most participants were aware that bananas are low in added sugar (77.8%) and 35% orange juice and muesli bars are high in added sugar (78.4% and 72.0% respectively). Strawberry yoghurt, which is also high in added sugar, appeared to be a little more confusing, with only 55.0% answering correctly. With salt, most participants knew that sausages are high (85.5%) and spinach is low (84.9%), however, most people did not know that wholegrain bread is high in salt (only18.5% answered correctly) and there was confusion over pasta, which is low in salt (52.4% answered correctly). Most participants knew that wholegrain bread and bananas are high-fibre foods (86.5% and 67.3% respectively), however, there was a little confusion over cornflakes and fish, which are low in dietary fibre, with 58.1% and 59.4% answering correctly. Only 39% of participants knew that a vegetarian pastry is high in saturated fat. There was some confusion over whole milk, which is high in saturated fat, and avocado, which is low in saturated fat, with 57.9% and 59.8% answering correctly, respectively. Comment The results indicate that more than 30% of people do not know that fruits such as bananas are high in fibre. This suggests that the message that fruit and vegetables are high in fibre has not been communicated effectively. Only 39% of participants knew that a vegetarian pastry is high in saturated fat and there was confusion over whether whole milk and avocado are high or low in saturated fat. This indicates that many people don’t know which foods are high in saturated fat which makes it difficult for them to follow current recommendations.
Deakin University, Centre for Physical Activity and Nutrition Research (C-PAN) Deakin University CRICOS Provider Code 00113B
5

12. Which of these breads contains the most dietary fibre?
Percent White bread 2.3
Wholemeal bread 22.2 Wholegrain bread 70.4 Not sure 5.1 Total 100.0
13. Which one of the following has the most kilojoules (i.e. calories, energy) for the same
weight?
Percent Sugar 27.2
Carbohydrate 12.7 Dietary fibre 2.7 Fat 22.9 Alcohol 14.4 Not sure 20.2 Total 100.0
Summary Most participants were aware that wholegrain bread contains the most dietary fibre (70.4%), however there was a lot of confusion around which nutrient is the most energy dense. Only 22.9% of participants knew that fat is the most energy dense nutrient. Comment This result confirms that there is confusion about sources of dietary energy. This suggests that effective communication about energy content is required.
14. A healthy dinner plate should consist of:
Percent Half protein, half vegetables 13.4
Half carbohydrates, a quarter protein, a quarter vegetables 3.7 Not sure 7.2 Half vegetables, a quarter protein, a quarter carbohydrates 54.7 A third vegetables, a third protein, a third carbohydrates 21.0 Total 100.0
15. Do these habits help prevent heart disease?
% Yes % No % Not sure Eating MORE dietary fibre 78.1 10.3 11.5 Eating LESS saturated fat 86.8 5.9 7.2 Eating LESS fruit 6.1 87.2 6.7 Eating LESS salt 87.7 5.7 6.5 Eating MORE vegetables 85.9 7.7 6.4 Eating LESS preservatives-additives 76.7 10.1 13.3 Eating LESS omega-3 fatty acids 19.8 64.4 15.8 Maintaining a healthy body weight 91.0 3.6 5.3%
Deakin University, Centre for Physical Activity and Nutrition Research (C-PAN) Deakin University CRICOS Provider Code 00113B
6

16. Do these habits help prevent obesity?
% Yes % No % Not sure Eating LESS dietary fibre 12.0 78.0 10.0 Eating LESS saturated fat 87.0 7.2 5.8 Eating MORE sugar 5.1 91.0 3.9 Eating MORE fruit and vegetables 88.9 6.3 4.8 Drinking LESS alcohol 88.7 6.4 4.9 Exercising MORE 91.8 4.3 4.0
Summary Over half of the participants (54.7%) knew the proportions of carbohydrates, protein and vegetables that make up a healthy dinner plate (United States Department of Agriculture n.d.). Most participants knew which diet and lifestyle habits prevent heart disease; 78.1% or more answered correctly for each of the habits except for ‘Eating LESS preservatives/additives’ and ‘Eating LESS omega-3 fatty acids’. Only 10.1% of participants knew that eating less preservatives and additives does not prevent heart disease and 64.4% knew that eating less omega-3 fatty acids also does not help. Most participants recognised which diet and lifestyle habits prevent obesity with 78% or more answering correctly for each habit. Comment These results indicate that almost half of the general population (45%) do not know the proportions of carbohydrates, protein and vegetables that make up a healthy dinner plate. Most people know which diet and lifestyle habits prevent heart disease, however, 35% either don’t know what omega-3 fatty acids are or aren’t aware of their importance in preventing heart disease. Nearly 77% of respondents believed preservatives and additives contribute to heart disease, however, evidence to date has not demonstrated any clear association. Whilst these findings are encouraging there is clearly a need for better communication and education about these concepts.
17. Which nutrient is particularly important for the healthy development of a baby's brain during pregnancy?
Percent
Zinc 4.7 Folate 59.5 Calcium 6.7 Vitamin K 4.1 Not sure 24.9 Total 100.0
18. There is another nutrient needed for healthy development of an unborn baby's brain.
What is it?
Percent Iodine 15.3
Iron 30.3 Vitamin C 5.9 Magnesium 10.3 Not sure 38.2 Total 100.0
Deakin University, Centre for Physical Activity and Nutrition Research (C-PAN) Deakin University CRICOS Provider Code 00113B
7

19. Vitamin D and Calcium are important for:
Percent Fighting infections in the body 4.6
Transporting oxygen in the blood 3.2 Building strong bones 81.3 Maintaining vision-eye sight 3.0 Not sure 7.9 Total 100.0
20. What does Iron do?
Percent Helps produce hormones needed by the body 4.7
Helps blood clot to enable wounds to heal 10.0 Helps convert glucose to energy 6.2 Transports oxygen in the blood 54.9 Not sure 24.1 Total 100.0
21. Which of these nutrients are particularly important for adolescent girls and women of
reproductive age?
Percent Vitamin C 20.0 Iron 60.5 Calcium 37.5 Iodine 15.2 Vitamin E 19.9 Not sure 23.0
Summary The results for questions 16 – 20 in Section 2 show that 59.5% and 15.3% of participants knew that folate and iodine are particularly important for the development of a baby’s brain. Most respondents knew that vitamin D and calcium are important for building strong bones (81.3%) but there was some confusion over the function of iron, only 54.9% recognised that it transports oxygen in the blood and nearly a quarter of participants indicated they didn’t know. 60.5% of participants knew that iron is particularly important for adolescent girls and women of reproductive age, however, only 15.2% knew that iodine is also important for this age group. Comment These results indicate that only 15% of people know the importance of iodine for adolescent girls and women of reproductive age and its importance in the development of a baby’s brain. This is a serious knowledge gap and it is important that women and girls (in particular) are made aware of the importance of iodine so they can ensure they consume enough iodine before and during pregnancy. Most people (59.5%) recognised that folate is also important in foetal brain development, however, about 40% of respondents indicated they did not know. Although the fortification of bread with folate and iodine was made mandatory in Australia in 2009 (Food Standards Australia New Zealand [FSANZ] 2010) these results suggest the need for further communication about these issues and the reasons for fortification.
Deakin University, Centre for Physical Activity and Nutrition Research (C-PAN) Deakin University CRICOS Provider Code 00113B
8

Most respondents recognised the importance of vitamin D and calcium in building strong bones. Nevertheless most Australians do not eat enough dairy foods (NHMRC 2011). This may be partly due to inadequate knowledge of appropriate serving sizes for dairy foods as indicated previously. Over half of the participants knew the role of iron in the body (54.9%) and its importance for adolescent girls and women of reproductive age (60.5%). However, about 40% or more were unaware. This knowledge is important in the prevention and treatment of iron deficiency which is quite prevalent in Australian society (Pasricha et al 2010).
22. As far as you know, do the federal and state governments control the use of the following phrases on food labels?
% Yes % No % Not sure
Reduced fat 29.9 26.2 44.0 High in fibre 27.1 27.5 45.5 Low in salt 27.6 27.1 45.3
23. Now think about the Nutrition Information Panel on the food label. This shows the
amounts of kilojoules (or calories), protein, and fat in the food. If it showed that 100 grams of the food contained the following amounts of nutrient, would you consider them to be low or high amounts?
% High % Low % Not sure
100 milligrams of sodium 55.1 19.9 25.0 20 grams of fat 72.8 7.4 19.8 15 milligrams of cholesterol 39.5 27.3 33.2 5 grams of dietary fibre 11.4 65.8 22.8 10 grams of saturated fat 62.7 15.6 21.8
24. The following label is the nutrition information panel on a loaf of white bread
currently sold in Australia. Do you think this bread is high in fat, salt, sugar and dietary fibre?
% Yes % No % Not sure
Fat 21.7 64.5 13.8 Salt 67.1 17.4 15.6 Sugar 31.4 53.6 15.0 Dietary fibre 18.4 66.7 14.9
25. Below are food labels for 2 popular breakfast cereals. Which cereal do you think
contains the most sugar, salt and dietary fibre?
% Cereal A % Cereal B % They are the
same % Not sure Sugar 71.0 11.2 4.5 13.3 Salt 69.9 10.3 4.4 15.4 Dietary fibre 10.3 69.3 4.4 16.0%
Summary Generally, there was confusion as to whether the government regulates the terms ‘reduced fat’, ‘high in fibre’ and ‘low in salt’ on food labels, only 29.9%, 27.1% and 27.6% of participants knew that each of these terms is regulated. Most participants knew that 20 grams of fat and 10 grams of saturated fat in 100 grams of food are high amounts of fat and saturated fat (72.8% and 62.7% respectively), however, only 11.4% knew
Deakin University, Centre for Physical Activity and Nutrition Research (C-PAN) Deakin University CRICOS Provider Code 00113B
9

that 5 grams of dietary fibre in 100 grams of food is a high amount and only 19.9% and 27.3% knew that 100 grams of sodium and 15 milligrams of cholesterol in 100 grams in food are low amounts, respectively. Most participants were able to see from the food label for a loaf of white bread that this bread was high in salt (Q23, 67.1%) and low in fat (64.5%), sugar (53.6%) and dietary fibre (66.7%), however about a third or more could not tell from the label whether this bread was high or low in these nutrients. Question 24 asked participants to read the labels for two popular breakfast cereals and compare the quantities of sugar, salt and dietary fibre in these cereals. Most participants were able to compare the labels and discern which product was higher in sugar (71.0%), salt (69.9%) and dietary fibre (66.7%), however, about 29% or more were not able to do this. Comment These results indicate that there is confusion as to whether governments regulate the terms ‘reduced fat’, ‘high in fibre’ and ‘low in salt’ on food labels. These terms are in fact regulated by the federal government (NSW Food Authority 2011; Food Standards Australia New Zealand 2012). These results suggest the need for better communication about government regulation in this area. About 30% of people were unable to compare the quantities of certain nutrients in foods using the food labels and most respondents could not identify the amounts of nutrients there should be in 100g of a food, with the exception of fat and saturated fat. Given the importance of these nutrients (e.g. sodium reduction) these are problematic findings. We will examine who these people are in future analyses. This demonstrates a gap in the public’s knowledge in reading and understanding food labels.
26. Up to what age should an infant consume breast milk (or infant formula) only?
Percent Around 3 months 10.7
Around 6 months 25.4 Around 9 months 10.8 Around 12 months 21.0 Around 18 months or longer 11.6 Don't know 20.5 Total 100.0
Summary Only 25.4% of participants knew that infants should only consume breast milk or infant formula up to around 6 months of age. Comment The responses to question 26 indicate that only a quarter of Australian adults are aware that infants should only consume breast milk or infant formula up to around 6 months of age. This is the current recommendation from the World Health Organisation (WHO) and the Australian Government Department of Health and Ageing (DoHA) (World Health Organisation 2012; Department of Health and Ageing [DoHA] 2010). Before 6 months of age an infant’s digestive system is unlikely to be mature enough to digest solid foods and after this age (approximately) breast milk or infant formula can no longer meet the nutritional needs of the infant. These findings suggest miscommunication of this message. The education of expectant and new parents in this area is essential to ensure that infants receive the energy and nutrients in the quantities they need for optimal growth.
Deakin University, Centre for Physical Activity and Nutrition Research (C-PAN) Deakin University CRICOS Provider Code 00113B
10
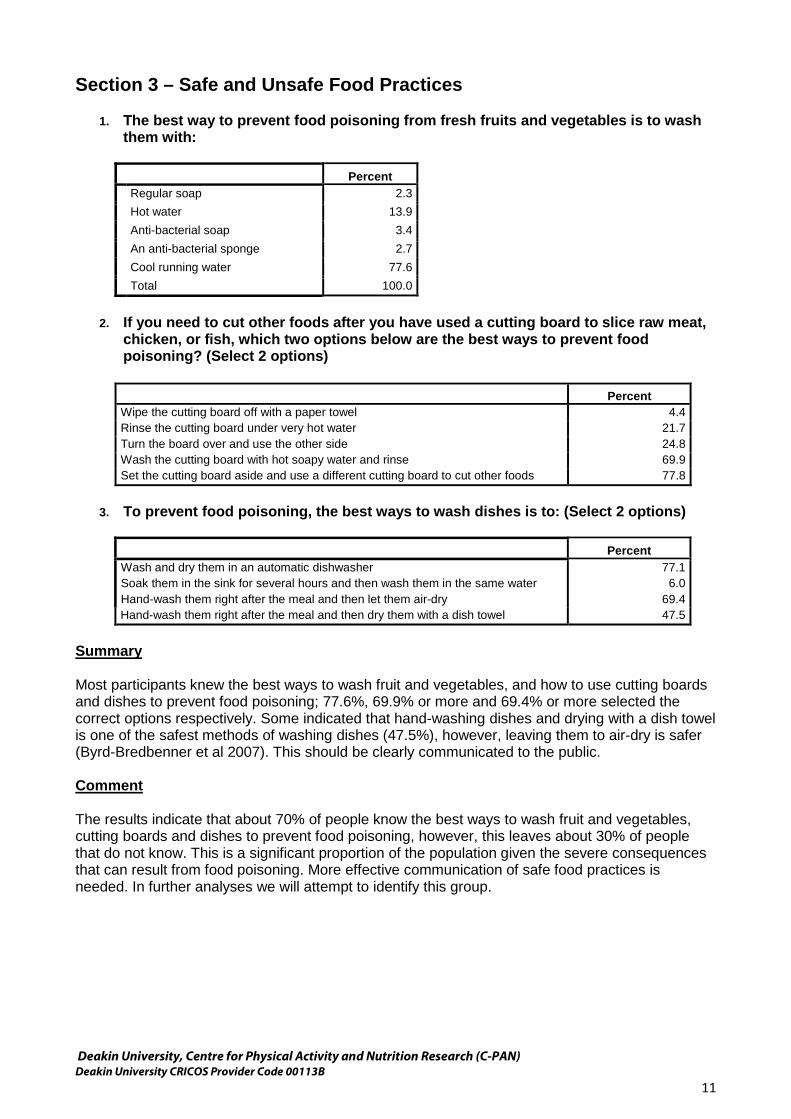
Section 3 – Safe and Unsafe Food Practices
1. The best way to prevent food poisoning from fresh fruits and vegetables is to wash them with:
Percent
Regular soap 2.3 Hot water 13.9 Anti-bacterial soap 3.4 An anti-bacterial sponge 2.7 Cool running water 77.6 Total 100.0
2. If you need to cut other foods after you have used a cutting board to slice raw meat,
chicken, or fish, which two options below are the best ways to prevent food poisoning? (Select 2 options)
Percent
Wipe the cutting board off with a paper towel 4.4 Rinse the cutting board under very hot water 21.7 Turn the board over and use the other side 24.8 Wash the cutting board with hot soapy water and rinse 69.9 Set the cutting board aside and use a different cutting board to cut other foods 77.8
3. To prevent food poisoning, the best ways to wash dishes is to: (Select 2 options)
Percent
Wash and dry them in an automatic dishwasher 77.1 Soak them in the sink for several hours and then wash them in the same water 6.0 Hand-wash them right after the meal and then let them air-dry 69.4 Hand-wash them right after the meal and then dry them with a dish towel 47.5
Summary Most participants knew the best ways to wash fruit and vegetables, and how to use cutting boards and dishes to prevent food poisoning; 77.6%, 69.9% or more and 69.4% or more selected the correct options respectively. Some indicated that hand-washing dishes and drying with a dish towel is one of the safest methods of washing dishes (47.5%), however, leaving them to air-dry is safer (Byrd-Bredbenner et al 2007). This should be clearly communicated to the public. Comment The results indicate that about 70% of people know the best ways to wash fruit and vegetables, cutting boards and dishes to prevent food poisoning, however, this leaves about 30% of people that do not know. This is a significant proportion of the population given the severe consequences that can result from food poisoning. More effective communication of safe food practices is needed. In further analyses we will attempt to identify this group.
Deakin University, Centre for Physical Activity and Nutrition Research (C-PAN) Deakin University CRICOS Provider Code 00113B
11

4. To wash your hands properly, after applying soap to wet hands, how long should you rub your hands together for?
Percent
At least 5 - 10 seconds 14.0 At least 10 - 15 seconds 33.4 At least 15 - 20 seconds 22.0 At least 20 - 30 seconds 30.6 Total 100.0
5. To prevent food poisoning, what should your freezer's operating temperature be?
Percent
-18°C 29.1 -8°C 26.7 -4°C 38.5 0°C 5.7 Total 100.0
6. To prevent food poisoning, what should your refrigerator's operating temperature
be?
Percent -18°C 5.0
-4°C 19.6 4°C 62.0 7°C 9.6 16°C 3.7 Total 100.0
Summary Only 22.0% of participants knew the minimum time you should rub your hands together for when washing them, however, 30.6% thought it was longer. Only 29.1% knew the correct operating temperature of a freezer to prevent food poisoning though 62.0% knew the correct operating temperature of a refrigerator. Comment These results indicate that about half of the Australian population do not know how to wash their hands properly, most do not know what the temperature of a freezer should be and over a third do not know what the temperature of a refrigerator should be. This suggests that communication is required to ensure everyone knows how they can minimise their risk of contracting food poisoning.
Deakin University, Centre for Physical Activity and Nutrition Research (C-PAN) Deakin University CRICOS Provider Code 00113B
12

7. If a family member is going to be several hours late for a hot meal, how should you store the meal to keep it safe until this person is ready to eat it?
Percent
Store it in the refrigerator and reheat it when the person is ready to eat it 60.4 Store it on the kitchen counter until the person is ready to eat it 1.8 Store it in a cool oven until the person is ready to eat it 4.2 Store it in a warm oven until the person is ready to eat it 24.6 Don't know 8.9 Total 100.0
8. To prevent food poisoning, how long should leftover foods be heated?
Percent
Until they are boiling hot 37.6 Just until they are hot, but not too hot to eat right away 36.4 Just until they are at least room temperature 5.8 Reheating isn't necessary 3.8 Don't know 16.4 Total 100.0
9. Which foods are safe for pregnant women, infants and children to eat?
Percent
Soft cheeses, cold smoked fish, cold deli salads 16.1 Hot dogs and lunchmeats that have not been reheated 5.2 Raw or undercooked eggs 5.0 Canned vegetables, pasteurized fruit juice 56.9 These individuals do not need to avoid any type of food 16.8 Total 100.0
Summary Over half (60.4%) of participants knew how to correctly store a hot meal for someone who will be eating hours after preparation, only 37.6% knew how to reheat leftover food appropriately and 56.9% knew which foods are safe for pregnant women, infants and children. Comment The results for questions 7, 8 and 9 show that many people do not have basic knowledge on food safety for everyday activities or for people at particular life stages. Most people do not know that they should reheat leftover foods until they are boiling hot in order to prevent food poisoning, more than 40% do not know which foods are safe and, more importantly, unsafe for pregnant women, infants and children, and about 40% do not know how to correctly store a hot meal for someone who will be eating hours after preparation. These food safety knowledge gaps are likely to contribute to the prevalence of food borne illness.
Deakin University, Centre for Physical Activity and Nutrition Research (C-PAN) Deakin University CRICOS Provider Code 00113B
13

10. Which two options do you think are the best ways to defrost meat?
Percent Leave it covered on the sink 22.3 Put it in the fridge to defrost a day before you need it 84.4 Defrost it in a plastic bag in a sink of hot water 12.0 Defrost in the microwave and cook right away 68.7 Don't know 6.3
Summary Most participants knew the safest ways to defrost meat, with 68.7% and 84.4% selecting the safest options. A significant proportion, however, believed it is safe to defrost meat by leaving it on the sink (22.3%) or by defrosting it in a plastic bag in a sink of hot water (12.0%). Comment These results indicate that most people are aware of the safest ways to defrost meat, however, some people falsely believe that unsafe options such as leaving meat on the sink are safe. This is incorrect and should be clarified and communicated appropriately to ensure the public can protect themselves from food borne illnesses. Overall, the respondents’ knowledge of food safety was poor. This suggests the need for more effective communication and education about food safety.
Deakin University, Centre for Physical Activity and Nutrition Research (C-PAN) Deakin University CRICOS Provider Code 00113B
14

Section 4 – Environment and Ethics
1. How much would you say you know about…
% Nothing at all % A little % Some % A lot Food Security 30.6 42.8 22.2 4.5 Environmental Sustainability 21.4 45.0 26.7 6.9 Fair Trade 25.4 47.4 22.7 4.5 Animal Welfare 13.6 45.7 31.8 8.8 Genetically Modified Foods 29.1 45.8 20.1 4.9 Organic Foods 16.6 47.0 29.3 7.1 Climate Change 11.7 42.2 34.9 11.3
Summary Most of the participants generally felt they knew little or nothing about the listed topics. The highest levels of self rated knowledge were about climate change and animal welfare (46.2% and 40.6% said they knew some or a lot about these topics respectively). The topics with the lowest self rated knowledge levels were genetically modified foods and food security (25.0% and 26.7% reported they knew some or a lot about these topics respectively).
2. Which of the following do you think best describes what food security is?
Percent
Ensuring food is not tampered with during production 42.6 Ensuring a regular supply of safe and nutritious food is accessible and affordable for everyone.
42.1
Ensuring the food you eat is safe and nutritious by growing it yourself 7.9 None of the above 7.4 Total 100.0
3. Do you agree or disagree with the following statements about the food supply?
% Agree % Disagree % Not sure
There are starving people in the world because not enough food is produced to feed everyone
39.6 50.1 10.3
Some people in rural or remote Australia cannot eat a healthy diet because fresh healthy food is not available in the local store
38.5 44.7 16.8
4. Approximately what percentage of people in Australia run out of food every
fortnight?
Percent 0 - 5% 22.8
5 - 10 38.3 10 - 20 23.9 20 - 30 15.0 Total 100.0
Deakin University, Centre for Physical Activity and Nutrition Research (C-PAN) Deakin University CRICOS Provider Code 00113B
15

5. How many people in the world go hungry every day?
Percent 50 - 100 million 23.5
300 - 400 million 30.6 600 - 700 million 19.2 900 million - 1 billion 26.7 Total 100.0
Summary Only 42.1% of participants understood the meaning of the term food security, about half knew that the world produces enough food to feed everyone and only 26.7% knew that 900 million – 1 billion people go hungry every day. On a local level, only 38.5% of participants knew about food insecurity issues experienced in rural and remote Australia and 38.3% knew the proportion of the Australian population that run out of food every fortnight. Comment The results indicate that most people are not aware of the term food security or the extent of food insecurity in Australia and the world. Nearly three quarters of Australian adults do not know the extent of hunger in the world and more than 60% are unaware of the difficulties that people here in Australia experience in obtaining adequate nutritious food every day. Again better communication and education is indicated. If people become more aware of these issues they can take action if they wish to, in the political domain or in the supermarket, for example, by supporting a particular political group, government policies or programs, or buying fair trade products.
6. Which of the following best describes what environmental sustainability is?
Percent The ability of the environment to adapt to change (eg.
Temperature, rainfall, animal and plant species numbers) 10.8
Living in a way that minimises damage to the environment 57.2 Extinction of species of plants and animals and evolution of new species better able to survive in today's environment
3.8
All of the above 28.3 Total 100.0
7. Do you think the following statements are true or false?
% True % False % Not sure
Use of fertilisers and pesticides damages soil and reduces its ability to produce food in the long term
56.9 23.3 19.7
All insecticides and pesticides are a health hazard 45.8 38.3 15.9
8. By 2050 rainfall in the south east of Australia is expected to...
Percent
Increase by 10% 20.2 Increase by 20% 18.4 Decrease by 10% 41.5 Decrease by 20% 19.9 Total 100.0
Deakin University, Centre for Physical Activity and Nutrition Research (C-PAN) Deakin University CRICOS Provider Code 00113B
16

Summary About 57% of participants knew the correct definition of environmental sustainability and 57% were aware of the damage fertilisers and pesticides cause to the soil. However, only 38.3% knew that not all fertilisers and pesticides are a health hazard and only 41.5% were aware that rainfall in the south east of Australia is expected to drop by 10% by 2050. Comment These results indicate that whilst many know what environmental sustainability is (57.2%), 40% of the Australian population do not know, and most do not have the knowledge to live in an environmentally sustainable way or to decide whether or not to support policies and initiatives that are critical to the future of food production in this nation.
9. Which of the following do you think best describes what fair trade is?
Percent Farmers receiving a fair price for their produce 27.9
Workers being paid and treated fairly 16.8 The production and farming of food in an environmentally responsible way
7.3
All of the above 47.9 Total 100.0
10. Which of the following do you think best describes what animal welfare is?
Percent
(a) How an animal is physically and psychologically coping with the conditions in which it lives
30.4
(b) The legal rights of animals, which are essentially the same as the rights of humans
10.4
(c) Both (a) and (b) 50.9 (d) Neither (a) or (b) 8.4 Total 100.0
11. Intensive farming methods (i.e. keeping animals housed or confined for most of their
lives) are used in Australia for which of the following animals?
Percent Chickens 75.8 Cattle 28.0 Pigs 58.4 Egg laying hens 83.7 None of the above 6.7
Summary Only 47.9% of participants knew what fair trade is and only 30.4% were able to correctly describe what animal welfare is. Most people know that chicken and egg laying hens are intensively farmed (75.8% and 83.7% respectively), however, only 58.4% were aware that pigs are also intensively farmed in Australia.
Deakin University, Centre for Physical Activity and Nutrition Research (C-PAN) Deakin University CRICOS Provider Code 00113B
17

Comment These results suggest there are major knowledge gaps about fair trade and animal welfare. These knowledge gaps mean that many Australians cannot make informed decisions on whether to support more ethically operated farms and buy free range and fair trade products or not. Better communication about these issues is required.
12. Which of the following do you think best describes what a genetically modified food is?
Percent
Food that contains genetic material 6.9 Foods that have been made by cross-breeding two other foods using natural plant and animal reproduction methods
12.6
Food in which the genes have been altered using biotechnology 73.6 None of the above 6.9 Total 100.0
13. Do you agree or disagree with the following statements about the food supply?
% Agree % Disagree % Not sure
Genetically modified foods can prolong shelf life of food and offer lower prices
51.2 16.2 32.6
Genetically modified foods are NOT necessary to feed the world's population
43.7 24.2 32.1
In Australia, foods containing genetically modified ingredients must indicate this on their product label
64.9 10.5 24.6
Genetically modified foods must first obtain a safety clearance before they can be sold in Australia
68.7 7.6 23.6
It is impossible to transfer animal genes into plants 20.9 31.2 47.9 Genetic modification can produce foods that are more nutritious than conventional foods
32.7 31.2 36.1
Summary Almost three quarters (73.6%) of participants selected the correct definition of a genetically modified food and most knew that genetically modified foods must undergo a safety check before being sold in Australia (68.7%) and that the product label must state that the product contains genetically modified ingredients (64.9%). About half knew that genetically modified foods can prolong shelf life and lower food prices and less than half believe that genetically modified foods are not needed to feed the world’s population. Many did not know what this technology can do; with less than a third of participants knowing that genetic modification can be used to transfer animal genes into plants and that it can produce foods with higher nutritional value. Comment The results from questions 12 and 13 indicate that, whilst most people know what a genetically modified food is, there is general confusion as to what this technology can do and uncertainty around whether we need genetically modified food to feed the world’s population. Better communication, by impartial authorities, is required.
Deakin University, Centre for Physical Activity and Nutrition Research (C-PAN) Deakin University CRICOS Provider Code 00113B
18

14. Which of the following do you think best describes what an organic food is?
Percent Food that is not genetically modified 4.7
Food that is grown without the use of synthetic chemicals such as pesticides and artificial fertilisers
51.0
Food that is not exposed to radiation 2.2 All of the above 42.1 Total 100.0
15. Do you agree or disagree with the following statements about the food supply?
% Agree % Disagree % Not sure
Organic foods are more nutritious than conventional foods 42.2 33.4 24.4 Organic farmers use natural pesticides to control insects and weeds
64.0 13.5 22.6
In Australia there are government regulations regarding labelling a product as 'organic'
65.6 8.9 25.6
Summary Almost all the participants knew that organic food is grown without the use of synthetic chemicals (93.1%) but at least half did not know that organic foods are also not genetically modified or exposed to radiation. Most participants knew that organic farmers use natural pesticides (64.0%), however, only a third of participants knew organic foods do not have added nutritional benefits and only 8.9% of participants were aware that the use of the word ‘organic’ is not government regulated. Comment The results indicate that most people have a fair idea of what organic foods are but many are under some misconceptions regarding organic foods such as that they are more nutritious than conventional foods (33.4%). Fewer than 10% of respondents know that the word ‘organic’ is not government regulated. This should be clarified to the public, or alternatively the use of the word organic on product labels should be regulated to ensure people are confident that they are buying what they think they are buying, as recommended in a recent review of food labels (DoHA 2011). Over a third of Australians do not know that organic farmers use natural pesticides. Again, this should be communicated to ensure people know what they are getting when they buy organic foods.
16. Which of the following do you think best describes what climate change is?
Percent A shift in the earth's climate to more unstable patterns that has occurred in recent decades 47.8
A shift in the earth's climate to higher temperatures that has occurred in recent decades 30.8 A shift in the earth's climate to lower temperatures that has occurred in recent decades 4.5 A myth created by the government to justify another tax 16.9 Total 100.0
Deakin University, Centre for Physical Activity and Nutrition Research (C-PAN) Deakin University CRICOS Provider Code 00113B
19

17. Are the following statements about climate change true or false?
% True % False % Not sure The burning of fossil fuels does NOT contribute to climate change 13.9 66.8 19.3 Climate change is expected to cause more frequent, extreme weather conditions including floods, droughts and bushfires
76.3 11.0 12.8
Ocean acidification, caused by climate change, is a serious threat to food webs and ecosystems.
58.6 14.2 27.3
Climate change is causing mass extinction of plant and animal species across the world
46.6 26.5 26.9
18. Which of the following are greenhouse gases?
% Yes % No % Not sure
Carbon dioxide 66.3 15.6 18.1 Hydrofluorocarbons 54.5 12.3 33.2 Oxygen 11.0 70.7 18.3 Carbon Trioxide 29.9 15.3 54.8 Methane 70.1 8.9 21.0
Summary Only 30.8% of participants knew that climate change is a change in the earth’s climate to higher temperatures. 47.8% thought it was a change to more unstable patterns. Whilst most accepted it was a form of global reality, 16.9% of participants thought climate change is a myth created by the government to justify another tax. Most participants knew that the burning of fossil fuels contributes to climate change (66.8%) and that climate change is expected to increase the frequency of extreme weather conditions such as floods, droughts and bushfires (76.3%), however, only 58.6% knew that climate change is also causing ocean acidification, threatening oceanic wildlife and only 46.6% of participants believe climate change is causing mass extinction of plant and animal species worldwide. The results from question 18 show that most participants knew which gases are greenhouse gases with 54.5%, 66.3% and 70.1% knowing that hydrofluorocarbons, carbon dioxide and methane are greenhouse gases, respectively (Parliament of Australia 2008). Comment These findings suggest that the issue of climate change and its associated serious consequences have not been communicated effectively to the public, making it difficult for them to make an informed decision on whether or not to support policies and initiatives for the environment. This is particularly relevant given the federal government recently introduced a carbon tax. Around a third of participants were unaware of which were and were not greenhouse gases. This suggests more public education is required.
Deakin University, Centre for Physical Activity and Nutrition Research (C-PAN) Deakin University CRICOS Provider Code 00113B
20

Discussion This study provides some clear insights into the knowledge of Australian adults with regards to components of a healthy diet, the nutrient content and health consequences of foods, safe food practices, and a variety of environmental and ethical food issues. Gaps in the knowledge of Australian adults can be identified from the responses and addressed by the Australian government and other stakeholders. Overall knowledge of particular areas held by different population groups will be analysed and reported later. A number of knowledge gaps identified in the nutrition section may be contributing to the obesity epidemic Australia is currently experiencing. These include ignorance about appropriate serving sizes of lollies and junk foods (energy dense, nutrient poor foods); foods that are high in saturated fat; energy density of nutrients; proportions of carbohydrates, protein and vegetables on a healthy dinner plate; and reading food labels. These topics should be considered in public health communication campaigns to promote healthy eating and tackle obesity. Better communication and education about foods and nutrients may help prevent heart disease and obesity. Areas of ignorance include knowledge of foods that are high in fibre, particularly fruit and vegetables, and knowledge regarding omega-3 fatty acids. Other areas for improvement include knowledge of dairy foods (especially relevant to the prevention of osteoporosis). Although the survey indicates that most respondents understood the importance of calcium and vitamin D in building strong healthy bones, it also indicates that most respondents underestimated the amount of dairy foods Australians should eat and the appropriate serving sizes of dairy products. Considering the prevalence of osteoporosis (and other chronic diseases) will likely increase in the future as the Australian population ages, and that osteoporotic fractures are associated with reduced quality of life and increased mortality, this knowledge gap needs to be addressed urgently. This food knowledge survey also demonstrates a knowledge gap in the areas of important nutrients for women of reproductive age and during pregnancy, as well as breastfeeding recommendations. Only 15% of participants knew the importance of iodine during pregnancy. Iodine deficiency during pregnancy can prevent the healthy development of the baby’s brain, causing intellectual disability or mental retardation. Education about the importance of iodine is critical to prevent intellectual disability in children (Charlton, Yeatman & Houweling 2010). Although participants’ knowledge of the importance of folate and iron in women of reproductive age was better, the results indicate that about 40% of Australians are not aware of their importance. Folate is critical for foetal brain development and women of reproductive age are particularly at risk of iron deficiency due to blood loss during menstruation. Clearly, there is a need for more effective communication and education in this area. The results also suggest that three quarters of the Australian population did not know for how long an infant should only consume breast milk or infant formula exclusively. This gap should be rectified. Both the WHO and the DoHA recommend that infants should be given breast milk or infant formula exclusively up to around 6 months of age. Before this time an infant’s digestive system may not be mature enough to digest solid foods and after this age breast milk or infant formula can no longer meet the nutritional needs of the infant. The education of expecting and new parents in this area is essential to ensure that infants receive the energy and nutrients in the quantities they need for optimal growth. In practice this is knowledge that all citizens should know, so greater emphasis on its acquisition may be required in secondary and tertiary education. The results of the food safety section of the survey indicate that there are serious gaps in Australians’ knowledge of food safety. The aspects of food safety knowledge tested in this survey are basics in food safety that everyone should know. The Australian and State governments have conducted community education programs for many years; these findings suggest that they need to be supported further and more effective communication strategies on safe food practices are required.
Deakin University, Centre for Physical Activity and Nutrition Research (C-PAN) Deakin University CRICOS Provider Code 00113B
21

Overall, the respondents’ knowledge of current environmental and ethical food issues was poor. This knowledge gap prevents people from making educated choices in the supermarket, such as whether to buy free range, fair trade, organic or genetically modified products, or whether to support or oppose certain policies or issues in the political arena or to make financial donations to certain non-government organisations. More effective communication strategies with necessary information on these issues, from impartial authorities such as schools, universities and governments need to be implemented to increase the public’s awareness of these issues.
Deakin University, Centre for Physical Activity and Nutrition Research (C-PAN) Deakin University CRICOS Provider Code 00113B
22
References Alaejos, M, Gonzalez, V & Afonso, A 2008, ‘Exposure to heterocyclic aromatic amines from the consumption of cooked red meat and its effect on human cancer risk: a review’, Food Additives and Contaminants, vol. 25, no. 1, pp. 2-24. Byrd-Bredbenner, C, Wheatley, V, Schaffner, D, Bruhn, C, Blalock, L & Maurer, J 2007, ‘Development and implementation of a food safety knowledge instrument’, Journal of Food Science Education, vol. 6, no. 3, pp. 46-55. Charlton, K, Yeatman, H & Houweling, F 2010, 'Poor iodine status and knowledge related to iodine on the eve of mandatory iodine fortification in Australia’, Australian Pacific Journal of Clinical Nutrition, vol. 19, no 2, pp. 250-5. Department of Health and Ageing 2010, ‘Breastfeeding’, retrieved 31 January 2012, <http://www.health.gov.au/internet/main/publishing.nsf/content/health-pubhlth-strateg-brfeed-index.htm>. Department of Health and Ageing 2011, Labelling logic: review of food labelling law and policy (2011), Commonwealth of Australia, Canberra. DoHA – see Department of Health and Ageing Elwood, P, Givens, D, Beswick, A, Fehily, A, Pickering, J & Gallacher, J 2008, ‘The survival advantage of milk and dairy consumption: an overview of evidence from cohort studies of vascular diseases, diabetes and cancer’, Journal of the American College of Nutrition, vol. 27, no. 6, pp. 723S-34S. Food Standards Australia New Zealand 2010, ‘Addition of vitamins and minerals to food’, retrieved 31 January 2012, <http://www.foodstandards.gov.au/consumerinformation/fortification/>. Food Standards Australia New Zealand 2012, ‘About FSANZ’, retrieved 13 February 2012, <http://www.foodstandards.gov.au/scienceandeducation/aboutfsanz/>. German, J, Gibson, R, Krauss, R, Nestel, P, Lamarche, B, Van Staveren, W, Steijns, J, De Groot, L, Lock, A & Destaillats, F 2009, ‘A reappraisal of the impact of dairy foods and milk fat on cardiovascular disease risk’, European Journal of Nutrition, Vol. 48, no. 4, pp. 191-203. National Health and Medical Research Council 2011, Australian dietary guidelines incorporating the Australian guide to healthy eating (DRAFT), retrieved 8 February 2012, <https://www.eatforhealth.gov.au/sites/default/files/files/public_consultation/n55_draft_australian_dietary_guidelines_consconsulta_111212.pdf>. National Health and Medical Research Council 2003, Dietary guidelines for Australian adults, Commonwealth of Australia, Canberra. NHMRC – see National Health and Medical Research Council NSW Food Authority 2011, ‘Nutrition Labelling’, retrieved 13 February 2012, <http://www.foodauthority.nsw.gov.au/consumers/food-labels/label-facts/nutrition-labelling/nutrition-labelling/>. Parliament of Australia 2008, ‘Parliamentary library: greenhouse gases’, retrieved 8 February 2012, <http://www.aph.gov.au/library/pubs/climatechange/theBasic/greenhouse.htm>.
Deakin University, Centre for Physical Activity and Nutrition Research (C-PAN) Deakin University CRICOS Provider Code 00113B
23

Pasricha, S, Flecknoe-Brown, S, Allen, K, Gibson, P, McMahon, L, Olynyk, J, Roger, S, Savoia, H, Tampi, R, Thomson, A, Wood, E & Robinson, K 2010, ‘Diagnosis and management of iron deficiency anaemia: a clinical update’, Medical Journal of Australia, vol. 193, pp. 525-32. Ralston, R, Lee, J, Truby, H, Palermo, C & Walker, K 2012, ‘A systematic review and meta-analysis of elevated blood pressure and consumption of dairy foods’, Journal of Human Hypertension, vol. 26, pp. 3-13. United States Department of Agriculture n.d., ‘ChooseMyPlate.gov’, retrieved 8 February 2012, <http://www.choosemyplate.gov/index.html>. World Health Organisation 2012, ‘Breastfeeding’, retrieved 31 January 2012, <http://www.who.int/topics/breastfeeding/en/>. Zheng, W & Lee, S 2009, ‘Well-done meat intake, heterocyclic amine exposure, and cancer risk’, Nutrition and Cancer, vol. 61, no. 4, pp. 437-46.
Deakin University, Centre for Physical Activity and Nutrition Research (C-PAN) Deakin University CRICOS Provider Code 00113B
24