food for the well-being of society and the people’s...
TRANSCRIPT

1
Company Presentation
June 2018
Food for the well-being of Society and the
people’s happiness.

2
1. Corporate Profile
2. Results
3. Corporate Governance and Capital Market

3
Corporate Profile

4
Over 65 years operating in the food sector in Brazil
National Leader in the cookies and pasta markets
Growth strategy and consistent results
Strong acquisition track record

5

6
MISSION
We offer high-quality, innovative, healthy, tasty and
competitively priced food products for people’s
nourishment and enjoyment
VISION
We contribute to society's development through
successful and sustainable partnerships, a global
presence and diversified business, and are
recognized for our respect for people and the
environment, ethics, creativity, willingness to serve,
simplicity and passion for everything we do

7
55% Production
34% Sales and logistics
11% Administrative
33% women on
the Board of Directors
7
A team with 16.7 Thousand employees focused on sustainable results
(*) Figures without Piraquê
*

88
Competitive Advantages
Recognized
BrandsStrategically
Located
Plants
Vertically
Integrated
Integrated
Distribution
Network National
Sustainability
Financial solidity
and strong cash
flow generation
Qualified
employees

9
A broad and diversified portfolio
Cookies & Crackers¹ 53%
% of Sales 2017 *
Pasta 21%
Wheat Flour & Bran 17%
Margarine & Vegetable
Shortening6%
3%Others ²
¹ Contain Cookies, Crakers and Chocolate covered cookies.
² Cakes, snacks, cake mix and packaged toast
* Figures without Piraquê

19 brands with regional or national approach
10Brand with National approach

ADRIA was elected in 2016 as one of the
"50 most valuable brands in Brazil", according to the
ranking published by IstoÉ Dinheiro and prepared by
Kantar
11
...and our brands are awarded and recognized on a regionl and national basis
VITARELLA was elected in 2017 as one of the
“60 most valuable brands in Brazil",
according to the ranking published by IstoÉ Dinheiro and
prepared by Kantar
ISABELA, a brand of pasta, biscuits and toast, was voted
the preferred and most remembered brand in the state of
Rio Grande do Sul in 2017.

31.9%
16.5% 16.4%
7.4% 6.8% 5.6% 5.0% 4.3% 2.5% 1.9% 1.7%
VITARELLA FORTALEZARICHESTER ISABELA ESTRELA ADRIA PILAR ZABET NIKITO OTHERS PELAGGIO
24.2%
15.6%
10.6% 10.3%7.9% 7.9% 7.7%
66.3% 5.3% 4.1%
VITARELLA ADRIA ESTRELA FORTALEZA ISABELA IMPERADOR BASILAR RICHESTER OTHERS PILAR
Sales per product line and brand
Pasta *% of Revenue by brands
Cookies & Crackers * % of Revenue by brands
Cookies
and
Crackers*
53.0% of
total sales
Pasta*
21.4%
of total
sales
12(*) Figures without Piraquê

54.7%
36.0%
5.2% 2.9% 0.6% 0.6%PURO SABOR MEDALHA DE
OURO
ADORITA VITARELLA AMORELA OTHERS
Margarine & Vegetable Shortening *% of Revenue by brands Margarine
& Vegetable
Shortening*
6.0% of
total sales
47.5%
34.1%
4.1% 3.7% 3.3% 2.4% 1.8% 1.6% 1.6%
MEDALHADE OURO
FINNA PADEIRO ADORITA MONARCA ARATU OTHERS IMPERIAL PUROSABOR
Wheat Flour & Bran *% of Revenue by brands
Wheat
Flour &
Bran*
17.0% of
total sales
13
Sales per product line and brand
(*) Figures without Piraquê

Note: The values are Percentage of Total Revenue
In 2017 0.5% (0.4% in 2016) of Net Revenue corresponded to exports.
Our sales are distributed in all regions in Brazil
North
Midwest
Southeast
2017 – 3.9%2016 – 4.1%
2017 – 3.0%2016 – 2.8%
2017 – 16.4%2016 – 15.3%
2017 – 69.8%2016 – 71.3%
South
2017 – 6.4%2016 – 6.1%
14
Northeast
(*) Figures without Piraquê
*

National Market Leadership*
Market Share Volume
Cookies & Crackers²
¹ Until 2016, AC Nielsen market share data considered retailers only and, as of 2017, they have also included cash & carry outlets.
Cash & Carry: a sales channel that offers a hybrid business model, aimed at both the retailer (merchants, grocers) and individual consumers
² Period: jan-dez/17
Market Share Volume
Pastas²
¹Leadership in Cookies & Crackers in 2017 ¹Leadership in Pasta in 2017
15
35.0%
8.1% 7.1%
6.6%
5.7%
5.0%32.5% 32.4%
12.5%
30.2%
9.6%
6.9%
5.0%
3.4%
28.0% 28.1% 27.9% 28.6%32.5%
2013 2014 2015 2016 2017
28.0% 28.9% 28.4% 28.8%32.4%
2013 2014 2015 2016 2017
(*) Figures without Piraquê

16
Assertive creation of new products, packaging and categories in line with consumer needs, market trends and scenarios
Healthy withflavor
Convenience
Indulgence andexperience
Nutrition
Affordable

17
Marketing investments to drive sales and to create strong brands
Richester Animados Zoo Vitarella Treloso
SalsitosFINNA

18
Marketing investments to drive sales and to create strong brands

19
We are also investing on new packages
Previous Packages New Packages

20
Previous Packages New Packages
We are also investing on new packages

21
Our products are sold through a diversified cliente mix
% Revenue* per Client Mix
24.8% 25.4%
28.2% 28.7%
20.5% 19.8%
17.9% 16.2%
6.9% 7.9%
1.0% 1.4%
0.7% 0.6%
2017 2016
Small Retail
Wholesale
Key Accounts/
Regional Chains
Cash & Carry
OtherIndustry
(*) Figures without Piraquê

Exported to 25 Countries in 2017
América do
Sul
América
Central
América do
Norte
África
Ásia
América do
Sul
América
Central
América do
Norte
África
Ásia
Europa
20172016
5 países
2016
5 países
20174 países
20166 países
2017
1 país
20162 país
2017
1 países
2016 1 país
2017
7 países
2016
8 países
20171 país
2016
1 país
2017
Europa
Oriente
Médio**Iêmen, Palestina, Kuwait, Emirados Árabes,
Omã, Jordânia, Qatar, Iraque, Síria, Líbano,
Israel
0 países
20162 países
2017
22(*) Figures without Piraquê
* *
*

Fábrica Fortaleza
State of Ceará
Grande Moinho
Aratu
State of Bahia
Gorduras e Margarinas
Especiais
State ofCeará
15 Industrial Plants and 38 Distribution Centers
23

24
The vertically integrated production increases our competitiveness
83% of the vegetal shortening we
consume is produced internally
92% of the wheat flour we
consume is produced internally
VERTICAL INTEGRATION OF WHEAT FLOUR * VERTICAL INTEGRATION OF VEGETABLE OIL *
(*) Figures without Piraquê

25
Sustainability
Nutrition and Health
Packaging
Waste
Water - Effluents | Energy - Emissions
Social Investments and Communities
Transparency and Dialogue
Inputs
Topics of Work Groups
“Expand business and generate value with responsibility to current and future generations”

26
Aquisition in 2003
Regions: South and
Southeast
Aquisition in 2008
Region: Northeast
Aquisition in 2011
Region: Northeast
Aquisition in 2011 Aquisition in 2012
Region: South
Strong Acquisitions Track Record
Aquisition in 2018
Region: SoutheastRegion: Northeast

27
The closing of the Piraquê acquisition was in May 2018
* The information presented is the Market Share in Volume and Value Sales of the Piraquê brand (year 2017)
Powder Juice
Cookies and
Crackers*
Volume and Value Brazil Share: 3.8% and 6.2%
Volume and Value Northeast Share: 0.3% and 0.6%
Volume and Value Southeast Share : 8.1% and 12.0%
Pasta
Volume and Value Brazil Share: 3.4% and 4.2%
Volume and Value Northeast Share: 0.4% and 0.6%
Volume and Value Southeast Share: 7.1% and 8.2%

28
Strategy
Expanding Market Share
leadership.
Organic Growth
New acquisitions.
Operations in new food
segments.
Vertical integration
expansion.
Maintain the current
dividend policy.
Continuous search for more
operational efficiency and
costs control.

29
Results
29

30
Net Revenue* (R$ million)
CAGR 2009-2017: 11.0%
2,347 2,4442,911
3,545
4,3114,579 4,622
5,328 5,415
2009 2010 2011 2012 2013 2014 2015 2016 2017
(*) Figures without Piraquê

251.9 241.1273.4
309.9357.7 359.8
340.2 358.1 356.8
2009 2010 2011 2012 2013 2014 2015 2016 2017
37.5 38.5 40.653.9 57.9 61.9 65.9 70.0
83.6
2009 2010 2011 2012 2013 2014 2015 2016 2017
359.1 380.0418.3
489.3527.4 525.4 503.8 521.8 528.8
2009 2010 2011 2012 2013 2014 2015 2016 2017
516.7597.1 623.8
664.8737.5 764.0 769.3
827.7 850.7
2009 2010 2011 2012 2013 2014 2015 2016 2017
31
Sales Volume * by Product Line
CAGR 2009-2017: 5.0%
CAGR 2009-2017: 6.4%
CAGR 2009-2017: 4.4%
CAGR 2009-2017: 10.5%
Cookies and Crackers – Sales (‘000 tonnes) Pasta – Sales (‘000 tonnes)
Wheat Flour and Bran – Sales (‘000 tonnes) Margarine and Vegetable Shortening – Sales (‘000 tonnes)
(*) Figures without Piraquê

2.42 2.392.77 2.97
3.38 3.33 3.343.72 3.91
2009 2010 2011 2012 2013 2014 2015 2016 2017
0.84 0.81 0.93 0.94 1.06 1.13 1.15 1.21 1.08
2009 2010 2011 2012 2013 2014 2015 2016 2017
2.27 2.15 2.282.52
2.77 2.94 3.073.36 3.25
2009 2010 2011 2012 2013 2014 2015 2016 2017
3.48 3.543.79 3.97
4.384.57 4.75
5.26 5.43
2009 2010 2011 2012 2013 2014 2015 2016 2017
32
CAGR 2009-2017: 5.7%
CAGR 2009-2017: 3.2%
CAGR 2009-2017: 4.6%
CAGR 2009-2017: 6.2%
Net Average* Price by Product Line
Cookies and Crackers – Sales (R$/Kg) Pasta – Sales (R$/Kg)
Wheat Flour and Bran – Sales (R$/Kg) Margarine and Vegetable Shortening – Sales R$/Kg)
(*) Figures without Piraquê

33
CAGR 2009-2017: 10.7%
Gross Profit* (R$ million) and Gross Margin* (%)
995 1,020 1,098
1,4221,629
1,724 1,665
2,0852,249
42.4% 41.7%37.7% 40.1% 37.8% 37.7% 35.8% 39.1% 41.5%
2009 2010 2011 2012 2013 2014 2015 2016 2017
(*) Figures without Piraquê

34
EBITDA* (R$ million) and and EBITDA Margin* (%)
CAGR 2009-2017: 9.5%
469.2 466.3 481.2
621.6673.8
770.4686.6
919.4966.4
20.0% 19.1%16.5% 17.5%
15.6%16.8%
14.9%17.3% 17.8%
2009 2010 2011 2012 2013 2014 2015 2016 2017
(*) Figures without Piraquê

35
CAGR 2009-2017: 11.6%
Net Profit* (R$ million) and Net Margin* (%)
351.5 351.7 366.5
470.5524.4
599.3 603.9
784.4844.3
15.0% 14.4% 12.6% 13.3% 12.2% 13.1% 13.1% 14.7% 15.6%
2009 2010 2011 2012 2013 2014 2015 2016 2017
(*) Figures without Piraquê

36
CAGR 2009-2017: 12.4%
Capex* (R$ million) and Capex*/Net Revenue (%)
120.5 135.3 142.5117.2
287.9
407.9
456.9
263.9307.1
5.1% 5.5% 4.9% 3.3%6.7% 8.9% 9.9%
5.0% 5.7%
2009 2010 2011 2012 2013 2014 2015 2016 2017
* Excluding acquisitions
(*) Figures without Piraquê

37
CAGR 2009-2017: 12.7%
Operational Cash Generated * (R$ million) and Operational Cash/Net Revenue* (%)
334.6 343.3431.5
334.7
572.6646.1
490.5
964.2870.8
14.3% 14.0% 14.8%
9.4%13.3% 14.1%
10.6%
18.1%16.1%
2009 2010 2011 2012 2013 2014 2015 2016 2017
(*) Figures without Piraquê

38
Net Cash (R$ million)*
and Net Cash/EBITDA (unit) *
-378.8-211.2
-468.4 -427.1-261.7
-176.0
-396.2
212.8
596.6
-0.8-0.5
-1.0-0.7
-0.4-0.2
-0.6
0.20.6
-900, 0
-800, 0
-700, 0
-600, 0
-500, 0
-400, 0
-300, 0
-200, 0
-100, 0
0,0
100,0
200,0
300,0
400,0
500,0
600,0
2009 2010 2011 2012 2013 2014 2015 2016 2017
(*) Figures without Piraquê

39
Corporate Governance and Capital Market
Listed in the “Novo
Mercado”
Free Float composed by:
25.8% local investors
74.2% foreign investors
03 independent members on
the Board of Directors.
Audit Committee composed
by 3 independent members
Ordinary stocks
( 339 millions)
Shareholder Position as of 12/29/2017.
National Long-Term Rating
'AAA (bra)'
63%12%
25%Controller
Administrators
Free Float

40
MDIA 3 vs IBOVESPASince the IPO (R$ billion, year end)
Average Daly
Volume : MDIA3
(R$ Millions)Profitability%
-100%
0%
100%
200%
300%
400%
500%
600%
700%
800%
0
5
10
15
20
25
30
35
40
oct
/06
jan
/07
ap
r/0
7
jul/
07
oct
/07
jan
/08
ap
r/0
8
ago
/08
oct
/08
jan
/09
ap
r/0
9
set/
09
oct
/09
jan
/10
ap
r/1
0
ou
t/10
oct
/10
jan
/11
ap
r/1
1
no
v/1
1
oct
/11
jan
/12
ap
r/1
2
dez
/12
oct
/12
jan
/13
ap
r/1
3
jul/
13
oct
/13
jan
/14
ap
r/1
4
jul/
14
oct
/14
jan
/15
ap
r/1
5
jul/
15
oct
/15
jan
/16
ap
r/1
6
jul/
16
oct
/16
jan
/17
ap
r/1
7
jul/
17
oct
/17
Volume (em milhões) MDIA3 IBOV
MDIA3 x IBOV
17/10/2006 a 29/12/2017

41
Sustainability Results

Tel.: (85) 4005-5952 or 5874
E-mail: [email protected]
Geraldo Luciano Mattos Júnior - Vice-President of Investments and Controllership
Fabio Cefaly - New Business and Investor Relations Director
Fernanda Carvalho - New Business and Investor Relations Manager
Julianny Maia – New Business and Investor Relations Analyst
Renata Lessa– New Business and Investor Relations Analyst
Vitor Veiga – Trainee
42
Market Marker Independent
Auditors
B3 Ticker
MDIA3
Custodian
IR Team

Thank you
43

44
Food for the well-being of Society and
the people’s happiness
Results Presentation
1Q18

45
Volume growth in all product lines and decrease
of average price
Net Revenue
+ 0.9% vs. 1Q17
Volume
+ 4.5% vs. 1Q17
Average Price
-3,3% vs. 1Q17=
1,206 1,21727 10 9 4 7 12 26 29 3 0
Net revenue1Q17
Cookies andCrackers
Pasta Wheat Flourand Bran
Margarineand
VegetablesShortening
OthersProducts
Cookies andCrackers
Pasta Wheat Flourand Bran
Margarineand
VegetablesShortening
OthersProducts
Net revenue1Q18
Variation of Net Revenue - 1Q18 VS 1Q17 (R$ Millions and %)
Volume Effect Price Effect
4.5% 3.7% 4.3% 6.0% 25.0% 2.0% -9.9% -12.4%-3.5% -0.5%
(*) Figures without Piraquê
* * *
*

2.8%
0.3%1.0%
1.3%
2.9%
1.0%
Cookies and
Crackers
Pasta Wheat Flour
and Bran
Margarine
and
Vegetable
Shortening
Others
Products
Total
Average Price Variation 1Q18 vs 4Q17
Average prices decreased in 1Q18 vs 1Q17 and
increased compared to 4Q17
46
5.40 5.45 5.49 5.36 5.51
3.44 3.37 3.16 3.09 3.10
1.21 1.08 1.00 1.05 1.06
4.01 3.92 3.89 3.82 3.87
3.00 3.00 2.93 2.87 2.90
1Q17 2Q17 3Q17 4Q17 1Q18
Net Average Price R$/KG
Total M Dias
Cookies and
Crackers
Margarine and
Vegetable Shortening
Pasta
Wheat
Flour and Bran
2.0%
-9.9%-12.4%
-3.5%
-0.5%
-3.3%
Cookies and
Crackers
Pasta Wheat Flour
and Bran
Margarine
and
Vegetable
Shortening
Others
Products
Total
Average Price Variation 1Q18 vs 1Q17
*
* *
(*) Figures without Piraquê

47
Volume Growth leveraged by incentives to the sales
promoters and marketing investments
Incentive to the sales promoters to gain new extra points of sales in our
clients;
Marketing campaigns with prize promotions to the end consumers
Promote sell in and sell out National visibility

48
Launches consistent with the strategy of growth and
introduction of items with higher added value

49
We maintained the national leadership in
pasta, cookies and crackers
Wheat Flour and Bran
Northeast Leadership with 28.6%*
* Market Share - Volume according to Ac Nielsen data ( jan-feb/18)
Cookies and Crackers
National Leadership with 32.2%*
∆ Share Volume: +0.3 p.p.
∆ Share Value: +0.2 p.p.
Pasta
National Leadership with 33.1%*
∆ Share Volume: -0.4 p.p.
∆ Share Value: -0.6 p.p.
Note: The variations presented reffers to the periods nov-dec/17 vs. jan-feb/18
*
*
*
(*) Figures without Piraquê

606657639
50
COGS negatively impacted by decrease in the volumes produced,
increase in the price of wheat and BRL devaluation
129 134 123
89 87 81
380 389 359
37 43 39
4 4 4
1T17 4T17 1T18
Volume Produced('000 tonnes)
Cookies and Crackers Pasta
Wheat Fluor and Bran Margarine and Vegetable Shortening
Others Products
22.2% 24.6% 24.3%
23.8% 23.1% 23.2%
8.4% 9.3% 10.0%6.8% 7.8% 8.3%
1Q17 4Q17 1Q18
Cost of Goods Sold(% Net Revenue)
WheatOther inputs and PackagingLaborIndirect Cost and depreciation
61.2% 65.8%64.8%
*
*

51
Growth of Vertical Integration Index of Shortening
Wheat Flour | Company Consumption (%)
Shortening | Company Consumption (%)
92.1% 92.2% 92.7% 91.3% 90.6%
7.9% 7.8% 7.3% 8.7% 9.4%
1Q17 2Q17 3Q17 4Q17 1Q18
Own Production External Source
84.4% 74.8% 77.8%94.1% 98.2%
15.6% 25.2% 22.2%5.9% 1.8%
1Q17 2Q17 3Q17 4Q17 1Q18
Own Production External Source
Vertical
Integration
Index
1Q18 = 98.2%
1Q17 = 84.4%
Vertical
Integration
Index
1Q18 = 90.6%
1Q17 = 92.1%
(*) Figures without Piraquê
*
*
*
*

52
Decrease in Operating Expenses
(% Net Revenue) versus 4Q17
* Selling Expenses contain: Salaries and benefits, freight and other expenses with marketing, sales force and
logistics.
25.6%26.7%
24.3%
27.5%25.9%
19.7% 20.7% 19.1%21.1% 20.0%
3.3% 3.1%3.0%
3.7%3.7%
2.6% 2.9%2.2%
2.7%2.2%
1Q17 2Q17 3Q17 4Q17 1Q18
Operation Expenses(% Net Revenue)
Sales Administrative and general Other
*
(*) Figures without Piraquê

53
EBITDA (R$ Million)* and EBITDA Margin* (% Net Revenue)
-21.3%
1Q18 vs. 1Q17
233.1 247.7291.3
194.3 183.5
19.3% 18.0%19.8%
14.2% 15.1%
0,0%
5,0%
10,0%
15,0%
20,0%
25,0%
30,0%
1Q17 2Q17 3Q17 4Q17 1Q18
0
50
100
150
200
250
300
EBITDA EBITDA Margin
(*) Figures without Piraquê
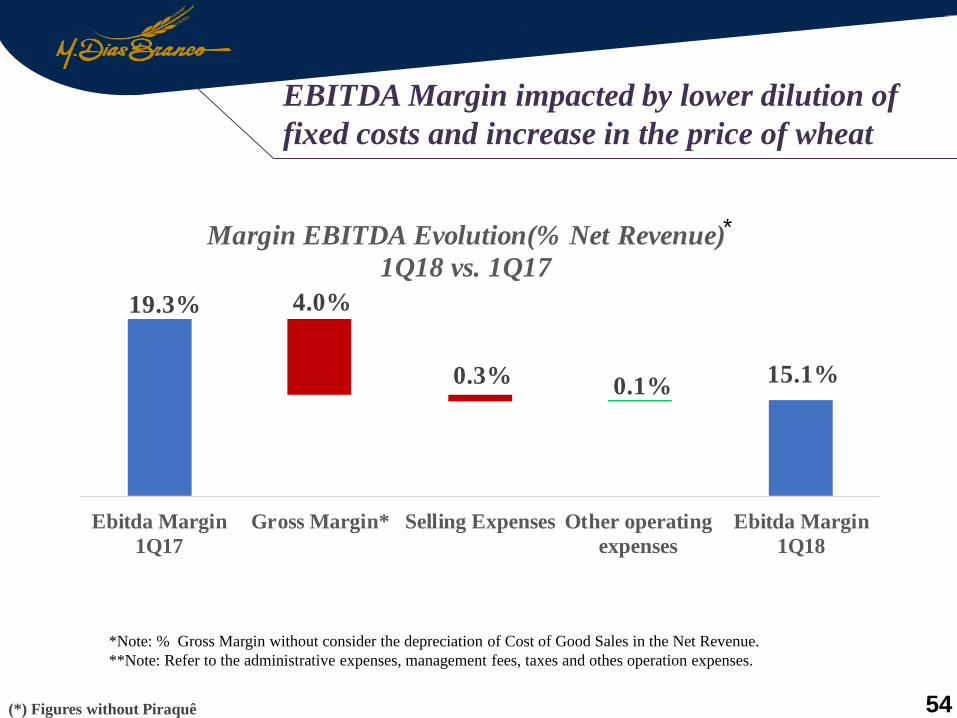
EBITDA Margin impacted by lower dilution of
fixed costs and increase in the price of wheat
54
*Note: % Gross Margin without consider the depreciation of Cost of Good Sales in the Net Revenue.
**Note: Refer to the administrative expenses, management fees, taxes and othes operation expenses.
19.3%
15.1%
4.0%
0.3% 0.1%
Ebitda Margin
1Q17
Gross Margin* Selling Expenses Other operating
expenses
Ebitda Margin
1Q18
Margin EBITDA Evolution(% Net Revenue)
1Q18 vs. 1Q17
(*) Figures without Piraquê
*

EBITDA Margin growth compared to 4Q17
55
*Note: % Gross Margin without consider the depreciation of Cost of Good Sales in the Net Revenue.
**Note: Refer to the administrative expenses, management fees, taxes and other operating expenses.
14.2%15.1%
0.9% 1.1%0.7%
Ebitda Margin
4Q17
Gross Margin* Selling Expenses Other operating
expenses
Ebitda Margin
1Q18
Margin EBITDA Evolution(% Net Revenue)
1Q18 vs. 4Q17
*
(*) Figures without Piraquê

56
Net Profit(R$ Million)* e Net Margin(% Net Revenue)*
-26.2%
1Q18 vs. 1Q17
189.4 199.4253.6
201.9
139.715.7% 14.5% 17.3% 14.8% 11.5%
1Q17 2Q17 3Q17 4Q17 1Q18
0
50
100
150
200
250
300
0%
10%
20%
30%
40%
50%
60%
Net Profit Net Margin
(*) Figures without Piraquê

57
We invested R$ 67.1 millions in infrastructure
Expansion of storage capacity of the
distribution center in the Maracanaú unit (CE)
Modernization of silos of the Wheat Mill in Cabedelo (PB)
Construction in progress of the Wheat Mill in
Bento Gonçalves (RS)
Capex (R$ Million e % Net Revenue) – without acquisition
-7,1%
1Q18 vs. 1Q17
72.2 81.6 78.6 74.7 67.1
6.0% 5.9% 5.3% 5.5% 5.5%
1Q17 2Q17 3Q17 4Q17 1Q18
0
50
100
150
200
250
0%
5%
10%
15%
20%
25%
30%
35%
40%
45%
50%
Capex Capex/Net Revenue
(*) Figures without Piraquê
*
*

58
Evolution of HR management and social-
environmental pratices
Launch of Oracle Human Capital Management
(HCM) software
Inventory of Greenhouse Gas Emissions
for 12 industrial units
Labor’s accident rate decreased by 21.1%
compared to 1Q17
The relative water consumption decreased
by 4.3% compared to 1Q17
*
*
*
*
(*) Figures without Piraquê

59
24.3% of Net
Revenue in 1Q18
Strong cash generation in 1Q18*
925.9
1,178.0 295.9 70.3
26.5
Cash and cash equivalent onDec-17
Net Cash from operatingactivities
Payment of property andsoftware licenses
Financing activities Cash and cash equivalent onMar-18
1Q17 = R$ 203.3 million
4Q17 = R$ 9.0 million
(*) Figures without Piraquê

60
We ended 1Q18 with net cash position (cash
greater than debt) of R$ 824.8 million*
347.2407.5
661.9596.6
824.8
0.4 0.4
0.70.6
0.9
1Q17 2Q17 3Q17 4Q17 1Q18
(*) Figures without Piraquê

61
Capital Market
0%
10%
20%
30%
40%
50%
60%
0
5
10
15
20
25
30
35
40
jan-17 feb-17 mar-17 apr-17 may-17 jun-17 jul-17 aug-17 sep-17 out-17 nov-17 dez-17 jan-18 feb-18 mar-18 apr-18 may-18
MDIA x IBOV x IGC
01/02/2017 a 05/10/2018
Volume (Millions) MDIA3 IBOV IGC
Average Daly
Volume : MDIA3
(R$ Millions)
Profitability%