food expenditure patterns in the mediterranean countries
TRANSCRIPT
T he main purpose of this article is to examine what has happened during the last three decades with food
product expenditure patterns in the four Mediterranean EC countries, that is, France, Italy, Spain and Greece. In order to do so we have used annual time series data. The sample periods differ between countries owing to differences in the availability of data. In the case of France and Greece we have data from 1963 to 1989, whereas for Italy we only have data from 1970 up to 1989. Finally, in the case of Spain the time series go from 1964 to 1988. All the data, expressed in billions, have been obtained from several issues of National Accounts, vo!. 11, Detailed Tables, issues which are published by the OECD. Total expenditure in food products has been broken down into four categories: Group 1: Food. Group 2: Non-alcoholic beverages. Group 3: Alcoholic beverages. Group 4: Tobacco. The fact that the real expenditure time series are expressed in different base years requires that we homogenize data so that all time series are expressed relative to the same base year, that is, 1985. We are going to carry out a complete analysis of food-product expenditures using three indicators . First we analyze time evolution of five budget shares, that is, food products expenditure relative to total expenditure (one for each of the specific groups) and group expenditure relative to total food expenditure. Second we carry out an inflation analysis calculating the annual average rates for each magnitude for the total sample period and for several subperiods. We choose the limit years according the most representative years from an economic point of view of the last three decades, that is, both oil crises, 1973 and 1979. Finally, we carry out an analysis of the rates of growth obtaining the annual average per capita real rates of growth for all magnitudes and for the same periods that we take into account in the inflation analysis .
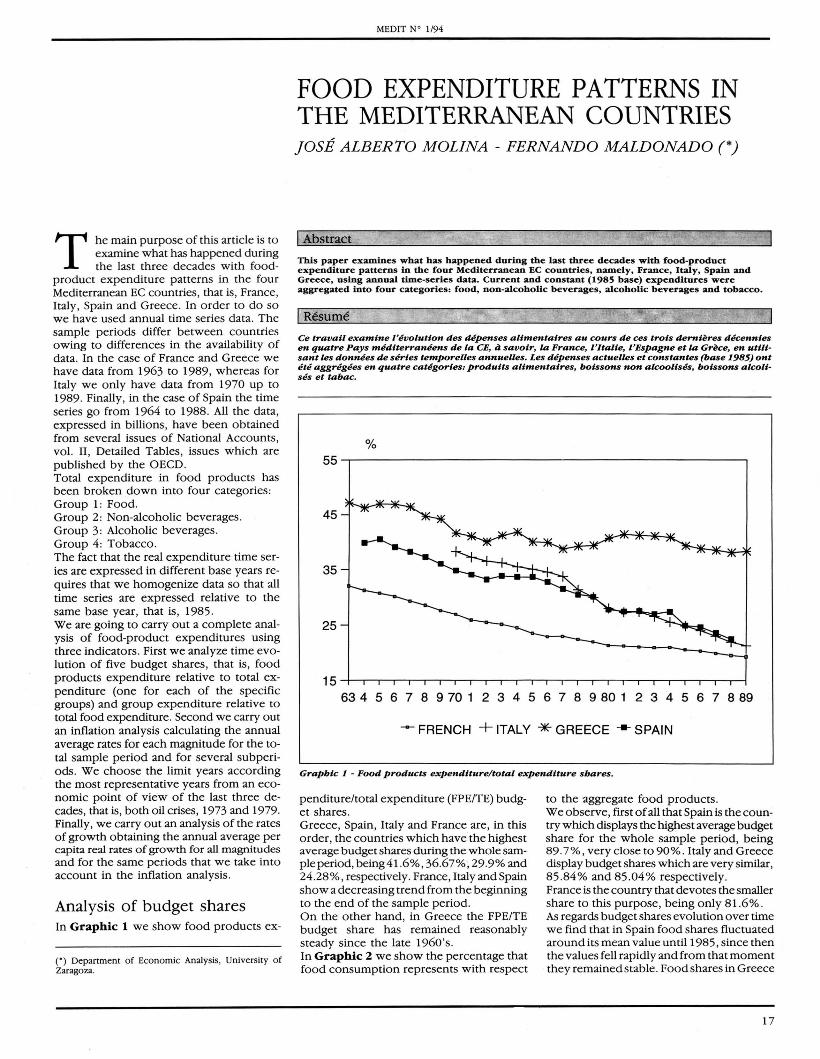
Analysis of budget shares In Graphic 1 we show food products ex-
(') Department of Economic Analysis, University of Zaragoza.
MEDIT N" 1/94
FOOD EXPENDITURE PATTERNS IN THE MEDITERRANEAN COUNTRIES JOSE ALBERTO MOLINA - FERNANDO MALDONADO (*)
I Abstract
This paper examines what has happened during the last three decades with food-product expenditure patterns in the four Mediterranean EC countries, namely, France, Italy, Spain and Greece, using annual time-series data. Current and constant (1985 base) expenditures were aggregated into four categories: food, non-alcoholic beverages, alcoholic beverages and tobacco.
I R~sume Ce travail examine revolution des depenses altmentalres au cours de ces trois dernl~res decennles en quatre Pays medlterraneens de la CE, a savolr, la France, l'ltalie, l'Espagne et la Gr~ce, en utllisant les donnees de series temporelles annuelles. Les depenses actuelles et constantes (base 1985) ont ete aggregees en quatre categories: prodults alimentalres, bolssons non alcoolises, botssons alcolises et tabac.
55~--------------------------------------------~
45
35
25
63 4 5 6 7 8 9 70 1 2 3 4 5 6 7 8 9 80 1 2 3 4 5 6 7 8 89
-- FRENCH + ITALY "* GREECE .... SPAIN
Graphic 1 - Food products expenditure/total expenditure shares.
penditure/total expenditure (FPE/TE) budget shares . Greece, Spain, Italy and France are, in this order, the countries which have the highest average budget shares during the whole sampie period, being41 .6% , 36.67%, 29.9% and 24.28% , respectively. France, Italy and Spain show a decreaSing trend from the beginning to the end of the sample period. On the other hand, in Greece the FPE/TE budget share has remained reasonably steady since the late 1960's. In Graphic 2 we show the percentage that food consumption represents with respect
to the aggregate food products . We observe, first of all that Spain is the country which displays the highest average budget share for the whole sample period, being 89. 7%, very close to 90% . Italy and Greece display budget shares which are very similar, 85 .84% and 85 .04% respectively. France is the country that devotes the smaller share to this purpose, being only 81.6%. As regards budget shares evolution over time we find that in Spain food shares fluctuated around its mean value until 1985, since then the values fell rapidly and from that moment they remained stable. Food shares in Greece
17

also fluctuated unti11981, and from this year on the values declined gradually. Italy displays an increasing trend from the beginninig of its sample period up to the late 1970's, since then budget shares remain almost constant. Shares in France remained stable since the early 1960's. Graphic 3 shows alcoholic beverage expenditure budget shares . France is the country with the highest average percentage, being 2.05% . Greece, Spain and Italy, in this order, are the countries which display the second, third, and fourth highest values that are 1.66%,1.42 % and 1.11 %, respectively. Shares in France increased progressively up to the end of the sample period. Greece displays the smallest values until the early 1970's, then there is a substantial increase up to the end of the 1980's. In this decade Greece shows, with France, the highest percentages. The values in Spain remained approximately constant until the early 1980's, in the late sample years there was a rise in these shares. Finally in Italy there was a steady growth in the alcoholic beverages· shares during the two last decades . Graphic 4 displays budget shares corresponding to the group alcoholic beverages. The most important feature is that the budget shares corresponding to France are clearly above those of the other three countries during the whole sample period. The French average percentage, 11.01 %, is almost twice as high as that of Spain, 4.5 %. As regards time evolution the values of France and Spain remained relatively stable, even the Spanish shares increased since the mid 80's. Shares also remained approximately constant in Greece until the mid-80's, since then an increasing trend can be observed. Finally, in Italy we observe a decline in the alcoholic beverages shares during the 1970's, then there was an increase until the end of the sample period. In Graphic S we represent tobacco's budget shares. We find that Greece, Italy, France and Spain, in this order, show the highest average values being 7.25%,6.65% , 5.32% and 4.37%, respectively. Greece shows an increasing trend in the 1960's, during the first half of the 1970's tobacco shares decline and then the values fluctuate over the second half of the 1970's, finally in the 1980's there is a clear tendency for this share to increase. In Italy, shares declined during the 1970 's, and increased until the early 1980's, from then values remained steady until the end of the whole sample period. In France, the figures remained virtually constant over the three decades with a steady rise from the late 1970's and during the 1980's. In Spain shares fluctuated over the 1960's and first mid 70's, then we observe a
18
MEDIT W 1/94
% 95~-------------------------------------------'
90
85
80
63 4 5 6 7 8 9 70 1 2 3 4 5 6 7 8 9 80 1 2 3 4 5 6 7 8 89
--- FRENCH + ITALY '* GREECE ...... SPAIN
Grapbic 2 - Food sbares.
% 4-.-----------------------------------------------.
3
2
~456789ro123456789~1 2345678~
....... FRENCH + ITALY '* GREECE ...... SPAIN
Grapbic 3 - Non-alcobolic beverages sbares.
progressive growth up to mid 80's, in the last sample years the values remained reasonably stable.
Analysis of the rates of inflation
Tables 1 (p. 20) show the rates of inflation for each of the sample countries . In Table 1.1
we observe that total consumption and alcoholic beverages display the highest average rates during the whole sample period, 7.07% and 6 .88%, respectively, and nonalcoholic beverages and tobacco the smallest ones, 5.48% and 5.67%. We also detect an increasing trend in the average rates of inflation in all magnitudes up to the sample subperiod 1979-1985, that is, immediately after the second oil crisis, then the

MEDIT W 1/94
% 14~-------------------------------------------'
12~---
10
8
6
4
63 4 5 6;' 7 8 9 70 1 2 3 4 5 6 7 8 9 80 1 2 3 4 5 6 7 8 89
--+- FRENCH + ITALY "* GREECE --- SPAIN
Grapbic 4 - Alcobolic beverages sbares.
% 10~--------------------------------------------~
8
6
4
63 4 5 6 7 8 9 70 1 2 3 4 5 6 7 8 9 80 1 2 3 4 5 6 7 8 89
---- FRENCH + ITALY "* GREECE --- SPAIt-.
Grapbic 5 - Tobacco sbares.
rates sh owed a clear decrease with valu es being relat vely small , even negative in the case of non-alcoholic beverages. This group displays the highest average rate of inflation in the sample subperiod 1979-1985 , 10.96%. We find the smallest values in the first and in the late years for all magnitudes. Table 1.2 shows rates of inflation in Italy. Like in France, total consumption displays the highest average rate for the whole sam-
pie period, 13 ,31 %, and alcoholic beverages and tobacco show the smallest ones , 9.9% ami 10.63% , respectively. The values for the rest of the magnitudes are very close . In Italy, we find the highest average rates for total and food consumption and non-alcoholic beverages immediately after the first oil crisis, that is , in the 1974-1978 sample subperiod. The values are high, nearly 20% in the three magnitudes.
For alcoholic beverages and tobacco the highest rates are between 1979 and 1985. We observe the smallest ones in the last years of the total sample with values around 5% and 6% . . In Table 1.3 we find the Greek average rates of inflation. In this case, the food group displays the highest value in the whole sample period, 13.14 %, and alcoholic beverages and tobacco the smallest ones , 10.81 % and 11.11 % , respectively. The other three magnitudes have similar average rates. After the second oil crisis , that is, between 1979 and 1985 we observe the six highest values, with figures over 20% in food and non-alcoholic beverages groups . On the other hand, in the first sample years we find the smallest rates under 5 % . In Table 1.4 we observe Spanish average rates of inflation. Tobacco's average rate is the highest in the total sample period, 13 .32 % , and the food group and total food values are the smallest ones, 9 .58% and 9.73 % , respectively. As well as in other countries we find the highest rates of inflation for all magnitudes after both oil crises. On the other hand, in the first and in the last subsample periods we detect the smallest values. To sum up , Greece is the country which shows the highest average rates for the aggregate food products as well as for the specific food group, non-alcoholic beverages and tobacco. Italy is the country that shows the highest total private consumption average rate. Spain on the o ther hand is the country with
19

the highest average value for the group alcoholic beverages. The group with the highest average rate throughout the sample is food in Greece with a rate of inflation of 13 .14 %. The group with the lowest average rate of inflation is non-alcoholic beverages in France, being 5.48%. So, it is clear that Greece is the most inflationary country in the sample as regards food products, whereas France in the country with the lowest annual average rates of inflation, rates that are more or less half those of Greece. As regards time evolution of rates of inflation, the highest values in all countries and categories appear in the two sub periods inmediately after both 1973 and 1979 oil crises . In Italy and Spain all the highest rates of inflation except for those of alcoholic beverages and tobacco correspond to the 1974-1978 subperiod. The highest rates of inflation corresponding to these two groups as well as to all the groups in France and Greece appear in the subperiod 1979-1985. As regards the lowest rates of inflation they appear in the first years of the sample in Greece and Spain and in the last sample period in Italy and France.
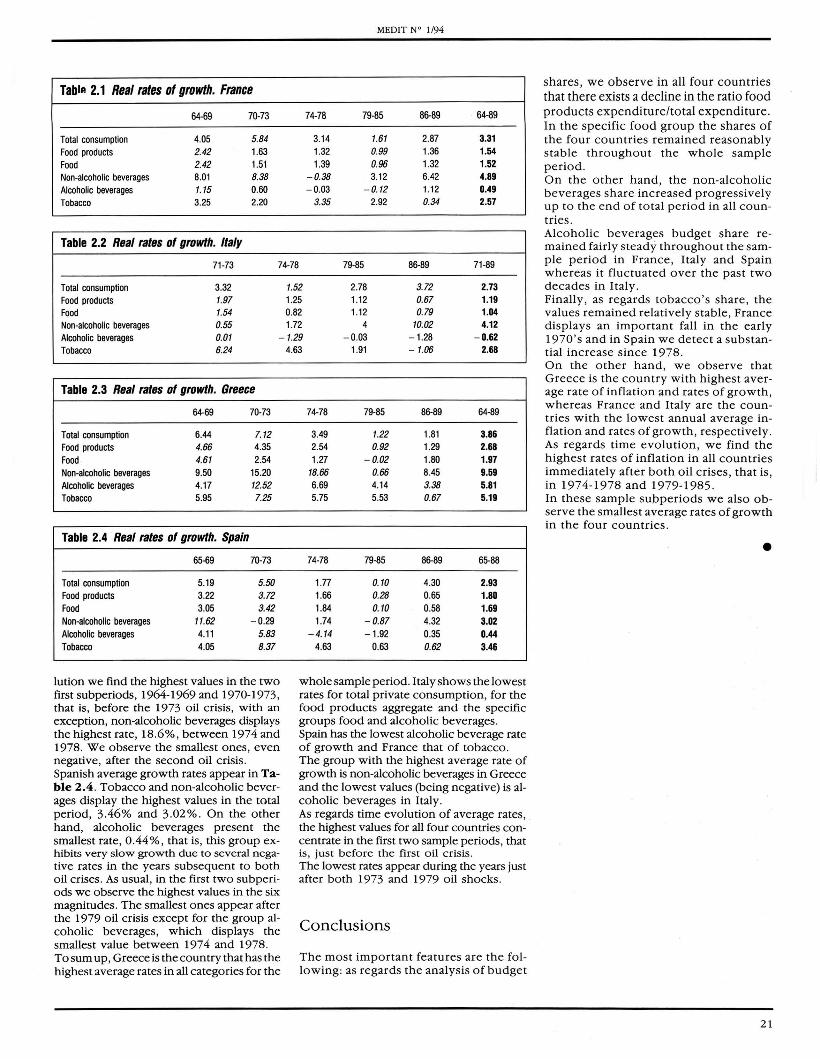
Analysis of the rates of growth
In Tables 2 we show average annual per capita real rates of growth. Average growth rates in France are depicted in Table 2.1. We observe that the non-alcoholic beverages group displays the 'highest value in the total sample period, 4.89%, and alcoholic beverages is the group which clearly presents the smallest average growth rate , 0.49%. As regards time evolution we find the highest values distributed in the first years until 1973 and the smallest ones, even negative in both beverage groups , in the
20
MEDIT W 1/94
Table 1.1 Rates of inflation. France
64-69
Total consumption 4.08 Food products 3. 14 Food 3.22 Non-alcoholic beverages 2.10 Alcoholic beverages 3.49 Tobacco 2.11
Table 1.2 Rates of inflation. Italy
71-73
Total consumption 8.09 Food products 7.59 Food 8.34 Non-alcoholic beverages 3.55 Alcoholic beverages 10.32 Tobacco 0.19
Table 1.3 Rates of inflation. Greece
64-69
Total consumption 2.64 Food products 3.24 Food 3.20 Non-alcoholic beverages 1.53 Alcoholic beverages 2. 16 Tobacco 4.29
Table 1.4 Rates of inflation. Spain
64-69
Total consumption 6.28 Food products 6.20 Food 6. 12 Non-alcoholic beverages 4.71 Alcoholic beverages 6.03 Tobacco 8.61
70-73
6.91 6.50 6.58 4.88 8.21 3.62
74-78
19.85 16.71 18.19 18.37 11 .23 9.51
70-73
6.16 7.17 9.16 4.47 4.70
0
70-73
8.59 8.77 9.03 8.98
11.49 1.29
74-78 79-85 86-89 64-89
9.62 10.25 2.97 7.07 9.03 9.56 3.23 6.47 9.36 9.52 2.71 6.53 6.94 10.96 - 0.22 5.48 9.39 9.46 2.97 6.88 4.90 10.09 6.30 5.67
79-85 86-89 64-89
15.13 5.89 13.31 13.16 5.65 11.48 12.99 4.64 11 .87 13.77 4.34 11.38 12.73 6.45 10.63
15.8 7.33 9.90
74-78 79-85 86-89 64-89
14.99 19.49 16.68 12.25 14.91 19.87 16.84 12.61 15.98 20.90 14.92 13.14 19.97 20.94 16.19 12.84 13.23 15.97 17.87 10.81 10.30 16.72 23.65 11.11
74-78 79-85 86-89 64-88
18.73 12.42 6.74 11.11 16.43 9.21 4.66 9.73 16.65 8.56 6.65 9.58 18. 16 16.51 7.11 11.97 17.41 18. 14 9.84 13.32 11.16 19.36 7.94 10.97
two subperiods immediately after both oil crises. In Table 2 .2 we find average growth rates for Italy. We observe that the highest values in the whole period correspond to the groups total consumption and tobacco, being 2.73% and 2.68 %, respectively. The smallest one is negative, - 0 .62 % and corresponds to alcoholic beverages, that is, this group displays negative growth since the first oil crisis. The highest rates appear in all groups except non-alcoholic beverages between 1971 and 1973, that is, before both crises , and the smallest in the last years of the sample that we have considered. In Table 2.3 we find the Greek average rates of growth. The group non-alcoholic beverages displays the highest value in the whole sample period, 9.59%, and food and total food expenditure the smallest ones , 1.97% and 2.68% respectively. The groups alcoholic beverages and tobacco present similar average rates. As regards time evo-
MEDIT W \ /94
Tabl!! 2.1 Real rates 01 growth. France
64-69 70-73 74-78 79-85 86-89 64-89
Total consumption 4.05 5.84 3.14 1.61 2.87 3.31 Food products 2.42 1.63 1.32 0.99 1.36 1.54 Food 2.42 1.51 1.39 0.96 1.32 1.52 Non-alcoholic beverages 8.01 8.38 - 0.38 3.12 6.42 4.89 Alcoholic beverages 1.15 0.60 -0.03 -0.12 1.12 0.49 Tobacco 3.25 2.20 3.35 2.92 0.34 2.57
Table 2.2 Real rates of growth. flaly
71-73 74-78 79-85 86-89 71-89
Total consumption 3.32 1.52 2.78 3.72 2.73 Food products 1.97 1.25 1.12 0.67 1.19 Food 1.54 0.82 1.12 0.79 1.04 Non-alcoholic beverages 0.55 1.72 4 10.02 4.12 Alcoholic beverages 0.01 -1.29 -0.03 - 1.28 - 0.62 Tobacco 6.24
Table 2.3 Real rates of growth. Greece
64-69 70-73
Total consumption 6.44 7.12 Food products 4.66 4.35 Food 4.61 2.54 Non-alcoholic beverages 9.50 15.20 Alcoholic beverages 4.17 12.52 Tobacco 5.95 7.25
Table 2.4 Real rates of growth. Spain
65-69 70-73
Total consumption 5.19 5.50 Food products 3.22 3.72 Food 3.05 3.42 Non-alcoholic beverages 11.62 -0.29 Alcoholic beverages 4.11 5.83 Tobacco 4.05 8.37
lution we find the highest values in the two first subperiods, 1964-1969 and 1970-1973, that is, before the 1973 o il crisis, with an exception, non-alcoholic beverages displays the highest rate, 18.6%, between 1974 and 1978. We observe the smallest ones, even negative, after the second oil crisis. Spanish average growth rates appear in Table 2.4. Tobacco and non-alcoholic beverages display the highest values in the total period, 3.46% and 3.02% . On the other hand, alcoholic beverages present the smallest rate, 0.44%, that is, this group exhibits very slow growth due to several negative rates in the years subsequent to both oil crises. As usual, in the first two subperiOds we observe the highest values in the six magnitudes . The smallest ones appear after the 1979 oil crisis except for the group alcoholic beverages, which displays the smallest value between 1974 and 1978. To sum up, Greece is the country that has the highest average rates in all categories for the
4.63 1.91 -1.06 2.68
74-78 79-85 86-89 64-89
3.49 1.22 1.81 3.86 2.54 0.92 1.29 2.68 1.27 -0.02 1.80 1.97
18.66 0.66 8.45 9.59 6.69 4.14 3.38 5.81 5.75 5.53 0.67 5.19
74-78 79-85 86-89 65-88
1.77 0. 10 4.30 2.93 1.66 0.28 0.65 1.80 1.84 0.10 0.58 1.69 1.74 - 0.87 4.32 3.02
-4.14 -1.92 0.35 0.44 4.63 0.63 0.62 3.46
whole sample period. Italy shows the lowest rates for total private consumption, for the food products aggregate and the specific groups food and alcoholic beverages. Spain has the lowest alcoholic beverage rate of growth and France that of tobacco. The group with the highest average rate of growth is non-alcoholic beverages in Greece and the lowest values (being negative) is alcoholic beverages in Italy. As regards time evolution of average rates, the highest values for all four countries concentrate in the first two sample periods, that is , just before the first oil crisis. The lowest rates appear during the years just after both 1973 and 1979 oil shocks.
Conclusions
The most important features are the following: as regards the analysis of budget
shares, we observe in all four countries that there exists a decline in the ratio food products expenditure/total expenditure . In the specific food group the shares of the four countries remained reasonably stable throughout the whole sample period. On the other hand, the non-alcoholic beverages share increased progressively up to the end o f total period in all countries . Alcoholic beverages budget share remained fairly steady throughout the sample period in France, Italy and Spain whereas it fluctuated over the past two decades in Italy. Finally, as regards tobacco 's sh are, the values remained relatively stable , France displays an important fall in the early 1970 's and in Spain we detect a substantial increase since 1978. On the other hand, we observe that Greece is the country with highest average rate of inflation and rates of growth, whereas France and Italy are the countries wi th the lowest annual average inflation and rates of growth, respectively. As regards time evolution, we find the highest rates of inflation in all countries immediately after both oil crises, that is, in 1974-1978 and 1979-1985. In these sample subperiods we also observe the smallest average rates of growth in the four countries.
•
21