food environments, health and nutrition in south africa
TRANSCRIPT
INSTITUTE FOR POVERTY, LAND AND AGRARIAN STUDIES (PLAAS)
Food environments, health and nutrition in South Africa Mapping the research and policy terrain
27 June 2016

Institute for Poverty, Land And Agrarian Studies Faculty of Economic and Management Sciences University of the Western Cape Private Bag X17 Bellville 7535 Tel: +27-(0)21-9593733 Fax: +27(0)21-9593732 Website: www.plaas.org.za Email: [email protected] Twitter: @PLAASuwc Facebook: www.facebook.com/PLAASuwc
DST-NRF Centre of Excellence in Food Security School of Government Building University of the Western Cape Private Bag X17 Bellville 7535 Tel: +27 (0)21–9593817 Website: www.foodsecurity.ac.za Email: [email protected] Twitter: @FoodSecurity_ZA Facebook: https://www.facebook.com/CoEinFS/
PLAAS Working Paper 34: Food environments, health and nutrition in South Africa: Mapping the research and policy terrain The PLAAS Working Paper Series is designed to share work in progress. Please send any suggestions or comments to the author. ©Institute for Poverty, Land and Agrarian Studies, University of the Western Cape, June 2016 Partner: The author receives funding from the DST-NRF Centre of Excellence in Food Security, hosted by UWC and co-hosted by the University of Pretoria Author: Nicole Claasen, Marinka van der Hoeven and Namukolo Covic [email protected] Series Editor & Design: Rebecca Pointer Layout: Rebecca Pointer
Cite as: Claasen, N., van der Hoeven, M., and Covic, N 2016. Food environments, health and nutrition in South Africa, Working Paper 34. Cape Town: PLAAS, UWC and Centre of Excellence on Food Security.
Institute for Poverty, Land And Agrarian Studies Faculty of Economic and Management Sciences University of the Western Cape Private Bag X17 Bellville 7535 Tel: +27-(0)21-9593733 Fax: +27(0)21-9593732 Website: www.plaas.org.za Email: [email protected] Twitter: @PLAASuwc Facebook: www.facebook.com/PLAASuwc
DST-NRF Centre of Excellence in Food Security School of Government Building University of the Western Cape Private Bag X17 Bellville 7535 Tel: +27 (0)21–9593817 Website: www.foodsecurity.ac.za Email: [email protected] Twitter: @FoodSecurity_ZA Facebook: https://www.facebook.com/CoEinFS/
ACKNOWLEDGEMENTS We would like to acknowledge comments and inputs from Stephen Greenberg during the progress of this paper as well as from other colleagues at PLAAS and in the Centre of Excellence in Food Security that were given during a workshop on Value Chains, Livelihoods and Consumer Food Environments at the University of Western Cape in August 2015. Thanks to Rebecca Pointer for editing and publication support.
ABSTRACT The aim of this paper was to review existing research and policies related to food environments so as to identify research gaps towards a research agenda for the new Centre of Excellence in Food Security. Food environments influence food choices and nutritional status. Significant changes have taken place in the South African consumer food environments since the mid-1990s accompanied by increased consumption of processed and fast foods. Overweight, obesity and non-communicable diseases (NCDs) have increased while micronutrient deficiencies remain highly prevalent. This raises concerns regarding the impact of current food environments on health and nutrition. A review was conducted identifying existing conceptual frameworks for food environments, as well as South African research and policy documents, all addressing the association between environmental factors and eating behaviour/food choices amid increasing obesity and NCDs rates. South African research does not address food environments comprehensively, tending to focus on aspects such as the situation in home, school, community and retail settings. The associations between food environments, the role of the food industry, the food choices and behaviour of consumers remain under-researched. Nutrition research focuses on nutrient intakes without interrogating foods being consumed. While a progressive policy environment exists it remains largely unevaluated and the high prevalence of obesity, related NCDs and micronutrient deficiencies question its effectiveness. There is a need to conduct comprehensive food environment research that can inform policies and programmes to effectively address the high prevalence of over and undernutrition. Keywords: South Africa, food environments, health, nutrition, policy

Institute for Poverty, Land And Agrarian Studies Faculty of Economic and Management Sciences University of the Western Cape Private Bag X17 Bellville 7535 Tel: +27-(0)21-9593733 Fax: +27(0)21-9593732 Website: www.plaas.org.za Email: [email protected] Twitter: @PLAASuwc Facebook: www.facebook.com/PLAASuwc
DST-NRF Centre of Excellence in Food Security School of Government Building University of the Western Cape Private Bag X17 Bellville 7535 Tel: +27 (0)21–9593817 Website: www.foodsecurity.ac.za Email: [email protected] Twitter: @FoodSecurity_ZA Facebook: https://www.facebook.com/CoEinFS/
ACRONYMS ADSA Association for Dietetics in South Africa BevSA Beverages Association of South BMI body mass index CGCSA Consumer Goods Council of South Africa CNDC community nutrition development centres CoEFS Centre of Excellence in Food Security CVD cardiovascular disease DDS dietary diversity score FAOSTAT Food and Agriculture Organization of the United Nations Statistics Division FBDGs food-based dietary guidelines GDA Guideline Daily Amounts INFORMAS International Network for Food and Obesity/non-communicable diseases Research,
Monitoring and Action Support HSFSA Heart and Stroke Foundation South Africa ISHP Integrated School Health Policy LSM living standard measure NCD non-communicable diseases NFCS National Food Consumption Survey NFCS-FB-1 National Food Consumption Survey: Fortification Baseline 1 NSNP National School Nutrition Programme NSSA Nutrition Society of South Africa PDC provincial distribution centre PPP public-private partnership RDA Recommended Daily Allowance RSA Republic of South Africa SABC South African Broadcasting Corporation SANHANES South African National Health and Nutrition Examination Survey SAJCN South African Journal of Clinical Nutrition SSB sugar-sweetened beverages StatsSA Statistics South Africa UK United Kingdom UNICEF United Nations Children's Emergency Fund UPP ultra-processed food products US United States of America VAT value added tax WHO World Health Organisation

Institute for Poverty, Land And Agrarian Studies Faculty of Economic and Management Sciences University of the Western Cape Private Bag X17 Bellville 7535 Tel: +27-(0)21-9593733 Fax: +27(0)21-9593732 Website: www.plaas.org.za Email: [email protected] Twitter: @PLAASuwc Facebook: www.facebook.com/PLAASuwc
DST-NRF Centre of Excellence in Food Security School of Government Building University of the Western Cape Private Bag X17 Bellville 7535 Tel: +27 (0)21–9593817 Website: www.foodsecurity.ac.za Email: [email protected] Twitter: @FoodSecurity_ZA Facebook: https://www.facebook.com/CoEinFS/
TABLE OF CONTENTS
1. INTRODUCTION .........................................................................1
2. CONCEPTS AND DETERMINANTS OF FOOD ENVIRONMENTS ...........................2
3. REFLECTION OF INTERNATIONAL REVIEWS ON FOOD ENVIRONMENTS AND DIETS ....6
4. FOOD ENVIRONMENTS AND NUTRITION IN SOUTH AFRICA ...........................7
5. MACRO-LEVEL APPROACHES IMPACTING FOOD ENVIRONMENTS AND NUTRITION IN SOUTH AFRICA ....................................................................... 14
6. CONCLUDING REMARKS .............................................................. 26
REFERENCES ............................................................................... 28


Working paper 34, Nicole Claasen, Marinka van der Hoeven and Namukolo Covic 1
1. INTRODUCTION Food environments can be described as ‘the collective physical, economic, policy and socio-cultural surroundings, opportunities and conditions that influence people’s food and beverage choices and nutritional status’ (Swinburn et al., 2013:2). The food environment in South Africa has changed rapidly since the mid-1990s, perhaps driven by an influx of trade and foreign direct investment by large and transnational food and beverage industries, as well as an ever growing market share by supermarket retailers and fast food chains (Igumbor et al., 2012; Puoane et al., 2012; Weatherspoon &Reardon, 2003). This change has contributed to making processed foods, more available, affordable and acceptable to all sectors of the South African population, and has been related to changing dietary patterns and contributing to overweight, obesity and non-communicable diseases (NCDs) (Igumbor et al., 2012). South Africa has the highest prevalence of obesity as defined by body mass index (BMI≥30 Kg m2) among women in sub-Saharan Africa with 42% in 2013 (Ng et al., 2014). Obesity is considered to be one of the major risk factors of the high prevalence of NCDs in the country. NCDs contribute to 37% of all-cause mortality, particularly contributing to type 2 diabetes, heart disease, certain cancers and osteoarthritis (Puoane et al., 2012). Statistics South Africa (2015), for instance, has reported cardiovascular diseases, diabetes and hypertensive diseases among the top ten leading causes of death ranking second, third and seventh, respectively in 2014. Yet at the same time, South Africa still battles with household food insecurity and micro-nutrient deficiencies for a significant part of the population. The latest South African National Health and Nutrition Examination Survey (SANHANES-1) (Shisana et al., 2013) indicated that 28% of the population were at risk of hunger and 26% experienced hunger (are food insecure). Children were most vulnerable with regard to under-nutrition, with 26% of children 1-3 years old being stunted (e.g. of low height for age compared to a standard population as an indicator of chronic malnutrition) (Shisana et al., 2014). Thus both over and undernutrition are observed within the South African setting, requiring food environments and systems that address both. The increasing prevalence of overweight and obesity along with its adverse public health implications is a global challenge. Yet, effective measures to counteract these trends are still absent (Ng et al., 2014). Globally, the changing food environments and systems dominated by large transnational food and drink corporations, also called ‘Big Food’, have been reported to be significant drivers of the obesity epidemic. This has been attributed to increased supply of ultra-processed food products (UPPs) which are often energy-dense but nutrient-poor (Monteiro et al., 2013; Swinburn et al., 2011). Monteiro et al. (2013:22) define UPPs as ‘ready-to-consume products that are entirely or mostly made not from foods, but from industrial ingredients and additives, and are extremely profitable’. Examples are burgers, frozen meals, pizza and pasta dishes, nuggets and sticks, crisps, biscuits, confectionary, cereal bars, carbonated and other sugared drinks, and various snack products etc. UPPs themselves are characterised by being highly palatable because of high content of fat, sugar, salt and other additives. The high palatability combined with affordability, omnipresence, desirable convenience amid increasingly busy lifestyles and aggressive marketing strategies, make UPPs drivers of changing dietary patterns from meal consumption (normally consumed at regular times and places) to snack type consumption (eaten anytime and everywhere) with neglect of fresh and minimally processed foods. The resulting unfavourable dietary patterns promote obesity and related NCDs (Monteiro et al., 2013). Public health policies are often recommended to mitigate negative trends in dietary patterns towards unhealthy profiles but Moodie et al. (2013) argue that transnational unhealthy commodity industries, including tobacco, alcohol and UPP and drink industries use similar strategies that undermine the effectiveness of such public health policies and programmes.

2 Food environments, health and nutrition in South Africa
Among reported strategies are: to bias research findings, to co-opt policy makers and public health professionals, to lobby politicians and public officials to oppose public regulations, and to encourage voters to oppose public health regulations. While there is the school of thought that industry-led interventions could be effective within public health strategies, Moodie et al. (2013) highlights that there is no evidence of effectiveness or safety of industry-operated, voluntary self-regulation or public-private partnerships (PPPs) in response to unhealthy consumption patterns. They urge that government regulation and market intervention are necessary to prevent harm caused by unhealthy commodity industries. There is no doubt that the public is affected by the food choices they make. Food choices are influenced not only by individual factors (such as health, preference or income) but also a complexity of environmental and systemic drivers (Swinburn et al., 2011). Thus, interventions only aiming at behavioural change of consumers (e.g. education and information programmes) would not be adequate to combat the obesity epidemic. In addition, policy interventions, mainly government policies, are crucial to address and perhaps even reverse obesogenic environmental drivers (Monteiro et al., 2013, Swinburn et al., 2011). Thus the two approaches should be viewed as being complementary to bring about the desired positive change in food consumption patterns. While a growing body of research exists internationally that examines the effects of food environments and corporate strategies on health and nutrition, in South Africa the nature and extent of these dynamics have not received much attention. Yet, South Africa stands out in Sub-Saharan Africa in having a relatively extensive proliferation of supermarkets and fast food chains even in communities of low socio-economic status. Further, unlike other Sub-Saharan countries South Africa’s food value chain depends primarily on large commercial farming enterprises. More research evidence in the field of food environments in the context of South Africa is needed to guide policy responses to the rising prevalence of obesity and NCDs that are now a major public health concern. The aim of this report was to review existing research and policies related to food environments to identify research gaps towards a research agenda for the new Centre of Excellence in Food Security (CoEFS). This report therefore first outlines aspects of the concept of and determinants of food environments followed by a brief reflection of international reviews that examined the relationships between food environments and diets. Thereafter, South African food environments will be mapped based on existing national studies, including food environments as related to the home, school, community and retail store settings. Then, macro-level approaches that can have an impact on food environments and nutrition in South Africa are considered, such as the national food and nutrition security policy, strategic plans for NCD and obesity prevention, national road map for nutrition, South African food-based dietary guidelines, salt regulation, food fortification, food prices and pricing strategies, and food product labelling. The end of this report gives a short conclusion that is followed by recommendations for further research and identification of policy needs. This report provides a selective overview on food environments in South Africa from a health and nutrition perspective. We are aware this report is not comprehensive as other dimensions that shape food environments are not fully addressed, e.g. agriculture, trade and industry, social and geographical sciences, consumer rights and protection.
2. CONCEPTS AND DETERMINANTS OF FOOD ENVIRONMENTS In this section an overview is provided on concepts related to food environments and determinants thereof. Within the last two decades, different concepts and definitions of food environments have emerged. For example, there are concepts relating to obesogenic environments (Swinburn et al., 1999), nutrition environments (Glanz et al., 2005), and food environments (Story, 2008, Swinburn et al., 2013). What these concepts have in common is that

Working paper 34, Nicole Claasen, Marinka van der Hoeven and Namukolo Covic 3
they try to capture the association between environmental factors and eating behaviour or food choices in the context of increasing rates of obesity and NCDs. Swinburn et al. (1999) were the first to use a system-based approach to identify environmental determinants linked to obesity by considering two mediators - food and physical activity. They introduced the term obesogenic environments which they define as: ‘the sum of influences that the surroundings, opportunities, or conditions of life have on promoting obesity in individuals or populations’ (Swinburn et al., 1999:564). Based on an ecological model for obesity (Egger& Swinburn, 1997), they developed an analytical framework for obesogenic environments that comprises two levels of environments (micro- and macro-environment) on one axis, and four types of environments (physical, economic, political and socio-cultural) on the other axis. The determinants and examples of environments linked to food as suggested by Swinburn et al. (1999) are summarized in Table 1.
Table 1: Determinants of food environments and selected examples* Type Size
Physical (Availability)
Economic (Costs)
Political (Rules)
Socio-cultural (attitudes & beliefs)
Micro-environmental settings (where groups of people gather for specific purposes involving food, e.g. schools, neighbourhoods, homes, churches, markets)
- what is available in food outlets (e.g. restaurants, supermarkets, schools)
- point of purchase information (e.g. labels and logos)
- nutrition expertise, training, and information
- cost of food production, manufacturing, distribution, and retailing
- income
- in school: school nutrition policy, school rules related to food
- in home: family rules on food purchase and consumption
- ‘culture’ or ‘climate’ of a setting, e.g. health-promoting schools
Macro-environmental sectors (groups of industries, services, or supporting infrastructure influencing food choices in various settings)
- industry groups, local and regional authorities, central governments, transnational corporations
- taxing, pricing policies, subsidies
- financial support of health promotion programmes
- food policies and practices towards healthy food
- government food and nutrition policies, regulations, laws
- food industry policies and standards
- regulations on food labels, health claims, food advertisement aimed at children
- mass media (advertising & marketing)
*The original grid of Swinburn, Egger and Raza (1999) also includes determinants of physical activity which have been removed from this table to focus specifically on food environments.
(Adapted from Swinburn et al., 1999)* Glanz et al. (2005) conceptualise the term nutrition environments based on an ecological model of health behaviour (Sallis & Owen, 2002, cited in Glanz et al., 2005); the model identifies four types of nutrition environments: (1) a community nutrition environment defined by the number, type, location and accessibility of food outlets (e.g. retail stores, restaurants); (2) organisational nutrition environments including home, school, work and other environments; (3) a consumer nutrition environment that relates to what consumers encounter within and around food outlets, such as nutritional quality, price, promotions, placement, range of choices, freshness and nutritional information; and (4) information environment referring to media and advertising. In their model (see Figure 1), these four environments are framed by a policy variable (e.g. government and industry policies) and individual variables (e.g. socio-demographics, psychosocial factors, and perceptions).

4 Food environments, health and nutrition in South Africa
Figure 1: Model of nutrition environments
Source: Glanz et al., 2005:331.
Story et al. (2008) describe an ecological framework of food environments and conditions that impact on eating behaviour with four broad levels of influence: (1) individual level including cognition, behaviour, biological, demographic factors; (2) social environment including interactions with family, friends, peers, and others in community; (3) physical environment including settings where people eat (e.g. home, childcare, schools, work sites, retail food stores, restaurants); and (4) macro-level factors including socio-cultural norms and values, policies, prices, and marketing. Their model of food environments with its numerous determinants is displayed in Figure 2.
Figure 2: Ecological framework on multiple influences on food choices
Source: Story et al., 2008:273.

Working paper 34, Nicole Claasen, Marinka van der Hoeven and Namukolo Covic 5
The most recent and comprehensive concept of food environment with relevant determinants are defined by the International Network for Food and Obesity/non-communicable diseases Research, Monitoring and Action Support(INFORMAS) (Swinburn et al, 2013). INFORMAS is a global network of public interest organisations and researchers that aim to monitor, benchmark, and support actions towards healthy food environments and reduced rates of obesity and NCDs. INFORMAS adapted the above concepts of Swinburn et al. (1999), Glanz et al. (2005) and Story et al. (2008). They argue that in order to reduce obesity and diet-related diseases, ‘healthy food environments’ need to be created. These are defined as:
Environments in which the foods, beverages and meals that contribute to a population diet meeting national dietary guidelines are widely available, affordably priced and widely promoted.
Source: Swinburn et al., 2013:2. INFORMAS note that the four main dimensions of food environments (physical, economic, policy, and socio-cultural) are influenced in multiple ways by four main factors: the food industry, government, society, and individual factors (see Figure 3). The food industry creates the supply, promotes consumption, and contributes to socio-cultural norms about food. Government policies, laws and regulations provide a frame within which the food industry must operate. Society establishes cultural norms, e.g. through traditional, religious and cultural practices. Individuals interact with the food environment towards their food choices (Swinburn et al., 2013). In order to benchmark and monitor food environments, a monitoring framework with process, impact and outcome modules was developed. Process determinants, referring to organisations, investigate public and private sector policies and actions. Impact determinants, describing food environments, include research on food composition, labelling, promotion, provision, retail, prices, trade and investment. Outcome determinants, referring to populations, investigate population diet, physiological and metabolic risk factors, and health outcomes (Swinburn et al., 2013).
Figure 3: Food environments, its components, and interactions
Source: Swinburn et al., 2013:3.1
1 Numbers in brackets (1, 2, 3, 4) as displayed within food industry, government, and society refer to the influence on the
respective food environment: (1) physical, (2) economic, (3) policy, and (4) socio-cultural.

6 Food environments, health and nutrition in South Africa
3. REFLECTION OF INTERNATIONAL REVIEWS ON FOOD ENVIRONMENTS AND DIETS
Larson and Story (2009) extensively reviewed research related to the influence of social, physical, and macro-environments on food choices in the US from 1999 to 2009. They conclude that although many studies found associations between food environments and food choices, the majority of the studies reviewed had methodological limitations that lead to questioning their credibility on guiding environmental interventions and policies. They recommend that future research on food environments needed to address the rigor of study design and the need for multilevel investigations, inclusion of diverse subgroups (e.g. age, gender, socio-economic status), development and evaluation of standard measures, and improvement of dietary assessment methods (Larson&Story, 2009). A more focused systematic review on consumer food store environments, mainly in the US, but also in Australia, Canada, New Zealand, UK and Scotland was done by Gustafson et al. (2012) who selected 56 papers of primary, quantitative international studies published between 2000 and 2011. The review found no consistent association between food store environment (available food items within stores) and neighbourhood characteristics, food prices, dietary patterns, or BMI. The authors found comparison between the different studies was particularly difficult because different food store audit tools were used. It remains a question as to which would be the key food items of audit tools to represent ‘health’ for a store or ‘healthy foods’. The selection of ‘healthy’ food items for audit tools may further be subject to change because of continuous changes in dietary recommendations and guidelines based on the latest evidence on diets and health. Gustafson et al. (2012) point out the complex nature of diverse settings and store types. Surrounding characteristics of supermarkets (e.g. lighting, safety, crime rates) as well as other variables such as competition, store location, and individual incomes are usually not reported but may contribute to a better understanding of prices and consumer behaviour relating to food. The review further urges the need for longitudinal studies addressing purchasing patterns, diets and obesity outcomes as well as explorations of marketing strategies within stores and the influence it may have on consumer choices (Gustafson et al., 2012). Studies on marketing strategies within retail stores and consumers’ responses published between 1995 and 2010 were reviewed by Glanz et al. (2012). Their review included English-language publications focusing on physical grocery stores and food products. The review of 125 primary research articles as well as other sources such as review and commentary articles, and industry reports, found that there was limited evidence that increasing access to healthy foods in stores resulted in healthy eating patterns. The authors indicated that limitations of the review were that market research is concerned with purchases and not with dietary intake, a generalisation of findings was difficult because most studies are experiments or carried out in only a few stores, and that comprehensive and standardised measures on all four marketing components (product, price, placement and promotion) are scarce. The authors further noted that industry based methods were promising in public health research to evaluate the impact of food marketing, e.g., by using electronic supermarket sales data, inventory data, and loyalty card outputs. The review concluded that retailers, marketing designers and public health researchers needed to collaborate to design and evaluate potential ‘health promoting marketing strategies’ (Glanz et al., 2012).

Working paper 34, Nicole Claasen, Marinka van der Hoeven and Namukolo Covic 7
4. FOOD ENVIRONMENTS AND NUTRITION IN SOUTH AFRICA Work that can be considered to be related to food environments in South Africa has tended to address isolated components of some of the aspects earlier discussed on concepts and determinants of food environments. The broad categories of food environments that were established during the process of reviewing current literature structure the outline of this section and include food consumption patterns, home food environment (including television advertising), school food environment, community food environment (fast food and street food), and retail store food environment. Exploring the available evidence in these aspects though limited will provide useful information related to food systems in South Africa and also reveal gaps that will need to be addressed by research to generate evidence that can inform policies and programmes.
Food consumption patterns in South Africa In order to determine the effects of food environments on food choices, it is essential to know what South Africans consume. However, nationally representative food and dietary intake data was recently found to be very limited in South Africa (Van Heerden&Schönfeldt, 2011). The first National Food Consumption Survey (NFCS among children was conducted in 1999 by Labadarios et al. (2005a) to collect baseline information that could guide the food fortification policy that was being considered at the time by identifying commonly eaten foods. The survey found that the five foods mostly consumed by South African children (aged one to nine years) were maize meal, sugar, tea, whole milk and brown bread (Labadarios et al., 2005a). Consequently, maize meal and wheat flour were fortified by implementation of the Food Fortification Act of 2003. The follow-up National Food Consumption Survey: Fortification Baseline 1 (NFCS-FB-1) only focused on attitudes towards fortification, and the procurement and use of fortified maize meal and wheat bread and therefore cannot be regarded as a national food consumption survey (Labadarios et al., 2007). Based on a review on food intake studies in South Africa from 1987 to 2010, van Heerden and Schönfeldt (2011) stressed that besides NFCS, which only focused on children, there are only a limited number of smaller, regional studies that mostly focus on previously disadvantaged groups based on apartheid laws. Hence, there is no knowledge on food consumption patterns across age, race, and different socio-economic groups in South Africa. Moreover, most published food intake data only reported on nutrient intake but not the actual foods consumed (van Heerden&Schönfeldt, 2011). Labadarios et al. (2011) carried out a nationally representative survey on dietary diversity among South Africans (n=3287, ≥16 years) from all provinces, geographic localities and socio-economic strata, including environmental determinants. A non-quantified recall recorded all food and beverages consumed during the previous 24 hours. Foods were then categorised into nine different food groups: (1) cereals, roots, tubers; (2) meat, poultry, fish; (3) dairy, (4) eggs; (5) Vitamin A rich fruit and vegetables; (6) legumes; (7) other fruit; (8) other vegetables; (9) fats and oils. Then a dietary diversity score (DDS) was calculated by counting each food group once. A DDS of 9 indicates a very varied diet while a DDS≤4 indicates poor dietary diversity and was used as an indicator for food insecurity. Labadarios et al. (2011) found that 38.3% of South Africans only had between one and three food groups the previous day, among them cereals, meat and poultry, dairy and vegetables with consumption of Vitamin A rich fruit and vegetables being less reported. There were high discrepancies among provinces, geographical areas, living standard measure (LSM) and race. The highest percentages of DDS<4 were found in Limpopo and Eastern Cape (61.8% and 59.6% respectively), tribal and urban informal areas (63.9% and 55.7%), populations with low LSM (73.9%), and black population groups (50%). Environmental factors associated to a low DDS were a river as the drinking water source, having no toilet, no access to electricity, an income from casual work, living in a traditional type of house, being sick or disabled, and buying from a local spaza store in the vicinity (Labadarios et al., 2011). Thus, poverty seems to have been a key factor for low DDS.

8 Food environments, health and nutrition in South Africa
While the survey findings showed that dietary diversity should be of concern in South Africa, it did not provide any data on the consumption of processed versus whole or minimally processed foods which could indicate the prevailing food environment including exposure to highly refined foods in South African households. The latest South African National Health and Nutrition Examination Survey (SANHANES-1, Shisana et al., 2014) confirmed the findings of Labadarios et al. (2011). From SANHANES-1 a national average of DDS of 4.2 and 39.7% of the population having a DDS<4 were observed. Further, SANHANES-1 provided data on dietary intakes of fat (as part of fatty meat, fried foods, and high fat snacks) and sugar (sweetened beverages, confectionary, and sweet snacks), which can be good proxies for consumption of processed foods. Results show that high fat and sugar intake is prevalent across the South African population, particularly so for the young generation (15-24 year olds). These findings highlight unhealthy eating habits, most likely promoted by unhealthy eating environments and suggest an urgent need to explore the determinants and drivers of these consumption patterns. A recent analysis of international databases, that included the Food and Agriculture Organization of the United Nations Statistics Division (FAOSTAT) food balance sheets and Euromonitor International© Packaged Food and Beverage Consumption (Euromonitor PFBC), identified significant food and beverage consumption shifts in South Africa since 1994 (Ronquest-Ross et al., 2015). Findings showed that there has been an overall increase in energy intake, sugar-sweetened beverages, processed and packaged foods, animal source foods, and added caloric sweeteners, while the consumption of vegetables actually decreased. In particular the consumption of processed and packaged food, such as soft drinks, sauces, dressings and condiments, and sweet and savoury snacks had the most drastic increase (>50%). These findings showed significant changes in food consumption patterns that may be due to changing food environments (Ronquest-Ross et al., 2015). While providing useful information, extrapolating consumption patterns from agricultural data such as FAOSTAT should be done cautiously because of differences with actual consumption patterns across different sectors of the population, as reflected earlier. There is no national and regionally comparable data on food consumption in South Africa that has taken into account different economic, ethnic and geographical groups. Evidence is further lacking on consumption patterns of indigenous foods and traditional meals across the different ethnic groups in South Africa, identifying the possible contribution to healthy and sustainable food environments. The lack of evidence on indigenous and traditional foods reflects a significant gap in evidence to inform the public policy formulation to address the changing consumption patterns. It also reflects negatively on the effectiveness of existing food and nutrition policies and programmes.
Home food environment (including television advertising) Not many studies describe the home food environment in South Africa. Feeley et al. (2012) in their longitudinal study described changes of dietary habits of adolescents (living in Soweto, Johannesburg) in their home environment over a five year period, in terms of breakfast consumption, snacking while watching TV, and family meals. Findings showed that regular weekday breakfast consumption decreased across the age groups (76.4% and 65.3% for the 13- and 17-year old groups, respectively) with male adolescents consuming breakfast more regularly than females. Snacking while watching television increased by 86% (means 3.6 ± 4.6 and 6.7 ± 5.9 snacks/week from the 13- to 17-year-olds in the study population). The most commonly consumed snacks while watching television are bread, crisps, fruit, sweet biscuits and chocolates. Meals with their family were eaten on ‘most or every day’ by almost two-thirds of adolescents, indicating that eating practices of adolescents related to meals may be influenced by family (Feeley et al., 2012).

Working paper 34, Nicole Claasen, Marinka van der Hoeven and Namukolo Covic 9
Cassim (2010) mapped the aspects of food and beverage marketing on television to children in South Africa. Children were exposed to an about 24 minutes of television advertising per day based on data from 2003-2005; this is likely to have increased by now. Cassim (2010) also pointed out that R785 million was spent on food and R1.4 billion on beverage advertising in 2007. The top food and beverages advertisers in South Africa were Unilever (1st), Coca Cola (17th), Tiger Brands (20th) and KFC (21st) (Cassim, 2010). According to Igumbor et al. (2012), the South African government has not yet implemented any regulations on food marketing to children. However, in 2009 the South Africa Pledge on Marketing to Children was established, an initiative of the Consumer Goods Council of South Africa (CGCSA), which includes 24 signatories from food manufacturers, retailers, and fast food chains. The pledge focuses only advertising on television and in schools to children less than 12 years old, but no specific commitments or monitoring of the pledge are in place (Igumbor et al., 2012). Mchiza et al. (2013) explored in-depth television advertising of food in South Africa. The content of television food advertisements aimed at adults and children in South Africa was analysed by recording the four national television channels between 15h00 and 21h00 every day for a 4-week period in April and May 2011. Of all recorded advertisements, 44% were related to foods: 63% were for specific food products, 21% for alcohol, and 13% for supermarket and pharmacy promotions. Almost half of all food-related advertisements appeared during the family viewing time (17h00-19h00). During this time, most food advertisements were high-energy and low-nutrient foods, such as desserts and sweets (22%), fast foods (20%), starchy foods (16%), condiments (14%), and sweetened drinks (10%). Only 2% of all food-related advertisements were for fruit and vegetables. Out of all food-related advertisements, most presented ordinary people (63%). Some presented a mixture of personalities (e.g. celebrities, professionals, and ordinary people) (22%), celebrities only (10%, alcohol advertisements in particular), and the rest used professionals only and cartoon characters. Mchiza et al. (2013) stressed concern that most advertisements were for high-energy foods and argued that television adverts may thus be promoting increased consumption of high-energy foods and drinks, increased meal frequency, fast food consumption, and lower consumption of fruit and vegetables. They recommended government introduce regulations to reduce advertising of unhealthy food and drinks, especially to protect children’s health (Mchiza et al., 2013). Steyn et al. (2014), also make three recommendations for television food and drink advertising to children: (1) prohibiting advertising of foods and beverages high in fat, sugar and salt in accordance with World Health Organisation (WHO) recommendations; (2) prohibiting alcohol advertising; and (3) restricting the use of advertising techniques that appeal to children, including prohibiting of cartoon characters and/or animation, or promotional offers and gifts or tokens. They further suggested a pre-screening committee by the state-owned South African Broadcasting Corporation (SABC) channels with members nominated by the Nutrition Directorate of the Department of Health to ensure advertising met the required criteria (Steyn et al., 2014). No studies were found relating the effect/role of exposure to advertising on consumption patterns.
School food environment Schools are probably the most researched and best described of South Africa’s food environments. Various studies describe different determinants of school environments, especially regarding the challenges of preventing childhood obesity and promoting future health. South Africa has had a school feeding programme since 1994 (Taljaard et al., 2013). The Integrated School Health Policy (ISHP) (Depts of Health and Basic Education, 2012) offers a policy framework for adequate school food environments. The ISHP aims ‘to contribute to the improvement of the general health of school-going children as well as the environmental conditions in schools and addresses health barriers to learning in order to improve education outcomes of access to school, retention within school and achievement at school’ (Depts of Health and Basic Education, 2012:10).
10 Food environments, health and nutrition in South Africa
As such it provides three health packages with minimum activities outlined in schools, including health education and promotion, learner health assessment and screening, and provision of on-site services. The provision of on-site services specifically refers to an environmental assessment related to food safety and suitability, which could promote a healthier food environment at school. Furthermore, resource-poor schools are supported by the National School Nutrition Programme (NSNP), initially under the Department of Health and now under the Department of Education. The NSNP is part of the Integrated Food Security Strategy that endorses three components, namely school feeding, nutrition education, and sustainable food production initiatives (Department of Education, 2008). While the policy environment seems progressive, the effectiveness of implementation is another matter. A national survey of 90 poorly resourced schools by Faber et al. (2014) explored the school food environment in terms of breakfast consumption, school meals, lunch boxes, school vending and classroom nutrition-related activities. The survey raised a number of concerns with regards to the low number of learners carrying a lunch box (24%), school meals provided by the NSNP having a low content of vegetables and fruit, low number of teachers having received nutrition training (15%), and unhealthy food items bought by students from tuck shops and vendors inside and outside the school premises (Faber et al., 2014). At national level the SANHANES-1 indicated that >50% of children aged 10-14 years (51%) did not use a lunch box but 51.3 % of children indicated taking money to school (Shisana et al., 2013). Feeley at al. (2012) found that regular lunch box use was not common among adolescents living in Soweto, Johannesburg and had decreased with age (17.4% to 8.6% at 13- and 17-year-olds, respectively). Most popular foods in lunch boxes were cheese, bread, fruit, and fruit juice (Feeley et al., 2012). Faber et al. (2014) stated that 57% of learners brought money to school on the survey day. Parents did not know what type of food their children bought at school and thought that foods sold at schools could be healthier (32%) (Faber et al., 2014). Yet, the sale of unhealthy foods by vendors in and around schools has been documented by a number of other studies (e.g., Abrahams et al., 2011; Feeley et al., 2012; Temple et al., 2006; Wiles et al., 2013). The five most popular tuck shop purchases by adolescents in Soweto were sweets, crisps, sweetened beverages, fried chips and white bread (Feeley et al., 2012). Barriers to selling more healthy foods in and around schools included difficulties in stocking fresh produce, children’s preference for unhealthy foods, fear of losing income due to selling healthier food items, and the higher cost of healthy foods (Wiles et al., 2013, Marracini et al., 2012; De Villiers&Faber, 2015; Krølner et al., 2011). Moore and Tapper (2008) observed that fruit tuck shops on their own did not change children’s consumption patterns at school for the better. Only when combined with school regulations on foods that children were allowed to bring to school was there greater impact. Promoting a healthy school food environment needs a comprehensive approach that includes classroom curricular, policy and environmental changes, and parental and community support, to create a demand for healthier foods to be sold at school (Faber et al., 2014).
Community food environment (fast food and street food) Most studies referring to the community food environment in South Africa refer to fast food and street food outlets. According to Steyn et al. (2011), fast foods are described as food products that ‘are sold from outlets in formal structures such as buildings and malls and frequently operate as franchises’. Street foods ‘are regarded as being foods or beverages that are sold by the informal sector. [They] are generally sold from stands/stalls on the pavement of busy streets in both urban and rural areas, usually at lower cost than fast food’ (Steyn et al., 2011). Street food vendors generally only sell a few food products that often include snacks such as crisps or soft drinks, but also cooked foods (Steyn et al., 2011:1).
Working paper 34, Nicole Claasen, Marinka van der Hoeven and Namukolo Covic 11
From a nationally representative cross-sectional survey (n=3287), Steyn et al. (2011) reported that street foods and fast foods were commonly consumed by the South African population, with 33.5% consuming street food and 35% consuming fast food at least once a week. Socio-economic status seemed to play a role in fast food and street food consumption. Participants from the medium LSM category frequently bought street foods (14.7%) while participants from the high LSM category frequently bought fast foods (13.2%). In 2010 of the 8,661 fast food outlets in South Africa, 4,991 where owned by fast food chains, while others were independent outlets. Fast food chains are dominated by large South African companies (Igumbor et al., 2012) that are also spreading to other African countries. Steyn et al. (2011) found that fast food consumption patterns were similar among all ethnic groups with 21.4% of black, 26.8% of mixed ancestry, 30.1% of Indian, and 28.3% of white South Africans consuming fast food twice or three times per month. Street food was mainly consumed by black South Africans (45.3%), compared to 22.4% of mixed ancestry, 15.2% of Indian and 9.6% of white South Africans. Fruit and soft drinks were the most commonly consumed street food among all ethnic groups. Steyn et al. (2011:8) further discuss the “convenience aspect” of street foods in urban areas, particularly for people who travel long distances to their work place every day. In this case, consuming regular meals at home is often challenging and is replaced by ready-to-eat street foods that are easy accessible and affordable. Steyn et al. (2011) conclude that the increasing purchases of fast food and street food pose many public health concerns, particularly with regards to the consumption of soft drinks, high fat and energy-dense foods and the related risk to obesity and diet-related NCDs. Further, they pointed out that little was known about the types of food frequently consumed and their nutritional value which poses a question on how to include these foods within the dietary guidelines promoted by health professionals in South Africa (Steyn et al., 2011). Feeley et al. (2012) documenting the dietary patterns of adolescents in Soweto, Johannesburg over 5-years, found that fast-food consumption increased by 10.4% (from 4.8 ± 3.9 to 5.3 ± 4.2 times/week for 13- and 17-year olds, respectively)2. The five most popular fast food items were fried chips, vetkoek (deep-fried dough bread), fried fish, pie, and boerewors (local sausage) rolls. Beverage consumption – mostly soft drinks – increased by 29% (from 3.1 ±2.5 to 4.0 ±2.5 times/week for 13- and 17-year-olds, respectively). With increased age, there was an increased preference for soft drinks and chocolate and a decreased preference for sweets, ice cream, and squash. It is further argued that the wide availability and accessibility of fast foods in commercial and informal outlets are reasons for the high consumption. Especially, lower prices from informal vendors make fast foods more available and accessible to low income groups (Feeley et al., 2012). An exploratory study of Feeley et al. (2011) among rural informal food vendors in Mpumalanga investigated the availability of food and its macro-nutrient composition. Most commonly, food sold by informal vendors were fried chips, vetkoek and a local speciality called kotas (a quarter loaf of white bread filled with chips, processed cheese and meats and sauces). All of these energy-dense foods are high in fat but low in fibre and micro-nutrients. Feeley et al. (2011) discuss that food sold by informal vendors in these rural communities may replace home-cooked meals and other healthier food options because they are so easily accessible, hence contributing strongly to the obesity epidemic in rural South Africa. On the other hand, food vending contributes to rural household income and hence forms an important part of the community. Strategies to promote vending of locally produced foods (e.g. from food gardens) and healthier food options urgently need to be investigated and evaluated (Feeley et al., 2011). Street foods are often regarded with concern when it comes to food hygiene and safety. A study among 200 street vendors in Gauteng, however, showed minimal health risks for consumers of street food (Martins, 2006). Street vendors followed high hygiene standards when preparing 2 Feeley et al. (2012) did not specify between street food and fast food.

12 Food environments, health and nutrition in South Africa
and serving food. Further, microbiological tests showed low counts of tested pathogens in the food samples (Martins, 2006). The study further stressed that street food vending was a relatively ‘easy-to-enter’ business because little start-up funds are required. As such, an informal street food business offers livelihoods for people of poor socio-economic status and with low qualification (Martins, 2006). Von Holy and Makhoane (2006) showed similar findings based on existing literature with regard to street food safety. Nevertheless, they pointed out that street vendors faced unfavourable conditions with regard to access to sanitary facilities (von Holy&Makhoane, 2006). A more recent study by Campell (2011) on knowledge, attitudes, and practices regarding food hygiene and safety among 150 street food vendors in Gauteng confirmed acceptable food handling practices of street food vendors. But the study also found that street food vendors who received training and monitoring by environmental health practitioners followed higher hygiene standards suggesting room for improvement (Campell, 2011). Research on marketing strategies, food consumption patterns and spending in the community food environment, particularly within the restaurant setting, are scarce in the South African research landscape.
Retail store food environment In South Africa, food retail consists of the formal and informal sector. As described by Stroebel and Van Schalkwyk (2012), the formal food retail sector includes a wide range of neighbourhood convenience stores, specialty stores, boutiques, chain supermarkets, department stores and large wholesale and retail outlets. Informal food retail consists of general dealers, small cafes, street vendors, hawkers, tuck shops, primitive street corner stalls and spaza shops. The size, volume and revenue of the informal food sector cannot easily be determined because these outlets are not registered as retailers, nor do they pay rent or tax. Spaza shops are the most common food outlet within the informal sector and are mostly available in townships and poorer neighbourhoods. With regard to distribution throughout the country, small food outlets (e.g., rural shops, urban counter shops, and urban self-service shops) outnumber by far large supermarkets and other more formal retail outlets. However, considering the market size, supermarkets present the largest share of the food industry, generating more than half (55.6%) of the food industry’s value in 2007 (Stroebel&van Schalkwyk, 2012). Following a global pattern, the food retail environment in South Africa has changed largely in past decades due to the growing number of supermarkets. Initially, supermarkets served a small niche in cities for rich and middle income households, but current trends show that supermarkets are rapidly penetrating into poorer neighbourhoods and rural areas (Weatherspoon&Reardon, 2003). While supermarkets were not permitted to enter townships and former homelands during apartheid (Business Today, as cited by Weatherspoon & Readon, 2003), the supermarket industry exploded after the end of apartheid in 1994. Various supermarket outlets developed, such as hypermarkets and convenience stores, replacing more traditional retailers, like small shops and public markets. The South African supermarket industry is dominated by four large chains: Pick n Pay, Shoprite, Spar and Woolworths with annual turnovers of, respectively, R49.8 billion, R47 billion, R26 billion, and R10.3 billion for the 2008 financial year (Stroebel& van Schalkwyk, 2012). Of these four chains, Shoprite and Pick n Pay have expanded into the poorer neighbourhoods, including former homelands, rural areas and townships. Woolworths is the only supermarket particularly targeting higher income consumers. Further, high competition between the supermarket chains, near saturation of domestic markets, and the search for higher profits enabled by South African supermarkets, such as Shoprite and Pick ‘n Pay to spill over into other African countries through foreign direct investment (Stroebel&van Schalkwyk, 2012; Weatherspoon&Readon, 2003).

Working paper 34, Nicole Claasen, Marinka van der Hoeven and Namukolo Covic 13
Stroebel and van Schalkwyk (2012) argued that changing consumer demographics drove the demand for supermarket services. Along with urbanisation and westernisation trends, households have become more heterogeneous and smaller, and the number of women participating in the labour force is increasing. Individual health consciousness and food safety concerns are growing due to better education and access to information. Consequently, the dependency on supermarkets is growing due to less time for cooking, higher demand for convenience foods and new foods with high taste profiles. On the other hand, consumer purchasing capacities increased due to increased per capita incomes as well as technological advantages, such as transport and refrigeration for food storage that allowed the adaptation of purchasing patterns towards less frequent food purchases (Stroebel&van Schalkwyk, 2012). A case study of two rural villages in the Transkei, South Africa (D’Haese&van Huylenbroeck, 2005) demonstrated the implications of the rise of supermarkets for rural poor communities. The food consumption basket of these two poor communities consisted of large quantities of a few food items, including mainly maize meal, maize grains, sugar, flour and milk. Households with slightly higher income were more likely to buy these products from supermarkets than local shops because they could afford the transport costs to the nearest towns. The benefits of supermarkets in terms of larger variety and lower prices outweighed the costs for travelling. Like other studies, D’Haese and van Huylenbroeck (2005) concluded that supermarkets may be beneficial for food security of poorer households in terms of access to a range of quality foods and lower prices compared to other food outlets. However, the adverse implications of supermarkets were that they replaced traditional markets, challenged market access for local and small-scale producers and suppliers, and limited local economic growth (D’Haese&van Huylenbroeck, 2005; Stroebel&van Schalkwyk, 2012; Weatherspoon&Readon, 2003). Recent research on the geography of supermarkets in Cape Town contests the argument that supermarkets increase access to food and promote food security among poor households. As Peyton et al. (2015) documented, supermarkets in Cape Town were unequally spatially distributed, with lower income areas having the lowest ratio of supermarkets per square kilometre. The U-Save Shoprite chain was predominantly found in lower income areas but also not in the poorest areas, illustrating that the poorest households face serious limitations in accessing diverse and quality food from formal food outlets. Hence, it seems that the formal food retail system cannot meet the food needs of the poorest and that supermarket expansion has limited capacity to address food insecurity in environments with structural inequality and a related geography of poverty. On the other hand, low income areas have a high prevalence of informal retail businesses, providing a niche service that can meet demands of consumers with irregular and low incomes, especially with regard to small quantities food with low prices and informal credit-based systems. Residents of poorer neighbourhoods use a variety of formal and informal retailers when adapting to poverty and food insecurity. Therefore, informal retailers provide an alternative to supermarkets and are not likely to be easily replaced (Peyton et al., 2015). Battersby and Peyton (2014) further point out that supermarkets in low-income areas stock less healthy foods compared to supermarkets in wealthier areas. This is of concern with regard to unhealthy eating patterns, obesity, and diet-related diseases within poorer communities. Igumbor at el. (2012) discussed that the food environment in South Africa is influenced by ‘Big Food’ companies (large commercial entities that dominate the food and beverage environment) with adverse health implications. Currently, the South African food environment consists of over 1,800 food manufacturers but the ten largest packaged food companies account for a disproportionally large share of sales with 51.8% of the total packaged food sales. The top ten packaged food companies include Tiger Brands, Unilever, Parmalat, Nestle SA, Clover, Dairybelle, Pioneer Food, Cadbury, AVI Ltd and PepsiCo. With regard to soft drinks, three companies - Coca-Cola, PepsiCo

14 Food environments, health and nutrition in South Africa
and Danone - account for 64.7% of the market sales. In order to increase market shares and per capita consumption, the Big Food companies developed different strategies to make their products, often processed foods, more available, affordable and acceptable to consumers. Strategies to increase food availability include expansion to rural areas and other low-income areas with highly efficient retail management and procurement models that have out-competed local wholesalers and small retailers on food price and quality. Moreover, in order to increase their product availability, large food manufacturers have also involved the informal retail sector, particularly with regard to the selling of soft drinks, dairy products, bakery products, and snacks. Strategies to make food products more affordable relate mainly to the Big Food retailers’ procurement systems that cut out traditional wholesalers, consolidate suppliers and deal with larger volumes. Last, strategies of ‘Big Food’ manufacturers include heavy marketing, such as sales promotions, health claims on packaging, and television advertising. While these strategies highlight the influence of ‘Big Food’ on the food environment in South Africa, it is still questionable to what extent ‘Big Food’ can be associated with the observed changes in dietary patterns and increased prevalence of obesity and diet-related diseases (Igumbor at al., 2012).
5. MACRO-LEVEL APPROACHES IMPACTING FOOD ENVIRONMENTS AND NUTRITION IN SOUTH AFRICA
The government has used food, nutrition and health related policies, strategies and programmes to try to influence the food environment in a positive direction though it is not clear how effective they have been. These are discussed in this section.
National food and nutrition security policy The 2014 gazetted food and nutrition security policy of the Departments of Social Development and Agriculture, Forestry and Fisheries (RSA, 2014) calls for multi-sectorial initiatives and programmes aimed at ensuring availability, accessibility, and affordability of safe and nutritious food at national and household levels. Targeting the high number of food insecure households and individuals in South Africa, this policy has five pillars of action: (1) improved nutritional safety nets, (2) improved nutrition education, (3) investment in agriculture, (4) improved market participation of emerging farmers, and (5) food and nutrition security risk management. As part of the food and nutrition policy, a Household Food and Nutrition Security Strategy has been developed that proposes to strengthen existing programmes, such as the NSNP, the National Food Fortification programme, and food distribution programmes (such as food parcels and food vouchers). In addition, it proposes two new initiatives that include establishing a nutrition programme within Early Childhood Development Centres and establishing larger and more robust food distribution networks for food insecure individuals. The latter is implemented by the Department of Social Development, employing a state-supported value chain approach from provincial distribution centres (PDC) and community food depots, to community nutrition development centres (CNDC) that include different stakeholders such as producers (including local producers), manufacturers, wholesalers and retailers providing food, food parcels, and cooked meals for food insecure individuals and households. By 2014/15, the Department of Social Development had established nine PDCs and 140 CNDCs in all provinces, enabling access to food for more than 400,000 households and providing over three million kilograms of food supplies to more than 615 898 beneficiaries (Department of Social Development, 2015).While South Africa has several safety net programmes (e.g. child grants, old age pensions, veterans grants, and foster care grants), these attempts to improve nutritional safety nets may influence the way food environments are shaped for the poor sectors of the population.

Working paper 34, Nicole Claasen, Marinka van der Hoeven and Namukolo Covic 15
Strategic plan for preventing and controlling non-communicable diseases 2013-2017 The Department of Health’s strategic plan for preventing and controlling non-communicable diseases 2013-2017 acknowledges that unhealthy diets along with tobacco use, low physical inactivity, and alcohol abuse are the major risk factors of the NCD epidemic in South Africa. The strategy identifies several cost-effective ways to tackle unhealthy diets and obesity, including fiscal measures (e.g. taxes) along with food advertising regulations, food labelling, worksite interventions, mass media campaigns, school-based interventions, and physician counselling. With a target to reduce obesity by 10% by 2020, actions with regard to dietary changes focus on creating healthier food environments that include different role players (government, NGOs, food producers and the public) as well as a better legislation. Specific activities relating to nutrition and food environments are (1) to reduce salt intake through regulation of salt in processed foods (see more information below), and (2) to reduce the prevalence of overweight through increased access and availability of healthy foods (Department of Health, 2013a).
National road map for nutrition 2013-2017 The road map for nutrition in South Africa 2013-2017 of the Department of Health (2013b) aims to direct nutrition-related activities in the health sector by focusing on five strategies: (1) advocacy and technical support to integrate nutrition into relevant sector strategies and programmes, (2) positioning nutrition strategically within the health sector at national and provincial levels, (3) delivering key nutrition interventions through appropriate action, (4) strengthening the Human Resources to deliver effective nutrition services, and (5) strengthening the information base for effective nutrition services (Dept of Health, 2013b). The existing evidence on current unhealthy aspects of food environments in South Africa, including the growing influence of the food industry, does not find any consideration within the Road Map. In contrast, the Road Map particularly welcomes continuous work with the food industry ‘to strengthen the implementation of nutrition-related interventions’ (Dept of Health, 2013b: 26).
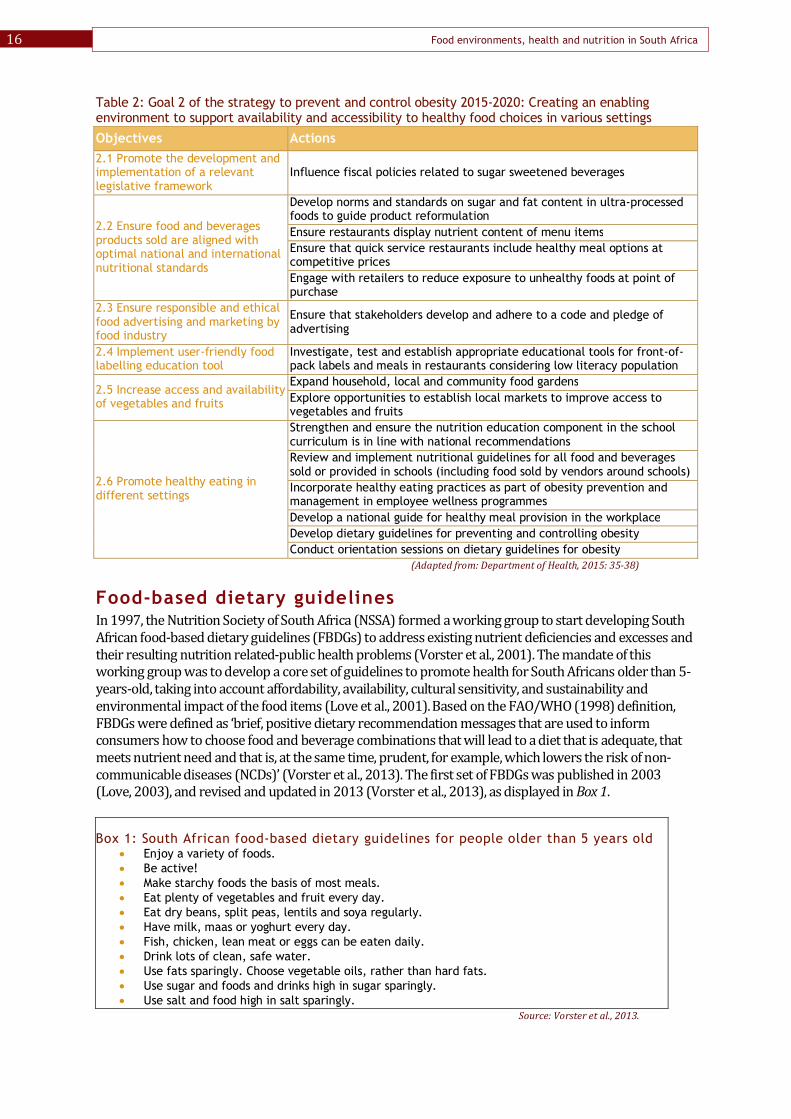
Strategy to prevent and control obesity 2015-2020 In line with the strategic plan for preventing and controlling non-communicable diseases 2013-2017 (Dept of Health, 2013a), the Department of Health recently published the strategy for the preventing and controlling obesity 2015-2020, which aims to ‘reform obesogenic environments and enablers, while enhancing opportunities for the increased physical activity and healthy food options in every possible setting’. It also sets targets to reduce obesity by 10% by 2020 (Dept of Health, 2015:17). The strategy acknowledges that an individual-based approach to behavioural change is not the only solution for combating rising obesity rates in the country and further recommends a population-based approach, focused on policy, context and environmental change. The strategy includes six broad goals: (1) supporting inter-sectorial engagement, (2) creating enabling environments, (3) increasing physical activity, (4) preventing early childhood obesity, (5) promoting community communication, education, and mobilisation, and (6) establishing surveillance, monitoring and evaluation systems. The comprehensive objectives and proposed actions with regard to creating an enabling food environment (goal 2) acknowledge the socio-ecological approach to promoting healthy food environments from specific settings (e.g. school, workplace, community and retail store environments) to legislative measures (e.g. taxing sugar sweetened beverages) (see Table 2). The strategy stresses the need for multi-stakeholder and multi-disciplinary involvement, proposing to engage different Departments (e.g. Health, Treasury, Trade and Industry, Agriculture, Education) and the media, food industry (e.g. Consumer Goods Council of South Africa, Choose Healthy Options Wisely) and academia (Department of Health, 2015). The success of this strategy remains to be seen.
16 Food environments, health and nutrition in South Africa
Table 2: Goal 2 of the strategy to prevent and control obesity 2015-2020: Creating an enabling environment to support availability and accessibility to healthy food choices in various settings
Objectives Actions 2.1 Promote the development and implementation of a relevant legislative framework
Influence fiscal policies related to sugar sweetened beverages
2.2 Ensure food and beverages products sold are aligned with optimal national and international nutritional standards
Develop norms and standards on sugar and fat content in ultra-processed foods to guide product reformulation Ensure restaurants display nutrient content of menu items Ensure that quick service restaurants include healthy meal options at competitive prices Engage with retailers to reduce exposure to unhealthy foods at point of purchase
2.3 Ensure responsible and ethical food advertising and marketing by food industry
Ensure that stakeholders develop and adhere to a code and pledge of advertising
2.4 Implement user-friendly food labelling education tool
Investigate, test and establish appropriate educational tools for front-of-pack labels and meals in restaurants considering low literacy population
2.5 Increase access and availability of vegetables and fruits
Expand household, local and community food gardens Explore opportunities to establish local markets to improve access to vegetables and fruits
2.6 Promote healthy eating in different settings
Strengthen and ensure the nutrition education component in the school curriculum is in line with national recommendations Review and implement nutritional guidelines for all food and beverages sold or provided in schools (including food sold by vendors around schools) Incorporate healthy eating practices as part of obesity prevention and management in employee wellness programmes Develop a national guide for healthy meal provision in the workplace Develop dietary guidelines for preventing and controlling obesity Conduct orientation sessions on dietary guidelines for obesity
(Adapted from: Department of Health, 2015: 35-38)
Food-based dietary guidelines In 1997, the Nutrition Society of South Africa (NSSA) formed a working group to start developing South African food-based dietary guidelines (FBDGs) to address existing nutrient deficiencies and excesses and their resulting nutrition related-public health problems (Vorster et al., 2001). The mandate of this working group was to develop a core set of guidelines to promote health for South Africans older than 5-years-old, taking into account affordability, availability, cultural sensitivity, and sustainability and environmental impact of the food items (Love et al., 2001). Based on the FAO/WHO (1998) definition, FBDGs were defined as ‘brief, positive dietary recommendation messages that are used to inform consumers how to choose food and beverage combinations that will lead to a diet that is adequate, that meets nutrient need and that is, at the same time, prudent, for example, which lowers the risk of non-communicable diseases (NCDs)’ (Vorster et al., 2013). The first set of FBDGs was published in 2003 (Love, 2003), and revised and updated in 2013 (Vorster et al., 2013), as displayed in Box 1.
Box 1: South African food-based dietary guidelines for people older than 5 years old Enjoy a variety of foods. Be active! Make starchy foods the basis of most meals. Eat plenty of vegetables and fruit every day. Eat dry beans, split peas, lentils and soya regularly. Have milk, maas or yoghurt every day. Fish, chicken, lean meat or eggs can be eaten daily. Drink lots of clean, safe water. Use fats sparingly. Choose vegetable oils, rather than hard fats. Use sugar and foods and drinks high in sugar sparingly. Use salt and food high in salt sparingly.
Source: Vorster et al., 2013.

Working paper 34, Nicole Claasen, Marinka van der Hoeven and Namukolo Covic 17
The FBDGs were adopted by the South African Department of Health, Directorate of Nutrition and the messages aligned with a food guide – an illustration that aims to support consumer education about healthy eating as suggested by Keller and Lang (2007). The food guide (see Figure 4) displays the seven food groups that should be eaten regularly: starchy foods; vegetables and fruits, dry beans, peas, lentils and soya; chicken, fish, meat and eggs; milk, maas, yoghurt; fat and oil; and water. The figure represents different food group circles, with the proportional size symbolically reflecting the proportion volume that should be eaten as part of a daily diet (Vorster et al., 2013).
Figure 4: South African food guide
Source: South African Department of Health, Directorate of Nutrition, as used in Vorster et al., 2013.
The FBDGs and the food guide are meant to be applicable to South Africa’s diverse population with different cultural backgrounds and income levels. However, evidence is needed as to whether the simplification of the South Africa’s diverse diets, as applied in the FBDGs and food guide, provide a meaningful education tool for healthy eating. Further, the schematic and basic display of processed and packaged foods in the food guide could be viewed as controversial against a background of increasing evidence of their negative health implications. Further, the recent salt legislation aimed at reducing the amount of salt added to processed foods emanated from evidence that the bulk of salt intake among most of the population comes from processed foods such as bread, breakfast cereals, butter and spreads, and processed meats (RSA, 2013). To date, only limited studies testing the effectiveness of FBDGs have been conducted, mainly in the Kwa-Zulu Natal and Western Cape provinces (Love et al., 2001, Love et al., 2008). A more recent study showed that implementing the FBDGs and optimising the school physical environment are important strategies to improve school nutrition by educators from the Western Cape. Twelve public schools with 256 participating educators indicated that FBDG were appropriate for school children (94%), could be used as an education tool (97%) and fill gaps in the current curriculum about healthy dietary habits (91%). Educators' workload (61%), insufficient time (46%), learners' disadvantaged background (43%) and educators' lack of knowledge (33%) form the most relevant barriers to implementing FBDGs (Nguyen et al., 2015).

18 Food environments, health and nutrition in South Africa
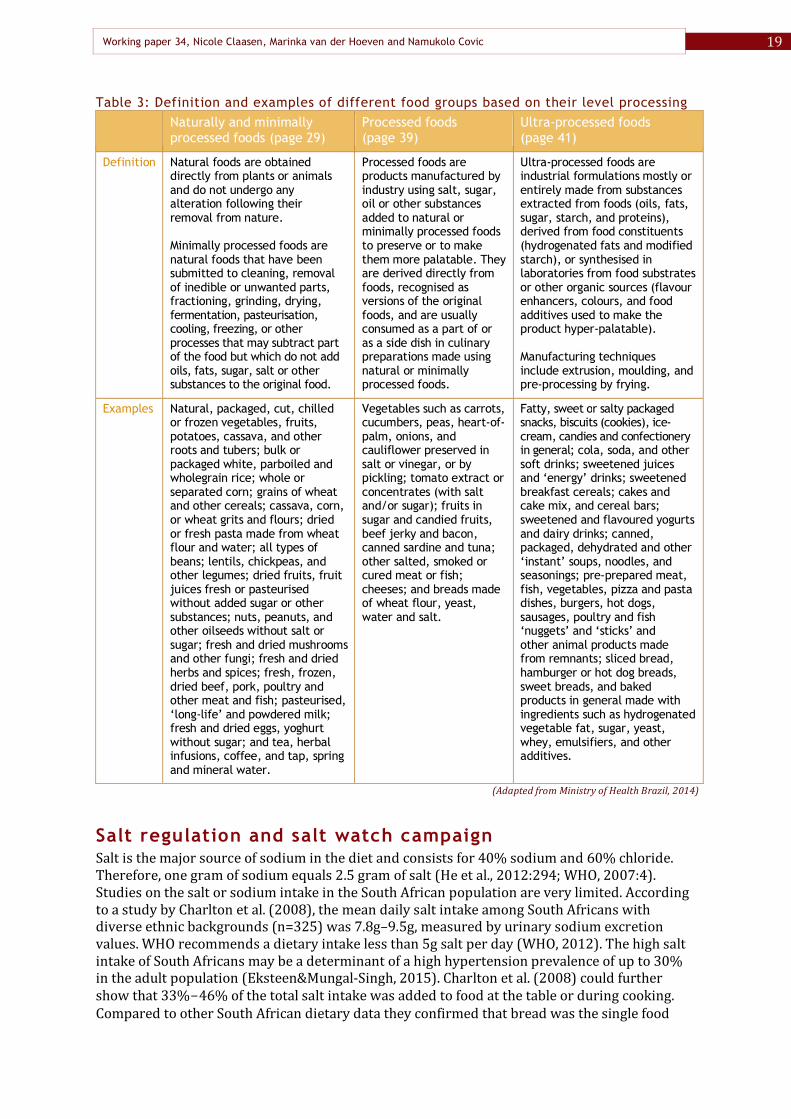
Earlier we indicated that a study done by Faber et al., (2014) found that only 15% of school teachers reported having had any form of nutrition education. So although the FBDGs may be a useful educational tool the capacity of the current school setting to take advantage of this is rather limited. The FBDGs are implemented and promoted by the South African Department of Health, Directorate of Nutrition. Since testing and implementing the first set up, and recent revisions in 2013, a number of stakeholders from government, academia, nutrition professionals and food industry were involved in developing the FBDGs, such as the NSSA, Association for Dietetics in South Africa (ADSA), South African Medical Research Council, North-West University - Potchefstroom, Dry Bean Producers Organisation, South African Sugar Association, and the South African Meat Board (Vorster, et al., 2001, Vorster, et al., 2013). Recently, public media has increasingly criticised the relations between ADSA, NSSA and the food industry and the extent to which they may impact on the kind of dietary advice provided by nutrition professionals in the country. Further exploration of the impact of these relations is needed. Recently, Brazil introduced dietary guidelines that apply a novel approach to inform consumers about eating and promote ‘health and well-being of people, families, communities, and the whole Brazilian population, now and in future’ (Ministry of Health of Brazil, 2014:11). In contrast to established food-based dietary guidelines, Brazil’s dietary guidelines focus on preparing and eating whole meals, strongly considering cultural and social dimensions as well as socially-fair and sustainable food systems. Instead of dividing foods in different food groups (e.g. starchy foods, fruits and vegetables, meat, dairy, fats and oils) the new guidelines categorise foods according to different levels of processing: natural or minimally processed foods, processed foods, and ultra-processed foods (see Table 3). The recommended golden rule is: always prefer natural or minimally processed foods and freshly made dishes and meals to ultra-processed foods (Ministry of Health of Brazil, 2014:47). Further, the Brazilian dietary guidelines do not use a food guide but display healthy meal options (see Figure 5) and highlight the importance of culinary preparation and eating in appropriate environments and company (Ministry of Health of Brazil, 2014). Seeing Brazil’s progressive approach for promoting healthy and sustainable diets, a comparative assessment between Brazil and South Africa could be of value to depict possible positive trends by the implementation of the new dietary guidelines.
Figure 5: Example of healthy meal options as displayed in the Brazilian dietary guidelines
Source: Ministry of Health Brazil, 2014.
Working paper 34, Nicole Claasen, Marinka van der Hoeven and Namukolo Covic 19
Table 3: Definition and examples of different food groups based on their level processing Naturally and minimally
processed foods (page 29) Processed foods (page 39)
Ultra-processed foods (page 41)
Definition Natural foods are obtained directly from plants or animals and do not undergo any alteration following their removal from nature. Minimally processed foods are natural foods that have been submitted to cleaning, removal of inedible or unwanted parts, fractioning, grinding, drying, fermentation, pasteurisation, cooling, freezing, or other processes that may subtract part of the food but which do not add oils, fats, sugar, salt or other substances to the original food.
Processed foods are products manufactured by industry using salt, sugar, oil or other substances added to natural or minimally processed foods to preserve or to make them more palatable. They are derived directly from foods, recognised as versions of the original foods, and are usually consumed as a part of or as a side dish in culinary preparations made using natural or minimally processed foods.
Ultra-processed foods are industrial formulations mostly or entirely made from substances extracted from foods (oils, fats, sugar, starch, and proteins), derived from food constituents (hydrogenated fats and modified starch), or synthesised in laboratories from food substrates or other organic sources (flavour enhancers, colours, and food additives used to make the product hyper-palatable). Manufacturing techniques include extrusion, moulding, and pre-processing by frying.
Examples Natural, packaged, cut, chilled or frozen vegetables, fruits, potatoes, cassava, and other roots and tubers; bulk or packaged white, parboiled and wholegrain rice; whole or separated corn; grains of wheat and other cereals; cassava, corn, or wheat grits and flours; dried or fresh pasta made from wheat flour and water; all types of beans; lentils, chickpeas, and other legumes; dried fruits, fruit juices fresh or pasteurised without added sugar or other substances; nuts, peanuts, and other oilseeds without salt or sugar; fresh and dried mushrooms and other fungi; fresh and dried herbs and spices; fresh, frozen, dried beef, pork, poultry and other meat and fish; pasteurised, ‘long-life’ and powdered milk; fresh and dried eggs, yoghurt without sugar; and tea, herbal infusions, coffee, and tap, spring and mineral water.
Vegetables such as carrots, cucumbers, peas, heart-of- palm, onions, and cauliflower preserved in salt or vinegar, or by pickling; tomato extract or concentrates (with salt and/or sugar); fruits in sugar and candied fruits, beef jerky and bacon, canned sardine and tuna; other salted, smoked or cured meat or fish; cheeses; and breads made of wheat flour, yeast, water and salt.
Fatty, sweet or salty packaged snacks, biscuits (cookies), ice-cream, candies and confectionery in general; cola, soda, and other soft drinks; sweetened juices and ‘energy’ drinks; sweetened breakfast cereals; cakes and cake mix, and cereal bars; sweetened and flavoured yogurts and dairy drinks; canned, packaged, dehydrated and other ‘instant’ soups, noodles, and seasonings; pre-prepared meat, fish, vegetables, pizza and pasta dishes, burgers, hot dogs, sausages, poultry and fish ‘nuggets’ and ‘sticks’ and other animal products made from remnants; sliced bread, hamburger or hot dog breads, sweet breads, and baked products in general made with ingredients such as hydrogenated vegetable fat, sugar, yeast, whey, emulsifiers, and other additives.
(Adapted from Ministry of Health Brazil, 2014)
Salt regulation and salt watch campaign Salt is the major source of sodium in the diet and consists for 40% sodium and 60% chloride. Therefore, one gram of sodium equals 2.5 gram of salt (He et al., 2012:294; WHO, 2007:4). Studies on the salt or sodium intake in the South African population are very limited. According to a study by Charlton et al. (2008), the mean daily salt intake among South Africans with diverse ethnic backgrounds (n=325) was 7.8g–9.5g, measured by urinary sodium excretion values. WHO recommends a dietary intake less than 5g salt per day (WHO, 2012). The high salt intake of South Africans may be a determinant of a high hypertension prevalence of up to 30% in the adult population (Eksteen&Mungal-Singh, 2015). Charlton et al. (2008) could further show that 33%-46% of the total salt intake was added to food at the table or during cooking. Compared to other South African dietary data they confirmed that bread was the single food

20 Food environments, health and nutrition in South Africa
item that contributed the most toward the non-discretionary source of salt (25-40% of daily salt intake). Bertram et al. (2012) showed the potential positive effect of a salt reduction policy on the number of fatal cardiovascular diseases (CVDs) and non-fatal strokes in South Africa. Lowering the salt content of bread, margarine, soup and seasoning, could prevent 8% of strokes, 6.5% of ischemic heart disease, and 11% of hypertensive heart disease, resulting in 7,400 fewer deaths from CVDs and 4,300 fewer non-fatal strokes (Bertram et al., 2012). As response to the alarming salt intake figures and related public health concerns, the South African Summit on the Prevention and Control of NCDs in 2011 gave the public and private sector, academia and civil society an opportunity to give input to develop strategies and targets to improve the situation regarding NCDs in South Africa. The outcome was a declaration to reduce the salt intake in the general population from 8g-10 g per day (current level in 2011) to less than 5g per day in 2020 which was then included in the strategic plan to prevent and control NCDs in South Africa (SA Summit on Prevention and Control of NCDs, 2011). In March 2013, the Department of Health gazetted regulations related to reducing sodium in certain foods (RSA, 2013). Sodium reduction will be implemented in two phases in 2016 and 2019, to allow consumers to adapt to the taste of lower-sodium foods (Hofman&Lee, 2013). The types of targeted food products and sodium reduction targets are summarised in Table 4.
Table 4: Maximum limits of sodium content in targeted food products by respective deadlines Foodstuff category 2010 Baseline 30June 2016 30 June 2019 Bread 528 mg 400 mg 380 mg Breakfast cereals and porridges 638 mg 500 mg 400 mg Butter and spreads such as margarine 867 mg 550 mg 450 mg Savoury snacks (excluding salt and vinegar flavour) 1000 mg 800 mg 700 mg
Flavoured potato crisps (excluding salt and vinegar flavour) 1067 mg 650 mg 550 mg
Salt and vinegar flavoured snacks and potato crisps 1730 mg 1000 mg 850 mg
Cured processed meat 1596 mg 650 mg 850 mg Raw processed meat, sausages & similar products 1061 mg 800 mg 600 mg
Source: Republic of South Africa, 2013. According to Hofman & Lee (2013), the food industry opposed salt regulation in different ways during the consultation process. Based on the fact that most global initiatives on reducing sodium use voluntary compliance rather than mandatory regulations, representatives of the food industry tried to negotiate for a voluntary compliance of a salt reduction policy in South Africa. Industry representatives further tried to redirect the responsibility away from the food industry to the consumers by emphasising the need for behavioural action rather than policy regulations. Further arguments presented by the food industry were that South Africa was turning into a ‘nanny state’ and that limiting sodium negatively impacts appropriate texture, taste and shelf life of food products. Academics, on the other hand, provided valuable information counteracting the industry’s fears after which the legislation was adopted. To complement the salt legislation action, the Department of Health engaged the Heart and Stroke Foundation South Africa (HSFSA) to coordinate a Salt Watch working group and run a campaign to reduce population salt intake through national awareness programmes and behaviour changes in order to achieve a greater legislative impact on public health. Members of this working group include the HSFSA, North-West University, NSSA, ADSA, CGCSA, the South African Medical Research Council and the University of Pretoria (Eksteen&Mungal-Singh, 2015). Interestingly, the food industry – including Willowton Group, Unilever, Tiger Brands, Spur, and Oceana Brands – greatly fund the HSFSA (HSFSA, 2016).

Working paper 34, Nicole Claasen, Marinka van der Hoeven and Namukolo Covic 21
National food fortification programme Food fortification is defined by the WHO and FAO (2006:xxvii) as ‘the practice of deliberately increasing the content of an essential micronutrient, i.e. vitamins and minerals (including trace elements) in a food, so as to improve the nutritional quality of the food supply and provide a public health benefit with minimal risk to health’. In developed countries food fortification has been shown to be an effective, low-cost strategy to increase micronutrient intake and reduce the consequences of micronutrient deficiencies (Dary et al., 2002). Historically the South African vitamin A consultative group in 1994 showed South African children had a high prevalence of micronutrient deficiencies including those of iron, zinc and vitamin A. Subsequently, the 1999 NFCS showed that South African children (1-9 years) had low micronutrient intake (Labadarios et al., 2005a). On the basis of the 1999 NFCS results a decision was taken to put in place mandatory food fortification and to inform the choice of food vehicles for the national fortification programme. Then the NFCS-FB-1 of 2005 which serves as the fortification baseline demonstrated that micronutrient deficiencies still persisted (Labadarios et al., 2007). However, this must be interpreted cautiously because the food fortification only came into effect towards the end of 2003 and it could have taken some time to get to full fortification exposure across the country. Small localised studies on primary school children after 2005 seem to indicate a more positive picture, at least for anaemia (Taaljard et al., 2013). The SANHANES-1 (Shisana et al., 2014) confirmed that the situation may have improved with respect to iron, zinc and vitamin A. Since 2003 it has been mandatory for all maize meal and wheat flour to be fortified with a micronutrient mix in South Africa (see Table 5). Fortified food items are indicated with a logo (see Figure 6) on their packaging and advertising material. The logo and accompanying health claim may be used voluntarily (Editorial office SAJCN, 2003). Maize meal and wheat flour are fortified to provide people >10 years old the following percentages of the Recommended Daily Allowance (RDA) per 200g of raw maize meal/wheat flour: vitamin A (31%), thiamin (25%), niacin (25%), pyridoxine (25%), folate (50%), riboflavin (17% from maize and 20% from wheat flour), iron (25% from unsifted maize meal and 50% from maize meal), and zinc (20%) (Labadarios et al., 2005b).
Table 5: Fortification micronutrient mix specification
Fortificants Wheat flour (g/kg)
Maize meal (g/kg)
Unsifted maize meal (g/kg)
Vitamin A Palmitate, 250 000 IU/g 119.04 138.88 138.88 Thiamin mononitrate 12.34 13.93 13.93 Riboflavin 8.90 8.50 8.50 Nicotinamide 118.40 125.00 125.00 Folic acid 7.15 7.15 7.15 Pyridoxine HCL 16.24 19.32 19.32 Electrolytic iron 178.57 178.57 89.28 Zinc oxide (min. 80% activity) 93.40 93.40 93.40
Calcium carbonate (min. 40% activity) * * *
* calcium carbonate is used as a carrier for the added fortificants and its amount is therefore depended on the weight of the fortificants. The calcium carbonate will "fill up" the mixture up to 1 kg.
Source: RSA, 2002.
Figure 6: Logo used to indicate a food item fortified according to the mandatory food fortification legislation in South Africa
Source: Editorial Office SAJCN, 2003.

22 Food environments, health and nutrition in South Africa
Steyn et al. (2008a, b) stipulated that with implementing national fortification of the two most commonly consumed staple foods, the micronutrient intake and the overall micronutrient density of the diet of children aged 1-9 years and adults, would improve substantially (Steyn et al., 2008a,b). Yet, a reflection report on the South African maize meal and wheat flour fortification programme from 2004 to 2007 indicated the following challenges: stability of some micro-nutrients in the fortification mix, the loss of micronutrients over time or due to sunlight exposure and the poor monitoring of mills and fortification mix manufacturers, suppliers, and importers (Dept of Health &UNICEF SA, 2007). Following the concerns of the reflection report, several more studies confirmed that the current fortification mix may not be effective in improving the micronutrient status. For example, van Stuijvenberg et al. (2008) found that the current levels of electrolytic iron used as fortificant in bread may not improve the iron or haemoglobin status and this may be applicable to maize meal as well (van Stuijvenberg et al., 2008). Yusufali et al. (2012) found that the fortification micronutrient mix in both maize and bread flour was inadequate for vitamin A, iron and nicotinamide at retail level. These studies indicate that the South African food fortification programme has not yet been optimised. Furthermore, there is a research gap on the effect of the fortification programme on the nutritional status.
Food prices and pricing strategies Research by Temple and Steyn (2011) showed that a healthy diet was unaffordable to most South Africans. When replacing less healthy foods of a typical South African diet with healthier options (e.g. corn flakes with bran flakes, white bread with brown bread) the costs increase by an average of 65%. Foods with high energy density but low micronutrient density (e.g. sugar, cookies, peanut butter) are often lower in costs per unit of dietary energy (Rand per megajoule) compared to foods with low energy density but high micronutrient density (e.g. raw vegetables, fish) that are often found to be more expensive per dietary energy. This partially explains why poor people are more likely to opt for low cost foods with high energy density but low micro-nutrient density that can satisfy hunger, yet making them prone to obesity and related NCDs. Nevertheless, Temple and Steyn (2011) stressed that not all low cost foods need to be low in micronutrient density. They illustrated a number of foods with higher micronutrient density at low or intermediate costs, such as lentils, beans, oats, milk, vegetables, apples, or canned pilchards. Hence, if consumers carefully select foods it is feasible to make affordable and healthy food choices. Consumer education on healthy diets and affordability is crucial, especially when targeting low income households. It was concluded that food costs represented a barrier to successful health-promotion campaigns and government interventions were needed using tools like taxation and subsidies to impact food prices favourably for the poor (Temple and Steyn, 2011). On the role of pricing policy options to stimulate healthy eating in South Africa, Mkhabela (2013) explored the opinions of different experts from academic research, agri-business as well as governmental and non-governmental public policy groups. Four pricing strategies were enumerated by the participants, including taxes, government interventions and insurance systems, packaging, and price and discount strategies. The top ranked strategies by experts were in the packaging, price and discount strategies, for example, offering an additional healthy product or gift, no discount, or a price increase on unhealthy foods, discount stickers or discount cards for low income households, and price cuts on healthy food (see Table 6). Notably, Mkhabela (2013) points out that experts ranked options higher when they did not have to carry the responsibility themselves. For example, government experts favoured industry-performed strategies while industry experts favoured government-performed strategies (Mkhabela, 2013). Taxation is one of the most discussed pricing strategies in research on food environments. In 1991, South Africa introduced a broad-based value added tax (VAT) of 10% 1993 the rate increased to 14%. It includes a basket of zero-rated food stuff (see Box 2) to alleviate the tax burden of poor households.

Working paper 34, Nicole Claasen, Marinka van der Hoeven and Namukolo Covic 23
Table 6: Top 20 ranked price strategies for stimulating healthy eating Pricing strategy categories Strategies rated with most effectiveness Rank Taxes Putting healthy food options at a lower VAT 13
Government interventions and insurance system
Extra food allowance for low income groups Indirect discounts for low income consumers Government allowance to retailers
17 20 14
Packaging (offers and presentation)
Post with recipes Offering an additional healthy product Offering small gifts or extras Two healthy products for the price of one Saving stamps on healthy food No discount on unhealthy foods
18 1 2 3 11 4
Price and discount strategies
Frequent specials on healthy food options Sudden price increase for unhealthy foods Combination discount Healthy options at lower prices Special discount stickers Healthy food coupons for low income households Healthy food discount card for low income households Price cuts on healthy food items Bulk discount on healthy foods Reducing portion sizes of unhealthy foods
16 5 6 15 7 12 8 9 10 13
Adapted from: Mkhabela, 2013. Box 2: Zero-rated food stuff according to Value-Added Tax Act No. 89 of 1991 Brown bread, maize meal, samp, mealie rice, dried maize, dried beans, lentils, pilchards (excluding pet food or sardines supplied in tins), milk powder (unflavoured), dairy powder blend, rice, fresh vegetables (excluding canned, bottled and dehydrated), fresh fruit (excluding canned, bottled and dehydrated), vegetable oil used for cooking (excluding olive oil), milk including long-life milk (excluding condensed, flavoured, sweetened and evaporated milk), cultured milk, brown wheaten flour, raw eggs, edible legumes and pulses. In addition, paraffin is also zero-rated. However VAT, which has not changed since its implementation, is regarded as having a regressive impact on poor households despite zero-rating. Experts call for a new assessment of VAT because consumption patterns are changing over time and several policies and programmes on poverty reduction and income redistribution have been implemented (Jansen&Calitz, 2015). Using the example of vegetables, Jansen et al. (2013) show that besides “basic” fresh vegetables (e.g. spinach, cabbage, tomatoes) canned and frozen vegetables are also often purchased by poorer households, based on StatsSA’s 2005/06 Income and Expenditure Survey. On the other hand, other or more “luxurious” fresh vegetables (e.g. lettuce, cauliflower, broccoli, cucumber, marrows, mushrooms) that are also zero-rated are more likely consumed by middle and higher income households. Hence, it is suggested that zero-rating of canned vegetables would benefit poorer households. Rough calculations on tax revenue suggest this will imply a loss in revenue which however could be buffered by taxing other or ‘luxurious’ types of vegetables mainly consumed by richer households. Regular assessment of the appropriate basket for zero-rated food stuffs in favour of poorer households needs to be done on a more regular basis. Research is also needed on whether zero-rating really benefits the end-consumer or is absorbed by the distribution chain (Jansen et al., 2013). When addressing the trade-offs of fiscal policy in terms of lost revenue to governments the long term benefits of reducing the financial burden on national budgets is overlooked. When comparing the costs and benefits of VAT zero-rating with key social assistance programmes (e.g. old age pensions and child support grants), Jansen and Calitz (2015) concluded that social assistance programmes were better targeted and more effective from a cost- benefit- point of view than zero-rating. It has been argued that zero-rating favours the

24 Food environments, health and nutrition in South Africa
poor, yet the entire population benefits from it simply by purchasing the given products. Such distortions would be addressed if zero-rating was removed and replaced with better targeted social assistance programmes. The money saved may in turn allow better focus on targeted social transfers where the equity gains would be much higher (Jansen&Calitz, 2015). Manyema et al. (2014) applied a mathematical model to calculate the potential impact of a 20% tax on sugar-sweetened beverages (SSBs) on obesity in South Africa. The model compares the current situation with a counterfactual situation in which increased prices of SSBs are assumed to affect individual consumption and weight gain until they are in a new equilibrium. The model does not stipulate the effect over time of the intervention. Based on their calculations, a 20% tax on SSBs could reduce obesity by 3.8% in men and by 2.4% in women, with the total number of obese adults decreasing by over 220,000. It is argued that fiscal policies could have an effective impact on obesity but should be part of a multifaceted and inter-sectorial approach to reducing obesity and related NCDs. Further, revenues from this type of tax could contribute to relieving the pressure on the health system and supporting public health programmes. However, it was also urged to explore public opinion with regard to knowledge and perceptions on the suggested fiscal measures to tackle obesity in South Africa (Manyema et al., 2014). On 24 February 2016, Finance Minister Pravin Gardhan announced in his budget speech plans the introduction of a tax on sugar-sweetened beverages in 2017 (Treasury, 2016). While this may have been surprising for many South Africans, this action is in line with the strategy for the prevention and control of obesity 2015-2020 (Department of Health, 2015; see above). At this point the proposed tax rate is however not yet known. The Beverages Association of South Africa has already meanwhile disputed the sugar tax arguing that it will harm small business and mainly affects the poor negatively (BevSA, 2016). Critics said that a 10% sugar tax may have little effect on prices of sugary-drinks that are already held artificially low by big companies, such as Coca-Cola, and could have unintended adverse effects for smaller local producers of similar products. Further, it was suggested that a tax on junk food should be introduced simultaneously with the proposed sugar tax to promote measurable population benefits, following the example of Mexico (Bakermarch, 2016). In Mexico a tax on SSB (1 peso per liter; translating into slightly less than 10% tax) was implemented in 2014. One year after its introduction there has been a 12% reduction in SSB purchases and a 4% increase in purchases of non-taxed beverages, mainly bottled plain water (Colchero et al., 2016). Whether this would have similar impact in South Africa remains to be seen. Another example of a nationwide price intervention to promote healthy food choices by the private sector is the HealthyFood programme of the South African health insurer Discovery, offering up to 25% rebates on healthy food purchases for its Vitality members. Once registered and activated, members receive an immediate 10% rebate on healthy foods at Pick ‘n Pay or Woolworth stores, which can be increased to a 25% rebate after the completion of an online questionnaire (Discovery, 2015a). HealthyFood guides for the respective stores provide a detailed list of food items that are available for rebate. A team of nutrition and health experts selected the listed food items based on latest dietary guidelines and independently of brands. It has been reported that no collaborations were formed with suppliers or manufacturers for this programme (Discovery, 2015b, c). Sturm et al. (2013) used Pick ‘n Pay scanner data between 2009 and 2012 linked to 170,000 households - of which 60% were eligible of the HealthyFood rebate - to examine the effect of price incentives on grocery shopping behaviour. It was found that participation in the programme led to increased purchases of healthy foods by 6% and 9.3% of total expenditure in the 10% and 25% rebate programmes, respectively. Expenditures on fruit and vegetables to total expenditure also increased (5.7% and 8.5%, respectively) and decreased for less desirable foods (5.6% and 7.2%, respectively) (Sturm et al., 2013).

Working paper 34, Nicole Claasen, Marinka van der Hoeven and Namukolo Covic 25
An et al. (2013) investigated self-reported changes of dietary consumption and weight status of participants of the HealthyFood programme. Data was used from Discovery’s health risk assessment questionnaire that needs to be filled in annually by participants in order to keep their 25% rebate. Findings show that participation in the HealthyFood programme was associated with higher consumption of fruits and vegetables, and wholegrain foods, and decreased consumption of less healthy foods (e.g. sugary and salty foods, fried foods, processed meats, and fast-food). There was no association between programme participation and obesity prevention though. While the findings showed the substantial effectiveness of price interventions, it is cautioned that the data are based on a few individuals who are eligible for the HealthyFood benefit (An et al., 2013, Sturm et al., 2013).
Food product labelling In South Africa food product labelling is regulated under R 146 of the Foodstuffs, Cosmetics and Disinfectants Act of 1972, that came into effect in 2012 (Igumbor et al., 2012). Nutrition labelling remains voluntary but regulations require a standard format if nutrition labels are used. Strict criteria are applied when statements such as ‘A source of…’, ‘Low in…’, ‘Virtually free of…’, or ‘Free of…’ are used. Food companies, such as Tiger Brands, Spar, and Coca Cola use Guideline Daily Amounts (GDA) labelling, entailing the quantity of specific nutrients in the product and the recommended daily allowance (Igumbor et al., 2012). Consumer perceptions and knowledge of food product labels are not very well researched in South Africa; existing studies are exploratory and non-representative of the South African population. A study in Klerksdorp and Potchefstroom in the North-West Province (Jacobs et al., 2011) (n=174 adult consumers) showed that information mostly used on food labels by consumers included the expiry date, the list of ingredients, and nutritional information referring to fat and cholesterol. Participants encountered difficulties in using food labels because of inadequate information supporting diet-related health conditions (70%), difficulties in understanding the nutritional information (48%), font size too small (41%), and confusing terms used in ingredient lists (41%). Reasons for not reading food labels were preference of product attributes (such as taste and price, 75% and 74%, respectively), habitual purchasing patterns (73%) and no time to read food labels (72%). Suggestions by participants to improve food labels were concerned with improved readability (e.g. use of colour and logos, more languages, larger font size), improved information for understanding the nutrition information (e.g. less complex terminology), and communicating the importance of food labels (e.g. through education in schools, media, in-store information) (Jacobs et al., 2010). Another study in Potchefstroom (van der Merwe et al., 2012) (n=229 adult consumers; 68% Afrikaans speaking) highlights that 69% of consumers were aware of food label legislation and read labels when making a first time purchase (70%). While most consumers were able to locate and manipulate label information (86%), identify symbols (97%) and some nutrient content claims (e.g. ‘high in Vitamin A’, ‘trans-fat free’; 98% and 97%, respectively), only 19% could correctly identify some permissible health/nutrition claims and false claims (e.g. ‘wholesome’, ‘95% fat free’) (van der Merwe et al., 2012). A review of research on consumer and industry response to nutrition labelling in the global South (including South Africa) by Mandle et al. (2015) pointed out that consumers preferred to have nutrition labelling on packaged food products but use and comprehension was low due to difficulties in interpreting the information. Evidence on the industry response in the global South was limited but suggested that industry involvement in legislation concerning front-of-package information may reduce the regulatory strength of labelling policy, leading to labels being smaller and more difficult to interpret for consumers. Another matter of concern is that product reformulations may lead to food products with healthier composition which carry respective front-of-package claims. These food products, however, are still ultra-processed products which are associated with changing dietary patterns and diet-related diseases (Mandle et al., 2015).

26 Food environments, health and nutrition in South Africa
6. CONCLUDING REMARKS South African research does not address food environments comprehensively, tending to focus on single aspects such as the situation at home, school, community and retail settings. Associations between food environments, the role of the food industry, the food choices and behaviour of consumers remain under-researched. South Africa has a fairly advanced policy framework to create healthier food environments for preventing and controlling obesity and NCDs as well as addressing micronutrient deficiencies at population level. Policies and programmes, however, remain largely unevaluated and the high prevalence of obesity, related NCDs and micronutrient deficiencies question their effectiveness. Based on the information provided in this document the following areas for further research and policy recommendations are given below.
Recommendations for further research Regular national food consumption survey data: Undertake regular national food
consumption surveys to fill the knowledge gap on changes in food consumption among different economic, age, ethnic or geographical groups in South Africa. In particular, shift away from analysing only nutrient intake of food consumption towards considering what foods people eat, and analysing food products and systematic food-based processing levels.
Rigorous and longitudinal research designs to investigate the impact of food environments: Research on South African food environments mostly assume negative impacts on nutrition and health, but no rigorous measures and longitudinal evidence linking food environments with direct nutritional outcomes are available. In addition, little is known about what really drives food consumption patterns across different socio-economic settings.
Transdisciplinary and collaborative research approaches: Research on food environments should shift towards trans-disciplinary collaborative approaches, particularly between nutrition and consumer sciences, sociology, psychology, environmental sciences and economics, including various stakeholders from the private, public, and civil society sector. Only by adopting trans-disciplinary approaches can we develop a holistic understanding of food environments.
Food industry and UPPs: Adopt new research approaches to investigate the increasing commercialisation of the food sector, along with aggressive marketing strategies and the omnipresence of UPPs, in order to provide evidence on the impact on consumers’ food choices and dietary intake. It is particularly important to acknowledge the influential role that the South African food industry plays in the research agenda because it funds research, scientific conferences, and nutrition professionals.
Home food environment: More research is needed on household dietary and culinary practices (e.g. number of meals, place and times of meal consumption, joint family meals, time used to prepare meals, decision-making processes), and the food and nutrition knowledge transfer between old and young family members.
School food environments: Many studies describe unfavourable food environments in and around schools. Investigate the barriers to healthier school food environments for pupils, teachers, and food vendors.
Community and food retail environment: Undertake more research on the community and food retail environment and its impact on the food choices, dietary intake and nutritional status of South African consumers. Holistically investigate the different food environments for different cultural, socio-economic, and geographic groups to obtain a full perspective on food environments and nutrition in South Africa.
Sustainability of food environments: Prioritise research on food sustainability concerns and related food systems that shape South African food environments.

Working paper 34, Nicole Claasen, Marinka van der Hoeven and Namukolo Covic 27
Cultural and traditional food environments: Increase research on the perceptions, attitudes and practices as well as the nutritional value of street foods, traditional and indigenous foods. Undertake in-depth research on the drivers of changing diets from traditional - using mainly minimally processed foods - to modern diets, based on a variety processed and ultra-processed foods.
Food-based dietary guidelines: Collect evidence on the effectiveness of the 2013 up-dated South African FBDGs in nutrition and consumer education. Consider new approaches to dietary guidelines as introduced by the Brazilian Department of Health in the South African context. Assess South African’s nutritional literacy to gain much needed insights into improvements to nutrition education strategies. School teachers’ partial exposure to nutrition education is concerning as it limits schools’ ability to leverage current policies that aim to address nutrition in the school environment. It is therefore important to examine the effect of providing nutrition education to school teachers on nutrition behaviour change in school environments.
Mediatisation of food environments: Give more attention to the influence of media (commercial advertising and entertainment media) on food choices and culinary practices.
Effect of food fortification on nutritional status: Remedy the evidence gap regarding the adequacy of the national micronutrient food fortification of maize meal, wheat flour and bread, also exploring the local considerations of the national micronutrient fortification programme.
Pricing strategies for healthier food environments: Criticism has been raised about the effectiveness of the implemented zero-rating of food stuffs to alleviate the tax-burden of poor South African households; this needs further research. The recently announced tax for sugar-sweetened beverages will create a good ground to research the effects of a fiscal strategy on dietary consumption patterns, which had success in Mexico. However, an urgent baseline study is needed before the legislation takes effect to be able to assess progress over time.
Food labeling: No national representative data on consumers’ interpretation and understanding of food labels exists; therefore, research is needed to assess how food labelling can support food choices that will promote healthier diets.
Policy recommendations Strengthen inter-departmental approaches to creating healthy food environments.
Strengthen monitoring and evaluation frameworks to implant existing policies and programmes and ensure accountability mechanisms, including penalties.
Collaborate with civil society movements and media to improve consumer nutrition awareness and literacy.
Increase awareness and monitoring of the influence of the food industry on the nutrition landscape in South Africa (e.g. marketing to children, aggressive advertising strategies in resource-poor communities, and involvement in nutrition research).
Set and define nutrition standards for ‘healthy’ and ‘unhealthy’ foods, considering new approaches such as the Brazilian example of categorising based on the level of food processing.
Formulate legislation to improve access and availability of fresh and minimally processed foods.
Introduce stricter and better controlled regulations for advertising unhealthy foods and drinks.
Prioritise healthy food environments for young South Africans (e.g. school regulations for healthy food environments, healthy end of purchase aisles, and advertising to children).
Revise food label regulations, considering consumer difficulties in understanding current labels.

28 Food environments, health and nutrition in South Africa
REFERENCES 1. Abrahams, Z., De Villiers, A., Steyn, N.P., Fourie, J., Dalais, L., Hill, J., Draper, C.E. & Lambert, E.V. 2011. What’s
in the lunchbox? Dietary behaviour of learners from disadvantaged schools in the Western Cape, South Africa. Public Health Nutrition, 14, 1752-1758.
2. An, R., Patel, D., Segal, D. & Sturm, R. 2013. Eating better for less: a national discount program for healthy food purchases in South Africa. American Journal of Health Behaviour 37(1): 56-61.
3. Bakermarch, V. 2016. Gordhan should broaden sugar tax to junk food. Business Day Live – Opinion & Analysis (17 March). Available at: http://www.bdlive.co.za/opinion/2016/03/17/gordhan-should-broaden-sugar-tax-to-junk-food
4. Battersby, J., & Peyton, S. 2014. The geography of supermarkets in Cape Town: Supermarket expansion and food access. Urban Forum, 25(2): 153-164.
5. Bertram, M. Y., Steyn, K., Wentzel-Viljoen, E., Tollman, S. & Hofman, K.J. 2012. Reducing the sodium content of high-salt foods: Effect on cardiovascular disease in South Africa. Africa Medical Journal, 102(9): 743-745.
6. BevSA (2016). BevSA response to proposed sugar tax (press release, 25 February) Centurion: BevSA. Available at: http://www.bevsa.co.za/2016/02/25/bevsa-response-to-proposed-sugar-tax/
7. Campbell, P. T. 2011. Assessing the knowledge, attitudes and practices of street food vendors in the city of Johannesburg regarding food hygiene and safety. Doctoral dissertation, University of the Western Cape.
8. Cassim, S. B. 2010. Food and beverage marketing to children in South Africa: mapping the terrain. South African Journal of Clinical Nutrition, 23(4).
9. Charlton, K.E., Steyn, K., Levitt, N.S., Peer, N. & Johanthan, D. 2008. A food-based dietary strategy lowers blood pressure in a low socio-economic setting: a randomized study in South Africa. Public Health Nutrion, 11(12): 1397-1406.
10. Colchero, M. A., Popkin, B. M., Rivera, J. A., & Ng, S. W. 2016. Beverage purchases from stores in Mexico under the excise tax on sugar sweetened beverages: observational study. BMJ, 352, doi: 10.1136/bmj.h6704.
11. D’Haese, M. & Van Huylenbroeck, G. 2005. The rise of supermarkets and changing expenditure patterns of poor rural households case study in the Transkei area, South Africa. Food Policy, 30(1), 97-113.
12. Dary, O., Mora, J.O. & International Vitamin A Consultative Group. 2002. Food fortification to reduce vitamin A deficiency: International Vitamin A Consultative Group recommendations. Journal of Nutrition, 132(Suppl 9), 2927S-2933S.
13. De Villiers, A. & Faber, M. 2015. The school food environment: shaping the future health of the nation: guest editorial. South African Journal of Nutrition, 28(1), 4-5.
14. Department of Education. 2008. National Guidelines for the Implementation, Monitoring and Reporting on the National School Nutrition Programme. Draft 5. Pretoria: South African Department of Education.
15. Department of Health. 2013a. Strategic plan for the prevention and control of non-communicable diseases 2013–2017. Pretoria: South Africa Department of Health. Available at: http://www.thewhpca.org/resources/item/south-africa-strategic-plan-for-the-prevention-and-control-of-non-communicable-diseases-2013-2017
16. Department of Health. 2013b. Road map for nutrition in South Africa 2013–2017. Pretoria: South Africa Department of Health. Available at: https://extranet.who.int/nutrition/gina/sites/default/files/ZAF%202013%20Roadmap%20for%20Nutrition%20in%20South%20Africa%20.pdf
17. Department of Health. 2015. Strategy for the prevention and control of obesity 2015-2020. Pretoria: South Africa Department of Health. Available at: http://www.health-e.org.za/wp-content/uploads/2015/12/National-Strategy-for-prevention-and-Control-of-Obesity-4-August-latest.pdf
18. Department of Health & UNICEF SA. 2007. A Reflection of the South African Maize Meal and Wheat Flour Fortification Programme (2004 to 2007). Pretoria: The Department of Health South Africa and UNICEF South Africa. Available at: http://www.unicef.org/southafrica/SAF_resources_wheatfortificationn.pdf
19. Department of Social Development. 2015. Annual report for the year ended 31 March 2015. Pretoria: South African Department of Social Development. Available at: http://pmg-assets.s3-website-eu-west-1.amazonaws.com/151014DSDAR.pdf
20. Departments of Health and Basic Education. 2012. Integrated School Health Policy. Pretoria: South Africa Departments of Health and Basic Education. Available at: http://www.health-e.org.za/2013/10/24/integrated-school-health-policy/
21. Discovery. 2015a. HealthyFood from Pick n Pay and Woolworths. Johannesburg: Discovery. Available at: https://www.discovery.co.za/portal/individual/improve-health-healthyfood
22. Discovery. 2015b. Pick n Pay HealthyFood catalogue. Johannesburg: Discovery. Available at: https://www.discovery.co.za/discovery_coza/web/linked_content/pdfs/vitality/healthy_food_catalogue.pdf
23. Discovery. 2015c. Woolworth HealthyFood catalogue. Johannesburg: Discovery. Available at: https://www.discovery.co.za/discovery_coza/web/linked_content/pdfs/vitality/woolworths_healthyfood_catalogue.pdf
24. Editorial Office SAJCN. 2003. Food fortification becomes a reality in South Africa. South African Journal of Clinical Nutrition. 16(2): 39.
25. Egger, G. & Swinburn, B. 1997. An “ecological” approach to the obesity pandemic. BMJ, 315(7106): 477-480.

Working paper 34, Nicole Claasen, Marinka van der Hoeven and Namukolo Covic 29
26. Eksteen, G. & Mungal-Singh, V. 2015. Salt intake in South Africa: a current perspective. Journal of Endocrinology, Metabolism and Diabetes of South Africa, 20(1): 9-14.
27. Faber, M., Laurie, S., Maduna, M., Magudulela, T., & Muehlhoff, E. 2014. Is the school food environment conducive to healthy eating in poorly resourced South African schools? Public Health Nutrition, 17(6): 1214-1223.
28. FAO/WHO. 1998. Preparation and Use of Food-Based Dietary Guidelines. Geneva: Food and Agriculture Organization of the United Nations/World Health Organization.
29. Feeley, A. B. B., Kahn, K., Twine, R., & Norris, S. A. 2011. Exploratory survey of informal vendor-sold fast food in rural South Africa. South African Journal of Clincal Nutrition, 24(4): 199-201.
30. Feeley, A., Musenge, E., Pettifor, J. M., & Norris, S. A. 2012. Changes in dietary habits and eating practices in adolescents living in urban South Africa: The birth to twenty cohort. Nutrition, 28(7): e1-e6.
31. Glanz, K., Bader, M. D., & Iyer, S. 2012. Retail grocery store marketing strategies and obesity: an integrative review. American Journal of Preventive Medicine, 42(5): 503-512.
32. Glanz, K., Sallis, J. F., Saelens, B. E., & Frank, L. D. 2005. Healthy nutrition environments: concepts and measures. American Journal of Health Promotion, 19(5): 330-333.
33. Gustafson, A., Hankins, S., & Jilcott, S. 2012. Measures of the consumer food store environment: a systematic review of the evidence 2000–2011. Journal of Community Health, 37(4): 897-911.
34. He, F.J., Campbell, N.R.C. & MacGregor, G.A. 2012. Reducing salt intake to prevent hypertension and cardiovascular disease. Rev Panam Salud Publica, 32(4):293–300.
35. Hofman K.J. & Lee, R. 2013. Successful Sodium Regulation in South Africa: Intersectoral Case Study. Brazzaville: WHO Regional Office for Africa. Available at: http://www.afro.who.int/en/clusters-a-programmes/hpr/social-a-economic-determinants-of-health/case-studies/country-experiences-rio/4085-successful-sodium-regulation-in-south-africa-.html
36. HSFSA. 2016. About us, Heart and Stroke Foundation South Africa (website). Available at: http://www.heartfoundation.co.za/about-you/about-us
37. Igumbor, E. U., Sanders, D., Puoane, T. R., Tsolekile, L., Schwarz, C., Purdy, C., Swart, R., Durão, S. & Hawkes, C. 2012. "Big Food", the Consumer Food Environment, Health, and the Policy Response in South Africa. PLoS Medicine, 9(7): 866. DOI: 10.1371/journal.pmed.1001253.
38. Jacobs, S.A., De Beer, H. & Larney, M. 2011. Adult consumers’ understanding and use of information on food labels: a study among consumers living in the Potchefstroom and Klerksdorp regions, South Africa. Public Health Nutrition 14(3): 510-522.
39. Jansen, A. & Calitz, E. 2015. How effective is VAT zero rating as a pro-poor policy? Econ3x3 (website). Available at: http://www.econ3x3.org/sites/default/files/articles/Jansen%20%26%20Calits%202015%20VAT%20zero%20rating%20FINAL_0.pdf
40. Jansen, A., Stoltz, E. & Yu, D. 2013. The targeting of zero-rated basic foodstuffs under value-added tax (VAT) in South Africa. Studies in Economics and Econometrics, 37(3): 87-104.
41. Keller I. & Lang, T. 2007. Food-based dietary guidelines and implementation: lessons from four countries – Chile, Germany, New Zealand and South Africa. Public Health Nutrition, 11(8): 867-874.
42. Krølner, R., Rasmussen, M., Brug, J., Klepp, K.I., Wind, M. & Due, P. 2011. Determinants of Fruit and Vegetable Consumption among Children and Adolescents: A Review of the Literature. Part II: Qualitative Studies. International Journal of Behavioral Nutrition and Physical Activity, 8(112). DOI: 10.1186/1479-5868-8-112.
43. Labadarios, D., Steyn, N. P. & Nel, J. 2011. How diverse is the diet of adult South Africans. Nutrition Journal, 10(3). DOI: 10.1186/1475-2891-10-33.
44. Labadarios, D., Swart, R., Maunder, E.M.W., Kruger, H.S., Gericke, G.J., Kuzwayo, P.M.N., Ntsie, P.R., Steyn, N.P., Schloss, I., Dhansay, M.A., Jooste, P.L., Dannhauser, A., Nel, J.H., Molefe, D. & Kotze, T.J.v.W. 2007. The National Food Consumption Survey-Fortification Baseline (NFCS-FB-I): South Africa, 2005. Pretoria: Directorate: Nutrition, Department of Health.
45. Labadarios, D., Steyn, N. P., Maunder, E., MacIntryre, U., Gericke, G., Swart, R., Huskisson, J., Dannhauser, A., Vorster, H.H., Nesamvuni, A.E. & Nel, J. H. 2005a. The national food consumption survey (NFCS): South Africa, 1999. Public Health nutrition, 8(05), 533-543.
46. Labadarios, D., Steyn, N.P., Mgijimac, C. & Daldlad, N. 2005b. Review of the South African nutrition policy 1994–2002 and targets for 2007: Achievements and challenges. Nutrition 21:100–108
47. Larson, N. & Story, M. 2009. A review of environmental influences on food choices. Annals of Behavioral Medicine, 38(1): 56-73. 48. Love, P., Maunder, E.M.W. & Green, J.M. 2008. Are South African women willing and able to apply the new food-
based dietary guidelines? Lessons for nutrition educators: original research. South African Journal of Clinical Nutrition, 21(2), 17-24.
49. Love P. 2003. Approved! South African Dietary Guidelines. South African Journal of Clinical Nutrition, 16(2):70. 50. Love, P., Maunder, E., Green, M., Ross, F., Smale-Lovely, J. & Charlton, K. E. 2001. South African food-based
dietary guidelines: testing of the preliminary guidelines among women in KwaZulu-Natal and the Western Cape. South African Journal of Clinical Nutrition, 14(1): 9-19.

30 Food environments, health and nutrition in South Africa
51. Mandle, J., Tugendhaft, A., Michalow, J. & Hofman, K. 2015. Nutrition labeling: A review of research on consumer and industry response in the global South. Global Health Action 8: 25912. doi: 10.3402/gha.v8.25912.
52. Manyema, M., Veerman, L. J., Chola, L., Tugendhaft, A., Sartorius, B., Labadarios, D., & Hofman, K. J. 2014. The potential impact of a 20% tax on sugar-sweetened beverages on obesity in South African adults: A mathematical model. PLoS ONE, 9, 8. DOI: 10.1371/journal.pone.0105287
53. Marracini, T., Meltzer, S., Bourne, L. & Draper, E.C. 2012. A qualitative evaluation of exposure to and perceptions of the Woolworths Healthy Tuck Shop Guide in Cape Town, South Africa. Child Obesity, 8: 369–377.
54. Martins, J. H. 2006. Socio-economic and hygiene features of street food vending in Gauteng. South African Journal of Clinical Nutrition, 19(1): 18-25.
55. Mchiza, Z. J., Temple, N. J., Steyn, N. P., Abrahams, Z., & Clayford, M. 2013. Content analysis of television food advertisements aimed at adults and children in South Africa. Public Health Nutrition, 16(12): 2213-2220.
56. Ministry of Health of Brazil. 2014. Dietary guidelines for the Brazilian population. Eduardo Alves Melo (ed). Carlos Augusto Monteiro (translator). Brasilia: Ministry of Health of Brazil. Available at: http://189.28.128.100/dab/docs/portaldab/publicacoes/guia_alimentar_populacao_ingles.pdf
57. Mkhabela, T. 2013. Exploring pricing policy options to stimulate healthy eating in South Africa: Seeking consensus using the Delphi technique approach. Agrekon 52(Supl 1): 101-107.
58. Monteiro, C. A., Moubarac, J. C., Cannon, G., Ng, S. W., & Popkin, B. 2013. Ultra‐processed products are becoming dominant in the global food system. Obesity reviews, 14(S2): 21-28.
59. Moodie, R., Stuckler, D., Monteiro, C., Sheron, N., Neal, B., Thamarangsi, T., Lincoln, P., Casswel, S. on behalf of The Lancet NCD Action Group. 2013. Profits and pandemics: prevention of harmful effects of tobacco, alcohol, and ultra-processed food and drink industries. The Lancet, 381(9867): 670-679.
60. Moore, L. & Tapper, K. 2008. The impact of school fruit tuck shops and school food policies on children’s fruit consumption: a cluster randomised trial of schools in deprived areas. Journal of Epidemiology & Community Health, 62: 926–931.
61. Ng, M., Fleming, T., Robinson, M., Thomson, B., Graetz, N., Margono, C., et al. 2014. Global, regional, and national prevalence of overweight and obesity in children and adults during 1980–2013: A systematic analysis for the Global Burden of Disease Study 2013. The Lancet, 384(9945): 766-781.
62. Nguyen, K.A., De Villiers, A., Fourie, J.M., Bourne, L.T. & Hendricks, M.K. 2015. The feasibility of implementing food-based dietary guidelines in the South African primary-school curriculum. Public Health Nutrition, 18(1): 167-175.
63. Peyton, S., Moseley, W., & Battersby, J. 2015. Implications of supermarket expansion on urban food security in Cape Town, South Africa. African Geographical Review, 34(1): 36-54.
64. Puoane, T. R., Tsolekile, L. P., Caldbick, S., Igumbor, E. U., Meghnath, K., & Sanders, D. 2012. Chronic non-communicable diseases in South Africa: progress and challenges. South African Health Review, 115-126.
65. Republic of South Africa. 2002. Foodstuffs, Cosmetics and Disinfectants Act 54 of 1972. Available at: https://www.capetown.gov.za/en/CityHealth/Documents/Legislation/Act%20-%20Foodstuffs,%20Cosmetics%20and%20Disinfectants%20Act%20-%2054%20of%201972.pdf
66. Republic of South Africa. 2013. Foodstuffs, Cosmetics and Disinfectants Act 54 of 1972. Regulations relating to the reduction of sodium in certain foodstuffs and related matters. (Proclamation No. R. 214, 2013) Government Gazette, March 20, Regulation Gazette No. 36274. Available at: http://www.heartfoundation.co.za/sites/default/files/articles/South%20Africa%20salt%20legislation.pdf
67. Republic of South Africa 2014. The national policy of food and nutrition security for the Republic of South Africa. Government Gazette, August 22, No. 37915. Available at: http://www.gov.za/sites/www.gov.za/files/37915_gon637.pdf
68. Ronquest-Ross, L. C., Vink, N., & Sigge, G. O. 2015. Food consumption changes in South Africa since 1994. South African Journal of Science, 111(9-10). DOI: 0.17159/sajs.2015/20140354
69. SA Summit on Prevention and Control of NCDs. 2011. South African Declaration on the Prevention and Control of Non-Communicable diseases. South Africa summit on the prevention and control of non-communicable diseases, Birchwood Hotel and Conference Centre, Boksburg, 12-13 September 2011. Available at: http://www.worldactiononsalt.com/docs/news/2011/60313.pdf
70. Shisana O, Labadarios D, Rehle T, Simbayi L, Zuma K, Dhansay A, Reddy P, Parker W, Hoosain E, Naidoo P, Hongoro C, Mchiza Z, Steyn NP, Dwane N, Makoae M, Maluleke T, Ramlagan S, Zungu N, Evans MG, Jacobs L, Faber M, & the SANHANES-1 Team. 2014. South African National Health and Nutrition Examination Survey (SANHANES-1): 2014 Edition. Cape Town: HSRC Press.
71. StatsSA. 2015. Mortality and causes of death in South Africa, 2014: Findings from death notification. Statistical release P0309.3. Pretoria: StatsSA. Available at: http://www.statssa.gov.za/publications/P03093/P030932014.pdf
72. Steyn, N. P., Mchiza, Z., Abrahams, Z., & Temple, N. 2014. Television advertising to children: Ethical considerations with regard to advertising of unhealthy foods and drinks. HSRC Policy Brief. Cape Town: HSRC Press. Available at: http://www.hsrc.ac.za/uploads/pageContent/4577/2014%20Television%20Advertising.pdf
73. Steyn, N. P., Labadarios, D., & Nel, J. H. 2011. Factors which influence the consumption of street foods and fast foods in South Africa: A national survey. Nutrition Journal, 10(1). DOI: 10.1186/1475-2891-10-104.

Working paper 34, Nicole Claasen, Marinka van der Hoeven and Namukolo Covic 31
74. Steyn, N.P., Nel, J. & Labadarios, D. 2008a. Will fortification of staple foods make a difference to the dietary intake of South African children? South African journal of clinical nutrition, 21(1): 22-26.
75. Steyn, N.P., Wolmarans, P., Nel, J.H. & Bourne, L.T. 2008b. National fortification of staple foods can make a significant contribution to micronutrient intake of South African adults. Public Health Nutrition, 11(3): 307-313.
76. Story, M., Kaphingst, K. M., Robinson-O'Brien, R., & Glanz, K. 2008. Creating healthy food and eating environments: Policy and environmental approaches. Annual Reviews of Public Health, 29: 253-272.
77. Stroebel, L. & van Schalkwyk, H.D. 2012. Food retailing and agricultural development. In: Van Schalkwyk, H.D., Groenewald, J.A., Fraser, G.C.G., Obi, A. & van Tilburg, A. Eds. Unlocking Markets to Smallholders: Lessons from South Africa. The Netherlands: Wageningen Academic Publishers.
78. Sturm, R., An, R., Segal, D., & Patel, D. 2013. A cash-back rebate program for healthy food purchases in South Africa: Results from scanner data. American Journal of Preventive Medicine, 44(6), 567-572.
79. Swinburn, B., Egger, G., & Raza, F. 1999. Dissecting obesogenic environments: The development and application of a framework for identifying and prioritizing environmental interventions for obesity. Preventive Medicine, 29(6): 563-570.
80. Swinburn, B. A., Sacks, G., Hall, K. D., McPherson, K., Finegood, D. T., Moodie, M. L., & Gortmaker, S. L. 2011. The global obesity pandemic: shaped by global drivers and local environments. The Lancet, 378(9793): 804-814.
81. Swinburn, B., Sacks, G., Vandevijvere, S., Kumanyika, S., Lobstein, T., Neal, B., Barquera, S., Friel, S., Hawkes, C., Kelly, B., L’abbé, M., Lee, A., Ma, J., Macmullan, J., Mohan, S., Monteiro, C. Rayner, M., Sanders, D., Snowdon, W. & Walker, C. 2013. INFORMAS (International Network for Food and Obesity/non‐communicable diseases Research, Monitoring and Action Support): Overview and key principles. Obesity reviews, 14(S1). DOI: 10.1111/obr.12087.
82. Taljaard, C., Covic, N., Van Graan, A., Kruger, H., Smuts, C., Baumgartner, J., Kvalsvig, J., Wright, H., van Stuijvenberg, M. & Jerling, J. 2013. Effects of a multi-micronutrient-fortified beverage, with and without sugar, on growth and cognition in South African schoolchildren: A randomised, double-blind, controlled intervention. British Journal of Nutrition, 4. DOI: 10.1017/S000711451300189X.
83. Temple, N.J., Steyn, N.P., Myburgh, N.G. & Nel, J.H. 2006 Food items consumed by students attending schools in different socioeconomic areas in Cape Town. South Africa. Nutrition, 22, 252–258.
84. Temple, N. J., & Steyn, N. P. 2011. The cost of a healthy diet: A South African perspective. Nutrition, 27(5): 505-508. 85. Treasury. 2016. Budget speech 2016. Pretoria: RSA. Available at:
http://www.treasury.gov.za/documents/national%20budget/2016/speech/speech.pdf 86. Van der Merwe, D., Bosman, M., Ellis, S., De Beer, H. & Mielmann, A. 2012. Consumers’ knowledge of food label
information: An exploratory investigation in Potchefstroom, South Africa. Public Health Nutrition 16(3): 403-408. 87. Van Heerden, I. V., & Schönfeldt, H. C. 2011. The lack of food intake data and the consequences thereof. South
African Journal of Clinical Nutrition, 24(1): 10-18. 88. Van Stuijvenberg, M.E., Smuts, C.M., Lombard, C.J. & Dhansay, M.A. 2008. Fortifying brown bread with sodium
iron EDTA, ferrous fumarate, or electrolytic iron does not affect iron status in South African schoolchildren. Journal of Nutrition, 138: 782-786.
89. Von Holy, A., & Makhoane, F. M. 2006. Improving street food vending in South Africa: Achievements and lessons learned. International Journal of Food Microbiology, 111(2): 89-92.
90. Vorster, H.H., Badham, J.B., Venter, C.S. 2013. An introduction to the revised food-based dietary guidelines for South Africa. South African Journal of Clinical Nutrition, 26(3): S1-S164.
91. Vorster, H.H., Love, P. & Browne, C. 2001. Development of food-based dietary guidelines for South Africa – The process. South Africa Journal of Clinical Nutrition, 14(3): S3-S6.
92. Weatherspoon, D. D., & Reardon, T. 2003. The rise of supermarkets in Africa: Implications for agrifood systems and the rural poor. Development Policy Review, 21: 333-355.
93. WHO & FAO. 2006. Guidelines on food fortification with micronutrients. In Allen, L., De Benoist, B., Dary, O. & Hurrell, R. Eds. Geneva: WHO and FAO. Available at: http://www.who.int/nutrition/publications/guide_food_fortification_micronutrients.pdf
94. WHO. 2007. Reducing Salt Intake in Populations. Report of a WHO forum and technical meeting, 5-7 October 2006, Paris, France. Geneva: WHO. Available at: http://www.who.int/dietphysicalactivity/Salt_Report_VC_april07.pdf
95. WHO. 2012. Guideline: Sodium Intake for Adults and Children. Geneva: WHO. Available at: http://apps.who.int/iris/bitstream/10665/77985/1/9789241504836_eng.pdf?ua=1&ua=1
96. Wiles, N. L., Green, J. M., & Veldman, F. J. 2013. Tuck-shop purchasing practices of Grade 4 learners in Pietermaritzburg and childhood overweight and obesity. South African Journal of Clinical Nutrition, 26(1): 37-42.
97. Yusufali, R., Sunley, N., De Hoop, M. & Panagides, D. 2012. Flour fortification in South Africa: Post-implementation survey of micronutrient levels at point of retail. Food and Nutrition Bulletin, 33(4 Suppl): S321-S329.