food deserts in south dakota
TRANSCRIPT

Food Deserts in South Dakota
Nimish Sheth

The Food Desert Metaphor
2
First used in the U.K. to describe lack of access to food due to grocery store closures in deteriorating neighborhoods in cities
Uneven distribution of consumer food sources leads to areas of concentration and places with limited or non-existent access to food choices (Morton, 2005)
Differential access to healthy and affordable food based on socio-economic conditions (Beaulac, Kristjansson, and Cummins, 2009)

Food Desert in the U.S. context
3
In the U.S., proliferation of convenience stores and mini-
marts provides increased access to food
Clouds quality, nutritional, and affordability factors
Food desert alternately defined as residential proximity to
large food retailers (Morton and Blanchard, 2007)

Goals
4
Identify and characterize food deserts in South Dakota, a
large rural state, based on geographic access to retail food
Use GIS for identifying food deserts – regions with limited
or non-existent geographic access to large food retailers
Create a set of maps to visualize the process of categorizing
food deserts
Characterize food deserts vs. non-food deserts to gain socio-
economic insights, if any

Methodology
5
Calculate distance between residential locations and
supermarkets
Locate cities, counties, and major roads in the state to
visualize the relative locations of supermarkets and food
deserts
Aggregate distances by census tract to identify and
characterize food deserts

Data for South Dakota
6
Data Source
Census Blocks U.S. Census Bureau
Census Tracts U.S. Census Bureau
Census Tract Demographics U.S. Census Bureau
Supermarkets (except convenience
stores)
ReferenceUSA
Roads South Dakota Dept. of
Transportation
Cities MGIS (Price), U.S. Census Bureau
State, Counties MGIS (Price)

Data Processing
7
Project Data NAD83 SPCS
South Dakota South FIPS4002
Create GDBImport data
Calculate Census
Block Centroids
Map Supermarkets
(lat/long)
Closest
Supermarket to
Block Centroid
Simple Distance
join
Mean Distance to
Supermarket by
Census Tract
Summarized Inside
joinCreate choropleth map
Mean Distance by Tract
Create series of
maps to visualize
analysis
Assemble Data
Analyze
characteristics of food
& non-food deserts in
ArcMap and Excel
^
Aberdeen
Brookings
Watertown
Rapid City
Sioux Falls
Pierre
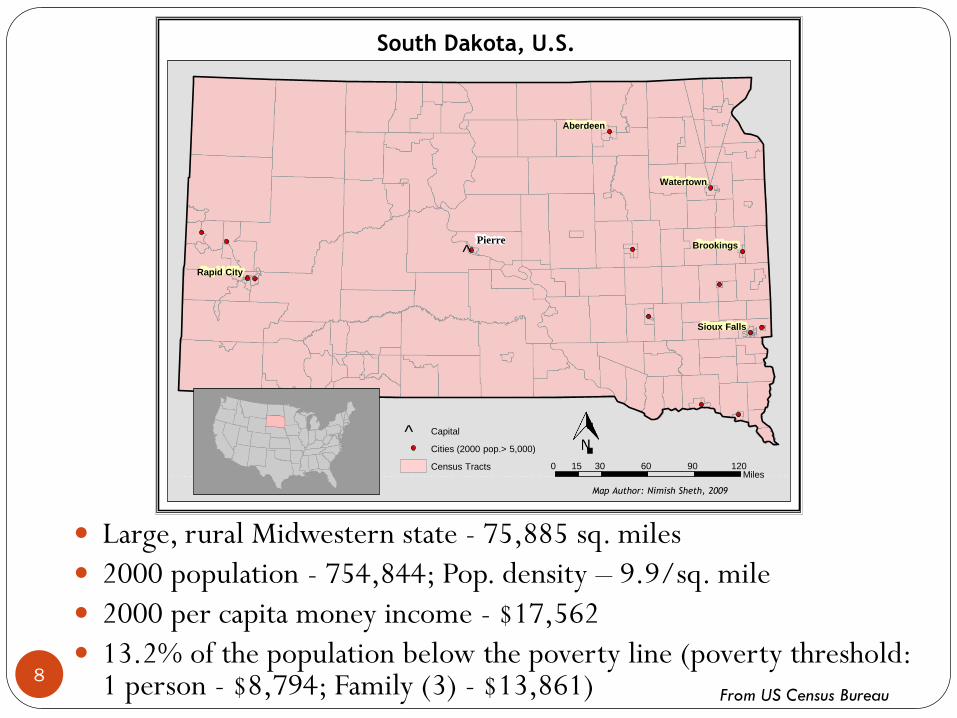
South Dakota, U.S.
0 30 60 90 12015Miles
^ Capital
Cities (2000 pop.> 5,000)
Census Tracts
Map Author: Nimish Sheth, 2009
:
8
Large, rural Midwestern state - 75,885 sq. miles
2000 population - 754,844; Pop. density – 9.9/sq. mile
2000 per capita money income - $17,562
13.2% of the population below the poverty line (poverty threshold: 1 person - $8,794; Family (3) - $13,861) From US Census Bureau
#*#*
#*
#*
#*
#*
#*
#* #*#*
#*#*
#*
#*
#*
#*
#*
#*
#*
#*
#*
#*
#*
#*
#*
#*
#*
#*#*
#*#*#*#*
#*
#*
#*
#*
#*#*
#*
#*
#*
#*
#*
#*
#*
#*
#*
#*#*
#*#*#*#*
#*
#*
#*
#*
#*
#*
#*
#*
#*
#*
#*
#*
#*
#*#*#*
#*
#*
#*
#*
#*
#*
#*
#*#*
#*
#*
#*
#*
#*
#*
#*
#*
#*
#*
#*
#*
#*
#*
#*
#*
#*
#*#*#*#*
#*
#*#*
#*
#*#*
#*
#*
#*
#*
#*
#*
#*#*#*#*
#*
#*
#*
#*
#*
#*
#*
#*#*
#*
#*
#*
#*
#*
#*
#*#*
#*
#*
#*
#* #*
#*
#*
#*
#*
#*
#*
^
Aberdeen
Brookings
Watertown
Rapid City
Sioux Falls
Pierre
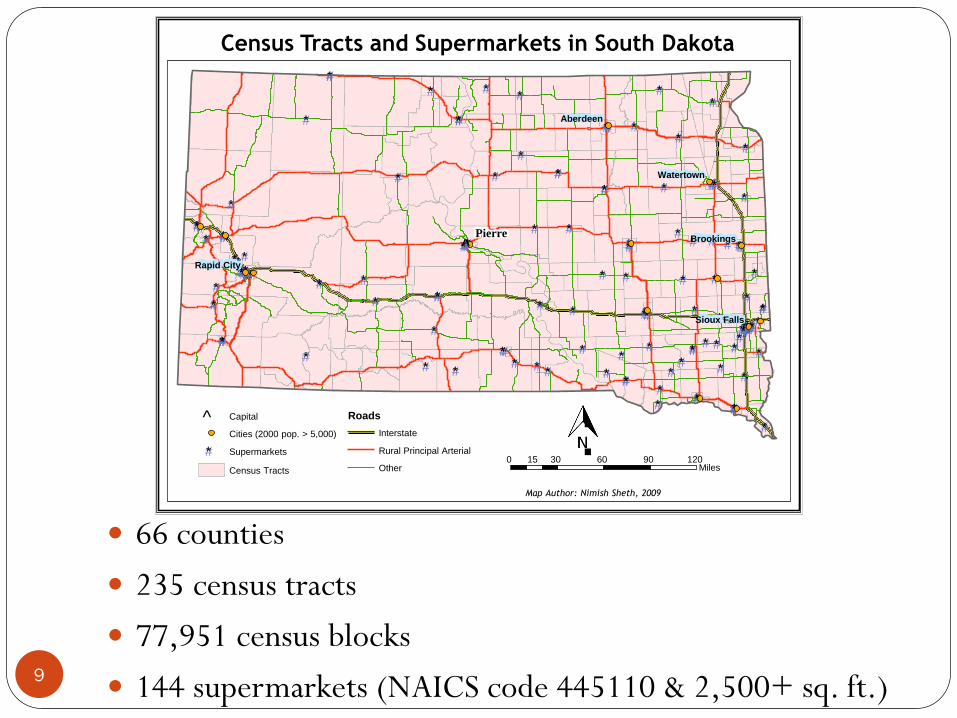
Census Tracts and Supermarkets in South Dakota
0 30 60 90 12015Miles
^ Capital
#* Supermarkets
Census Tracts
Roads
Interstate
Rural Principal Arterial
Other
Cities (2000 pop. > 5,000)
Map Author: Nimish Sheth, 2009
:
9
66 counties
235 census tracts
77,951 census blocks
144 supermarkets (NAICS code 445110 & 2,500+ sq. ft.)

10
Closest supermarket to block centroid
Mean distance by census tract
#*
#*
#*
!(1.48 miles
1.52 miles
460359629001046
Walmart Supercenter
County Fair Food Store
Closest supermarket to block centroid
!( Block 460359629001046
#* Supermarkets
Roads
Interstate
Rural Principal Arterial
Other
Block Centroid
Census Tract
0 0.5 1 1.5 20.25
Miles
Map Author: Nimish Sheth, 2009
:

Average Distance to Supermarkets by Census Tract
Mean Distance to Supermarketsby Census Tract (miles)
#* Supermarkets
0 - 1
1 - 4
4 - 8
8 - 12
> 12
0 30 60 90 12015Miles
Map Author: Nimish Sheth, 2009
:
11
Avg. U.S. grocery trip: 8 miles – 1995 Natl. Transportation Survey (Morton & Blanchard, 2007)
Tracts with a mean distance > 12 miles deemed food desert
75 of 235 tracts identified as food deserts (31.9%) account for 16.9% of state population mean distance to supermarket is 17.5 miles vs. 6.3 miles for non-food deserts
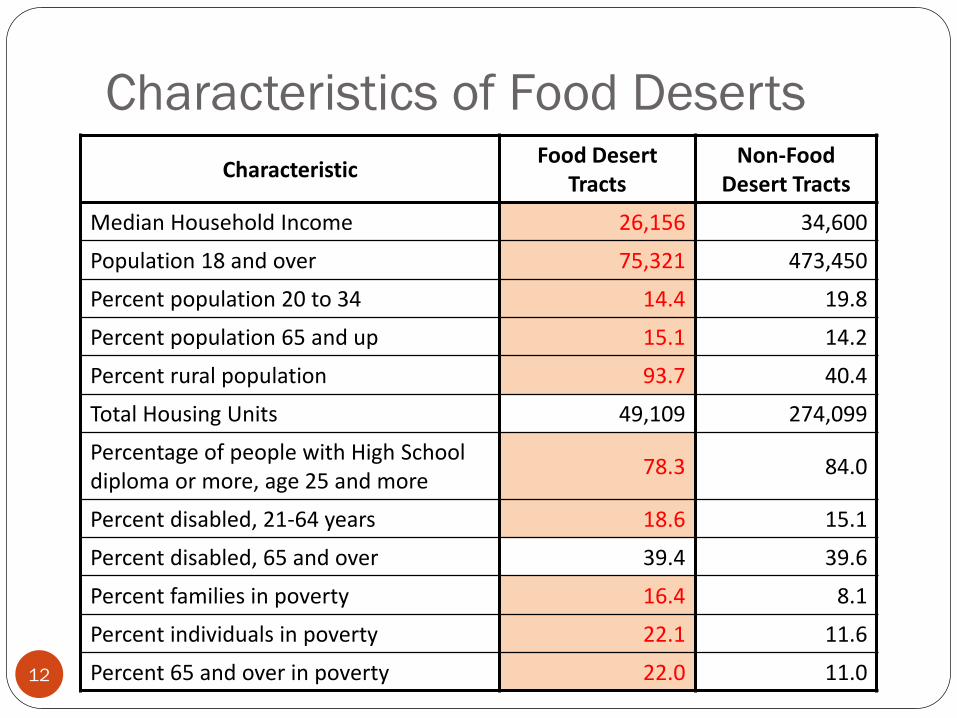
Characteristics of Food Deserts
12
CharacteristicFood Desert
TractsNon-Food
Desert Tracts
Median Household Income 26,156 34,600
Population 18 and over 75,321 473,450
Percent population 20 to 34 14.4 19.8
Percent population 65 and up 15.1 14.2
Percent rural population 93.7 40.4
Total Housing Units 49,109 274,099
Percentage of people with High School diploma or more, age 25 and more
78.3 84.0
Percent disabled, 21-64 years 18.6 15.1
Percent disabled, 65 and over 39.4 39.6
Percent families in poverty 16.4 8.1
Percent individuals in poverty 22.1 11.6
Percent 65 and over in poverty 22.0 11.0

13
• Of the 20 poorest tracts (based on individual poverty rate), 15 identified as food deserts • 5 of these 15 tracts are among the 20 tracts with the lowest educational attainment (based on
percentage of people with High School diploma or more)
• Of the 20 tracts with the lowest educational attainment, 14 identified as food deserts
• Of the 20 food deserts with the greatest distance from supermarkets: • 4 are among the top 20 tracts with greatest rate of individual poverty
• 3 are among the top 20 tracts with the least educational attainment
• 2 are among the top 20 tracts with the least median household Income
!(
!(
!(!(
!( !( !(
!( !( !(
!(!(!(
!(!(
^Pierre
Aberdeen
Brookings
Watertown
Rapid City
Sioux Falls
Food Desert Categorization of CensusTracts
0 30 60 90 12015Miles
^ Capital
!( Cities (2000 pop. > 5,000)
Counties
Food Desert Census Tract
Non-Food Desert Census Tract
Map Author: Nimish Sheth, 2009
:
Limitations and Future Research
14
Block centroids are a gross approximation of residential
locations
Euclidean distance not reflective of true travel distance
Residents not constrained by state boundaries
Home/community gardens, farmers’ markets, etc. not
considered
Economic and Informational food access
References
15
U.S. Census Bureau
ReferenceUSA
South Dakota Dept. of Transportation
Price, M. Mastering ArcGIS, 4th Edition (Exercise Data)
Morton, L.W. and Blanchard, T.C. (2007). “Starved for Access:
Life in Rural America’s Food Deserts.” Rural Realities 1 (4): 1-10.
Morton, L.W. et al., (2005). “Solving the Problems of Iowa Food
Deserts: Food Insecurity and Perceptions of Civic Structure.”
Rural Sociology 70 (1): 94-112.