food chemistry - ucanrucce.ucdavis.edu/files/datastore/234-2516.pdf · food chemistry journal...
TRANSCRIPT

Food Chemistry 139 (2013) 171–183
Contents lists available at SciVerse ScienceDirect
Food Chemistry
journal homepage: www.elsevier .com/locate / foodchem
An integrated approach for flavour quality evaluation in muskmelon (Cucumismelo L. reticulatus group) during ripening
Simona Vallone a, Hanne Sivertsen b, Gordon E. Anthon b, Diane M. Barrett b, Elizabeth J. Mitcham a,Susan E. Ebeler c, Florence Zakharov a,⇑a Department of Plant Sciences, University of California, One Shields Avenue, Davis, CA 95616, USAb Department of Food Science and Technology, University of California, One Shields Avenue, Davis, CA 95616, USAc Department of Viticulture and Enology, University of California, One Shields Avenue, Davis, CA 95616, USA
a r t i c l e i n f o
Article history:Received 6 July 2012Received in revised form 20 December 2012Accepted 28 December 2012Available online 7 January 2013
Keywords:Melon maturityRipeningAromaFlavourVolatilesSensory descriptive analysiszNoseHeadspace sorptive extraction
0308-8146/$ - see front matter � 2013 Elsevier Ltd. Ahttp://dx.doi.org/10.1016/j.foodchem.2012.12.042
⇑ Corresponding author. Tel.: +1 530 752 4374; faxE-mail address: [email protected] (F. Zakharov).
a b s t r a c t
Numerous and diverse physiological changes occur during fruit ripening and maturity at harvest is one ofthe key factors influencing the flavour quality of fruits. The effect of ripening on chemical composition,physical parameters and sensory perception of three muskmelon (Cucumis melo L. reticulatus group) cul-tivars was evaluated. Significant correlations emerging from this extensive data set are discussed in thecontext of identifying potential targets for melon sensory quality improvement. A portable ultra-fast gas-chromatograph coupled with a surface acoustic wave sensor (UFGC–SAW) was also used to monitoraroma volatile concentrations during fruit ripening and evaluated for its ability to predict the sensoryperception of melon flavour. UFGC–SAW analysis allowed the discrimination of melon maturity stagebased on six measured peaks, whose abundance was positively correlated to maturity-specific sensoryattributes. Our findings suggest that this technology shows promise for future applications in rapid fla-vour quality evaluation.
� 2013 Elsevier Ltd. All rights reserved.
1. Introduction
Netted muskmelon (Cucumis melo L., reticulatus group), alsocommonly called cantaloupe, is an orange-fleshed, sweet and aro-matic melon that is highly popular in the United States, represent-ing a large share of the produce market. In 2010, the estimated netdomestic use of muskmelon totaled over 2.6 billion pounds, andmuskmelon ranked fourth in U.S. annual per capita consumptionof fresh fruit after bananas, watermelons and apples (USDA-ERS,2010). Consumer surveys assessing ‘‘overall preference’’ for severalmuskmelon cultivars highlighted that flavour, sweetness and tex-ture were important factors in determining consumer liking ofmelons (Lester, 2006). While these attributes are dictated by thespecific cultivar, or genetic makeup, of the muskmelon, maturityat harvest has also been shown to have a large impact on the sugarcontent (related to sweetness), volatile content (related to flavourand aroma) and texture of melon fruit (Beaulieu & Grimm, 2001;Beaulieu, Ingram, Lea, & Bett-Garber, 2004; Beaulieu & Lancaster,2007; Pratt, 1971).
Harvesting firmer and early mature fruits is a commercialpractice commonly adopted in order to maximise post-harvest life
ll rights reserved.
: +1 530 752 8502.
during handling, shipping and storage of climacteric fruits (Kader,2008). However, this practice is detrimental for flavour quality be-cause it does not allow full development of the fruit aroma profile(Beaulieu, 2006; Beaulieu et al., 2004; Wyllie, Leach, & Wang,1996).
Typically, muskmelon fruit maturity in the field is determinedby the extent of the development of an abscission layer (also called‘‘slip’’ in the trade) between the vine and the fruit. In California,melons are generally harvested at 3=4- to full-slip stage for localmarket distribution. However, genetic, environmental and agro-nomic factors often complicate maturity assessment by influencingfruit physiology and the development of this abscission zone,resulting in variable postharvest fruit quality. In addition, melonsdestined for long distance transport are typically harvested earlier,sometimes even before the clear development of an abscissionzone.
Due to the interactions of many parameters (e.g., sugar content,aroma profile, colour, texture) in determining fruit sensory charac-teristics, measuring a single composition parameter such as sugarcontent is seldom sufficient to reflect an objective assessment ofoverall fruit flavour quality. From an applicative perspective, acomprehensive assessment of flavour quality is often unfeasibledue to the requirement of expensive analytical instrumentation,highly trained personnel and time- and labour-consuming proce-

172 S. Vallone et al. / Food Chemistry 139 (2013) 171–183
dures. While the availability of rapid methods for the detection ofexternal, visual quality has allowed the distribution of aestheticallysuperior fruit, the lack of rapid methods for flavour quality controlmay hinder the delivery of more flavourful fruit to consumers.
In our study we first evaluated the effect of ripening on sensoryperception, chemical composition and physical measurements ofmelon fruit. Changes in chemical composition and physical proper-ties during the ripening process were then correlated to sensoryattributes in an attempt to predict flavour perception by chemicalcomposition analysis. Finally, an ultra-fast gas-chromatograph wasevaluated for its ability to monitor changes in melon volatile con-centrations during ripening and to predict the sensory perceptionof flavour.
2. Materials and methods
2.1. Plant material and sample preparation
Muskmelons (C. melo L., reticulatus group) cv. Navigator, MasRico and Thunderbird, were grown in Davis, CA (38.55 N,121.74 W), and provided by HM. Clause Seed Company (Modesto,CA, USA). Each of the three cultivars was planted on three differentdates with approximately 2-week intervals during the spring of2010 and grown on raised beds using standard commercial cultiva-tion practices with drip irrigation. Each cultivar plot correspondingto one ‘‘planting date’’ was used to supply one of three iterations offruit materials for sensory testing and physiochemical analysis.
Fruit were harvested at five different maturity stages, rangingfrom early mature to fully ripe, between July and September2010. The maturity at harvest was assessed in the field by examin-ing the presence or absence of the abscission zone formed aroundthe peduncle, commonly called ‘‘slip’’. Early mature melonscorresponded to fruits that had reached full size, but did not showa visible abscission zone around the peduncle (thereafter named‘‘pre-slip’’ fruit). Fruits were classified as ‘‘full slip’’ when a fullydeveloped abscission zone (as evidenced by the development of acrack around the peduncle) was visible at harvest time. Underour growing conditions, the abscission zone developed veryquickly (within less than a day), making the standard 1=4-, ½- and3=4-slip maturity assessment impractical. Therefore, ‘‘full-slip’’ mel-ons were grouped in three classes, ‘‘slip A’’ (Sa), ‘‘slip B’’ (Sb) and‘‘slip C’’ (Sc), based on increasing force needed to detach the fruitfrom the plant (force applied to detach the fruit: Sa > Sb > Sc). Sixmelons were chosen for each maturity stage based on the absenceof external and internal defects, and size homogeneity. Fruits wererinsed with tap water in order to remove dirt and dust, cut longi-tudinally into four wedges, and a further classification of the‘‘pre-slip’’ fruit was performed visually based on the degree of col-our lightness of the flesh: ‘‘pre-slip light orange’’ (PL) and ‘‘pre-slipdark orange’’ (PD).
Seeds and cavity tissue were removed, and two oppositewedges per fruit were selected for physiochemical analysis andthe other two opposite wedges were used for sensory analysis onthe same day.
2.2. Environmental conditions
Average and maximum daily air temperature and total solarradiation data were retrieved from the web-site of California Infor-mation Management System (CIMIS; http://www.cimis.water.ca.-gov) weather station, located 5 miles North-West (38.54 N,121.78 W) of HM. Clause Seed Company fields. Total solar radiationwas converted into photosynthetic active radiation (PAR) in 400–700 nm wavebands, according to Thimijan and Heins (1983), andexpressed in lmol m�2 s�1.
2.3. Sensory analysis
2.3.1. Panellist recruiting and trainingStudents and staff with various backgrounds in sensory testing
were recruited from the UC Davis campus to participate in sensorypanel training.
Nine panellists underwent six one-hour training sessions, over aperiod of 3 weeks. During the initial training sessions, panellistsgenerated and agreed upon a list of sensory attributes presentedin Table 1. The attributes were rated on a 10 cm unstructured scale,anchored at the ends with ‘‘none’’ and ‘‘strong’’, except for colourintensity, which ranged from ‘‘pale orange’’ to ‘‘strong orange’’,and unevenness of colour, which ranged from ‘‘even’’ to ‘‘uneven’’.
2.3.2. Sensory descriptive analysisMelon balls (1.3 cm in diameter) carved from melons of the
same cultivar and maturity stage were gently mixed in a mixingbowl, and a set of five balls was put into five 162-mL plastic cupswith lids labelled with random three digit codes. The samples wereserved in complete randomised order, as established by the soft-ware program CSA, Compusense Five (Version 5.0, Compusense,Guelph, Ontario, Canada, 2008), in individual booths and undernormal fluorescent white light, at ambient room temperature(20 �C). Water and unsalted crackers were used as rinsing agentsbetween samples.
A modified quantitative descriptive analysis (QDA) (Stone, Sidel,Oliver, Woolsey, & Singleton, 1974) was used to evaluate the sam-ples. Five samples per cultivar, representing all five maturitystages, were evaluated during each session and each cultivar eval-uation was repeated three times (corresponding to the three differ-ent planting dates). Panellists evaluated the samples one by one, ona computer screen, according to the order presented in the soft-ware program. Appearance of the fruit was evaluated first basedon the overall average colour intensity and unevenness of colourfor the five melon balls. Panellists then smelled the sample, andevaluated the aroma attributes. Two sample balls were used forevaluation of the texture attributes. Panellists swallowed the sam-ples after completing the evaluation. Flavours, tastes and flavourlasting sensation were evaluated on the remaining three sampleballs.
2.4. Physical and chemical analysis
2.4.1. Physical measurementsColour measurement was performed using a Minolta Colorime-
ter (CR-300, Minolta, Ramsey, NJ, USA). L⁄, a⁄, b⁄ values were re-corded on six replicates per sample, from the side of2 � 2 � 2 cm flesh cubes obtained from the equatorial region ofthe fruit. Hue angle, h, was calculated as h = arctan (a⁄/b⁄).
Puncture and compression assessments were performed toevaluate fruit flesh firmness, using a TA.XT2 Texture Analyzer(Texture Technologies, Scarsdale, NY, USA). Puncture testing wasperformed with a 100 g force load on the side of a 2 � 2 � 2 cmflesh cube obtained from the equatorial region of the fruit. A5 mm diameter flat-head stainless steel cylindrical probe travelledat a rate of 1 mm s�1 for a total of 6 mm. The area under the curvefrom 0 to 6 mm was used as the puncture measurement. Compres-sion testing using a 38 mm flat compression probe was performedwith a 100 g force load on the side of a 2 � 2 � 2 cm cube. Pretestspeed was 10 mm s�1 with a test speed of 0.5 mm s�1, followed bya post-test speed of 10 mm s�1. The compression measurementdetermined from the graph was total force area (N � s). Six meloncubes were analysed for puncture and compression for each culti-var, maturity level, and planting date.

Table 1Sensory attributes and reference standards.
Attribute Attribute descriptions References
AppearanceColour intensity The intensity of the most dominant colour of the sample (all five melon balls included), ranging from very pale
orange to strong orangeNone
Unevenness ofcolour
The degree of evenness of the colour, ranging from even (no white spots in flesh), to uneven (many white spots) inthe sample
None
AromaOverall aroma The intensity of aroma of any type, ranging from weak overall aroma, to strong aroma present in the sample NoneFruity aroma The intensity of fruity aroma like mixed fruit juice, a fresh fruity aroma, ranging from none to strong fruity aroma Dole mixed fruit juice
(orange, peach, mango juice)Scale point: 10
Marshmallowaroma
The intensity of sweet aroma, includes the sweet sensation of sugar, marshmallows, and bubblegum, ranging fromnone to strong sweet aroma.
Marshmallows, small sizeScale point: 10
Cucumberaroma
The intensity of green, fresh aroma, like cucumber, squash, ranging from none to strong, green aroma English cucumber, peeled andcut into 1 cm slicesScale point 10
Musky aroma The intensity of the spicy aroma of cedar wood, like cedar mothballs, but also the musky smell of animal, rangingfrom none to a strong musky aroma
A piece of cedar woodScale point: 10
Buttery aroma The intensity of the aroma of butter, ranging from none to a strong buttery aroma Real butter, ca. 1 cm3
Scale point: 10
TextureJuiciness The amount of juice released in the sample when biting into it with the front teeth, ranging from no juice released,
to lots of juice releasedRipe peachScale point: 10
Firmness The force required to compress the sample between the back teeth, ranging from soft to firm Banana, yellow, ripeScale point: 0–1English cucumber with peelScale point: 10
Crunchiness The amount of sound generated when chewing the back teeth, ranging from no sound, like a banana, to a lastingcrunchy sound
Granny Smith apple wedgeScale point: 10
Fibrousness The presence of fibres in the flesh, ranging from no fibres to many fibres in the sample No referenceTaste and flavourSweet taste The intensity of sweet taste like sugars, but also like candy (marshmallows or bubblegum), ranging from none to a
strong sweet tasteMarshmallow, small sizeScale point: 10
Sour taste The intensity of fresh sour taste like Granny Smith apples, ranging from none to a strong sour taste Granny smith appleScale point: 10
Fruity flavour The intensity of the flavour of fruit juice of mixed fruits, ranging from none to a strong fruity flavour Dole mixed juice (orange,peach, mango):Scale point: 10
Bitter taste The intensity of bitter taste, like caffeine, but also like the peel of cucumber, or an unripe fruit, ranging from none toa strong bitter taste
English cucumber peelScale point: 10
After flavour How long the flavour lasts in the mouth, ranging from a few seconds to longer than 20 s None
S. Vallone et al. / Food Chemistry 139 (2013) 171–183 173
2.4.2. Chemical measurementsSoluble solids content (SSC) was determined by refractometry
(Reichert AR6 Series, Depew, NY, USA) using 200 lL of juice ob-tained from squeezing melon balls (using a garlic press) sampledfrom blossom end, stem end and equatorial regions of the melons.Titratable acidity (TA) was determined by diluting 4 g of juice (ob-tained as above) in 20 mL deionised water and titrating to pH 8.2using an automatic titrator (Radiometer TitraLab Tim850, Radiom-eter Analytical SAS, Lyon, France). TA is reported as citric acidequivalents. Each measurement was performed in triplicate foreach sample. For ethylene and carbon dioxide analysis, 25 g of mel-on pieces (obtained randomly along melon wedges using an11 mm i.d. cork borer) were enclosed in air-tight glass vessels(250 mL volume). After equilibration for 15 min, a 10-mL head-space sample was analysed by gas chromatography coupled withflame ionisation detector using a Varian 3800 (Walnut Creek, CA,USA) equipped with a 6 m � 3 mm alumina column held at 50 �C.For carbon dioxide analysis, 10-mL headspace sample was injectedinto a rapid gas analyzer (VIA510; Horiba, Fukuoka, Japan). Ethyl-ene and CO2 concentrations were calculated by comparing thesample response to authentic standard curves.
Juice samples obtained as described for SSC and TA measure-ments were used for sugar and acid analysis. Fructose, glucose, su-crose, citric, malic and glutamic acid concentrations wereevaluated by enzymatic assays as described in Vermeir, Nicolai,Jans, Maes, and Lammertyn (2007) using enzyme reagent kits
(R-Biopharm, Marshall, MI, USA) according to the manufacturer’sinstructions. Standard solutions were used to verify the accuracyof the method.
2.4.3. Volatile compound analysis2.4.3.1. Sample preparation. For a detailed sample preparation, seeVallone, Lloyd, Ebeler, and Zakharov (2012). Briefly, after removingthe seeds and seed cavity tissue, melon balls (2.5 cm in diameter)from six fruits were pooled and mixed, and then 200 g of samplewere homogenised with 200 mL of saturated CaCl2 solution and50 lL of a 100 mM solution of 2-methylbutyl isovalerate in meth-anol, added as an internal standard. Then, 5-mL aliquots of samplewithout foam were pipetted into 20-mL glass amber vials. Thevials, sealed with a steel screw cap fitted with a Teflon/silicon sep-tum, were flash frozen in liquid nitrogen, and stored at �80 �C untilanalysis. For volatile analysis, samples were thawed for one hour atroom temperature immediately prior to analysis.
2.4.3.2. Headspace sorptive extraction and gas chromatography massspectrometry. Headspace sorptive extraction (HSSE) and gas chro-matography mass spectrometry (GC–MS) was performed usingan Agilent (Santa Clara, CA, USA) gas chromatograph (7890A) andmass spectrometer detector (5975C), equipped with a thermaldesorption unit (TDU) and cryo-cooled injection system (CIS) (Ger-stel Inc., Mülheim an der Ruhr, Germany). The headspace samplingwas performed with a 10-mm magnetic stir bar (also called

174 S. Vallone et al. / Food Chemistry 139 (2013) 171–183
Twister™) coated with 24 lL of polydimethylsiloxane (Gerstel Inc.,Germany). The bar was suspended above the sample in the 20-mLamber vial and exposed to the headspace for 30 min at room tem-perature, while the sample was stirred at 550 rpm. For thermaldesorption, the following parameters were used: initial TDU tem-perature of 30 �C, heated to 40 �C at 720 �C min�1, then to 250 �Cat 60 �C min�1 and held for 5 min; solvent venting as desorptionmode and vent time of 0.01 min. Simultaneously, the analyteswere transferred into the PTV-injector where they were cryogeni-cally focused at �80 �C, using liquid nitrogen. The injection modewas set as solvent vent; vent flow of 50 mL min�1 and vent pres-sure of 0 psi until min 0; purge flow to split vent of 5 mL min�1
at min 1; gas saver of 20 mL min�1 after 2 min. The initial injectiontemperature was programmed at �80 �C, then heated to 280 �C at12 �C s�1 and held for 5 min. The GC was equipped with a DB-5MScapillary column (30 m � 0.25 mm; film thickness 0.25 lm). Theinjector temperature was 220 �C and helium carrier gas flow ratewas 1.2 mL min�1. MS parameters were as follows: the transfer-line was set to 230 �C; the source was 230 �C; the quadrupole tem-perature was 150 �C; and the scan range was from 30 to 300 m/z ata rate of 3 scans s�1. Spectral deconvolution was performed withAMDIS software version 2.69 (Stein, 1999) and spectral alignmentwas performed with Mass Profiler Professional (version B2.01; Agi-lent, Santa Clara, CA, USA).
Volatile compound identity was confirmed by matching reten-tion time and mass spectra of authentic standards whenever pos-sible. The percent relative response ratio of each volatilecompound was calculated using the internal standard peak area.
All samples were analysed in triplicate.
2.4.3.3. Ultra-fast chromatography and surface acoustic wave sensoranalysis. An ultra-fast gas chromatograph (GC) coupled with a sur-face acoustic wave (SAW) sensor called zNose™ (model 4500; Elec-tronic Sensor Technology-EST; Newbury Park, CA, USA), was usedas a rapid method for volatile compounds analysis. The UFGC–SAW analysis was carried out in two steps, sampling and injection.A detailed description of the sampling and injection parameters isfound in Vallone et al. (2012).
2.5. Statistical analysis
The sensory data was captured by the Compusense softwareprogram, which converted each panellist rating to a value between1.00 and 9.00 (with 1.00 anchored at the low intensity end and9.00 anchored at the high intensity end of the scale). A four-wayanalysis of variance (generalised Linear Model) was run with amixed model (9 judges � 5 ripening stages � 3 cultivars � 3 plant-ing dates). The judges were evaluated as a random effect. The over-all panel performance, judge repeatability and discriminationability were evaluated on a randomly selected set of replicatesusing the software PanelCheck version 1.4.0 (Tomic et al., 2010).
A three-way analysis of variance (ANOVA) was performed toanalyse the effects of maturity at harvest, cultivar and plantingdate on sensory attributes, physical and chemical measurements.Tukey’s test was performed for all pair-wise comparisons to evalu-ate statistically significant differences among the means. A princi-pal component analysis (PCA) was performed to reduce thedimensionality of the data, and to visualise relations among allthe variables (sensory and physiochemical). First, Pearson’s corre-lation coefficients were calculated for each pair-wise combination,using log transformed and mean centered data. Then the new vari-ables (principal components) were obtained from the eigenvectorsof the estimated correlation matrix of the original variables (Bor-gognone, Bussi, & Hough, 2001). Since the variables measuredhad different units, the correlation matrix was selected to stan-dardise the original variables and obtain a variance equal to 1.
The Scree test was used to select the number of principal compo-nents to retain. Regression analysis was performed on selectedvariables for which the assumption of dependence was satisfied,and the coefficient of determination and significance of the slopewere calculated. The analysis of variance and Tukey’s test wereperformed using the statistical program SAS (version 9.1.3; SASInstitute Inc., Cary, NC, USA), while JMP (version 10.0.0; SAS Insti-tute Inc., Cary, NC, USA) was used for principal component andregression analysis. Pearson’s correlation analysis was performedusing the package Hmisc (Harrell & with contributions from manyother users, 2012) in the statistical programming language R (R2.14.0-Development Core Team 2008, Vienna, Austria).
3. Results and discussion
3.1. Physiochemical and sensory evaluation of three melon cultivars atdifferent maturity stages
Maturity at harvest is one of the key factors influencing melonquality, due to the numerous physiological changes that take placeduring the ripening process. As expected with field-grown fruit,significant differences were observed in some sensory and physio-chemical parameters, not only as a function of maturity and culti-var, but also as influenced by environmental factors (i.e., ‘‘plantingdate’’) (Table 2, Table S3). Changes in natural environment that oc-curred between the three growing periods may have influenced thecomposition of the fruits at harvest time. An increase in maximumair temperature as well as a decrease in photosynthetic active radi-ation (PAR) were observed between the first and last planting date(data not shown). In some muskmelon varieties, a seasonal varia-tion in colour, SSC and sugar content has been observed (Beaulieu,2005; Beaulieu, Lea, Eggleston, & Peralta-Inga, 2003).
3.1.1. Sensory evaluationJudge performance quality, based on the evaluation reproduc-
ibility on a replicate set of samples, was evaluated using Panel-Check (Tomic et al., 2010). This analysis showed that the panelused the attributes in a similar and consistent way (data notshown).
Significant differences in most sensory attributes were foundacross maturity stages and among the three cultivars (Table 2). Sig-nificant planting date and interactions effects were also observedfor various sensory attributes.
When scores for each sensory attribute were averaged across allmaturity stages and planting dates, the cultivar Navigator was gen-erally perceived to have the highest ‘‘intensity of colour’’, ‘‘overallaroma’’, ‘‘sweet taste’’, and ‘‘fruity flavour’’, and a lower intensityof ‘‘cucumber aroma’’ and ‘‘bitter taste’’ (Table S1). Mas Rico gener-ally had the lowest perceived ‘‘intensity of colour’’ and ‘‘fruity aro-ma’’, but was scored high for ‘‘cucumber aroma’’, ‘‘firmness’’ and‘‘crunchiness’’. The Thunderbird cultivar was the most bitter andhad the lowest ‘‘sweet taste’’ and ‘‘fruity flavour’’ intensities. Previ-ous studies comparing sensory attributes in different melon culti-vars also found significant differences in taste, aroma and textureperception (Senesi, Di Cesare, Prinzivalli, & Lo Scalzo, 2005; Senesi,Lo Scalzo, Prinzivalli, & Testoni, 2002).
The different cultivars tended to follow similar changes in sen-sory perception during maturation. The sensory scores for ‘‘colourintensity’’, ‘‘overall aroma’’, ‘‘fruity aroma’’, ‘‘marshmallow aroma’’,‘‘musky aroma’’, ‘‘juiciness’’, ‘‘sweet taste’’, ‘‘fruity flavour’’ and‘‘after flavour’’ increased with increasing maturity, while sensoryscores for ‘‘cucumber aroma’’, ‘‘firmness’’, ‘‘crunchiness’’, ‘‘fibrous-ness’’ and ‘‘sour taste’’ attributes generally decreased as maturityincreased. The largest increase in perceived intensity was foundbetween ‘‘pre-slip light’’ and ‘‘dark’’ stages for ‘‘colour intensity’’,
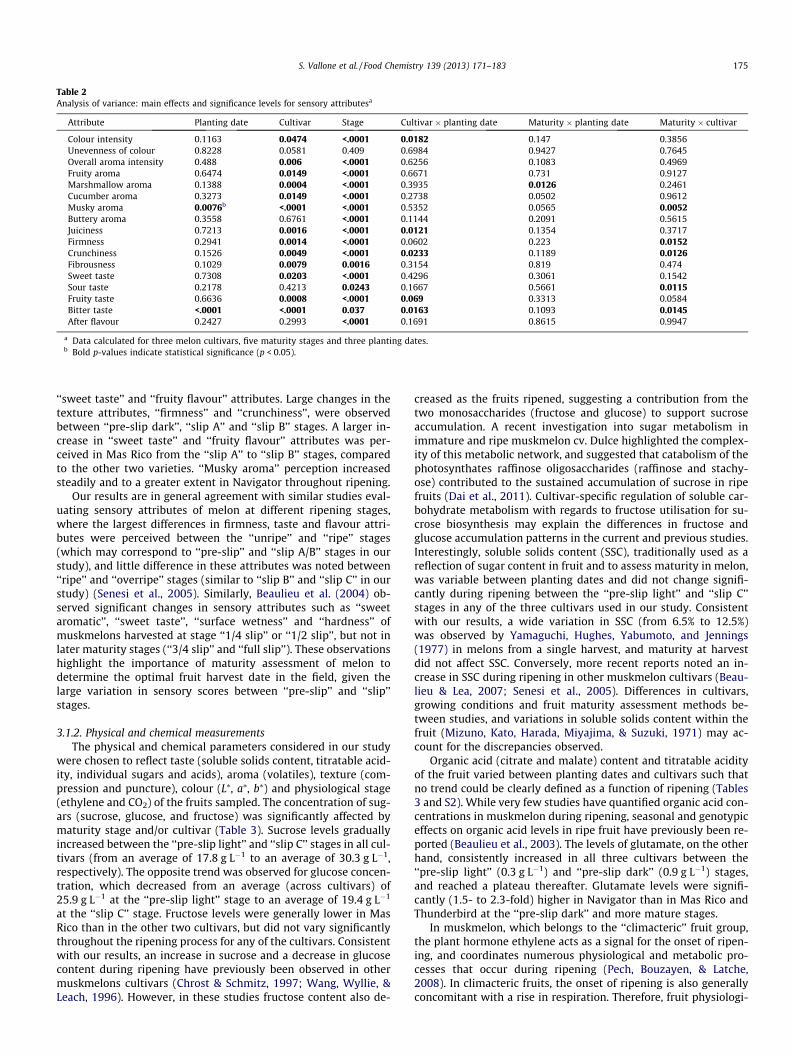
Table 2Analysis of variance: main effects and significance levels for sensory attributesa
Attribute Planting date Cultivar Stage Cultivar � planting date Maturity � planting date Maturity � cultivar
Colour intensity 0.1163 0.0474 <.0001 0.0182 0.147 0.3856Unevenness of colour 0.8228 0.0581 0.409 0.6984 0.9427 0.7645Overall aroma intensity 0.488 0.006 <.0001 0.6256 0.1083 0.4969Fruity aroma 0.6474 0.0149 <.0001 0.6671 0.731 0.9127Marshmallow aroma 0.1388 0.0004 <.0001 0.3935 0.0126 0.2461Cucumber aroma 0.3273 0.0149 <.0001 0.2738 0.0502 0.9612Musky aroma 0.0076b <.0001 <.0001 0.5352 0.0565 0.0052Buttery aroma 0.3558 0.6761 <.0001 0.1144 0.2091 0.5615Juiciness 0.7213 0.0016 <.0001 0.0121 0.1354 0.3717Firmness 0.2941 0.0014 <.0001 0.0602 0.223 0.0152Crunchiness 0.1526 0.0049 <.0001 0.0233 0.1189 0.0126Fibrousness 0.1029 0.0079 0.0016 0.3154 0.819 0.474Sweet taste 0.7308 0.0203 <.0001 0.4296 0.3061 0.1542Sour taste 0.2178 0.4213 0.0243 0.1667 0.5661 0.0115Fruity taste 0.6636 0.0008 <.0001 0.069 0.3313 0.0584Bitter taste <.0001 <.0001 0.037 0.0163 0.1093 0.0145After flavour 0.2427 0.2993 <.0001 0.1691 0.8615 0.9947
a Data calculated for three melon cultivars, five maturity stages and three planting dates.b Bold p-values indicate statistical significance (p < 0.05).
S. Vallone et al. / Food Chemistry 139 (2013) 171–183 175
‘‘sweet taste’’ and ‘‘fruity flavour’’ attributes. Large changes in thetexture attributes, ‘‘firmness’’ and ‘‘crunchiness’’, were observedbetween ‘‘pre-slip dark’’, ‘‘slip A’’ and ‘‘slip B’’ stages. A larger in-crease in ‘‘sweet taste’’ and ‘‘fruity flavour’’ attributes was per-ceived in Mas Rico from the ‘‘slip A’’ to ‘‘slip B’’ stages, comparedto the other two varieties. ‘‘Musky aroma’’ perception increasedsteadily and to a greater extent in Navigator throughout ripening.
Our results are in general agreement with similar studies eval-uating sensory attributes of melon at different ripening stages,where the largest differences in firmness, taste and flavour attri-butes were perceived between the ‘‘unripe’’ and ‘‘ripe’’ stages(which may correspond to ‘‘pre-slip’’ and ‘‘slip A/B’’ stages in ourstudy), and little difference in these attributes was noted between‘‘ripe’’ and ‘‘overripe’’ stages (similar to ‘‘slip B’’ and ‘‘slip C’’ in ourstudy) (Senesi et al., 2005). Similarly, Beaulieu et al. (2004) ob-served significant changes in sensory attributes such as ‘‘sweetaromatic’’, ‘‘sweet taste’’, ‘‘surface wetness’’ and ‘‘hardness’’ ofmuskmelons harvested at stage ‘‘1/4 slip’’ or ‘‘1/2 slip’’, but not inlater maturity stages (‘‘3/4 slip’’ and ‘‘full slip’’). These observationshighlight the importance of maturity assessment of melon todetermine the optimal fruit harvest date in the field, given thelarge variation in sensory scores between ‘‘pre-slip’’ and ‘‘slip’’stages.
3.1.2. Physical and chemical measurementsThe physical and chemical parameters considered in our study
were chosen to reflect taste (soluble solids content, titratable acid-ity, individual sugars and acids), aroma (volatiles), texture (com-pression and puncture), colour (L⁄, a⁄, b⁄) and physiological stage(ethylene and CO2) of the fruits sampled. The concentration of sug-ars (sucrose, glucose, and fructose) was significantly affected bymaturity stage and/or cultivar (Table 3). Sucrose levels graduallyincreased between the ‘‘pre-slip light’’ and ‘‘slip C’’ stages in all cul-tivars (from an average of 17.8 g L�1 to an average of 30.3 g L�1,respectively). The opposite trend was observed for glucose concen-tration, which decreased from an average (across cultivars) of25.9 g L�1 at the ‘‘pre-slip light’’ stage to an average of 19.4 g L�1
at the ‘‘slip C’’ stage. Fructose levels were generally lower in MasRico than in the other two cultivars, but did not vary significantlythroughout the ripening process for any of the cultivars. Consistentwith our results, an increase in sucrose and a decrease in glucosecontent during ripening have previously been observed in othermuskmelons cultivars (Chrost & Schmitz, 1997; Wang, Wyllie, &Leach, 1996). However, in these studies fructose content also de-
creased as the fruits ripened, suggesting a contribution from thetwo monosaccharides (fructose and glucose) to support sucroseaccumulation. A recent investigation into sugar metabolism inimmature and ripe muskmelon cv. Dulce highlighted the complex-ity of this metabolic network, and suggested that catabolism of thephotosynthates raffinose oligosaccharides (raffinose and stachy-ose) contributed to the sustained accumulation of sucrose in ripefruits (Dai et al., 2011). Cultivar-specific regulation of soluble car-bohydrate metabolism with regards to fructose utilisation for su-crose biosynthesis may explain the differences in fructose andglucose accumulation patterns in the current and previous studies.Interestingly, soluble solids content (SSC), traditionally used as areflection of sugar content in fruit and to assess maturity in melon,was variable between planting dates and did not change signifi-cantly during ripening between the ‘‘pre-slip light’’ and ‘‘slip C’’stages in any of the three cultivars used in our study. Consistentwith our results, a wide variation in SSC (from 6.5% to 12.5%)was observed by Yamaguchi, Hughes, Yabumoto, and Jennings(1977) in melons from a single harvest, and maturity at harvestdid not affect SSC. Conversely, more recent reports noted an in-crease in SSC during ripening in other muskmelon cultivars (Beau-lieu & Lea, 2007; Senesi et al., 2005). Differences in cultivars,growing conditions and fruit maturity assessment methods be-tween studies, and variations in soluble solids content within thefruit (Mizuno, Kato, Harada, Miyajima, & Suzuki, 1971) may ac-count for the discrepancies observed.
Organic acid (citrate and malate) content and titratable acidityof the fruit varied between planting dates and cultivars such thatno trend could be clearly defined as a function of ripening (Tables3 and S2). While very few studies have quantified organic acid con-centrations in muskmelon during ripening, seasonal and genotypiceffects on organic acid levels in ripe fruit have previously been re-ported (Beaulieu et al., 2003). The levels of glutamate, on the otherhand, consistently increased in all three cultivars between the‘‘pre-slip light’’ (0.3 g L�1) and ‘‘pre-slip dark’’ (0.9 g L�1) stages,and reached a plateau thereafter. Glutamate levels were signifi-cantly (1.5- to 2.3-fold) higher in Navigator than in Mas Rico andThunderbird at the ‘‘pre-slip dark’’ and more mature stages.
In muskmelon, which belongs to the ‘‘climacteric’’ fruit group,the plant hormone ethylene acts as a signal for the onset of ripen-ing, and coordinates numerous physiological and metabolic pro-cesses that occur during ripening (Pech, Bouzayen, & Latche,2008). In climacteric fruits, the onset of ripening is also generallyconcomitant with a rise in respiration. Therefore, fruit physiologi-

Table 3Physical and chemicala parameters measured in three melon cultivars harvested at five maturity stages from three planting dates.
Cultivarb Maturityc Planting date Puncture Compression L⁄ a⁄ b⁄ Hue Ethylene CO2 SSC TA Glutamic acid Citric acid Malic acid Sucrose Glucose Fructose(N) (N) (lL kg�1 h�1) (mL kg�1 h�1) (%) (%) (g L�1) (g L�1) (g L�1) (g L�1) (g L�1) (g L�1)
T PL 1 18.0 40.2 65.1 11.6 37.0 0. 30 2.7 186.7 8.7 0.08 0.29 3.06 0.34 18.0 28.0 29.02 19.1 36.9 63.5 9.1 34.2 0.26 1.7 102.4 7.8 0.31 0.17 2.98 0.32 14.6 26.7 28.63 18.7 50.6 64.8 7.9 32.6 0.24 6.1 170.7 8.7 0.06 0.22 3.17 0.31 12.1 25.8 25.8
M PL 1 19.0 46.0 66.2 11.0 37.3 0.29 3.2 193.4 10.7 0.27 0.52 2.96 0.45 37.3 26.1 26.52 18.0 45.7 66.3 9.7 34.7 0.27 3.6 201.8 8.0 0.07 0.21 2.48 0.43 16.3 26.2 25.53 21.8 48.2 66.9 9.8 35.2 0.27 3.4 127.9 6.6 0.08 0.29 2.78 0.38 8.4 24.1 24.2
N PL 1 16.5 39.9 67.4 10.5 35.5 0.29 3.8 236.0 9.4 0.04 0.73 2.46 0.41 23.3 28.2 28.62 16.7 38.7 66.3 9.9 32.8 0.29 13.9 189.6 7.9 0.95 0.27 2.56 0.34 15.3 26.2 27.03 16.2 41.4 67.9 10.5 35.4 0.29 6.0 249.8 9.0 0.03 0.40 2.68 0.02 14.7 21.8 27.2
T PD 1 12.6 27.4 65.9 10.7 38.0 0.27 3.3 177.8 9.3 0.06 0.64 2.41 0.40 26.3 29.1 31.22 11.8 23.3 63.9 10.2 35.0 0.28 8.3 126.8 9.9 0.27 0.55 2.54 0.36 30.7 25.9 27.63 18.6 36.8 62.6 10.3 35.0 0.29 2.9 258.3 10.0 0.12 0.35 3.16 0.36 30.6 26.0 27.1
M PD 1 16.8 41.9 65.6 11.9 38.3 0.30 3.3 203.8 11.2 0.23 0.88 2.73 0.51 43.7 25.4 26.42 17.0 34.0 64.1 10.9 35.4 0.30 16.2 128.9 9.0 0.06 0.55 1.98 0.49 25.1 24.7 24.83 19.4 36.2 67.9 10.5 34.8 0.29 5.3 151.9 7.6 0.06 0.64 2.21 0.48 17.9 22.2 22.4
N PD 1 15.7 37.1 65.5 11.9 37.6 0.31 7.2 210.2 10.4 0.03 1.36 2.22 0.49 34.2 26.0 28.32 11.6 27.4 62.7 10.2 33.3 0.29 12.1 253.7 10.0 0.79 1.39 1.61 0.45 27.1 26.6 27.83 16.4 35.7 65.8 11.5 36.3 0.31 6.1 252.9 10.6 0.05 1.35 2.17 0.16 21.4 22.4 19.7
T Sa 1 6.6 14.6 68.6 9.9 35.6 0.27 21.9 240.1 8.5 0.06 0.68 1.94 0.24 21.7 20.8 23.62 7.7 15.8 58.1 10.1 33.0 0.30 13.9 70.2 8.8 0.32 0.84 2.15 0.30 23.4 24.6 28.63 7.6 17.5 63.4 10.0 35.2 0.28 19.0 175.7 8.3 0.07 0.57 2.87 0.23 23.8 25.8 29.8
M Sa 1 7.8 18.3 62.6 11.9 38.1 0.30 15.7 172.7 10.6 0.24 1.11 2.86 0.37 38.6 26.1 28.12 13.1 32.3 63.0 11.1 35.7 0.30 13.8 160.0 9.4 0.06 0.69 1.67 0.43 28.9 25.4 26.33 11.8 23.6 65.1 10.2 34.4 0.29 13.8 172.4 8.0 0.06 1.20 1.93 0.41 24.5 20.1 20.6
N Sa 1 8.8 21.8 64.5 11.7 36.7 0.31 19.1 175.8 10.2 0.04 1.49 2.33 0.42 33.4 27.0 28.82 11.2 25.5 65.3 11.7 36.4 0.31 20.5 295.3 9.1 0.68 1.26 0.85 0.49 29.1 23.3 25.33 9.5 20.5 66.1 11.8 36.7 0.31 20.3 263.6 9.6 0.05 1.13 2.17 0.02 16.1 22.1 27.3
T Sb 1 5.6 10.9 67.1 11.1 37.8 0.28 15.5 213.5 8.0 0.06 0.98 1.93 0.29 22.1 21.3 25.82 9.7 23.4 61.4 10.7 36.1 0.29 13.5 152.4 8.9 0.30 1.22 1.46 0.41 28.3 21.6 26.33 7.7 14.3 61.6 11.1 35.8 0.30 19.2 267.2 8.7 0.06 0.72 2.24 0.30 25.5 20.7 24.9
M Sb 1 11.7 31.6 62.8 11.3 37.2 0.29 23.9 263.5 10.3 0.24 1.23 2.47 0.44 40.6 22.6 24.82 7.7 14.3 56.2 10.8 33.6 0.31 11.3 138.9 9.6 0.06 0.60 2.18 0.44 36.1 21.0 23.53 9.2 20.8 65.2 11.0 35.5 0.30 19.1 173.0 9.1 0.06 0.96 2.07 0.40 34.3 19.8 22.2
N Sb 1 7.2 14.1 60.9 11.0 34.1 0.31 16.1 176.8 9.2 0.04 1.53 1.67 0.48 31.4 22.0 26.12 9.2 20.8 62.2 11.0 34.8 0.30 11.0 253.4 8.1 0.76 1.59 0.92 0.49 21.3 21.0 23.73 8.6 22.1 64.6 11.9 36.8 0.31 20.4 208.9 9.4 0.05 1.97 1.78 0.04 29.0 28.0 35.9
T Sc 1 4.1 11.6 67.6 10.8 37.1 0.28 16.4 201.8 8.2 0.06 0.83 1.77 0.31 27.7 18.9 26.22 6.1 11.6 62.6 10.2 35.2 0.28 12.6 59.7 8.7 0.29 1.24 1.88 0.38 25.7 21.8 26.23 6.1 16.6 61.4 9.6 33.6 0.28 20.4 212.7 8.7 0.06 0.56 1.91 0.33 32.6 18.3 24.3
M Sc 1 5.4 16.6 63.5 11.5 37.4 0.30 19.8 221.0 9.6 0.30 0.64 2.87 0.29 35.8 21.7 26.12 8.7 22.8 59.6 11.9 36.0 0.32 14.2 167.4 10.3 0.06 0.78 2.24 0.49 42.2 19.6 21.83 9.1 22.0 62.5 12.4 37.2 0.32 13.6 210.6 9.8 0.07 0.68 2.19 0.48 42.8 18.2 20.1
N Sc 1 6.5 16.8 61.7 11.1 35.8 0.30 15.8 175.6 9.0 0.04 1.73 1.62 0.55 31.8 18.3 24.42 6.4 15.8 59.4 10.9 34.5 0.31 7.1 201.0 8.6 1.21 0.85 1.29 0.53 28.5 18.7 24.03 8.1 18.0 64.4 12.1 37.1 0.31 19.2 217.0 9.0 0.05 1.70 0.79 0.02 5.4 19.0 21.5
Data are reported as mean value of three replicates.a Volatile compounds are reported in Table 4.b Cultivar: T = Thunderbird; M = Mas Rico; N = Navigator.c Maturity stage at harvest: PL = pre-slip light; PD = pre-slip dark; Sa = slip A; Sb = slip B; Sc = slip C.
176S.V
alloneet
al./FoodChem
istry139
(2013)171–
183

S. Vallone et al. / Food Chemistry 139 (2013) 171–183 177
cal state during ripening was monitored using flesh ethylene pro-duction rates and respiration rates. These parameters were highlyvariable and affected by environmental factors; however, a generaltrend in ethylene production could be noted, as there was asignificant and consistent sharp increase in ethylene productionrate between the ‘‘pre-slip dark’’ (7.2 lL kg�1 h�1) and ‘‘slip A’’(17.6 lL kg�1 h�1) stages in all three cultivars. This sharpincrease in ethylene production may constitute a signal for theinitiation of faster ripening and may explain the sharper decreasein firmness between these two stages, as ethylene has beenshown to regulate cell wall breakdown in melon (Nishiyamaet al., 2007).
Comprehensive analysis of melon volatile profiles was carriedout using headspace sorptive extraction coupled with GC–MS(HSSE-GC–MS), and 82 volatile compounds were detected (Table 4).Consistent with previous reports (Beaulieu, 2006; Beaulieu &Grimm, 2001; Senesi et al., 2005; Wang et al., 1996; Wyllie, Leach,Wang, & Shewfelt, 1995), the total volatile content significantly in-creased during ripening. Total volatile concentration in ‘‘pre-slip’’and ‘‘slip A’’ fruit was less than 20% and 50%, respectively, that offully ripe fruits (‘‘slip B’’). Among all the volatiles detected,twenty-eight compounds were significantly affected by fruit matu-rity at harvest (Table 4).
Volatile esters were the predominant constituents of melonflesh aroma, representing from 48% to 94% of the total volatilesmeasured in pre-slip and slip B fruits, respectively.
Several volatiles measured in this study were previously identi-fied as important muskmelon aroma compounds (Beaulieu &Grimm, 2001; Homatidou, Karvouni, Dourtoglou, & Poulos, 1992;Jordan, Shaw, & Goodner, 2001; Kourkoutas, Elmore, & Mottram,2006; Wyllie & Leach, 1992; Wyllie, Leach, Wang, & Shewfelt,1994). Various esters quantified in our study were previouslyinvestigated for their sensory significance in melon aroma andhave been identified as odour active compounds by gas chroma-tography–olfactometry (Jordan et al., 2001; Schieberle, Ofner, &Grosch, 1990; Wyllie et al., 1994). As reported by these authors,some esters measured in our study were found to activelycontribute to the fruity and floral notes characteristic of melon ar-oma, including isobutyl acetate (described as floral), ethyl 3-(methylthio)propanoate (clean/fresh/melon/green), heptyl acetate(clean/fresh/floral), and (Z)-3-hexen-1-yl acetate (green/herbal/banana).
The aldehyde fraction greatly decreased in ripe fruits. Althoughenvironmental conditions affected the concentrations of nearly allaldehydes, hexanal, 2-heptenal and 2,4-nonedienal were generallypresent at higher concentration in early mature fruits compared tofully ripe fruits. Beaulieu and Grimm (2001) also found higher con-centration of 2-heptenal in immature muskmelons (Cucumis meloreticulatus group cv. Sol Real and Athena). Hexanal and (E)-2-non-enal, both measured in our study, have been reported to be respon-sible for green and cucumber-like notes in melon and in cucumber(Cucumis sativus L.) aroma (Schieberle et al., 1990; Ullrich & Grosch,1987). The remaining fraction of the total volatile profile was com-prised of sulphur-containing esters, alcohols, ketones, terpenoids,norisoprenoids and unidentified compounds. The concentrationof sulphur-containing esters, alcohols and terpenoids significantlyincreased as fruits ripened.
In addition to ripening-associated changes in melon aroma,quantitative differences in volatile concentrations were observedbetween the three cultivars investigated in this study. Cultivar-specific differences in aroma profiles were also reported in previ-ous studies (Beaulieu & Grimm, 2001; Obando-Ulloa, Ruiz, Mon-forte, & Fernandez-Trujillo, 2010; Senesi et al., 2005; Wyllie &Leach, 1992; Yamaguchi et al., 1977), highlighting a strong geneticcontrol of the aromatic trait.
On average, the total volatile content was higher in Navigatorthan in Thunderbird and Mas Rico (68% and 36% of the total vola-tile content of Navigator, respectively).
Although sulphur-containing esters were measured in all threecultivars, a significant increase in ethyl-(methylthio)acetate andethyl-3-(methylthio)propionate concentrations was observed dur-ing ripening only in Navigator. In a broad screening conducted on26 melon cultivars with the intent to investigate the incidence ofsulphur-containing esters in the aroma profile, ethyl-(methyl-thio)acetate was frequently detected and its presence in the aromaextract appeared to be cultivar dependent (Wyllie & Leach, 1992).
3.2. Investigating relationships between sensory attributes andphysiochemical parameters
To investigate relationships among sensory perception andphysiochemical parameters, and the effects of ripening on overallmelon flavour, a correlation analysis was performed on all vari-ables, followed by principal component analysis (PCA) on the cor-relations matrix to visualise the relationships. The first sixcomponents explained 70.3% of the total variation, with the firsttwo components accounting for 43.8% and 10.5% of the total vari-ation (Fig. 1). While variation along the second component waslikely due to environmental effects, on the first component, separa-tion of the samples was primarily driven by maturity at harvest.Early mature fruits (‘‘pre-slip’’ light and dark) clustered on the leftside of the plot and were negatively correlated with the more ma-ture fruits (‘‘slip B’’ and ‘‘slip C’’), which were grouped on the oppo-site quadrant (Fig. 1).
Indeed, all the variables that had significantly higher values inpre-slip fruits were found on the left quadrant of the plot. Fleshtexture (‘‘compression’’ and ‘‘puncture’’) was positively correlatedwith sensory firmness (r = 0.87 and 0.92) and crunchiness(r = 0.88 and 0.92) sensory attributes, which were scored high in‘‘pre-slip’’ fruits (Fig. 1). Cucumber aroma was significantly corre-lated to firmness, as measured with both Texture Analyzer andby the sensory panel (r P 0.81). ‘‘Cucumber aroma’’ was also corre-lated with the volatile compound, 2-heptenal (r = 0.78), which isderived from oxidation/degradation of fatty acids and has beenpreviously reported to contribute to the flavour of fresh cucumbers(Grosch & Schwarz, 1971; Ullrich & Grosch, 1987). Significant asso-ciations between the sensory attributes ‘‘hardness’’, ‘‘cucurbit’’(which could correspond to our sensory ‘‘firmness’’ and ‘‘cucumberaroma’’) and total aldehyde levels were also found in the WesternShipper cultivar Sol Real (Beaulieu & Lancaster, 2007).
Ethylene was produced at higher levels in fully ripe fruits andwas also negatively correlated to firmness evaluated using bothinstrumental (compression and puncture: r = �0.69 and �0.74)and sensory assessments (crunchiness and firmness: r = �0.74and �0.75). Ethylene has been shown to play an important rolein the regulation of many ripening processes including fruit soften-ing in melon (Ayub et al., 1996; Hadfield et al., 2000; Pech et al.,2008). For example, in ripening Charentais melons (Cucumis melo,cantalupensis group), fruit softening due to cell wall disassemblywas shown to be an ethylene-dependent mechanism (Nishiyamaet al., 2007). Ethylene has also been shown to be involved in regu-lating volatile production and aroma development during melonripening (Bauchot, Mottram, Dodson, & John, 1998; El-Sharkawyet al., 2005; Flores et al., 2002). Consistently, we observed that infully ripe fruits, sensory attributes such as ‘‘overall aroma inten-sity’’, ‘‘juiciness’’, ‘‘fruity flavour’’, ‘‘marshmallow aroma’’ and ‘‘fru-ity aroma’’ were significantly correlated with ethylene production(r P 0.59). In addition, ethylene production was highly correlatedwith the concentrations of numerous volatile compounds, particu-

Table 4Analysis of variance of volatile compounds: significance levels of main effects and interactions.
Volatile compound CAS # RTa RIb RIc Cultivar Maturity Planting date Maturity � cultivar Maturity � planting date Cultivar � planting date
1 Ethyl acetate 141-78-6 2.12 674 605/628d 0.045 0.005 0.735 0.532 0.827 0.3082 Propyl acetate 109-60-4 2.99 722 707/720d 0.023 0.015 0.167 0.087 0.249 0.1883 Ethyl isobutyrate 97-62-1 3.68 761 751/762d <.0001 <.0001 0.471 0.0002 0.435 0.4544 Isobutyl acetate 110-19-0 3.94 775 768/776d 0.025 <0.001 0.361 0.829 0.608 0.1295 Hexanal 66-25-1 4.44 802 801 0.306 0.009 0.002 0.580 0.012 0.0376 Ethyl butanoate 105-54-4 4.50 804 803 <.0001 <.0001 0.190 <.0001 0.277 0.2257 Butyl acetate 123-86-4 4.81 816 812 0.002 <.0001 0.094 0.004 0.296 0.3628 2-Ethyl-3-methylbutanal 26254-92-2 5.29 834 0.871 0.154 0.001 0.297 0.009 0.0239 Ethyl 2-methylbutanoate 7452-79-1 5.69 849 846 <.0001 <.0001 0.533 0.0003 0.660 0.59510 Methyl thiobutyrate 2432-51-1 5.78 852 869* <.0001 0.0003 0.176 0.003 0.496 0.22111 2-Methylpropyl propanoate 540-42-1 6.21 868 863 0.007 0.0002 0.142 0.072 0.505 0.02712 Hexanol 111-27-3 6.32 872 865 0.0002 <.0001 0.333 0.002 0.816 0.44113 3-Methylbutyl acetate 123-92-2 6.47 878 876 0.144 0.001 0.035 0.132 0.005 0.60714 2 Methylbutyl acetate 624-41-9 6.53 880 877 0.001 <.0001 0.012 0.187 0.020 0.626
2-Butyl furan 4466-24-4 6.87 892 894d 0.082 0.153 0.123 0.119 0.156 0.16115 Heptanal 111-71-7 7.14 902 902 <.0001 0.015 0.001 0.171 0.056 0.00116 Ethyl pentanoate 539-82-2 7.17 903 898d <.0001 0.002 0.130 0.003 0.497 0.08517 Pentyl acetate 628-63-7 7.61 916 912 0.006 <.0001 0.003 0.055 0.017 0.26618 Butyl propanoate 590-01-2 7.74 920 907 0.236 0.005 0.024 0.926 0.408 0.00119 Prenyl acetate 1191-16-8 7.89 924 918 0.006 <.0001 0.411 0.011 0.409 0.33720 Methyl hexanoate 106-70-7 7.93 925 922 <.0001 <.0001 0.784 <.0001 0.582 0.82721 S-methyl 3-methylbutanethioate 23747-45-7 8.34 938 938 0.061 <.0001 0.297 0.678 0.833 0.04322 Ethyl (E)-2-methyl-2-butenoate 5837-78-5 8.43 940 949d <.0001 <.0001 0.071 <.0001 0.517 0.07723 2-Heptenal 18829-55-5 8.93 955 955 0.058 <.0001 0.019 0.174 0.022 0.07824 Isobutyl butanoate 539-90-2 8.96 956 953d 0.004 <.0001 0.006 0.004 0.077 0.17725 Benzaldehyde 100-52-7 9.02 958 962 <0.001 <.0001 0.696 0.004 0.847 0.28726 3-Methylbutyl propanoate 105-68-0 9.52 972 974d 0.001 0.002 0.202 0.015 0.122 0.00227 1-Octen-3-one 4312-99-6 9.71 978 975 0.082 0.002 0.048 0.683 0.817 0.57428 1-Octen-3-ol 3391-86-4 9.77 980 978 <.0001 0.001 0.317 0.200 0.299 0.00129 Ethyl (methylthio)acetate 4455-13-4 9.91 984 981 <0.001 <.0001 0.298 0.003 0.614 0.24930 6-Methyl, 5-hepten-2-one 110-93-0 10.02 987 985d 0.223 0.319 0.001 0.304 0.132 0.26431 2-Pentylfuran 3777-69-3 10.14 991 989/992d 0.658 0.496 0.033 0.650 0.440 0.15832 2-Octanone 111-13-7 10.16 991 992d 0.005 0.001 0.010 0.561 0.971 0.66633 Ethyl hexanoate 123-66-0 10.50 1001 999 <.0001 <.0001 0.328 <.0001 0.629 0.19234 Octanal 124-13-0 10.55 1003 1003 0.001 0.095 0.011 0.007 0.018 <.000135 (Z)-3-hexen-1-ol, acetate 3681-71-8 10.75 1008 1004/1008d 0.001 <.0001 0.063 0.008 0.373 0.15736 Hexyl acetate 142-92-7 10.98 1015 1011/1015d 0.023 <.0001 0.012 0.120 0.068 0.26437 (E)-4-hexen-1-yl acetatee 42125-17-7 11.27 1023 0.003 <.0001 0.037 0.018 0.102 0.32838 Methyl heptanoate 106-73-0 11.36 1025 1021 <.0001 <.0001 0.055 <.0001 0.393 0.03539 Limonene 5989-27-5 11.38 1026 1029 0.002 0.109 0.495 0.033 0.038 0.26040 Eucalyptol 470-82-6 11.47 1028 1032/1030d 0.004 <.0001 0.008 0.041 0.217 0.03941 2-Ethyl hexan-1-ol 104-76-7 11.51 1029 1029* 0.001 0.072 0.106 0.364 0.767 0.20242 Benzyl alcohol 100-51-6 11.73 1035 1033 0.021 0.0003 0.523 0.075 0.498 0.73743 2,6-Dimethyl-4-heptanone 68514-40-9 12.16 1047 0.260 0.299 0.012 0.386 0.134 0.000244 (E)-oct-2-enal 2548-87-0 12.50 1057 1060d 0.011 0.690 0.173 0.906 0.838 0.06445 2,3-Butanedioldiacetate (I) 1114-92-7 12.77 1064 1064 0.002 <.0001 0.809 0.012 0.964 0.15746 1-Octanol 111-87-5 13.03 1072 1070 0.008 0.014 0.273 0.030 0.858 0.80647 2,3-Butanedioldiacetate (II) 1114-92-7 13.24 1077 0.040 <.0001 0.851 0.115 1.000 0.18048 2-Nonanone 821-55-6 13.76 1092 1091d 0.004 0.007 0.003 0.008 0.127 0.05749 Methyl benzoate 93-58-3 13.80 1093 1091d 0.006 0.003 0.421 0.115 0.980 0.070
Tetrahydro linalool 78-69-3 13.97 1098 1098d 0.367 0.907 0.422 0.403 0.553 0.40950 Ethyl 3-(methylthio) propionate 13327-56-5 14.02 1099 1098 <.0001 <.0001 0.076 <.0001 0.420 0.10951 Nonanal 124-19-6 14.18 1104 1104 0.001 0.101 0.088 0.270 0.081 0.002
n-Amyl isovalerateIS 25415-62-7 14.36 1108 110752 Heptyl acetate 112-06-1 14.53 1113 1111 0.825 <.0001 0.002 0.614 0.044 0.092
178S.V
alloneet
al./FoodChem
istry139
(2013)171–
183

53 Methyl octanoate 111-11-5 14.95 1125 1126d <.0001 <.0001 0.143 <.0001 0.446 0.123Unknown1 15.68 1146 <.0001 0.305 0.246 0.623 0.126 <.0001
54 2-Ethylhexyl acetate 103-09-3 15.88 1151 1144* 0.004 <.0001 <.0001 0.070 0.136 0.28755 (E)-2-nonenal 18829-56-6 16.14 1159 1162/1155d 0.001 0.350 0.753 0.941 0.825 0.05256 Benzyl acetate 101-41-7 16.33 1164 1261d <.0001 <.0001 0.147 0.024 0.340 0.49657 Ethyl benzoate 93-89-0 16.51 1169 1172/1170d <.0001 <.0001 0.109 <.0001 0.442 0.159
Unknown2 17.19 1188 0.014 <.0001 0.766 0.294 0.459 0.65358 Ethyl octanoate 106-32-1 17.52 1197 1194 <.0001 0.001 0.062 0.0003 0.398 0.06259 Decanal 112-31-2 17.77 1205 1205 0.001 0.347 0.128 0.675 0.259 0.01760 Octyl Acetate 112-14-1 18.02 1212 1213 0.017 0.0001 0.013 0.133 0.093 0.13661 2,4-Nonadienal 5910-87-2 18.04 1213 1216 0.482 0.002 0.511 0.090 0.925 0.18362 b-Ciclocitral 432-25-7 18.22 1218 1220 0.012 0.083 <.0001 0.314 0.733 0.05663 Ethylphenyl acetate 101-97-3 19.12 1244 1243 <.0001 <.0001 0.433 <.0001 0.624 0.33264 2-Phenylethyl acetate 103-45-7 19.51 1256 1255 0.302 <.0001 0.001 0.549 0.263 0.10565 (E)-2-decenal 3913-81-3 19.68 1261 1261d 0.118 0.430 0.621 0.798 0.330 0.025
Unknown3 19.90 1267 0.014 0.011 0.932 0.391 0.081 <.000166 2-Undecanone 112-12-9 20.78 1293 1296d 0.019 0.048 0.018 0.055 0.181 0.10767 Undecanal 112-44-7 21.21 1306 1306 0.002 0.787 0.288 0.621 0.081 0.02568 a-Terpinyl acetate 80-26-2 22.57 1348 1350d 0.001 0.0002 0.373 0.116 0.590 0.003
Unknown4 22.60 1349 0.064 0.452 0.090 0.370 0.159 0.30769 3-Phenylpropyl acetate 122-72-5 23.26 1369 1373 0.284 0.001 0.012 0.689 0.116 0.379
Unknown 5 23.32 1371 0.025 0.500 0.052 0.317 0.173 0.31770 Ethyl decanoate 110-38-3 24.11 1396 1392 <.0001 0.022 0.098 0.146 0.456 0.018
Tetradecane 629-59-4 24.21 1399 1399d 0.065 0.725 0.439 0.681 0.260 0.24571 Dodecanal 112-54-9 24.49 1408 1407d 0.001 0.603 0.408 0.263 0.111 0.02072 Geranyl acetone 3796-70-1 25.85 1453 1448/1453d 0.017 0.150 0.001 0.324 0.948 0.08373 b-Ionone 14901-07-6 26.84 1485 1484 0.005 0.237 <.0001 0.301 0.934 0.06674 Dihydroactinidiolide 17092-92-1 27.91 1533 1539d 0.042 0.442 0.003 0.187 0.560 0.147
Bold p-values indicate statistical significance (<0.05).a RT: retention time expressed in minutes.b RI: retention indices calculated from C8–C20 n-alkanes.c RI: retention indices reported in the literature for DB-5MS capillary GC columns (Beaulieu & Grimm, 2001).d RI: retention index reported in Pherobase, Flavournet and NIST library 8.0 for DB-5MS and HP-5MS capillary GC column.e Tentatively identified.
* RI: retention index reported in Pherobase on DB-1 capillary column.IS Internal standard.
S.Vallone
etal./Food
Chemistry
139(2013)
171–183
179

Fig. 1. Biplot from Principal Component Analysis of physical and chemical parameters and sensory attributes. Symbol shape corresponds to different cultivars:square = Thunderbird; triangle = Mas Rico; circle = Navigator. Maturity is represented by different shades of grey: open symbols, light grey = pre-slip light; filled symbols,light grey = pre-slip dark; filled symbols, dark grey = slip A; filled symbols, black = slip B; open symbols, black = slip C. Numbers correspond to identified volatiles reported inTable 4; only the volatiles significantly influenced by maturity at harvest, cultivar and/or planting date effects were included in the analysis. The length of the dotted arrowsfrom the origin of the axis to a particular parameter indicates how well the variation in that parameter is explained by the model.
180 S. Vallone et al. / Food Chemistry 139 (2013) 171–183
larly esters, e.g., 2-methylbutyl acetate (r = 0.73), pentyl acetate(r = 0.66), heptyl acetate (r = 0.63), and hexyl acetate (r = 0.63).
The ‘‘fruity aroma’’ sensory attribute was significantly and pos-itively correlated with many volatiles, including benzyl acetate,pentyl acetate, hexyl acetate, benzaldehyde, eucalyptol, heptyl ace-tate, isobutyl butanoate and prenyl acetate (correlation coefficientsr P 0.76). Benzyl acetate, hexyl acetate and eucalyptol have previ-ously been described in various melon types as characteristic im-pact flavour or aroma compounds (CIFAC) with fruity, floral and/or fresh odour characters (Beaulieu, 2005; Jordan et al., 2001;Kourkoutas et al., 2006).
Two isomers of 2,3-butanediol diacetate detected in our sam-ples have also been reported in several melon varieties (Beaulieu& Grimm, 2001; Homatidou et al., 1992; Kourkoutas et al., 2006;Wyllie & Leach, 1990). The racemic mixture was described to havea sweet smell and high odour threshold, and therefore suggestednot to significantly impact the aroma of melon cv. Golden Crispy(Wyllie & Leach, 1990). In our samples, however, both isomerswere positively correlated to the ‘‘marshmallow aroma’’ sensoryattribute (r = 0.76).
‘‘Musky aroma’’ was positively correlated to the presence ofethyl-(methylthio)acetate and ethyl butanoate (r P 0.80). In ourstudy the perception of ‘‘musky aroma’’ was higher in Navigator;the volatile profile for this variety was also significantly richer in sul-phur-containing esters compared to the other varieties. It has beenreported that trace amounts of some sulphur compounds, such asethyl-(methylthio)acetate, might contribute to the musky note inmuskmelon (Cucumis melo cv. Makdimon) (Wyllie et al., 1994).
‘‘Sweet taste’’ was positively correlated to concentrations of su-crose (r = 0.53), as expected, and more surprisingly, to glutamicacid (r = 0.53). Human sweet and umami taste receptors, locatedin taste buds, respond to diverse sweetening components (suchas sugars, synthetic sweeteners and sweet-tasting proteins) andglutamate and purine nucleotides (such as 50-inosine monophos-phate and 50-guanosine monophosphate), respectively. Interest-ingly, sweet and umami receptor protein complexes have beenshown to share a common subunit (Li et al., 2002), and severalstudies in rats have suggested that glutamate can activate bothtypes of receptors, likely evoking both sweet and umami tastes(Heyer, Taylor-Burds, Tran, & Delay, 2003; Ninomiya et al., 2000;Sako & Yamamoto, 1999; Yamamoto et al., 1991). While the roleof glutamate as flavour enhancer is well established in human tasteperception, most studies have focused on the effect of glutamateconcentration on taste modalities (e.g. saltiness, bitterness andumami) associated with savoury foods (Fuke & Ueda, 1996; Yeo-mans, Gould, Mobini, & Prescott, 2008). On the other hand, the spe-cific effect – if any – of glutamate on sweetness perception inhumans is still unclear (Kemp & Beauchamp, 1994; Maga, 1983).Our results suggest an intriguing role for glutamate in sweetnessperception in melons that warrants further investigation.
3.3. Evaluation of melon flavour quality using a portable ultra-fast gaschromatograph (the zNose™)
An analysis of variance performed on a total of 22 peaks mea-sured by UFGC–SAW showed that the abundance of 6 peaks (peak

S. Vallone et al. / Food Chemistry 139 (2013) 171–183 181
2, 5, 9, 13, 14 and 17) was significantly influenced by maturity atharvest regardless of the cultivar, although some quantitative dif-ferences were also observed between cultivars (Table S3).
To our knowledge, no previous UFGC–SAW studies investigatedrelationships between peaks detected and sensory attributes. To-wards this goal, we selected peaks and sensory attributes that weresignificantly affected by maturity at harvest, cultivar and/or plant-ing date, and a PCA was performed on the correlation matrix(Fig. 2). The first two components accounted for 62% of the totalvariance explained. Consistent with aforementioned results ofPCA on physiochemical parameters and sensory attributes, thesamples separation was driven by a maturity effect on the firstcomponent, while a planting date effect was the main driver ofthe separation on the second component. As shown in the biplot(Fig. 2), peaks 9 and 14 were positively correlated to ‘‘cucumber ar-oma’’ (r = 0.83 and 0.85), ‘‘firmness’’ (r = 0.78) and ‘‘crunchiness’’(r = 0.78 and 0.77) sensory attributes. In fully ripe fruits, the high-est significant correlations for ‘‘fruity aroma’’ were observed withpeak 5 (r = 0.95), peak 2 (r = 0.90) and peak 17 (r = 0.93). Peak 17was also found to be significantly correlated to ‘‘sweet taste’’ and‘‘fruity flavour’’ attributes (r = 0.70 and 0.73).
To evaluate the prediction ability of these correlations, regres-sion analysis was conducted on aforementioned sensory attributesand peaks. Significant linear relationships were observed between‘‘fruity aroma’’ and peak 2 (R2 = 0.81; y = 4.8301x � 0.5669), peak 5(R2 = 0.78; y = 0.5095646 + 0.0773868x) and peak 17 (R2 = 0.54;
Fig. 2. Biplot from principal component analysis of peaks from UFGC–SAW analysquare = Thunderbird; triangle = Mas Rico; circle = Navigator. Maturity is represented bylight grey = pre-slip dark; filled symbols, dark grey = slip A; filled symbols, black = slip B;axis to a particular parameter indicates how well the variation in that parameter is exp
y = 0.3484706 + 0.0919787x), and between peak 17 and ‘‘fruity fla-vour’’ (R2 = 0.70; y = 0.2985612 + 0.1009298x), and ‘‘sweet taste’’(R2 = 0.67; y = 0.3883602 + 0.0964181x). Significant linear relation-ships were also observed between ‘‘cucumber aroma’’ and peaks 9and 14, although they only explained 38% and 41% of the modelvariation, respectively.
These results indicate that several peaks detected by UFGC–SAW may represent markers for these sensory attributes.
This technology has been used in several studies for rapid vola-tile analysis of fresh produce (Du, Olmstead, & Rouseff, 2012; Li,Heinemann, & Irudayaraj, 2007; Li, Wang, Raghavan, & Vigneault,2009; Vallone et al., 2012; Watkins & Wijesundera, 2006). How-ever, to our knowledge, only few studies have focused on fruitmaturity assessment using UFGC–SAW.
To evaluate mango (Mangifera indica L.) ripeness, Li et al. (2009)selected a peak, whose concentration increased consecutively therespiration climacteric, and used it to predict mango ripeness,achieving an 80% accuracy rate.
UFGC–SAW analysis has also been used in a recent investigationto discriminate among blueberries harvested at three maturitystages (Du et al., 2012). Using 14 selected peaks, a clear separationbetween fully ripe and less ripe berries was successfully achievedfor one of the two cultivars assessed (‘‘Primadonna’’ and ‘‘Jewel’’).As the authors suggested, the greater separation of the fully ripeberries of the cultivar ‘‘Primadonna’’ might be ascribed to the high-er level of total volatiles produced by this cultivar.
sis and sensory attributes. Symbol shape corresponds to different cultivars:different shades of grey: open symbols, light grey = pre-slip light; filled symbols,
open symbols, black = slip C. The length of the dotted arrows from the origin of thelained by the model.

182 S. Vallone et al. / Food Chemistry 139 (2013) 171–183
4. Conclusions
Maturity at harvest, cultivar and planting date qualitatively andquantitatively affected chemical composition and physical charac-teristics of melon, ultimately impacting sensory perception.
Overall, the perception of sweetness, fruity and musky noteswas greater in ripe fruit, while cucumber notes were predominantin less ripe fruit. Instrumental measurements of flesh firmnesswere generally correlated with sensory texture perception. Afteresters, aldehydes were the most abundant group of volatiles inpre-slip fruit. Hexanal, typically imparting green notes to fruit aro-mas, was the predominant aldehyde measured, while 2-heptenalwas significantly correlated with cucumber aroma in pre-slip fruit.In riper fruit, esters and sulphur containing compounds predomi-nated and correlated with perceived fruity and musky aromas.The cultivar Navigator was generally perceived to have the highestintensity of colour, aroma, taste, and flavour attributes, while MasRico scored higher for cucumber notes and firmness. Identifying allthe variables affecting fruit quality and monitoring them duringthe pre- and post-harvest life of a fruit remains a challenge dueto the lack of a single rapid, comprehensive method for physio-chemical analysis.
Volatiles play an important role in determining melon flavour,and the significant correlations existing among various volatilesand sensory attributes found in our and previous studies, suggestthat this relationship might be potentially exploited to predict sen-sory perception by measuring volatiles.
Here, a portable volatile sensing system (UFGC–SAW) was ableto discriminate melons of different maturity stages based on 6measured peaks, whose abundances were positively correlated tosensory attributes associated with different maturity stages of mel-on. Our findings suggest that this technology shows much promisefor future applications in rapid aroma measurement. Further inves-tigations are needed to confirm the ability of the UFGC–SAWinstrument in predicting fruit sensory properties.
Acknowledgements
This project was supported by the Specialty Crops Research Ini-tiative Competitive Grants Program Grant No. 2009-51181-05783from the USDA National Institute of Food and Agriculture. We aregrateful to Bill Copes (HM. Clause) for providing the melons usedin this study, and to Robin Clery (Givaudan) for his kind gift of2,3-butanediol diacetate. We thank Edward Orgon, Michael Mace,Aly Depsky and Sharon Wei for technical assistance.
Appendix A. Supplementary data
Supplementary data associated with this article can be found, inthe online version, at http://dx.doi.org/10.1016/j.foodchem.2012.12.042.
References
Ayub, R., Guis, M., BenAmor, M., Gillot, L., Roustan, J. P., Latche, A., et al. (1996).Expression of ACC oxidase antisense gene inhibits ripening of cantaloupe melonfruits. Nature Biotechnology, 14(7), 862–866.
Bauchot, A. D., Mottram, D. S., Dodson, A. T., & John, P. (1998). Effect ofaminocyclopropane-1-carboxylic acid oxidase antisense gene on theformation of volatile esters in cantaloupe Charentais melon (Cv. Vedrandais).Journal of Agricultural and Food Chemistry, 46(11), 4787–4792.
Beaulieu, J. C. (2005). Within-season volatile and quality differences in stored fresh-cut cantaloupe cultivars. Journal of Agricultural and Food Chemistry, 53(22),8679–8687.
Beaulieu, J. C. (2006). Volatile changes in cantaloupe during growth, maturation,and in stored fresh-cuts prepared from fruit harvested at various maturities.Journal of the American Society for Horticultural Science, 131(1), 127–139.
Beaulieu, J. C., & Grimm, C. C. (2001). Identification of volatile compounds incantaloupe at various developmental stages using solid phase microextraction.Journal of Agricultural and Food Chemistry, 49(3), 1345–1352.
Beaulieu, J. C., Ingram, D. A., Lea, J. M., & Bett-Garber, K. L. (2004). Effect of harvestmaturity on the sensory characteristics fresh-cut cantaloupe. Journal of FoodScience, 69(7), S250–S258.
Beaulieu, J. C., & Lancaster, V. A. (2007). Correlating volatile compounds, sensoryattributes, and quality parameters in stored fresh-cut cantaloupe. Journal ofAgricultural and Food Chemistry, 55(23), 9503–9513.
Beaulieu, J. C., & Lea, J. M. (2007). Quality changes in cantaloupe during growth,maturation, and in stored fresh-cut cubes prepared from fruit harvested atvarious maturities. Journal of the American Society for Horticultural Science,132(5), 720–728.
Beaulieu, J. C., Lea, J. M., Eggleston, G., & Peralta-Inga, Z. (2003). Sugar and organicacid variations in commercial cantaloupes and their inbred parents. Journal ofthe American Society for Horticultural Science, 128(4), 531–536.
Borgognone, M., Bussi, J., & Hough, G. (2001). Principal component analysis insensory analysis: Covariance or correlation matrix? Food Quality and Preference,12, 323–326.
Chrost, B., & Schmitz, K. (1997). Changes in soluble sugar and activity of alpha-galactosidases and acid invertase during muskmelon (Cucumis melo L) fruitdevelopment. Journal of Plant Physiology, 151(1), 41–50.
Dai, N., Cohen, S., Portnoy, V., Tzuri, G., Harel-Beja, R., Pompan-Lotan, M., et al.(2011). Metabolism of soluble sugars in developing melon fruit: A globaltranscriptional view of the metabolic transition to sucrose accumulation. PlantMolecular Biology, 76(1–2), 1–18.
Du, X., Olmstead, J., & Rouseff, R. (2012). Comparison of fast gas chomatography–surface acoustic wave (FGC–SAW) detection and GC–MS for characterizingblueberry cultivars and maturity. Journal of Agricultural and Food Chemistry, 60,5099–5106.
El-Sharkawy, I., Manriquez, D., Flores, F. B., Regad, F., Bouzayen, M., Latche, A., et al.(2005). Functional characterization of a melon alcohol acyl-transferase genefamily involved in the biosynthesis of ester volatiles. Identification of the crucialrole of a threonine residue for enzyme activity. Plant Molecular Biology, 59(2),345–362.
Flores, F., El Yahyaoui, F., de Billerbeck, G., Romojaro, F., Latche, A., Bouzayen, M.,et al. (2002). Role of ethylene in the biosynthetic pathway of aliphatic esteraroma volatiles in Charentais cantaloupe melons. Journal of Experimental Botany,53(367), 201–206.
Fuke, S., & Ueda, Y. (1996). Interactions between umami and other flavorcharacteristics. Trends in Food Science & Technology, 7(12), 407–411 [Article].
Grosch, W., & Schwarz, J. M. (1971). Linoleic and linolenic acid as precursors of thecucumber flavor. Lipids, 6, 351–352.
Hadfield, K. A., Dang, T., Guis, M., Pech, J. C., Bouzayen, M., & Bennett, A. B. (2000).Characterization of ripening-regulated cDNAs and their expression in ethylene-suppressed Charentais melon fruit. Plant Physiology, 122(3), 977–983.
Harrell, F. E. and with contributions from many other users (2012). Hmisc: HarrellMiscellaneous. R package version 3.9-1. <http://CRAN.R-project.org/package=Hmisc>.
Heyer, B. R., Taylor-Burds, C. C., Tran, L. H., & Delay, E. R. (2003). Monosodiumglutamate and sweet taste: Generalization of conditioned taste aversionbetween glutamate and sweet stimuli in rats. Chemical Senses, 28(7), 631–641.
Homatidou, V. I., Karvouni, S. S., Dourtoglou, V. G., & Poulos, C. N. (1992).Determination of total volatile components of Cucumis melo L. varietycantaloupensis. Journal of Agricultural and Food Chemistry, 40(8), 1385–1388.
Jordan, M. J., Shaw, P. E., & Goodner, K. L. (2001). Volatile components in aqueousessence and fresh fruit of Cucumis melo cv. athena (muskmelon) by GC–MS andGC–O. Journal of Agricultural and Food Chemistry, 49(12), 5929–5933.
Kader, A. A. (2008). Perspective: Flavor quality of fruits and vegetables. Journal of theScience of Food and Agriculture, 88, 1863–1868.
Kemp, S. E., & Beauchamp, G. K. (1994). Flavor modification by sodium chloride andmonosodium glutamate. Journal of Food Science, 59(3), 682–686.
Kourkoutas, D., Elmore, J. S., & Mottram, D. S. (2006). Comparison of the volatilecompositions and flavour properties of cantaloupe, galia and honeydewmuskmelons. Food Chemistry, 97(1), 95–102.
Lester, G. (2006). Consumer preference quality attributes of melon fruits. ActaHorticulture, 712, 175–182.
Li, C., Heinemann, P. H., & Irudayaraj, J. (2007). Detection of apple deteriorationusing an electronic nose and zNose (TM). Transactions of the Asabe, 50(4),1417–1425.
Li, X. D., Staszewski, L., Xu, H., Durick, K., Zoller, M., & Adler, E. (2002). Humanreceptors for sweet and umami taste. Proceedings of the National academy ofSciences of the United States of America, 99(7), 4692–4696.
Li, Z. F., Wang, N., Raghavan, G. S. V., & Vigneault, C. (2009). Ripeness and rotevaluation of ‘Tommy Atkins’ mango fruit through volatiles detection. Journal ofFood Engineering, 91(2), 319–324.
Maga, J. A. (1983). Flavor potentiators. Crc Critical Reviews in Food Science andNutrition, 18(3), 231–312.
Mizuno, T., Kato, K., Harada, M., Miyajima, Y., & Suzuki, E. (1971). Studies on the freesugars and amino acids in a fruit of muskmelon. Journal of The Japanese Societyfor Food Science and Technology, 18, 319–325.
Ninomiya, Y., Nakashima, K., Fukuda, A., Nishino, H., Sugimura, T., Hino, A., et al.(2000). Responses to umami substances in taste bud cells innervated by the

S. Vallone et al. / Food Chemistry 139 (2013) 171–183 183
chorda tympani and glossopharyngeal nerves. Journal of Nutrition, 130(4),950S–953S.
Nishiyama, K., Guis, M., Rose, J. K. C., Kubo, Y., Bennett, K. A., Lu, W. J., et al. (2007).Ethylene regulation of fruit softening and cell wall disassembly in Charentaismelon. Journal of Experimental Botany, 58(6), 1281–1290.
Obando-Ulloa, J. M., Ruiz, J., Monforte, A. J., & Fernandez-Trujillo, J. P. (2010). Aromaprofile of a collection of near-isogenic lines of melon (Cucumis melo L.). FoodChemistry, 118(3), 815–822.
Pech, J. C., Bouzayen, M., & Latche, A. (2008). Climacteric fruit ripening: Ethylene-dependent and independent regulation of ripening pathways in melon fruit.Plant Science, 175(1–2), 114–120.
Pratt, H. (1971). Melons. The biochemistry of fruits and their products. NY: AcadamicPress. 207–232.
Sako, N., & Yamamoto, T. (1999). Analyses of taste nerve responses with specialreference to possible receptor mechanisms of umami taste in the rat.Neuroscience Letters, 261(1–2), 109–112.
Schieberle, P., Ofner, S., & Grosch, W. (1990). Evaluation of potent odorants incucumbers (Cucumis sativus) and muskmelons (Cucumis melo) by aroma extractdilution analysis. Journal of Food Science, 55(1), 193–195.
Senesi, E., Di Cesare, L. F., Prinzivalli, C., & Lo Scalzo, R. (2005). Influence of ripeningstage on volatiles composition, physicochemical indexes and sensoryevaluation in two varieties of muskmelon (Cucumis melo L var reticulatusNaud). Journal of the Science of Food and Agriculture, 85(8), 1241–1251.
Senesi, E., Lo Scalzo, R., Prinzivalli, C., & Testoni, A. (2002). Relationships betweenvolatile composition and sensory evaluation in eight varieties of nettedmuskmelon (Cucumis melo L var reticulatus Naud). Journal of the Science ofFood and Agriculture, 82(6), 655–662.
Stein, S. E. (1999). An integrated method for spectrum extraction and compoundidentification from gas chromatography/mass spectrometry data. Journal of theAmerican Society for Mass Spectrometry, 10(8), 770–781.
Stone, H., Sidel, J., Oliver, S., Woolsey, A., & Singleton, R. C. (1974). Sensoryevaluation by quantitative descriptive analysis. Food Technology, 28(11), 24–34.
Thimijan, R. W., & Heins, R. D. (1983). Photometric, radiometric, and quantum lightunits of measure – A review of procedures for interconversion. HortScience,18(6), 818–822.
Tomic, O., Luciano, G., Nilsen, A., Hyldig, G., Lorensen, K., & Naes, T. (2010).Analysing sensory panel performance in a proficiency test using the PanelChecksoftware. European Food Research and Technology, 230(3), 497–511.
Ullrich, F., & Grosch, W. (1987). Identification of the most intense volatile flavorcompounds formed during autoxidation of linoleic acid. Zeitschrift FurLebensmittel-Untersuchung Und-Forschung, 184(4), 277–282.
USDA-ERS. (2010, 05/2011). Vegetables and melons yearbook. <http://usda.mannlib.cornell.edu/MannUsda/viewDocumentInfo.do?documentID=1212> Accessed 6.1.2012.
Vallone, S., Lloyd, N. W., Ebeler, S. E., & Zakharov, F. (2012). Fruit volatile analysisusing an electronic nose. Journal of Visualized Experiments (61), e3821.
Vermeir, S., Nicolai, B. M., Jans, K., Maes, G., & Lammertyn, J. (2007). High-throughput microplate enzymatic assays for fast sugar and acid quantificationin apple and tomato. Journal of Agricultural and Food Chemistry, 55(9),3240–3248.
Wang, Y. M., Wyllie, S. G., & Leach, D. N. (1996). Chemical changes during thedevelopment and ripening of the fruit of Cucumis melo (cv Makdimon). Journalof Agricultural and Food Chemistry, 44(1), 210–216.
Watkins, P., & Wijesundera, C. (2006). Application of zNose (TM) for the analysis ofselected grape aroma compounds. Talanta, 70(3), 595–601.
Wyllie, S. G., Leach, D. N., Wang, Y. M., & Shewfelt, R. L. (1995). Key aromacompounds in melons – Their development and cultivar dependence fruit flavors:Biogenesis, characterization, and authentication (Vol. 596, pp. 248–257).Washington, DC: American Chemical Society.
Wyllie, S. G., Leach, D. N., & Wang, Y. (1996). Development of flavor attributes in thefruit of C. melo during ripening and storage. In G. R. Takeoka, R. Teranishi, P. J.Williams, & A. Kobayashi (Eds.), Biotechnology for improved foods and flavor(pp. 228–239). Washington, DC: American Chemical Society.
Wyllie, S. G., & Leach, D. N. (1990). Aroma volatiles of Cucumis melo cv GoldenCrispy. Journal of Agricultural and Food Chemistry, 38(11), 2042–2044.
Wyllie, S. G., & Leach, D. N. (1992). Sulfur-containing compounds in the aromavolatiles of melons (Cucumis melo). Journal of Agricultural and Food Chemistry,40(2), 253–256.
Wyllie, S. G., Leach, D. N., Wang, Y. M., & Shewfelt, R. L. (1994). Sulfur volatiles inCucumis melo Cv Makdimon (muskmelon) aroma – Sensory evaluation by gas-chromatography olfactometry. In C. J. Mussinan & M. E. Keelan (Eds.). Sulfurcompounds in foods (Vol. 564, pp. 36–48). Washington: American ChemicalSociety.
Yamaguchi, M., Hughes, D. L., Yabumoto, K., & Jennings, W. G. (1977). Quality ofcantaloupe muskmelons – Variability and attributes. Scientia Horticulturae, 6(1),59–70.
Yamamoto, T., Matsuo, R., Fujimoto, Y., Fukunaga, I., Miyasaka, A., & Imoto, T.(1991). Electrophysiological and behavioral studies on the taste of umamisubstances in the rat. Physiology & Behavior, 49(5), 919–925.
Yeomans, M. R., Gould, N. J., Mobini, S., & Prescott, J. (2008). Acquired flavoracceptance and intake facilitated by monosodium glutamate in humans.Physiology & Behavior, 93(4–5), 958–966.