food bowl route - department of infrastructure ... bowl rail alignment would solve for the region...
TRANSCRIPT

FOOD BOWLROUTE Summary Report


3
Summary Report
The Food Bowl Inland Rail Alliance
The Food Bowl Inland Rail Alliance (FBIRA) represents the local governments of Mitchell, Greater Shepparton, and Moira in Victoria and Berrigan, Jerilderie, Urana, Griffith, Leeton and Narrandera in NSW. The Alliance has been formed with the aim of ensuring the Australian Government gives further consideration to routing the Melbourne to Brisbane Inland Rail via the Food Bowl Route through Shepparton, Tocumwal and Narrandera given the extraordinary export growths being experienced in Australia’s most economically diverse and prosperous primary production and food processing region. The FBIRA is strongly supported by the extensive network of producers, value adding processors and suppliers within the region.
Inland Rail Food Bowl RouteThe Melbourne–Brisbane Inland Rail project is a once-in-a-generation opportunity to transform the movement of goods in eastern Australia. This will unequivocally increase relationships between Australians living in rural, regional, and major urban areas and it will create greater ties and stronger affiliations between domestic goods and the ever growing export markets around the globe. For these reasons it has rightly been championed by the Australian Government as a key piece of national infrastructure. This project will dramatically increase the efficiency and productivity of Australia’s freight rail industry, resulting in a more competitive inter-capital freight transport market.
However, the Inland Rail project can be much more. The Food Bowl Route runs through Australia’s major agricultural heartlands which already produce over $10 billion of the nation’s annual agricultural yield, and this infrastructure has the potential to unlock unprecedented economic growth and productivity gains:
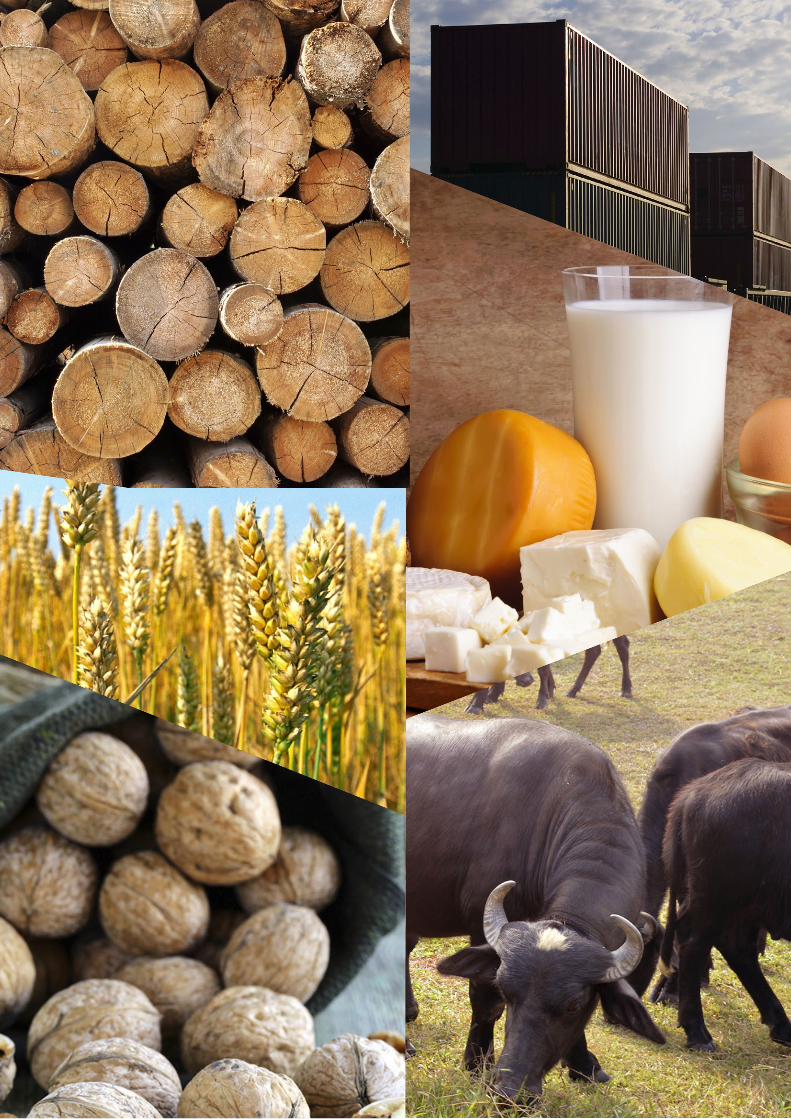
- The various geographic and climatic conditions across the Food Bowl, coupled with the extensive irrigation infrastructure, mean the region is home to a vast array of primary produce including dairy, grain, livestock, wine, fruit, vegetables, cotton, rice, tree nuts, timber and fertilisers. As the region continues to evolve, producers are adapting and diversifying into new and lucrative crops.
- The 2015 containerised rail freight demand in the Food Bowl Region is 54,000 TEU. The Food Bowl Route: Rail User Economics and Freight Commerce report projects this demand to more than double in the next five years to 116,427 TEU by 2020 and to more than triple to 169,829 TEU by 2035.
- In today’s global economy, international demand for fresh produce that has passed Australia’s world-leading processing standards can only increase. To meet this demand, Australian goods need unimpeded access to ports, to investment, to internal freighting and external exporting facilities and all this begins with careful consideration of this growing and economically impactful food bowl region.
3

- With appropriate planning, more detailed options analysis and shrewd foresight we can link some of our most innovative and diverse regional producers with domestic markets in our burgeoning cities, as well as the massive export market potential in Asia and beyond.
Whilst strongly supportive of the Inland Rail project, the FBIRA is adamant that the selection of the Albury–Wagga route recommended in the ARTC’s 2010 Melbourne–Brisbane Rail Alignment Study is flawed. Presently, the proposed route crosses southern NSW via Albury, Wagga Wagga, Junee and Cootamundra, and this decision was solely based on initial capital cost and the journey time between Melbourne and Brisbane. This conclusion of the 2010 study has several shortcomings that should be reconsidered, particularly in the context of selecting the Albury–Wagga Alignment over the Food Bowl Route:
- The two alternate options do not appear to have been costed on a like-for-like basis – the capital expenditure cost estimates used are too coarse for detailed options assessment and this must be remedied to fully appreciate the advantages of the FBIRA proposal.
- The study fails to adequately assess the potential demand from the Food Bowl Region, with the consequent benefits to the project gained through additional access and user revenues. In the five years since the 2010 study, the Food Bowl Region has experienced considerable growth as evidenced by the impressive private sector investment in the region.
- It is understood that the focus of the 2010 study is on Melbourne–Brisbane inter-capital freight; however, this should not preclude assessment of potential benefits for regional exporters and it should consider mutually beneficial alignment options that advantage both freight tasks. The forecast growth in the food bowl area, in both volume and diversity, merits further due diligence.
Benefits of the Food Bowl RouteThe Food Bowl Route provides significant freight efficiency for some producers when compared with the Wagga Wagga/Albury alignment. This is because receival sites located along the Food Bowl Route (for example at Wumbulgal) are closer than the intermodal freight terminals in Wagga Wagga and Albury. The reduced distance required to transport commodities to rail hubs located within close proximity to the prospective Food Bowl Inland Rail Route is an immediate saving to the producer and opens up additional export market opportunities.
Aside from the direct freight efficiency improvement, using the Food Bowl Route will also:
- provide greater opportunities for access to agricultural export markets, particularly through rail connection to the Port of Brisbane, as well as the Port of Melbourne, Port Botany and Port Kembla
- improve national freight network reliability and resilience and provide greater security of logistics chains
- generate the potential to reduce operating and maintenance costs through shorter route length and transit times, and lesser gradients and curvatures (subject to detailed investigation)
- maximise the use of existing intermodal and rail corridor infrastructure
- minimise externalities from road freight, particularly road damage costs borne by local government
- broaden the commercial agricultural opportunities between the states.
4

There have been many recent significant industry and external changes along the Food Bowl Route that will enhance industry’s ability to invest further, to attract investment, or to export. Three such examples are:
- The Connections Project which realises a $2 billion investment in the Murray Goulburn irrigation system. This project will help the area prepare for the massive demand from Asia for clean, green produce and it will attract investors who are keen to take advantage of these opportunities. This also presents an opportunity to provide for the market internally due to possible changes in food labelling legislation, driving shifts in consumer perceptions and buying habits.
- Baiada Poultry has submitted a $38 million development application to Griffith Council for a 20,000 square metre chicken hatchery capable of hatching three million chicks every week. Once completed, this will be the largest chicken processor in Australia.
- The establishment of the Agri Australis hazelnut plantation at Narrandera with over one million hazelnut trees is an example of a sub-industry which has enhanced the region’s ability to attract further investment and employment. There is also scope for growers to plant hazelnuts to complement cash crops and diversify their agribusinesses. In addition to Agri Australis’ exporting potential, this could lead to greater export opportunities for other local producers.
The Food Bowl region is home to almost 175,000 residents and produces over $10 billion of the nation’s agricultural produce:
DairyThe region produces over 20% of Australia’s dairy output, contributing approximately $4.3 billion to Australian GDP and directly employing around 10,000 people.
Broad acre cropsIn 2012-13 the region produced $3.8 billion in broad acre crops which is over 20% of Australia’s total supply.
Rice Rice production in Australia is located almost exclusively within the Food Bowl region, with 1,500 growers producing up to 1 million tonnes and generating annual revenues over $800 million.
CottonValue of exports from southern NSW reaching around $150 million in 2012-13.
LivestockProduction within the region was valued at almost $1.5 billion in 2012-13.
ChickenLargest poultry producer in Australia with plans for the largest hatchery in Australia to be built.
FruitsIn 2012-13 the region produced around 45% of Australia’s fruits.
Prunes Largest prune growing area in Australia.
5

Citrus FruitCitrus production is Australia’s largest fresh fruit export, with the Riverina producing 180,000 to 200,000 tonnes annually (70% of NSW production) worth $98 million.
WineThe region is Australia’s largest producer of wine (including 70% of NSW wine grapes) with Casella Wines responsible for 27% of Australian bottled table wine exports, including over 12.5 million cases per annum of the iconic Yellow Tail brand to 50 countries.
VegetablesVegetable production is worth over $400 million for the region.
Tree NutsThe value of almonds and walnuts grown in the region is over $1.2 billion annually and is expected to grow by over 30% to 2025 with exports accounting for 75% of production. This includes a new hazelnut plantation in Narrandera with over one million hazelnut trees.
RecommendationsARTC’s 2010 study notes appropriately that not all route combinations can be fully assessed given the sheer quantity; however the FBIRA believe that the Food Bowl Route is a viable alternative that deserves more detailed costing and value engineering.
The ARTC should conduct further due diligence including:
- detailed future demand forecasting of the food bowl area
- modelling of capital expenditure and return on investment
- investigation into Public Private Partnerships during the build stage to help facilitate the delivery of this important piece of infrastructure.
The FBIRA has already undertaken significant demand forecasting in the Food Bowl Route: Rail User Economics and Freight Commerce report and it has summarised key considerations in the Food Bowl Route: Council Challenges and Demand Information report. This most recent report addresses the major issues that the Food Bowl rail alignment would solve for the region and discusses issues which must be addressed by the Government if the Melbourne-Brisbane Inland Rail is not developed.
This project of national significance has the ability to guarantee Australian food security and also to allow greater access to lucrative export markets by attracting additional investment into the Food Bowl area. Thus, further investigation into the Food Bowl Route is essential before an informed final decision can be made on which rail route offers the greatest long-term benefit to Australia.
6
7

FOOD BOWLROUTE Council Challenges and Demand Information


3
Summary of Food Bowl Route Council Challenges and Demand Information
Further to the Food Bowl Inland Rail Alliance meeting with John Anderson (Chairperson, Inland Rail Implementation Group) it was requested that Councils along the Food Bowl Route be consulted, with the key considerations being as follows:
1. What are the major issues that the Food Bowl rail alignment would solve for our region?
2. What if the Melbourne-Brisbane Inland Rail is not developed? What are the issues that must be addressed by Government?
Responses from Shepparton City Council, Narrandera Shire Council, Griffith City Council, Berrigan Shire Council, Leeton Shire Council, Urana Shire Council and Jerilderie Shire Council have been collated.
1. What are the major issues that the Food Bowl rail alignment would solve for our region?
Australia deserves the best access to expansion and exporting. In today’s international climate, the demand for exports of fresh produce that have been exposed to Australia’s strict processing standards can only increase.
Further considerations include:
- Increased national freight network reliability, competitiveness and resilience and greater security of logistics chains.
- Benefits that creation of a true network will deliver for the freight rail industry, with gauge standardisation between all of north eastern Victoria and southern NSW and greater opportunity for private equity participation including public and private partnerships.
- Reduction in operating and maintenance costs through shorter route length and transit times, and lesser gradients and curvatures.
- Opportunities to maximise the use of existing intermodal and rail corridor infrastructure.
- The Food Bowl route will service areas that represent major irrigated food and fibre agriculture industries within eastern Australia. These industries are world leading in the production of enormous quantities of clean and green product that is valued worldwide.
- Wider externality benefits that will be derived through attracting more freight from the Food Bowl to rail, in particular reduced road damage costs which are borne by local government and the states. This will provide benefits for all interstate transport users and Councils.
- Fast, efficient, larger volume and cost effective freight movement from Food Bowl for export.
- A positive impact on the ability of business and industry in the Food Bowl Region to be globally competitive.
- The Food Bowl Route would create increased transport mode shift from road to rail. This will have a cumulative effect where the efficiencies would result in greater demand, in turn generating likely investment in intermodal terminals such as at Shepparton.
- Freight currently goes to the Port of Melbourne by road or rail and is then shipped internationally. The Food Bowl Route will mean that exports from the Berrigan area could be sent directly to the Port of Brisbane.
3

The Food Bowl Route provides significant freight efficiency for some producers when compared with the Wagga Wagga/Albury alignment. This is because receival sites (eg at Wumbulgal) located along the Food Bowl Route are closer than the intermodal freight terminals in Wagga Wagga and Albury. The reduction in distance required to transport commodities to rail hubs located within close proximity to the prospective Food Bowl Inland Rail Route is a direct saving to the producer and opens up additional export market opportunities.
An example of cost efficiency for industries in the Narrandera area utilising Wumbulgal rather than Wagga Wagga if the Food Bowl route existed is provided below:
Based on $5 per km haulage x2 (return of truck)
Narrandera to Wagga
$969 per 25 tonnes =
$38.76 per tonne
Narrandera to Wumbulgal
$688 per 25 tonnes =
$27.52 per tonne
Freight Transport Saving to producer $11.24 per tonne
6510 (TEU) x 25 tonnes = 162,750 x $11.24 saving in transport cost
Overall saving to producers annually $1,829,310
Not only is this a direct saving to the producer, it also streamlines commodity turnover enabling greater output and profitability.
Australian Grain Link have also stated that should the Food Bowl Route become operational, utilising the intermodal site at Wumbulgal would attract an additional 550,000 tonnes of grain that can be containerised and freighted to the Port of Melbourne. This could be achieved at a $10 per tonne efficiency resulting in a combined saving for the local grain industry of $5,500,000 annually. When factoring in other agricultural commodities produced in the Riverina such as cotton seed the figure would be significantly higher.
Whilst opportunity will exist for items to be freighted as far as Wagga Wagga by road and then transferred to rail for the remainder of the direct-to-port journey, this would be a secondary solution that would result in freight inefficiencies with costs borne by industry.
Industries such as Sunrice, JBS Swift (Riverina Beef) and Southern Cotton have indicated that they would prefer rail over road due to difficulty with truck companies, greater loading capacities, freight logistics and ability to access Brisbane or Sydney ports.
Additional issues that the Food Bowl rail alignment would solve for our region include:
- Assist in economic growth, allowing for industries to relocate from already overcrowded centres.
4

- Provide the impetus for further investment in the region. The options currently available for transfer of product to port are a major consideration of potential investors. Growing businesses such as the Agri Australis hazelnut plantation and Goulburn Valley Freight Logistics Centre (GV Link - land earmarked for this development located at Toolamba Road, Mooroopna) would have greater scope for freight transfer and export expansion. New export industries to China and Japan demonstrate the commitment from international investors in Leeton area exports.
- Efficient and cost effective access to ports will encourage other domestic producers to expand into the export market as well as increasing the global competitiveness of the food bowl route’s agricultural industry.
- Local economic growth through increased employment opportunities and incentive for people to move into the region.
The Hume region, as a single example, is a key generator of freight but with most freight currently transferred by road there is a significant opportunity to ensure the most productive and viable rail route is chosen through high yield cropping and irrigation country. This would increase the volume transported by rail which in turn would provide further benefits such as safety, reduced environmental impacts, lessened congestion, increased productivity and time savings.
Where freight is trucked in (for example empty wine bottles) and then trucked out again (as filled wine bottles) the producer would benefit from the opportunity to utilise rail for both options.
There have been significant industry and external changes in LGAs along the Food Bowl Route that will enhance industry’s ability to invest further, attract investment, or export. These include:
- Increase in grain production and movement through grain handling facilities.
- The Connections Project realises a $2B investment in the Murray Goulburn irrigation system. There is massive demand from Asia for clean, green, produce and investors are keen to take advantage of these opportunities.
- The possible changes to food labelling legislation ensuring imported foods list their country of origin may also positively impact local producers as the Australian reputation for quality agriculture and food production is renowned worldwide. This may further encourage consumer demand for Australian produce rather than imported (often cheaper) goods. Changing consumer perceptions and buying habits is achievable (for example, preference for free ranged eggs over caged eggs now evident across Australia).
- Baiada/ Steggles Griffith - with a $9.3m development application expansion - wanting to increase processing throughput to 2.8m chickens a week. This will be the largest chicken processor in Australia if not the Southern Hemisphere. Another major advancement includes a possible new Rail Hub and logistics park.
- The establishment of the Agri Australis hazelnut plantation at Narrandera (over 1 million hazelnut trees) is one example of a sub-industry which has enhanced the region’s ability to attract further investment and employment. There is also scope for growers to plant hazelnuts to complement cash crops and diversify their agribusinesses. In addition to Agri Australis’ exporting potential, this could lead to greater export potential for other local producers.
- A larger number of competitive grain handling firms provides grain producers with greater selling options. Increased on-farm storage allows for all year selling rather than only during and immediately after harvest.
- Massive and growing rail-contestable export demand from the Food Bowl Region, including the greater opportunity for competition between export gateways. Much of this demand is already conducive to rail and the diversity of produce will provide year-round demand.
5
2. What if the Melbourne-Brisbane Inland Rail is not developed? What are the issues that must be addressed by Government?
- Road congestion will continue to increase.
- Increased costs of doing business and projected road freight growth for the highways through the Food Bowl will require huge investment to compensate for lack of rail options for industry. This will increase pressure on Councils’ roads maintenance programmes. The increase in road freight will also add to significant pollution and road trauma.
- Road costs and produce costs will increase as road infrastructure deteriorates. This will greatly impact on the business economic potential, directly impacting on the Food Bowl region’s economic growth through limited incentive to businesses to invest and grow in the area.
- Food Bowl producers will lose the opportunity for highest competitiveness of the product. This will be reflected at market due to the impact on delivery reliability and cost of freight.
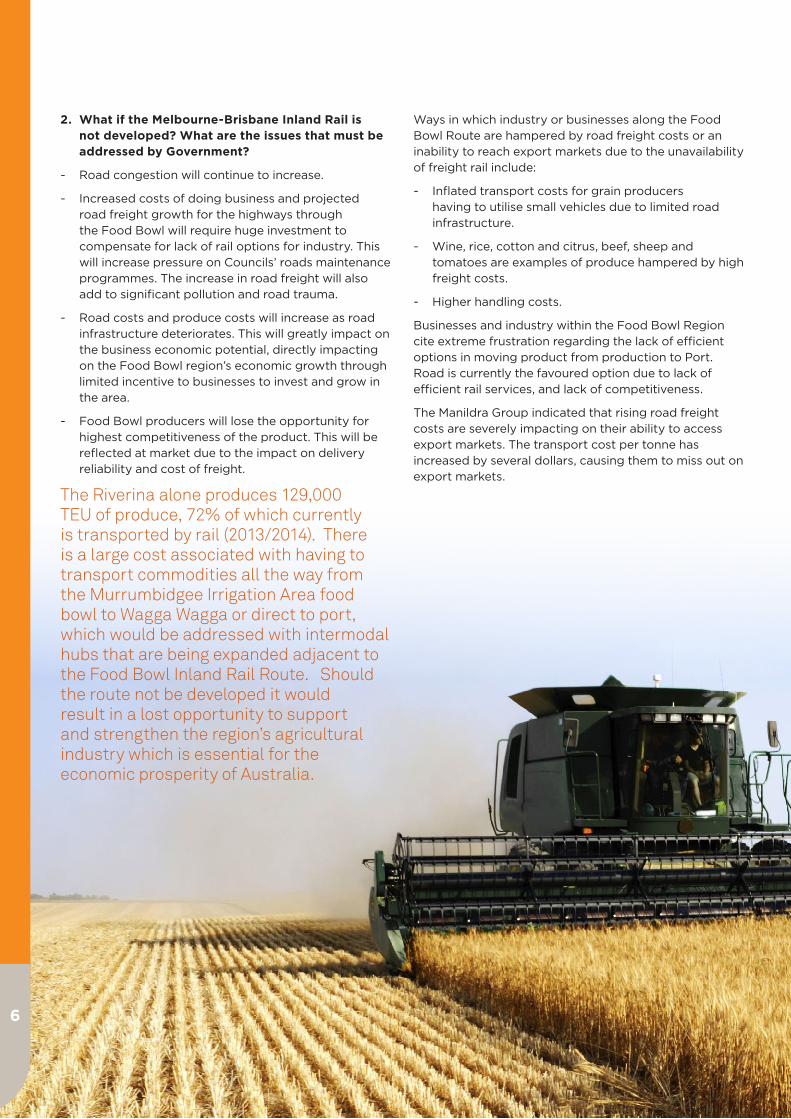
The Riverina alone produces 129,000 TEU of produce, 72% of which currently is transported by rail (2013/2014). There is a large cost associated with having to transport commodities all the way from the Murrumbidgee Irrigation Area food bowl to Wagga Wagga or direct to port, which would be addressed with intermodal hubs that are being expanded adjacent to the Food Bowl Inland Rail Route. Should the route not be developed it would result in a lost opportunity to support and strengthen the region’s agricultural industry which is essential for the economic prosperity of Australia.
Ways in which industry or businesses along the Food Bowl Route are hampered by road freight costs or an inability to reach export markets due to the unavailability of freight rail include:
- Inflated transport costs for grain producers having to utilise small vehicles due to limited road infrastructure.
- Wine, rice, cotton and citrus, beef, sheep and tomatoes are examples of produce hampered by high freight costs.
- Higher handling costs.
Businesses and industry within the Food Bowl Region cite extreme frustration regarding the lack of efficient options in moving product from production to Port. Road is currently the favoured option due to lack of efficient rail services, and lack of competitiveness.
The Manildra Group indicated that rising road freight costs are severely impacting on their ability to access export markets. The transport cost per tonne has increased by several dollars, causing them to miss out on export markets.
6

Furthermore in the absence of inland rail:
- Government subsidies could be provided to producers to support ‘local growers’ and generate profitability and expansion in both the domestic and export markets.
- Government could provide Councils, who are already investing heavily to attract investors, with assistance packages or grants to facilitate infrastructure upgrades. For example supply of power needed for the continued expansion of Baiada/Steggles in Griffith.
- Sealing of key roads would assist the establishment of Rail Hubs that would enable growth.
- Prioritisation of the duplication of the Goulburn Valley Highway is needed from Shepparton to the NSW/Victorian border.
- An upgrade is required at the rail to Port of Melbourne interchange. There is congestion on the railway interchange which has a significant impact on the efficiency of the operations throughout the supply chain.
- The Government policy of looking to shift transport from road to rail to realise productivity efficiencies, improve safety, and reduce environmental impacts and to allow producers to be globally competitive simply would not be met.
ConclusionDomestic freight is forecast to nearly double by 2030 and triple by 2050. If there is no incentive to shift freight from road to rail then long distance truck movements are anticipated to increase on the Newell Highway by 300 per cent by 2050. Australia has an enormous opportunity currently to dramatically increase exports globally. This cannot be realised effectively without an efficient, reliable and cost effective rail network.
There is a global shift towards ‘clean and green’ produce particularly in the lucrative China export market. This has become even more important with the recent Free Trade Agreement with China.
To create an inland rail which does not directly cross the heart of the Nation’s food bowls and primary producers fails to capitalise on the opportunities inherent within them.
The FBIRA reiterates the need for further due diligence (future demand, capital expenditure, return on investment and investigation of public and private partnerships) on the Southern Alignment of the Melbourne to Brisbane Inland Rail Project.
7


AECOM
Food Bowl Route
29-Jan-2014 Prepared for – Narrandera Shire Council – ABN: 96 547 765 569

AECOM
Food Bowl Route
29-Jan-2014 Prepared for – Narrandera Shire Council – ABN: 96 547 765 569
Quality Information
Document Food Bowl Route
Date 29-Jan-2014
Prepared by Eloise Modun and Oliver Baxter
Reviewed by Austin Kennedy
Revision History
Revision A B
Date 28-Jan-2014 29-Jan-2014
Authorised by
Austin Kennedy
Associate Director
Austin Kennedy
Associate Director
Food Bowl Route Rail User Economics and Freight Commerce
Client: Narrandera Shire Council
ABN: 96 547 765 569
Prepared by
AECOM Australia Pty Ltd
Level 9, 8 Exhibition Street, Melbourne VIC 3000, Australia
T +61 3 9653 1234 F +61 3 9654 7117 www.aecom.com
ABN 20 093 846 925
29-Jan-2014
AECOM in Australia and New Zealand is certified to the latest version of ISO9001, ISO14001, AS/NZS4801 and OHSAS18001.
© AECOM Australia Pty Ltd (AECOM). All rights reserved.
AECOM has prepared this document for the sole use of the Client and for a specific purpose, each as expressly stated in the document. No other
party should rely on this document without the prior written consent of AECOM. AECOM undertakes no duty, nor accepts any responsibility, to any
third party who may rely upon or use this document. This document has been prepared based on the Client’s description of its requirements and
AECOM’s experience, having regard to assumptions that AECOM can reasonably be expected to make in accordance with sound professional
principles. AECOM may also have relied upon information provided by the Client and other third parties to prepare this document, some of which
may not have been verified. Subject to the above conditions, this document may be transmitted, reproduced or disseminated only in its entirety.

AECOM
Food Bowl Route
29-Jan-2014 Prepared for – Narrandera Shire Council – ABN: 96 547 765 569
Table of Contents Executive Summary i 1.0 Introduction 1
1.1 The Food Bowl Inland Rail Alliance 1 1.2 Purpose 1
2.0 Approach 3 2.1 Industry survey 3
2.1.1 Identification of freight generators 3 2.1.2 Industry engagement 3
2.2 Gross demand 3 2.3 Mode-share 3 2.4 Growth forecasting 4 2.5 Selected organisations surveyed 4 2.6 Assumptions and limitations 4
3.0 Geographic context 5 3.1 Geography 5 3.2 Population and regional centres 6 3.3 Existing transport networks 7
3.3.1 Road 8 3.3.2 Rail 8 3.3.3 Intermodal terminals 8 3.3.4 Grain receival and storage 8 3.3.5 Irrigation networks 8
4.0 Economic context 10 4.1.1 Employment 10 4.1.2 Revenue 10 4.1.3 Investment 10
5.0 Commodities 11 5.1 Grain 11
5.1.1 Wheat 11 5.1.2 Rice 14 5.1.3 Oilseeds 14
5.2 Dairy 15 5.3 Cotton 16 5.4 Horticulture 17
5.4.1 Fruit 17 5.4.2 Citrus 17 5.4.3 Tree nuts 17 5.4.4 Vegetables 17
5.5 Wine and beverages 18 5.6 Meat and livestock 19 5.7 Fibre and packaging 20 5.8 Other 20
6.0 Aggregate demand 21 6.1 Containerised freight demand 22 6.2 Bulk freight demand 24
7.0 Next Steps 25
Appendix A Engagement Pack A
AECOM
Food Bowl Route
29-Jan-2014 Prepared for – Narrandera Shire Council – ABN: 96 547 765 569
i
Executive Summary On 5 December 2014 an advocacy paper was
presented to the Hon John Anderson AO, chair of
the Inland Rail Implementation Group outlining the
Food Bowl Inland Rail Alliance’s (FBIRA) key
arguments for reviewing the ARTC’s route selection
process for the Melbourne – Parkes section. This
report builds on that initial submission by providing a
robust evidence base for potential rail freight
demand on the Inland Rail Food Bowl Alignment
and an understanding of the types of freight users in
the region and their logistics systems. It also
quantifies the value of domestic and export markets,
employee numbers and industry investment in the
Food Bowl Region.
Through industry engagement with 20 major primary
production and processing companies throughout
the region and across a range of commodities, this
study has reaffirmed the advocacy paper’s premises
that:
- domestic and export freight volumes generated
in the region are growing much faster than
previously assumed
- primary production within the Food Bowl
Region is diversifying, and coupled with
investment in processing and packaging, the
commodities, supply chains and pack-types
are conducive to rail freight transport
- Industries based in the Food Bowl Region are
strongly supportive of the Food Bowl
Alignment through Shepparton, Tocumwal and
Narrandera, and believe that this critical
infrastructure will be a catalyst for further
private sector investment in the region.
High level gross demand forecasting and mode
share analysis undertaken as part of this study
indicates that containerised rail freight demand
could potentially grow to 170,000 TEU per annum
by 2035, which is equivalent to 1,277 train services
from the region to the Port of Melbourne and
domestic intermodal terminals in Sydney, Brisbane
and Melbourne.
Diversification of the grain industry into oil seeds
and further growth in rice production in the region
could potentially grow by as much as 80% to 2.9
million tonnes by 2035. If this volume can be
captured on an efficient standard gauge rail network
for delivery into the ports of Geelong, Melbourne
and Kembla, it could potentially result in 620 bulk
grain rail services from the region per annum.
Confidence in the region’s potential from private
industry is underscored by over $316 million of
recent or planned investment in processing capacity
identified by the 20 industry respondents. This is by
no means a comprehensive figure as it does not
consider planned investment by new entrants into
the region.
Clearly the Food Bowl region is booming, and the
FBIRA believes that this initial study into potential
demand warrants further investigation of the
detailed demand, construction costs and operational
savings that may be provided by routing the Inland
Rail project via the Food Bowl Alignment.

AECOM
Food Bowl Route
29-Jan-2014 Prepared for – Narrandera Shire Council – ABN: 96 547 765 569
1
1.0 Introduction
1.1 The Food Bowl Inland Rail
Alliance
The FBIRA represents the local governments of
Mitchell, Greater Shepparton, and Moira in Victoria
and Berrigan, Jerilderie, Urana, Griffith, Leeton and
Narrandera in NSW. The Alliance has been formed
with the aim of ensuring the Australian Government
gives further consideration to routing the Melbourne to
Brisbane Inland Rail via the Food Bowl Alignment
project through Shepparton, Tocumwal and
Narrandera given the extraordinary export growths
being experienced in Australia’s most economically
diverse and prosperous primary production and food
processing region. The FBIRA is strongly supported
by the extensive network of producers, value adding
processors and suppliers within the region.
1.2 Purpose
The ARTC’s 2010 Melbourne-Brisbane Inland Rail
Alignment Study recommended an alignment through
southern NSW via Albury, Wagga Wagga, Junee and
Cootamundra. Whilst strongly supportive of the Inland
Rail project, the FBIRA is adamant that the 2010
study has several shortcomings that should be
reconsidered particularly in relation to the selection of
the Albury-Wagga alignment over the Food Bowl
Alignment. These shortcomings include:
- The two alternate options do not appear to have
been costed on a like-for-like basis – the capex
cost estimates used are too coarse for detailed
options assessment. The 2010 study notes
appropriately that not all route combinations can
be fully assessed given the sheer number,
however the Food Bowl Alignment is a viable
alternative that merits more detailed costing and
value engineering.
- Despite the Terms of Reference for the study
requiring a determination of above rail
operational benefits, this does not appear to
have been adequately factored into the
evaluation criteria for the options assessment. In
particular it did not consider broader strategic
network benefits including network redundancy
and reliability improvements as well as the
operational benefits that gauge standardisation
will provide.
- The study did not adequately assess the
potential demand from the Food Bowl Region,
with the subsequent benefits to the project
through additional access and user revenues.
Understandably that the ARTC’s focus for the
project is on Melbourne – Brisbane inter-capital
freight; however this should not preclude
assessment of potential benefits for regional
exporters and considering mutually beneficial
alignment options that advantage both freight
tasks. In the five years since the 2010 study, the
Food Bowl Region has experienced
considerable growth as evidenced by the private
sector investment in the region. This growth, in
both volume and diversity merits further detailed
demand analysis.
This report provides an evidence base for the
FBIRA’s assertion regarding the third point – it
provides a bottom-up analysis of the potential
demand that could contribute to Inland Rail’s viability
through diversifying the infrastructure’s user base.
Through industry stakeholder engagement an
understanding of the sensitivities to time, reliability
and cost, and potential barriers to rail freight within
the region has been documented, along with the
unique opportunities that the Food Bowl alignment
presents.
Agricultural diversification, deregulation, irrigation
reforms and recent free trade agreements with China
and other south-east Asian trading partners will
continue to drive this growth in the Food Bowl region’s
agricultural output. The geographic relationship of the
region to our export gateways coupled with the
enormous private sector investment in value adding
industries in the regional centres of Seymour,
Shepparton, Griffith, Tocumwal, Leeton and
Narrandera means that much of this export growth is
ideally suited to intermodal rail transport.
AECOM
Food Bowl Route
29-Jan-2014 Prepared for – Narrandera Shire Council – ABN: 96 547 765 569
2
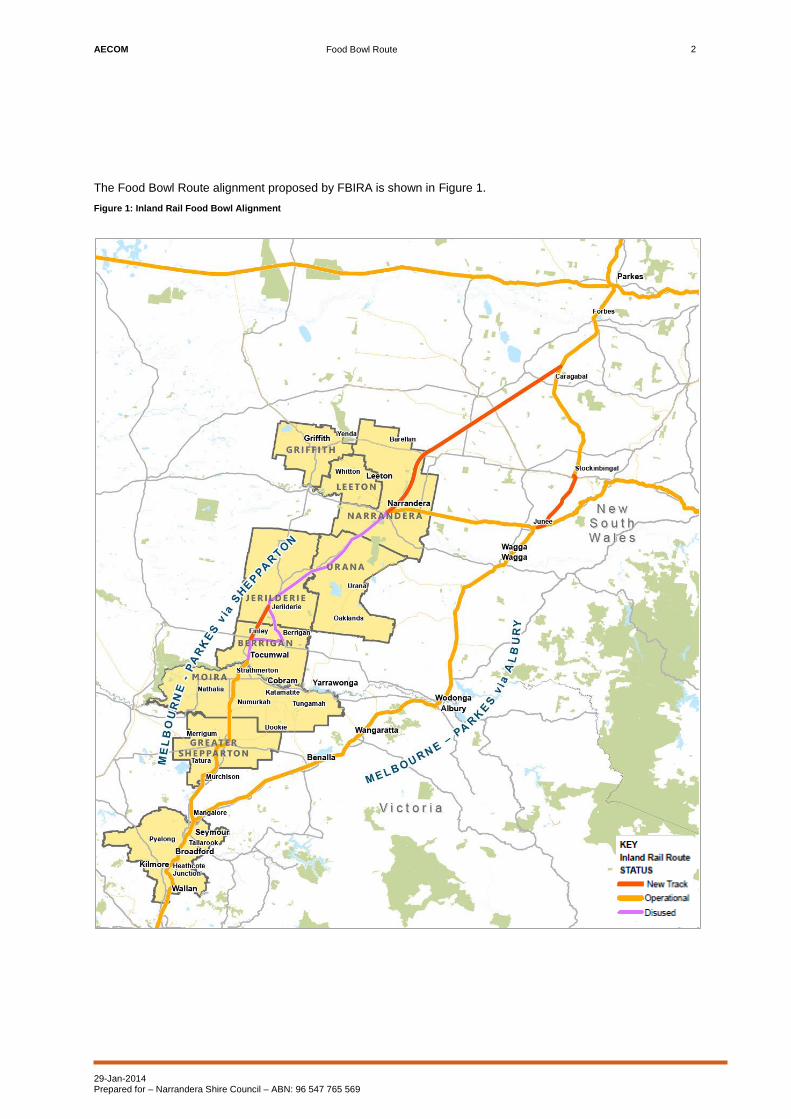
The Food Bowl Route alignment proposed by FBIRA is shown in Figure 1.
Figure 1: Inland Rail Food Bowl Alignment

AECOM
Food Bowl Route
29-Jan-2014 Prepared for – Narrandera Shire Council – ABN: 96 547 765 569
3
2.0 Approach
This section details the approach to industry
stakeholder engagement, supply chain analysis and
agricultural production forecasting undertaken for this
study.
2.1 Industry survey
2.1.1 Identification of freight generators
In collaboration with FBIRA member Councils, and
building on the companies identified in the previous
stage of this work, a list of target industries was
compiled. Priority was given to companies that are
known to produce large volumes of freight and their
remoteness from Melbourne, Sydney and Brisbane.
Potential users were also considered from surrounding
municipalities that could benefit from the Food Bowl
Route.
Organisations targeted are major producers and value
adding industries including:
- Grain handlers, marketers and millers
- Dairy processors and exporters
- Wineries
- Horticultural processors (fruits, vegetables and
tree nuts)
- Meat processors and feedlots
- Other allied industries including packaging and
transport operators
Where possible, persons responsible for freight and
logistics at each company were identified and
approached, primarily via telephone. An “Industry
Engagement Pack” was then emailed and telephone
interview scheduled. During these interviews,
stakeholders were taken through the questionnaire
with the aim of collecting qualitative information that
may provide evidence for the Food Bowl Route
demand.
Information requested from each stakeholder was
based around the following themes:
- Information about the organisation’s background
and market position
- Current and future production capacity
- Details of the existing supply chain
- Any recent or planned industry investment
- Organisational perceptions of rail for freight
transport.
2.1.2 Industry engagement
An industry engagement pack was provided to each
company that agreed to take part in the study. An
example engagement pack is provided in Appendix A
which includes:
1) A cover letter introducing the FBIRA and the
Inland Rail project, and detailing the purpose of
the engagement
2) A short questionnaire detailing the types of
information sought for the project
A copy of the advocacy paper presented to the Inland
Rail Implementation Group was also provided.
2.2 Gross demand
Given the discrete nature of individual logistics chains
through the region, and the relative sizes of the larger
producers, gross demand was derived using a bottom-
up industry engagement approach via the extensive
stakeholder engagement process detailed in Section
2.1. Freight demand/generation was estimated for
individual organisations and summed to determine
total demand for the region. This approach uses the
fine details to build the “big picture”.
2.3 Mode-share
Organisations choose combinations of rail, sea, air and
road to transport freight. Each mode has attributes that
make them more suitable, and generally less
expensive, for particular freight movements. Choice is
strongly influenced by the nature of the goods
requiring transport, taking into account characteristics
such as density, mass, perishability, type and
durability. Road and rail play an important part in
transporting domestic freight, in some cases
competing for freight and in other cases working
together.
Mode-share was qualitatively assessed by assigning
High, Medium or Low ratings to account for:
- existing transport modes used
- distance to end-markets and suitability of existing
supply chains
- distance to an existing or potential intermodal
terminal within the Food Bowl Region
- sensitivity of the freight to time, cost and reliability
- annual volumes.
Logit modelling techniques were not deemed
appropriate given the short time frame for data
collection, collation and reporting, and the absence of
an appropriate generalised transport cost model.
AECOM
Food Bowl Route
29-Jan-2014 Prepared for – Narrandera Shire Council – ABN: 96 547 765 569
4
Logit modelling techniques were not deemed
appropriate given the short time frame for data
collection, collation and reporting, and the absence of
an appropriate generalised transport cost model.
2.4 Growth forecasting
A set of standardised spreadsheets were developed to
collate the information gathered in the industry
engagement phase. Following each engagement, the
table was populated with each stakeholder’s
responses.
Gross forecasts were developed for each industry
participant accounting for changing land-uses,
investment and domestic and overseas demand.
Combining the growth forecasts with the potential rail
mode-shares, gross rail tonnages were developed.
These were then converted into container volumes and
ultimately into train loads.
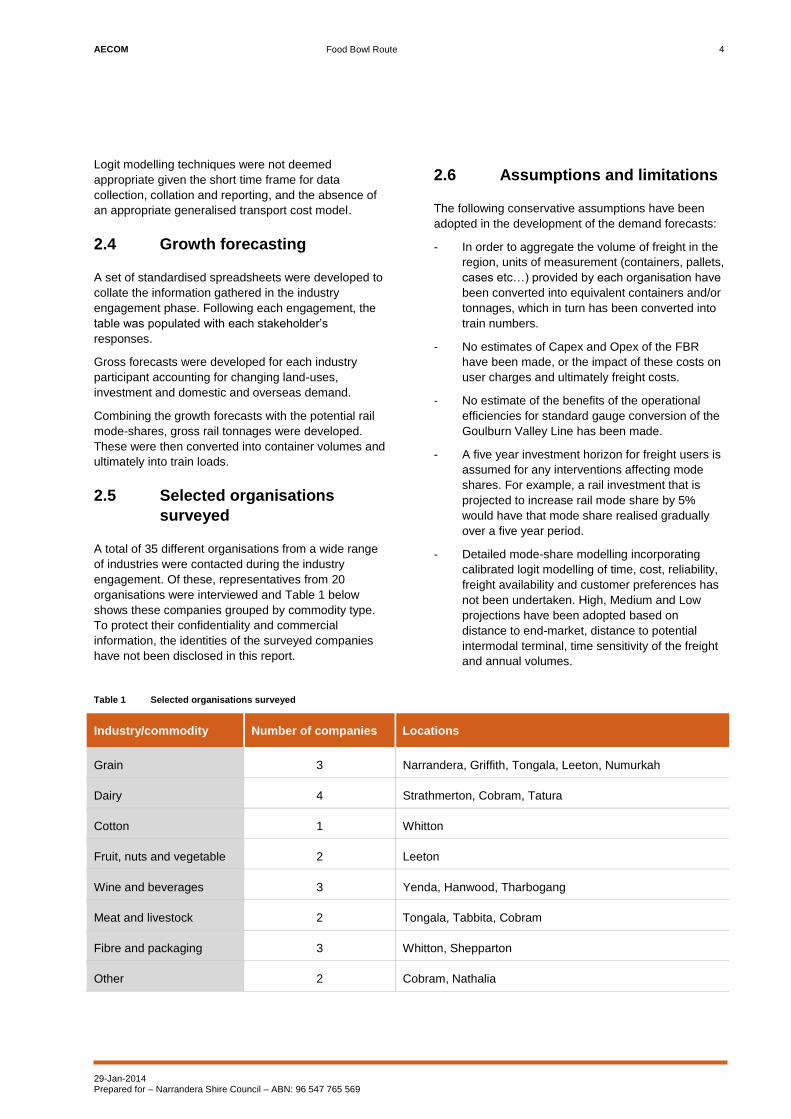
2.5 Selected organisations
surveyed
A total of 35 different organisations from a wide range
of industries were contacted during the industry
engagement. Of these, representatives from 20
organisations were interviewed and Table 1 below
shows these companies grouped by commodity type.
To protect their confidentiality and commercial
information, the identities of the surveyed companies
have not been disclosed in this report.
2.6 Assumptions and limitations
The following conservative assumptions have been
adopted in the development of the demand forecasts:
- In order to aggregate the volume of freight in the
region, units of measurement (containers, pallets,
cases etc…) provided by each organisation have
been converted into equivalent containers and/or
tonnages, which in turn has been converted into
train numbers.
- No estimates of Capex and Opex of the FBR
have been made, or the impact of these costs on
user charges and ultimately freight costs.
- No estimate of the benefits of the operational
efficiencies for standard gauge conversion of the
Goulburn Valley Line has been made.
- A five year investment horizon for freight users is
assumed for any interventions affecting mode
shares. For example, a rail investment that is
projected to increase rail mode share by 5%
would have that mode share realised gradually
over a five year period.
- Detailed mode-share modelling incorporating
calibrated logit modelling of time, cost, reliability,
freight availability and customer preferences has
not been undertaken. High, Medium and Low
projections have been adopted based on
distance to end-market, distance to potential
intermodal terminal, time sensitivity of the freight
and annual volumes.
Table 1 Selected organisations surveyed
Industry/commodity Number of companies Locations
Grain 3 Narrandera, Griffith, Tongala, Leeton, Numurkah
Dairy 4 Strathmerton, Cobram, Tatura
Cotton 1 Whitton
Fruit, nuts and vegetable 2 Leeton
Wine and beverages 3 Yenda, Hanwood, Tharbogang
Meat and livestock 2 Tongala, Tabbita, Cobram
Fibre and packaging 3 Whitton, Shepparton
Other 2 Cobram, Nathalia

AECOM
Food Bowl Route
29-Jan-2014 Prepared for – Narrandera Shire Council – ABN: 96 547 765 569
5
3.0 Geographic context
3.1 Geography
The Food Bowl region stretches from central Victoria
to southern NSW – see Figure 2, it covers an area of
approximately 25,100 square kilometres and supports
a population of around 180,000 people.
Mitchell Shire forms the southern-most boundary of
the FBIRA, just 30 kilometres north of Melbourne, and
the northern-most boundary is 520 kilometres west of
Sydney in Narrandera Shire. The area therefore
strategically offers urban, peri-urban and rural
landscapes and is situated along one of Australia’s
most significant transport corridors linking the capital
cities of the eastern seaboard.
The varied geographic and climatic conditions provide
diverse growing conditions for a vast array of
agricultural commodities being produced and
processed for consumption in both domestic and
international markets. Throughout the Food Bowl
region, the climate varies from semi-arid in the north
to temperate in the south. This results in fairly sparse
rainfall with hot summers and cold winters. The Great
Dividing Range which runs from the north of
Queensland, along the New South Wales coast and
into Victoria, produces a cooler, mountain climate on
the inland side of the mountains.
To mitigate the dry summer conditions, extensive
irrigation infrastructure across the region fed by the
Murray, Murrumbidgee and Goulburn Rivers ensure
both high agricultural yields and security of production
during periods of drought.
Figure 2: Terrain and major features of the Food Bowl Alignment
AECOM
Food Bowl Route
29-Jan-2014 Prepared for – Narrandera Shire Council – ABN: 96 547 765 569
6
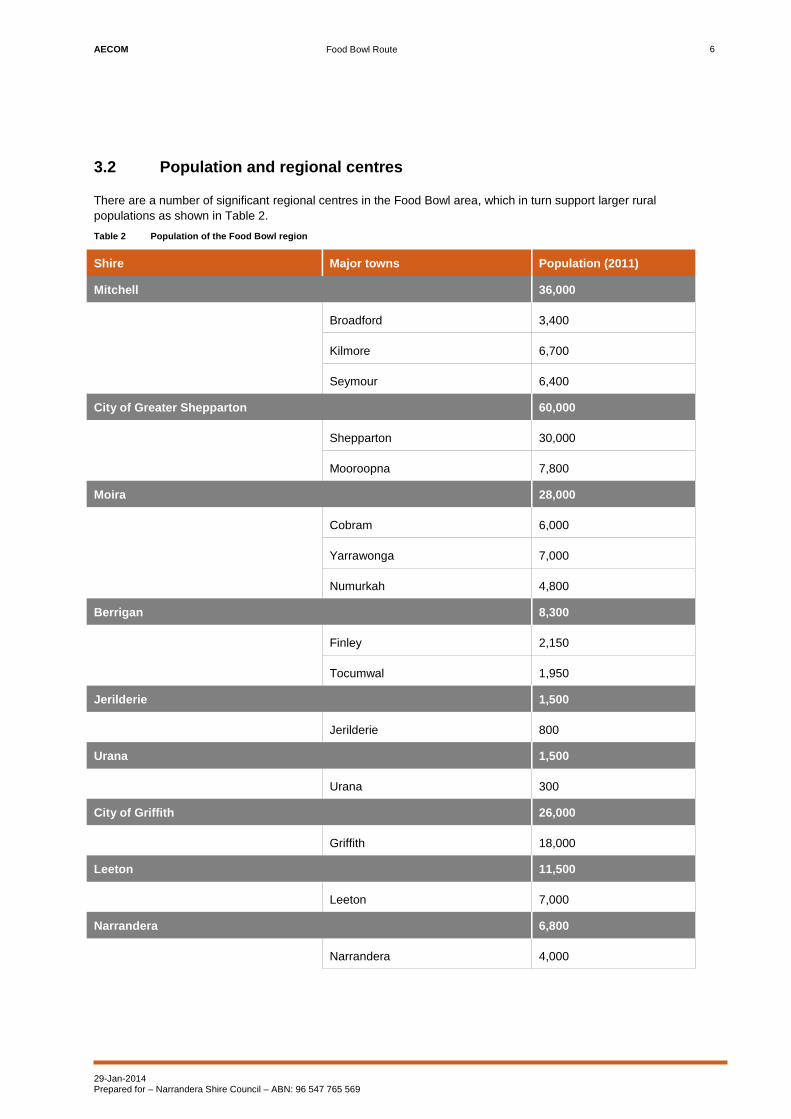
3.2 Population and regional centres
There are a number of significant regional centres in the Food Bowl area, which in turn support larger rural
populations as shown in Table 2.
Table 2 Population of the Food Bowl region
Shire Major towns Population (2011)
Mitchell 36,000
Broadford 3,400
Kilmore 6,700
Seymour 6,400
City of Greater Shepparton 60,000
Shepparton 30,000
Mooroopna 7,800
Moira 28,000
Cobram 6,000
Yarrawonga 7,000
Numurkah 4,800
Berrigan 8,300
Finley 2,150
Tocumwal 1,950
Jerilderie 1,500
Jerilderie 800
Urana 1,500
Urana 300
City of Griffith 26,000
Griffith 18,000
Leeton 11,500
Leeton 7,000
Narrandera 6,800
Narrandera 4,000

AECOM
Food Bowl Route
29-Jan-2014 Prepared for – Narrandera Shire Council – ABN: 96 547 765 569
7
The regional City of Greater Shepparton in
northern Victoria began as a sheep station and river
crossing before transforming into a railway town.
Today the major fruit, vegetable and dairy
processing centre supports a population of over
60,000 and is forecast to grow to over 80,000 by
2031. Shepparton is also the centre of the Goulburn
Valley irrigation system, one of the largest in
Australia. Mooroopna, on the other side of the
Goulburn River, will have a critical place in the
proposed freight and logistics centre planned just
south of the town. This will consist of a terminal for
the transfer of freight between truck and rail, and
general freight area to provide direct rail access for
the Goulburn Valley to the Port of Melbourne.
Cobram, along with the nearby towns of Numurka
and Yarrawonga in the Shire of Moira in northern
Victoria is surrounded by orchards, dairy farms and
wineries. It is the birthplace of the Murray Goulburn
Co-operative which collects 35% of Australia’s milk
production.
Tocumwal, on the banks of the Murray River in
southern New South Wales, is surrounded by rich
farmland and State forest. While traditionally growth
in the region has been derived from primary
production there is now a strong a trend towards the
establishment of small and medium sized
manufacturing and processing facilities.
With a population of nearly 4,000, Narrandera is
situated at the junction of the Newell and Sturt
highways, adjacent to the Murrumbidgee River. The
town is surrounded to the east by extensive cereal
crops, sheep and wool production and to the west
rice, cereals, citrus, wine grapes and potatoes in the
Murrumbidgee Irrigation Area.
Leeton is a purpose-built town designed after the
New South Wales Government announced irrigation
schemes in the early 20th
century. With a population
of nearly 7,000, it is situated in an extremely
productive region with citrus, rice, grapes and wheat
grown in the area. It is also home to the SunRice
(Ricegrowers Limited) headquarters – one of the
largest employers in regional NSW.
Like Leeton, Griffith was also designed by Walter
Burley Griffin as a service town for the extensive
irrigation scheme that supports wine, citrus, rice and
poultry production in the area. The township’s
population of over 17,000 supports a much larger
hinterland of 26,000 with more than 60% of the
population having an Italian heritage.
3.3 Existing transport networks
Freight and logistics are a crucial part of the
economic health of the Food Bowl region and the
existing transport networks are described in the
following sections.
Forecasted freight growth will add significant
pressure to both road and rail networks in the area,
thus an integrated solution is required to avoid the
current network forming a barrier to growth.
Although the Port of Melbourne is closer than Port
Botany for container exports and Kembla for bulk
grain, producers in the region view improved port
access opportunities as a key benefit of the Food
Bowl Alignment resulting in greater competition
between the ports. Figure 3 below shows the major
road and rail networks through the region
Figure 3: Road and rail networks
AECOM
Food Bowl Route
29-Jan-2014 Prepared for – Narrandera Shire Council – ABN: 96 547 765 569
8
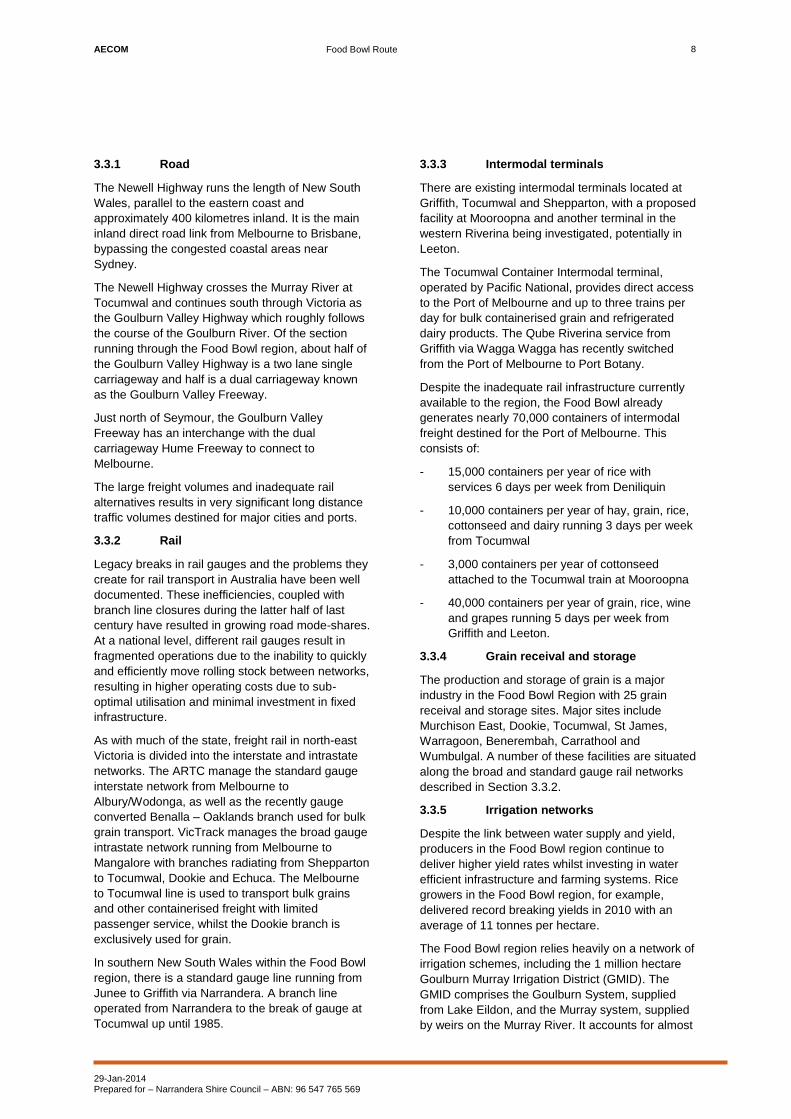
3.3.1 Road
The Newell Highway runs the length of New South
Wales, parallel to the eastern coast and
approximately 400 kilometres inland. It is the main
inland direct road link from Melbourne to Brisbane,
bypassing the congested coastal areas near
Sydney.
The Newell Highway crosses the Murray River at
Tocumwal and continues south through Victoria as
the Goulburn Valley Highway which roughly follows
the course of the Goulburn River. Of the section
running through the Food Bowl region, about half of
the Goulburn Valley Highway is a two lane single
carriageway and half is a dual carriageway known
as the Goulburn Valley Freeway.
Just north of Seymour, the Goulburn Valley
Freeway has an interchange with the dual
carriageway Hume Freeway to connect to
Melbourne.
The large freight volumes and inadequate rail
alternatives results in very significant long distance
traffic volumes destined for major cities and ports.
3.3.2 Rail
Legacy breaks in rail gauges and the problems they
create for rail transport in Australia have been well
documented. These inefficiencies, coupled with
branch line closures during the latter half of last
century have resulted in growing road mode-shares.
At a national level, different rail gauges result in
fragmented operations due to the inability to quickly
and efficiently move rolling stock between networks,
resulting in higher operating costs due to sub-
optimal utilisation and minimal investment in fixed
infrastructure.
As with much of the state, freight rail in north-east
Victoria is divided into the interstate and intrastate
networks. The ARTC manage the standard gauge
interstate network from Melbourne to
Albury/Wodonga, as well as the recently gauge
converted Benalla – Oaklands branch used for bulk
grain transport. VicTrack manages the broad gauge
intrastate network running from Melbourne to
Mangalore with branches radiating from Shepparton
to Tocumwal, Dookie and Echuca. The Melbourne
to Tocumwal line is used to transport bulk grains
and other containerised freight with limited
passenger service, whilst the Dookie branch is
exclusively used for grain.
In southern New South Wales within the Food Bowl
region, there is a standard gauge line running from
Junee to Griffith via Narrandera. A branch line
operated from Narrandera to the break of gauge at
Tocumwal up until 1985.
3.3.3 Intermodal terminals
There are existing intermodal terminals located at
Griffith, Tocumwal and Shepparton, with a proposed
facility at Mooroopna and another terminal in the
western Riverina being investigated, potentially in
Leeton.
The Tocumwal Container Intermodal terminal,
operated by Pacific National, provides direct access
to the Port of Melbourne and up to three trains per
day for bulk containerised grain and refrigerated
dairy products. The Qube Riverina service from
Griffith via Wagga Wagga has recently switched
from the Port of Melbourne to Port Botany.
Despite the inadequate rail infrastructure currently
available to the region, the Food Bowl already
generates nearly 70,000 containers of intermodal
freight destined for the Port of Melbourne. This
consists of:
- 15,000 containers per year of rice with
services 6 days per week from Deniliquin
- 10,000 containers per year of hay, grain, rice,
cottonseed and dairy running 3 days per week
from Tocumwal
- 3,000 containers per year of cottonseed
attached to the Tocumwal train at Mooroopna
- 40,000 containers per year of grain, rice, wine
and grapes running 5 days per week from
Griffith and Leeton.
3.3.4 Grain receival and storage
The production and storage of grain is a major
industry in the Food Bowl Region with 25 grain
receival and storage sites. Major sites include
Murchison East, Dookie, Tocumwal, St James,
Warragoon, Benerembah, Carrathool and
Wumbulgal. A number of these facilities are situated
along the broad and standard gauge rail networks
described in Section 3.3.2.
3.3.5 Irrigation networks
Despite the link between water supply and yield,
producers in the Food Bowl region continue to
deliver higher yield rates whilst investing in water
efficient infrastructure and farming systems. Rice
growers in the Food Bowl region, for example,
delivered record breaking yields in 2010 with an
average of 11 tonnes per hectare.
The Food Bowl region relies heavily on a network of
irrigation schemes, including the 1 million hectare
Goulburn Murray Irrigation District (GMID). The
GMID comprises the Goulburn System, supplied
from Lake Eildon, and the Murray system, supplied
by weirs on the Murray River. It accounts for almost

AECOM
Food Bowl Route
29-Jan-2014 Prepared for – Narrandera Shire Council – ABN: 96 547 765 569
9
90 percent of water used in irrigation and over 70
percent of water stored in Victoria.
In 2007, the Victorian Government commenced the
$2 billion Food Bowl Modernisation Project (also
known as the Northern Victorian Irrigation Renewal
Project, NVIRP) within the GMID. Stage one of the
project involved modernising the larger channels
and providing new connections to GMID customers,
whilst stage two involved installing new irrigation
metering. In 2012 the NVIRP was merged with
Goulburn-Murray Water and is due for completion in
2018. Now renamed the Connections Project, it will
redevelop the Goulburn Murray irrigation system
into a world’s best practice system, shortening order
times and providing more reliable delivery of water
to irrigators.
In southern NSW, the Murrumbidgee Irrigation
serves over 3,200 landholdings across 660,000
hectares. $149.6 million of funding has been
provided to Murrumbidgee Irrigation by the
Australian Government in 2015 for farm upgrades in
exchange for water rights.
AECOM
Food Bowl Route
29-Jan-2014 Prepared for – Narrandera Shire Council – ABN: 96 547 765 569
10
4.0 Economic context
The organisations surveyed for this report were from
a wide range of industries and were of varying
sizes. All were considered to be large producers in
the area, and most are also major employers.
Employment numbers, annual revenue and
investment figures have been aggregated for the
region to protect the commercial information
provided by each organisation. It should be noted
that not all organisations provided the requested
data – some were not comfortable sharing the data
and others were unable to provide it at the level of
detail required.
The information provided by these organisations
provides a snapshot of the economic context
surrounding the proposed Food Bowl alignment. It is
by no means a comprehensive estimate of
commerce in the region.
4.1.1 Employment
Much of the industry in the Food Bowl region
centres on irrigation with dairy, horticulture and
viticulture, farming and agriculture related industries
providing employment for a large section of the
workforce.
Eighteen of the 20 organisations provided
employment numbers. They directly employ a total
of 3,748 people in the Food Bowl region. Of the 12
organisations that broke employment data down into
roles, 177 people (or an average of 19%) are
employed in administration based roles.
4.1.2 Revenue
The organisations surveyed produced annual
revenue from production activities in the Food Bowl
of $3.9 billion (13 responses) in 2014 of which
exports were valued at $2.6 billion (10 responses).
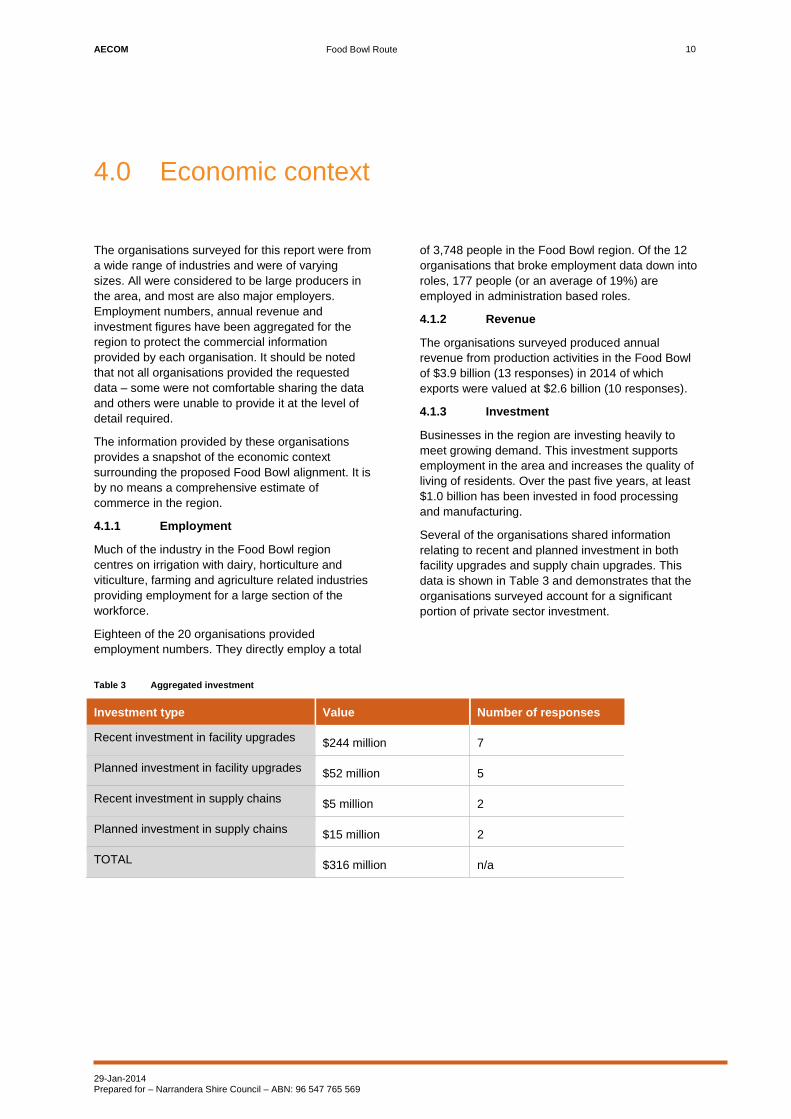
4.1.3 Investment
Businesses in the region are investing heavily to
meet growing demand. This investment supports
employment in the area and increases the quality of
living of residents. Over the past five years, at least
$1.0 billion has been invested in food processing
and manufacturing.
Several of the organisations shared information
relating to recent and planned investment in both
facility upgrades and supply chain upgrades. This
data is shown in Table 3 and demonstrates that the
organisations surveyed account for a significant
portion of private sector investment.
Table 3 Aggregated investment
Investment type Value Number of responses
Recent investment in facility upgrades $244 million 7
Planned investment in facility upgrades $52 million 5
Recent investment in supply chains $5 million 2
Planned investment in supply chains $15 million 2
TOTAL $316 million n/a

AECOM
Food Bowl Route
29-Jan-2014 Prepared for – Narrandera Shire Council – ABN: 96 547 765 569
11
5.0 Commodities
This section provides information about each of the industries examined including a description of the market, product destinations and supply chains. Many of the industries in the Food Bowl region are interlinked and this provides opportunities for economies of scale for transport and storage.
5.1 Grain
5.1.1 Wheat
The grain industry in Australia was once highly
regulated with a largely homogenous product
offering and monopoly control of handling and
export marketing, but since the 1980s deregulation
has led to a much more competitive industry with
products being differentiated on price and service
and a number of new, handlers, marketers and
exporters have emerged. This has resulted in more
specialised product that is increasingly attractive to
the global markets In 2012-13 the region produced
$3.8 billion in broad acre crops – over 20% of
Australia’s total supply.
Wheat for domestic consumption and feedstock is
generally grown on the east coast of Australia
where grain farms are primarily family run
enterprises with a large number of small farms and
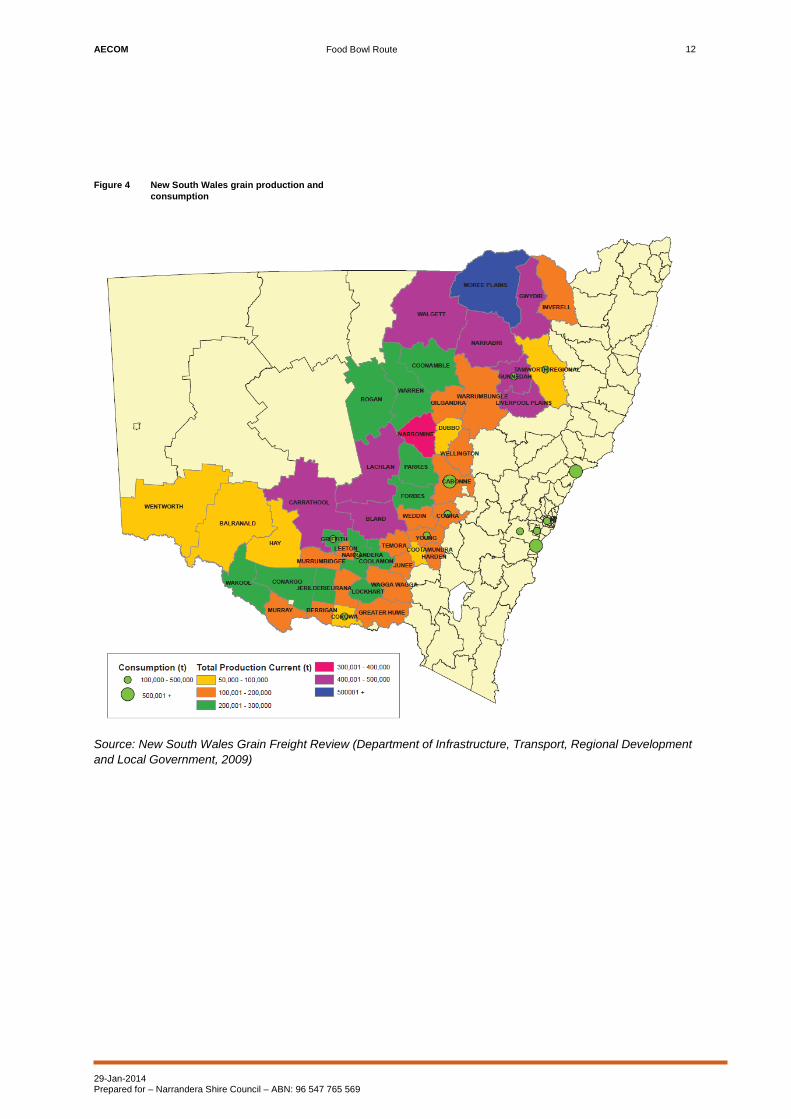
a small number of large farms. Grain is sourced
from farms on the New South Wales western slopes
and plains, as shown in Figure 4, as well as
northern Victoria from Tocumwal through to the
South Australian border. Production occurs over the
year; however harvest is typically from November to
January. Farmers strive to continuously improve
yield expand global market share.
AECOM
Food Bowl Route
29-Jan-2014 Prepared for – Narrandera Shire Council – ABN: 96 547 765 569
12
Figure 4 New South Wales grain production and
consumption
Source: New South Wales Grain Freight Review (Department of Infrastructure, Transport, Regional Development
and Local Government, 2009)

AECOM
Food Bowl Route
29-Jan-2014 Prepared for – Narrandera Shire Council – ABN: 96 547 765 569
13
There is significant storage and processing
infrastructure located across the Food Bowl region
with all major grain, handers and marketers having
a presence. The grain is stored in both on-farm and
off- farm silos for transport to the domestic and
export market. Road and rail are both attractive for
the transport of grain, with the supply chain
decisions based on cost, proximity to growers and
consumers, level of control and competition. An
example of a typical supply chain is shown in Figure
5 and an example of a typical bulk grain supply
chain is shown in Figure 6.
Figure 5 Typical grain supply chain
Figure 6 Typical bulk grain supply chain
Central to the southern NSW growers, the Narrandera
flour mill produces flour for the Melbourne market and
internal trade between other facilities within the parent
organisation with stockfeed produced as a by-product.
There is little seasonality in the milling operations so
the number of trucks moving flour to Melbourne is
constant. From Melbourne, export material is put into
containers and shipped to the Philippines, Indonesia
and Thailand. Flour for inter-company trade is moved
via rail from the mill’s rail siding to Brisbane, Sydney
and Adelaide depending on the products being
blended.

AECOM
Food Bowl Route
29-Jan-2014 Prepared for – Narrandera Shire Council – ABN: 96 547 765 569
14
5.1.2 Rice
Rice is a mature and vital industry with the vast
majority of Australia’s rice crop generated in the Food
Bowl region by a very large number of growers.
Australian rice growers generally achieve a yield per
hectare far in excess of the global average, a result
which is particularly impressive given the industry is
strictly regulated to ensure a minimal impact on the
environment. The industry is dominated by a few
processing organisations and generates over $800
million per year. Advances in recent years has seen
yields rise and water consumption decline, however
the Murrumbidgee and Murray irrigation districts will
always remain as the centre for Australian rice
production.
Most of Australia’s rice growers are located in the
Murray and Murrumbidgee areas of New South Wales
with a small number in Victoria, as shown in Figure 7
below. There are three mills, three stockfeed
manufacturing plants and 21 rice receival depots in the
Food Bowl region. The regional towns of Leeton,
Griffith, Deniliquin, Coleambally and Finley are
particularly supported by the industry.
Figure 7 Rice growing areas of Australia
Source: Ricegrowers’ Association of Australia (2015)
From the up-country mills, rail is generally the
preferred mode of transport to both domestic
markets and export gateways. The majority of the
crop is exported in bulk from the Port of Melbourne
to a large number of destinations overseas. The
remainder is distributed for domestic consumption.
The key factors in a rice producers supply chain are
reliability to get the product to the customer or port
on time and total cost to serve.
5.1.3 Oilseeds
Both at home and overseas, Australian oils and
oilseeds are in demand. The industry is mature with
a large number of organisations supplying and
exporting oilseed, oilseed meal, unrefined and
refined oils. There are several companies in and
around the Food Bowl region in this industry.
Seeds are crushed within the Food Bowl region and
the oil is sent to either Brisbane or Melbourne for
refining and to Melbourne for export, primarily to
Asia. Once a waste by-product, the oilseed meal is
now used for stockfeed and is sold to local farmers.
There is no seasonality in the production of oilseed
products and the integrated supply chain relies on
collaboration between seed breeders, growers,
storage handlers, refiners, millers and sellers.
Reliability is crucial and the freight task is currently
wholly carried by trucks.
AECOM
Food Bowl Route
29-Jan-2014 Prepared for – Narrandera Shire Council – ABN: 96 547 765 569
15
5.2 Dairy
The Food Bowl region is one of the nation’s largest
dairying areas with many farms in the Goulburn and
Murray Valleys. Compared to the national average,
the farms in the area are generally smaller but carry
more cows and produce more milk. All of the major
dairy companies in Australia have a presence in the
region, producing over 20% of Australia’s dairy
output and contributing approximately $4.3 billion to
Australian GDP. Around 50% of production is
exported to destinations such as the Middle East
and Asia and the other 50% is consumed
domestically in line with population distributions.
Demand from China, India and Asia has driven
strong demand growth in the industry.
Within the dairy industry, some seasonality is
observed and the peak period is usually from
September to January. Farmers in Food Bowl
Region have achieved a shift towards a “flatter” milk
production (less seasonality) driven by low rainfall
and the associated cost of irrigation resulting in
more intensive feeding systems. Products
generated in the Food Bowl region include milk,
processed and cut cheese, infant formula and other
powders, cheese and butter.
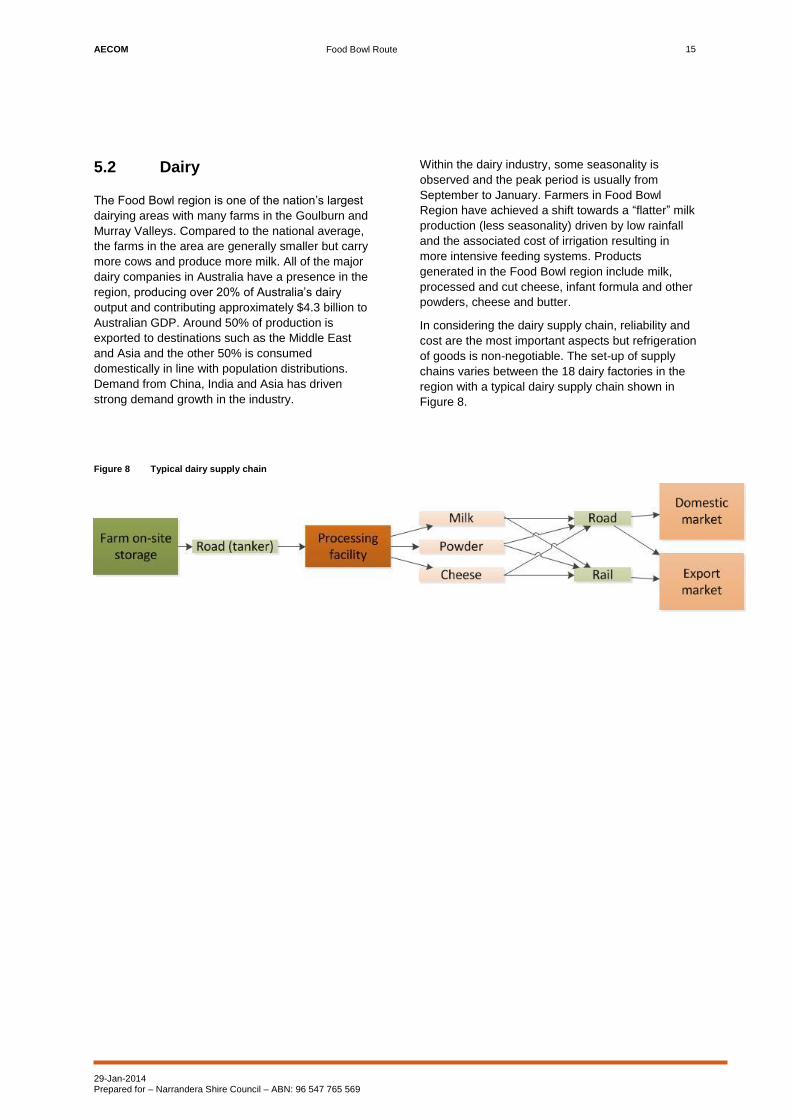
In considering the dairy supply chain, reliability and
cost are the most important aspects but refrigeration
of goods is non-negotiable. The set-up of supply
chains varies between the 18 dairy factories in the
region with a typical dairy supply chain shown in
Figure 8.
Figure 8 Typical dairy supply chain

AECOM
Food Bowl Route
29-Jan-2014 Prepared for – Narrandera Shire Council – ABN: 96 547 765 569
16
Examples of supply chains in the Food Bowl region
include:
- One organisation’s bulk cheese product is
produced in Melbourne, sent to the Food Bowl
region for processing, then is either moved to
Shepparton to be put on rail for export from the
Port of Melbourne or is moved by road to
Melbourne for domestic distribution. Rail is used
for transporting products from Melbourne to
Perth. Packaging inputs mostly originate from
Victoria but some are shipped in from overseas.
- Another organisation interviewed produces large
volumes of milk powder which is not time
sensitive or seasonal but still requires food
grade containers. In this case, the supply chain
is relatively straight forward though the
organisation has little structure to the timing of
when the containers leave the site.
- A third dairy manufacturer’s processing plant
receives a large volume of raw milk daily which
is turned into cheese and milk powder. These
products are then brought to Melbourne using a
combination of rail and road for distribution to
the export and import markets.
5.3 Cotton
Most cotton farms are family owned and operated,
producing yields 2.5 times the global average.
Increases in yield have been attributed to plant
breeding and better water management and the
cotton industry is known for producing a high quality
fibre that is esteemed in Asia with a premium price to
match. Exports from southern New South Wales were
valued at $150 million in 2012-13. Within the Food
Bowl region there are currently two gins, in Whitton
and in Hillston, with two more under construction in
Hay and Carrathool which will become operational in
the near future. Cotton gins separate cottonseed and
trash from the raw cotton fibre in a series of stages.
The main export markets for Australian cotton are in
East Asia, with over 75% sold to China, and seed is
also exported to South East Asia and the US. The
domestic market is primarily based in Melbourne and
Sydney. Cotton and its by-products are used in the
production of bank notes, margarine, rubber and
medical supplies.
The highly seasonal crops in the Murrumbidgee area
are harvested from over 26,000 hectares with the
peak period being between April and September.
Recent high water prices in Queensland have
resulted in large producers migrating to New South
Wales. This expansion has flow on benefits to other
local industries such as freight operators, fertilisers
and fuel.
Due to the high volumes, time and reliability are the
most significant factors in the supply chain. Cotton
growers sell their cotton to one of a number of
independent Australian merchants before ginning and
these merchants pay the fee on behalf of the grower.
Farmers have the option of forward selling a crop for
up to three years which locks in a sale price.
Cottonseed represents 55% of ginned cotton’s weight
and is a major source of container use. A typical
supply chain is shown in Figure 9.
Figure 9 Typical cotton supply chain

AECOM
Food Bowl Route
29-Jan-2014 Prepared for – Narrandera Shire Council – ABN: 96 547 765 569
17
5.4 Horticulture
5.4.1 Fruit
In 2011 there were over 800 fruit producers in the
Food Bowl region with a value of production of over
$440 million. In 2012-13, the region produced around
45% of Australia’s fruits including around 99% of the
national nashi crop, 86% of the national pear crop, and
70% of the national peach crop amongst other fruits.
The number of growers in the region has declined in
the past two decades due to consolidation of
properties but the fresh fruit market in general is
increasing.
There are around 300 fruit and nut farms in the
Shepparton region producing significant volumes of
pears, apples, tomatoes and stone fruit. Australia’s
largest producer of canned fruits, Coca Cola Amatil
(CCA) owned SPC Ardmona has production facilities
in Shepparton and Cobram. The Victorian Government
has recently invested $22 million in the Shepparton
plant to match CCA’s $78 million dollar investment.
Most of the fruit production is consumed domestically
with demand driven by increased consumer health
concerns, improved quality and greater availability.
Exports from the Goulburn Valley are a small but
important component and there is scope to grow the
Asian market.
5.4.2 Citrus
The Mediterranean-like conditions of the Riverina are
conducive to citrus growing with the area producing
180,000 to 200,000 tonnes of citrus for export, valued
at $98 million per annum. Around Griffith, Leeton and
Hillston, citrus planting is largely oranges with a small
proportion of lemons.
Recent improved trade relations have led to growth in
the key export markets of China, South Korea, Japan,
Thailand, Indonesia and the US. Growers have worked
hard to build a market in China where, as recently as
five years ago, exporting was considered to be too
hard.
The Berri Juice factory in Leeton processes over
70,000 tonnes of prime citrus fruit annually.
Traditionally processing oranges, apple and apple
combination juices are becoming a significant part of
the business. All products are sent to the domestic
market by road in cartons or in bulk and there are no
exports due to the short shelf life of the products. The
supply of oranges is seasonal with the peak occurring
between November and April. Time is the most
important factor in the supply chain, followed by
reliability and cost.
5.4.3 Tree nuts
The value of almond and walnuts grown in the Food
Bowl region is over $1.2 billion annually and expected
to grow by over 30% to 2025. Exports are expected to
account for 75% of production.
Tabbita in the Goulburn Valley near Shepparton and
the Leeton in the Riverina are two of the major walnut
production areas in Australia, with over 2,500 hectares
of orchards surrounding the two towns. A state-of-the-
art cracking facility was opened in Leeton in 2014.
Australian walnut producers are in a good position as
there is generally limited scope for expanded
production in the southern hemisphere outside of
Australia.
Walnuts are highly seasonal with a three month
harvest season beginning in March and a nine month
export period. Once the walnuts are graded they are
packed into bags, placed onto pallets and then slip
sheeted into export containers. The containers are
predominantly sent by road to Griffith to be put onto
trains for export from the Port of Melbourne. All
domestic freight is road based and flexibility and cost
are the major determinants for supply chain decisions.
Almonds have traditionally been a strong crop in the
Riverina with over 65,000 almond trees near Griffith
alone. Orchard ownership structures range from
medium sized family enterprises to large investment
companies. Consumer demand continues to grow,
particularly in the export market as living standards
rise in developing countries. Australian almonds supply
nearly all domestic consumption so the growth in
production is directed to markets in the US, Europe,
India, China and the Middle East.
The hazelnut industry in Australia is an emerging
sector with about 60 tonnes grown locally in contrast to
the 2,000 tonnes which are imported annually. To
redress this imbalance, one million hazelnut trees were
planted across 2,000 hectares of land in 2014 at the
Agri Australis hazelnut project site in Narrandera. The
first crop is expected to be harvested in the next three
years with full production generating 5,000 tonnes per
annum seven years from now. As crop yields grow
there is strong incentive to invest in processing within
the region.
5.4.4 Vegetables
With recent restructuring within the Goulburn Valley,
many fruit farms are diversifying into vegetable
production with current production valued at over $400
million per annum. Crops that grow well in the region
include zucchini and broccoli destined for the domestic
market.

AECOM
Food Bowl Route
29-Jan-2014 Prepared for – Narrandera Shire Council – ABN: 96 547 765 569
18
5.5 Wine and beverages
The Griffith and Leeton regions are the largest wine
producing areas in New South Wales and home to the
majority of exported Australian wine. In 2013,
vineyards covering an area of over 20,000 hectares
produced over 300,000 tonnes of grapes. These
wineries are generally large scale family owned
producers well suited for rail transport where possible.
Today there are more than 12 wineries based in the
region including major producers De Bortoli Wines,
Warburn Estate, McWilliams and Casella Wines –
makers of the world famous Yellow Tail brand. In
addition, Casella Wines and Coca Cola Amatil have
recently formed a joint venture to produce beer for the
Australian market aiming for a 15% market share
within 10 years.
Production of wine is partially seasonal with grapes
received from February to April and exports peaking
from September to December. Outputs are fairly
consistent with the domestic market evenly split
according to the spread of population and the major
export markets being the US and China. Most wineries
currently transport finished product by road but supply
chains can vary. Timing, availability of transport and
the care taken when handling the products are key
factors in supply chain decision making.
For example, the winery shown in Figure 10 transports
most of its wine by rail to the Port of Melbourne for
export.
Figure 10 Typical export focused winery supply chain
In contrast, another winery shown in Figure 11 sends its wine in bulk to Sydney for bottling. The majority of their
product is consumed domestically, with the small amount that is exported going through Port Botany.
Figure 11 Typical domestic focused winery supply chain

AECOM
Food Bowl Route
29-Jan-2014 Prepared for – Narrandera Shire Council – ABN: 96 547 765 569
19
5.6 Meat and livestock
Livestock produced in the Food Bowl region was
valued at almost $1.5 billion in 2012-13 and is
expected to continue to grow in line with the
expanding Asian middle class. A variety of meats are
produced and processed in the area, including meat
from beef, sheep, goats and pigs.
Within the Food Bowl region there are meat
processing facilities at Cobram, Seymour, Tatura,
Tongala and Yanco. The Yanco processing plant is
supplied by its adjacent beef feedlot situated on 2,000
hectares. There is also a 6,200 hectare beef feedlot in
Tabbita.
Tatura Abattoirs recently received funding from a
combination of Goulburn Valley Water and the
Victorian Government to invest in new processes and
equipment. This $600,000 project will allow increased
production and delivery significant economic benefits
through extra jobs and improved odour amenity
Major piggeries are located in Grong Grong and
Cosgrove with Australian pork exported to Singapore
and New Zealand. There are opportunities to increase
exports to China, Japan, Taiwan and Korea. Goat
studs are located near Shepparton, Numurkah and
Mulwala with the main export markets in the US and
Taiwan.
There are over 750,000 head of cattle and three
million head of sheep in the Food Bowl region. Beef is
primarily exported to Japan, South Korea and the US,
whilst the main export market for sheep is the Middle
East. Meat supply chains in Australia are complex
and interrelated. An example meat supply chain is
shown in Figure 12.
One company in the Food Bowl region transports
products on B-double trucks using a combination of
refrigerated vehicles and reefer containers for both
export and domestic markets in the major capital
cities. There is no seasonality and the vast majority is
exported through the Port of Melbourne.
Figure 12 Typical meat supply chain in Australia
AECOM
Food Bowl Route
29-Jan-2014 Prepared for – Narrandera Shire Council – ABN: 96 547 765 569
20
5.7 Fibre and packaging
One company has packaging distribution centres
located at Griffith and Shepparton. The customers
are generally producers in the Food Bowl region
including farmers, manufacturers and wineries to
whom the corrugated boxes are transported on
loose pallets or full truck loads rather than
containers. The boxes are sent from Adelaide to
Griffith and from Melbourne to Leeton and Griffith.
Another packaging and logistics company, located
in Shepparton, does send some goods to the Port of
Melbourne for export to Australasia. Domestic
goods are moved on road with the exception of
those bound for Perth, which are put on rail from
Melbourne. Some goods are also shipped from
Melbourne to Tasmania. Time is the critical factor in
the supply chain as there is limited opportunity to
hold freight movements. There are peaks in demand
before Christmas and before winter when new stock
is put onto supermarket shelves.
5.8 Other
Other significant freight flows in the region include
stockfeed and fertiliser, both of which are
domestically consumed and transported exclusively
on road.
The location of the stockfeed mill surveyed is
contingent on the least cost and least distance for
both inputs and output destinations. The core
customers are generally a short haul from the mill
and the remainder is transported via the Port of
Melbourne on to Tasmania. Most sales are to dairy,
beef and sheep farms with reduced demand in July
and February.
Fertiliser is not produced within the Food Bowl
region. It is brought to the region in bulk from the
Port of Melbourne and Port of Geelong and
delivered directly to the farms. Fertiliser demand is
seasonal from April to June and in August.
Grants Sawmilling in Narrandera produces flooring,
cladding and structural timber which is exported to
Japan, however volumes are relatively small.
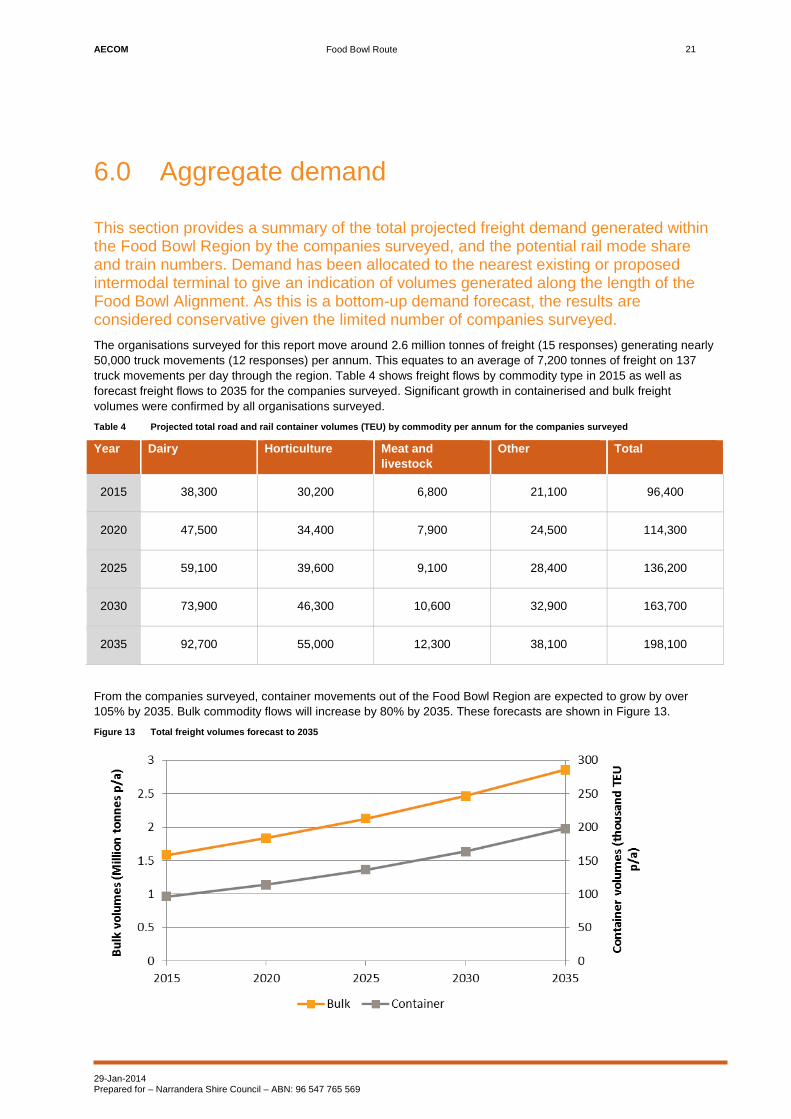
AECOM
Food Bowl Route
29-Jan-2014 Prepared for – Narrandera Shire Council – ABN: 96 547 765 569
21
6.0 Aggregate demand
This section provides a summary of the total projected freight demand generated within the Food Bowl Region by the companies surveyed, and the potential rail mode share and train numbers. Demand has been allocated to the nearest existing or proposed intermodal terminal to give an indication of volumes generated along the length of the Food Bowl Alignment. As this is a bottom-up demand forecast, the results are considered conservative given the limited number of companies surveyed.
The organisations surveyed for this report move around 2.6 million tonnes of freight (15 responses) generating nearly
50,000 truck movements (12 responses) per annum. This equates to an average of 7,200 tonnes of freight on 137
truck movements per day through the region. Table 4 shows freight flows by commodity type in 2015 as well as
forecast freight flows to 2035 for the companies surveyed. Significant growth in containerised and bulk freight
volumes were confirmed by all organisations surveyed.
Table 4 Projected total road and rail container volumes (TEU) by commodity per annum for the companies surveyed
Year Dairy Horticulture Meat and
livestock
Other Total
2015 38,300 30,200 6,800 21,100 96,400
2020 47,500 34,400 7,900 24,500 114,300
2025 59,100 39,600 9,100 28,400 136,200
2030 73,900 46,300 10,600 32,900 163,700
2035 92,700 55,000 12,300 38,100 198,100
From the companies surveyed, container movements out of the Food Bowl Region are expected to grow by over
105% by 2035. Bulk commodity flows will increase by 80% by 2035. These forecasts are shown in Figure 13.
Figure 13 Total freight volumes forecast to 2035
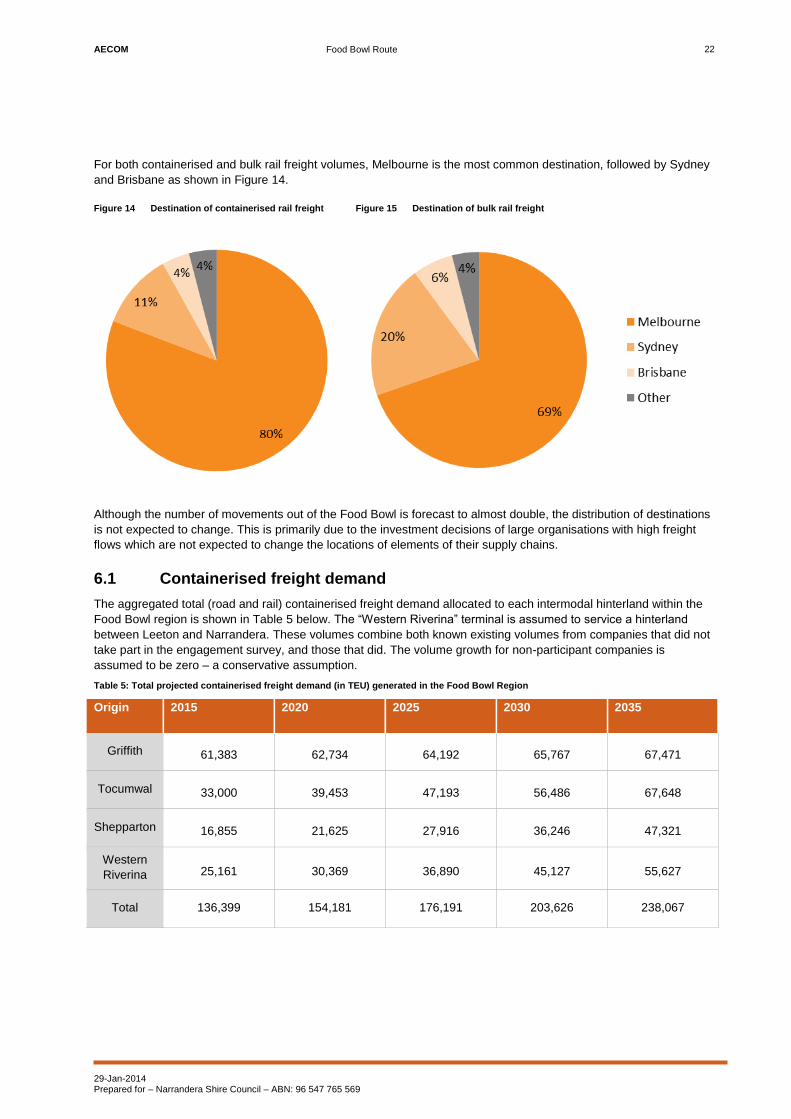
AECOM
Food Bowl Route
29-Jan-2014 Prepared for – Narrandera Shire Council – ABN: 96 547 765 569
22
For both containerised and bulk rail freight volumes, Melbourne is the most common destination, followed by Sydney
and Brisbane as shown in Figure 14.
Figure 14 Destination of containerised rail freight Figure 15 Destination of bulk rail freight
Although the number of movements out of the Food Bowl is forecast to almost double, the distribution of destinations
is not expected to change. This is primarily due to the investment decisions of large organisations with high freight
flows which are not expected to change the locations of elements of their supply chains.
6.1 Containerised freight demand
The aggregated total (road and rail) containerised freight demand allocated to each intermodal hinterland within the
Food Bowl region is shown in Table 5 below. The “Western Riverina” terminal is assumed to service a hinterland
between Leeton and Narrandera. These volumes combine both known existing volumes from companies that did not
take part in the engagement survey, and those that did. The volume growth for non-participant companies is
assumed to be zero – a conservative assumption.
Table 5: Total projected containerised freight demand (in TEU) generated in the Food Bowl Region
Origin 2015 2020 2025 2030 2035
Griffith 61,383 62,734 64,192 65,767 67,471
Tocumwal 33,000 39,453 47,193 56,486 67,648
Shepparton 16,855 21,625 27,916 36,246 47,321
Western
Riverina 25,161 30,369 36,890 45,127 55,627
Total 136,399 154,181 176,191 203,626 238,067
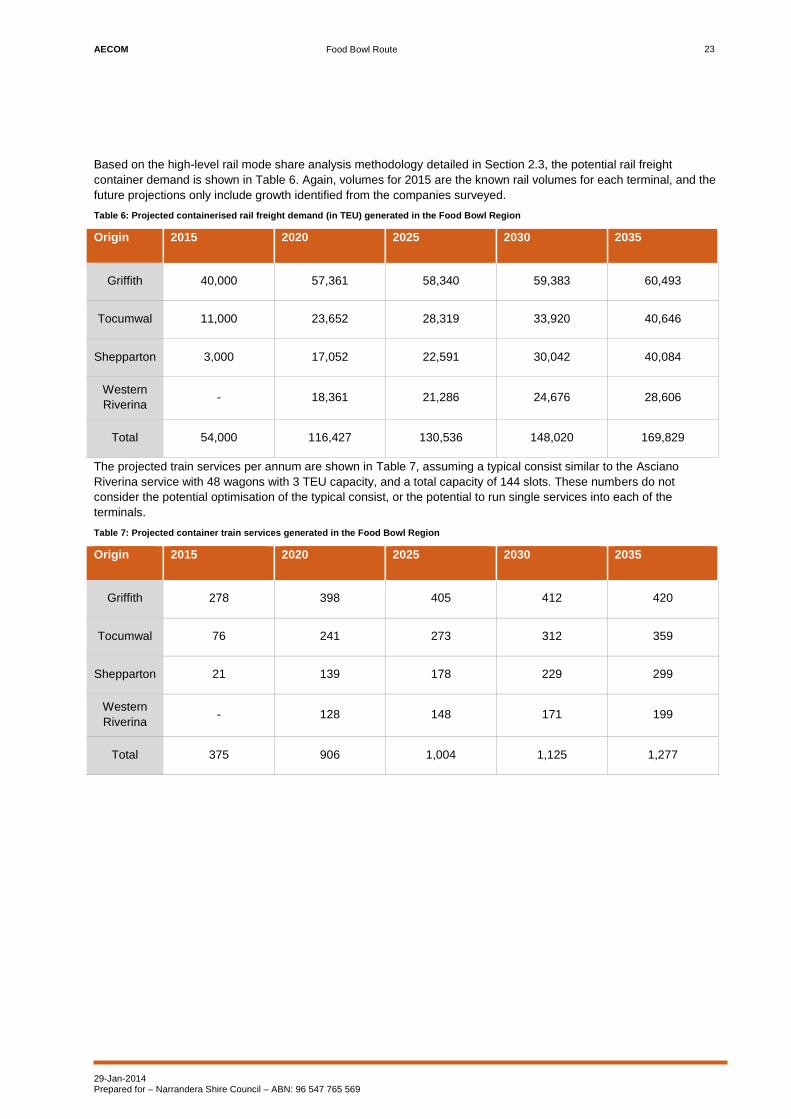
AECOM
Food Bowl Route
29-Jan-2014 Prepared for – Narrandera Shire Council – ABN: 96 547 765 569
23
Based on the high-level rail mode share analysis methodology detailed in Section 2.3, the potential rail freight
container demand is shown in Table 6. Again, volumes for 2015 are the known rail volumes for each terminal, and the
future projections only include growth identified from the companies surveyed.
Table 6: Projected containerised rail freight demand (in TEU) generated in the Food Bowl Region
Origin 2015 2020 2025 2030 2035
Griffith 40,000 57,361 58,340 59,383 60,493
Tocumwal 11,000 23,652 28,319 33,920 40,646
Shepparton 3,000 17,052 22,591 30,042 40,084
Western
Riverina - 18,361 21,286 24,676 28,606
Total 54,000 116,427 130,536 148,020 169,829
The projected train services per annum are shown in Table 7, assuming a typical consist similar to the Asciano
Riverina service with 48 wagons with 3 TEU capacity, and a total capacity of 144 slots. These numbers do not
consider the potential optimisation of the typical consist, or the potential to run single services into each of the
terminals.
Table 7: Projected container train services generated in the Food Bowl Region
Origin 2015 2020 2025 2030 2035
Griffith 278 398 405 412 420
Tocumwal 76 241 273 312 359
Shepparton 21 139 178 229 299
Western
Riverina - 128 148 171 199
Total 375 906 1,004 1,125 1,277

AECOM
Food Bowl Route
29-Jan-2014 Prepared for – Narrandera Shire Council – ABN: 96 547 765 569
24
6.2 Bulk freight demand
The aggregated total (road and rail) bulk freight demand for the companies surveyed within the Food Bowl region is
shown in Table 5 below. Unlike the intermodal container volumes, these figures have not been attributed to any one
location along the Food Bowl Alignment. The projected train services per annum assume a typical bulk grain consist
for services into the port of Melbourne Bulk Grain Terminal ant Appleton Dock with 54 wagons and a total payload of
3,650 tonnes.
Table 8: Total projected bulk freight demand generated in the Food Bowl Region
Volume/number 2015 2020 2025 2030 2035
Total volumes (tonnes) 1,583,000 1,835,000 2,127,000 2,466,000 2,859,000
Potential rail volumes
(tonnes) 1,250,000 1,449,000 1,680,000 1,947,000 2,258,000
Train services 342 397 460 533 619
AECOM
Food Bowl Route
29-Jan-2014 Prepared for – Narrandera Shire Council – ABN: 96 547 765 569
25
7.0 Next Steps
This report clearly indicates the significant growth in
potential rail freight demand through the Food Bowl
region, and further investigations into the alignment
are warranted.
These further studies should include:
- detailed cost estimates of both the capex and
opex of the Food Bowl Alignment to a standard
that will enable a fair comparison with the
Albury-Wagga alignment
- further demand forecasting using a top-down
econometric approach to complement the
bottom-up forecasts presented here
- an assessment and evaluation of the strategic
benefits that the Food Bowl Alignment could
bring to the Inland Rail project through full gauge
standardisation of Victoria’s north-east rail
network (and the benefits and efficiencies this
will provide rail operators), as well as the
network redundancy and reliability benefits that
will be provided to inter-capital freight services.
The FBIRA believes that these further studies will
demonstrate the financial and economic benefits of
the Food Bowl Alignment and its potential to unlock
unprecedented economic growth and productivity
gains through Australia’s major agricultural
heartlands, well beyond the inter-capital freight
demands.

AECOM
Food Bowl Route
Appendix A
Engagement Pack

AECOM
Food Bowl Route

AECOM
Food Bowl Route

AECOM
Food Bowl Route

AECOM
Food Bowl Route

AECOM
Food Bowl Route