food and the eu product environmental footprint … and the eu product environmental footprint pilot...
TRANSCRIPT
Food and the EU Product Environmental Footprint pilot phase
Imola Bedő Environmental Footprint Team
DG Environment – A1 Eco-Innovation and Circular Economy Unit
©H
D w
allpapers

…not only do consumers value supply chain
information and utilize it in their product choices,
but actually attach negative utility to its
omission. Participants were willing to pay more
for avoiding genetic modification, pesticides, and
antibiotics. In sum, the investigation established
that consumers were concerned about issues of
sustainability and were willing to pay more for
clear benefits that are provided by sustainable
products.
Jan Niklas Meise, Thomas Rudolph, Peter Kenning, Diane M. Phillips: Feed them facts: Value perceptions and consumer use of sustainability-related product information, 2014
“
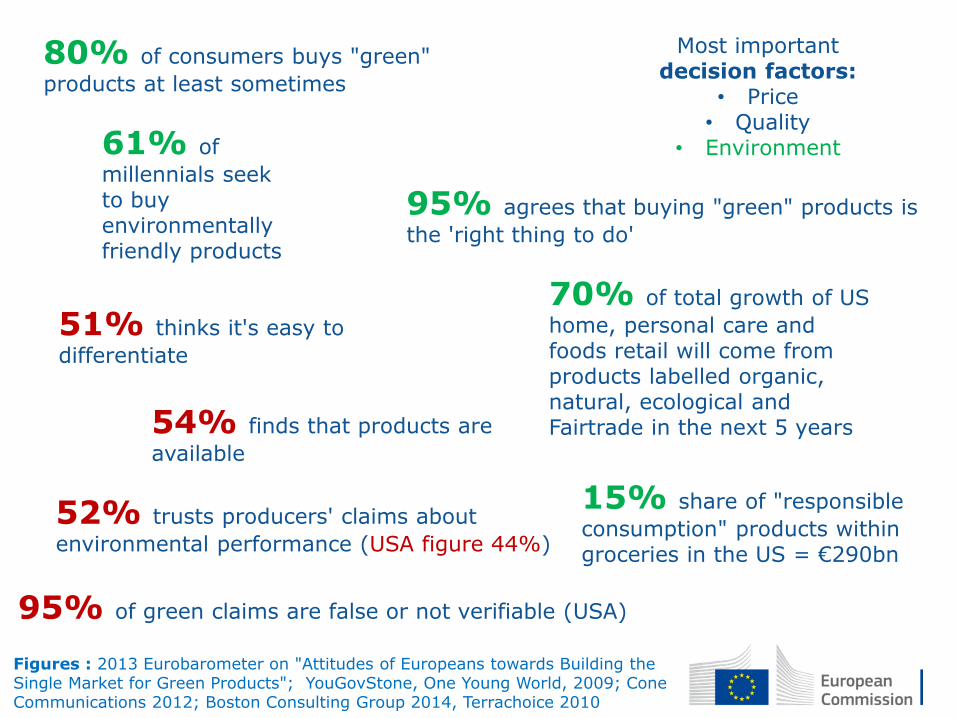
80% of consumers buys "green"
products at least sometimes
95% agrees that buying "green" products is
the 'right thing to do'
51% thinks it's easy to
differentiate
54% finds that products are
available
52% trusts producers' claims about
environmental performance (USA figure 44%)
Most important decision factors:
• Price • Quality
• Environment
Figures : 2013 Eurobarometer on "Attitudes of Europeans towards Building the Single Market for Green Products"; YouGovStone, One Young World, 2009; Cone Communications 2012; Boston Consulting Group 2014, Terrachoice 2010
61% of
millennials seek to buy environmentally friendly products
70% of total growth of US
home, personal care and foods retail will come from products labelled organic, natural, ecological and Fairtrade in the next 5 years
15% share of "responsible
consumption" products within groceries in the US = €290bn
95% of green claims are false or not verifiable (USA)

Minimise environmental impacts across the board
Climate change
Ozone depletion Eco-
toxicity
Human toxicity
Particu-late
matter Radiation
Acidifi-cation Eutro-
phication
Resource depletion
Land transfor-mation
Water depletion
growing sale making roasting waste
recycling processing transport
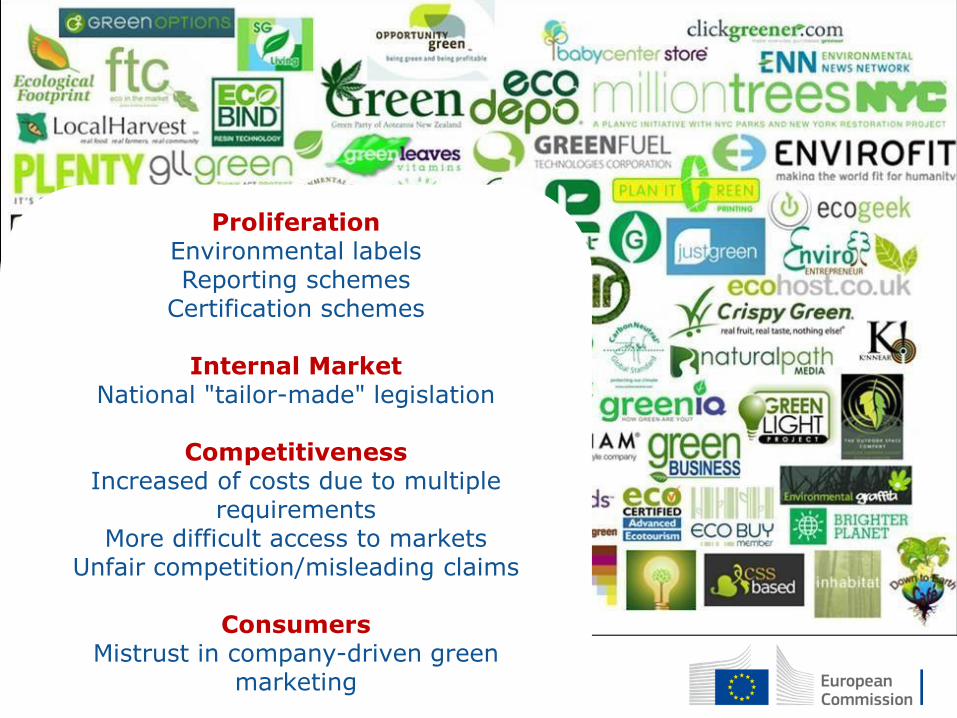
Proliferation Environmental labels Reporting schemes
Certification schemes
Internal Market National "tailor-made" legislation
Competitiveness
Increased of costs due to multiple requirements
More difficult access to markets Unfair competition/misleading claims
Consumers
Mistrust in company-driven green marketing

• Level playing field for competing based on environmental
performance, based on a common tool for measuring
performance
• Provide a reliable, reproducible, comparable tool for
providing environmental information
• Building the Single Market for Green Products [COM(2013) 196]
• Recommendation on the use of common methods for measuring
and communicating the life cycle environmental performance of
products and organisations (2013/179/EU): Product Environmental
Footprint (PEF) and Organisation Environmental Footprint (OEF)
methods
Environmental Footprint

3-year pilot (2013 – 2016)
1. Test the process for the development of PEFCRs and OEFSRs
2. Test different approaches for verification systems
3. Communication vehicles
SMEs
Data
Inter-national
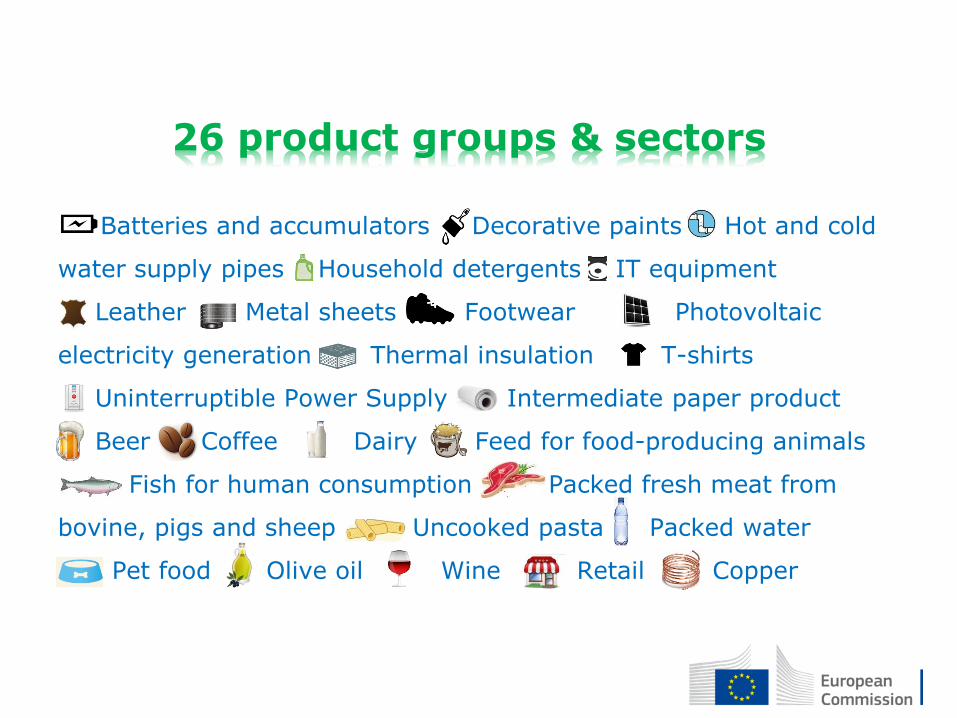
Batteries and accumulators Decorative paints Hot and cold
water supply pipes Household detergents IT equipment
Leather Metal sheets Footwear Photovoltaic
electricity generation Thermal insulation T-shirts
Uninterruptible Power Supply Intermediate paper product
Beer Coffee Dairy Feed for food-producing animals
Fish for human consumption Packed fresh meat from
bovine, pigs and sheep Uncooked pasta Packed water
Pet food Olive oil Wine Retail Copper
26 product groups & sectors
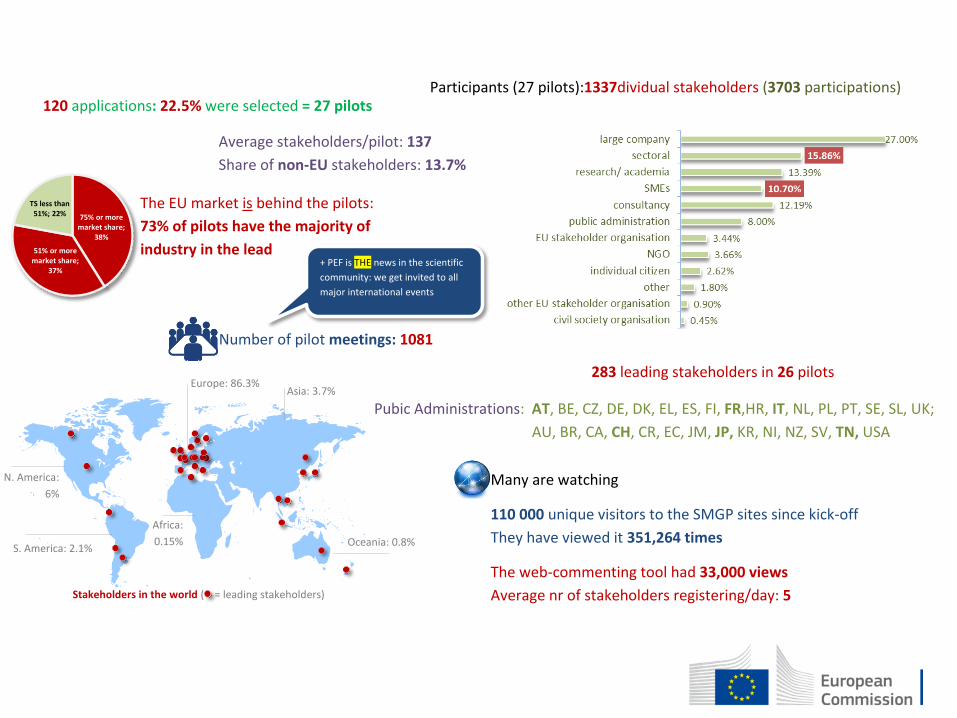
Europe: 86.3%
120 applications: 22.5% were selected = 27 pilots
Number of pilot meetings: 1081
Participants (27 pilots):1337dividual stakeholders (3703 participations)
Pubic Administrations: AT, BE, CZ, DE, DK, EL, ES, FI, FR,HR, IT, NL, PL, PT, SE, SL, UK;
AU, BR, CA, CH, CR, EC, JM, JP, KR, NI, NZ, SV, TN, USA
75% or more market share;
38%
51% or more market share;
37%
TS less than 51%; 22%
The EU market is behind the pilots:
73% of pilots have the majority of
industry in the lead
Many are watching
110 000 unique visitors to the SMGP sites since kick-off
They have viewed it 351,264 times
The web-commenting tool had 33,000 views
Average nr of stakeholders registering/day: 5
+ PEF is THE news in the scientific
community: we get invited to all
major international events
283 leading stakeholders in 26 pilots
Stakeholders in the world ( = leading stakeholders)
Average stakeholders/pilot: 137
Share of non-EU stakeholders: 13.7%
S. America: 2.1%
N. America:
6%
Africa:
0.15%
Asia: 3.7%
Oceania: 0.8%

11/13
M03 1st physical consultation
End of pilots End of pilots
Kick-off 1st wave
1st draft PEFCR ready M10
Approval of scope and representative product by SC Start screening studies
M05
2nd draft of PEFCR ready M13
12/16
Co
mm
un
ic
atio
n te
st
06/14 Kick-off 2nd wave
M09 Send screening for quick check to EC & Helpdesk
Virtual consultation M11
Approval of 2nd draft PEFCR by SC M14
Start of supporting studies M15
2nd consultation (physical and virtual) M19
External review M22
Final PEFCR ready M25
Approval of final PEFCR by SC M26
Release of final PEFCR M27
In the screening process PEFCRs: Fish, leather, meat, olive oil, pasta, thermal insulation, wine
Consultation concluded, awaiting approval PEFCRs: Beer, Coffee, Feed, T-shirts
Draft rules approved PEFCRs: Dairy, detergents, decorative paints, footwear, Hot & Cold water pipes systems, Intermediate paper products, IT equipment (storage), Metal sheets, batteries, packed water, pet food, photovoltaic electricity production, UPS OEFSRs: copper production, retail

Outlook
EC Evaluation
Peer review
Policy discussion
2017 2018 -
Consultations https://webgate.ec.europa.eu/fpfis/wikis/display/EUENVFP/
Mid-term conference: Brussels, 3-4 November 2015
For any further information
http://ec.europa.eu/environment/eussd/smgp/
https://webgate.ec.europa.eu/fpfis/wikis/display/EUENVFP/
Twitter: @EU_EnvFootprint