food access: prices, the retail environment, and health/media/files/activity files... · food...
TRANSCRIPT

Nutrition is our Agendanutrition.tufts.edu
Food access: prices, the retail environment, and health
IOM Workshop: Mapping the Food System an its Effects
September, 2013 Washington, DC
Parke Wilde

Literature Review: Overview
Food spending and health: • Food insecurity hypothesis • Food environment hypothesis • Food price hypothesis
Source: Wilde, Llobrera, and Valpiani, 2012. Current Obesity Reports.

Nutrition is our Agendanutrition.tufts.edu
Outline
• Prices • Food retail environment

Nutrition is our Agendanutrition.tufts.edu
Outline
• Prices • Food retail environment

Theory
Fruits and Vegetables
Price
Quantity

Theory
Fruits and Vegetables
Price
Quantity
Demand

Theory
Fruits and Vegetables
Price
Quantity
Supply

Theory
Fruits and Vegetables
Price
Quantity
Demand
Supply

Source: Andreyeva et al. (2010), American Journal of Public Health.

Elasticities show how beverage quantities respond to changes in prices and total beverage spending

Source: http://www.fns.usda.gov/ora/MENU/WhatsNew.htm .

Abt Associates | pg 12
Interim Impact on Mean TFV Intake
0.0
0.2
0.4
0.6
0.8
1.0
1.2
Cup-
Equi
vale
nts
Treatment group (N=1047 recalls over 946 respondents)
Control group (N=1033 recalls over 924 respondents)
}
impact = 0.22 cup-equivalents per day;
25% difference (p=0.001)
1.09 cup-equivalents per day
0.88 cup-equivalents per day

Effect of prices on child obesity
Source: Wendt and Todd (2011).

Literature Review: Food Prices and Mean BMI
Source Treatment BMI Design Type
FOOD PRICES
Wendt and Todd (2011)
A 10% price increase low-fat milk 0.07 ***
Longi- tudinal
A 10% price increase dark green veg 0.05 ** A 10% price increase for sweet snacks -.05 *** A 10% price increase for carbonated beverages 1 year prior1 -.08 ***
A 10% price increase for 100% juices 1 year prior1 -0.06 ***
A 10% price increase fresh/frozen starch veg 1 year prior1 -0.06 ***
Source: Wilde, Llobrera, and Valpiani, 2012. Current Obesity Reports.

Nutrition is our Agendanutrition.tufts.edu
Conclusions: Prices Main point: • It is plausible that retail prices affect
health. • In a framework, perhaps better to
address what you would like to happen to supply and demand (rather than prices).

Nutrition is our Agendanutrition.tufts.edu
Conclusions: Prices Research caution: • For each study, what is the source of
price variation?

Nutrition is our Agendanutrition.tufts.edu
Conclusions: Prices Policy caution: • In contemplating changes to market
prices, consider their effect on incentives for both producers and consumers.
• In contemplating taxes/subsidies, realistically assess the policy-making process.

Nutrition is our Agendanutrition.tufts.edu
Outline
• Prices • Food retail environment

Literature Review: Food Environments
• Larson N, Story M, Nelson M. (2009). Neighborhood environments: disparities in access to healthy foods in the U.S. Am J Prev Med.
• Giskes K, van Lenthe F, Avendano-Pabon M, Brug J. (2011). A systematic review of environmental factors and obesogenic dietary intakes among adults: Are we getting closer to understanding obesogenic environments? Obes Rev.

Nutrition is our Agendanutrition.tufts.edu
Matrix of Options
Food Environment
Measures
Other Measures of
Access
Geographic Unit
Geographic Boundary
•Density •Proximity •Composite
•Vehicle •Poverty •Food Insecurity
•Political •Census •Geometric
•Buffer •Distance, travel time •Size

≥1 mile from nearest supermarket
no automobile ≥ 10 miles
<1 mile from supermarket
and has automobile
Orange shading represents poor access to a supermarket.
Low access and low income (1)
Note: Analysis at the block group level.
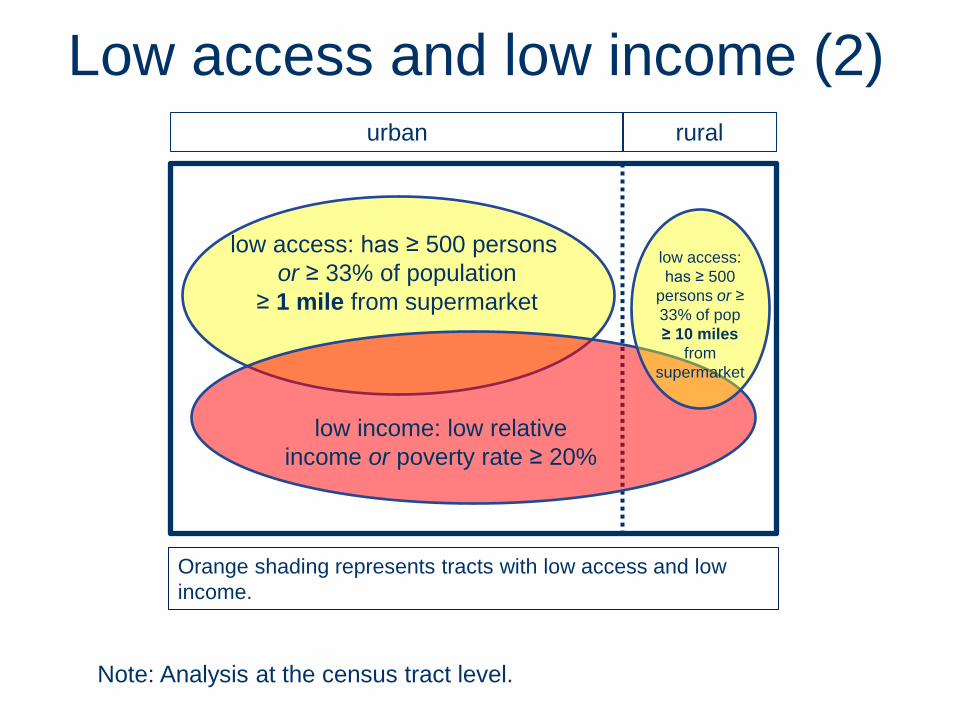
low access: has ≥ 500 persons or ≥ 33% of population
≥ 1 mile from supermarket
rural urban
low access: has ≥ 500
persons or ≥ 33% of pop ≥ 10 miles
from supermarket
Orange shading represents tracts with low access and low income.
low income: low relative income or poverty rate ≥ 20%
Low access and low income (2)
Note: Analysis at the census tract level.

Low-income areas are more likely to have a supermarket nearby.
Source: Ver Ploeg, Breneman, Dutko, Williams, Snyder, Dicken, and Kaufman (2012). Access to Affordable and Nutritious Food: Updated Estimates of Distance to Supermarkets Using 2010 Data, ERR-143, USDA/ERS.

-6-4
-20
2
0 .2 .4 .6 .8 1Poverty rate, people
lndist lndistFitted values
Census block groups: log(distance) from supermarket and poverty rate
Note: red indicates “low income/low access.” Source: Wilde and Llobrera (in review).


Literature Review: Food Environment and Mean BMI
Source Treatment BMI Design Type
FOOD ACCESS
Block et al. (2011)
A 1-km increase in distance to fast-food restaurant -0.11 * Longitudinal
A 1-km increase in distance to convenience store 0.02
Longitudinal
A 1-km increase in distance to grocery store -0.06 *
Longitudinal
A 1-km increase in distance to chain supermarket -0.02
Longitudinal
Source: Wilde, Llobrera, and Valpiani, 2012. Current Obesity Reports.

Literature Review: Food Environment and Odds of Obesity
Source Treatment OR Design Type
FOOD ACCESS
Currie et al. (2011)
An additional fast food restaurant within 0.1 miles (compared to having one within 0.25 miles)4
1.08 **
Longitudinal
Ludwig et al. (2011)
Receipt of a voucher to live in a low-poverty census tract versus no change in benefits4
0.95
Randomized trial
Source: Wilde, Llobrera, and Valpiani, 2012. Current Obesity Reports.

Nutrition is our Agendanutrition.tufts.edu
Conclusions: Retail Environment Main point: • It is plausible that the food retail
environment affects health, although empirical evidence is mixed.

Nutrition is our Agendanutrition.tufts.edu
Conclusions: Retail Environment Research caution: • Correlation is not causation. • Diagnosis of food deserts should
– avoid presuppositions, – account for vehicles, and – account for population density.

Nutrition is our Agendanutrition.tufts.edu
Conclusions: Retail Environment Policy caution: • Address poverty. • Consider neighborhoods not just from
the perspective of a community-based focus group, but also from the perspective of a commercial retailer.
• In contemplating retailer subsidies, focus on areas of greatest need only.

For more information … Food Policy in the United States: An Introduction
(Routledge/Earthscan, March 2013)
www.usfoodpolicy.com