fomc 20080318 g bpt 220080313
TRANSCRIPT

Prefatory Note The attached document represents the most complete and accurate version available based on original files from the FOMC Secretariat at the Board of Governors of the Federal Reserve System. Please note that some material may have been redacted from this document if that material was received on a confidential basis. Redacted material is indicated by occasional gaps in the text or by gray boxes around non-text content. All redacted passages are exempt from disclosure under applicable provisions of the Freedom of Information Act.
Content last modified 03/07/2014.
Class III FOMC - Internal (FR)
CURRENT ECONOMICAND FINANCIAL CONDITIONS
Part 2
Recent Developments
Prepared for the Federal Open Market Committeeby the staff of the Board of Governors of the Federal Reserve System
March 13, 2008

Class III FOMC - Internal (FR)
March 13, 2008
Recent Developments
Prepared for the Federal Open Market Committeeby the staff of the Board of Governors of the Federal Reserve System

Domestic NonfinancialDevelopments

Domestic Nonfinancial Developments
II-1
The economy appears to have stalled this quarter following a very weak fourth quarter. Labor market conditions deteriorated at the beginning of the year, with private payroll employment contracting in February for the third month in a row. Residential construction activity has continued its steep descent. Consumer spending looks to be about flat this quarter, as gains in household wealth and real income have diminished and sentiment has slumped. Business spending generally also appears to have been sluggish around the turn of the year, while forward-looking indicators such as business sentiment have soured, and manufacturing output has faltered. Meanwhile, the acceleration in prices since the middle of last year has continued, led by increases in food and energy prices. Core inflation has also stepped up in recent months, although the twelve-month change in core prices in January remained slightly below what it was a year ago.
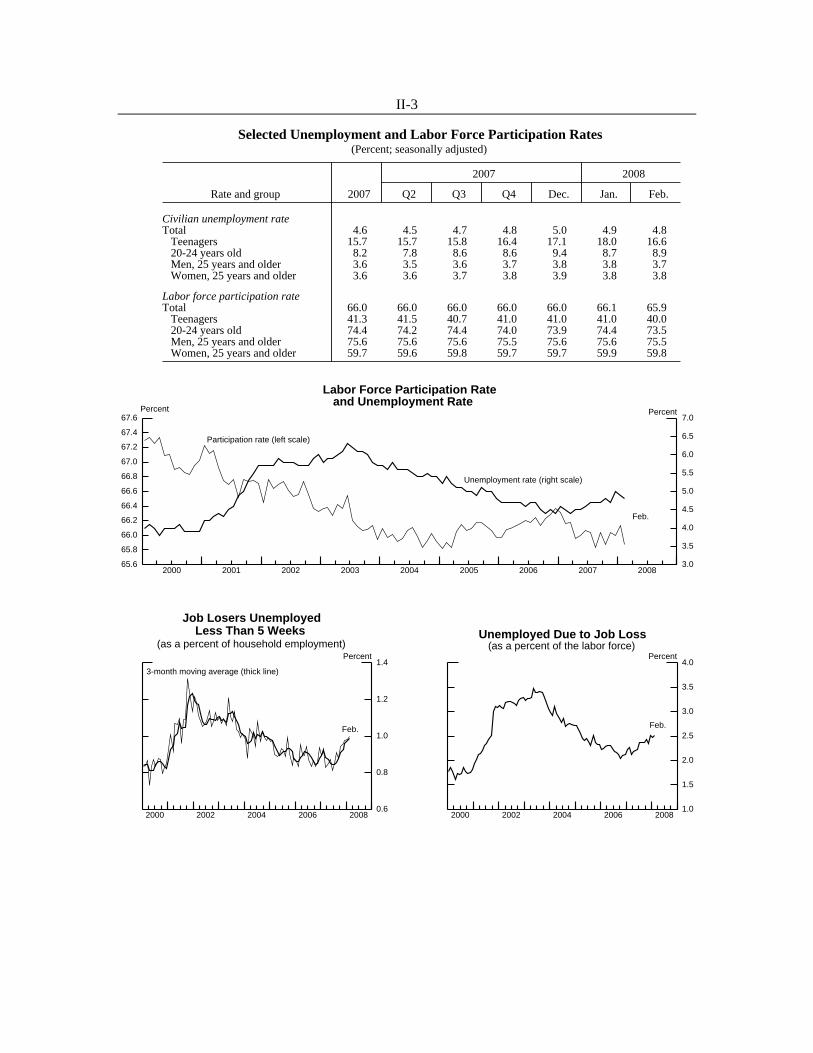
Labor Market Developments Labor demand has deteriorated markedly in recent months. In February, private payroll employment fell 101,000 following smaller job losses in the previous two months. With the exception of nonbusiness services, the recent employment declines were widespread. Manufacturing payrolls decreased at an average rate of 41,000 per month so far this year, about twice the pace seen in the second half of last year.1 Job losses in the temporary help industry also steepened over this period, while employment in wholesale trade—which often moves closely with the manufacturing sector—turned down. Employment in the residential construction industry and related financial services industries continued to decline in early 2008. The average workweek of production or nonsupervisory workers on private nonfarm payrolls moved down to 33.7 hours in January and held at that level in February. Accordingly, aggregate weekly hours fell in January and edged down a bit further in February to a level 0.4 percent (not at an annual rate) below the fourth-quarter average.
Turning to the household survey, the unemployment rate has averaged 4.9 percent over the past three months, up from 4.5 percent in the first half of last year. Most of the increase since that time is attributable to a rise in unemployed job losers. The labor force participation rate moved down 0.2 percentage point in February, to 65.9 percent, and has changed little, on net, since last spring.
1 On February 26, about 3,600 UAW employees at American Axle & Manufacturing, a motor vehicle
parts supplier for General Motors (GM), went on strike. By the week ending March 15—the reference week for the March payroll survey—GM anticipates that it will have temporarily shut down a number of assembly and parts plants, idling between 20,000 and 40,000 workers.

II-2
2000 2002 2004 2006 2008-400
-300
-200
-100
0
100
200
300
400
-400
-300
-200
-100
0
100
200
300
400Thousands
2000 2002 2004 2006 2008
Feb.
3-month moving average
Changes in Private Payroll Employment
2000 2002 2004 2006 200833.0
33.5
34.0
34.5
35.0 Hours
94
96
98
100
102
104
106
108
1102002 = 100
2000 2002 2004 2006 2008
Workweek(left scale)
Aggregate hours (right scale)
Feb.
Aggregate Hours and Workweek of Production or Nonsupervisory Workers
Changes in Employment(Thousands of employees; seasonally adjusted)
2007 2008
Measure and sector 2006 H1 Q3 Q4 Dec. Jan. Feb.
Average monthly change Monthly change
Nonfarm payroll employment (establishment survey) 175 107 71 80 41 -22 -63 Private 159 87 62 45 -14 -26 -101 Natural resources and mining 5 3 2 4 4 2 2 Manufacturing -14 -24 -23 -17 -22 -31 -52 Construction 13 -7 -22 -41 -55 -25 -39 Wholesale trade 12 10 9 6 -2 -5 -7 Retail trade 5 12 1 0 -25 0 -34 Transportation and utilities 10 2 7 -3 -8 -7 2 Information -2 0 -1 -4 -4 -4 1 Financial activities 9 -7 -8 -14 -8 -8 -12 Professional and business services 46 19 22 44 52 -9 -20 Temporary help services 1 -9 -13 4 -5 -11 -28 Nonbusiness services1 76 80 76 71 54 61 58 Total government 16 20 8 35 55 4 38 Total employment (household survey) 264 23 58 -16 -436 37 -255 Memo:Aggregate hours of private production workers (percent change)2 2.4 1.4 1.1 1.0 .1 -.4 -.1 Average workweek (hours)3 33.9 33.8 33.8 33.8 33.8 33.7 33.7 Manufacturing (hours) 41.1 41.1 41.4 41.2 41.1 41.1 41.1
1. Nonbusiness services comprises education and health, leisure and hospitality, and "other." 2. Establishment survey. Annual data are percent changes from Q4 to Q4. Quarterly data are percent changes from precedingquarter at an annual rate. Monthly data are percent changes from preceding month. 3. Establishment survey.
II-3
2000 2001 2002 2003 2004 2005 2006 2007 200865.6
65.8
66.0
66.2
66.4
66.6
66.8
67.0
67.2
67.4
67.6 Percent
3.0
3.5
4.0
4.5
5.0
5.5
6.0
6.5
7.0Percent
Unemployment rate (right scale)
Participation rate (left scale)
Feb.
Labor Force Participation Rateand Unemployment Rate
2000 2001 2002 2003 2004 2005 2006 2007 20080.6
0.8
1.0
1.2
1.4
0.6
0.8
1.0
1.2
1.4Percent
2000 2002 2004 2006 2008
3-month moving average (thick line)
Job Losers UnemployedLess Than 5 Weeks
(as a percent of household employment)
Feb.
2000 2001 2002 2003 2004 2005 2006 2007 20081.0
1.5
2.0
2.5
3.0
3.5
4.0
1.0
1.5
2.0
2.5
3.0
3.5
4.0Percent
2000 2002 2004 2006 2008
Feb.
Unemployed Due to Job Loss(as a percent of the labor force)
Selected Unemployment and Labor Force Participation Rates(Percent; seasonally adjusted)
2007 2008
Rate and group 2007 Q2 Q3 Q4 Dec. Jan. Feb.
Civilian unemployment rateTotal 4.6 4.5 4.7 4.8 5.0 4.9 4.8 Teenagers 15.7 15.7 15.8 16.4 17.1 18.0 16.6 20-24 years old 8.2 7.8 8.6 8.6 9.4 8.7 8.9 Men, 25 years and older 3.6 3.5 3.6 3.7 3.8 3.8 3.7 Women, 25 years and older 3.6 3.6 3.7 3.8 3.9 3.8 3.8
Labor force participation rateTotal 66.0 66.0 66.0 66.0 66.0 66.1 65.9 Teenagers 41.3 41.5 40.7 41.0 41.0 41.0 40.0 20-24 years old 74.4 74.2 74.4 74.0 73.9 74.4 73.5 Men, 25 years and older 75.6 75.6 75.6 75.5 75.6 75.6 75.5 Women, 25 years and older 59.7 59.6 59.8 59.7 59.7 59.9 59.8
II-4
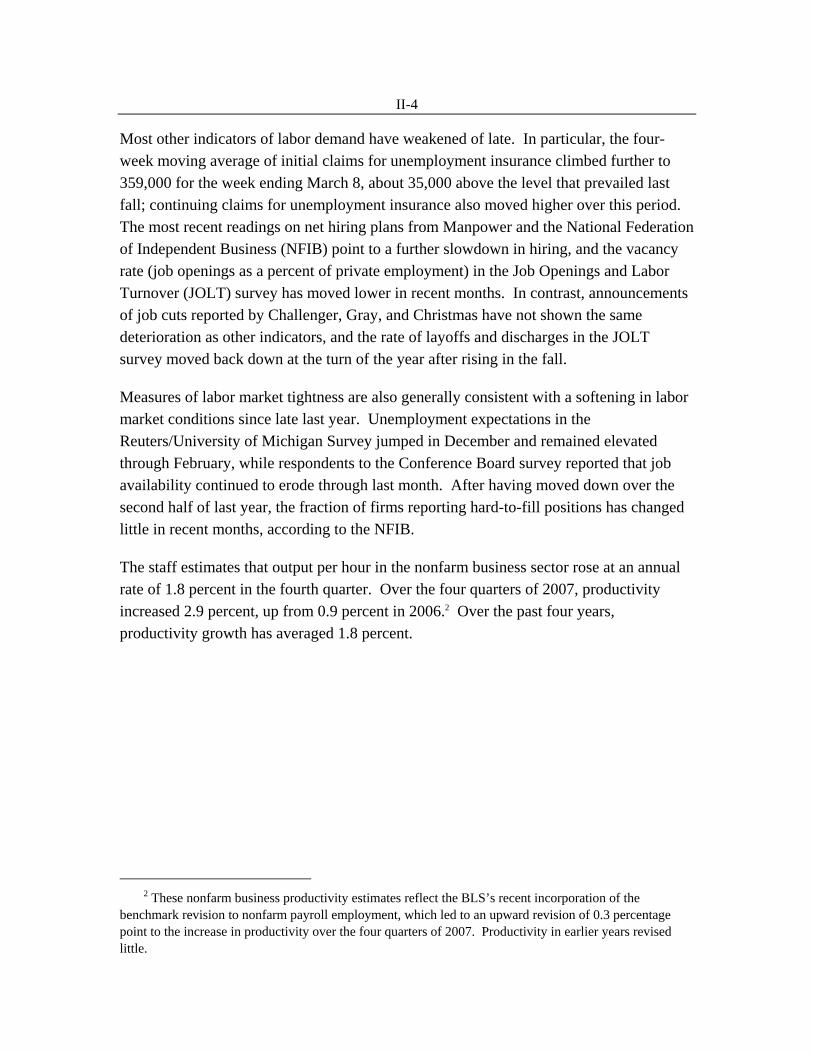
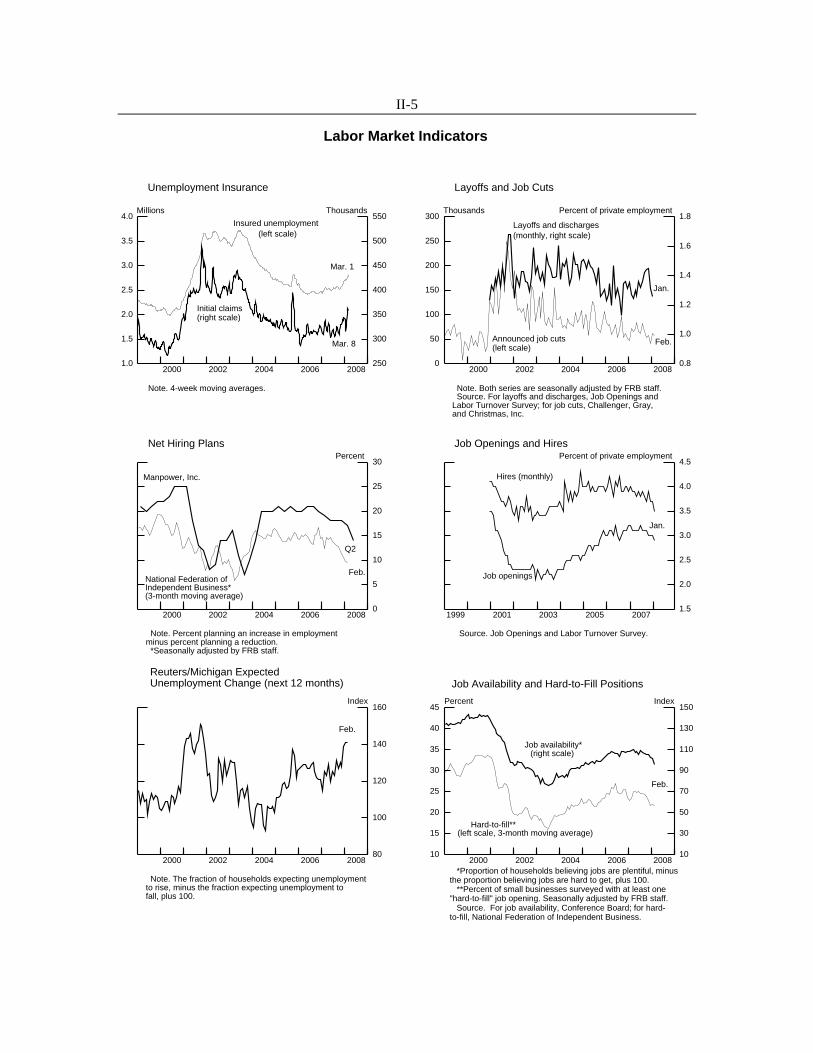
Most other indicators of labor demand have weakened of late. In particular, the four-week moving average of initial claims for unemployment insurance climbed further to 359,000 for the week ending March 8, about 35,000 above the level that prevailed last fall; continuing claims for unemployment insurance also moved higher over this period. The most recent readings on net hiring plans from Manpower and the National Federation of Independent Business (NFIB) point to a further slowdown in hiring, and the vacancy rate (job openings as a percent of private employment) in the Job Openings and Labor Turnover (JOLT) survey has moved lower in recent months. In contrast, announcements of job cuts reported by Challenger, Gray, and Christmas have not shown the same deterioration as other indicators, and the rate of layoffs and discharges in the JOLT survey moved back down at the turn of the year after rising in the fall.
Measures of labor market tightness are also generally consistent with a softening in labor market conditions since late last year. Unemployment expectations in the Reuters/University of Michigan Survey jumped in December and remained elevated through February, while respondents to the Conference Board survey reported that job availability continued to erode through last month. After having moved down over the second half of last year, the fraction of firms reporting hard-to-fill positions has changed little in recent months, according to the NFIB.
The staff estimates that output per hour in the nonfarm business sector rose at an annual rate of 1.8 percent in the fourth quarter. Over the four quarters of 2007, productivity increased 2.9 percent, up from 0.9 percent in 2006.2 Over the past four years, productivity growth has averaged 1.8 percent.
2 These nonfarm business productivity estimates reflect the BLS’s recent incorporation of the
benchmark revision to nonfarm payroll employment, which led to an upward revision of 0.3 percentage point to the increase in productivity over the four quarters of 2007. Productivity in earlier years revised little.
II-5
Labor Market Indicators
2000 2002 2004 2006 20081.0
1.5
2.0
2.5
3.0
3.5
4.0 Millions
250
300
350
400
450
500
550Thousands
2000 2002 2004 2006 2008
Initial claims(right scale)
Mar. 8
Insured unemployment (left scale)
Mar. 1
Note. 4-week moving averages.
Unemployment Insurance
2000 2002 2004 2006 20080
50
100
150
200
250
300 Thousands
0.8
1.0
1.2
1.4
1.6
1.8Percent of private employment
2000 2002 2004 2006 2008
Jan.
Layoffs and discharges(monthly, right scale)
Feb.Announced job cuts(left scale)
Note. Both series are seasonally adjusted by FRB staff. Source. For layoffs and discharges, Job Openings andLabor Turnover Survey; for job cuts, Challenger, Gray,and Christmas, Inc.
Layoffs and Job Cuts
2000 2002 2004 2006 20080
5
10
15
20
25
30
0
5
10
15
20
25
30Percent
2000 2002 2004 2006 2008
Manpower, Inc.
National Federation ofIndependent Business*(3-month moving average)
Q2
Feb.
Note. Percent planning an increase in employmentminus percent planning a reduction. *Seasonally adjusted by FRB staff.
Net Hiring Plans
2000 2002 2004 2006 20081.5
2.0
2.5
3.0
3.5
4.0
4.5
1.5
2.0
2.5
3.0
3.5
4.0
4.5Percent of private employment
1999 2001 2003 2005 2007
Jan.
Job openings
Hires (monthly)
Source. Job Openings and Labor Turnover Survey.
Job Openings and Hires
2000 2002 2004 2006 200880
100
120
140
160
80
100
120
140
160Index
2000 2002 2004 2006 2008
Reuters/Michigan Expected Unemployment Change (next 12 months)
Feb.
Note. The fraction of households expecting unemploymentto rise, minus the fraction expecting unemployment to fall, plus 100.
2000 2002 2004 2006 200810
15
20
25
30
35
40
45 Percent
10
30
50
70
90
110
130
150Index
2000 2002 2004 2006 2008
Job Availability and Hard-to-Fill Positions
*Proportion of households believing jobs are plentiful, minus the proportion believing jobs are hard to get, plus 100. **Percent of small businesses surveyed with at least one"hard-to-fill" job opening. Seasonally adjusted by FRB staff. Source. For job availability, Conference Board; for hard-to-fill, National Federation of Independent Business.
Job availability*(right scale)
Hard-to-fill**(left scale, 3-month moving average)
Feb.

II-6
Output per Hour(Percent change from preceding period at an annual rate;
seasonally adjusted)
2005:Q4 2006:Q4 2007to to
Sector 2006:Q4 2007:Q4 Q1 Q2 Q3 Q4
Nonfarm business All persons .9 2.91 1.0 2.6 6.3 1.81
All employees2 1.1 2.21 .7 2.9 5.2 .21
Nonfinancial corporations3 1.4 n.a. 1.2 2.1 2.9 n.a.
1. Staff estimates. 2. Assumes that the growth rate of hours of non-employees equals the growth rate of hours of employees. 3. All corporations doing business in the United States except banks, stock and commodity brokers,and finance and insurance companies. The sector accounts for about two-thirds of business employment.Nonfinancial corporate output is calculated as an income-side measure. n.a. Not available.
3 As noted, parts shortages from the American Axle & Manufacturing strike have caused a significant
number of GM assembly plants in the U.S. to shut down. We estimate that each week of lost production at the affected plants would reduce total production in March by roughly 175,000 units (annual rate) and would reduce the change in total IP by about 0.05 percent.
Industrial Production The available indicators suggest that industrial production (IP) dropped back in February after having edged up in the previous two months. Factory output appears to have slipped last month, and utilities output fell sharply after a weather-related rise in January. While weakness in the construction and motor vehicle sectors has restrained manufacturing output recently, robust exports have provided a partial buffer. Capacity utilization in manufacturing stood at 81.5 percent in January, ¾ percentage point below the previous peak last July but still ½ percentage point above its 1972-2007 average.
The output of motor vehicles and parts moved down further early this year. Total motor vehicle assemblies in January and February averaged an annual rate of 10.1 million units, down about 400,000 units from their pace in the fourth quarter of last year. The automakers have been diligent in their efforts to keep production aligned with sales. Thus, despite the recent step-down in sales, days’ supply of light vehicles in February remained near its historical average. The latest production schedules, which do not incorporate the strike-related plant shutdowns at General Motors (GM),3 call for assemblies to edge up slightly in both March and the second quarter. Elsewhere in transportation, commercial aircraft production continued to rise at the beginning of the year, as Boeing prepares for the launch of its new 787 Dreamliner.
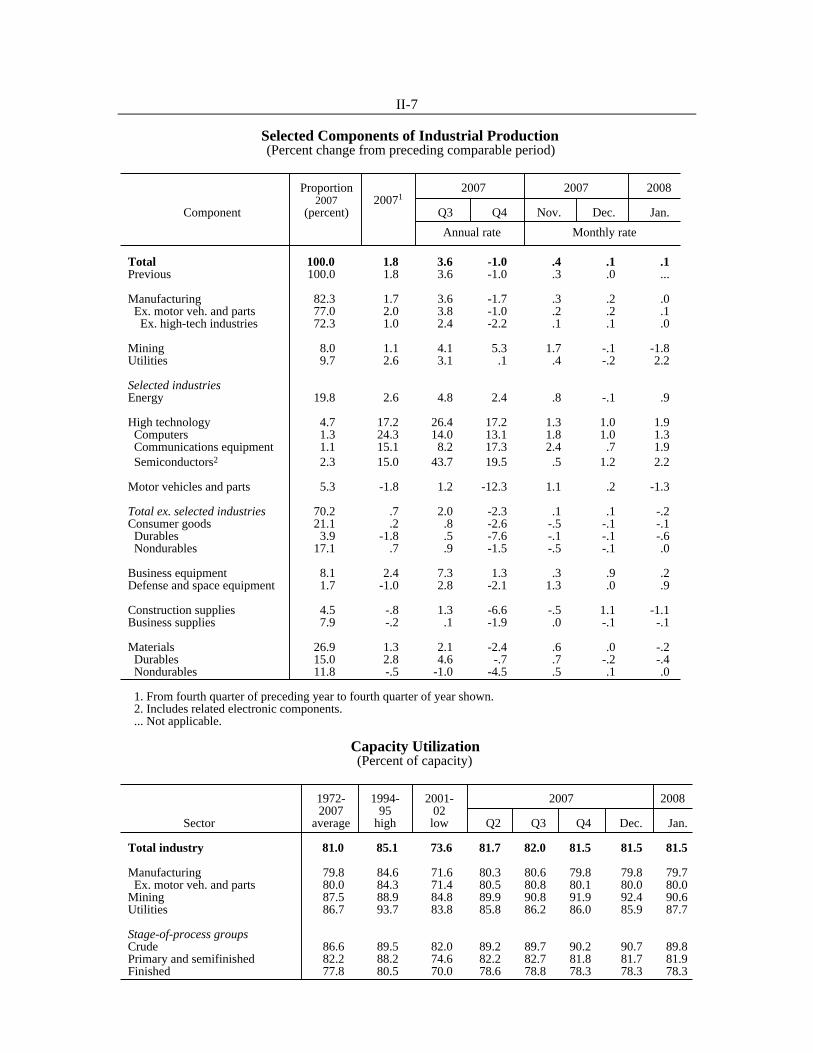
II-7
Selected Components of Industrial Production (Percent change from preceding comparable period)
Proportion 2007 2007 20082007 20071
Component (percent) Q3 Q4 Nov. Dec. Jan.
Total 100.0 1.8 3.6 -1.0 .4 .1 .1Previous 100.0 1.8 3.6 -1.0 .3 .0 ...
Manufacturing 82.3 1.7 3.6 -1.7 .3 .2 .0 Ex. motor veh. and parts 77.0 2.0 3.8 -1.0 .2 .2 .1 Ex. high-tech industries 72.3 1.0 2.4 -2.2 .1 .1 .0
Mining 8.0 1.1 4.1 5.3 1.7 -.1 -1.8Utilities 9.7 2.6 3.1 .1 .4 -.2 2.2
Selected industriesEnergy 19.8 2.6 4.8 2.4 .8 -.1 .9
High technology 4.7 17.2 26.4 17.2 1.3 1.0 1.9 Computers 1.3 24.3 14.0 13.1 1.8 1.0 1.3 Communications equipment 1.1 15.1 8.2 17.3 2.4 .7 1.9 Semiconductors2 2.3 15.0 43.7 19.5 .5 1.2 2.2
Motor vehicles and parts 5.3 -1.8 1.2 -12.3 1.1 .2 -1.3
Total ex. selected industries 70.2 .7 2.0 -2.3 .1 .1 -.2Consumer goods 21.1 .2 .8 -2.6 -.5 -.1 -.1 Durables 3.9 -1.8 .5 -7.6 -.1 -.1 -.6 Nondurables 17.1 .7 .9 -1.5 -.5 -.1 .0
Business equipment 8.1 2.4 7.3 1.3 .3 .9 .2Defense and space equipment 1.7 -1.0 2.8 -2.1 1.3 .0 .9
Construction supplies 4.5 -.8 1.3 -6.6 -.5 1.1 -1.1Business supplies 7.9 -.2 .1 -1.9 .0 -.1 -.1
Materials 26.9 1.3 2.1 -2.4 .6 .0 -.2 Durables 15.0 2.8 4.6 -.7 .7 -.2 -.4 Nondurables 11.8 -.5 -1.0 -4.5 .5 .1 .0
1. From fourth quarter of preceding year to fourth quarter of year shown. 2. Includes related electronic components. ... Not applicable.
Annual rate Monthly rate
Capacity Utilization (Percent of capacity)
1972- 1994- 2001- 2007 20082007 95 02
Sector average high low Q2 Q3 Q4 Dec. Jan.
Total industry 81.0 85.1 73.6 81.7 82.0 81.5 81.5 81.5
Manufacturing 79.8 84.6 71.6 80.3 80.6 79.8 79.8 79.7 Ex. motor veh. and parts 80.0 84.3 71.4 80.5 80.8 80.1 80.0 80.0Mining 87.5 88.9 84.8 89.9 90.8 91.9 92.4 90.6Utilities 86.7 93.7 83.8 85.8 86.2 86.0 85.9 87.7
Stage-of-process groupsCrude 86.6 89.5 82.0 89.2 89.7 90.2 90.7 89.8Primary and semifinished 82.2 88.2 74.6 82.2 82.7 81.8 81.7 81.9Finished 77.8 80.5 70.0 78.6 78.8 78.3 78.3 78.3

II-8
Production of Domestic Light Vehicles(Millions of units at an annual rate except as noted)
2007 2008 2007 2008
Item Q3 Q4 Q1 Q2 Dec. Jan. Feb. Mar.
U.S. production1 10.7 10.3 9.9 10.1 10.3 9.9 9.9 10.0 Autos 3.9 4.0 4.0 4.1 4.1 4.0 3.9 4.1 Light trucks 6.8 6.3 5.9 6.1 6.2 6.0 6.0 5.9
Days’ supply2 69 64 n.a. n.a. 64 67 68 n.a. Autos 59 51 n.a. n.a. 50 53 54 n.a. Light trucks 75 76 n.a. n.a. 76 78 79 n.a.
Inventories3 2.75 2.59 n.a. n.a. 2.59 2.56 2.59 n.a. Autos .99 .90 n.a. n.a. .90 .88 .88 n.a. Light trucks 1.76 1.69 n.a. n.a. 1.69 1.68 1.70 n.a.
Memo: U.S. production, total motor vehicles4 10.9 10.5 10.1 10.4 10.5 10.2 10.1 10.2
Note. FRB seasonals. Components may not sum to totals because of rounding. 1. Production rates for March and the second quarter reflect the latest industry schedules. 2. Quarterly values are calculated with end-of-period stocks and average reported sales. 3. End-of-period stocks. 4. Includes medium and heavy trucks. n.a. Not available.
2.2
2.4
2.6
2.8
3.0
3.2
3.4
3.6Millions of units
1998 1999 2000 2001 2002 2003 2004 2005 2006 2007 2008
Feb.
Inventories of Light Vehicles
30
40
50
60
70
80
90Days
1998 1999 2000 2001 2002 2003 2004 2005 2006 2007 2008
Feb.
Using sales in current monthUsing 3-month moving average of sales
Days’ Supply of Light Vehicles

II-9
Output in high-tech industries has increased moderately of late. Semiconductor output—MPU and non-MPU chips—has slowed since the middle of last year, and domestic orders of printed circuit boards, a nonchip category of semiconductor IP, slumped further in January. Strong consumer demand led to a jump in unit sales of personal computers (PC) in the fourth quarter, but sales of servers only edged up. Elsewhere in high-tech, the output of communications equipment continued to post solid gains in January after a strong fourth quarter.
Forward-looking indicators suggest that high-tech output will continue to increase but at only a modest pace. Intel’s latest guidance for the current quarter points to little change in nominal revenue and is consistent with a moderate rise in real MPU production. The International Data Corporation (IDC) projects that the pace of PC sales will slow this quarter, and recent anecdotal reports from large computer producers such as Hewlett-Packard and IBM indicate that domestic demand has decelerated noticeably. First-quarter earnings guidance from Cisco, a large producer of high-end data networking equipment, suggests that demand for this category of communications equipment softened appreciably since the turn of the year.
Outside of energy, transportation, and high-tech, production was little changed in the three months ending in January, and the available data suggest that output declined in February. Among the major market groups, production of materials fell in January, as did production of construction supplies, which was 1.3 percent below its level a year earlier. Supplies associated with residential construction were down more than 7 percent relative to their year-earlier level, while the production of supplies associated with nonresidential construction was little changed. Elsewhere, consumer goods output declined for the fourth consecutive month in January, while business equipment production rose modestly.
Near-term indicators of manufacturing activity generally suggest that production will remain sluggish, at best, over the next few months. In particular, the three-month moving average of real adjusted durable goods orders was flat in January, the Institute of Supply Management’s (ISM) diffusion index of new orders stood below 50 for a third month in February, and the new orders indexes from regional surveys continued to decline, on balance. On a more positive note, the staff’s series on announced layoffs in the manufacturing sector has remained at a relatively low level the past several months.

II-10
Indicators of High-Tech Manufacturing Activity
2000 2001 2002 2003 2004 2005 2006 2007 2008 5
6
7
8
9
10
11
Note. FRB seasonals. Q1 Intel revenue is the range of thecompany’s guidance as of March 3, 2008. Source. Intel and Semiconductor Industry Association.
Worldwide MPU shipments
Intel revenue
Billions of dollars, ratio scale
Q1
Q4
MPU Shipments and Intel Revenue
2000 2001 2002 2003 2004 2005 2006 2007 2008-8
-6
-4
-2
0
2
4
6
8
10
12
14
-8
-6
-4
-2
0
2
4
6
8
10
12
14Percent
3-month moving average
MPUs
Non-MPU chips
Jan.
Note. MPU is a microprocessor unit.
Rate of Change in SemiconductorIndustrial Production
2001 2002 2003 2004 2005 2006 2007 20080.3
0.4
0.5
0.6
0.7
0.8
0.9
1.0
10
11
12
13
14
15
16
17
18
Q4
Q1
PCs (right scale)
Servers (left scale)
Millions of units, ratio scale Millions of units, ratio scale
Note. FRB seasonals. PCs include desktops, notebooks,ultraportables, and x86 PC servers. Q1 PC shipments isIDC forecast.
Source. International Data Corporation.
U.S. Personal Computer and Server Sales
2002 2003 2004 2005 2006 20074.0
4.5
5.0
5.5
6.0
6.5
7.0
7.5
8.0
Q4
Consumers
Businesses
Note. FRB seasonals. Source. International Data Corporation.
Millions of units, ratio scale
Personal Computer Sales by Market
2002 2003 2004 2005 2006 2007 2008
Billions of dollars
80
100
120
140
160
180
Jan.Shipments
Orders
Note. U.S. and Canadian bare and loaded circuit boardshipments. Source. Institute for Printed Circuits.
Circuit Board Orders and Shipments
2001 2002 2003 2004 2005 2006 2007 2008
2006 = 100
40
60
80
100
120
140
Cisco
U.S. sales
Note. FRB seasonals. Source. Synergy Research Group and Cisco Systems.
Q4
Q1
Cisco Revenue and U.S. Sales of High-EndData Networking Equipment

II-11
Indicators of Industrial Activity
8.0
8.5
9.0
9.5
10.0
10.5Index
Feb. May Aug. Nov. Feb. May Aug. Nov. Feb.2006 2007 2008
Note. One index point equals 1 percent of 2002 total industrial output.
Monthly aggregate of weekly indexWeekly index
Weekly Production Index excluding MotorVehicles and Electricity Generation
2002 2003 2004 2005 2006 2007 20080.1
0.2
0.3
0.4
0.5
0.6 Millions of units
8
9
10
11
12
13Millions of units
+Mar.Medium and heavy trucks
(left scale)
Note. March values are based on latest industryschedules.
+
Autos and light trucks (right scale)
Motor Vehicle Assemblies
2002 2003 2004 2005 2006 200715
16
17
18
19
20
21
22
20
22
24
26
28
30
Imports/domestic absorbtion (right scale)
Exports/shipments (left scale)
Note. Trade shares are 3-month moving averages. Source. Department of Commerce.
Percent
Dec.
Percent
Trade Shares
2002 2003 2004 2005 2006 2007 200825
45
65
85
105
125
145
165
185
25
45
65
85
105
125
145
165
1852002 = 100
Jan.
Commercial
Military
Boeing strike
IP for Aircraft
2002 2003 2004 2005 2006 2007 2008-4
-3
-2
-1
0
1
2
3
4 Percent
10
20
30
40
50
60
70
80
90Diffusion index
ISM (right scale)
RADGO (left scale)
Note. The diffusion index equals the percentage of respondents reporting greater levels of new orders plus one-half the percentage of respondents reporting that new orders were unchanged. RADGO is a 3-month moving average.
Feb.
Jan.
New Orders: ISM Survey and Change in RealAdjusted Durable Goods Orders (RADGO)
0
10
20
30
40
50
60
70
0
10
20
30
40
50
60
70
Feb. May Aug. Nov. Feb. May Aug. Nov. Feb. May Aug. Nov. Feb.2005 2006 2007 2008
Note. FRB seasonals. Source. Collected by staff.
Thousands
Manufacturing Layoff Announcements
II-12
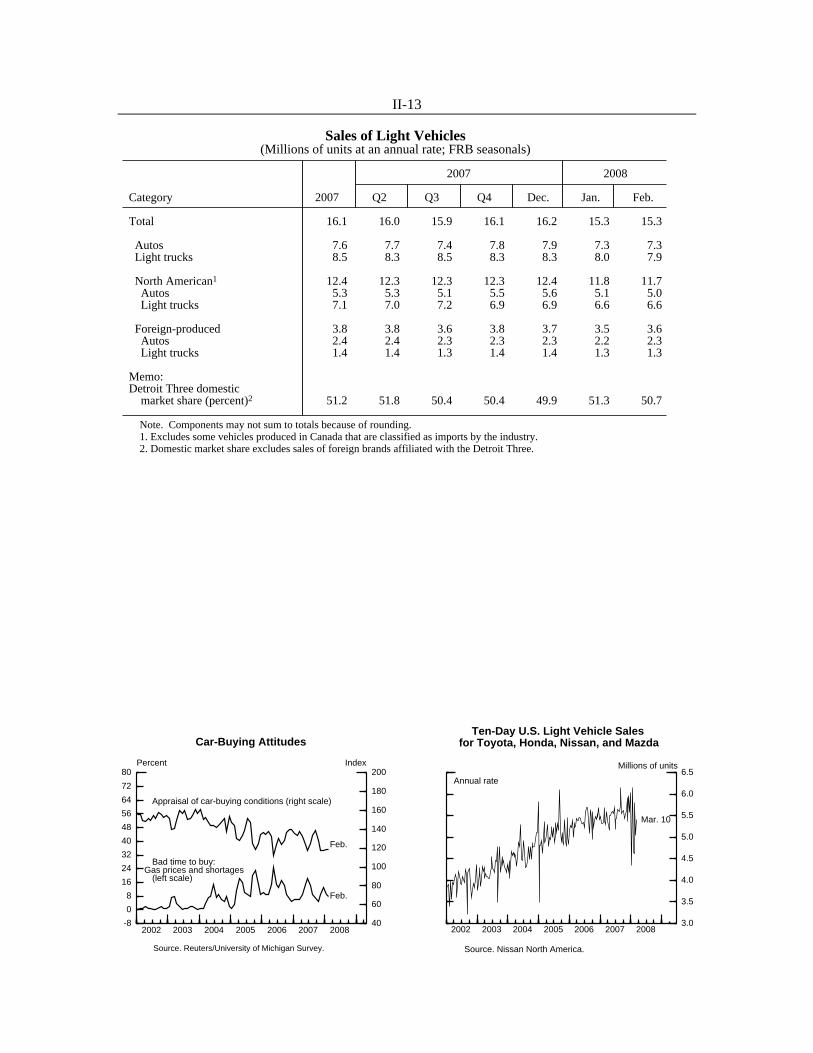
Motor Vehicles The average pace of light vehicle sales stepped down in January and February to an average annual rate of 15.3 million units, or 800,000 units below the fourth-quarter pace.
. The available indicators of vehicle demand suggest that sales will remain soft in the near term: Employment has fallen, real income gains have been weak, and the Reuters/University of Michigan Survey index of car-buying attitudes remained near its historic low in February. Through the first ten days of March, the pace of sales at Toyota, Honda, Nissan, and Mazda was about the same as last month, and our contacts at the major domestic firms are also projecting flat sales for March.
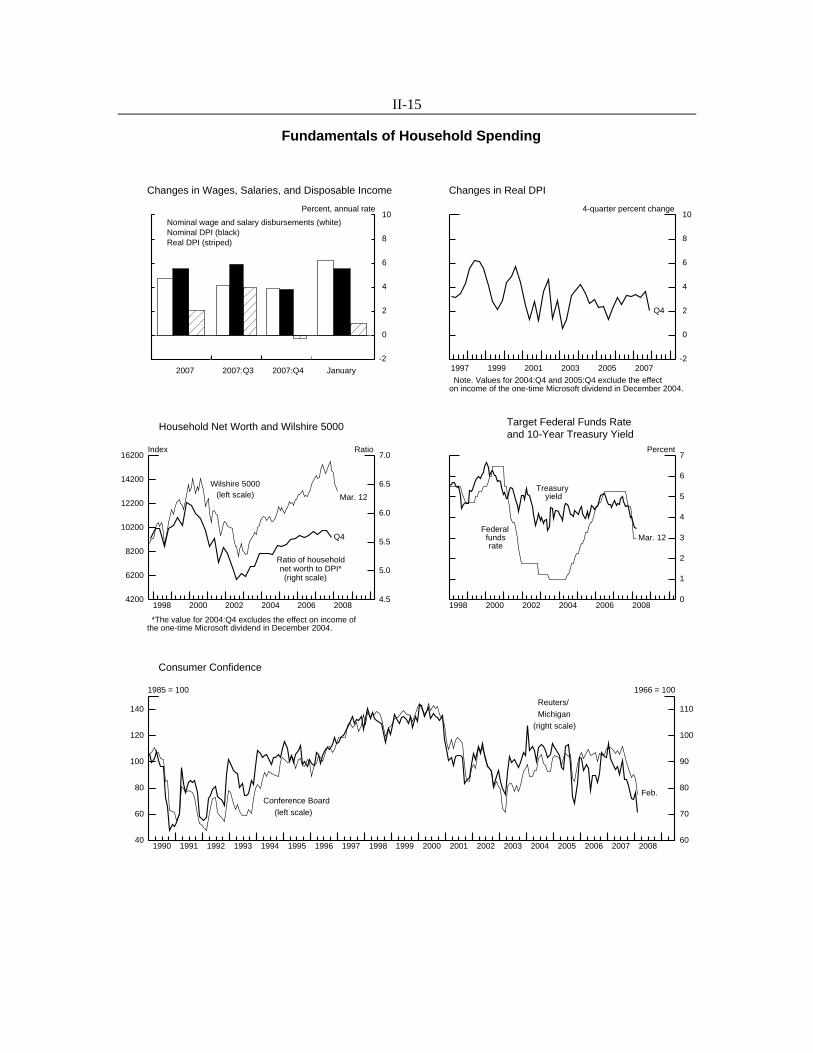
Consumer Spending Consumer spending has slowed in recent months. Nominal sales in the retail control category, which excludes sales at auto dealers and building material and supply stores, moved down in February on sharply lower sales at gasoline stations and weakness at most types of establishments. Factoring in our estimate of PCE prices, real spending in the retail control category of goods has now fallen at an average rate of 0.2 percent per month over the past three months. As noted above, spending on motor vehicles has also sagged recently. And, although real spending on services is reported to have increased solidly from November through January, part of this strength reflected a jump in outlays for energy services, which was likely transitory. Moreover, the Bureau of Economic Analysis (BEA) lacks timely data on many categories of services consumption, and its estimates for these categories are often extrapolations of past trends that may not accurately reflect the recent pace of spending.4
The slowing in consumer spending likely reflects the deterioration in its fundamental determinants and tighter credit conditions for some households. House prices fell in the fourth quarter of 2007, and equity prices have declined appreciably since the start of this year; both developments point to a noticeable decline in the ratio of household net worth to disposable personal income (DPI) this quarter. In addition, real DPI was unchanged in the fourth quarter, held down by higher prices for food and imported oil, and was reported to have only edged up in January despite a temporary boost from the BEA’s estimate of turn-of-the-year bonuses. While interest rates on credit cards and auto loans have edged down recently, industry reports suggest that tighter standards in consumer
4 Consumer spending on services has been subject to noticeable downward revisions around the start of
downturns in economic activity—for example, from late 1981 to early 1982 and then from late 1990 to early 1991.
II-13
Sales of Light Vehicles(Millions of units at an annual rate; FRB seasonals)
2007 2008
Category 2007 Q2 Q3 Q4 Dec. Jan. Feb.
Total 16.1 16.0 15.9 16.1 16.2 15.3 15.3
Autos 7.6 7.7 7.4 7.8 7.9 7.3 7.3 Light trucks 8.5 8.3 8.5 8.3 8.3 8.0 7.9
North American1 12.4 12.3 12.3 12.3 12.4 11.8 11.7 Autos 5.3 5.3 5.1 5.5 5.6 5.1 5.0 Light trucks 7.1 7.0 7.2 6.9 6.9 6.6 6.6
Foreign-produced 3.8 3.8 3.6 3.8 3.7 3.5 3.6 Autos 2.4 2.4 2.3 2.3 2.3 2.2 2.3 Light trucks 1.4 1.4 1.3 1.4 1.4 1.3 1.3
Memo:Detroit Three domestic market share (percent)2 51.2 51.8 50.4 50.4 49.9 51.3 50.7
Note. Components may not sum to totals because of rounding. 1. Excludes some vehicles produced in Canada that are classified as imports by the industry. 2. Domestic market share excludes sales of foreign brands affiliated with the Detroit Three.
3.0
3.5
4.0
4.5
5.0
5.5
6.0
6.5
Ten-Day U.S. Light Vehicle Salesfor Toyota, Honda, Nissan, and Mazda
Millions of units
Annual rate
2002 2003 2004 2005 2006 2007 2008
Mar. 10
Source. Nissan North America.
-8
0
8
16
24
32
40
48
56
64
72
80 Percent
40
60
80
100
120
140
160
180
200Index
2002 2003 2004 2005 2006 2007 2008
Feb.
Feb.
Bad time to buy:Gas prices and shortages
(left scale)
Appraisal of car-buying conditions (right scale)
Car-Buying Attitudes
Source. Reuters/University of Michigan Survey.

II-14
Retail and Food Services Sales(Percent change from preceding period; seasonally adjusted current dollars)
2007 2008Category Q2 Q3 Q4 Dec. Jan. Feb.
Annual rate Monthly rate
Total sales 4.8 3.7 3.6 -.7 .4 -.6 Retail control1 7.8 4.0 6.0 -.3 .6 -.2 Ex. sales at gasoline stations 4.7 5.0 1.9 -.3 .3 .0Memo: Real PCE control2 .3 4.1 1.0 -.6 .0 -.1
1. Total sales less outlays at building material and supply stores and automobile and other motorvehicle dealers. 2. Total goods spending excluding autos and trucks. The values for December and January are staffestimates. The value for February is a staff forecast.
2004 2005 2006 2007 2008-2.0
-1.5
-1.0
-0.5
0.0
0.5
1.0
1.5
2.0
-2.0
-1.5
-1.0
-0.5
0.0
0.5
1.0
1.5
2.0Percent
Note. The values for December and January are staff estimates. The value for February is a staff forecast.
1-month
6-month
Feb.
Change in Real PCE Goods
2004 2005 2006 2007 2008-1.0
-0.8
-0.6
-0.4
-0.2
-0.0
0.2
0.4
0.6
0.8
1.0
-1.0
-0.8
-0.6
-0.4
-0.2
-0.0
0.2
0.4
0.6
0.8
1.0Percent
1-month
6-month
Jan.
Change in Real PCE Services
1996 1997 1998 1999 2000 2001 2002 2003 2004 2005 2006 2007 2008-6
-4
-2
0
2
4
6
-6
-4
-2
0
2
4
6Percent
Jan.
Personal Saving Rate
II-15
Fundamentals of Household Spending
2007
Changes in Wages, Salaries, and Disposable Income Changes in Real DPI
Nominal wage and salary disbursements (white) Nominal DPI (black) Real DPI (striped)
2007:Q42007:Q3
-2
0
2
4
6
8
10 Percent, annual rate
January1998 2000 2002 2004 2006 2008
-2
0
2
4
6
8
10
-2
0
2
4
6
8
104-quarter percent change
Q4
Note. Values for 2004:Q4 and 2005:Q4 exclude the effecton income of the one-time Microsoft dividend in December 2004.
1997 1999 2001 2003 2005 2007
1998 2000 2002 2004 2006 20084200
6200
8200
10200
12200
14200
16200 Index
4.5
5.0
5.5
6.0
6.5
7.0Ratio
Q4
Wilshire 5000(left scale)
Ratio of householdnet worth to DPI*(right scale)
*The value for 2004:Q4 excludes the effect on income ofthe one-time Microsoft dividend in December 2004.
Mar. 12
Household Net Worth and Wilshire 5000
1998 2000 2002 2004 2006 20080
1
2
3
4
5
6
7
0
1
2
3
4
5
6
7Percent
Target Federal Funds Rate and 10-Year Treasury Yield
Mar. 12Federal
fundsrate
Treasuryyield
1990 1991 1992 1993 1994 1995 1996 1997 1998 1999 2000 2001 2002 2003 2004 2005 2006 2007 200840
60
80
100
120
140
1985 = 100
60
70
80
90
100
110
1966 = 100
Feb.Conference Board
(left scale)
Reuters/Michigan
(right scale)
Consumer Confidence

II-16
loan markets are limiting some households’ access to credit, which may be constraining their spending. Despite that credit tightening, the personal saving rate in January remained a shade below zero for the third straight month, as households are apparently adjusting only slowly to their reduced purchasing power.
Consumer sentiment, as measured by the Reuters/University of Michigan and Conference Board surveys, deteriorated sharply in February on heightened concerns about current economic conditions and the near-term outlook. The index from the Reuters/Michigan survey now stands 20 points below its level in midsummer and is around the lows reached in the early 1990s. About two-thirds of Reuters/Michigan survey respondents said they expect business conditions to be “bad” next year, and about half said they expect an increase in unemployment.
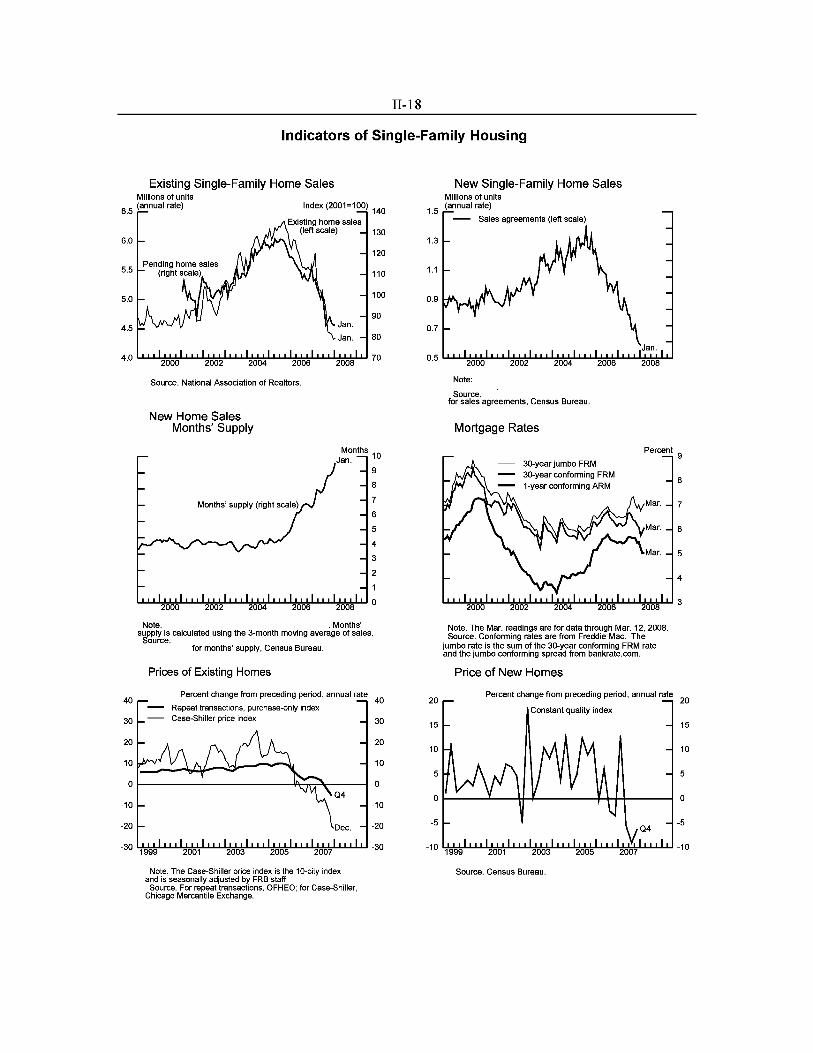
Housing The sharp contraction in residential construction has continued into 2008. Single-family housing starts fell another 5 percent in January—similar to the average rate of decline in the second half of last year—to an annual rate of 743,000 units. Adjusted single-family permit issuance—generally a useful indicator of current and future construction activity—also moved down in January and remained below starts. Meanwhile, multifamily starts moved up in January from their unusually low reading in December but remained below the range that this series has occupied for the past ten years. However, recent multifamily permit issuance points to a return to the low end of this range in the near term.
Home sales also weakened further in the past few months. The Census Bureau’s estimate of new single-family home sales stepped down 3 percent in January following an average monthly decline of 4 percent in the fourth quarter.
. In the market
for existing homes, single-family sales edged up 0.5 percent in January after having moved down at an average rate of 1 percent per month in the fourth quarter. In addition, the index of pending sales agreements—which tends to lead sales of existing single-family homes by one to two months—suggests that sales will be flat in February and March.
Because sales of new homes continued to fall sharply over the past six months, builders have made little progress in paring their bloated inventories. Despite a 10 percent contraction in the inventory of new homes for sale over the six-month period ending in

II-17
Private Housing Activity(Millions of units, seasonally adjusted; annual rate except as noted)
2007 2008
Sector 2007 Q3 Q4 Nov. Dec. Jan.
All units Starts 1.36 1.30 1.15 1.18 1.00 1.01 Permits 1.38 1.32 1.14 1.16 1.08 1.06
Single-family units Starts 1.05 .99 .83 .82 .78 .74 Permits .97 .94 .76 .77 .70 .68 Adjusted permits1 .99 .97 .78 .78 .74 .70 Permit backlog2 .109 .114 .109 .113 .109 .110
New homes Sales .78 .73 .65 .63 .61 .59 Months’ supply3 8.34 8.79 9.27 9.56 9.78 9.84
Existing homes Sales 4.94 4.76 4.39 4.41 4.32 4.34 Months’ supply3 8.68 9.15 10.02 9.74 10.32 10.77
Multifamily units Starts .309 .310 .326 .362 .220 .269 Permits .407 .384 .377 .392 .378 .380 Permit backlog2 .074 .075 .074 .072 .074 .078
Mobile homes Shipments .096 .096 .093 .093 .091 .091
Condos and co-ops Existing home sales .713 .701 .608 .611 .588 .550
1. Adjusted permits equal permit issuance plus total starts outside of permit-issuing areas. 2. Number outstanding at end of period. Excludes permits that have expired or have been canceled,
abandoned, or revoked. Not at an annual rate. 3. At current sales rate; expressed as the ratio of seasonally adjusted inventories to seasonally adjusted
sales. Quarterly and annual figures are averages of monthly figures.
1999 2000 2001 2002 2003 2004 2005 2006 2007 2008.0
.1
.2
.3
.4
.5
.6
.7
.8
.9
1.0 Millions of units
.0
.2
.4
.6
.8
1.0
1.2
1.4
1.6
1.8
2.0Millions of units
Private Housing Starts and Permits(Seasonally adjusted annual rate)
Single-family starts (right scale)
Single-family adjusted permits (right scale)
Jan.
Note. Adjusted permits equal permit issuance plus total starts outside of permit-issuing areas.
Multifamily starts (left scale) Jan.
II-18
Indicators of Single-Family Housing
Existing Single-Family Home Sales Millions of units
6_5
(annual rate) Index (2001=100) 140
6.0
5.5
5.0
4.5
40
30
20
-10
-20
Source. National Association of Realtors.
New Home Sales Months' Supply
Note. . Months'
130
120
110
100
90
80
s'§P~rc~. calculated using the 3-month moving average of sales.
for months' supply, Census Bureau.
Prices of Existing Homes
Percent change from preceding period, annual rate 40
Repeat transactions, purchase-only index Case-Shiller price index
Note. The Case-S hiller price index is the 1 D-eity index and is seasonally adjusted by FRB staff.
Source. For repeat transactions, OFHEO; for Case-Shiller, Chicago Mercantile Exchange.
30
20
10
0
-10
-20
New Single-Family Home Sales Millions of units
1_5
(annual rate)
1.3
1.1
0.9
0.7
20
15
10
5
-5
Note:
Source. for sales agreements, Census Bureau.
Mortgage Rates
Percent 9
30-year jumbo FRM 30-year conforming FRM 1-year conforming ARM
Note. The Mar. readings are for data through Mar. 12, 2008. Source. Conforming rates are from Freddie Mac. The
jumbo rate is the sum of the 30-year conforming FRM rate and the jumbo conforming spread from bankrate.com.
Price of New Homes
8
7
6
5
4
Percent change from preceding period, annual rate 20
Constant quality index
15
10
5
0
-5
Source. Census Bureau.

II-19
5 The stimulus bill signed into law on February 13, 2008, contained provisions allowing a temporary
increase in the conforming loan limit to 125 percent of the median house price in a city (not to exceed $729,750). This development has not directly affected rates paid by conforming borrowers, although rates quoted by lenders offering jumbo mortgages have reportedly been quite volatile as jumbo loan programs are being restructured to accommodate the new regulations. The stimulus bill also raised the limit on Federal Housing Administration (FHA) loans. However, FHA's relatively strict underwriting standards will likely limit the number of households that will benefit from this change.
6 In contrast, the OFHEO’s all transactions price index (seasonally adjusted by Board staff) decreased at an annual rate of only ½ percent in the fourth quarter. This index includes home values based on appraisals for refinancings in addition to purchases. Appraised values are likely to be less accurate because they are not arms’ length transactions but rather reflect lagged information on house prices.
January, the months’ supply of unsold new homes remained more than twice as high as the upper end of the fairly tight range that it had occupied between 1997 and the summer of 2005.
On balance, financing conditions have remained hostile to housing demand. The supply of credit for nonprime and nonconforming loans continues to be extremely tight. Issuance of securities backed by nonprime mortgages (which include the subprime and alt-A categories) suggests that originations of these types of loans were quite rare in January and February. Meanwhile, data from the Federal Housing Finance Board’s Monthly Interest Rate Survey suggest that the share of jumbo loans in prime mortgage originations was about 4 percent in January, roughly half of its average share since early 2006. Moreover, spreads between rates for jumbo and conforming thirty-year fixed-rate mortgages increased to around 100 basis points at the beginning of the year—about 75 basis points wider than the average spread between 2001 and mid-2007.5 Interest rates on prime conforming loans have also moved up recently, although they remain well below levels seen in the middle of last year.
Price declines for existing homes steepened in the fourth quarter of last year. The purchase-only version of the repeat-sales price index calculated by the Office of Federal Housing Enterprise Oversight (OFHEO) decreased at an annual rate of 5 percent in the fourth quarter after slipping at a 1½ percent pace in the third quarter.6 The ten-city version of the Case-Shiller repeat-sales price index—which includes houses financed by nonconforming loans and is more heavily concentrated in urban areas that had seen greater appreciation in earlier years—plunged at an annual rate of more than 20 percent in December after declining at a 15 percent pace over the preceding three months. In the market for new homes, the constant-quality price index fell at an annual rate of 6¼ percent in the fourth quarter. This decline in new home prices is consistent with
II-20
anecdotal evidence that many large homebuilders are resorting to price reductions, in addition to nonprice incentives, to bolster sales and unload inventory.
Equipment and Software Real spending on equipment and software has decelerated in recent months as business conditions have deteriorated and financial markets have tightened. We estimate that, in the fourth quarter, real equipment and software expenditures rose at a sluggish annual rate of 2 percent. In January, orders and shipments of nondefense capital goods excluding aircraft stood above their fourth-quarter averages, but more-timely surveys of business sentiment have a darker cast.
The subpar rise in spending on equipment and software last quarter is broadly in line with that quarter’s sharp deceleration in business output and the effect of higher interest rates on the user cost of capital. Since then, business financing conditions have continued to worsen. In particular, corporate bond yields have increased, and spreads over Treasury yields have widened. Furthermore, recent surveys have shown a sharp deterioration in businesses’ assessments of economic conditions. After plunging in January, the Philadelphia Fed’s index of business activity in the manufacturing sector edged down further in February, while a similar index from the Empire State manufacturing survey slumped last month. In addition, the ISM manufacturing diffusion index, which had ticked up in January, fell back in February to about its low December value.
Real business outlays on transportation equipment fell in the fourth quarter; more recently, the data have been mixed. A January increase in aircraft shipments and a step-down in exports suggest that domestic spending on aircraft will increase this quarter. Meanwhile, sales of medium and heavy trucks (classes 4 through 8) have been flat for several months after reaching a four-year low last year; the recent strength in truck orders suggests that truck sales will firm over the next few months. On the other side of the ledger, fleet sales of light motor vehicles declined, on balance, in January and February, with much of the weakness due to lower sales to daily rental firms; our contact at Chrysler reported that his firm plans to cut back noticeably on these types of sales in 2008.
Real spending on high-tech equipment and software rose at a solid annual rate of 13½ percent in the fourth quarter. However, this vigor does not appear to have been maintained past year-end: Weak shipments, a steep decline in orders, and higher net exports in January point to only modest gains in domestic spending this quarter. Also, as noted earlier, anecdotes from large PC producers indicate that some deceleration in the

II-21
2000 2001 2002 2003 2004 2005 2006 2007 200870
90
110
130
150
170
190
220
7
9
11
13
15
17
19
222000 = 100 Billions of chained (2000) dollars
2000 2002 2004 2006 2008
Jan.
Note. Ratio scales. Shipments are deflated by the staffprice index for computers and peripheral equipment, which
is derived from the BEA’s quality-adjusted price indexes.
Industrial production (left scale)Real M3 shipments (right scale)
Computers and Peripherals
2000 2001 2002 2003 2004 2005 2006 2007 20082
5
8
11
14
1720
2
5
8
11
14
1720
Billions of chained (2000) dollars, ratio scale
2000 2002 2004 2006 2008
Jan.
Note. Shipments and orders are deflated by a price index that is derived from the BEA’s quality-adjusted price indexesand uses the PPI for communications equipment for monthly interpolation.
ShipmentsOrders
Communications Equipment
2000 2001 2002 2003 2004 2005 2006 2007 2008200
340
480
620
760
9001040
1240
200
340
480
620
760
9001040
1240Thousands of units, ratio scale
2000 2002 2004 2006 2008
Feb.
Jan.
Note. Annual rate, FRB seasonals. Source. For sales, Ward’s Communications; for orders, ACT Research.
Sales of class 4-8 trucksNet new orders of class 5-8 trucks
Medium and Heavy Trucks
2000 2001 2002 2003 2004 2005 2006 2007 200832
37
42
47
52
58
32
37
42
47
52
58Billions of chained (2000) dollars, ratio scale
2000 2002 2004 2006 2008
Jan.
Note. Shipments and orders are deflated by the staff price indexes for the individual equipment types included in this category. Indexes are derived from the BEA’squality-adjusted price indexes.
ShipmentsOrders
Non-High-Tech, Nontransportation Equipment
Orders and Shipments of Nondefense Capital Goods(Percent change; seasonally adjusted current dollars)
2007 2008
Category Q3 Q4 Nov. Dec. Jan.
Annual rate Monthly rate
Shipments 9.4 2.8 -.5 1.4 1.9 Excluding aircraft 6.1 4.9 .1 1.6 .0 Computers and peripherals -15.2 36.6 -.9 3.6 -.1 Communications equipment 13.1 -16.9 3.4 4.0 -4.5 All other categories 8.0 4.4 -.1 1.2 .5
Orders -1.5 6.6 5.4 5.4 -8.2 Excluding aircraft 3.4 -1.7 -.1 5.2 -1.5 Computers and peripherals .7 8.2 11.6 5.1 -11.8 Communications equipment 17.3 -42.1 -1.0 18.5 -12.6 All other categories 2.4 2.5 -1.2 4.0 .7
Memo: Shipments of complete aircraft1 44.9 46.7 47.4 43.6 53.1
1. From Census Bureau, Current Industrial Reports; billions of dollars, annual rate.

II-22
Fundamentals of Equipment and Software Investment
1990 1991 1992 1993 1994 1995 1996 1997 1998 1999 2000 2001 2002 2003 2004 2005 2006 2007 2008-4
-2
0
2
4
6
8
-4
-2
0
2
4
6
84-quarter percent change
1990 1991 1992 1993 1994 1995 1996 1997 1998 1999 2000 2001 2002 2003 2004 2005 2006 2007
Q4
Source. Bureau of Economic Analysis.
Real Business Output
1990 1995 2000 2005-15
-12
-9
-6
-3
0
3
6
9
12
15
-15
-12
-9
-6
-3
0
3
6
9
12
154-quarter percent change
1991 1995 1999 2003 2007
Q4
High-tech
Non-high-tech
Source. Staff calculation.
User Cost of Capital
2000 2001 2002 2003 2004 2005 2006 2007 20084.5
5.5
6.5
7.5
8.5
9.5
10.5
11.5
12.5
13.5
4.5
5.5
6.5
7.5
8.5
9.5
10.5
11.5
12.5
13.5Percent
2000 2001 2002 2003 2004 2005 2006 2007 2008
10-year BBB
10-year high-yield
Mar. 12
Note. Daily averages based on Merrill Lynch bond data.
Corporate Bond Yields
1990 1995 2000 2005300
500
700
900
1100
1300
1500
1700 Billions of chained (2000) dollars
0.7
0.8
0.9
1.0
1.1
1.2
1.3
1.4
1.5
Ratio
1991 1995 1999 2003 2007
Q3
Q3
Real cash flow (left scale)
Ratio of cash flowto fixed investment
(right scale)
Note. Cash flow and fixed investment for the corporate business sector.Source. Bureau of Economic Analysis; FRB flow of funds accounts.
Corporate Cash Flow
2000 2002 2004 2006 200830
40
50
60
70
20
30
40
50
60
70
80Diffusion index
2000 2001 2002 2003 2004 2005 2006 2007 2008
Feb.
Source. Manufacturing ISM Report on Business;Philadelphia Fed Business Outlook Survey.
ISMPhiladelphia Fed
Surveys of Business Conditions

II-23
pace of domestic demand for computers and peripherals is under way. Moreover, Cisco is now reporting weaker demand for communications equipment, particularly in the retail and transportation sectors.
After having contracted at an annual rate of 2¼ percent in the fourth quarter, real business investment in equipment other than high-tech and transportation appears likely to step down again in the current quarter. While orders and shipments rose briskly in December and moved up further in January, most of the January increase in shipments was exported. Imports of this broad category of equipment fell in both December and January, a sign that domestic demand remains subdued.
Nonresidential Construction On the heels of robust gains during most of last year, nominal spending on nonresidential structures decelerated in December and posted an outright decline in January. Although spending in this sector is quite volatile, the recent deceleration is consistent with mounting indications of slowing demand for nonresidential buildings and tightening credit conditions. Vacancy rates in the retail sector continued to trend up in the fourth quarter, while increases in commercial property values have been slowing, even posting outright declines in some markets. In addition, the three-month average of the architectural billings diffusion index—which is reasonably well correlated with construction spending six months hence—moved down, on net, in the second half of 2007.
This sector is likely also feeling the effects of financial turmoil. The sharp contraction in issuance of commercial mortgage-backed securities in the fourth quarter of last year may signal a more general deterioration in financing conditions. Indeed, nonresidential construction contractors have indicated that funding has become more difficult to obtain in recent months, especially for more speculative projects.7 These responses are consistent with results from the January Senior Loan Officer Survey, in which about 80 percent of domestic banks reported tightening lending standards on commercial real estate loans over the preceding three months. Moreover, a marked increase in delinquency rates on nonresidential construction loans held by banks in the fourth quarter suggests that a growing share of builders are under financial strain.
The BEA reported that real expenditures on drilling and mining structures rose at an annual rate of 7 percent in the fourth quarter after unusually large increases in the second
7 These responses were reported in a survey conducted by Associated General Contractors of America.

II-24
Nonresidential Construction and Indicators(All spending series are seasonally adjusted at an annual rate; nominal CPIP deflated by
BEA prices through Q3 and by staff projection thereafter)
2000 2002 2004 2006 2008170
190
210
230
250
270
290
170
190
210
230
250
270
290Billions of chained (2000) dollars
2000 2002 2004 2006 2008
Jan.
Total Structures
2000 2002 2004 2006 200820
30
40
50
60
70
80
90
20
30
40
50
60
70
80
90Billions of chained (2000) dollars
2000 2002 2004 2006 2008
OfficeJan.
Commercial
Jan.
Other
Jan.
Note. Other consists of structures for religious organizations,education, lodging, amusement and recreation, transportation,and health care.
Office, Commercial, and Other
2000 2002 2004 2006 200810
20
30
40
50
60
70
10
20
30
40
50
60
70Billions of chained (2000) dollars
2000 2002 2004 2006 2008
Manufacturing
Jan.
Manufacturing
Power & communication
and Power & Communication
2000 2002 2004 2006 2008-1.5
-1.0
-0.5
0.0
0.5
1.0
1.5
2.0
2.5
3.0 Percent
35
40
45
50
55
60Diffusion index
Jan.
2000 2002 2004 2006 2008
Architectural Billings andNonresidential Construction Employment
Feb.
Billings (right scale)
Change inemployment (left scale)
Note. Both series are 3-month moving averages. Employmentconsists of industrial, commercial, and specialty trade construction. Source. For billings, American Institute of Architects;for employment, Bureau of Labor Statistics.
2000 2002 2004 2006 20080
3
6
9
12
15
18
0
3
6
9
12
15
18Percent
1999 2001 2003 2005 2007
Office
Q4
Retail
Industrial
Note. Industrial space includes both manufacturingstructures and warehouses. Source. Torto Wheaton Research.
Vacancy Rates
2000 2002 2004 2006 20080
5
10
15
20
25
30 Millions of feet
400
600
800
1000
1200
1400
1600
1800
2000
2200
2400Number
Drilling rigs(right scale)
2000 2002 2004 2006 2008
Footage drilled (left scale)
Mar.
Jan.
Note. The March readings for drilling rigs are based ondata through March 7, 2008. Both series are seasonallyadjusted by FRB staff. Source. DOE/Baker Hughes.
Drilling and Mining Indicators
II-25
8 The magnitude of second- and third-quarter increases was surprising given the indicators we track;
the BEA’s estimates reflect proprietary information not available to the staff. However, our indicators are consistent with the BEA’s reported increase in investment in the fourth quarter.
and third quarters.8 Data on drilling rigs in operation and on footage of new wells drilled suggest that investment in the current quarter will rise at a pace close to that of the fourth-quarter.
Business Inventories Real nonfarm inventories excluding motor vehicles increased at an annual rate of $12 billion in the fourth quarter, a rate of accumulation similar to that registered in the first three quarters of last year. The pace of stockbuilding was modest enough to keep the inventory-sales ratio flat last quarter. In the latest book-value data, the ratio of manufacturing and trade inventories to sales remained at a relatively low level in January.
Data from the staff’s flow-of-goods system indicate that the months’ supply of inventories for the major industry and market groups excluding motor vehicles ticked up in January, but few indications of serious inventory imbalances are evident. The months’ supply for construction supplies and materials dipped in January but remains moderately above its trend. Meanwhile, the ISM customers’ inventories index stood at 49 in February, an indication that, on net, purchasing managers do not think their customers’ stocks of inventories are elevated.
Federal Government Sector Federal spending has stepped up in recent months. Outlays in January and February, adjusted for payment-timing shifts and financial transactions, were almost 7 percent above the level recorded a year earlier. Defense spending posted a 14 percent increase, and interest outlays rose about 10 percent, as high readings on inflation boosted interest accruals on Treasury inflation-protected securities (TIPS). The strength in defense spending in January and February suggests that real defense purchases, as measured in the NIPAs, will pick up this quarter after having been essentially flat in the fourth quarter.
Receipts in January and February were a bit lower than in the comparable period last year, as robust inflows of non-withheld income and social insurance taxes were offset by a pickup in individual and corporate income tax refunds. Our information on refunds paid to date suggests that the IRS is processing them at about the same pace as last year. Evidently, the IRS was able to respond quickly to the December enactment of alternative minimum tax (AMT) relief legislation and avoided refund delays.

II-26
2000 2002 2004 2006 20081.1
1.2
1.3
1.4
1.5
1.6
1.7
1.8
1.9
1.1
1.2
1.3
1.4
1.5
1.6
1.7
1.8
1.9 Months
2000 2002 2004 2006 2008
Jan.
Jan.
Census book-value data
Staff flow-of-goods system
Note. Flow-of-goods system covers total industry ex.motor vehicles and parts, and inventories are relativeto consumption. Census data cover manufacturing and trade ex. motor vehicles and parts, and inventories arerelative to sales.
Inventory Ratios ex. Motor Vehicles
2000 2002 2004 2006 200835
40
45
50
55
60
35
40
45
50
55
60 Index
2000 2002 2004 2006 2008
Feb.
Note. A number above 50 indicates inventories are "too high."
ISM Customer Inventories:Manufacturing
Nonfarm Inventory Investment (Billions of dollars; seasonally adjusted annual rate)
2007 2008
Measure and sector Q2 Q3 Q4 Nov. Dec. Jan.
Real inventory investment(chained 2000 dollars)Total nonfarm business e 1.3 26.0 -13.4 n.a. n.a. n.a. Motor vehicles -9.6 13.3 -25.3 n.a. n.a. n.a. Nonfarm ex. motor vehicles e 10.9 12.7 11.9 n.a. n.a. n.a.
Manufacturing and trade ex. wholesale and retail motor vehicles and parts e 10.8 18.1 8.5 -23.1 45.8 n.a. Manufacturing -4.2 3.1 9.9 14.2 21.0 n.a. Wholesale trade ex. motor vehicles & parts e 6.5 13.9 -7.7 -11.1 1.2 n.a. Retail trade ex. motor vehicles & parts 8.5 1.1 6.4 -26.2 23.7 n.a.
Book-value inventory investment(current dollars) Manufacturing and trade ex. wholesale and retail motor vehicles and parts 60.7 38.3 74.3 54.0 128.5 139.8 Manufacturing 21.6 12.6 36.3 43.8 54.9 80.1 Wholesale trade ex. motor vehicles & parts 20.6 21.4 23.6 26.1 39.8 43.4 Retail trade ex. motor vehicles & parts 18.4 4.3 14.5 -15.9 33.7 16.4
n.a. Not available.e Staff estimate of real inventory investment based on revised book-value data.Source. For real inventory investment, BEA; for book-value data, Census Bureau.

II-27
Federal Government Budget(Unified basis; adjusted for payment-timing shifts and financial
transactions; data from Monthly Treasury Statement)
1994 1995 1996 1997 1998 1999 2000 2001 2002 2003 2004 2005 2006 2007 2008-500
-400
-300
-200
-100
0
100
200
300
-500
-400
-300
-200
-100
0
100
200
300Billions of dollars
12-month moving sum
Feb.
Surplus or Deficit (-)
1994 1995 1996 1997 1998 1999 2000 2001 2002 2003 2004 2005 2006 2007 2008-15
-10
-5
0
5
10
15
20
-15
-10
-5
0
5
10
15
20Percent change from year earlier
12-month moving sum
Outlays
Receipts
Feb.
Outlays and Receipts
Recent Federal Outlays and Receipts(Billions of dollars except as noted)
January-February 12 months ending in February
Percent Percent Function or source 2007 2008 change 2007 2008 change
Outlays 472.6 504.6 6.8 2,701.6 2,821.7 4.4 Net interest 38.9 43.0 10.4 227.7 251.9 10.6 National defense 87.2 99.7 14.3 544.4 586.4 7.7 Major transfers1 276.8 287.7 3.9 1,472.1 1,547.2 5.1 Other 69.7 74.3 6.6 457.4 436.1 -4.7
Receipts 380.9 370.9 -2.6 2,494.1 2,590.4 3.9 Individual income and payroll taxes 335.5 331.9 -1.1 1,904.5 2,014.5 5.8 Corporate income taxes 15.0 4.4 -70.8 373.4 353.4 -5.4 Other 30.5 34.7 13.9 216.2 222.5 2.9
Surplus or deficit (-) -91.6 -133.7 ... -207.5 -231.3 ... Memo:Unadjusted surplus or deficit (-) -81.8 -157.7 ... -192.7 -263.9 ...
1. Includes Social Security, Medicare, Medicaid, and income security programs. ... Not applicable.

II-28
Given the recent strength in outlays and weakness in receipts, the budget outlook has deteriorated. The federal budget deficit, adjusted for payment-timing shifts and financial transactions, was $134 billion in January and February, up considerably from the adjusted deficit of $92 billion recorded during this same period last year.
In February, Congress passed a stimulus package totaling $163 billion, which consisted of roughly $113 billion in tax rebates to households and $50 billion in bonus depreciation on business investment in 2008. Rebates will range from $300 for low-income individuals to as much as $1,200 for middle-income and upper-middle-income couples, plus an additional $300 per child. According to the Treasury Department, rebate payments will begin on May 1 and will be almost complete by the end of July. The bonus depreciation provision allows firms to immediately depreciate an additional 50 percent of the cost of most new equipment placed in service during 2008. This provision lowers tax revenues from businesses in 2008 and 2009 but raises tax revenues in later years as depreciation allowances are reduced. Consequently, the total cost of the provision through 2018 is about $7 billion.
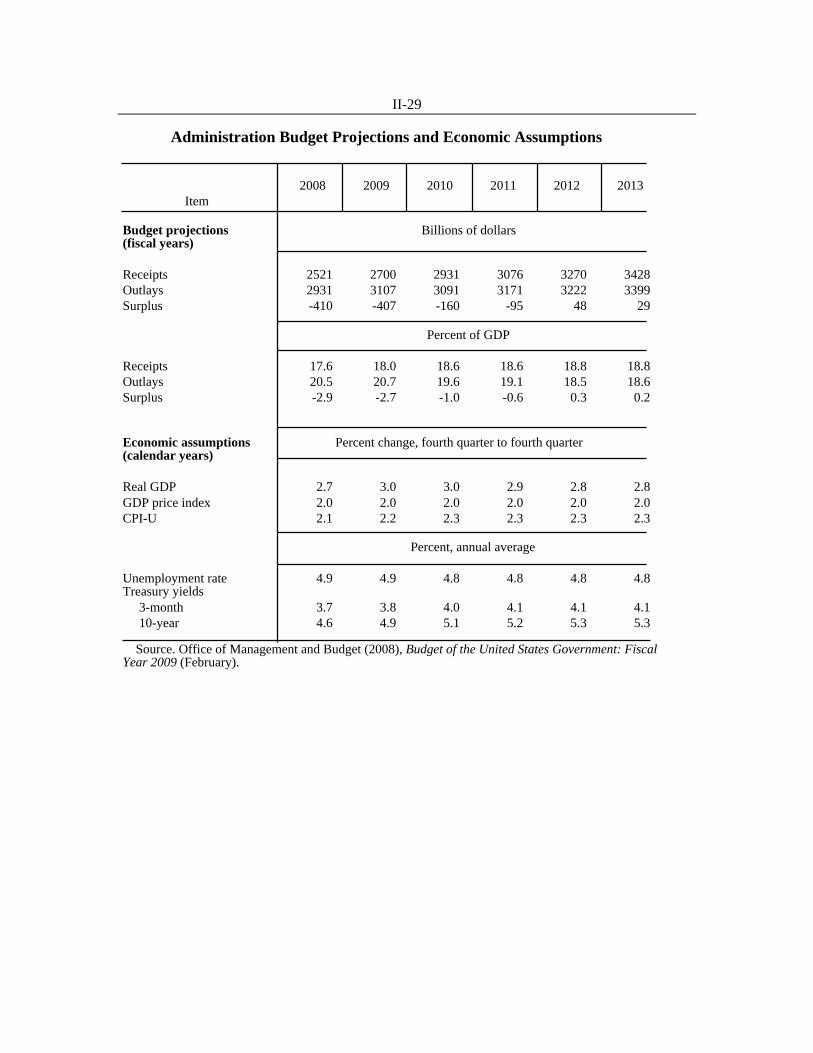
The Administration released its proposed budget for fiscal 2009 on February 4. In that document, the Administration forecasted a budget deficit of around $410 billion in both the current fiscal year, 2008, and in fiscal 2009; the forecast assumed the enactment of the President’s proposals (which contained a somewhat smaller fiscal stimulus package than the one that was ultimately enacted). The key near-term policy proposals include increased defense spending—mostly for military operations in Iraq and Afghanistan—and a one-year extension of AMT relief.
State and Local Government Sector The available data on the state and local sector suggest that real purchases will rise somewhat less in the first quarter than during the final quarter of 2007 because of weaker spending on construction. Nominal outlays for state and local construction in January were 1 percent (not at an annual rate) below their fourth-quarter level. In contrast, hiring appears to still be rising steadily: State and local employment increased an average of 25,000 per month in January and February, about the same pace as in the fourth quarter.
The NIPA data show a noticeable deterioration in the budget balances of state and local governments over the second half of 2007, a result of rapidly increasing nominal expenditures coupled with a slowing in receipts. Press reports suggest that state governments are responding to the weakening revenue environment through a variety of
II-29
Administration Budget Projections and Economic Assumptions
2008 2009 2010 2011 2012 2013 Item
Budget projections Billions of dollars(fiscal years)
Receipts 2521 2700 2931 3076 3270 3428Outlays 2931 3107 3091 3171 3222 3399Surplus -410 -407 -160 -95 48 29
Percent of GDP
Receipts 17.6 18.0 18.6 18.6 18.8 18.8Outlays 20.5 20.7 19.6 19.1 18.5 18.6Surplus -2.9 -2.7 -1.0 -0.6 0.3 0.2
Economic assumptions Percent change, fourth quarter to fourth quarter(calendar years)
Real GDP 2.7 3.0 3.0 2.9 2.8 2.8GDP price index 2.0 2.0 2.0 2.0 2.0 2.0CPI-U 2.1 2.2 2.3 2.3 2.3 2.3
Percent, annual average
Unemployment rate 4.9 4.9 4.8 4.8 4.8 4.8Treasury yields 3-month 3.7 3.8 4.0 4.1 4.1 4.1 10-year 4.6 4.9 5.1 5.2 5.3 5.3
Source. Office of Management and Budget (2008), Budget of the United States Government: FiscalYear 2009 (February).

II-30
State and Local Indicators
-4
-2
0
2
4
6
8
10
12
-4
-2
0
2
4
6
8
10
12
Percent change, annual rate
1999 2001 2003 2005 2007
Q4
Spending4-quarter moving average
Real Spending on Consumption & Investment
1998 2000 2002 2004 2006 2008-10
0
10
20
30
40
50
-10
0
10
20
30
40
50
Thousands of jobs, monthly average
Q1
Note. Q1 is the average for January and February.
Net Change in Employment
1998 2000 2002 2004 2006 2008140
150
160
170
180
190
200
140
150
160
170
180
190
200
Annual rate Billions of chained (2000) dollars
Jan.
Note. Nominal CPIP deflated by BEA prices throughQ4 and by a staff projection thereafter.
Real Construction
-1.0
-0.5
0.0
0.5
1.0
-1.0
-0.5
0.0
0.5
1.0
Percent of nominal GDP
1987 1992 1997 2002 2007
Q4
Note. Q4 is a staff estimate.
Net Saving
-15
-10
-5
0
5
10
15
20
-15
-10
-5
0
5
10
15
20
Percent change from year earlier
1999 2001 2003 2005 2007
4-quarter moving average
Totalrevenues
Individual and corporate income taxes
Q3
Source. Census Bureau.
State Revenues
0
2
4
6
8
10
12
14
0
2
4
6
8
10
12
14
Percent change from year earlier
1999 2001 2003 2005 2007
4-quarter moving average
Property taxes
Total revenues
Q3
Source. Census Bureau.
Local Revenues

II-31
9 Our estimate for January is about one-tenth percentage point lower than the figure published by the
BEA because we took account of data on medical prices from the January producer price index (PPI). The PPI was released too late for the BEA to incorporate this information, but will be folded into the revised estimates released at the end of March. The tables and charts in this section show the figures published by the BEA.
measures aimed chiefly at fiscal 2009 budgets, including reducing the planned growth of expenditures, increasing taxes, and tapping into rainy-day funds.
Prices Consumer prices have remained on a relatively steep upward trajectory in recent months. We estimate that total PCE prices rose 0.3 percent in January after a similar-sized increase in the previous month.9 The twelve-month change in PCE prices through January stood at 3¾ percent, boosted by surges in the prices of both food and energy. Excluding food and energy, the pace of PCE price increases has stepped up from the low rates posted last summer. Although long-term inflation expectations appear to have increased since the fall, they remain broadly in the range seen in recent years.
We estimate that core PCE prices rose 0.2 percent in January for the fourth consecutive month. The increase in core PCE prices of 2¼ percent over the twelve months ending in January is slightly smaller than the increase over the previous twelve months, but this twelve-month change masks an acceleration in prices since mid-2007: Over the past six months, core PCE prices rose at an annual rate of 2¾ percent, significantly above the 1½ percent rate over the previous six months. Prices of core goods, which had fallen through 2006 and most of 2007, have since reversed course. The upturn has been led by prices for apparel and prescription drugs, which have risen sharply after large declines in early 2007. Price increases in other goods categories also have picked up since late summer, as have price increases for both market and non-market consumer services.
After jumping substantially in the fall, PCE energy prices continued their upward climb in December and January. Retail gasoline prices appear to have dropped back in February, as demand flattened and gasoline inventories surged. But by the end of the month, sharp increases in crude oil prices were again pushing up gasoline prices. Over the twelve months ending in January, consumer energy prices rose 23 percent—a striking turnaround from the decline registered over the previous twelve months.
After slowing late last year, PCE food and beverage inflation bounced back up to 0.6 percent in January; the gain left the twelve-month change in the PCE price index for food and beverages at 4¾ percent, considerably higher than the 2½ percent increase recorded in the previous twelve-month period. In large part, the acceleration in food

II-32
Price Measures(Percent change)
12-month change 3-month change 1-month change
Annual rate Monthly rate
Jan. Jan. Oct. Jan. Dec. Jan.Measures 2007 2008 2007 2008 2007 2008
CPITotal 2.1 4.3 2.6 6.8 .4 .4 Food 2.4 4.9 4.6 4.7 .1 .7 Energy -3.1 19.6 2.6 43.6 1.7 .7 Ex. food and energy 2.7 2.5 2.3 3.1 .2 .3 Core goods -.2 .2 -.1 1.2 .0 .2 Core services 3.8 3.4 3.2 3.9 .3 .4 Shelter 4.4 3.1 2.6 3.7 .3 .4 Other services 3.1 3.7 3.8 4.3 .3 .4 Chained CPI (n.s.a.) 1 1.8 3.9 ... ... ... ... Ex. food and energy 1 2.3 2.2 ... ... ... ...
PCE prices 2
Total 2.1 3.7 2.2 5.4 .3 .4 Food and beverages 2.4 4.7 4.2 4.3 .1 .6 Energy -2.6 23.1 -7.2 45.4 1.8 .6 Ex. food and energy 2.4 2.2 2.6 3.0 .2 .3 Core goods -.3 -.3 -.6 1.3 .0 .3 Core services 3.6 3.2 4.0 3.6 .3 .3 Shelter 4.4 3.1 2.9 3.6 .3 .3 Other services 3.3 3.2 4.3 3.6 .3 .3 Core market-based 2.2 1.9 2.0 2.8 .2 .3 Core non-market-based 3.5 3.4 5.3 3.7 .3 .4
PPITotal finished goods .1 7.4 1.0 13.5 -.3 1.0 Food 2.5 8.3 9.7 12.0 1.4 1.7 Energy -6.9 22.6 -6.3 44.7 -3.0 1.5 Ex. food and energy 1.7 2.3 1.0 3.7 .2 .4 Core consumer goods 1.5 2.7 1.4 3.8 .2 .4 Capital equipment 2.1 1.6 -.3 3.5 .1 .4 Intermediate materials 1.1 8.8 -1.6 18.4 -.2 1.4 Ex. food and energy 3.6 4.1 -.9 7.5 .0 .8 Crude materials -9.5 31.3 1.3 63.9 1.1 2.5 Ex. food and energy 18.2 20.9 20.8 19.2 .2 4.0
1. Higher-frequency figures are not applicable for data that are not seasonally adjusted. 2. BEA’s published PCE prices in January does not incorporate January PPI medical prices. ... Not applicable.

II-33
Consumer Prices(12-month change except as noted)
2000 2001 2002 2003 2004 2005 2006 2007 20080
1
2
3
4
0
1
2
3
4 Percent
2000 2002 2004 2006 2008
Jan.
Total PCE
Core PCE
PCE Prices
2000 2001 2002 2003 2004 2005 2006 2007 20080
1
2
3
4
0
1
2
3
4 Percent
2000 2002 2004 2006 2008
Jan.
chainedCPI
PCE
CPI
CPI and PCE ex. Food and Energy
2000 2001 2002 2003 2004 2005 2006 2007 20080
1
2
3
0
1
2
3 Percent
2000 2002 2004 2006 2008
Jan.
Market-based components
PCE excluding Food and Energy
2000 2001 2002 2003 2004 2005 2006 2007 2008-1
0
1
2
3
4
5
-1
0
1
2
3
4
5 Percent
2000 2002 2004 2006 2008
Jan.
3-month change, annual rate
PCE excluding Food and Energy
2000 2001 2002 2003 2004 2005 2006 2007 2008-3
-2
-1
0
1
2
3
4
-3
-2
-1
0
1
2
3
4 Percent
2000 2002 2004 2006 2008
Jan.
Jan.
Services ex. energy
Goods ex. food and energy
PCE Goods and Services
2000 2001 2002 2003 2004 2005 2006 2007 2008-1
0
1
2
3
4
5
-1
0
1
2
3
4
5 Percent
2000 2002 2004 2006 2008
Jan.
3-month change, annual rate
CPI excluding Food and Energy

II-34
Energy and Food Price Indicators(Data from Energy Information Administration except as noted)
2005 2006 2007 200860
80
100
120
140
160
180
60
80
100
120
140
160
180Cents per gallon
Retail price less average spot crude price*
* Regular grade seasonally adjusted by FRB staff,less average spot crude price: 60% WTI, 40% Mayaheavy crude.
Mar. 10
Total Gasoline Margin
2005 2006 2007 200850
100
150
200
250
300
350
50
100
150
200
250
300
350Cents per gallon
* Regular grade seasonally adjusted by FRB staff.** 60% WTI, 40% Maya heavy crude.
Retail price*Rack price
Average spot crude price**
Mar. 10
Gasoline Price Decomposition
2005 2006 2007 2008185
195
205
215
225
235
245
255
185
195
205
215
225
235
245
255Millions of barrels
Note. Shaded region is average historical range ascalculated by DOE. Monthly data through December 2007,weekly data thereafter, as indicated by line weights. * Adjustment for approximate amount of fuel ethanol to beblended with RBOB component of inventories; estimated byFRB staff.
Mar. 7Excluding ethanolAdjusted for ethanol use*
Gasoline Inventories
2005 2006 2007 2008100
150
200
250
300
350
400
450
500
100
150
200
250
300
350
400
450
500Cents per gallon
Source. Chicago Board of Trade.
Near-futures price, dailyMonthly futures, Mar. 12
Ethanol Prices
2005 2006 2007 20080
1
2
3
4
5
6
0
2
4
6
8
10
12
14
16
18Dollars per bushel
Mar. 11
Source. Commodity Research Bureau.
Corn (left scale)Soybeans (right scale)Wheat (right scale)
Spot Agricultural Commodity Prices
2005 2006 2007 20080.0
0.5
1.0
1.5
2.0
2.5
3.0
3.5
4.0
4.5
5.0
0.0
0.5
1.0
1.5
2.0
2.5
3.0
3.5
4.0
4.5
5.012-month percent change
Jan.
Source. Bureau of Economic Analysis.
Food and beveragesEx. food and energy
PCE Food Prices
II-35
prices reflects widespread increases in the prices of agricultural commodities. Spot prices for corn, wheat, and soybeans moved up substantially last year and have continued their run-up so far this year: Soybean prices have increased another 13 percent since the January Greenbook, corn prices are up 18 percent, and wheat prices have risen 28 percent. The recent increase in wheat prices was especially pronounced because stocks—particularly for the spring wheat varieties used in pasta and related products—are currently quite lean. More generally, the rise in grain prices over the past year likely reflects a combination of increased ethanol production, demand from emerging market countries, weather-related disruptions, and high input costs. In contrast, spot prices of animal products, especially beef, pork, and dairy products, have turned down of late, as supplies have been expanding gradually in response to earlier high prices.
The high readings on overall consumer price inflation in the past six months appear to have contributed to a pickup in near-term inflation expectations; as for longer-term expectations, the weight of the evidence suggests that these expectations have also drifted up a touch recently. As measured by the Reuters/University of Michigan Survey, median expectations for year-ahead inflation moved up from 3.1 percent in October to 3.6 percent in February, with half of this change coming since the January Greenbook. Regarding longer-term expectations, increases in the Reuters/Michigan measure of median inflation expectations over the next five to ten years have amounted to only two-tenths since October, with no change since late January; the February reading of 3.0 percent was close to its average level over the past couple of years. According to the Survey of Professional Forecasters, expected inflation over the next ten years has edged up recently with both the CPI- and PCE-based expectations rising one-tenth, although this uptick just reversed the downtick a year earlier. Inflation compensation derived from TIPS has moved up more noticeably of late. Five-year inflation compensation has risen 0.3 percentage point since the January Greenbook after having declined from the fall until late January. The five-year, five-year-ahead measure has also moved up 0.3 percentage point since the January Greenbook and is 0.4 percentage point higher than it was in the fall.
Strong global demand and higher prices for energy and other commodities have contributed to continued price pressures at earlier stages of processing of late. The producer price index for core intermediate materials rose ¾ percent in January after a cumulative increase of 1 percent over the previous two months. Prices for energy-intensive products, such as plastics and agricultural and industrial chemicals, have increased sharply over the past few months, but these gains have been offset, to some extent, by a downturn in prices for lumber, plywood, and gypsum. On balance, the index

II-36
Broad Measures of Inflation(Percent change, Q4 to Q4)
Measure 2004 2005 2006 2007
Product pricesGDP price index 3.2 3.4 2.7 2.6 Less food and energy 3.2 3.3 2.9 2.2
Nonfarm business chain price index 3.2 3.5 2.2 1.9
Expenditure pricesGross domestic purchases price index 3.7 3.8 2.4 3.3 Less food and energy 3.1 3.1 2.8 2.2
PCE price index 3.1 3.2 1.9 3.4 Less food and energy 2.2 2.2 2.3 2.1
PCE price index, market-based components 2.8 3.0 1.6 3.4 Less food and energy 1.6 1.7 2.0 1.9
CPI 3.4 3.8 1.9 4.0 Less food and energy 2.1 2.1 2.7 2.3
Chained CPI 3.1 3.2 1.7 3.6 Less food and energy 2.1 1.8 2.3 2.0
Median CPI 2.3 2.7 3.1 3.1 Trimmed mean CPI 2.3 2.6 2.7 2.8
Trimmed mean PCE 2.4 2.5 2.7 2.4
Actual CPI inflation 1
Professional forecasters (10 years) 4
Surveys of Inflation Expectations(Percent)
Reuters/Michigan Survey
1 year 2 5 to 10 years 3
Period Mean Median Mean Median CPI PCE
2006:Q2 4.0 4.5 3.5 3.6 3.1 2.5 ... Q3 3.3 4.0 3.4 3.3 3.0 2.5 ... Q4 1.9 3.5 3.0 3.5 3.0 2.5 ...
2007:Q1 2.4 3.6 3.0 3.4 2.9 2.4 2.0 Q2 2.7 4.2 3.3 3.5 3.0 2.4 2.0 Q3 2.4 4.1 3.2 3.5 3.0 2.4 2.1 Q4 4.0 4.1 3.3 3.3 2.9 2.4 2.1
2008:Q1 n.a. n.a. n.a. n.a. n.a. 2.5 2.2
2007:Oct. 3.5 3.7 3.1 3.1 2.8 ... ... Nov. 4.3 4.3 3.4 3.4 2.9 2.4 2.1 Dec. 4.1 4.4 3.4 3.5 3.1 ... ... 2008:Jan. 4.3 4.0 3.4 3.4 3.0 ... ... Feb. n.a. 3.9 3.6 3.4 3.0 2.5 2.2
1. Percent change from the same period in the preceding year. 2. Responses to the question, By about what percent do you expect prices to go up, onaverage, during the next 12 months? 3. Responses to the question, By about what percent per year do you expect prices to go up,on average, during the next 5 to 10 years? 4. Median CPI and PCE price projections compiled by the Federal Reserve Bank of Philadelphia. ... Not applicable. n.a. Not available.

II-37
Measures of Expected Inflation
1975 1980 1985 1990 1995 2000 20050
2
4
6
8
10
12
0
2
4
6
8
10
12Percent
1972 1977 1982 1987 1992 1997 2002 2007
Survey Measures (Reuters/Michigan)
Q4
Median, next 12 months
Median, next 5 to 10 years
Quarterly
2005 2006 2007 20080
1
2
3
4
5
6
0
1
2
3
4
5
6Percent
Monthly
Feb.
1975 1980 1985 1990 1995 2000 20050
2
4
6
8
10
12
0
2
4
6
8
10
12Percent
1972 1976 1980 1984 1988 1992 1996 2000 2004 2008
Inputs to Models of Inflation
*For 2007 forward, the median projection for PCE inflation over the next 10 years from the Survey of Professional Forecasters (SPF);for 1991 to 2006, the equivalent SPF projection for the CPI; for 1981 to 1991, a related survey for the CPI conducted by Richard Hoey;and for the period preceding 1981, a model-based estimate constructed by Board staff. The survey data before 2007 are adjusted down0.5 percentage point to put the CPI projections approximately on a PCE basis.
**Derived from one of the reduced-form Phillips curves used by Board staff.
Q1
FRB/US long-run expectations measurefor PCE inflation*
Distributed lag ofcore PCE inflation**
Quarterly
2005 2006 2007 20080
1
2
3
4
5
0
1
2
3
4
5Percent
Quarterly
Q1
2001 2002 2003 2004 2005 2006 20070
1
2
3
4
5
0
1
2
3
4
5Percent
Inflation Compensation from TIPS
Note. Based on a comparison of an estimated TIPS yield curve with an estimated nominal off-the-run Treasury yield curve, with anadjustment for the indexation-lag effect.
5 to 10 years ahead
Next 5 years
Quarterly
Q4
2005 2006 2007 20080
1
2
3
4
0
1
2
3
4Percent
Weekly
Mar. 12
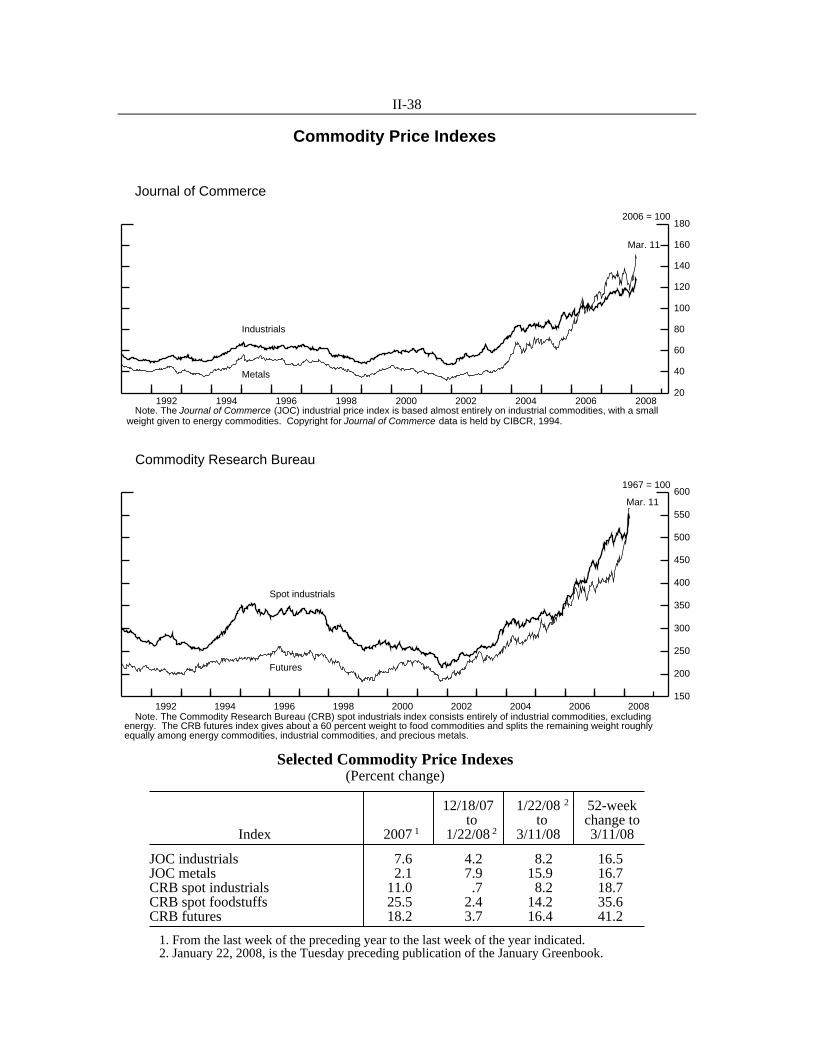
II-38
Commodity Price Indexes
1991 1992 1993 1994 1995 1996 1997 1998 1999 2000 2001 2002 2003 2004 2005 2006 2007 200820
40
60
80
100
120
140
160
180
20
40
60
80
100
120
140
160
1802006 = 100
Note. The Journal of Commerce (JOC) industrial price index is based almost entirely on industrial commodities, with a small weight given to energy commodities. Copyright for Journal of Commerce data is held by CIBCR, 1994.
Metals
Industrials
Mar. 11
1992 1994 1996 1998 2000 2002 2004 2006 2008
Journal of Commerce
1991 1992 1993 1994 1995 1996 1997 1998 1999 2000 2001 2002 2003 2004 2005 2006 2007 2008150
200
250
300
350
400
450
500
550
600
150
200
250
300
350
400
450
500
550
6001967 = 100
Note. The Commodity Research Bureau (CRB) spot industrials index consists entirely of industrial commodities, excludingenergy. The CRB futures index gives about a 60 percent weight to food commodities and splits the remaining weight roughlyequally among energy commodities, industrial commodities, and precious metals.
Spot industrials
Futures
Mar. 11
1992 1994 1996 1998 2000 2002 2004 2006 2008
Commodity Research Bureau
2
Selected Commodity Price Indexes(Percent change)
12/18/07 1/22/08 52-weekto to change to
Index 2007 1 1/22/08 2 3/11/08 3/11/08
JOC industrials 7.6 4.2 8.2 16.5 JOC metals 2.1 7.9 15.9 16.7 CRB spot industrials 11.0 .7 8.2 18.7 CRB spot foodstuffs 25.5 2.4 14.2 35.6 CRB futures 18.2 3.7 16.4 41.2
1. From the last week of the preceding year to the last week of the year indicated. 2. January 22, 2008, is the Tuesday preceding publication of the January Greenbook.

II-39
10 Compensation per hour is now reported to have increased at an annual rate of 3½ percent in the third
quarter. This figure incorporates information on compensation from third-quarter state unemployment insurance tax records, as well as information on hours from the BLS’s annual benchmark revision to the establishment survey.
11 The BEA estimates that some of these bonus payments were made—and will show up as wage and salary disbursements—in early 2008, though they represent remuneration accrued for productive activity in the fourth quarter of 2007. The BLS measures compensation per hour on an accrual basis.
for core intermediate materials increased 4 percent over the twelve months ending in January, about ½ percentage point more than in the preceding year.
Commodity prices have risen significantly since the January Greenbook. The Journal of Commerce index of industrial materials and the Commodity Research Bureau spot index of industrial materials have both jumped 8¼ percent since mid-January. Over the past year, these indexes increased at a slightly faster pace than the 15 percent average annual increase registered since the current surge in commodity prices began in mid-2002.
Labor Costs Labor costs have continued to increase at a moderate rate, with little sign, as yet, of higher price inflation passing through to higher compensation. The employment cost index for hourly compensation of private-industry workers rose at an annual rate of 3.1 percent over the three months ending in December. The twelve-month change was 3.0 percent, about equal to its average pace over the previous couple of years. Wages and salaries rose at a 3.1 percent rate for the third quarter in a row, while benefits costs accelerated slightly to a 3.5 percent rate in the fourth quarter. However, the twelve-month change in benefits costs remains below the change in the previous year because of a significant decline in retirement and savings costs in early 2007.
Compensation per hour in the nonfarm business sector is estimated to have risen at an annual rate of 4½ percent in the fourth quarter and was up 4 percent for 2007 as a whole.10 This four-quarter change is a step down from the 5 percent rate posted in 2006, which was boosted by the timing of large bonus payments. Bonus payments appear to have been smaller this bonus season—though recent reports suggest that these payments may not have been as small as early reports had indicated.11 After falling for the previous two quarters, unit labor costs are estimated to have risen at an annual rate of 2.8 percent in the fourth quarter. For 2007 as a whole, unit labor costs increased 1.0 percent, significantly below the substantial rise observed in 2006.

II-40
1996 1998 2000 2002 2004 2006 20080
1
2
3
4
5
6
7
8
0
1
2
3
4
5
6
7
8Percent
1997 1999 2001 2003 2005 2007
Productivity and costs*
ECI
Q4
* Value for 2007:Q4 is a staff estimate.
Compensation per Hour (Percent change from year-earlier period)
1996 1998 2000 2002 2004 2006 2008-3
-2
-1
0
1
2
3
4
5
6
-3
-2
-1
0
1
2
3
4
5
6Percent
1997 1999 2001 2003 2005 2007
Q4
Note. Value for 2007:Q4 is a staff estimate.
Unit Labor Costs (Percent change from year-earlier period)
1996 1998 2000 2002 2004 2006 20081.52
1.54
1.56
1.58
1.60
1.62
1.64
1.66
1.52
1.54
1.56
1.58
1.60
1.62
1.64
1.66Ratio
1997 1999 2001 2003 2005 2007
Average,1968-present
Q4
Note. The markup is the ratio of output price to unitlabor costs. Value for 2007:Q4 is a staff estimate.
Markup, Nonfarm Business
1996 1998 2000 2002 2004 2006 20081.0
1.5
2.0
2.5
3.0
3.5
4.0
4.5
1.0
1.5
2.0
2.5
3.0
3.5
4.0
4.5Percent
Feb.
Average Hourly Earnings (Percent change from year-earlier period)
Hourly Compensation and Unit Labor Costs(Percent change from preceding period at compound annual rate; based on seasonally adjusted data)
2005:Q4 2006:Q4 2007to to
Category 2006:Q4 2007:Q4e Q1 Q2 Q3 Q4 e
Compensation per hourNonfarm business 5.0 3.9 6.4 1.3 3.4 4.6
Unit labor costsNonfarm business 4.1 1.0 5.4 -1.3 -2.7 2.8
e Staff estimate.
II-41
Average hourly earnings for production or nonsupervisory workers increased 0.3 percent in January and February. Over the past year, they have risen 3¾ percent, somewhat less than in the previous twelve months.
Last Page of Domestic Nonfinancial Developments

Domestic FinancialDevelopments

III-T-1Selected Financial Market Quotations(One-day quotes in percent except as noted)
Change to Mar. 12 from2006 2007 2008 selected dates (percentage points)
Instrument 2006 2007 2008 June 29 Sept. 17 Jan. 29 Mar. 12 June 29 Sept. 17 Jan. 29
Short-termFOMC intended federal funds rate 5.25 5.25 3.50 3.00 -2.25 -2.25 -.50
Treasury bills1
3-month 4.88 4.05 2.23 1.45 -3.43 -2.60 -.78 6-month 5.06 4.15 2.29 1.53 -3.53 -2.62 -.76
Commercial paper (A1/P1 rates)2
1-month 5.27 5.23 3.08 2.69 -2.58 -2.54 -.39 3-month 5.37 5.25 3.02 2.97 -2.40 -2.28 -.05
Large negotiable CDs1
3-month 5.47 5.52 3.22 2.84 -2.63 -2.68 -.38 6-month 5.59 5.36 3.17 2.77 -2.82 -2.59 -.40
Eurodollar deposits3
1-month 5.33 5.55 3.30 2.90 -2.43 -2.65 -.40 3-month 5.49 5.60 3.30 2.90 -2.59 -2.70 -.40
Bank prime rate 8.25 8.25 6.50 6.00 -2.25 -2.25 -.50
Intermediate- and long-termU.S. Treasury4
2-year 5.26 4.12 2.25 1.64 -3.62 -2.48 -.61 5-year 5.15 4.18 2.89 2.48 -2.67 -1.70 -.41 10-year 5.28 4.58 3.88 3.72 -1.56 -.86 -.16
U.S. Treasury indexed notes5
5-year 2.51 2.04 .78 .27 -2.24 -1.77 -.51 10-year 2.61 2.15 1.39 1.11 -1.50 -1.04 -.28
Municipal general obligations (Bond Buyer)6 4.71 4.46 4.29 4.92 .21 .46 .63
Private instruments 10-year swap 5.81 5.17 4.26 4.29 -1.52 -.88 .03 10-year FNMA7 5.59 5.01 4.26 4.49 -1.10 -.52 .23 10-year AA8 6.20 6.05 5.66 6.06 -.14 .01 .40 10-year BBB8 6.74 6.46 6.39 6.67 -.07 .21 .28 10-year high yield8 8.74 8.95 9.85 10.32 1.58 1.37 .47
Home mortgages (FHLMC survey rate) 30-year fixed 6.78 6.34 5.68 6.13 -.65 -.21 .45 1-year adjustable 5.82 5.65 5.05 5.14 -.68 -.51 .09
Change to Mar. 12 Record high 2007 2008 from selected dates (percent)
Stock exchange index Record 2007 2008 Level Date Sept. 17 Jan. 29 Mar. 12 high Sept. 17 Jan. 29
Dow Jones Industrial 14,165 10-9-07 13,403 12,480 12,110 -14.50 -9.65 -2.97S&P 500 Composite 1,565 10-9-07 1,477 1,362 1,309 -16.38 -11.37 -3.93Nasdaq 5,049 3-10-00 2,582 2,358 2,244 -55.55 -13.08 -4.84Russell 2000 856 7-13-07 776 705 667 -22.02 -13.99 -5.37Wilshire 5000 15,807 10-9-07 14,839 13,740 13,179 -16.62 -11.19 -4.08
1. Secondary market. 2. Financial commercial paper. 3. Bid rates for Eurodollar deposits collected around 9:30 a.m. eastern time. 4. Derived from a smoothed Treasury yield curve estimated using off-the-run securities. 5. Derived from a smoothed Treasury yield curve estimated using all outstanding securities and adjusted for the carry effect. 6. Most recent Thursday quote. 7. Constant-maturity yields estimated from Fannie Mae domestic noncallable coupon securities. 8. Derived from smoothed corporate yield curves estimated using Merrill Lynch bond data. _______________________________________________________________________
NOTES:
June 29, 2006, is the day the most recent policy tightening ended. September 17, 2007, is the day before the most recent policy easing began. January 29, 2008, is the day before the most recent FOMC announcement.
_______________________________________________________________________
Short-Term Funding and Interbank MarketsIII-C-1
July Sept. Nov. Jan. Mar.2007 2008
20
40
60
80
100
120Basis points
Jan. FOMC
Spreads between 30-Day Libor and OIS Rates
Daily
Mar. 12
Note. LIBOR quotes are taken at 6:00 am, and OIS quotes are observed at the close of business of the previous trading day.
July Sept. Nov. Jan. Mar.2007 2008
0
50
100
150
200Basis points
Mar. 12
Jan. FOMCDaily
Spreads on 30-Day Commercial Paper
ABCP
A2/P2
Note. The ABCP spread is the AA ABCP rate minus the AAfinancial rate. The A2/P2 spread is the A2/P2 nonfinancialrate minus the AA nonfinancial rate.
600
700
800
900
1000
1100
1200
1300
1400Billions of dollars
Jan. Mar. May July Sept. Nov. Jan. Mar.2007 2008
Jan. FOMC
Mar. 12
Weekly
Commercial Paper Outstandings
Note. Seasonally adjusted; weeks ending on Wednesdays.
ABCP
Unsecured CP
July Sept. Nov. Jan. Mar.2007 2008
2.5
3.0
3.5
4.0
4.5
5.0
5.5
6.0Percent
Mar. 12
Jan. FOMC
Federal Funds Rates
Daily
Target
Effective
July Sept. Nov. Jan. Mar.2007 2008
0.5
1.0
1.5
2.0
2.5
3.0
3.5
4.0
4.5
5.0
5.5Percent
Daily
3-Month Treasury Bill Rate
Jan. FOMC
Mar. 12
July Sept. Nov. Jan. Mar.2007 2008
1
2
3
4
5
6Percent
Daily
Treasury Repo Rates for General Collateral
Jan. FOMC
Mar. 12
Overnight
1- month

Domestic Financial Developments
III-1
1 The spread on asset-backed commercial paper edged up, on net, over the intermeeting period.
However, the small increase understates to some extent the strains in that segment of the commercial paper market because the spread is measured relative to the AA financial rate, which became elevated over the intermeeting period.
Overview Concerns about the economic outlook and the exposure of financial institutions to further losses weighed on financial markets over the intermeeting period. Late in the period, significant strains resurfaced in short-term funding markets, prompting the Federal Reserve to take several steps to increase liquidity. On net, investors marked down the expected path for monetary policy substantially. Two-year nominal yields declined markedly, while ten-year nominal yields fell less, thereby leaving the yield curve noticeably steeper. Amid higher-than-expected inflation readings and notable increases in oil prices, TIPS-based inflation compensation rose across the term structure. Broad equity market indexes declined, and corporate bond spreads widened to multiyear highs. Indicators of household credit quality showed further deterioration, particularly for nonprime mortgages. According to Call Report data, commercial bank profits in the fourth quarter of 2007 were at their lowest level since the early 1990s, in part because of a sharp increase in loan-loss provisioning.
Money Market Functioning Conditions in some short-term funding markets deteriorated over the intermeeting period. Spreads of Libor and term federal funds rates over those on comparable-maturity overnight index swaps (OIS) jumped in late February amid renewed funding pressures. The spread on lower-rated nonfinancial unsecured commercial paper also widened, on net, and asset-backed commercial paper outstanding contracted a bit.1 In addition, dealers reported that liquidity conditions in the commercial paper market deteriorated because of concerns about the health of some financial institutions that provide liquidity and credit support to the market. Starting in mid-February, repurchase agreements backed by agency and private-label mortgage-backed securities (MBS) also came under significant pressure, with reports of larger “haircuts” being applied by lenders and news of market participants missing margin calls on positions.
Consistent with a step-up in funding pressures, auctions through the Term Auction Facility (TAF) during the intermeeting period drew more demand than those immediately following the turn of the year. On March 7, the Federal Reserve announced that it would increase the size of TAF auctions in March from $30 billion to $50 billion, which will result in $100 billion of TAF credit outstanding, and that it would begin a series of

III-2
Policy Expectations and Treasury Yields
Jan. 28 Jan. 31 Feb. 5 Feb. 8 Feb. 13 Feb. 19 Feb. 22 Feb. 27 Mar. 3 Mar. 6 Mar. 11
2.22.42.62.83.03.23.43.63.84.04.24.4
Percent
FOMCstatement
FOMCminutes
Chairman’stestimony
Januaryemployment
report
ISMnonmanufacturing
Februaryemployment
report
April 2008 federal funds
December 2009 Eurodollar
Money Market Futures Rates
Note. 5-minute intervals. 8:00 a.m. to 4:00 p.m. No adjustments for term premiums.
1.50
1.75
2.00
2.25
2.50
2.75
3.00
3.25
3.50
3.75Percent
Feb. June Oct. Feb. June Oct. Feb. 2008 2009 2010
Expected Federal Funds Rates
Note. Estimates from federal funds and Eurodollar futures.
March 12, 2008
January 29, 2008
50
100
150
200
250
300
Oct. Mar. Aug. Jan. May Oct. Mar.2005 2006 2007 2008
200
300
400
500
600
700
800
900
1000
1100Basis points Basis points
6-month Eurodollar (left scale)*10-year Treasury (right scale)
Implied Volatility of Interest Rates
Daily
Mar. 12
Jan. FOMC
*Width of a 90 percent confidence interval computed from theterm structures for the expected federal funds rate and impliedvolatility.
1 3 5 7 10 200.0
0.5
1.0
1.5
2.0
2.5
3.0
3.5
4.0
4.5
5.0Percent
Treasury Yield Curve
Years ahead Note. Smoothed yield curve estimated from off-the-run Treasurycoupon securities. Yields shown are those on notional par Treasurysecurities with semiannual coupons.
January 29, 2008
March 12, 2008
2.0
2.2
2.4
2.6
2.8
3.0
3.2
Percent
Jan. Mar. May July Sept. Nov. Jan. Mar.2007 2008
Mar. 12
Five-to-ten years ahead
Next five years*
Inflation Compensation
Daily
Note. Estimates based on smoothed nominal and inflation-indexed Treasury yields. *Adjusted for lagged indexation of TIPS.
Jan. FOMC
III-3
twenty-eight-day, single-tranche, term repurchase agreements that are expected to cumulate to $100 billion. The first larger TAF auction held on March 10 generated strong demand. On March 11, the Federal Reserve announced an increase in the sizes of its swap lines with the European Central Bank and the Swiss National Bank, and those central banks announced that they would draw on those lines to provide dollar funding as long as necessary. In addition, the Federal Reserve announced a new term securities lending facility that will allow primary dealers to borrow as much as $200 billion of Treasury securities from the portfolio of the System Open Market Account (SOMA) for a term of twenty-eight days, collateralized by agency debt, agency-backed MBS, and AAA-rated private-label MBS. Following these announcements, Libor-OIS spreads and spreads in markets for agency-guaranteed MBS over comparable maturity Treasury securities narrowed somewhat.
Yields on three-month Treasury bills dropped over the intermeeting period, mostly because of downward revisions to policy expectations, but some safe-haven demands may have also pressured yields lower, as the spread below comparable-maturity OIS widened somewhat in recent weeks, albeit to not to the levels observed last August. Liquidity in the bill market was strained at some points during the intermeeting period, but has reportedly improved amid increased issuance, particularly at the shortest maturities. The heightened demand for Treasury debt continued to be reflected in periodic downward spikes in the overnight repurchase agreement rate for general Treasury collateral.
Policy Expectations and Treasury Yields The Committee’s decision to lower the target federal funds rate 50 basis points at the January meeting elicited a modest general reaction in financial markets, but near-term futures rates declined a few basis points, as investors had apparently placed some odds on a smaller easing. The expected path of monetary policy over the next two years subsequently shifted down substantially, on net, as market perceptions of deterioration in the economic outlook and increasing concerns about the financial sector apparently outweighed higher-than-expected incoming readings on inflation and soaring energy prices. The release of the January FOMC meeting minutes produced little market reaction.
Federal funds futures and options indicate that investors are now virtually certain of at least 50 basis points of easing at the March FOMC meeting. Further ahead, Eurodollar futures quotes suggest that investors expect the federal funds rate to fall to around 1.75

III-4
Corporate Yields, Risk Spreads, and Stock Prices
80
85
90
95
100
105
110
115
120
125
130
135
Jan. 29, 2008 = 100
Jan. Mar. May July Sept. Nov. Jan. Mar.2007 2008
Selected Stock Price Indexes
Daily
S&P 500
DJ Financial Jan. FOMC
Mar. 12
2
4
6
8
10
12Percent
1988 1992 1996 2000 2004 2008
Ratio of Trend Earnings to Price for S&P 500 andLong-Run Treasury Yield
Monthly
(Trend earnings) / P*
Long-run real Treasury yield
+
+
Mar. 12
* Trend earnings are estimated using analysts’ forecasts ofyear-ahead earnings from I/B/E/S. + Denotes the latest observation using daily interest rates andstock prices and latest earnings data from I/B/E/S.
10
20
30
40
50Percent
2002 2003 2004 2005 2006 2007 2008
Implied Volatility on S&P 500 (VIX)
Weekly Friday*Jan.
FOMC
Mar. 12
* Latest observation is for most recent business day.
4.5
6.5
8.5
10.5
12.5Percent
2002 2003 2004 2005 2006 2007 2008
Corporate Bond Yields
Daily
10-year high-yield
10-year BBB
Jan. FOMC
Mar. 12
Note. Yields from smoothed yield curves based on Merrill Lynchbond data.
0
200
400
600
800
75
150
225
300
375
Basis points Basis points
2002 2003 2004 2005 2006 2007 2008
Corporate Bond Spreads
DailyJan.
FOMC
Mar. 12
Note. Measured relative to comparable-maturity Treasuries.
10-year high-yield(left scale)
10-year BBB(right scale)
0
200
400
600
800
1000
Basis points
2002 2003 2004 2005 2006 2007 2008
Far-term**
Near-term*
High-Yield Forward Credit Spreads
DailyJan.
FOMC
Mar. 12
* Forward spread between years 2 and 3. ** Forward spread between years 9 and 10. Source. Staff estimates.

III-5
2 Figure based on index levels as of market close on March 12. Relative to the January Greenbook, stock prices are about unchanged.
percent over the next half-year, and to remain at that level until early 2009. Implied uncertainty around the near-term policy path has fallen a touch since the January FOMC meeting and remains higher than before the onset of the financial market turmoil.
Consistent with the downward revision to policy expectations, two-year nominal Treasury yields fell markedly; ten-year yields declined less, leaving the yield curve noticeably steeper. Judging from TIPS yields, the change in the slope of the nominal yield curve largely reflected a steepening in the term structure of real yields. Inflation compensation rose across the term structure, likely prompted by higher-than-expected inflation data, climbing oil prices, dollar depreciation, and, perhaps, perceptions that the FOMC is especially focused on downside risks to growth. Survey measures of inflation expectations also suggest higher expected inflation as well as greater inflation uncertainty.
Stock Prices and Corporate Interest Rates Broad stock price indexes decreased about 4 percent, on net, over the intermeeting period.2 Stocks tumbled on negative economic news as well as concerns about the financial guarantors and the portfolios of financial intermediaries, but recovered some of their losses on the day that the Federal Reserve announced the new term securities lending program. The Dow Jones index of financial sector stocks was especially volatile and substantially underperformed the broader market, but the indexes for the energy and basic materials sectors rose somewhat on the surge in oil and other commodity prices. The spread between the twelve-month-forward trend earnings-to-price ratio for S&P 500 firms and a real long-run Treasury yield—a rough gauge of the equity risk premium—was little changed at the upper end of its range over the past two decades. Option-implied volatility on the S&P 500 index remained on the high side of the average for the past several months.
Yields on BBB-rated and high-yield corporate bonds increased over the intermeeting period, despite the decline in Treasury yields, pushing their spreads to the highest levels since 2002. Near-term forward spreads are particularly wide, suggesting greater concern among investors about the outlook for corporate credit quality over the next few years. Spreads on corporate bonds rated A and AA increased to their highest levels in over a decade, likely a reflection of the high proportion of financial firms with these ratings.

III-6
Corporate Earnings and Credit Quality
-30
-20
-10
0
10
20
30
40Percent
All firmsNonfinancials
1998 2001 2004 2007
S&P 500 Earnings Per Share
Change from 4 quarters earlier
Q4
Q4
Source. I/B/E/S for S&P 500 earnings per share.
-4
-3
-2
-1
0
1
2
3Percent
All firmsNonfinancials
2002 2003 2004 2005 2006 2007 2008
Revisions to Expected S&P 500 Earnings
Monthly
Mid- Feb.
Note. Index is a weighted average of the percent change in theconsensus forecasts of current-year and following-year EPS for afixed sample.
0.03
0.06
0.09
0.12
0.20
0.25
0.30
0.35Ratio Ratio
1989 1992 1995 1998 2001 2004 2007
Financial Ratios for Nonfinancial Corporations
Annual*
Debt overtotal assets(right scale)
Liquid assets overtotal assets(left scale)
Q4
Q4
* Data are quarterly starting in 2000:Q1. Source. Calculated with Compustat data.
0
1
2
3
4
5
6
7Percent of outstandings
1990 1993 1996 1999 2002 2005 2008
Selected Default and Delinquency Rates
C&I loan delinquency rate (Call Report)
Bond default rate*
* 6-month moving average, from Moody’s Investors Service.
Jan.
Q4
1992 1994 1996 1998 2000 2002 2004 2006 200850
40
30
20
10
0
10
20
30
Upgrades
Downgrades
Jan.
Bond Ratings Changes of Nonfinancial CompaniesPercent of outstandings
Annual rate
Source. Calculated with data from Moody’s Investors Service.
0.0
0.5
1.0
1.5
2.0Percent of liabilities
1993 1996 1999 2002 2005 2008
Expected Year-Ahead Defaults
Monthly
Jan.
Note. Firm-level estimates of default weighted by firm liabilities asa percent of total liabilities, excluding defaulted firms. Source. Moody’s KMV.

III-7
Corporate Earnings and Credit Quality With fourth-quarter earnings reports nearly complete, operating earnings per share for S&P 500 firms are estimated to have plunged more than 25 percent from year-earlier levels; huge write-downs by financial firms led to a large decline in that sector’s earnings. In contrast, earnings per share for nonfinancial firms increased 13 percent on a year-over-year basis, and reports from most nonfinancial S&P 500 firms met or exceeded forecasts. Looking forward, year-ahead earnings for both financial and nonfinancial S&P 500 firms were marked down significantly in January and February.
Data on nonfinancial corporate balance sheets for the fourth quarter of 2007 suggest that corporate credit quality is holding up. The aggregate ratio of liquid assets to total assets remained high by historical standards, and the aggregate leverage ratio stayed low. The delinquency rate on C&I loans ticked up again in the fourth quarter but remained low. In January, ratings changes for corporate bonds were sparse, and the realized six-month trailing default rate on corporate bonds continued to hover near zero. However, a forward-looking measure of credit quality, the KMV forecast of the aggregate year-ahead default rate, jumped in January.
Business Finance Gross bond issuance by nonfinancial firms was solid in January and February, but nearly all the issues were rated investment grade. Outstanding nonfinancial commercial paper also expanded at a moderate pace, while growth in C&I loans stalled in February after a gain in January. Aggregating across bonds, commercial paper, and C&I loans, net debt financing expanded at a modest pace over the past two months.
Net equity issuance was deeply negative in the fourth quarter (the most recently available data), as public and private equity issuance was dwarfed by equity retirements. Retirements from cash-financed mergers and acquisitions set a new record, largely because of the completion of a number of blockbuster leveraged buyouts. In 2008, the pace of merger completions has slowed, and very few large deals have been announced. Repurchases remained strong in the fourth quarter, but the pace at which new programs (from nonfinancial firms) have been announced has moderated a bit this year.
In January and February, gross public equity issuance by nonfinancial firms was sluggish, with IPO activity particularly sparse in the face of lower and more volatile equity prices. Financial issuance was sizable, reflecting several large offerings of preferred shares from major financial institutions.

III-8
Business FinanceGross Issuance of Securities by U.S. Corporations
(Billions of dollars; monthly rates, not seasonally adjusted)
2007 2008
Type of security 2004 2005 2006 2007 Q4 Jan. Feb.
Nonfinancial corporationsStocks1 5.4 4.6 4.7 5.5 6.5 1.9 3.1 Initial public offerings 1.6 1.7 1.8 1.6 2.0 .6 .1 Seasoned offerings 3.8 2.8 2.9 3.8 4.5 1.3 3.0
Bonds2 22.7 19.1 29.8 35.6 38.7 27.2 22.6 Investment grade 8.2 8.4 13.0 17.2 20.3 24.8 19.0 Speculative grade 9.7 6.4 8.0 10.3 6.8 1.0 .8 Other (sold abroad/unrated) 4.9 4.3 8.8 8.2 11.6 1.4 2.7
MemoNet issuance of commercial paper3 1.5 -.4 3.9 -.4 -.2 9.9 6.6Change in C&I loans at commercial banks3,4 3.1 9.9 12.9 20.9 23.1 7.3 4.5
Financial corporationsStocks1 6.9 5.0 5.3 8.6 12.3 25.1 9.1Bonds2 139.3 176.3 187.7 156.0 82.3 93.0 44.3
Note. Components may not sum to totals because of rounding. 1. Excludes private placements and equity-for-equity swaps that occur in restructurings. 2. Data include regular and 144a private placements. Bond totals reflect gross proceeds rather than par value oforiginal discount bonds. Bonds are categorized according to Moody’s bond ratings or to Standard & Poor’s ifunrated by Moody’s. 3. End-of-period basis, seasonally adjusted. 4. Adjusted commercial bank credit data.
2003 2004 2005 2006 2007 2008
-20
-10
0
10
20
30
40
50
60
70
Commercial paper*C&I loans*Bonds
Total
Selected Components of Net Debt Financing
Billions of dollars
Monthly rate, nonfinancial firms
* Seasonally adjusted, period-end basis.
H1
H2
Jan.
Feb.
2003 2004 2005 2006 2007
-120
-110
-100
-90
-80
-70
-60
-50
-40
-30
-20
-10
0
10
20
30
40
Public issuancePrivate issuanceRepurchasesCash mergers
Total
Components of Net Equity Issuance
Billions of dollars
Monthly rate, nonfinancial firmsH1 Q3
Q4 e
e Staff estimate.

III-9
3 On February 27, the Office of Federal Housing Enterprise Oversight (OFHEO) lifted the portfolio
caps on Fannie Mae and Freddie Mac and said it would consider gradually reducing the extra capital required because of the GSEs’ operational and internal control problems during the past several years.
Commercial Real Estate Conditions in commercial real estate credit markets have remained somewhat tight. Commercial mortgage debt growth moderated a bit further in the fourth quarter. Sales of commercial real estate dropped back sharply in January and February after hovering in an extremely high range in 2007. Spreads of yields on AAA-rated and BBB-rated commercial mortgage-backed securities (CMBS) over those on comparable-maturity Treasury securities soared further over the intermeeting period amid continued concerns about high leverage on recently securitized mortgages and investor distrust of structured financial products in general. Issuance of CMBS has been scant thus far this quarter.
Fundamentals for existing commercial properties remained solid, on balance, in the fourth quarter, with little change in the vacancy rate and growth in commercial rents staying fairly high. Delinquency rates on CMBS and on commercial real estate loans held at life insurance companies were low in the fourth quarter. However, delinquencies on commercial real estate loans held by commercial banks rose further on continued deterioration in the performance of loans funding commercial and residential development projects.
Household Finance Residential mortgage debt decelerated further in the fourth quarter. Loan performance continued to deteriorate; delinquency rates on subprime mortgages climbed steeply further, and delinquency rates on prime mortgages reached multiyear highs.
Credit default swap (CDS) premiums for Fannie Mae and Freddie Mac increased to historical highs in the early months of 2008, likely reflecting continued concerns about mortgage credit quality and, relatedly, these firms’ announcements of substantial fourth-quarter losses.3 A heightened supply of agency-guaranteed MBS and higher required compensation for prepayment risk have pushed up spreads over Treasury yields in this market over the past several months. In addition, in early March, diminished liquidity in the agency MBS market boosted spreads even further. Spreads peaked on March 6 and have since fallen back a bit. The increase in secondary market spreads, along with increased guarantee fees charged by the government-sponsored enterprises (GSEs), pushed up interest rates in the primary market for conforming mortgages. Issuance of

III-10
1997 1999 2001 2003 2005 2007 0
2
4
6
8
10
12
14
16
18Percent change from year earlier
Q4
Commercial Mortgage Debt
Quarterly
Source. Flow of funds.2001 2002 2003 2004 2005 2006 2007 2008
0
20
40
60
80Billions of dollars
3-month moving average, monthly rate
Feb.p
Sales of Commercial Real Estate
p Preliminary. Source. Real Capital Analytics.
2000 2002 2004 2006 2008 0
300
600
900
1200
1500
1800Basis points
BBB AAA
Mar. 12
Mar. 12
Investment-Grade CMBS Spreads
Weekly
Note. Measured relative to the 10-year Treasury yield. Source. Morgan Stanley.
0
20
40
60
80
100Billions of dollars
1998 2000 2002 2004 2006 2008
*
CMBS Issuance
Quarterly rate
* Quarter to date. Source. Commercial Mortgage Alert.
-8
-6
-4
-2
0
2
4
6
8
10
1992 1995 1998 2001 2004 20076
8
10
12
14
16Percent change from year earlier Percent
Vacancy rates(right scale)
Rents(left scale)
Q4
Q4
Rents and Vacancy Rates on CommercialProperties
Quarterly
Note. Average of series for office, industrial, and retailproperties. Source. Torto Wheaton.
1997 1999 2001 2003 2005 2007
0
1
2
3
4Percent
Q4
Q4
Dec.At lifeinsurancecompanies
CMBS
At commercial banks*
Delinquency Rates on Commercial Mortgages
* Excluding farmland. Source. Citigroup, Call Report, ACLI.
Commercial Real Estate

III-11
2001 2002 2003 2004 2005 2006 2007 4
6
8
10
12
14
16Percent change from year earlier
Q4
Quarterly
Mortgage Debt
Source. Flow of funds.
4
6
8
10
12
14
16
18
2001 2002 2003 2004 2005 2006 2007 20080.0
0.5
1.0
1.5
2.0
2.5
3.0Percent of loans Percent of loans
Subprime (left scale)
Prime (right scale)Dec.
Jan.
Delinquencies on Mortgages
Monthly
Note. Percent of loans 90 or more days past due or inforeclosure. Prime includes near-prime mortgages. Source. First American LoanPerformance.
Sept. Dec. Mar. June Sept. Dec. Mar.2006 2007 2008
0
20
40
60
80
100
120Basis points
GSE IndexBanking Index
Credit Default Swap Premiums
Daily
Note. Sector index is the median of individual quotes. Source. Markit.
Jan.FOMC
Mar. 12
Mar. 12
Sept. Dec. Mar. June Sept. Dec. Mar.2006 2007 2008
0
50
100
150
200
250
300
350
400Basis points
UnadjustedOption-adjusted
Jan.FOMC
Mar. 12
Mar. 12
Daily
FNMA 30-Year MBS Current Coupon Spreads
Note. Option-adjusted spread from Bloomberg’s prepayment model.Unadjusted spread relative to duration-matched Treasury. Source. Bloomberg.
140
160
180
200
220
240
260
280
Sept. Dec. Mar. June Sept. Dec. Mar.2006 2007 2008
5.0
5.5
6.0
6.5
7.0Basis points Percent
30-year fixed-rate spread(left scale)
30-year fixed-rate(right scale)
Jan.FOMC Mar.
12
Mar. 12
Prime Conforming Mortgage Rate and Spread
Weekly
Note. FRM spread relative to 10-year Treasury. Source. Freddie Mac.
0
50
100
150
200
250
300Billions of dollars
2001 2002 2003 2004 2005 2006 2007 2008
AgencyNon-agency
Monthly rate
Agency and Non-agency MBS Issuance
H1
H2
J.F.
Source. For agency issuance, Fannie Mae, Freddie Mac,and Ginnie Mae. For non-agency issuance, Inside MortgageFinance MBS database.
Residential Mortgages
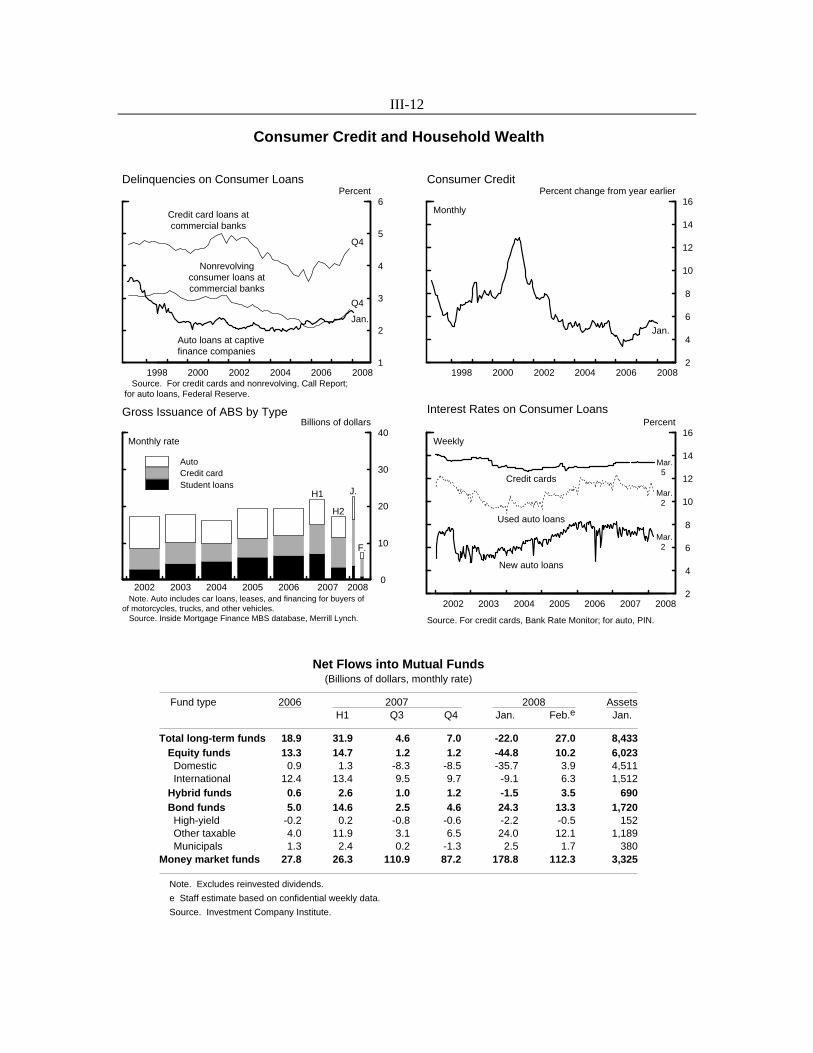
III-12
1998 2000 2002 2004 2006 20081
2
3
4
5
6Percent
Auto loans at captive finance companies
Credit card loans atcommercial banks
Nonrevolvingconsumer loans atcommercial banks
Jan.
Q4
Q4
Delinquencies on Consumer Loans
Source. For credit cards and nonrevolving, Call Report; for auto loans, Federal Reserve.
1998 2000 2002 2004 2006 2008 2
4
6
8
10
12
14
16Percent change from year earlier
Jan.
Monthly
Consumer Credit
0
10
20
30
40Billions of dollars
2002 2003 2004 2005 2006 2007 2008
AutoCredit cardStudent loans
Monthly rate
Gross Issuance of ABS by Type
H1
H2
J.
F.
Note. Auto includes car loans, leases, and financing for buyers ofof motorcycles, trucks, and other vehicles. Source. Inside Mortgage Finance MBS database, Merrill Lynch.
2002 2003 2004 2005 2006 2007 2008 2
4
6
8
10
12
14
16Percent
New auto loans
Used auto loans
Credit cards
Interest Rates on Consumer Loans
Weekly
Mar. 5
Mar. 2
Mar. 2
Source. For credit cards, Bank Rate Monitor; for auto, PIN.
Consumer Credit and Household Wealth
Net Flows into Mutual Funds(Billions of dollars, monthly rate)
Fund type 2006 2007 2008 Assets H1 Q3 Q4 Jan. Feb.e Jan.
Total long-term funds 18.9 31.9 4.6 7.0 -22.0 27.0 8,433 Equity funds 13.3 14.7 1.2 1.2 -44.8 10.2 6,023 Domestic 0.9 1.3 -8.3 -8.5 -35.7 3.9 4,511 International 12.4 13.4 9.5 9.7 -9.1 6.3 1,512 Hybrid funds 0.6 2.6 1.0 1.2 -1.5 3.5 690 Bond funds 5.0 14.6 2.5 4.6 24.3 13.3 1,720 High-yield -0.2 0.2 -0.8 -0.6 -2.2 -0.5 152 Other taxable 4.0 11.9 3.1 6.5 24.0 12.1 1,189 Municipals 1.3 2.4 0.2 -1.3 2.5 1.7 380Money market funds 27.8 26.3 110.9 87.2 178.8 112.3 3,325
Note. Excludes reinvested dividends.
e Staff estimate based on confidential weekly data.
Source. Investment Company Institute.

III-13
4 Legislation enacted last fall reduced the subsidy to lenders providing loans through the Federal
Family Education Loan Program.
agency-guaranteed MBS, supported by an elevated pace of refinancing in late January and early February, was robust through mid-March.
Conditions in the nonprime and prime jumbo mortgage markets remain very tight, with issuance of private residential MBS scant in January and drying up in February. The Economic Stimulus Act of 2008, signed into law in mid-February, included a temporary increase in the size of mortgages in certain high-price areas that can be securitized by the GSEs. The GSEs announced that the newly conforming loans would be subject to an additional 25 basis point guarantee fee and more stringent underwriting guidelines than standard conforming loans, including lower maximum loan-to-value ratios and higher minimum credit scores. Rates quoted by lenders on jumbo mortgages have been quite volatile in recent weeks as originators have scrambled to redesign loan programs.
Most delinquency rates on consumer loans have continued to move up and now stand near or above their historical averages. Consumer credit expanded at a moderate pace in January, with issuance of consumer auto, credit card, and student loan asset-backed securities (ABS) remaining solid through that month. However, issuance in all three categories declined somewhat in February. In the secondary market for student loans, investors have considerably reduced their participation owing to concerns about complex securities and reduced federal government support of public and private entities providing government-guaranteed loans.4 Spreads on consumer loan ABS have risen notably further in recent weeks, although the available data suggest that retail interest rates on credit card and auto loans have not changed much.
In the fourth quarter, OFHEO’s purchase-only index of national home prices dropped at an annual rate of 5 percent, the largest decrease since the start of the series in 1991. Futures quotes indicate that over the intermeeting period market participants sharply marked down the expected path of house prices. Given declines in housing and stock prices, the ratio of household net worth to disposable personal income fell in the fourth quarter.
Long-term mutual funds, which in January experienced net outflows due to heavy redemptions of equity funds, recovered these losses with sizable inflows in February. Money market mutual funds experienced net inflows at the highest pace on record in
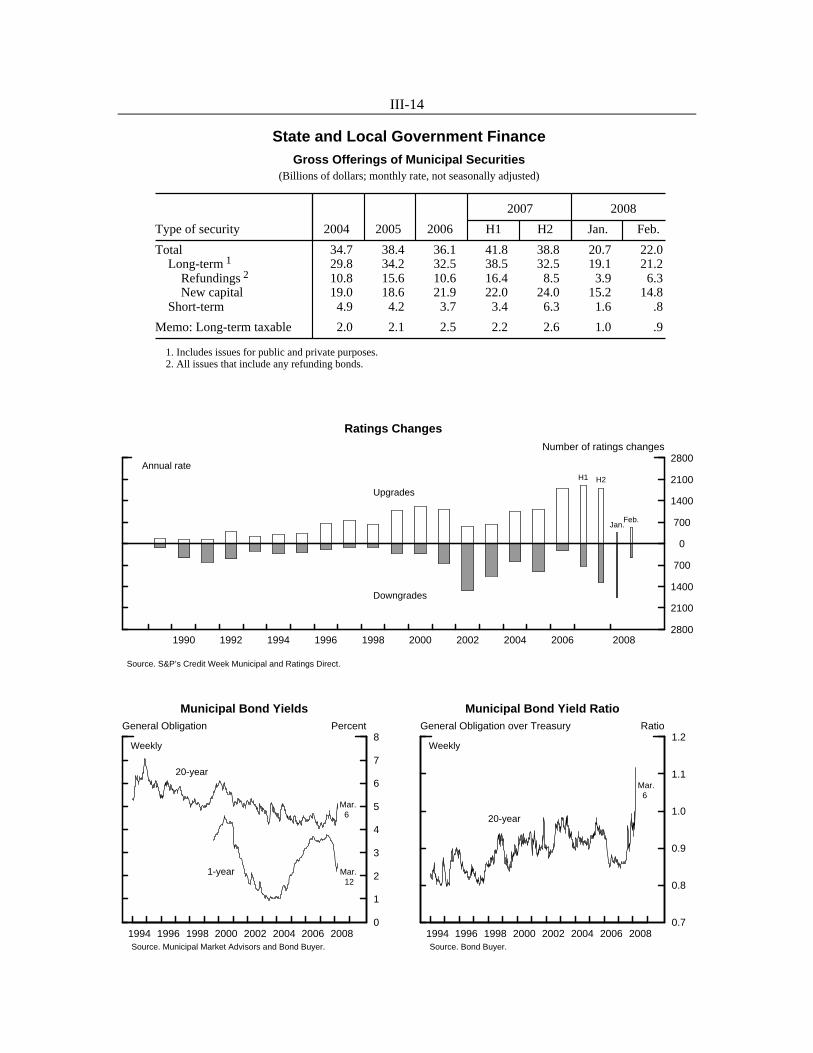
III-14
State and Local Government FinanceGross Offerings of Municipal Securities
(Billions of dollars; monthly rate, not seasonally adjusted)
2007 2008
Type of security 2004 2005 2006 H1 H2 Jan. Feb.
Total 34.7 38.4 36.1 41.8 38.8 20.7 22.0 Long-term 1 29.8 34.2 32.5 38.5 32.5 19.1 21.2 Refundings 2 10.8 15.6 10.6 16.4 8.5 3.9 6.3 New capital 19.0 18.6 21.9 22.0 24.0 15.2 14.8 Short-term 4.9 4.2 3.7 3.4 6.3 1.6 .8
Memo: Long-term taxable 2.0 2.1 2.5 2.2 2.6 1.0 .9
1. Includes issues for public and private purposes. 2. All issues that include any refunding bonds.
1990 1992 1994 1996 1998 2000 2002 2004 2006 20082800
2100
1400
700
0
700
1400
2100
2800
Upgrades
Downgrades
Ratings ChangesNumber of ratings changes
Annual rateH1 H2
Jan.Feb.
Source. S&P’s Credit Week Municipal and Ratings Direct.
0
1
2
3
4
5
6
7
8General Obligation Percent
1994 1996 1998 2000 2002 2004 2006 2008
Municipal Bond Yields
Weekly
20-year
1-year
Mar. 6
Mar. 12
Source. Municipal Market Advisors and Bond Buyer.
0.7
0.8
0.9
1.0
1.1
1.2General Obligation over Treasury Ratio
1994 1996 1998 2000 2002 2004 2006 2008
Municipal Bond Yield Ratio
Weekly
20-year
Mar. 6
Source. Bond Buyer.

III-15
nominal terms this year through early March, a surge prompted in part by investors’ shift toward relatively safe assets.
Treasury Finance The five- and ten-year securities auctioned at the Treasury’s midquarter refunding in February were received well, but demand in the auctions for two-year notes and thirty-year bonds was below average. Measures of foreign demand for Treasury securities were somewhat mixed, with indirect bidding at the auctions down a bit further but custody holdings of Treasury securities at the Federal Reserve Bank of New York up modestly. The Treasury noted that it expects to increase bill issuance, and possibly nominal coupon issuance, in the coming months to address its projected increase in borrowing needs.
Liquidity in the market for Treasury coupon securities has remained somewhat impaired. Bid-ask spreads have stayed higher than they were before the onset of financial turmoil last year, and the on-the-run premium for the ten-year note rose in February to its highest level since 2002. Borrowing of Treasury securities in the SOMA Securities Lending Program stayed near record levels.
State and Local Government Finance Gross issuance of long-term municipal bonds slowed in January and February. Although a moderation is typical early in the year, issuance was also likely damped by the troubles facing financial guarantors. Historically, these guarantors have insured about half of all municipal bonds; this share has declined recently. Issuance of short-term bonds has been light as of late, an indication that most state and local governments are not experiencing substantial near-term funding pressures. Relatively few municipal bonds saw ratings changes in February after a spike in downgrades in January associated with a major financial guarantor being downgraded from AAA to AA, which lowered the ratings on most of the bonds it insured. The likelihood of an even larger wave of municipal bond downgrades was reduced when Standard & Poor’s confirmed AAA ratings in late February on the two largest bond insurers.
Even so, yields on long-term municipal bonds have jumped in recent weeks, reportedly reflecting some reluctance of dealers to provide liquidity and an unusually large volume of sales from leveraged investors. As a result, the ratio of municipal bond yields to comparable-maturity Treasuries has shot up, reaching record levels.

III-16
M2 Monetary Aggregate(Based on seasonally adjusted data)
Percent change (annual rate)1 Level(billions
2007 2008 of dollars),
Aggregate and components 2006 2007 H1 Q3 Q4 Jan. Feb. Feb.(p) (p)
M2 4.9 5.9 6.7 4.7 5.3 8.3 16.5 7,602
Components2
Currency 3.5 2.0 2.6 1.6 1.2 -1.4 1.4 759Liquid deposits3 .8 4.5 6.5 2.7 2.0 3.9 13.2 4,553Small time deposits 18.5 4.2 4.1 2.1 6.2 7.5 1.9 1,226Retail money market funds 12.9 20.5 15.5 21.5 24.6 36.9 61.1 1,057
Memo:Institutional money market funds 15.6 38.3 22.7 38.1 53.4 25.9 89.0 2,042Monetary base 3.1 2.0 2.5 1.9 1.0 -3.2 3.9 824
1. For years, Q4 to Q4; for quarters and months, calculated from corresponding average levels.2. Nonbank traveler’s checks are not listed.3. Sum of demand deposits, other checkable deposits, and savings deposits.p Preliminary.

III-17
Money and Bank Credit M2 expanded at an annual rate of 17 percent in February. Retail money funds extended their blistering advance, likely reflecting continued safe haven demands. Following a slight boost in January from tax-related flows, liquid deposits accelerated markedly in February as the drop in market rates resulting from the monetary policy easing trimmed their opportunity cost.
Growth of commercial bank credit moderated in January and February. C&I loans decelerated markedly from their torrid fourth-quarter pace, mainly at large banks. Growth of these loans was likely damped by a reduction in merger and acquisition activity, weak business spending, and fewer previously committed loan deals coming onto banks’ books. The February Survey of Terms of Business Lending suggests that spreads of C&I loan rates over banks’ cost of funds rose in the current quarter. Commercial real estate loans advanced relatively briskly again over the first two months of the year, and loans secured by residential real estate continued to expand modestly. Consumer loan growth stayed moderate.
According to the fourth-quarter Call Reports, commercial bank profits plunged last quarter. The decline was concentrated at large banks and was driven in part by a jump in provisioning for loan losses. The delinquency rate on all loans and leases increased to a level only a little below its recent peak in 2002.

III-18
Commercial Bank Credit(Percent change, annual rate, except as noted; seasonally adjusted)
Type of credit 2006 H1 Q3 Q4 Jan. Feb. Level1
2007 2007 2007 2008 2008e Feb. 2008e
Total 9.6 9.4 12.4 9.0 4.7 6.3 8,799
Loans2
Total 10.9 10.2 12.6 11.8 12.4 4.0 6,743 To businesses Commercial and industrial 16.5 10.0 24.3 29.2 12.6 1.3 1,427 Commercial real estate 13.7 9.6 12.4 8.2 5.9 10.9 1,601
To households Residential real estate 7.0 10.7 2.6 1.0 5.3 4.7 1,891 Revolving home equity 1.4 2.0 6.7 11.9 10.9 5.9 489 Other 9.1 13.6 1.3 -2.6 3.3 4.2 1,401 Consumer 5.9 6.4 10.5 7.6 13.0 1.0 813 Originated3 6.9 5.2 10.3 7.4 16.2 4.7 1,222 Other4 11.8 14.1 19.6 18.9 35.5 -1.7 1,012
SecuritiesTotal 6.1 6.9 11.7 .2 -20.1 14.1 2,056 Treasury and agency 1.9 -4.2 5.6 -22.3 -21.8 3.2 1,084 Other5 13.2 23.8 19.9 29.4 -18.3 26.4 972
Note. Yearly annual rates are Q4 to Q4; quarterly and monthly annual rates use corresponding average levels. Datahave been adjusted to remove the effects of mark-to-market accounting rules (FIN 39 and FAS 115), the consolidation ofcertain variable interest entities (FIN 46), the adoption of fair value accounting (FAS 159), and the effects of sizablethrift-to-bank and bank-to-thrift structure activity in October 2006, March 2007, and October 2007. Data also account forbreaks caused by reclassifications. 1. Billions of dollars. Pro rata averages of weekly (Wednesday) levels. 2. Excludes interbank loans. 3. Includes an estimate of outstanding loans securitized by commercial banks. 4. Includes security loans and loans to farmers, state and local governments, and all others not elsewhere classified.Also includes lease financing receivables. 5. Includes private mortgage-backed securities, securities of corporations, state and local governments, foreigngovernments, and any trading account assets that are not Treasury or agency securities, including revaluation gainson derivative contracts. e Estimated.
1998 2000 2002 2004 2006 2008
140
160
180
200
220
240Basis points
Weightedaverage
Weightedaverage
adjusted*
C&I Loan Rate Spreads
Quarterly
Note. Spreads over market interest rate on an instrument of comparable maturity on loans less than $25 million (2006$). *Adjusted for changes in nonprice loan characteristics. Source. Survey of Terms of Business Lending.
Q1
Q1
Q4
1992 1995 1998 2001 2004 20070.0
0.5
1.0
1.5
2.0Percent
100 largest banksAll other banks
Q4
Q4
Return on Assets for Commercial Banks
Quarterly, s.a.a.r.
Source. Call Report.
Q3
Last Page of Domestic Financial Developments

International Developments
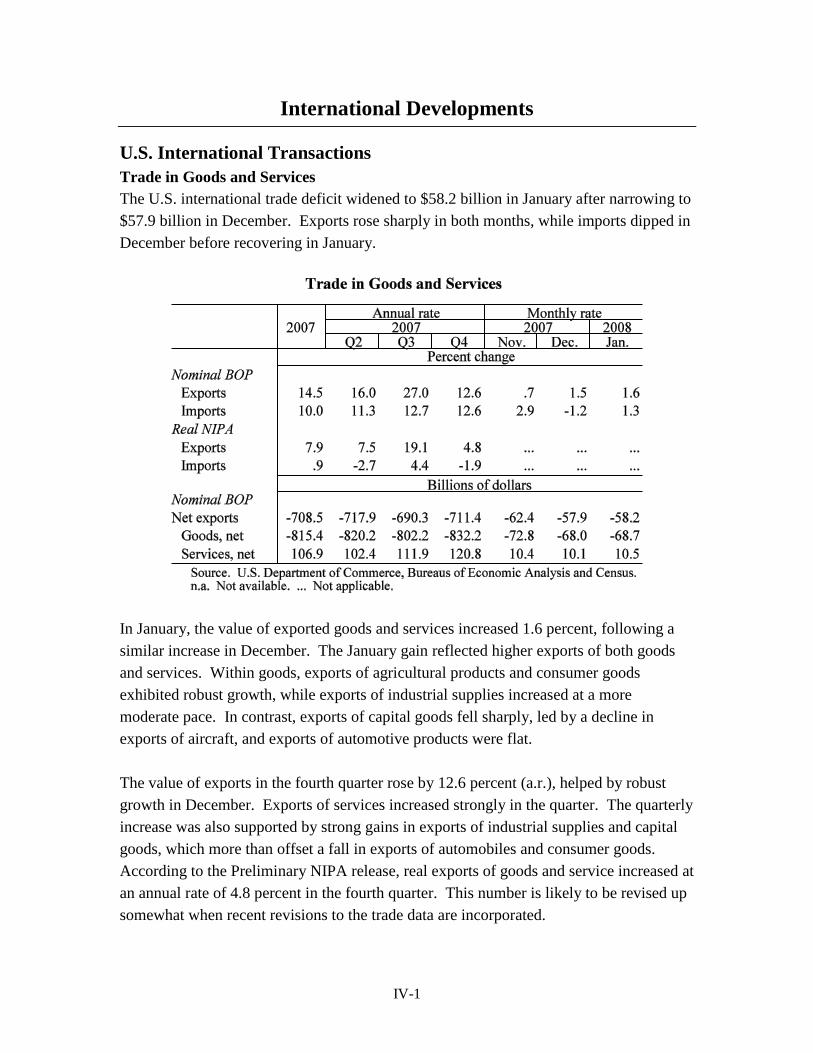
International Developments
IV-1
U.S. International Transactions
Trade in Goods and Services
The U.S. international trade deficit widened to $58.2 billion in January after narrowing to
$57.9 billion in December. Exports rose sharply in both months, while imports dipped in
December before recovering in January.
In January, the value of exported goods and services increased 1.6 percent, following a
similar increase in December. The January gain reflected higher exports of both goods
and services. Within goods, exports of agricultural products and consumer goods
exhibited robust growth, while exports of industrial supplies increased at a more
moderate pace. In contrast, exports of capital goods fell sharply, led by a decline in
exports of aircraft, and exports of automotive products were flat.
The value of exports in the fourth quarter rose by 12.6 percent (a.r.), helped by robust
growth in December. Exports of services increased strongly in the quarter. The quarterly
increase was also supported by strong gains in exports of industrial supplies and capital
goods, which more than offset a fall in exports of automobiles and consumer goods.
According to the Preliminary NIPA release, real exports of goods and service increased at
an annual rate of 4.8 percent in the fourth quarter. This number is likely to be revised up
somewhat when recent revisions to the trade data are incorporated.

IV-2

IV-3
IV-4
The value of imported goods and services rose 1.3 percent in January, reversing a
similarly sized decline in December. Imports in January were importantly boosted by a
large increase in the value of oil imports, reflecting both an increase in price and a jump
in volumes. Non-oil imports recorded a steep decline, with imports of consumer goods
falling the most. Imports of industrial supplies and capital goods also fell back slightly,
whereas imports of services, foods, and automobiles all showed moderate gains.
In the fourth quarter the value of imported goods and services increased 12.6 percent
(a.r.), despite December‟s sharp decline. A large increase in the value of imported oil
resulting from higher oil prices significantly boosted import growth in the quarter.
Services imports also exhibited strong growth, while imports of non-oil goods fell back.
Imports of non-oil industrial supplies and automotive products declined sharply in the
quarter. In contrast, imports of consumer goods exhibited strong growth, while imports
of capital goods increased slightly. As reported in the Preliminary NIPA release, real
imports of goods and services declined at an annual rate of 1.9 percent in the fourth
quarter. As with exports, this figure will likely be revised up, reflecting recent data
revisions.
Prices of Internationally Traded Goods
Non-oil imports. In the first two months of 2008, core import prices rose sharply,
boosting their average level 7¼ percent (a.r.) above the fourth-quarter level. Most of this
increase was due to higher prices for material-intensive goods, which were up nearly
17 percent. Prices for nonfuel industrial supplies rose 17¼ percent, largely reflecting
sharply higher prices for imported chemicals. For imported food, the average level of
prices in the first two months was 15½ percent (a.r.) above the fourth-quarter average.
Over the same period, prices for finished goods increased 3 percent, with prices for
capital goods excluding computers and semiconductors, consumer goods, and automotive
products all rising at about that pace.
Oil. The BLS price index of imported oil rose 4.8 percent in January, and then fell
1.5 percent in February. The spot price of West Texas Intermediate (WTI) crude oil
averaged $92.95 per barrel in January. Since then, however, the spot price of WTI has
surged, rising 20 percent to $109.92 per barrel as of March 12. The price of futures for
delivery at the end of 2016 has also risen considerably, closing at $102.91 per barrel on
March 12, about $15 higher than at the time of the January Greenbook. The higher price
of oil likely owes to a confluence of factors, including increased geopolitical risk,
potentially stronger demand, and the recent fall in the value of the dollar.

IV-5

IV-6

IV-7
Exports. The average level of core export prices in the first two months of 2008 was
11¼ percent (a.r.) above the fourth-quarter level, as prices of material-intensive goods
soared 21 percent and prices of finished goods rose 3 percent. The large increase in
material-intensive goods reflected a 44½ percent increase in prices for agricultural
exports combined with a 14 percent increase in prices for nonagricultural industrial
supplies. Prices for agricultural exports have risen briskly so far this year because of
higher prices for wheat, corn, and soybeans, which all have recently reached record
highs. Prices for nonagricultural industrial supplies are up, mostly because of higher
prices for chemicals, fuels, and metals. Within finished goods, the category with the
largest increase was capital goods excluding computers and semiconductors, which rose
3¾ percent.
IV-8
U.S. International Financial Transactions
Since the last Greenbook, we have received data on U.S. international financial
transactions for December and January. The unusually weak foreign official inflows
during the third quarter of 2007 (line 1 of the Summary of U.S. International Financial
Transactions Table) were followed by record inflows during the fourth quarter, and for
the year as a whole, foreign official inflows were nearly as strong as in 2006.
. Official net purchases of U.S.
Treasuries accounted for only a little over 10 percent of total official inflows in 2007,
down sharply from 2006, with most of the acquisitions focused on agency securities,
corporate bonds, and stocks. In January 2008, foreign official flows registered a record
monthly inflow of $101 billion, with strong inflows in all types of U.S. securities. In
both December and January, sizable acquisitions of stocks and corporate bonds largely
reflected the well-publicized capital injections into U.S. financial firms from sovereign
wealth funds of China, South Korea, Singapore, and Middle East oil exporters. Partial
and confidential data on custody accounts at FRBNY indicate that foreign official inflows
likely moderated somewhat in February from January‟s very high level.
The chart on Foreign Official Financial Flows offers more perspective on these data.
Flows from G-10 and OPEC countries have fluctuated between small inflows and
outflows since 2006, with the trend being a fairly small net inflow. Inflows from other
countries have continued to account for the greater part of official inflows, and have
experienced significant volatility in the past few months.
Private foreign net purchases of U.S. securities (line 4 of the table and the top panels of
the chart on Private Securities Flows) for 2007 as a whole registered a 10 percent
increase from 2006, mainly because of very strong inflows during the first half of the
year. With the start of the financial market turmoil in the third quarter of 2007, however,
private foreign net purchases of U.S. securities fell sharply, with foreign net sales
recorded for agency bonds, corporate and municipal bonds (a category that also includes
asset-backed securities), and corporate stocks (lines 4b, 4c, and 4d of the table). Net
outflows in these categories were offset by increased purchases of U.S. Treasuries (line
4a), indicating a „flight to quality‟ in private foreign demand for U.S. securities. Private
purchases of corporate securities recovered somewhat in the fourth quarter, while
purchases of U.S. Treasuries rose even further. In January, foreign private purchases of
all security types were small.
IV-9
After recording strong outflows in the third quarter, U.S. net acquisitions of foreign
securities (line 5 of the table and bottom panel of the chart on Private Securities Flows)
contracted sharply in the fourth quarter of 2007. For the year as whole, U.S. net
acquisitions of bonds and stocks (lines 4a and 4b) were somewhat smaller than those
recorded in 2006. During December 2007 and January 2008, U.S. purchases of foreign
stocks were minimal. Total U.S. net purchases of foreign securities in January were
similar to the monthly average of 2007.
As is typical at a monthly frequency, flows recorded by the banking sector (line 3) were
volatile in 2007, with a net outflow of $75.8 billion for the year. In January 2008,
banking offices in the U.S. recorded modest outflows of $36.7 billion. Some of these
outflows may be linked to U.S. banks providing liquidity to European banks, particularly
via repurchase agreements.
Complete U.S. balance of payments data for the fourth quarter are not yet available.
However, some partial data have come in, including changes in bank-reported foreign
currency denominated claims and liabilities, as well as changes in U.S. investors‟
holdings of foreign short-term securities. These flows, which will be included in line 10,
indicate a further $100 billion in inflows during the fourth quarter in addition to the
nearly $300 billion in inflows recorded for lines 1-5, suggesting that the statistical
discrepancy will likely swing from positive $86 billion in the third quarter to a sizable
negative number in the fourth quarter.

IV-10

IV-11

IV-12
IV-13
Foreign Financial Markets
Market turmoil stepped up again in late February, in part as investor perceptions of the
near-term prospects for U.S. growth declined further. Less-downbeat economic data in
the other advanced economies and statements by some foreign officials warning of
inflationary pressures led investors to expect that the Federal Reserve‟s monetary policy
response would be more substantial than that of other major central banks. As a result,
the exchange value of the dollar dropped on net over the intermeeting period, with the
trade-weighted major currencies index falling 3¾ percent to a new post-Bretton Woods
low. The dollar depreciated 5 percent against the euro and 6 percent versus the yen over
the period. The dollar depreciated 2¼ percent against sterling and was little changed on
net versus the Canadian dollar.
The Bank of England and the Bank of Canada lowered their policy interest rates during
the intermeeting period, by 25 and 50 basis points respectively, while the European
Central Bank and the Bank of Japan left their policy rates unchanged. ECB President
Trichet, after the March 6 meeting of the Governing Council, again emphasized his
concerns about inflationary pressures. Similar concerns, driven in part by sharp increases
in the prices of many commodities over the period, led the Reserve Bank of Australia and
Sweden‟s Riksbank to increase their policy rates.
Conditions in interbank term money markets for dollar and sterling, which had improved
substantially in January, deteriorated again in late February, and spreads between Libor
and overnight index swap rates began to rise again. Although spreads in euro held fairly
steady through February, they also turned up in early March as lending conditions
continued to deteriorate. On March 11, as part of a set of coordinated actions by G-10
central banks designed to help calm term funding markets, the FOMC announced that it
would increase the size of its dollar swap lines with the ECB and the Swiss National
Bank, and the ECB and SNB announced they would resume their dollar auctions and
increase their size. Simultaneously, the Bank of England announced the continuation of
its three-month repo operations with an expanded list of acceptable collateral, and the
Bank of Canada announced that it would conduct two exceptional 28-day repo
operations. Following these announcements, the spread between dollar Libor and OIS
rates declined, but euro and sterling spreads showed little reaction.
In line with expectations of divergent monetary policies, two-year Treasury yields fell
about 80 basis points on net over the period, while German two-year yields declined only
20 basis points. Ten-year sovereign nominal yields declined about 30 basis points in

IV-14
Germany and 20 basis points in the United States. In European sovereign bond markets,
market liquidity has reportedly worsened since late February, and spreads between less
liquid Italian bonds and more liquid German bonds have widened about 25 basis points.
European corporate spreads have also moved up over the intermeeting period, although
by less than in the United States.
Amid growing concerns about the impact of the global financial turmoil and the pace of
U.S. economic activity, major headline equity indexes in Europe, Japan, and the United
States ended the period down 3 to 8 percent on net. Financial sector share prices
registered more substantial falls in most major industrial countries. Euro-area banking
share prices dropped about 10 percent on average, and Japanese banking share prices lost
almost 15 percent despite a report by Japan‟s FSA indicating that Japanese banks have
only a modest total exposure to U.S. subprime-based assets. Market analysts were
focused over the period on the releases of earnings reports by major European banks,
watching in particular for the amounts written down by the various institutions. The
picture was mixed, as some European banks, including UBS, Credit Suisse and Credit
Agricole reported larger-than-expected writedowns, but a number of others, including
HSBC, Deutsche Bank, and Barclays reported smaller-than-expected writedowns.
Latin American financial markets were relatively unaffected by the global financial
turmoil. The dollar was little changed against the Mexican peso and depreciated 5
percent versus the Brazilian real. Equity indexes in Mexico, Brazil, and Argentina rose 2
to 6 percent. Latin American dollar-denominated bond spreads widened slightly. In
emerging Asia, dollar exchange rates were mixed, as were movements in equity indexes;
Taiwanese, Korean, and Thai indexes rose, but indexes in China and Hong Kong
declined.
We received no reports of intervention purchases or sales by the central banks of major
industrial countries over the intermeeting period. The Desk did not intervene during the
period for the accounts of the System or the Treasury.

IV-15

IV-16

IV-17

IV-18

IV-19

IV-20
Developments in Advanced Foreign Economies
Real GDP growth slowed in the fourth quarter in the major advanced foreign economies.
The source of the slowdown varied substantially across economies. In the euro area,
GDP growth was pulled down by an outright fall in domestic demand. Domestic demand
also slowed in the United Kingdom. In contrast, Canadian domestic demand remained
very strong, but was offset by a steep decline in net exports.
Except in Canada, consumer price inflation has risen in these economies over the past
several months, pushed up by higher food and energy prices. In the euro area, inflation
pressures are particularly acute; overall inflation reached 3.2 percent in February, the
highest level since euro-area statistics were officially compiled in 1997. Core inflation in
Canada continued to moderate in January, reaching 1.5 percent.
Statements accompanying central bank meetings in March cited increased downside risks
to growth. The Bank of Canada cut its policy rate 50 basis points at its March meeting,
citing downside risks to growth emanating from the United States. The Bank of England
cut its policy rate 25 basis points in February. The European Central Bank and the Bank
of Japan left rates unchanged, indicating concerns over inflationary pressures outweighed
risks to growth.
According to the preliminary estimate, Japan's real GDP grew 3.5 percent (s.a.a.r) in the
fourth quarter, spurred by export growth and strong business fixed investment, which
bounced back following four quarters of decline. Net exports contributed 1.8 percentage
points to growth, despite a decline in exports to the United States. The revisions to the
Construction Standards Law implemented last summer continued to weigh on housing
investment, which subtracted about one percentage point from growth. However, the
Ministry of Finance corporate survey is at odds with the recent strength in business
investment, suggesting that the fall in capital investment that started earlier in 2007
accelerated in the fourth quarter, as private capital expenditure fell 7.7 percent from a
year earlier.

IV-21

IV-22
Recent economic indicators have been mixed. Industrial production and core capital
goods shipments fell in January. Consumer confidence also dropped in February to its
lowest level in almost five years. However, consumption indicators remain healthy, with
strong increases in January retail sales and household spending. Real exports also rose in
the first month of this year, boosted by strong demand from Asia and the Europe.
The labor market continued to be tight, with the unemployment rate unchanged at
3.8 percent in January. However, the job offers-to-applicants ratio (the number of
officially posted job openings relative to the number of officially registered job seekers)
remained at 0.98, its lowest level in two years, indicating that employment may soften.
Total cash earnings (which include bonuses) grew 1 percent in January from a year
earlier, following 13 months of declines.
The nationwide headline consumer price index (excluding only fresh food) rose
0.7 percent in January from a year earlier. However, the rise in the index was the result
of an increase in oil prices; consumer prices excluding fresh food and energy fell 0.1
percent.

IV-23

IV-24
Euro-area real GDP growth slowed to 1.5 percent in the fourth quarter. Total domestic
demand fell 0.1 percent as private consumption contracted and investment growth
slowed. Net exports contributed 1.7 percentage points to growth, although this largely
reflects a decline in imports. The fourth-quarter slowdown in euro-area growth was
driven by slowing growth in both Germany and France, which together account for
around 50 percent of euro-area GDP.
Recent survey-based indicators point to a further slowing of growth in the first quarter.
The European Commission survey of euro-area economic sentiment fell in February for
the ninth consecutive month, with declines in confidence widespread across the
industrial, consumer, and construction sectors. Germany‟s IFO business climate index,
although remaining at a low level, unexpectedly rose in February, as firms took a slightly
less gloomy view of current conditions.

IV-25

IV-26
The final reading on the euro-area services PMI for January declined about 3 points to
50.6 before bouncing back to 52.3 in February. The manufacturing PMI has been about
unchanged over the past three months after recovering from a sharp drop in October.
Retail sales and industrial production improved in January.
According to the preliminary estimate, headline inflation was 3.2 percent in February,
unchanged from January and its highest level since euro-area statistics began in 1997.
Recent headline inflation has been boosted by rising energy and food prices. January
core inflation (excluding energy and unprocessed food) was a more modest 2.3 percent.
In the United Kingdom, real GDP growth moderated to 2.3 percent (s.a.a.r.) in the fourth
quarter. Domestic demand weakened noticeably as private consumption rose and
investment contracted. Net exports made a positive contribution to GDP growth, as
imports fell more than exports. Inventories and government consumption also made
positive contributions.
Recent data on mortgage lending are consistent with a sharp reduction in new loan
origination. Net mortgage lending fell 25 percent in the twelve months to January, while
the number of mortgages approved for house purchases tumbled 39 percent. In contrast,
mortgage refinancing posted double-digit gains over the same period. Twelve-month
house price appreciation has slowed from double digit gains last summer to around
2 percent in February.

IV-27
Consumer confidence slid to a five-year low in February as households were increasingly
pessimistic about the general economic situation. In contrast, business confidence rose in
January after reaching a two-year low a month earlier. The PMI for services rose to 54.1
in February as firms reported an increase in outstanding business and were more
optimistic about future business.
The labor market remains robust, with wages up and unemployment remaining low in
January. The number of people claiming unemployment benefits fell for a sixteenth
consecutive month in January, and the number of vacancies remained at its highest level
since 2001.
The twelve-month rate of headline inflation ticked up to 2.2 percent in January.
Excluding energy, food, and alcoholic beverages, inflation slowed 0.1 percentage points
to 1.3 percent.

IV-28

IV-29
In Canada, real GDP growth slowed sharply in the fourth quarter, with most of the
weakness appearing late in the quarter. Net exports subtracted from growth as exports
fell and imports rose. Final domestic demand accelerated, as private and government
consumption soared. Growth in private consumption was especially impressive as it
occurred before a January reduction in the retail sales tax. Inventory accumulation made
only a modest contribution in the fourth quarter following an outsized gain in the third.
Investment growth was solid.
Employment increased substantially in both January and February, 0.3 percent in each
month. In contrast to the pattern seen throughout 2007, employment growth was
concentrated in the private sector. Consistent with the gains in employment wages have
increased at record rates, near 4.9 percent on a twelve-month basis.
The twelve-month rate of consumer price inflation fell 0.2 percentage points to
2.2 percent in January. Inflation has been supported by rising gasoline prices and
increases in mortgage interest costs. Core inflation, which excludes the eight most
volatile components and the effects of changes in indirect taxes, slowed further in
January, reaching 1.4 percent. The twelve-month growth rate of average hourly wages
jumped sharply in December, reaching an impressive 4.9 percent.
The Bank of Canada lowered its policy rate by 75 basis points over the quarter; a 25 basis
point reduction in January was followed by a 50 basis point reduction in March. The
BOC cited concerns over downside risks to its outlook driven by a likely further slowing

IV-30
of activity in the United States. The BOC indicated that further stimulus “is likely to be
required in the near term.”
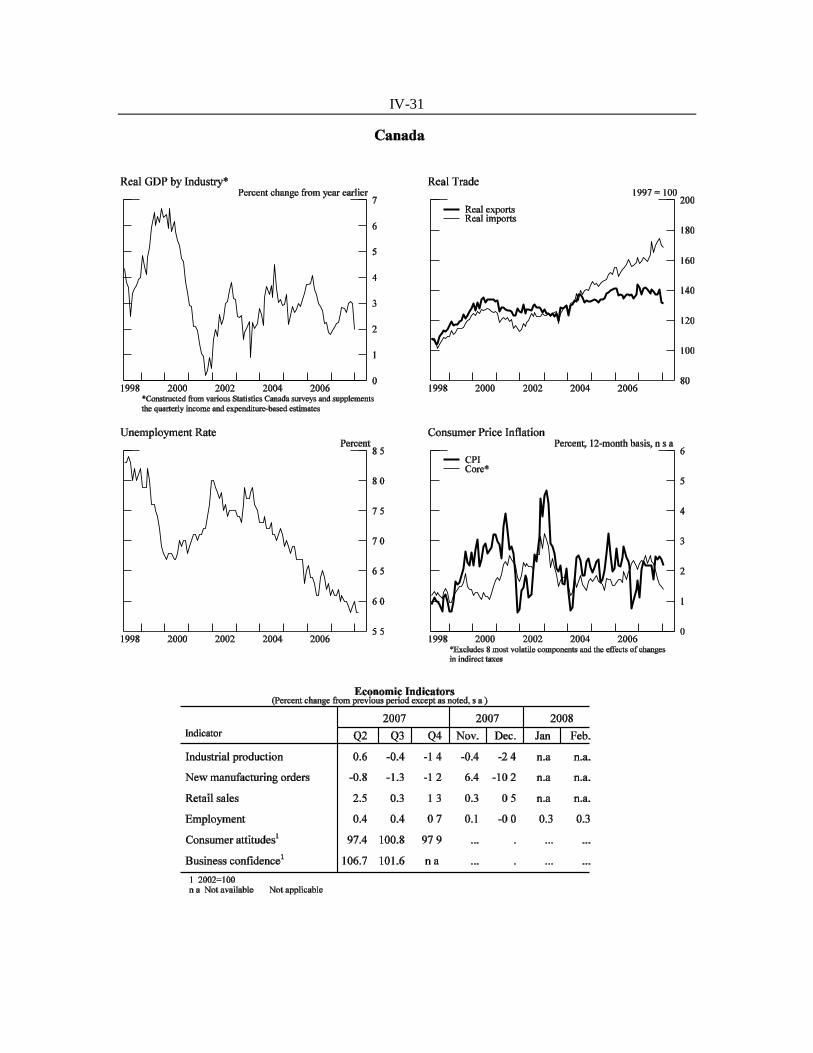
IV-31
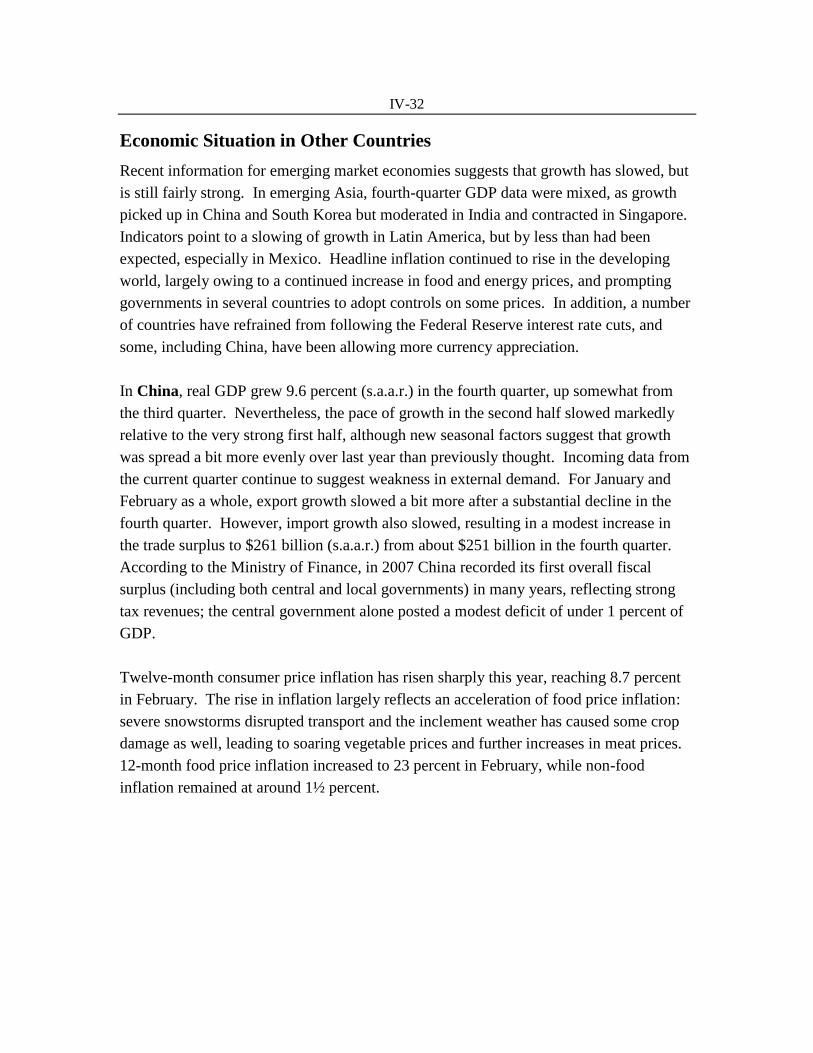
IV-32
Economic Situation in Other Countries
Recent information for emerging market economies suggests that growth has slowed, but
is still fairly strong. In emerging Asia, fourth-quarter GDP data were mixed, as growth
picked up in China and South Korea but moderated in India and contracted in Singapore.
Indicators point to a slowing of growth in Latin America, but by less than had been
expected, especially in Mexico. Headline inflation continued to rise in the developing
world, largely owing to a continued increase in food and energy prices, and prompting
governments in several countries to adopt controls on some prices. In addition, a number
of countries have refrained from following the Federal Reserve interest rate cuts, and
some, including China, have been allowing more currency appreciation.
In China, real GDP grew 9.6 percent (s.a.a.r.) in the fourth quarter, up somewhat from
the third quarter. Nevertheless, the pace of growth in the second half slowed markedly
relative to the very strong first half, although new seasonal factors suggest that growth
was spread a bit more evenly over last year than previously thought. Incoming data from
the current quarter continue to suggest weakness in external demand. For January and
February as a whole, export growth slowed a bit more after a substantial decline in the
fourth quarter. However, import growth also slowed, resulting in a modest increase in
the trade surplus to $261 billion (s.a.a.r.) from about $251 billion in the fourth quarter.
According to the Ministry of Finance, in 2007 China recorded its first overall fiscal
surplus (including both central and local governments) in many years, reflecting strong
tax revenues; the central government alone posted a modest deficit of under 1 percent of
GDP.
Twelve-month consumer price inflation has risen sharply this year, reaching 8.7 percent
in February. The rise in inflation largely reflects an acceleration of food price inflation:
severe snowstorms disrupted transport and the inclement weather has caused some crop
damage as well, leading to soaring vegetable prices and further increases in meat prices.
12-month food price inflation increased to 23 percent in February, while non-food
inflation remained at around 1½ percent.

IV-33
Recent indicators for India show a moderation of activity. Fourth-quarter GDP
moderated significantly, after a marked increase in the third quarter. Industrial
production rebounded in December from the previous month, although growth in mining
and energy production slowed significantly. The trade deficit widened sharply in
January, as soaring imports swamped a slight increase in exports. Both consumer and
wholesale price inflation held roughly steady in January. However, more recent weekly
data for the wholesale price index indicate a renewed increase in inflation in February, in
part driven by higher prices for some food products and cotton. In addition, the
government increased the ceiling on state-controlled fuel prices by 5 percent on
February 14.
Leading up to the start of the new fiscal year in April, the government announced its
proposed 2008-09 budget in late February. Expenditure is heavily loaded toward
education, health, and infrastructure, and agriculture. The government projects a 2008-09
fiscal deficit of 2½ percent of GDP, but analysts remain skeptical, pointing to the
significant off-budget spending (possibly exceeding 2 percent of GDP). In February, the
government also took steps to allow greater capital outflow, giving firms the option of
issuing foreign-currency exchangeable bonds to fund operations abroad.

IV-34
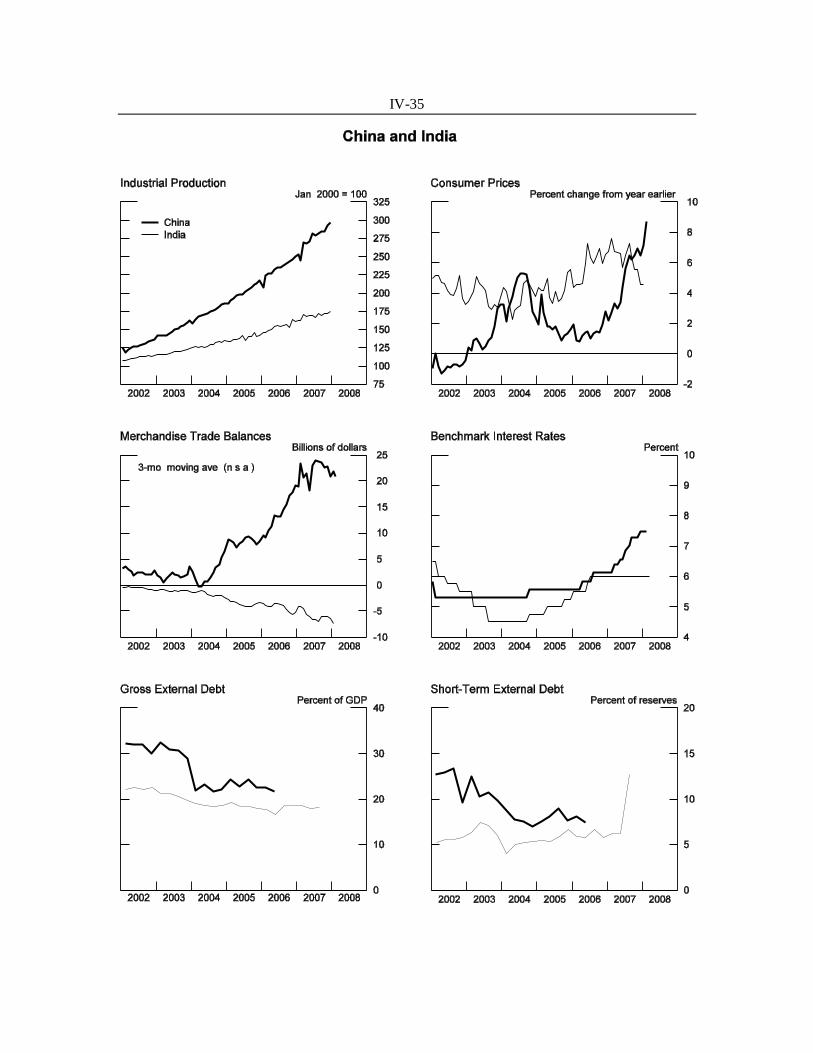
IV-35

IV-36
In the NIEs1, fourth-quarter economic performance was mixed, as real GDP growth was
strong in South Korea and Hong Kong, but moderated in Taiwan, and was negative in
Singapore. Contributions of external demand to growth generally weakened. In
Singapore, the contraction resulted primarily from a sharp decline in activity in the
volatile biomedical sector. In January, industrial production rebounded in Taiwan,
Singapore and South Korea. Across the region, exports have generally risen in the
current quarter, but except in Singapore these gains have been largely offset by strong
imports, resulting in lower trade balances.
Except in Singapore, twelve-month consumer price inflation stabilized in most recent
months across the NIEs, but inflationary pressures remain. Food price inflation has
retreated from previous peaks in South Korea and Taiwan, as the earlier effects of
adverse weather have faded. In Singapore, inflation picked up, owing mainly to a one-off
technical revision in the measurement of accommodation costs. Amid inflationary
pressures, the central bank of Taiwan allowed the local currency to appreciate at a more
rapid pace, while South Korea announced some anti-inflationary measures, including a
10 percent reduction in the tax on gasoline and other oil products and a freeze of public
services and transportation fees. On February 1, Taiwan decided to extend for another
six months a measure enacted last year to keep lower tariff rates on several farm
products.
1 Newly-industrialized economies: Hong Kong, South Korea, Singapore, and Taiwan
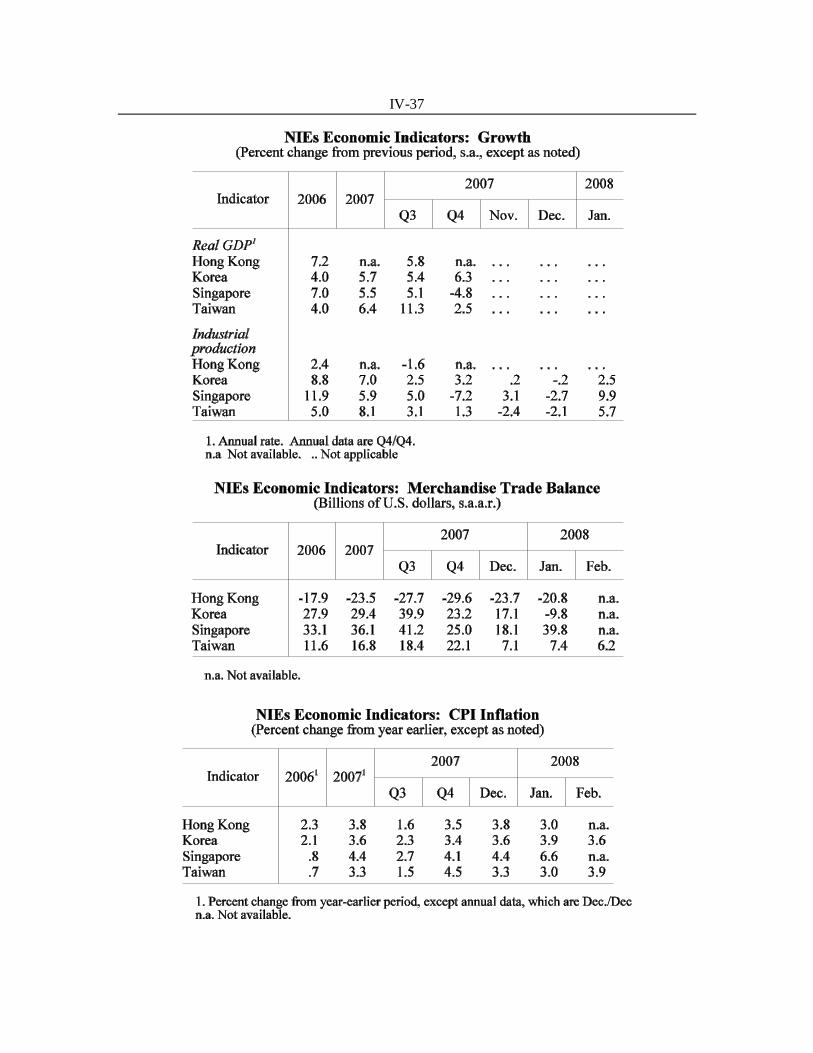
IV-37

IV-38

IV-39
Data from the ASEAN-4 region indicate that economic growth slowed in Indonesia and
Malaysia but picked up in the Philippines and Thailand in the fourth quarter. Despite
weakening demand in Europe and the United States, economic indicators have generally
remained robust in the first quarter of 2008, as a result of strengthening domestic
consumption and increased regional trade. Industrial production, on average, picked up
due to inventory buildup in Malaysia and expansion in the electronics industry in the
Philippines and Thailand.
Across the region, increased food and energy prices continued to push consumer price
inflation higher, prompting governments to adopt new measures to control inflation. On
February 1, the Indonesian government introduced progressive export taxes on palm oil,
and subsidies for prices of soybeans, in addition to the already in-effect subsidies on fuel
and rice prices. The Philippines‟ Central Bank lowered interest rates ¼-percentage point
in January. In other countries, policy rates were kept on hold to contain inflationary
pressures, despite increasing interest rate differentials vis-à-vis the U.S. policy rate. On
February 13, Malaysian Prime Minister Badawi announced the dissolution of parliament.
The new elections were held on March 8. The ruling Barisan Nasional (BN) coalition
won 63 percent of parliamentary seats, down from its previous 90 percent, and falling
short of a two-thirds majority. Abdullah Badawi will continue as Prime Minister.
Although BN maintained a simple majority, the results are interpreted by political
analysts as a setback for BN and a vote against the government‟s recent handling of such
sensitive issues as racial tension and inflation. On March 3, Thailand‟s central bank
eliminated capital control measures instituted in 2006 during the military junta rule.

IV-40

IV-41

IV-42
Real GDP for Mexico increased 3 percent (a.r.) in the fourth quarter, more than most
analysts had anticipated. The increase was largely driven by the services sector, while
manufacturing continued to show signs of moderation. The Mexican government met its
fiscal target of a balanced budget in 2007, as rising oil and non-oil revenues supported an
increase in government expenditures. Headline inflation ticked down to 3.7 percent in
January, below the upper limit of the central bank‟s target range. However, core inflation
readings continue to be elevated, with large increases in the housing sector price index.
In Brazil, real GDP growth remained strong in the fourth quarter. January industrial
production partially rebounded from its dip in December, bringing twelve-month growth
to 7¾ percent. Strong domestic demand also continued to fuel rapid import growth,
leading to a further narrowing of the trade surplus in January. Twelve-month inflation
through January remained high at 5 percent, boosted by food prices. With capacity
utilization rates still high and inflationary pressures from food and energy prices still a
concern, at its March 6 monetary policy meeting the central bank unanimously voted to
keep the target for the overnight interest rate, the Selic rate, at 11¼ percent. The target
has remained at that level since last September.

IV-43
External and domestic factors continue to support growth in Argentina. The increase in
agricultural commodity prices has provided strong stimulus to agricultural production and
exports. The overall trade surplus increased further in the fourth quarter. Domestic
demand remains strong, primarily consumption and residential investment. Consumer
price inflation moderated to a still-elevated rate of 8.2 percent in January. The figure
reported by the national statistical office, though, was once again below market
expectations. Allegations that the authorities understate the rate of inflation continue.

IV-44
Real GDP for Venezuela increased 16 percent (s.a.a.r.) in the fourth quarter. Quarterly
growth estimates should be viewed with great caution, however, and growth slowed last
year on a four-quarter basis to about 8½ percent. Petroleum output was down by over
4 percent, reflecting managerial problems at the government-owned PDVSA and the
hostile environment for foreign investors. In early February, a UK court issued an
injunction that freezes up to $12 billion in PDVSA assets held abroad until the
Venezuelan government reaches a settlement with Exxon Mobil for last year‟s
government takeovers of energy projects. Chavez reacted to the move by halting
shipments to Exxon Mobil. Inflation reached 24 percent in January on a twelve-month
basis.
Despite the high price of oil, the current account surplus narrowed $7.1 billion in 2007, as
import growth was very strong, fueled by loose macro policies and the below-market
official exchange rate.

IV-45

IV-46
In Turkey, third-quarter real GDP contracted due to significant cuts in government
spending and a drop in exports. Incoming data suggest that growth rebounded in the
fourth quarter. Average industrial production for the fourth quarter was up 3.7 percent.
Twelve-month consumer price inflation has continued to be hoisted by food and energy
prices in recent months, reaching 9.1 percent in February, significantly higher than the
upper limit of the central bank‟s year-end target of 4 percent +/- 2 percentage points.
Nonetheless, having loosened policy for six consecutive months, in February, the
Monetary Policy Committee further cut the borrowing and lending rates 25 basis points
to 15¼ percent and to 19¼ percent, respectively. The Monetary Policy Committee
indicated that the lagged effects of previous monetary tightening coupled with weak
aggregate demand will continue to support disinflation in the medium term.
Last Page of Part 2