fomc 20010320 g bpt 120010314
TRANSCRIPT

Prefatory Note
The attached document represents the most complete and accurate version available based on original copies culled from the files of the FOMC Secretariat at the Board of Governors of the Federal Reserve System. This electronic document was created through a comprehensive digitization process which included identifying the best-preserved paper copies, scanning those copies,1 and then making the scanned versions text-searchable.2 Though a stringent quality assurance process was employed, some imperfections may remain.
Please note that this document may contain occasional gaps in the text. These gaps are the result of a redaction process that removed information obtained on a confidential basis. All redacted passages are exempt from disclosure under applicable provisions of the Freedom of Information Act.
1 In some cases, original copies needed to be photocopied before being scanned into electronic format. All scanned images were deskewed (to remove the effects of printer- and scanner-introduced tilting) and lightly cleaned (to remove dark spots caused by staple holes, hole punches, and other blemishes caused after initial printing). 2 A two-step process was used. An advanced optimal character recognition computer program (OCR) first created electronic text from the document image. Where the OCR results were inconclusive, staff checked and corrected the text as necessary. Please note that the numbers and text in charts and tables were not reliably recognized by the OCR process and were not checked or corrected by staff.

Confidential (FR) Class II FOMC
Part 1 March 14, 2001
CURRENT ECONOMICAND FINANCIAL CONDITIONS
Summary and Outlook
Prepared for the Federal Open Market Committeeby the staff of the Board of Governors of the Federal Reserve System

Confidential (FR) Class II FOMC
March 14, 2001
Summary and Outlook
Prepared for the Federal Open Market Committeeby the staff of the Board of Governors of the Federal Reserve System

Domestic Developments
The information received since the last meeting of the FOMC suggests thateconomic activity has been expanding only very slowly of late but has not slidbackwards. Real GDP now is estimated to have increased at an annual rate ofabout 1 percent in the fourth quarter, and our best guess is that it rose at asimilar pace in the first quarter. Businesses have been working to correctinventory imbalances, and this has led to sizable declines in manufacturingoutput. Thus far, however, spillovers to income and demand more broadly havebeen limited. Despite a plunge in sentiment, households have maintained theirspending, albeit at a slower pace than in the second half of last year. Moreover,homebuilding has picked up, and business outlays on plant and equipment heldup reasonably well early this year.
Despite the considerable drop in the federal funds rate since the turn of the year,financial conditions have not eased appreciably, if at all. It is true that corporatebond yields and mortgage rates have declined since year-end. However, broadequity indexes have continued to slump despite the lower interest rates, beatendown by bad news about corporate earnings and by increased uncertainty.Given our outlook for the economy, corporate earnings are likely to remaindisappointing for a while, and we are projecting the Wilshire 5000 to move a bitlower in the period ahead. Although U.S. equity markets have weakened anddomestic interest rates have moved down, the exchange value of the dollar hasstrengthened further.
Though there is no evidence of a widespread "credit crunch," financing forbusinesses continues to be relatively tight. Conditions in the commercial papermarket are still inhospitable for lower-tier firms and even for stronger firmsviewed as susceptible to a rating downgrade. Banks report that they havecontinued to tighten both their standards for making business loans and theterms on the loans they do make. In longer-term credit markets, investment-grade issues continue to be well received, but funding for speculative-gradefirms remains costly, even with the decline in rates this year, and investors arewary of financing smaller, lesser-known companies. Public equity issuance hasbeen light, and venture capital financing is reported to have been scaled back,with the bulk of the funds directed mainly to follow-on investments rather thanto riskier start-ups.
Economic conditions abroad appear to be somewhat weaker than we thought atthe time of the January Greenbook. We have cut our estimate of foreign outputgrowth in the second half of 2000 about 1/4 percentage point, and we havetrimmed the near-term outlook as well. In part, this reassessment reflects thefact that the slowdown in the United States and the global high-tech correctionnow appear to have damped foreign economic activity more than we hadpreviously thought.

Part 1 Summary and Outlook, March 14, 2001
The forecast assumes another 50-basis-point reduction in the federal funds ratein the near term--bringing the change vis-à-vis the January Greenbook to 75basis points. By our estimates, this lower level of short-term interest ratesessentially offsets the implications for economic activity of the more negativeassumptions about the stock market, exchange rate, and foreign activity. As aresult, our projection calls for real GDP to increase at an annual rate of about1-1/4 percent in the second quarter before gradually strengthening to a 3-3/4percent rate in 2002--about the same as in the January Greenbook. We continueto expect the inventory adjustment in the manufacturing sector and the shakeoutin high-tech industries to largely play out over the first half of this year. Follow-on effects on business and household spending may still be evident as we movethrough midyear, but those effects should diminish as the year progresses.Given our estimate of a still-high rate of return on new investment, capitalspending picks up somewhat in the second half of this year, and consumerspending firms after a weak second quarter, in part because of a step-up inincome growth.
We view the current economic environment as fragile, with the economyvulnerable to adverse shocks. Alternative model simulations later in this sectionexplore the implications for economic activity and inflation of a morepronounced, but temporary, slowdown in high-tech investment, a lower rate oftechnical progress, and a sustained loss of consumer confidence. We alsoconsider the possibility that some of the more positive spending indicators oflate may be signaling greater underlying strength in the economy than we haveassumed in the baseline projection.
Key Background FactorsLong-term corporate bond yields have fallen since the January FOMC meeting.We expect them to inch up over the projection period on our view that the bondmarket will be surprised by the absence of any additional monetary easingbeyond the first quarter. With earnings reports expected to continue to bedisappointing, equity prices are assumed to decline a bit further in the secondquarter to a level nearly 10 percent below that in the January Greenbook but toremain flat thereafter.
On the fiscal front, we have adjusted our assumptions to reflect the budgetdevelopments of the past two months. The key change affecting fiscal 2001 isthe addition of a small retroactive feature to our assumed tax cut. This results inlower withholding rates beginning this July and is estimated to reduce the fiscal2001 surplus by $10 billion. We have also reshaped the composition of ourassumptions for fiscal 2002 to be more consistent with the President's budgetblueprint and the apparent priorities of the Congress. Specifically, we havetrimmed the size of the assumed tax cut in 2002 by $10 billion (from $50 billionto $40 billion) while adding a similar amount to discretionary spending. The

Domestic Developments I-3
latter adjustment leaves our current projection of discretionary spending a bitabove the level proposed by the Administration, but congressional leaders havealready warned that appropriations are likely to exceed the amounts requestedby the President. In addition, we have made some technical adjustments to ourcurrent-services estimates of spending and revenues to reflect the information inthe new projections from the Administration and the Congressional BudgetOffice. All in all, we now expect the total unified budget to run surpluses of$256 billion in fiscal 2001 and $242 billion in fiscal 2002. The projected on-budget surpluses, which exclude social security and the Postal Service, are$95 billion and $66 billion respectively.
As noted, foreign economic activity in the second half of last year was weakerthan we had anticipated, and we have trimmed a bit from our projection for thefirst half of this year. But we still expect growth of foreign real GDP to pick upin the second half and to average about 3 percent in 2001 and 3-3/4 percent in2002. The dollar has risen, on balance, against the currencies of a broad groupof our trading partners over the intermeeting period; we still assume it willdecline in real terms between now and the end of 2002, but from a higher leveland at a slower pace than in the January Greenbook. As a result, the broad realmeasure of the dollar is 4 percent higher at the end of the forecast period than inthe last Greenbook.
The spot price of West Texas intermediate crude oil has eased somewhat, onnet, in recent weeks and is currently running just below $28 per barrel. We haveraised our projection for coming quarters slightly on the assumption that OPECwill make some modest cuts in production when it meets later this week. Butworld oil supplies over the projection period should still be sufficient both tomeet consumption and to allow for a gradual rise in stocks. Consistent withrecent quotes in the futures markets, we expect the spot price of WTI to edgedown to about $27.50 per barrel by the fourth quarter of this year and then tofall to $24.50 by the fourth quarter of 2002.
Recent Developments and the Near-term OutlookWe now project that real GDP is increasing at an annual rate of 0.8 percent inthe current quarter, compared with the projected decline of 0.5 percent in theJanuary Greenbook. Final sales appear to be rising faster than we hadanticipated, as stronger-than-expected spending for consumption and housingmore than offsets weaker-than-expected net exports. In addition, a largerportion of the necessary inventory adjustment appears to have occurred in thefourth quarter of last year; hence, the drag from reduced inventory investment inthe current quarter is likely to be smaller. Our projected increase in real GDP isless than a literal reading of the labor market results for January and Februarywould imply, but it seems balanced in light of other indicators of spending andproduction, especially the steep 5 percent (annual rate) decline expected in

Part 1 Summary and Outlook, March 14, 2001
Summary of the Near-Term Outlook(Percent change at annual rate except as noted)
2001:Q1 2001:Q2
Measure Jan. Mar. Jan. Mar.GB GB GB GB
Real GDP -.5 .8 1.3 1.3Private domestic final purchases 1.5 3.2 1.3 .7
Personal consumption expenditures 1.4 2.3 1.1 .6Residential investment -2.1 7.9 -.0 5.2Business fixed investment 3.0 6.3 2.6 .2
Government outlays for consumptionand investment 2.3 2.6 3.1 3.1
Contribution to growth,percentage points
Inventory investment -2.6 -2.1 -.0 .5Net exports .4 -.3 -.3 -.4
manufacturing IP this quarter. At this stage, we have little reason to alter ourprojection for real GDP growth in the second quarter, and it remains around1-1/4 percent.
Roughly one-third of the upward revision to GDP in the current quarter reflectsdevelopments in the motor vehicle sector, where sales have been running muchhigher than we had anticipated. The additional sales stem importantly fromanother round of incentives and from the moving forward of some fleet salesfrom later in the year. But, still, they lessen the production cuts that wouldotherwise have been required this quarter to bring bloated inventories undercontrol. We now expect assemblies to fall from about 11-1/2 million units(annual rate) in the fourth quarter to about 10-1/2 million units this quarter; thedecline is about 1/2 million units smaller than we had anticipated in January, butit still shaves about 1 percentage point from real GDP growth. The automakers'latest schedules call for assemblies to rise to 12 million units in the secondquarter; however, given the likelihood that inventories (especially of lighttrucks) will still be high at the end of the current quarter, we are anticipating amuch smaller increase--to 11 million units, which would be a small plus for nextquarter's GDP.
Although inventory investment outside motor vehicles turned out to besubstantially lower in the fourth quarter than we had anticipated, overhangs stillwere sizable at the turn of the year in a number of industries, including sometypes of equipment, metals, lumber, and chemicals. Thus, with businesses

Domestic Developments
apparently continuing to adjust production to work off undesired stocks, we areprojecting a further downshift in the pace of stockbuilding that cuts about3/4 percentage point from real GDP growth in the first quarter and about1/2 percentage point in the second quarter.
Consumer spending appears to be faring a little better than we had anticipated,and we have raised our projection for consumption growth this quarter to about2-1/4 percent, about 1 percentage point above that in the January Greenbook. Inaddition to the stronger light vehicle sales, outlays on non-auto goods now seemlikely to post a moderate increase this quarter. But outlays for services inJanuary were only slightly above the fourth-quarter level, in part because of asharp weather-related decline in energy services, and we anticipate only amodest increase over the quarter as a whole. Given the plunge in sentiment inthe past couple of months, we expect consumption growth to soften noticeablyin the second quarter--although not so much as might be predicted based onsentiment alone.
Fleet sales of motor vehicles are helping to buoy investment in equipment andsoftware (E&S), which is now expected to rise at an annual rate of about4 percent this quarter, after having declined nearly 4 percent in the fourthquarter. We also anticipate a decent--albeit unspectacular--increase in realspending on computers, after taking into account the sharp drop in computerprices in January. At the same time, the incoming orders and shipments datapoint to little change this quarter in real outlays for either communicationsequipment or for industrial and other equipment. We expect real E&S outlays toedge down in the second quarter, given the reports of weak demand for high-tech equipment and the likelihood that this quarter's spurt in motor vehiclepurchases will be reversed.
Construction activity remains remarkably robust. Boosted by the declines inmortgage rates, single-family housing starts have been trending up since lastsummer, and in January, they reached 1.34 million units (annual rate), thehighest level in a year. Given the corroborating strength in permits and the briskpace of home sales, we expect starts to remain around this level in February andMarch. Real residential investment, as estimated by the BEA, is likely to postsolid increases in both the first and the second quarters as the uptrend in startsfeeds through to construction. Outlays for nonresidential construction also havebeen exceptionally strong of late, with the level of construction-put-in-place inJanuary more than 6 percent (not at an annual rate) above the fourth-quarteraverage.
In the government sector, real federal expenditures on consumption and grossinvestment are projected to post a small increase this quarter. Nondefensepurchases are expected to rebound after having been depressed in the fourth

I-6 Part 1 Summary and Outlook, March 14, 2001
quarter by sales from the Strategic Petroleum Reserve, while defense spendingis likely to be about unchanged. Meanwhile, the incoming data on employmentand construction point to a solid advance in state and local expenditures.
We expect real net exports to exert a small arithmetic drag on output growth thisquarter, after having been a larger negative in 2000. Data beyond December aresparse, but we anticipate only small changes in the volumes of exports andimports in the current quarter.
On the inflation front, we project that the chain price index for personalconsumption expenditures will rise at an annual rate of about 2-3/4 percent inthe current quarter. Overall energy prices are likely to be up substantially again,primarily because of a surge in natural gas prices around the turn of the year. Inaddition, we now expect PCE prices excluding food and energy to rise at anannual rate of about 2-1/2 percent, 1/2 percentage point above the projection inthe January Greenbook; the revision reflects both the slightly bigger thanexpected increase in the core CPI in January and higher BEA estimates forprices of PCE components for which no market information is available. As forwages, average hourly earnings rose 0.3 percent per month, on average, inJanuary and February and are projected to rise at an annual rate of about4 percent in the first quarter, the same as the increase posted over the fourquarters of last year.
The Longer-term Outlook for the EconomyWe have not greatly revised our assessment of the longer-run outlook foreconomic activity. As indicated in the overview, we are assuming more easingof monetary policy than we did last time; we have also added a little fiscalstimulus this year. But these policy changes only about offset the negativeeffects on activity of the lower path for the stock market, the higher path for theexchange value of the U.S. dollar, and weaker economic activity abroad.
Household spending. Growth in consumer spending is expected to pick up alittle in the second half of this year and to revive further in 2002. Theimprovement is expected to be modest because concerns about employmentprospects undoubtedly will continue to weigh on households for a while longerand wealth effects will exert significant restraint on spending throughout theprojection period. In addition, we are likely to see some payback later this yearfor the strong purchases of light vehicles in recent months. More generally,households may trim their spending on durable goods following the rapidincreases over the past few years. On the other hand, real income growth shouldbe reasonably well maintained this year, given the declines in energy prices andthe assumed tax cut, and pick up with the renewal of payroll gains as we moveinto 2002. Moreover, the longer-run prospects for productivity and incomeremain very favorable in our forecast. All in all, we expect real PCE growth to

Domestic Developments
Projections of Real GDP(Percent change from end of preceding period except as noted)
2000 2001Measure I 2002
HI H2 H1 H2
Real GDP
Previous
Final salesPrevious
PCEPrevious
Residential investmentPrevious
BFIPrevious
Government purchasesPrevious
ExportsPrevious
ImportsPrevious
Inventory changePrevious
Net exportsPrevious
5.2
5.2
5.35.3
5.35.3
2.22.2
17.717.7
1.81.8
10.210.2
15.215.2
-0.0-0.0
-1.0-1.0
1.1
0.4
1.91.7
1.51.2
6.5-1.1
3.2 4.52.8 6.1
2.9 3.32.7 3.1
0.9 7.12.8 9.3
Contribution to growth,percentage points
-0.4 -0.8 0.3-0.0 -1.3 0.3
-0.7-0.7
-0.3 -0.10.1 0.1
average about 2-1/4 percent in the second half of 2001 and about 2-3/4 percentin 2002. Consistent with a negative wealth effect, we project the personalsaving rate to climb about 1-1/2 percentage points on an annual-average basisbetween 2000 and 2002.
We have strengthened the forecast for housing activity, as the effects of the verypositive incoming data on our assessment of demand and the reduction inmortgage rates more than offset the restraint from lower levels of wealth. Alltold, we now expect single-family starts to rise from 1.27 million units in 2000

Part 1 Summary and Outlook, March 14,.2001
to 1.33 million units in 2001 and 1.36 million units in 2002. Multifamily startsare projected to total 310,000 units in both 2001 and 2002.
Business investment in equipment and software. We have tempered ourexpectations regarding the outlook for E&S spending over the next few quartersand now expect real outlays to rise less than 3 percent over 2001 as a whole--thesmallest increase in a decade. The revision is centered in the high-tech sector,where the retrenchment now seems likely to be deeper and to last longer thanwe had anticipated. That said, our baseline projection assumes that the returnsto investing in high-tech capital remain sizable, and thus, once the currentshakeout is behind us, high-tech investment spending should again rise rapidly.Outlays for other types of equipment also are likely to remain soft over the nextfew quarters, but they, too, pick up next year as overall output growth firms. Asa result, we expect overall E&S growth to return to a double-digit pace in 2002.
Nonresidential construction. Outlays for nonresidential construction got off toa strong start this year, but we anticipate some moderation in growth in comingquarters. The recent data on space rents, vacancy rates, and property valuessuggest that the sector is in good shape overall, and although lenders may beturning a bit more cautious, funding for projects generally remains available.Office construction should be well maintained through 2002. But othercommercial building is likely to be restrained by the softness in consumerspending and the financial difficulties of some retailers. Construction of newindustrial buildings will probably turn sluggish as well given the emergingexcess capacity in the manufacturing sector.
Inventory investment. Inventory investment has slowed dramatically in recentquarters, and we expect it to remain low through the end of this year asbusinesses continue to adjust their stocks to the more subdued pace of salesgrowth. Stockbuilding is expected to pick up in 2002 as sales prospectsimprove, but with businesses remaining focused on tight inventory control, weexpect investment to be held to levels that are consistent with a resumption ofthe downward trend in the inventory-sales ratio.
Government spending. We now expect real federal expenditures forconsumption and investment to increase about 2-1/2 percent over the fourquarters of 2001 and 3-1/2 percent in 2002. Consistent with the changes to ourfiscal policy assumptions, the projection is somewhat above that in the JanuaryGreenbook, with bigger increases in both the defense and the nondefensecategories.
Although the number of state and local governments reporting fiscal strains hasrisen, the sector still seems to be in reasonably good shape overall, and revenues

Domestic Developments I-9
over the next two years should be sufficient to fund moderate increases inspending. Thus we continue to project state and local purchases to rise about3-1/2 percent per year over 2001 and 2002, about the same as the averageincrease over the past three years.
Net exports. We expect the demand for U.S. exports, after some weakness inthe near term, to return to relatively robust rates of growth over the remainder ofthe forecast period. This pattern reflects the near-term slowing and subsequentrebound of foreign output and a boost from the projected depreciation of thedollar. But imports also are projected to pick up, largely reflecting theacceleration of domestic demand. On balance, we now expect the arithmeticnegative contribution to real GDP growth from the external sector to beabout 1/4 percentage point in 2001 and 2002, in contrast to the roughly neutralinfluence projected in the January Greenbook. (The International Developmentssection provides a more detailed discussion of the outlook for the externalsector.)
Aggregate Supply, the Labor Market, and the Prospects for InflationWe estimate that the pace of capital accumulation implied by our currentforecast of business investment is consistent with structural productivity rising3.1 percent in 2001 and 3.0 percent in 2002. Accordingly, growth in potentialGDP is expected to be 4.2 percent this year and 4.1 percent in 2002. These ratesare the same as those in the January Greenbook.
Productivity and the labor market. We now expect actual (as opposed tostructural) productivity in the nonfarm business sector to decline at an annualrate of 1-1/4 percent in the current quarter after having risen 2 percent in thefourth quarter. This pattern is shaped in part by some erratic swings in thehours of self-employed persons; that aside, this period of slow productivitygrowth reflects the lags in firms' adjustments of their work forces to a markedlyslower pace of output growth. As that adjustment proceeds, we anticipate arebound in productivity growth to about 3 percent in the second quarter.Productivity growth is expected to average 3-1/4 percent in the second half--abit above its trend rate--as output growth strengthens again, and it slows only alittle in 2002.
Private payrolls are forecast to be about unchanged in the near term as furthercutbacks in manufacturing are offset by modest gains elsewhere. Hiring isexpected to pick up gradually over the course of 2002 but to average only about50,000 per month during the year as a whole. We have edged down ourprojection for the unemployment rate in the current quarter to 4.3 percent, but itmoves up to 5.2 percent by the end of 2001 and reaches 5.6 percent by the endof 2002.

Part 1 Summary and Outlook, March 14, 2001
Decomposition of Structural Labor Productivity(Percent change, Q4 to Q4, except as noted)
Measure 1973 1996- 1999 2000 2001 200295 98
Structural labor productivity 1.4 2.5 3.2 3.3 3.1 3.0Previous 1.4 2.5 3.2 3.3 3.1 3.0
Contributions1Capital deepening .7 1.1 1.5 1.5 1.3 1.2
Previous .7 1.1 1.5 1.5 1.3 1.2
Multifactor productivity .4 1.1 1.4 1.5 1.5 1.5Previous .4 1.1 1.4 1.5 1.5 1.5
Labor quality .3 .3 .3 .3 .3 .3
1. Percentage points.
Wages and prices. Inflation is expected to recede over the projection period.We assume that the slightly larger than expected increases in consumer prices inrecent months will be reversed in the near term. Thereafter, inflation will berestrained by lower levels of resource utilization.
The ECI for hourly compensation rose 4.4 percent in 2000, and we expect it toedge off only a tad in 2001. Despite the rising unemployment rate, workers'efforts to garner the benefits of structural productivity gains likely will persist,and the relatively rapid increase in consumer prices last year should continue toboost nominal wage demands. Moreover, all signs point to big increases inhealth insurance costs this year. But by 2002, with consumer price inflationhaving moderated and with some slack having developed in the labor market,we expect ECI growth to slow further, to 4 percent.
We have made some adjustments to the forecast of PCE energy prices, whichnow decline about 4-1/4 percent in 2001 and 2-3/4 percent in 2002. But thebasic story is the same as that in the January Greenbook. Reflecting the path forcrude oil prices, gasoline prices are expected to fall considerably this year andnext. As noted, natural gas prices continued to soar through the beginning of theyear, and they are likely to show another huge increase for the current quarter asa whole. But with spot prices having declined in February and March, we arelooking for a sizable drop in natural gas prices in the second quarter andmoderate declines thereafter as additional supplies come on line. Meanwhile,increases in food prices are expected to be in the range of 2-1/2 percent to3 percent per year, about the same as the rise in 2000.
I-10

Domestic Developments I-11
The Outlook for the Labor Market(Percent change, Q4 to Q4, except as noted)
Measure 1999 2000 2001 2002
Output per hour, nonfarm business 3.8 3.4 2.1 3.1Previous 4.1 3.6 1.9 3.1
Nonfarm payroll employment 2.2 1.6 0.5 0.7Previous 2.2 1.6 0.2 0.8
Household employment survey 1.5 1.0 -0.3 0.5Previous 1.5 1.0 -0.2 0.6
Labor force participation rate' 67.1 67.1 67.0 66.9Previous 67.1 67.1 67.0 66.9
Civilian unemployment rate' 4.1 4.0 5.2 5.6Previous 4.1 4.0 5.2 5.5
1. Percent, average for the fourth quarter.
The PCE chain price index excluding food and energy is projected to rise a littleless than 2 percent in 2001 and 1-3/4 percent in 2002. We expect core inflationto be damped by the waning of the indirect effects of last year's higher energycosts and by the elimination of labor market tightness, although we continue toanticipate that a firming of prices of core non-oil imports will add a bit todomestic prices in 2002. The core CPI is expected to increase 2-1/2 percent thisyear and 2-1/4 percent in 2002.
In all, we expect the increase in total PCE prices to drop from about 2-1/4percent in 2000 to about 1-3/4 percent per year in 2001 and 2002. The total CPIis projected to increase a bit more than 2 percent per year, on average, over thisperiod after having risen 3-1/2 percent in 2000.
Financial Flows and ConditionsDebt of the domestic nonfinancial sectors is projected to increase 5 percent thisyear and decelerate to 4-1/4 percent next year. The federal government isexpected to retire a substantial amount of debt over the next two years, andnonfederal borrowing moderates.
Nonfinancial business debt is projected to expand at an 8 percent annual rateduring the forecast period. Firms are expected to rely heavily on externalfunding as capital expenditures outstrip internally generated funds by a widemargin. The pace of net equity retirements, both from mergers and sharebuybacks, will moderate from that of recent years reflecting slower economicgrowth and declining profit margins. Given our economic outlook, we expect

Inflation Projections(Percent change, Q4 to Q4, except as noted)
Measure 1999 2000 2001 2002
PCE chain-weighted price index 2.0 2.3 1.8 1.6Previous 2.0 2.3 1.8 1.7
Food 2.0 2.5 3.0 2.4Previous 2.0 2.5 2.8 2.5
Energy 12.0 15.9 -4.3 -2.8Previous 12.0 15.4 -3.5 -3.5
Excluding food and energy 1.5 1.6 1.9 1.7Previous 1.5 1.6 1.9 1.8
Consumer price index 2.6 3.4 2.2 2.0Previous 2.6 3.4 2.3 2.0
Excluding food and energy 2.0 2.5 2.5 2.3Previous 2.1 2.6 2.5 2.4
GDP chain-weighted price index 1.6 2.3 2.0 1.7Previous 1.6 2.3 2.0 1.7
ECI for compensation of privateindustry workers1 3.4 4.4 4.3 4.0
Previous 3.4 4.4 4.3 4.1
NFB compensation per hour 4.4 5.7 5.2 4.9Previous 4.8 5.6 5.3 5.0
Prices of core non-oilmerchandise imports .4 1.4 1.2 2.5
Previous .4 1.5 1.6 2.7
1. December to December.
credit quality to erode somewhat further over the forecast period. Lower-tierfirms will face considerable scrutiny by investors and banks, but financingshould remain generally available, albeit at wide spreads and under relativelytight terms and standards. In contrast, capital-market financing for investment-grade firms should continue to be readily available at rates close to currentlevels. These relatively stringent overall financial conditions should dampbusiness spending somewhat over the forecast period.
Household borrowing is expected to slow gradually over the next two years.Consumer credit growth will recede notably from the pace in recent years,damped in part by very weak nominal spending on consumer durable goods. In
I-12 Part 1 Summary and Outlook, March 14, 2001

Domestic Developments
contrast, we are forecasting little deceleration in home mortgage debt as lowloan rates support high levels of housing activity and mortgage borrowing.With the unemployment rate expected to move up, debt-service burdens likelywill bite for an increasing number of households this year, and we expectconsumer credit quality to deteriorate modestly over the forecast period.
Growth of state and local government debt is projected to move up this year, asCalifornia borrows money to pay for power for its residents and the recentdecline in interest rates spurs some advance refunding of existing debt. Inaddition, we expect these governments to issue a considerable amount of debt tofund new capital projects. Nonetheless, over the entire forecast period, debtgrowth averages only about 3 percent, held down by substantial retirements ofpreviously refunded debt.
Growth of M2 is expected to outpace substantially that of nominal GDP thisyear. The marked decline in M2 opportunity cost as well as the anticipatedflatness of the yield curve will enhance the attractiveness of holding M2 assets.In addition, considerable mortgage refinancing activity in the first half of theyear should boost M2 because the prepayments are temporarily held intransaction accounts. In 2002, M2 growth moves back in line with that ofnominal GDP as the lift from interest rates and prepayment activity wanes.
Alternative simulationsAfter a near-term bout of weakness, economic growth gradually recovers in thestaff forecast, bolstered by strong trend productivity growth and supportivemonetary and fiscal policies. However, many factors could alter this outlook,and we use model simulations to illustrate several major risks to the projection.In the first scenario ("recession in high tech"), the slowdown in high-techinvestment is more pronounced than in the staff forecast, a difference thatmodestly weakens aggregate spending as well as the economy's productivepotential. By contrast, the second scenario ("productivity slowdown") involvesa more substantial worsening in supply-side conditions--an unexpectedpermanent falloff in the pace of overall technological improvement. In the thirdscenario ("low consumer confidence"), we focus on a pure demand-based threatto the outlook--the possibility that the deterioration in consumer confidence willrestrain spending more than we anticipate. However, we recognize that therealso are upside risks to our forecast. Recent spending and labor market datahave been on the strong side of our expectations, and a more optimisticinterpretation of this information (the "strong demand" scenario) would generatefaster growth in the current quarter and significantly more momentumthereafter. A final model simulation illustrates the implications of an alternativemonetary policy assumption.
1-13

Alternative Simulations(Percent change, annual rate, from end of preceding period, except as noted)
2001 2002Measure
H1 H2 H1 H2
Real GDPBaseline 1.1 2.9 3.6 3.8Recession in high tech .7 2.4 3.0 3.2Productivity slowdown -.1 .6 1.4 1.9Low consumer confidence .2 1.6 2.7 3.3Strong demand 2.7 4.5 5.1 5.1Easier monetary policy 1.1 3.2 4.0 4.2
Civilian unemployment rate1Baseline 4.6 5.2 5.5 5.6Recession in high tech 4.6 5.3 5.7 6.0Productivity slowdown 4.6 5.5 6.0 6.4Low consumer confidence 4.7 5.6 6.2 6.5Strong demand 4.4 4.6 4.5 4.2Easier monetary policy 4.6 5.1 5.3 5.4
PCE prices excluding foodand energyBaseline 2.0 1.9 1.7 1.7Recession in high tech 2.0 1.9 1.7 1.7Productivity slowdown 2.0 2.0 1.9 2.0Low consumer confidence 2.0 1.9 1.6 1.4Strong demand 2.0 1.9 1.9 2.2Easier monetary policy 2.0 1.9 1.9 2.0
1. Average for the final quarter of the period.
Recession in high tech. In the staff projection, actual and desired stocks ofcapital are assumed to be in reasonably close alignment at the present time.However, one risk is that substantial overinvestment has in fact occurred,especially in computers and telecommunications equipment. In the firstalternative scenario, current stocks of high-tech equipment are judged to beundesirably high given the outlook for profits, and firms seek to limit newinvestment as a result. Real investment in computers, software, andcommunications equipment is assumed to remain flat at the 2000:Q4 levelthrough most of this year, compared with an increase over the same period of7 percent (annual rate) in the baseline forecast; a flat profile is typically seenonly in recessions. By the end of this year, high-tech spending begins to pickup, but growth does not return to the pace projected by the staff until late 2002.Despite the marked weakness in this sector, the economy as a whole skirts arecession this year, and overall output growth picks up (though more slowly
1-14 Part I Summary and Outlook, March 14, 2001

than in the staff forecast) in 2002. The limited fallout from the high-tech slumpreflects the small size of this sector in the U.S. economy as well as theassumption that the expected productivity of this capital in the long run isunaffected by the transitory shortfall in demand.
Productivity slowdown. In the second scenario, we continue to assume thehigh-tech recession described in the first scenario, but we have added theassumption that trend total factor productivity growth is 1 percentage pointbelow the staffs estimate. Over the course of this year, the reduced pace oftechnological advance leads to an equal-sized revision in the public'sexpectations for long-run growth of income, sales, and earnings--a change thatyields (among other things) a further large decline in equity prices. But long-term real interest rates fall by only a modest amount, in part because thenominal federal funds rate is held unchanged at its baseline path. Under theseconditions, there is almost no rise in real GDP this year, and growth is less than1-3/4 percent in 2002. Although the unemployment rate climbs to about 6-1/2percent by late next year, inflation picks up relative to baseline because of costpressures associated with the slower growth of trend productivity.
Low consumer confidence. In the staff forecast, we have discountedsomewhat the sharp deterioration in consumer confidence of late in light of theimpressive strength in sales of motor vehicles and houses. In this scenario, wetake more seriously the possibility that the very weak readings on confidencemay be signaling that a marked step-up in precautionary saving is in the offing.Specifically, we assume that confidence will remain at depressed levels over thenext several quarters and that this will lead consumers to cut back on spendingby enough to raise the personal saving rate 1 percentage point by the end of thisyear; housing demand is assumed to weaken as well. Under thesecircumstances, real GDP rises less than 1 percent this year and only 3 percent in2002. As a result, the unemployment rate rises to 6-1/2 percent by the end of2002, causing inflation next year to be 1/4 percentage point below baseline.
Strong demand. In sharp contrast to the readings on consumer confidence,recent labor market and spending indicators suggest that current-quarter realGDP growth could be significantly faster than incorporated in the staff outlook.If taken literally, these indicators also suggest a stronger underlying level offinal sales and thus, by implication, faster growth in coming quarters. Toillustrate this risk, the fourth scenario assumes that much stronger privatedomestic final demand raises the growth rate of real GDP above2 percent in the current quarter. Furthermore, the implied boost to theunderlying level of aggregate demand is assumed to be permanent and thuscontinues to add to output growth in subsequent quarters, particularly as thestance of monetary policy remains the same as in the baseline forecast. Withoutany offsetting movement of the funds rate, real GDP growth climbs to more
1-15Domestic Developments

I-16 Part 1: Summary and Outlook, March 14, 2001
than 5 percent next year, bringing the unemployment rate back down to 4-1/4percent by late 2002 and putting inflation on an upward trajectory.
Easier monetary policy. Here, the federal funds rate declines over the balanceof this year and then partially retraces the decline in 2002--in line with theexpectations implicit in current futures contracts. On average, rates are about40 basis points below the baseline over the next seven quarters. Changes inother asset prices are determined endogenously by the model's equations. Withthis more aggressive policy easing, the unemployment rate climbs more slowly,and inflation next year is higher than in the staff forecast.

Strictly Confidential <FR>Class II FOMC STAFF PROJECTIONS OF CHANGES IN GDP, PRICES, AND UNEMPLOYMENT
(Percent, annual rate)
March 14, 2001
GDP chain-weighted Consumer UnemploymentNominal GDP Real GDP price index price index rate2
Interval 01/25/01 03/14/01 01/25/01 0314/01 012501 031401 01/25/01 011 5/0012 3/14/01 01/25/01 03/14/01
ANNUAL
19981999200020012002
QUARTERLY
1999 Q1Q2Q3Q4
2000 01Q2Q3Q4
2001 Q1Q2Q3Q4
2002 Q01Q2Q3Q4
TWO- QUARTER3
1999 Q2Q4
2000 Q2Q4
2001 Q2Q4
2002 Q2Q4
FOUR-QUARTER4
1998 Q41999 Q42000 Q42001 Q42002 Q4
-0.3 -0.3-0.3 -0.3-0.1 -0.11.2 1.20.3 0.4
4.9 4.9 3.0 3.0 1.8 1.8 2.5 2.2 -0.1 -0.18.2 8.2 7.0 7.0 1.3 1.3 2.7 3.0 -0.2 -0.2
8.2 8.2 5.2 5.2 2.8 2.8 4.0 3.6 -0.1 -0.14.0 3.4 2.1 1.6 1.8 1.8 2.9 3.2 0.0 0.0
2.7 3.4 0.4 1.1 2.4 2.3 2.9 2.5 0.7 0.64.8 4.6 3.1 2.9 1.6 1.7 1.7 1.9 0.5 0.6
5.6 5.3 3.7 3.5 1.8 1.7 1.9 1.9 0.2 0.35.6 5.5 3.9 3.8 1.6 1.6 2.0 2.0 0.1 0.1
1. For all urban consumers.2. Level, except as noted.3. Percent change from two quarters earlier; for unemployment rate, change in percentage points.4. Percent change from four quarters earlier; for unemployment rate, change in percentage points.

Strictly Confidential <FR> REAL GROSS DOMESTIC PRODUCT AND RELATED ITEMS, ANNUAL VALUESClass II FOMC (Seasonally adjusted annual rate)
March 14, 2001
---------Projected---------
Item Units1 1994 1995 1996 1997 1998 1999 2000 2001 2002
EXPENDITURES
Nominal GDP Bill. $ 7054.3 7400.5 7813.2 8318.4 8790.2 9299.2 9962.3 10350.6 10867.1Real GDP Bill. Ch. $ 7347.7 7543.8 7813.2 8159.5 8515.7 8875.8 9318.0 9481.8 9791.0
Real GDP change 4.1 2.2 4.1 4.3 4.6 5.0 3.4 2.0 3.7Gross domestic purchases 4.3 1.7 4.3 5.0 5.7 5.9 4.1 2.1 3.9Final sales 3.2 2.9 3.9 3.9 4.6 4.8 3.6 2.2 3.5Priv. dom. final purchases 4.3 3.2 4.4 5.1 6.4 6.1 5.0 2.2 3.7
Personal cons. expenditures 3.6 2.8 3.1 4.1 5.0 5.6 4.5 1.8 2.7Durables 6.4 3.7 5.0 8.8 12.6 11.1 5.2 -0.8 3.2Nondurables 4.1 2.5 3.2 2.5 5.0 5.9 3.8 1.4 2.2Services 2.7 2.7 2.7 3.9 3.4 4.2 4.7 2.5 2.8
Business fixed investment 9.2 7.5 12.1 11.8 12.9 10.1 10.2 3.9 9.3Equipment & Software 12.0 8.9 11.8 13.7 15.8 14.1 9.7 2.7 11.2Nonres. structures 1.1 3.3 12.8 6.5 4.9 -1.7 12.0 7.4 4.1
Residential structures 4.0 -1.5 5.6 3.5 10.3 2.8 -2.2 3.3 3.0
Exports 10.5 9.7 9.8 8.5 2.2 4.3 6.8 4.0 8.1Imports 12.2 5.0 11.2 14.3 11.2 12.0 11.5 4.5 8.2
Gov't. cons. & investment 0.2 -0.8 2.7 2.4 2.6 4.4 1.3 3.1 3.5Federal -3.7 -5.3 2.0 0.1 0.8 4.8 -1.3 2.6 3.5
Defense -5.9 -4.7 0.8 -1.4 -1.0 4.6 -2.0 1.7 2.6State & local 2.8 2.1 3.0 3.7 3.6 4.2 2.7 3.3 3.6
Change in bus. inventories Bill. Ch. $ 66.8 30.4 30.0 63.8 80.2 45.3 61.2 14.9 44.1Nonfarm 53.6 42.6 22.1 60.6 78.7 44.9 56.1 12.1 42.8
Net exports -86.5 -78.4 -89.0 -113.3 -221.0 -322.4 -412.7 -462.7 -502.7
Nominal GDP L change 6.2 4.3 6.0 6.2 5.9 6.5 5.8 4.0 5.4
EMPLOYMENT AND PRODUCTION
Nonfarm payroll employment Millions 114.1 117.2 119.6 122.7 125.8 128.8 131.4 132.4 132.9Unemployment rate % 6.1 5.6 5.4 4.9 4.5 4.2 4.0 4.8 5.5
Industrial prod. index t change 6.3 3.6 5.6 7.2 3.2 5.1 4.3 0.4 4.3Capacity util. rate - mfg. 4 82.5 82.5 81.6 82.7 81.3 80.5 81.3 77.9 78.6
Housing starts Millions 1.46 1.35 1.48 1.47 1.62 1.67 1.60 1.64 1.67Light motor vehicle sales 15.01 14.77 15.05 15.06 15.45 16.76 17.25 15.81 15.37North Amer. produced 12.88 12.87 13.34 13.12 13.43 14.28 14.38 12.87 12.51Other 2.13 1.90 1.70 1.93 2.02 2.48 2.87 2.94 2.87
INCOME AND SAVING
Nominal GNP Bill. $Nominal GNP % changeNominal personal incomeReal disposable incomePersonal saving rate %
Corp. profits, IVA & CCAdj. % changeProfit share of GNP %Excluding FR Banks
Federal surpl./deficit Bill. $State & local surpl./def.
Ex. social ins. funds
Gross natl. saving rate 1Net natl. saving rate
PRICES AND COSTS
GDP chn.-wt. price index % changeGross Domestic Purchases
chn.-wt. price index
PCE chn.-wt. price indexEx. food and energy
CPIEx. food and energy
ECI, hourly compensation2
Nonfarm business sectorOutput per hourCompensation per HourUnit labor cost
7071.1 7420.9 7831.2 8325.4 8786.7 9288.2 9952.7 10329.9 10832.96.2 4.4 5.9 6.0 5.7 6.5 5.8 3.9 5.35.1 4.3 5.9 6.3 6.3 5.6 5.7 4.7 5.22.9 1.7 2.6 3.8 4.6 3.1 2.2 3.0 4.16.1 5.6 4.8 4.2 4.2 2.2 -0.1 -0.1 1.5
12.3 11.3 11.4 9.9 -5.8 11.2 0.9 -2.1 5.38.1 9.0 9.6 10.0 9.3 9.2 9.5 8.5 8.47.9 8.7 9.4 9.7 9.0 8.9 9.2 8.2 8.1
-212.3 -192.0 -136.8 -53.3 49.0 124.4 253.6 263.6 239.48.6 15.3 21.4 31.0 41.7 50.0 59.9 55.2 46.34.0 11.4 18.7 29.9 41.3 50.4 60.3 55.4 46.1
16.3 16.9 17.2 18.0 18.8 18.5 18.3 18.0 18.84.3 5.1 5.7 6.7 7.5 6.8 6.5 5.7 6.4
2.1 2.1 1.9 1.8 1.2 1.6 2.3
2.1 2.1 1.9 1.4 0.8 1.9 2.4
2.1 2.1 2.3 1.5 1.1 2.0 2.32.3 2.3 1.8 1.7 1.6 1.5 1.6
2.6 2.7 3.2 1.9 1.5 2.6 3.42.8 3.0 2.6 2.2 2.4 2.0 2.5
3.1 2.6 3.1 3.4 3.5 3.4 4.4
1.1 1.1 2.3 2.3 2.8 3.8 3.42.2 2.6 3.2 3.5 5.1 4.4 5.71.0 1.5 0.9 1.1 2.3 0.6 2.4
1. Changes are from fourth quarter to fourth quarter.2. Private-industry workers.

1-19
Strictly Confidential <FR> REAL GROSS DOMESTIC PRODUCT AND RELATED ITEMS, QUARTERLY VALUESClass II FOMC (Seasonally adjusted, annual rate except as noted)
March 14, 2001
1998 1998 1998 1998 1999 1999 1999 1999 2000 2000Units Q1 Q2 Q3 Q4 Q1 Q2 Q3 Q4 Q1 Q2
EXPENDITURES
Nominal GDP Bill. $ 8634.7 8722.0 8829.1 8974.9 9104.5 9191.5 9340.9 9559.7 9752.7 9945.7Real GDP Billh. . $ 8404.9 8465.6 8537.6 8654.5 8730.0 8783.2 8905.8 9084.1 9191.8 9318.9
Real GDP t change 6.5 2.9 3.4 5.6 3.5 2.5 5.7 8.3 4.8 5.6
Gross domestic purchases 8.1 4.8 4.4 5.4 4.9 3.8 6.6 8.4 5.6 6.5Final sales 4.1 5.6 2.9 5.9 4.5 4.0 4.5 6.4 6.7 3.9Priv. dom. final purchases 7.2 7.5 4.4 6.3 6.4 6.2 5.6 6.2 9.3 4.7
Personal cons. expenditures 4.8 5.8 4.3 4.9 5.7 5.6 5.0 5.9 7.6 3.1Durables 9.4 13.9 4.1 23.9 8.6 15.0 8.0 13.0 23.6 -5.0
Nondurables 4.7 5.8 4.3 5.2 7.8 3.8 4.9 7.4 6.0 3.6
Services 4.0 4.3 4.3 1.3 4.1 4.6 4.5 3.8 5.2 4.6
Business fixed investment 20.1 15.6 3.5 13.2 9.5 9.6 11.8 9.5 21.0 14.6Equipment & Software 24.6 16.1 6.5 16.7 14.1 15.2 18.0 9.5 20.6 17.9Nonres. structures 7.9 14.1 -4.7 3.3 -3.4 -6.2 -6.2 9.7 22.3 4.4
Residential structures 9.6 12.6 10.3 8.9 8.2 5.9 -3.1 0.5 3.2 1.3
Exports 1.0 -3.0 -3.2 15.1 -7.9 5.8 10.2 10.3 6.3 14.3Imports 14.2 13.1 5.5 12.2 4.5 16.2 16.9 10.7 12.0 18.6
Gov't. cons. & investment -1.0 7.3 1.4 2.8 3.7 0.8 4.8 8.5 -1.1 4.8Federal -9.1 12.9 -3.2 3.7 -2.2 2.0 6.9 13.2 -14.2 17.2Defense -17.7 13.1 5.8 -2.4 -3.1 -2.3 12.3 12.6 -19.8 16.9
State & local 3.8 4.4 4.0 2.3 7.0 0.1 3.7 6.1 6.6 -1.1
Change in bus. inventories Bill. Ch. $ 117.3 60.9 73.1 69.4 48.1 13.1 39.1 80.9 36.6 78.6Nonfarm 109.7 62.5 79.2 63.5 49.2 14.1 43.5 73.0 33.0 72.3
Net exports -175.3 -219.8 -244.1 -244.9 -279.8 -314.6 -342.6 -352.5 -376.8 -403.4
Nominal GDP % change 7.6 4.1 5.0 6.8 5.9 3.9 6.7 9.7 8.3 8.2
EMPLOYMENT AND PRODUCTION
Nonfarm payroll employment MillionsUnemployment rate %
Industrial prod. index % changeCapacity util. rate - mfg. t
Housing starts MillionsLight motor vehicle sales
North Amer. producedOther
INCOME AND SAVING
Nominal GNP Bill. $Nominal GNP % changeNominal personal incomeReal disposable incomePersonal saving rate
Corp. profits, IVA & CCAdj.Profit share of GNP
Excluding FR Banks
Federal surpl./deficitState & local surpl./def.
Ex. social ins. funds
Gross natl. saving rateNet natl. saving rate
PRICES AND COSTS
GDP chn.-wt. price indexGross Domestic Purchases
chn.-wt. price index
PCE chn.-wt. price indexEx. food and energy
CPIEx. food and energy
ECI, hourly compensation1
Nonfarm business sectorOutput per hourCompensation per hourUnit labor cost
124.7 125.5 126.2 127.0 127.8 128.4 129.1 129.8 130.6 131.64.7 4.4 4.5 4.4 4.3 4.3 4.2 4.1 4.1 4.0
3.6 3.0 3.4 2.9 3.9 4.9 5.8 5.7 6.7 7.982.4 81.5 80.8 80.5 80.2 80.3 80.5 80.9 81.3 81.9
1.56 1.57 1.63 1.72 1.76 1.59 1.66 1.69 1.73 1.6114.99 16.01 14.55 16.24 16.18 16.79 17.08 17.00 18.20 17.2413.07 14.04 12.53 14.07 13.87 14.34 14.61 14.31 15.32 14.361.93 1.97 2.02 2.17 2.31 2.45 2.47 2.69 2.88 2.88
8640.3 8725.0 8814.9 8966.6 9097.2 9181.8 9327.3 9546.3 9745.0 9937.47.8 4.0 4.2 7.1 6.0 3.8 6.5 9.7 8.6 8.17.7 6.2 5.9 5.7 4.3 5.4 5.2 7.6 6.9 6.96.6 4.5 3.6 3.6 2.9 2.8 2.2 4.5 1.9 3.74.6 4.3 4.1 3.8 3.1 2.5 1.8 1.5 0.2 0.3
-12.6 -5.0 2.0 -7.0 26.5 -6.9 2.5 26.6 20.7 12.29.5 9.3 9.3 9.0 9.4 9.1 9.0 9.4 9.6 9.79.3 9.0 9.0 8.7 9.1 8.8 8.8 9.1 9.3 9.4
25.9 41.9 71.9 56.4 89.7 117.5 147.3 143.3 235.8 240.938.1 33.4 37.5 57.7 47.9 38.0 47.4 66.6 52.0 60.137.5 32.9 37.2 57.6 48.1 38.3 47.9 67.2 52.5 60.6
18.9 18.7 19.0 18.7 18.9 18.4 18.4 18.3 18.2 18.67.7 7.4 7.6 7.2 7.3 6.7 6.5 6.6 6.6 6.9
% change5
Bill. $
. change
3.0
1.1 2.2
1.2 1.9
1.5 1.71.7 1.8
2.0 1.72.3 1.8
1.6 3.3 2.4
1.9 3.8 2.1
2.2 3.5 2.11.7 2.2 1.4
3.1 4.3 2.82.5 2.5 2.7
3.3 4.4 2.6 1.7 4.3 3.7 4.0 5.9 4.4
5.0 8.0 2.1 6.35.2 4.2 4.1 6.00.2 -3.5 1.9 -0.2
1. Private-industry workers.
Item

Strictly Confidential <FR>Class II FOMC
REAL GROSS DOMESTIC PRODUCT AND RELATED ITEMS, QUARTERLY VALUES(Seasonally adjusted, annual rate except as noted)
March 14, 2001
- - - - -------- - - -- - Projected - - - - - - - - - - - - - - - - -
2000 2000 2001 2001 2001 2001 2002 2002 2002 2002Item Units Q3 Q4 Ql Q2 Q3 Q4 01 Q2 Q3 Q4
EXPENDITURES
Nominal GDPReal GDP
Real GDPGross domestic purchasesFinal salesPriv. dom. final purchases
Personal cons. expendituresDurablesNondurablesServices
Business fixed investmentEquipment & SoftwareNonres. structures
Residential structures
ExportsImports
Gov't. cons. & investmentFederalDefense
State & local
Change in bus. inventoriesNonfarm
Net exports
Nominal GDP
EMPLOYMENT AND PRODUCTION
Nonfarm payroll employmentUnemployment rate
ndustrial prod. indexCapacity util. rate - mfg.
Rousing startsLight motor vehicle salesNorth Amer. producedOther
INCOME AND SAVING
Nominal GNPNominal GNPNominal personal incomeReal disposable incomePersonal saving rate
Corp. profits, IVA & CCAdj.Profit share of GNPExcluding FR Banks
Federal surpl./deficitState & local surpl./def.Ex. social ins. funds
Gross natl. saving rateNet natl. saving rate
PRICES AND COSTS
GDP chn.-wt. price indexGross Domestic Purchases
chn.-wt. price index
PCE chn.-wt. price indexEx. food and energy
CPIEx. food and energy
ECI, hourly compensation1
,nfarm business sectorOutput per hourCompensation per hourUnit labor cost
Bill. $Bill. Ch. $
% change
Bill. Ch. $
% change
Millions
% change
Millions
Bill. $% change
% change
Bill. $
% change
10039.4 10111.5 10216.7 10283.8 10386.8 10515.2 10657.5 10792.5 10934.6 11083.89369.5 9391.9 9411.2 9442.2 9498.1 9575.8 9658.8 9743.6 9833.3 9928.4
2.2 1.0 0.8 1.3 2.4 3.3 3.5 3.6 3.7 3.93.0 1.5 1.1 1.6 2.7 3.1 4.0 3.9 3.9 3.62.4 1.6 3.0 0.8 2.0 3.1 3.1 3.3 3.5 4.14.2 2.0 3.2 0.7 2.1 2.8 3.6 3.7 3.8 3.8
4.5 2.8 2.3 0.6 2.0 2.4 2.6 2.6 2.7 2.77.6 -3.1 2.4 -6.8 -0.4 2.0 2.8 2.9 3.3 3.64.7 1.0 2.4 -0.1 1.6 1.8 2.2 2.2 2.2 2.23.7 5.0 2.3 2.4 2.7 2.7 2.8 2.8 2.8 2.8
7.7 -1.1 6.3 0.2 3.2 6.0 8.9 9.2 9.5 9.75.6 -3.7 3.9 -1.4 2.4 6.3 10.5 11.0 11.6 11.8
14.6 7.5 13.9 5.2 5.5 5.0 4.5 4.3 4.0 3.7-10.6 -1.9 7.9 5.2 -0.3 0.5 3.0 3.6 2.7 2.6
13.9 -6.1 -1.7 3.5 5.1 9.2 4.6 7.8 8.4 11.617.0 -0.7 0.7 5.1 6.4 5.9 7.8 9.3 8.5 7.2
-1.4 2.9 2.6 3.1 3.2 3.3 3.5 3.5 3.6 3.6-9.0 3.7 1.2 2.9 3.2 3.1 3.5 3.6 3.6 3.4-9.7 8.8 -1.2 2.7 2.9 2.7 2.5 2.8 2.7 2.42.9 2.4 3.4 3.2 3.2 3.3 3.5 3.5 3.6 3.6
72.5 56.9 0.4 11.1 21.8 26.4 37.2 44.2 49.5 45.667.4 51.8 -3.5 8.2 19.3 24.4 35.7 42.6 48.4 44.5
-427.7 -442.9 -450.4 -460.2 -471.2 -469.0 -487.0 -502.2 -512.7 -508.9
3.8 2.9 4.2 2.7 4.1 5.0 5.5 5.2 5.4 5.6
131.6 131.8 132.2 132.3 132.4 132.5 132.6 132.8 133.0 133.44.0 4.0 4.3 4.6 4.9 5.2 5.4 5.5 5.5 5.6
3.5 -0.8 -4.5 0.1 2.3 4.0 4.6 4.6 4.1 3.981.7 80.3 78.4 77.7 77.7 78.0 78.3 78.5 78.7 78.8
1.53 1.55 1.65 1.64 1.63 1.64 1.66 1.66 1.67 1.6817.38 16.17 16.83 15.76 15.32 15.33 15.34 15.36 15.38 15.4114.54 13.30 13.87 12.80 12.39 12.43 12.46 12.50 12.52 12.552.84 2.87 2.96 2.96 2.93 2.90 2.88 2.86 2.86 2.86
10030.5 10097.9 10197.4 10266.6 10366.5 10489.3 10627.4 10759.6 10899.3 11045.23.8 2.7 4.0 2.7 3.9 4.8 5.4 5.1 5.3 5.55.3 3.7 5.5 4.1 4.4 4.9 5.6 5.1 5.0 5.12.6 0.5 2.4 2.6 4.2 2.8 7.3 3.1 3.0 3.0
-0.2 -0.8 -0.8 -0.3 0.2 0.3 1.4 1.5 1.6 1.6
2.8 -25.5 -3.9 -7.9 -0.8 4.5 3.3 4.7 5.9 7.59.7 8.9 8.8 8.5 8.4 8.4 8.4 8.4 8.4 8.49.4 8.6 8.5 8.2 8.1 8.1 8.1 8.1 8.1 8.1
253.3 284.5 266.1 272.4 256.5 259.6 210.7 228.0 252.9 266.063.2 64.2 64.6 55.4 49.2 51.6 50.7 48.8 43.8 41.963.6 64.6 64.9 55.6 49.3 51.6 50.6 48.6 43.5 41.6
18.5 17.9 17.7 17.9 18.1 18.2 18.5 18.7 18.9 19.16.6 5.8 5.5 5.7 5.7 5.8 6.1 6.3 6.5 6.7
1.6
2.0
1.81.1
3.52.5
4.1
3.06.23.2
3.4 1.3
2.7 1.2
2.8 1.12.4 1.7
3.6 1.32.8 2.4
4.3 4.3
2.0 -1.2 3.26.6 4.6 5.54.6 5.9 2.3
1.7 1.9
1.6 1.9
1.6 1.51.9 1.7
1.9 1.92.5 2.3
4.2 4.1
3.5 3.2 3.15.2 5.2 4.91.7 2.0 1.8
1. Private-industry workers.

Strictly Confidential <FR>Class II FOMC
Item
Real GDPGross dom. purchases
Final salesPriv. dom. final purchases
Personal cons. expendituresDurablesNondurablesServices
Business fixed investmentEquipment & SoftwareNonres. structures
Residential structures
Net exportsExportsImports
Government cons. & invest.FederalDefenseNondefense
State and local
Change in bus. inventoriesNonfarmFarm
CONTRIBUTIONS TO GROWTH IN REAL GROSS DOMESTIC PRODUCT AND RELATED ITEMS
1998 1998 1999 1999 1999 1999 2000 2000 2000 98Q4/ 9904/ 004/Q3 Q4 Q1 Q2 Q3 Q4 Q1 Q2 Q3 97Q4 98Q4 99Q4
3.4 5.6 3.5 2.5 5.7 8.3 4.8 5.6 2.2 4.6 5.0 3.44.5 5.5 5.0 3.8 6.8 8.6 5.8 6.7 3.1 5.8 6.0 4.3
2.9 5.8 4.4 3.9 4.5 6.5 6.6 3.9 2.4 4.6 4.8 3.63.7 5.3 5.3 5.2 4.7 5.2 7.9 4.0 3.6 5.3 5.1 4.2
1.6 1.2 1.2 1.51.5 1.3 1.4 1.70.1 -0.1 -0.2 -0.20.4 0.3 0.3 -0.1
5.0 2.1 3.01.8 -0.4 0.61.2 0.7 0.92.0 1.8 1.5
2.5 1.9 1.01.9 1.7 0.60.6 0.1 0.40.1 0.1 -0.5
-1.0 0.1 -1.4 -1.4 -1.1 -0.4 -0.9 -1.0 -0.9-0.4 1.5 -0.9 0.6 1.1 1.1 0.7 1.5 1.5-0.7 -1.5 -0.6 -2.0 -2.1 -1.5 -1.6 -2.5 -2.4
0.3 0.5 0.6 0.1 0.8-0.2 0.2 -0.1 0.1 0.40.2 -0.1 -0.1 -0.1 0.5
-0.4 0.3 -0.0 0.2 -0.10.5 0.3 0.8 0.0 0.4
0.6 -0.2 -0.9 -1.4 1.20.8 -0.7 -0.6 -1.4 1.3
-0.2 0.5 -0.3 0.0 -0.1
1.5 -0.2 0.9 -0.20.8 -0.9 1.0 -0.60.5 -0.9 0.6 -0.40.3 -0.1 0.4 -0.20.7 0.8 -0.1 0.3
1.8 -1.81.3 -1.60.5 -0.2
1.7 -0.21.6 -0.20.1 -0.1
1.5 1.3 1.31.4 1.3 1.00.2 -0.1 0.40.4 0.1 -0.1
-1.1 -1.1 -0.90.3 0.5 0.7
-1.4 -1.5 -1.6
0.5 0.8 0.20.0 0.3 -0.1
-0.0 0.2 -0.10.1 0.1 0.00.4 0.5 0.3
0.0 0.2 -0.20.0 0.1 -0.20.0 0.1 -0.0
Note. Components may not sum to totals because of rounding.
March 14, 2001

Strictly Confidential <FR>Class II FOMC
Item
Real GDPGross dom. purchases
Final salesPriv. dom. final purchases
Personal cons. expendituresDurablesNondurablesServices
Business fixed investmentEquipment & SoftwareNonres. structures
Residential structures
Net exportsExportsImports
Government cons. & invest.Federal
DefenseNondefense
State and local
Change in bus. inventoriesNonfarmFarm
CONTRIBUTIONS TO GROWTH IN REAL GROSS DOMESTIC PRODUCT AND RELATED ITEMS March 14, 2001
2000 2001 2001 2001 2001 20 02 20 0 002 2002 0004/ 0104/ 02Q4/04 01 02 Q3 04 Q1 02 03 04 9904 0004 0104
1.0 0.8 1.3 2.41.6 1.1 1.7 2.8
1.6 2.9 0.8 2.01.7 2.8 0.6 1.8
1.9 1.6 0.4 1.4-0.3 0.2 -0.6 -0.00.2 0.5 -0.0 0.32.0 0.9 1.0 1.1
-0.1 0.8 0.0 0.4-0.4 0.4 -0.1 0.20.2 0.4 0.2 0.2
-0.1 0.3 0.2 -0.0
3.3 3.5 3.6 3.7 3.9 3.4 2.0 3.73.2 4.2 4.1 4.1 3.8 4.3 2.2 4.0
3.1 3.1 3.3 3.5 4.1 3.6 2.2 3.52.4 3.1 3.2 3.2 3.3 4.2 1.9 3.2
-0.6 -0.3 -0.4 -0.4 0.1 -0.6 -0.5 -0.3 0.2-0.7 -0.2 0.4 0.5 1.0 0.5 0.8 0.9 1.20.1 -0.1 -0.7 -0.9 -0.9 -1.1 -1.4 -1.2 -1.1
0.5 0.50.2 0.10.3 -0.0
-0.1 0.10.3 0.4
-0.7 -2.1-0.6 -2.2-0.0 0.1
0.5 0.6 0.6 0.60.2 0.2 0.2 0.20.1 0.1 0.1 0.10.1 0.1 0.1 0.10.4 0.4 0.4 0.4
0.5 0.4 0.2 0.40.5 0.4 0.2 0.40.0 -0.0 -0.0 -0.0
0.3 0.2 -0.20.3 0.2 -0.10.0 -0 0 -0.0
-0.9 -0.2 -0.30.7 0.4 0.9
-1.6 -0.7 -1.2
0.2 0.5 0.6-0.1 0.2 0.2-0.1 0.1 0.10.0 0.1 0.10.3 0.4 0.4
-0.2 -0.2 0.2-0.2 -0.3 0.2-0.0 0.0 -0.0
Note. Components may not sum to totals because of rounding.

Strictly Confidential (FR)Class II FOMC
March 14,2001Staff Projections of Federal Sector Accounts and Related Items
(Billions of dollars except as noted)
Item
Unified budget
Receipts2
Outlays2
Surplus/deficit 2
On-budgetOff-budget
Surplus excludingdeposit insurance
Means of financingBorrowingCash decreaseOther
Cash operating balance,end of period
NIPA federal sector
ReceiptsExpenditures
Consumption expendituresDefenseNondefense
Other spendingCurrent account surplusGross investmentCurrent and capital
account surplus
Fiscal indicators4
High-employment (HEB)
surplus/deficitChange in HEB, percent
of potential GDPFiscal impetus (FI)
percent, calendar year
Fiscal year1
1999 2000 20 001 2002
1827 2025 2105 21721703 1789 1850 1930125 236 256 2421 86 95 66
124 150 161 177
119 233 254 240
-223 -230 -2474 12 -4
-17 -38 9
56 53 41 45
337 2024 2139 2193735 1806 1870 1955464 489 506 538306 320 331 348158 168 175 191270 1317 1364 1417103 218 269 23894 104 112 117
9 114 157 121
8 103 122
-.8 -.9 -. 1
2 7 9
2000 2001 2002
QPI Q2 Q3a Q45 QI Q2 Q3 Q4 Q Q2 Q3 Q4
Not seasonally adjusted
434 656 492 461 464 682 498 490 462 684 536 515449 444 431 464 478 463 446 492 484 480 473 506-15 212 60 -2 -13 219 53 -2 -22 204 63 8-45 147 50 -14 -74 148 35 -52 50 128 40 -4930 65 10 12 61 71 17 51 28 76 22 57
-18 211 60 -3 -14 218 52 2 23 203 62 8
-27 -190 -5439 -13 54 -10 11
40 18824 -11
2 19
8 1575 -409 7
45 57 53 21 45 57 41 25 20 60 45 25
Seasonally adjusted annual rates
2012 2055 2089 2110 2138 2155 2151 2183 2162 2195 2231 22681776 1814 1836 1829 1872 1882 1895 1923 1952 1967 1978 2002479 499 490 489 506 511 516 521 538 544 550 556311 326 320 322 331 334 336 339 348 350 353 356168 173 170 167 176 178 180 182 190 193 196 200
1297 1315 1346 1340 1366 1371 1378 1402 1414 1423 1429 1447236 241 253 281 266 272 256 260 211 228 253 266101 106 104 113 110 111 113 115 116 118 119 121
134 135 149 168 156 161 143 145
31 20 39 78 90 120 123 136
95 110 134 145
94 116 143 158
-1 1 -.2 .4 -. 1 -.3 -0 -. 1 .4 -.2 -.2 -.1
-6 6 -2 .3 3 .5 5
I Fiscal year data for the unified budget come from OMB; quarterly data come from the Monthly Treasury Statement and may not sum to OMB fiscal year totals.2. OMB's February 2001 baseline surplus estimates are $284 billion in FY2001 and $283 billion in FY 2002. CBO's January 2001 baseline surplus estimates, assuming discretionary spending grows
with inflation beginning in FY 2002, are $281 billion in FY2001 and $313 billion in FY 2002. Budget receipts, outlays, and surplus/deficit include corresponding social security (OASDI) categoriesThe OASDI surplus is excluded from the on-budget surplus and shown separately as off-budget, as classified under current law.3. Other means of financing are checks issued less checks paid, accrued items, and changes in other financial assets and liabilities.4. HEB is the NIPA current and capital account surplus in current dollars, with cyclically sensitive receipts and outlays adjusted to the level of potential output associated with an unemployment rate of
6 percent. Quarterly figures for change in HEB and Fl are not at annual rates. The sign on Change in HEB, as a percent of nominal potential GDP, is reversed. FI is the weighted difference of discretionarychanges in federal spending and taxes in chained (1996) dollars, scaled by real federal consumption plus investment. For FI and the change in (HEB, negative values indicate aggregate demand restraint.
a--Actual

Strictly Confidential (FR)Class II FOMC
Change in Debt of the Domestic Nonfinancial Sectors(Percent)
Nonfederal
Households
Federal Home ConsumerPeriod 1 Total 2 government 3 Total 4 Total mortgages credit
1999200020012002
Quarter1999:3
42000:1
234
2001 1234
2002:1234
Memo:
State and local NominalBusiness governments GDP
4.14.00.6-1.4
-1.9-8.0-6.6-8.2
-1 9-0.9-5.9
-11.4-6.2-9.61.6
-12.0-7.0-9.6-2.3-9.0
-10.5-12.1
Note. Quarterly data are at seasonally adjusted annual rates.1 Data after 2000:Q4 are staff projections. Changes are measured from end of the preceding period to
end of period indicated except for annual nominal GDP growth, which is calculated from Q4 to Q4.2. On a monthly average basis, total debt is projected to grow 5.0 percent in 2001 and 4.3 percent in 2002.3. On a monthly average basis, federal debt is projected to grow -6.6 percent in 2001 and -8.0 percent in 2002.4. On a monthly average basis, nonfederal debt is projected to grow 7 7 percent in 2001 and 6.7 percent in 2002.
2.6.3 FOF
March 14, 2001

Strictly Confidential (FR)Class II FOMC
Category
Net funds raised by domesticnonfinancial sectors
1 Total2 Net equity issuance3 Net debt issuance
Borrowing sectorsNonfinancial business
4 Financing gap 15 Net equity issuance6 Credit market borrowing
Households7 Net borrowing 2
8 Home mortgages9 Consumer credit
10 Debt/DPI (percent) 3
State and local governments11 Net borrowing12 Current surplus 4
Federal government13 Net borrowing14 Net borrowing (quarterly, n.s.a.)15 Unified deficit (quarterly, n.s.a.)
Depository institutions
16 Funds supplied
Memo (percentage of GDP)17 Domestic nonfinancial debt 5
18 Domestic nonfinancial borrowing19 Federal government20 Nonfederal
Flow of Funds Projections: Highlights(Billions of dollars except as noted)
Seasonally adjusted annual rates
Calendar year 2000 2001
1999 2000 2001 2002 Q3 Q4 Ql Q2 Q3 Q4 Q1
March 14, 2001
2002
Q2 Q3 Q4
978.0 724.7 791.0 731 7 704.3 484.9 1201.6 625.4 724.9 612.1 902.1 695.5 679.4 649.8-143.5 -153.1 -106.0 -90.0 -75.6 -350.8 -28.0 156.0 -136.0 -104.0 -96.0 -88.0 -88.0 -88.01121.5 877.8 897.0 821 7 779.9 835.7 1229.6 781.4 860.9 716.1 998.1 783.5 767.4 737.8
172.1 222.9 231 7 306.4 238.6 247.4 207.4 223.0 239.1 257.5 282.2 300.1 316.0 327.5-143.5 -153.1 -106.0 -90.0 -75.6 350.8 -28.0 156.0 136.0 104.0 -96.0 -88.0 -88.0 -88.0602.1 574.0 517.8 553.3 423.5 533.9 493 7 560.7 523.3 493.5 536.9 539.4 562.0 5747
538.2 572.5 550.3 498.7 552.2 576.0 611.9 5541 531 2 504.1 503.5 496.9 500.0 494.7415.7 4019 426.7 434.0 408.5 400.2 441.2 421.2 426.2 418.2 434.2 429.2 436.2 436.294.4 134.7 77.3 30.8 122.9 134.2 118.0 84.2 61.3 45.8 36.5 31.9 28.0 26.795.0 98.4 102.0 103.3 98.6 100.2 101.0 102.1 102.5 103.1 102.6 103.0 103.5 103.9
52.3 27 1 52.9 29.4 23.6 60.3 71 1 75.4 35.8 29.4 29.4 29.4 29.4 29.4196.8 221.2 231.9 232.0 225.6 230.2 238.2 231.0 226.9 231.5 232.8 233.2 230.7 231.3
-71.2 -295.9 -224.0 -259.7 -219.5 -334.5 52.9 -408.8 -229.4 -310.9 -71 7 -282.2 -324.0 -361.0-71.2 -295.9 -224.0 -259.7 -53.8 25.0 39.6 188.3 -56.2 -19.1 8.5 -156.6 -79.9 -31 7158.3 -254.8 -256.3 -252.4 -60.4 2.3 13.2 -218.7 -52.5 1 7 22.1 -203.5 -62.8 -8.3
404.3 446.5 314.7 292.7 454.3 274.5 477.8 263.0 237.8 280.5 280.7 282.7 303.7 303.7
181.4 179.6 181.6 180.8 179.5 180.3 181.1 182.3 182.5 182.1 181 7 181.5 180.9 180.212.1 8.8 8.7 7.6 7.8 8.3 12.0 7.6 8.3 6.8 9.4 7.3 7.0 6.7-0.8 -3.0 -2.2 -2.4 -2.2 -3.3 0.5 -4.0 -2.2 -3.0 -0.7 -2.6 -3.0 -3.312.8 11.8 10.8 10.0 10.0 11.6 11.5 11.6 10.5 9.8 10.0 9.9 10.0 9.9
Note. Data after 2000:Q4 are staff projections.I For corporations: Excess of capital expenditures over U.S. internal funds.
2 Includes change in liabilities not shown in lines 8 and 9.
3. Average debt levels in the period (computed as the average of period-end debt positions)
divided by disposable personal income.
2.6.4 FOF
4. NIPA surplus less changes in retirement fund assets plus consumption of fixed capital.5. Average debt levels in the period (computed as the average of period-end debt positions) divided by nominal GDP6. Excludes government-insured mortgage pool securities.

International Developments
OverviewGrowth abroad has weakened as foreign activity has been hit by spillovers fromthe U.S. slowdown, the global slump in high-tech industries, and softer domesticdemand in some countries. Accordingly, the staff's projection of foreign growthfor the first half of this year has been lowered from the January Greenbook. Alarge part of the downward revision reflects reduced growth prospects in Mexicoin light of a contraction of exports in the fourth quarter that produced a sharpdrop in Mexican GDP. Our outlook for growth in Japan was marked down aswell. A fourth-quarter surge in private investment is likely to be reversed inresponse to weakness of both private consumption and external demand. Theexpected recovery of U.S. activity, lower oil prices, and some policy easingabroad should help boost foreign growth to near its potential rate in the secondhalf of this year and in 2002. However, recent volatility in global financialmarkets has increased downside risks to this outlook. The near-term projectionfor foreign inflation has been lowered--partly because of a very abruptdeceleration of consumer prices in Mexico in recent months--but average foreigninflation is expected to return later this year to a rate of about 3 percent as globaleconomic growth picks up.
Summary of Staff Projections(Percent change from end of previous period, s.a.a.r.)
2000 Projection
Indicator 2001H1 H2 Q1 Q2 2002
_Q1_____ Qi Q2 H2
Foreign output 5.5 2.9 1.8 2.7 3.5 3.7January GB 5.8 3.2 2.3 3.1 3.5 3.7
Foreign CPI 2.1 3.6 2.0 2.7 3.0 2.8January GB 2.0 3.8 3.0 2.8 3.0 3.0
NOTE. Changes for years are measured as Q4/Q4; for half-years, Q2/Q4 orQ4/Q2; and for quarters, from previous quarter.
Our oil price projection, in line with futures prices, continues to call for a gradualdecline over the forecast period. The projected path of oil prices runs along asomewhat higher track than in the January Greenbook, however, as OPECappears to have become more willing to trade off a smaller market share forhigher prices. The foreign exchange value of the dollar once again is expected todecline over the forecast period. However, the dollar starts from a higher leveland depreciates at a slower pace than projected in the January Greenbook,reflecting its recent resilience and softer growth abroad. The projected 2 percentdepreciation of the real broad dollar index over the next seven quarters puts thedollar at a level that is 4 percent higher than in the January Greenbook.

Part 1 Summary and Outlook, March 14, 2001
Real net exports of goods and services are forecast to make a slightly negativearithmetic contribution to U.S. GDP growth both this year and next, but thenegative effect on growth will be smaller than it was last year. We expect themarked drop in real exports in the fourth quarter of last year to be temporary. Asforeign activity strengthens and the dollar moves downward, real exports shouldreturn to fairly robust growth by the end of the forecast period. However, thedollar's higher path, compared with that projected in the January Greenbook,will take a bit of the steam out of demand for exports and will lower thecontribution of net exports to growth as well.
Recent DevelopmentsInternational financial markets. The index of the exchange value of the dollarin terms of the major currencies gained 2-3/4 percent since the January FOMCmeeting as market participants reassessed the relative near-term growthprospects of the United States versus several of our major trading partners. TheU.S. dollar gained 3-1/4 percent against the Canadian dollar, as activity in Canadadecelerated more than had been expected. The yen fell 4-1/2 percent amidincreasing concern over the outlook for the Japanese economy. Growingpolitical uncertainty and comments by Japanese authorities suggesting increasingsupport for depreciation of their currency also weighed on the yen. On balance,the dollar appreciated about 1 percent against the euro and 10 percent against theAustralian dollar. The dollar gained only 1/2 percent against the index of thecurrencies of our other important trading partners.
On March 6, the Bank of Canada lowered its key policy rate 50 basis points inresponse to additional evidence of slowing economic activity. The Bank ofJapan edged back toward the zero interest rate policy that it abandoned lastAugust, lowering the target for its key overnight rate to 15 basis points. TheBank of England also cut its key interest rate by 25 basis points in earlyFebruary. The European Central Bank kept policy rates unchanged during theperiod.
Long-term interest rates in most major industrial countries have declined sincethe January FOMC by amounts that range between 10 and 20 basis points.Yields on Japanese long-term government securities have fallen considerablymore--about 35 basis points--possibly reflecting dimming prospects for sustainedrecovery and growing expectations that the Bank of Japan may implement"quantitative easing" measures involving additional bond purchases. During theintermeeting period, share prices in most major industrial countries have droppedsharply in often volatile trading. High-tech stocks were especially hard hit,buffeted by continued warnings of earnings declines. Equity prices in Japan arenow at levels that have intensified concerns about the solvency of Japanesebanks. Indeed, on March 14 nineteen of Japan's largest banks were placed oncredit watch with negative outlook by a major ratings agency.
I-28

Financial market contagion from the crisis in Turkey has been muted so far.Bond spreads for most emerging-market countries have held steady since theJanuary FOMC meeting, while stock prices have moved down in a patternsimilar to that seen in industrial countries.
. The Desk did not intervene during the period for the accounts ofthe System or the Treasury.
Economic activity abroad. In foreign industrial countries, data from the fourthquarter confirm that average growth maintained a moderate pace of about2 1/2 percent. More recent indicators, however, point to slower growth in thecurrent quarter. Growth in the euro area picked up in the fourth quarter to nearly3 percent, but the pattern across the major countries was uneven, with growth inFrance quite strong and Germany lagging behind at less than 1 percent.Canadian manufacturing has taken a fairly severe hit from the U.S. slowdown,but other sectors, such as construction and services, appear to have remainedstrong. In Japan, a fourth-quarter bounceback of investment spending pushedGDP growth in 2000:H2 a little above zero. However, consumption was veryweak in the fourth quarter, and recent indicators--including industrial production,machinery orders, construction starts, and exports--suggest that the economy isfaltering. Political turmoil and an intensifying debate about emergency policieshave added uncertainty to prospects for recovery.
Deflation of core consumer prices in Japan quickened a bit in February toslightly more than 1 percent. In some other industrial countries, core inflationrates have edged up, but price pressures generally remain subdued. Lower oilprices helped headline consumer-price inflation in the euro area fall slightly to2.4 percent in January. The figure was outside the European Central Bank's2 percent target ceiling for the eighth consecutive month, but core inflation wasonly 1.6 percent. Canadian consumer-price inflation in January was at the3 percent ceiling of the Bank of Canada's inflation band, but core inflation was2 percent. In the United Kingdom, retail-price inflation remained well below thetarget rate of 2.5 percent.
Growth in the major developing countries has slowed. Weakness in exports tothe United States prompted a sharp fourth-quarter contraction in Mexico, andactivity in Argentina remains sluggish. Growth in emerging Asia has beenundercut by weaker global demand and ongoing adjustments in the high-techsector. Indeed, industrial production in some countries in the region has beencontracting, and growth in China appears to have slowed. The situation inTurkey remains unsettled as the authorities await finalization of a newIMF-supported stabilization program. Following the decision on February 22 toallow the Turkish lira to float, it has depreciated 30 percent on balance.
1-29International Developments

Prices of internationally traded goods. The spot price of West Texasintermediate crude, while volatile, has averaged nearly $30 per barrel so far thisquarter, about $2 per barrel less than in 2000:Q4. The modest drop in oil pricesoccurred despite significant disruptions to Iraqi oil exports, as marketparticipants revised down their assessment of U.S. and world economic activity.
In January, prices of imported core goods rose at a modest rate, but less rapidlythan in December. Higher prices for industrial supplies, including continuedincreases in the price of imported natural gas and an upturn in prices ofunfinished metals, led the January rise. On the export side, higher prices ofindustrial supplies--especially metals and chemicals--also contributed to anincrease in prices of exported core goods in January following declines of coregoods prices in the previous three months.
U.S. international transactions. The U.S. trade deficit in goods and serviceswas $33 billion in December, about unchanged from its November level, as bothimports and exports continued to fall. Exports of capital goods and industrialsupplies were particularly soft in December. On the import side, increasedpayments for imported natural gas and oil in December only partially offsetdeclines in the value of imports of automotive products, consumer goods, andcomputers. For the fourth quarter, the trade deficit was about $16 billion larger(annual rate) than in the third quarter. Fourth-quarter exports contracted across awide range of product categories and trading partners, with noteworthy declinesin U.S. exports to Mexico and developing Asia, while the value of imports wasabout the same as the high level recorded in the previous quarter.
OutlookThe dollar. The intermeeting appreciation of the dollar against the yen andCanadian dollar puts the starting level for the projected path of the dollar'sforeign exchange value above that in the January Greenbook. The dollar still isexpected to depreciate over the forecast period as the large and expanding U.S.current account deficit at some point strains investors' willingness to increaseholdings of dollar-denominated assets. In the face of the dollar's resilience torecent adverse news about the U.S. economy and heightened concerns about theoutlook for Japan (and the yen), we now project a less steep depreciation (about2 percent for the broad real dollar index over the next seven quarters) than wedid in January.
Foreign industrial countries. The slowdown of economic activity in the majorindustrial countries in the second half of last year is expected to persist throughthe current quarter, as average growth is forecast to fall below 1-1/2 percent. Theprojected gradual acceleration of U.S. GDP, somewhat easier fiscal andmonetary conditions in some foreign countries, and lower oil prices should bringabout more robust growth by midyear. The average pace of growth in the
I-30 Part 1 Summary and Outlook, March 14, 2001

International Developments 1-31
foreign industrial countries is projected to rebound to 2 percent in the secondhalf of 2001 and to reach 3 percent in 2002.
Although recent signs of economic weakness in Germany raise concerns, Europeas a whole appears to be experiencing only a modest slowdown. Indicators ofconsumer confidence remain strong. Fiscal stimulus already in place, continuedimprovement of labor market conditions, declining oil prices, and--in the case ofthe euro area--gains in competitiveness from earlier depreciation of the euroshould provide solid support for a pickup in growth in coming months. ForCanada, the expected U.S. rebound, along with fiscal stimulus, lower interestrates, and a weaker currency, should boost demand and make the country's fairlysharp slowdown brief.
In Japan, deepening worries about longer-term economic prospects, historicallyhigh unemployment, and re-intensifying concerns about the health of thefinancial sector as stock prices continue to decline--all point to continued veryweak private domestic demand. Neither monetary policy nor the recentlyannounced policy package is likely to provide substantial additional stimulus.Japanese exports, which have slowed sharply lately, are exposed to projectedweak growth in Japan's Asian trading partners. We are projecting growth ofJapanese GDP to be slightly negative this year and a modest 1-1/4 percent in 2002.
The recent and expected near-term slowing of growth in the foreign industrialcountries will keep capacity pressures restrained, and core inflation should riseonly slightly over the next two years. The decline in oil prices since the fourthquarter and the further downward trend in oil prices that is expected to occurlater in the forecast period should continue to lower headline inflation.
With near-term growth soft and core inflation moderate over the forecast period,we expect that policy interest rates in the foreign industrial countries will benudged down or left unchanged. We expect the Bank of Japan to return to thezero-interest-rate policy by the middle of this year. The ECB is projected to cutofficial rates 25 basis points in the second half of this year as inflation movesback below the target ceiling. Well-behaved inflation also should give the Bankof England scope for another 25-basis-point cut in coming months. The Bank ofCanada is expected to keep policy on hold during the forecast period.
Other countries. We now estimate that average real GDP growth in the majordeveloping-country trading partners of the United States slowed markedly fromrelatively robust rates during much of last year to only about 1/4 percent in2000:Q4. In the current quarter, average growth is expected to remain subduedat around 2-3/4 percent, before firming to just under 5 percent by the end of thisyear. The near-term outlook for Mexico has been revised down sharply, as weakexports (particularly to the United States) and tight domestic policies have been

restraining demand, but we expect a fairly quick bounceback spurred by strongerU.S. growth. Risks facing Argentina recently have become more pronounced,but we continue to expect the government's policies to be sufficient to allow theeconomy to record an anemic recovery beginning later this year. In developingAsia, weaker demand from industrial countries, especially for high-techproducts, will continue to restrain growth in the near term. However, growth inthe region should recover to a sustainable pace of about 5 percent.
Prices of internationally traded goods. We assume that OPEC will cutproduction targets modestly at its March 16 meeting and that, over the next fewmonths, oil prices will remain near current levels. We continue to project thatworld oil production will exceed consumption and allow a gradual increase instocks over the forecast period. Consistent with futures quotes, we project that,after midyear, oil prices will decline gradually over the forecast period. The endpoint of this projection is slightly higher than that in the January Greenbook,consistent with OPEC's apparent greater willingness to trade higher near-termoil prices for market share.
Selected Trade Prices(Percent change from end of previous period except as noted; s.a.)
2000 Projection
Trade category 2001Q3 Q4 2002
Q1 Q2 H2
ExportsNonagricultural (core) 1.2 .4 .3 .2 .5 .6Agricultural -12.5 10.7 .6 6.3 5.5 5.0
ImportsNon-oil (core) 1.4 .9 1.6 .6 1.4 2.5Oil (dollars per barrel) 28.73 29.11 25.82 25.65 24.54 21.92
NOTE. Prices for exports and non-oil imports of goods, excluding computersand semiconductors, are on a NIPA chain-weighted basis.
The price of imported oil for multi-quarter periods is the price for the finalquarter of the period.
Core import price inflation is projected to rise from 0.9 percent at an annual ratein the fourth quarter of last year to 1.6 percent in the current quarter and to moveback down in the second quarter. This pattern is influenced by sharp increases inprices of imported natural gas in December and January that are estimated tohave reversed in February and March. Thereafter, prices of core imports areprojected to accelerate gradually in the second half of this year until their growthlevels off at about 2-1/2 percent in 2002, in response to the projected path of thedollar and movements in prices abroad. Prices of exported core goods are
I-32 Part 1 Summary and Outlook, March 14, 2001

International Developments 1-33
projected to increase at an average rate of about 1/2 percent throughout theforecast period, as declines in energy-related products are more than offset bymodest increases in prices of other exported goods.
U.S. international transactions. Real exports of goods and services, whichgrew at an average annual rate of nearly 15 percent in the second and thirdquarters of last year, contracted in the fourth quarter. The abrupt swing wasespecially noticeable in exports of capital goods but was evident in all othermajor export categories as well. We expect that exports will decline a bit furtherin the current quarter, owing to somewhat slower-than-expected economicgrowth abroad late last year and in early 2001. As in our previous forecast,export growth is projected to accelerate thereafter as the pace of economicactivity abroad moves back up and projected dollar depreciation reduces relativeprices. Export growth is projected to average about 4 percent this year and about8 percent in 2002.
Summary of Staff Projectionsfor Trade in Goods and Services
(Percent change from end of previous period, s.a.a.r.)
2000 Projection
Measure 2001Q3 Q4 Q 2002
Q1 Q2 H2
Real exports 13.9 -6.1 -1.7 3.5 7.1 8.1January GB 13.9 -4.7 .8 4.9 9.3 9.9
Real imports 17.0 -.7 .7 5.1 6.2 8.2January GB 17.0 -.8 -2.3 6.0 6.5 8.2
NOTE. Changes for years are measured as Q4/Q4; for half-years, Q2/Q4 orQ4/Q2; and for quarters, from previous quarter.
After showing unusual strength during the first three quarters of 2000, growth ofreal imports of goods and services braked sharply and registered a small decline.The shift was attributable largely to fewer imports of automotive products,computers, semiconductors, oil, and other industrial supplies. Given theprojected path of U.S. GDP, imports are forecast to record another sluggishquarter before rebounding in the second quarter and then expanding at anaverage 7 percent rate over the remainder of the forecast period. Expected dollardepreciation will make relative prices a slightly restraining factor by the end ofnext year.
We project that the contribution of exports to U.S. GDP growth will average1/2 percentage point in 2001 and rise to 1 percentage point in 2002. Imports are

expected to make an average negative contribution of 3/4 percentage point in2001 and 11 percentage point in 2002. Overall, the negative arithmeticcontribution of the foreign sector to GDP growth averages about 1/4 percentagepoint both this year and next, much less than in 2000. The U.S. current accountdeficit as a share of GDP is projected to rise slowly, from 4-1/2 percent in 2000 tonearly 5 percent in 2002. Much of the projected deterioration is in the goods andservices account, but the net outflow of investment income also increasessubstantially as the U.S. net liability position expands.
Alternative simulations. To quantify the effects of possible risks to theoutlook for the U.S. economy, we consider two alternative scenarios in whicheconomic shocks are simulated using the FRB Global model. The first scenarioassumes a markedly diminished investor appetite for dollar-denominated assetsthat results in a considerably larger downward adjustment of the dollar than themodest depreciation assumed in the baseline outlook. The second alternativeassumes a sharp immediate fall in private real investment demand in Japancoupled with depreciation of the yen.
In the first scenario, the shock consists of an exogenous rise in the risk premiumon dollar-denominated assets that, with no changes in the spread between U.S.and foreign real interest rates, would produce an immediate real dollardepreciation of 15 percent relative to baseline. Two cases of this alternative areconsidered: The first case assumes no U.S. monetary policy response by holdingthe real federal funds rate unchanged from its baseline path, while the secondassumes that monetary policy is adjusted according to a Taylor rule. In bothcases, the major foreign central banks adjust interest rates according to a Taylorrule, except that Japan holds its short-term real interest rate constant.
When U.S. monetary policy does not respond, annual real GDP growth is nearly1/2 percentage point higher in 2001 and about 3/4 percentage point higher in 2002than in the baseline. Rising import prices and an expanding output gap putupward pressure on the inflation rate. As a result, the core PCE inflation raterises by about 3/4 percentage point in 2001 and 1/2 percentage point in 2002.When U.S. monetary policy does respond, real interest rates gradually rise,inducing an appreciation of the real exchange rate that counters some of theshock. Real GDP growth is about 1/4 percentage point higher in both 2001 and2002. The core PCE inflation rate is about 1/2 percentage point higher in 2001and 1/4 percentage point higher in 2002.
In the second scenario, we consider the effects of an autonomous shock toprivate real investment in Japan that would reduce its share of GDP by 3percentage points of baseline GDP, coupled with a shock to the risk premium onJapanese assets that reduces the real value of the yen 10 percent. This "Japanesegloom" scenario depresses U.S. aggregate demand, in part because real yen
I-34 Part 1: Summary and Outlook, March 14, 2001

International Developments I-35
depreciation and lower investment spending in Japan has a direct effect on U.S.exports. This direct effect is reinforced through spillovers to other countries,particularly to Japan's major trading partners in Asia that are also importantexport markets for the United States. Even so, with no U.S. monetary policyresponse, U.S. output growth would decline only about 1/4 percentage point in2001 and by less in 2002. Core price inflation would drop slightly in 2001 andabout 1/4 percentage point in 2002. (The shock depresses the level of Japaneseoutput 4 percent below baseline in 2001 and 2 percent below baseline in 2002.)
Alternative Simulations:Weaker Dollar
(Percent change from previous period, annual rate)
2001 2002Indicator and simulation HI H2 HI
H1 H2 H1 H2
U.S. real GDPBaseline 1.1 2.9 3.5 3.8Immediate 15 percent depreciation
Unchanged real funds rate 1.3 3.5 4.3 4.7Taylor Rule 1.2 3.3 3.9 4.1
U.S. PCE prices excl. food and energyBaseline 2.0 1.9 1.7 1.7Immediate 15 percent depreciation
Unchanged real funds rate 2.4 2.9 2.4 2.0Taylor Rule 2.3 2.7 2.2 1.8
NOTE. H1 is Q2/Q4; H2 is Q4/Q2.

I-36 Part 1: Summary and Outlook, March 14, 2001
Alternative Simulations:Yen Depreciation and Investment Decline in Japan
(Percent change from previous period, annual rate)
2001 2002Indicator and simulation H2 H
HI H2 H1 H2
U.S. real GDPBaseline 1.1 2.9 3.5 3.8Yen/Investment Demand Shocks in Japan
Unchanged real funds rate .8 2.8 3.4 3.7Taylor Rule .9 2.9 3.5 3.9
U.S. PCE prices excl. food and energyBaseline 2.0 1.9 1.7 1.7Yen/Investment Demand Shocks in Japan
Unchanged real funds rate 2.0 1.7 1.5 1.6
Taylor Rule 2.0 1.8 1.6 1.6
NOTE. H1 is Q2/Q4; H2 is Q4/Q2.
Part 1: Summary and Outlook, March 14, 2001I-36
I-36

Strictly Confidential (FR)Class II FOMC
OUTLOOK FOR FOREIGN
March 14, 2001
REAL GDP AND CONSUMER PRICES:(Percent, Q4 to Q4)
SELECTED COUNTRIES
Measure and country
----- Projected----
1994 1995 1996 1997 1998 1999 2000 2001 2002
REAL GDP (1)
Total foreign 5.2 2.4 4.0 4.3 1.2 4.8 4.2 2.9 3.7
Industrial Countriesof which:CanadaJapanUnited KingdomEuro-12Germany
Developing CountriesAsia
KoreaChina
Latin AmericaMexicoBrazil
CONSUMER PRICES (2)
Industrial Countriesof which:
CanadaJapanUnited Kingdom (3)Euro-12 (4)Germany
Developing CountriesAsia
KoreaChina
Latin AmericaMexicoBrazil
4.1 1.9 2.5 3.7 2 2 3.8 3.4 2.2 3.0
5.51.74.63.02.9
6.98.89.2
16.35.45.2
10.2
1.42.61.91.51.1
3.17.27.4
12.6-3.7-7.1-0.9
3.2-1.42.02.01 0
-0.1-1.8-4.69.51.22.8-0.8
4.90.43.23.32.5
6.38.9
14.06.24.35.53.4
1.1 1.3 1.4 1.5 1.0 1.2 1.9 1.2 1.3
-0.00.82.2NA2.8
22.910.85.8
26.954.07.0
1196.9
2.0-0.82.9NA1.4
16.96.44.3
11.142.148.921.5
2.00.13.2NA1.3
11.14.85.06.8
25.928.29.6
6.82.84.90.9
15.617.24.7
9.14.45.9-1.215.517.51.6
2.4-1.32.21.51.1
4.60.21.2
-0.912.613.68.3
3.1-1.12.12.72.5
1.8-0.82.11.71.4
1.8-0.42.41.91.5
Foreign GDP aggregates calculated using shares of U.S. non-agricultural exports.Foreign CPI aggregates calculated using shares of U.S. non-oil imports.CPI excluding mortgage interest payments, which is the targeted inflation rate.Harmonized CPI's, weighted by shares in final consumption of households convertedcurrency using estimated PPP exchange rates.
to a common
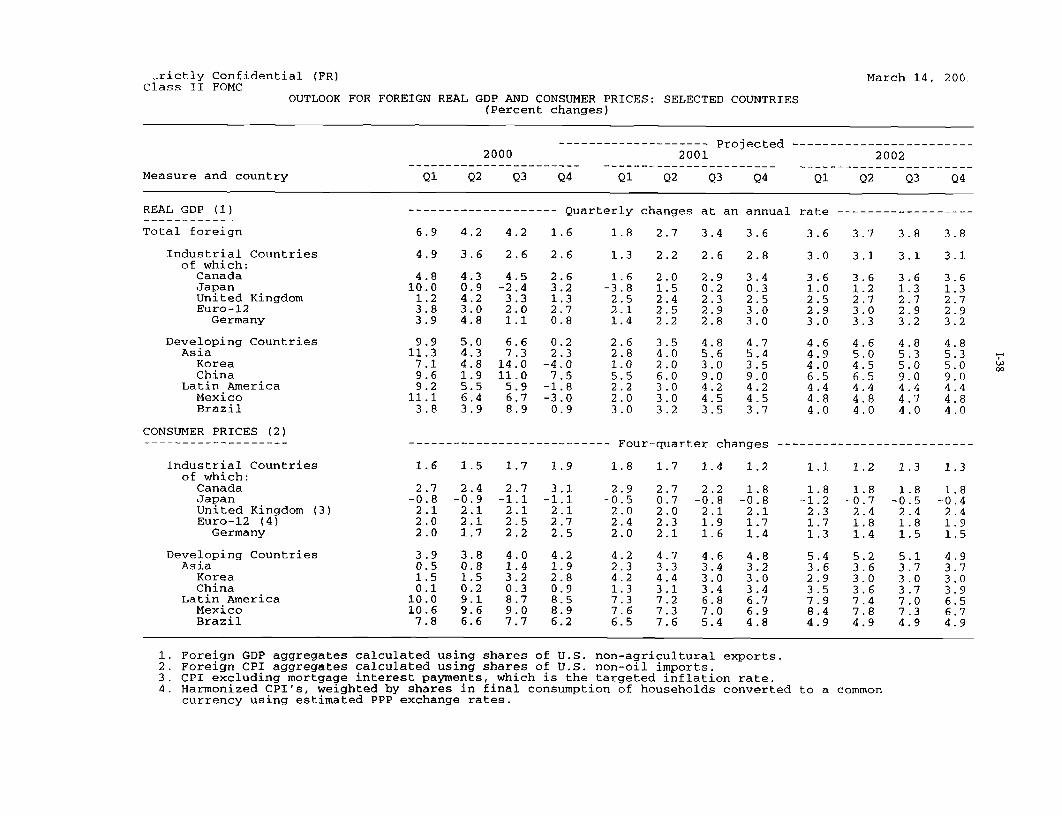
Strictly Confidential (FR)Class II FOMC
March 14, 2001
OUTLOOK FOR FOREIGN REAL GDP AND CONSUMER PRICES: SELECTED COUNTRIES(Percent changes)
-------------------- Projected ------------------------2000 2001 2002
Measure and country Q1 Q2 Q3 Q4 Q1 Q2 Q3 Q4 Q1 Q2 Q3 Q4Measure and country Q1 Q2 Q3 Q4 Q1 Q2 Q3 Q4 Q1 Q2 Q3 Q4
REAL GDP (1)
Total foreign
Industrial Countriesof which:CanadaJapanUnited KingdomEuro-12Germany
Developing CountriesAsia
KoreaChina
Latin AmericaMexicoBrazil
CONSUMER PRICES (2)-------------------
Industrial Countriesof which:CanadaJapanUnited Kingdom (3)Euro-12 (4)Germany
Developing CountriesAsia
KoreaChina
Latin AmericaMexicoBrazil
-------------------- Quarterly changes at an annual rate ------------------
6.9 4.2 4.2 1.6
4.9 3.6 2.6 2.6
4.810.01.23.83.9
9.911.37.19.69.2
11.13.8
4.5-2.4
3.32.01.1
6.67.3
14.011.0
5.96.78.9
1.8 2.7 3.4 3.6
1.3 2.2 2.6 2.8
3.6 3.7 3.8 3.8
3.0 3.1 3.1 3.1
1.6-3.8
2.52.11.4
0.22.3-4.07.5-1.8-3.00.9
--------------------------- Four-quarter changes --------------------------
1.6 1.5 1.7 1.9
2.7-0.8
2.12.02.0
3.90.51.50.1
10.010.6
7.8
2.4-0.9
2.12.11.7
2.7-1.1
2.12.52.2
3.1-1.1
2.12.72.5
1.8 1.7 1.4 1.2
2.9-0.52.02.42.0
2.2-0.82.11.91.6
1.8-0.82.11.71.4
1.1 1.2 1.3
1.8-1.2
2.31.71.3
1.8-0.52.41.81.5
1.3
1.8-0.42.41.91.5
Foreign GDP aggregates calculated using shares of U.S. non-agricultural exports.Foreign CPI aggregates calculated using shares of U.S. non-oil imports.CPI excluding mortgage interest payments, which is the targeted inflation rate.Harmonized CPI's, weighted by shares in final consumption of households convertedcurrency using estimated PPP exchange rates.
to a common

Strictly Confidential (FR)Class II FOMC
March 14, 2001
OUTLOOK FOR U.S. INTERNATIONAL TRANSACTIONS
------ Projected ------1994 1995 1996 1997 1998 1999 2000 2001 2002
NIPA REAL EXPORTS and IMPORTS
Net Goods & ServicesExports of G&SImports of G&S
Exports of G&SServicesAgricultural GoodsComputersSemiconductorsOther Goods 1/
Imports of G&SServicesOilComputersSemiconductorsOther Goods 2/
Net Goods & ServicesExports of G&SImports of G&S
Percentage point contribution to GDP growth, Q4/Q4
-0.31.0-1.3
10.58.2
16.327.466.9
6.9
12.21.8-0.239.054.512.3
-86.5732.8819.4
0.41.0
-0.6
-0.21.1-1.3
-0.81.0
-1.7
Percentage change, Q4/Q4
9.78.8
-4.039.179.65.7
5.05.52.4
35.092.4-1.2
9.88.93.8
21.644.6
7.8
11.25.37.8
17.856.710.5
8.51.41.0
25.821.310.9
14.314.03.9
33.032.912.7
-1.10.3
-1.4
2.22.8
-0.37.09.31.3
11.29.54.6
26.7-7.311.6
-1.10.5-1.5
4.30.2-0.513.334.4
4.1
12.02.1-3.925.034.013.9
-0.90.7-1.6
6.81.97.6
23.926.76.1
11.513.313.214.623.610.1
Billions of chained 1996 dollars
-78.4808.2886.6
-89.0874.2963.1
-113.3981.5
1094.8
-221.01003.61224.6
-322.41033.01355.3
-412.71126.51539.2
US CURRENT ACCOUNT BALANCECurrent Acct as Percent of GDP
Net Goods & Services (BOP)
Investment Income, NetDirect, NetPortfolio, Net
Other Income & Transfers,Net
Billions of dollars
-118.6 -109.5 -123.3 -140.5 -217.1 -331.5 -440.6 -483.4 -534.0-1.7 -1.5 -1.6 -1.7 -2.5 -3.6 -4.4 -4.7 -4.9
-97.0 -96.0 -102.1 -105.9 -166.9
21.155.2
-34.1
-42.7
25.064.9
-39.9
-38.6
23.469.4
-46.0
11.171.9
-60.9
-44.6 -45.7
-1.067.7
-68.8
-49.2
-265.0 -369.7 -400.2 -436.3
-13.162.7
-75.8
-53.4
-13.277.6
-90.8
-57.7
-24.582.0
106.4
-58.7
-38.086.5
-124.5
-59.7
1. Merchandise exports excluding agricultural products, computers, and semiconductors.2. Merchandise imports excluding oil, computers, and semiconductors.
-0.20.4-0.7
4.02.60.3
19.717.92.3
4.52.90.5
14.922.63.6
8.16.12.8
33.637.44.2
8.24.92.9
28.738.66.1
-462.71156.91619.6
-502.71237.51740.2

Strictly confidential (FR)Class II FOMC
March 14, 2001
OUTLOOK FOR U.S. INTERNATIONAL TRANSACTIONS
1997 1998 1999---------------------------- ---------------------------- ----------------------- _Q1 Q2 Q3 Q4 Q1 Q2 Q3 Q4 Q1 Q2 Q3 Q4
PA REAL EXPORTS and IMPORTSPercentage point contribution to GDP growth
Net Goods & ServicesExports of G&SImports of G&S
Exports of G&SServicesAgricultural GoodsComputersSemiconductorsOther Goods 1/
Imports of G&SServicesOilComputersSemiconductorsOther Goods 2/
Net Goods & ServicesExports of G&SImports of G&S
-1.00.8
-1.8
7.5-5.8-19.460.050.312.2
15.320.0-7.546.678.111.6
-0.31.9-2.2
-0.9 -0.91.2 -0.1-2.1 -0.8
-1.6 -1.9 -1.00.1 -0.3 -0.4
-1.7 -1.6 -0.7
0.1 -1.4 -1.4 -1.11.5 -0.9 0.6 1.0
-1.5 -0.6 -2.0 -2.1
Percentage change from previous period, s.a.a.r.
17.69.46.7
44.522.120.6
18.85.6
36.845.826.017.2
10.66.0
12.025.719.610.8
17.323.15.7
32.431.614.8
-0.8-3.37.9
-14.0-1.40.9
6.48.3
-12.910.55.67.5
1.05.2
-2.7-7.52.10.0
14.220.06.4
32.52.0
12.6
-3.06.4
-13.87.6
-13.6-6.6
13.16.7
41.222.6
-22.914.0
-3.2-10.0-12.5
14.719.0-1.2
5.59.82.1
10.60.14 5
15.110.834.714.735.914.3
12.22.2
-22.043.2-6.115.6
-7.9-3.8
-33.45.2
38.7-11.1
4.5-7.72.4
28.817.8
5.0
5.82.8
33.126.739.11.4
16.22.5
29.448.553.814.6
Billions of chained 1996 dollars, s.a.a.r.
-94.0940.3
1034.3
-100.6979.21079.8
-119.6 -139.21004.2 1002.11123.8 1141.2
-175.31004.51179.8
-219.7 -244.1996.8 988.81216.6 1232.9
-244.91024.11269.0
-279.8 -314.6 -342.61003.3 1017.6 1042.61283.1 1332.2 1385.2
: CURRENT ACCOUNT BALANCE -137.5rrent Account as % of GDP -1.7
Net Goods & Services (BOP) -108.2
Investment Income, NetDirect, NetPortfolio, Net
11.568.9
-57.4
Other Inc. & Transfers, Net -40.8
Billions of dollars, s.a.a.r.
-119.9 -133.6 -171.1-1.4 -1.6 -2.0
-169.6-2.0
-205.9-2.4
-245.2-2.8
-94.3 -101.1 -120.1 -134.5 -166.4 -185.3 -
16.376.6
-60.3
10.774.1
-63.4
5.768.1
-62.4
9.174.9
-65.7
6.072.4
-66.4
-12.159.0
-71.1
247.9 -266.5 -315.9 -358.6 -384.9-2.8 -2.9 -3.4 -3.8 -4.0
181.4 -210.7 -253.2 -290.9 -305.1
-7.364.7
-71.9
-41.9 -43.2 -56.7 -44.3 -45.5 -47.8 -59.2
-7.164.1
-71.2
-11.358.8
-70.0
-16.862.8
-79.6
-48.7 -51.5 -51.0
1 Merchandise exports excluding agricultural products, computers, and semiconductors.2 Merchandise imports excluding oil, computers, and semiconductors.
-0.41.1-1.4
10.2-2.538.022.237.811.9
16.96.3
-5.814.824.121.5
10.34.6
-19.91.2
22.516.3
10.78.2
-31.511.243.314.9
-352.51068.41420.9
-17.365.1
-82.4
-62.5

Strictly Confidential (FR)Class II FOMC
March 14,
OUTLOOK FOR U.S. INTERNATIONAL TRANSACTIONS
2000------------------------- Projected ---
2001 2002
Q1 Q2 Q3 Q4 Q1 Q2 Q3 Q4 Q1 Q2 Q3
[PA REAL EXPORTS and IMPORTS
Net Goods & ServicesExports of G&SImports of G&S
Exports of G&SServicesAgricultural GoodsComputersSemiconductorsOther Goods 1/
Imports of G&SServicesOilComputersSemiconductorsOther Goods 2/
Percentage point contribution to GDP growth
-0.9 -1.0 -0.9 -0.6 -0.3 -0.4 -0.40.7 1.5 1.5 -0.7 -0.2 0.4 0.5
-1.6 -2.5 -2.4 0.1 -0.1 -0.7 -0.9
Percentage change from previous period, s.a.a.r.
6.36.9
25.344.620.70.7
12.016.630.32.8
20.79.7
14.33.5
-2.044.971.214.9
18.610.635.344.533.515.8
13.9-2.842.527.538.617.2
17.022.3-4.928.788.915.1
-6.10.4
-23.4-11.8-10.0-6.5
-0.74.7-2.1-9.7
-23.50.5
-1.7-1.1
-11.24.1-2.0-1.6
0.72.98.7
-2.08.3
-0.9
3.52.40.6
12.68.33.1
5.11.74.7
11.512.6
5.0
5.13.95.8
32.434.9
0.8
6.42.67.0
26.336.1
4.4
0.11.0
-0.9
9.25.37.3
32.434.9
6.9
5.94.2
-16.426.336.1
5.9
-0.6 -0.50.5 0.8
-1.1 -1.4
4.65.72.9
33.637.4-1.3
7.84.7
-1.328.738.66.3
7.86.12.7
33.637.43.7
9.34.8
22.828.738.6
6.0
Billions of chained 1996 dollars, s.a.a.r.
Net Goods & ServicesExports of G&SImports of G&S
3 CURRENT ACCOUNT BALANCEirrent Account as % of GDP
-376.81084.81461.7
-403.41121.81525.2
-427.71158.81586.4
-442.91140.71583.6
-450.41135.91586.3
-460.21145.81606.0
-471.21160.11631.3
-469.0 -487.0 -502.2 -512.71185.9 1199.3 1222.1 1247.01654.9 1686.4 1724.3 1759.6
-508.91281.61790.5
Billions of dollars, s.a.a.r.
-406.8 -420.7 -452.4 -482.4 -470.3 -475.9 -487.5 -499.9 -511.3 -529.3 -542.1 -553.5-4.2 -4.2 -4.5 -4.8 -4.6 -4.6 -4.7 -4.8 -4.8 -4.9 -5.0 -5.0
Net Goods & Services (BOP) -341.3
Investment Income, NetDirect, NetPortfolio, Net
-11.968.3
-80.2
Other Inc. & Transfers, Net -53.6
-355.2 -383.3 -399.0 -391.5 -398.8 -407.3 -403.1
-10.876.1
-86.9
-12.7 -17.486.2 79.8
-98.9 -97.1
-54.7 -56.4 -66.1
-23.1 -21.0 -24.1 -29.776.4 82.9 84.7 83.8
-99.6 -103.9 -108.8 -113.5
-55.6 -56.1
-420.8
-33.984.1
-118.0
-435.5
-36.686.0
-122.6
-445.9 -443.0
-39.187.7
-126.8
-42.488.3
-130.7
-56.1 -67.1 -56.6 -57.1 -57.1 -68.1
1. Merchandise exports excluding agricultural products, computers, and semiconductors.2 Merchandise imports excluding oil, computers, and semiconductors.
-0.30.9
-1.2
8.46.22.8
33.637.4
4.5
8.55.07.6
28.738.6
6.0
0.21.2
-1.1
11.66.22.9
33.637.410.0
7.25.3
-13.928.738.66.2