fomc 20000516 g bpt 120000511
TRANSCRIPT

Prefatory Note
The attached document represents the most complete and accurate version available based on original copies culled from the files of the FOMC Secretariat at the Board of Governors of the Federal Reserve System. This electronic document was created through a comprehensive digitization process which included identifying the best-preserved paper copies, scanning those copies,1 and then making the scanned versions text-searchable.2 Though a stringent quality assurance process was employed, some imperfections may remain.
Please note that this document may contain occasional gaps in the text. These gaps are the result of a redaction process that removed information obtained on a confidential basis. All redacted passages are exempt from disclosure under applicable provisions of the Freedom of Information Act.
1 In some cases, original copies needed to be photocopied before being scanned into electronic format. All scanned images were deskewed (to remove the effects of printer- and scanner-introduced tilting) and lightly cleaned (to remove dark spots caused by staple holes, hole punches, and other blemishes caused after initial printing). 2 A two-step process was used. An advanced optimal character recognition computer program (OCR) first created electronic text from the document image. Where the OCR results were inconclusive, staff checked and corrected the text as necessary. Please note that the numbers and text in charts and tables were not reliably recognized by the OCR process and were not checked or corrected by staff.

Confidential (FR) Class II FOMC
Part 1 May 11, 2000
CURRENT ECONOMICAND FINANCIAL CONDITIONS
Summary and Outlook
Prepared for the Federal Open Market Committeeby the staff of the Board of Governors of the Federal Reserve System

Confidential (FR) Class II FOMC
May 11,2000
Summary and Outlook
Prepared for the Federal Open Market Committeeby the staff of the Board of Governors of the Federal Reserve System

Domestic Developments
OverviewU.S. economic activity has continued to expand impressively. We estimate thatreal GDP rose at an annual rate of around 5 percent in the first quarter, as a surgein private domestic final purchases more than offset sizable declines in netexports and inventory investment. Indeed, given that the measured advance inoutput was held down about 1 percentage point by a timing shift in payments toDepartment of Defense vendors, activity appears to have slowed little from thespectacular growth pace of the second half of 1999. Moreover, the availableinformation for the current quarter is pointing to another strong advance, perhapsagain in the neighborhood of 5 percent.
Such rapid expansion has pushed resource utilization rates upward--despite whatwe think is substantial ongoing structural improvement in productivity. Lastmonth, the unemployment rate edged below the 4 percent mark for the first timein more than thirty years, a development entirely consistent with the anecdotalreports in the Beige Book and elsewhere of an extremely tight labor market.Against this backdrop, and with the effects of the steep run-up in oil prices of thepast year filtering through the economy, we are not surprised to be seeing somesigns of a general pickup in wage and price inflation. Nonetheless, the recentnews, of which big jumps registered by the consumer price and employment costindexes were only a part, has been striking enough that we have elevated ourinflation projection slightly more than we might have solely on the basis of thehigher resource utilization now in our forecast.
Looking ahead, in light of the greater inflationary pressure, we have raised theassumed path for the nominal federal funds rate a notch. In the stock market, theWilshire 5000 has fluctuated mainly in the 13,000 to 14,000 range since lastDecember, making no further progress on what were very favorable first-quarterearnings reports. In recent days, equity prices have run around the low end ofthe range, and our forecast assumes that they will continue to do so over the nextyear and a half; this implies a declining wealth-income ratio, which adds to therestraint on aggregate demand. Consequently, our baseline projection continuesto call for a considerable moderation of real GDP growth, to just over 4 percentin the second half of 2000 and to a little more than 3-1/2 percent in 2001. Theunemployment rate is little changed over this period.
To achieve such a slackening in output growth, real domestic spending probablywill have to decelerate even more markedly, as the decline in U.S. net exports isexpected to slow in coming quarters. Overall, economic activity in the rest ofthe world has continued to surpass expectations, and we have carried some ofthe surprise forward by boosting projected foreign output growth a bit, especiallyin the near term. Meanwhile, despite the good news from abroad, the dollar hasregistered an unanticipated appreciation on exchange markets. In light of the

I-2 Part 1: Summary and Outlook May 11, 2000
dollar's ongoing strength, but with more than a little trepidation, we have raisedthe level of the trade-weighted dollar throughout the projection.
The elevation of the exchange rate path is modest, however, and we continue toanticipate a gradual dollar depreciation that contributes to a rise in core non-oilimport prices over coming quarters. Meanwhile, although some further easingof oil prices likely lies ahead, the pass-through effects of the earlier rise probablyhave yet to run their full course. All told, we see no major disinflationary offsetto the resource pressures in the domestic economy. Thus, core PCE prices,which increased just 1.5 percent in 1999, are projected to rise 2.2 percent thisyear and 2.4 percent next. The predictions for 2000 and 2001 are 0.2 pointshigher than in the March Greenbook.
Some Key Background FactorsLong-term interest rates--at least outside the junk bond sector--slipped a bit inthe initial part of the intermeeting period, but they have more than reversed thatmove since mid-April. Although we are assuming just a tad more tightening ofmoney market conditions than appears to be built into the present term structure,we are projecting a significant further rise in long rates over the next severalquarters. We suspect that the continued labor market pressures and the updrift incore inflation will make financial market participants less sanguine than they arenow about the prospects for an early peaking of short-term rates, so that the yieldcurve will flatten less than one might otherwise have expected.
The shift in market expectations just described presumably would not be bullishfor equity prices either. So, even though the recent upside surprise in corporateprofits and economic activity has led us to raise the level of earnings throughoutthe forecast period, we have retained the projection of an essentially flat stockmarket. Early declarations that April 14 was "The Day the NASDAQ Died"may overstate the case, but the crash of many Internet stocks and the morefrequent mention of price-earnings multiples may be an indication that themarket has regained some sanity; moreover, if we are right that a considerableslowing in profit momentum lies ahead, the current remarkable optimism aboutlonger-range earnings gains will be tested. We would underscore once again,however, our lack of conviction about the particular equity price path we havebuilt into our baseline forecast. And, once again, we have explored the possibleeconomic consequences of both higher and lower share prices in modelsimulations at the end of this section.
Our fiscal policy assumptions have been adjusted somewhat to reflect recentlegislative developments. The elimination of the social security earnings testsigned into law in early April is projected to raise benefit payments about$4 billion per year over the next few years. Furthermore, we have added some

Domestic Developments I-3
features of the congressional budget resolution to our forecast. The resolutioncalls for undoing last fall's legislation that delayed certain wage and benefitpayments from September to October of this year. We have incorporated thisreversal, which boosts outlays recorded in fiscal 2000 by $10 billion, and weassume that the additional resources freed up in fiscal 2001 will be used tofinance spending initiatives. We have also taken on board the proposed increasein agricultural subsidies, which may raise farm income about $5 billion per yearbeginning in the second half of this year, and the proposed income tax cut,which adds roughly $15 billion to disposable income in 2001.
Despite these stimulative additions, our forecast for the unified budget surplusruns higher than in the March Greenbook. Given the strength of tax receipts inrecent weeks, we now project unified surpluses of $225 billion in fiscal 2000and $269 billion in fiscal 2001. However, with the on-budget surplus projectedto reach $99 billion next year, we believe that the risks remain tilted decidedlytoward more spending increases or tax cuts than we have assumed.
Crude oil prices have fallen, on balance, since mid-March. The supply responseto OPEC's decision to raise production has been unexpectedly quick, and it nowlooks as though the price of WTI may average about $26.50 per barrel thisquarter--more than $3 below our March Greenbook forecast. The longer-termprojection is consistent with futures quotes and calls for the WTI price to driftdown to less than $22 by the end of 2001.
The Outlook for Real Economic ActivityAlthough it is mid-May, significant uncertainty remains about the outcome forfirst-quarter GDP, let alone about where activity is headed in the current quarter.In the case of the earlier period, the arrival in coming days of data on Marchretail inventories and international trade could alter our estimate of 4.9 percentreal GDP growth and give us a little different sense of the tendencies in theeconomy as we entered the spring.
Regarding the second quarter, our point-forecast for measured GDP growth is5-1/4 percent--with the rebound of federal government purchases from theartificially depressed first-quarter level accounting for about 1/2 percentage pointof the gain. The April labor market report, putting production worker hours3/4 percent (not at an annual rate) above the first-quarter average and theunemployment rate a little lower, argues for a strong output increase. Thesizable rise in manufacturing hours also points to a big jump in industrialproduction last month.

I-4 Part 1: Summary and Outlook, May 11, 2000
Summary of the Near-Term Outlook(Percent change at annual rate except as noted)
2000:Q1 2000:Q2
Measure 1999:Q4 Mar. May Mar. MayGB GB GB GB
Real GDP 73 4.3 4.9 4.9 53Private domestic final purchases 5.3 7.5 10.0 5.4 4.7
Personal consumption expenditures 5.9 6.1 7.6 4.1 4.0Residential investment 1.8 8.2 6.3 -1.4 -2.2Business fixed investment 2.9 14.8 24.8 15.1 10.6
Government outlays for consumptionand investment 9.3 .1 -1.4 5.4 3.9
Memo:Real GDP adjusted for defense spending
anomaly 6.8 5.2 5.8 4.4 4.8
Change, billions ofchained (1996) dollars
Inventory investment 28.7 -7.8 -45.3 -4.0 32.9Net exports -3.7 -41.2 -34.1 -12.8 -21.0
On the expenditure side, although April's downdraft in the stock market appearsto have scarcely dented consumer sentiment, the reports on retail sales and unitsales of new motor vehicles for the month point to some moderation inhousehold spending after a phenomenal first quarter. The April softening inpurchases could prove to be merely another head-fake, perhaps caused partly byan unusually late onset of spring weather. Still, the "fundamentals" drivingincreases in consumer demand, including the impetus from the earlier rise instock market, probably have crested. The pattern of housing starts through thewinter indicates that residential construction will decline a bit this quarter.Orders for nondefense capital goods suggest that business equipment investmentwill post another substantial gain, but one short of the huge first-quarterincrease. In addition, private nonresidential and state and local constructionprobably were boosted by favorable weather during the winter, pulling forwardsome activity from this quarter. In sum, we expect a substantial falloff in thegrowth of domestic final purchases this quarter; however, that deceleration willlikely be offset by a pickup in inventory investment and a somewhat less sizabledrop in net exports.

Domestic Developments I-5
Beyond the current quarter, we expect that the balance of these domestic andinternational influences will gradually tilt in the direction of slower GDPgrowth. Central to this projection is the damping of consumption and housingdemand by rising interest rates and a cessation of the bull market in equities.
Projections of Real GDP(Percent change, Q4 to Q4, except as noted)
Measure 1998 1999 2000 2001
Real GDPPrevious
Final salesPrevious
PCEPrevious
Residential investmentPrevious
BFIPrevious
Government purchasesPrevious
ExportsPrevious
ImportsPrevious
Memo:Real GDP adjusted for defense
spending anomaly1
Inventory changePrevious
Net exportsPrevious
4.74.6
4.74.7
5.15.1
11.311.3
13.113.1
2.32.2
2.01.9
10.810.8
4.7
4.64.5
4.64.5
5.65.6
3.93.8
7.16.9
5.05.0
4.84.5
12.613.0
4.5
4.54.2
4.74.3
4.94.6
-1.5-2.0
14.912.4
2.22.9
6.17.2
10.911.3
3.63.7
3.83.7
3.33.4
-3.6-4.4
10.09.8
3.53.4
8.48.7
8.18.5
Change, billions of chained (1996)dollars
-2.0 -3.9 -13.5 -12.5-2.0 -3.5 -9.4 -3.3
-102.9 -109.7 -89.8 -31.7-103.6 -117.4 -82.7 -34.2
1. The estimated GDP growth rate adjustment for the defense spendinganomaly is -0.12 percentage point in 1999 and +0.12 percentage point in 2000. Theapparent lack of symmetry in the growth rates shown in the table is due to rounding.

Part 1: Summary and Outlook, May 11, 2000
The weakening of household expenditure growth in turn impinges on theprofitability of businesses and encourages less robust capacity expansion. Inaddition, more moderate increases in final sales and improving supply-chainmanagement curb firms' desired inventory accumulation. Partly offsetting thesetrends, softer domestic demand and a little dollar depreciation foster somediminution in the pace of import growth, while exports respond to the solidworld economic expansion.
Household demand. We project that growth of real personal consumptionexpenditures will slow from an average rate of around 6 percent (annual rate) inrecent quarters to just over 4 percent in the remaining three quarters of this yearand to only 3-1/4 percent in 2001. To be sure, we have predicted suchdecelerations in the past, and things have gone in the opposite direction. For themost part, upside surprises in stock prices have been the culprit in these errors,though there may be something of a chicken-and-egg problem in that assessment:The ebullience of consumers, possibly infected with "New Era" enthusiasmabout economic prospects, may have lifted both the demand for goods and equityprices.
That said, we remain fairly confident that if the anticipated deterioration infinancial conditions occurs, it will take some of the steam out of consumerdemand. In fact, our rule of thumb suggests that, given the assumed stock marketpath, the spur to consumption growth from wealth effects should drop fromsomething on the order of 1 percentage point in the second half of 1999 to asmall negative in the second half of this year and then drop to a little more than ahalf point negative in 2001. In addition, accelerator effects should damp furthergrowth in outlays for motor vehicles and many other durable goods. Overall, weexpect spending to slow relative to disposable income, so that the personalsaving rate--which appears to have sunk to about 1/2 percent in the first quarter--moves back above 1 percent next year. 1
The same fundamentals also should put a damper on the demand for housing.Whether they have already begun to do so is unclear. As noted in Part 2,divergent indicators have made it difficult to gauge the recent direction ofdemand in the single-family market. We think that, in all likelihood, the rise inhousehold wealth--and the willingness of many confident buyers to switch tolower-initial-cost ARM financing--have been counterbalancing the effects of theconsiderable rise in interest rates on fixed-rate mortgages. Furthermore, there are
1. Although we have no solid evidence, we suspect that the recent data on personal incomeand the saving rate may understate the true figures. As noted earlier, tax receipts have beensurprisingly strong and, as we discuss later, the last couple of readings for the compensation perhour series derived from the national accounts look a bit lean.

Domestic Developments I-7
anecdotal reports that sales may have been boosted of late by a rush to beat themuch publicized prediction of an upcoming rise in interest rates. Going forward,however, our financial scenario tips this balance in a moderately negativedirection.
However, construction activity is unlikely to fall off appreciably in the near term.Partly because builders have been constrained to date by shortages of labor,materials, and lots, we believe that they have a sufficient backlog of projects tokeep them very busy for a while. We expect that single-family starts will total1.30 million units this year-somewhat below the 1999 figure--and then drop to a1.25 million unit pace (annual rate) by the end of next year. Multifamily startsare likely to follow much the same pattern. The overall level of starts projectedfor next year is still high relative to underlying demographic trends, but thatseems reasonable in light of continued high employment and good affordability.
Business spending. We anticipate that real business fixed investment, whichsurged at an annual rate of 25 percent in the first quarter after a late-1999 lull,will increase at a pace of close to 12 percent over the remainder of this year and10 percent in 2001. These obviously are still big numbers, and they reflect ourassessment that technological advance and the desire to substitute capital forrelatively costly labor will continue to lift demand in the face of less favorablefinancing conditions. In addition, the increasing importance of fast-depreciatingequipment means that greater replacement requirements are boosting grossinvestment; this tends to counteract the negative accelerator effects that onemight otherwise expect to see more clearly in the BFI path.
The aforementioned factors leave their greatest imprint on real outlays forequipment and software, which are expected to post an increase averaging around13 percent (annual rate) over the projection period. The growth will be led byfurther large advances in the computing and communications categories. Inaddition to the attraction of rapidly declining prices, investment in suchequipment evidently is being driven by the desire to build the broad-band andwireless infrastructure for e-commerce and information/entertainment services.2
Meanwhile, recent orders trends and rising capacity utilization point to moderategrowth in spending on other industrial equipment, while the demand for farm
2. Concerns have surfaced that the effective shutting-off of the financial spigot for dot-comenterprises may cut into demand for high-tech equipment. However, we believe that any sucheffects will be minor because these firms likely account for a small portion of total capitalexpenditures; in addition, these firms have, in the past, directed much of the funds they raisethrough IPOs and debt toward purposes that do not count as capital expenditures, such asadvertising.

I-8 Part 1: Summary and Outlook, May 11, 2000
machinery appears to be firming as well. In contrast, outlays for transportationequipment--both motor vehicles and aircraft--probably will decline from here.
Incoming information since the March Greenbook has led us to raise our forecastof spending on nonresidential structures considerably. Construction data for thefirst quarter showed large gains across categories in which spending had beenpuzzlingly weak last year. Moreover, new figures on vacancy rates, space rents,and property prices have confirmed our view that the commercial real estatemarket is not generally overbuilt. All told, we are now expecting a sizableincrease in spending on nonresidential structures this year and a further smalladvance next year.
Turning from fixed investment to inventories, aggregate nonfarm inventory-salesratios have declined sharply over the past year or so. Although it is quitepossible that unexpectedly strong sales led to an excessive drawdown of stocks,we have not heard many expressions of concern that inventory positions are toolean. Thus, although restocking efforts may occur here and there, we areanticipating only a moderate buildup of total inventories over the projectionperiod, with some further edging down of inventory-sales ratios. If anything, wesee a modest downside risk in this forecast if the current wave of "B2B"initiatives produces the inventory management improvements that have beentouted--but many of the more ambitious projects are embryonic, and theirpotential may have been overhyped in the desire of companies to "enhanceshareholder value" by capturing some of the Internet aura.3
Farm inventories were drawn down in the first quarter, marking the thirdconsecutive quarter of decline. Strong demand has been a key force behind thispattern, as consumer food expenditures have posted robust gains in the pastcouple of years, and more recently, agricultural exports have picked up. We arepredicting that drawdowns will continue for some time but then taper off suchthat farm stocks hold about steady in the latter part of next year.
Government. Once we get past the short-term dynamics of the timing shift indefense spending, we expect real federal purchases to follow a modest uptrend.Our forecast calls for an increase of 1/4 percent (annual rate) in the second halfof this year and a rise of around 1-1/4 percent over the four quarters of 2001.
3. Indeed, it would not be unduly cynical to suggest that some of the attraction of theseinitiatives has been the thought that the B2B exchanges that are being set up can be spun off atastronomical valuations; whether the recent slump in dot-corn stocks will alter this calculationremains to be seen. In any event, we believe that, in the near term, at least some companies willfind themselves burdened with the cost and confusion of maintaining old EDI and otherprocurement systems while trying to set up web-based hook-ups with their partners.

Domestic Developments I-9
This forecast is virtually the same as that in the March Greenbook, as the changesin our policy assumptions have a relatively small effect on federal governmentpurchases.
Most state and local governments continue to be in exceptionally good financialshape. We project that real state and local consumption and investmentexpenditures will increase about 4-3/4 percent (annual rate) over the next sixquarters, just a little below last year's robust pace. Spending on capitalimprovements and education may benefit most from the strong budgets, but moretax cuts also seem to be in store.
Net exports. The alterations in the expected paths of the dollar and foreignactivity have had a slightly negative effect, on balance, on the projection for realnet exports. This year's widening of the trade gap arithmetically trims just under1 percentage point from GDP growth, only a little less than we saw last year;however, the slowing of the deterioration of net exports in 2001 reduces the dragon GDP growth to just 1/4 percentage point. (The International Developmentssection provides a more detailed discussion of the outlook for the externalsector.)
Prospects for the Supply Side of the Economy and InflationThe expansion of aggregate supply has been substantial, but nowhere nearenough to match the advance of demand. Consequently, pressures on resourcesappear to have reached a point where workers feel they can be more aggressive inseeking higher compensation and where firms are more willing to test thecompetitive waters by hiking prices. The moderation in demand growth in ourforecast is insufficient to relieve those pressures, suggesting that--other thingsbeing equal--a greater tightening of policy than we have assumed may berequired to avert an ongoing deterioration in the inflation trend beyond theprojection period.
Labor markets. Given the data now in hand, we estimate that the officialaccounts will be revised to show a published productivity gain in the nonfarmbusiness sector of 1-1/2 percent (annual rate) in the first quarter. However, thisfigure is depressed by the anomaly in defense payments; adjusting for that yieldsa first-quarter increase of 2.7 percent and puts the estimated four-quarter changeat 3-1/2 percent. We see some of the strong productivity performance of the pastyear as reflecting a rapid pace of structural improvement, but we also think that asignificant portion is cyclical: Businesses have been surprised by the high levelof demand and unable to readily hire in the tight labor market, so they havesimply stretched their current workers further. Such stretching certainly isapparent in the thinner staffing and poorer service that one encounters in many
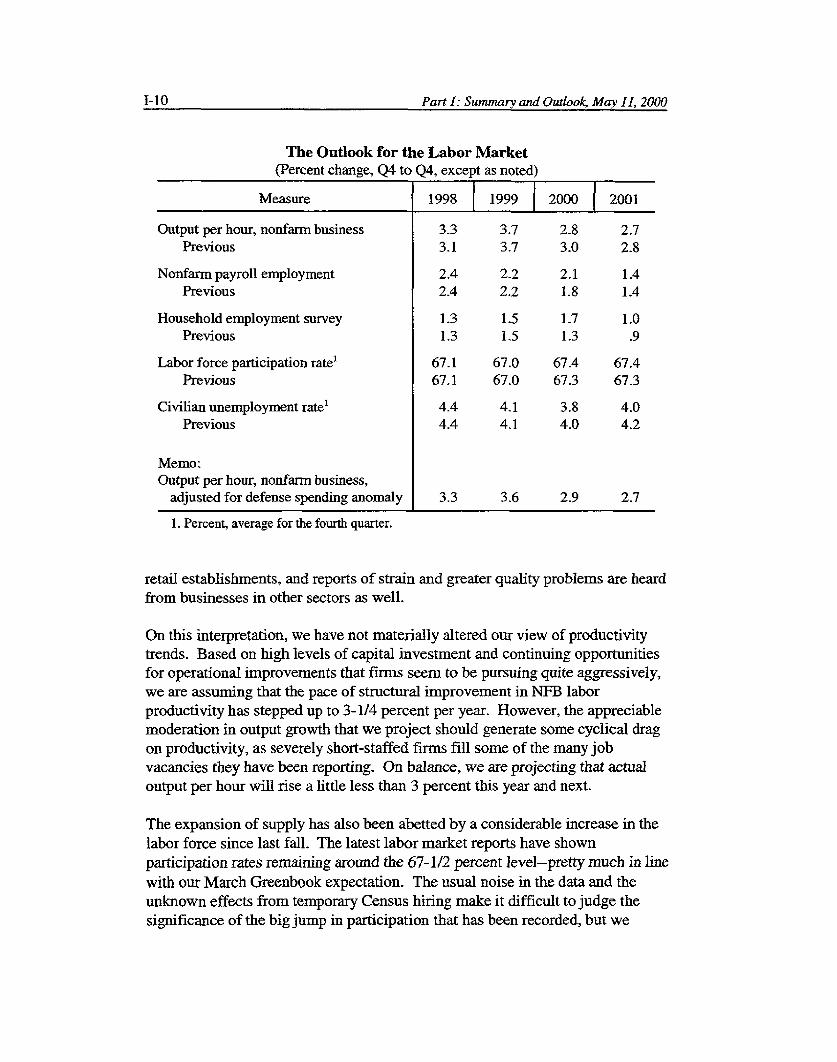
The Outlook for the Labor Market(Percent change, Q4 to Q4, except as noted)
Measure 1998 1999 2000 2001
Output per hour, nonfarm business 3.3 3.7 2.8 2.7Previous 3.1 3.7 3.0 2.8
Nonfarm payroll employment 2.4 2.2 2.1 1.4Previous 2.4 2.2 1.8 1.4
Household employment survey 1.3 1.5 1.7 1.0Previous 1.3 1.5 1.3 .9
Labor force participation rate' 67.1 67.0 67.4 67.4Previous 67.1 67.0 67.3 67.3
Civilian unemployment rate' 4.4 4.1 3.8 4.0Previous 4.4 4.1 4.0 4.2
Memo:Output per hour, nonfarm business,
adjusted for defense spending anomaly 3.3 3.6 2.9 2.7
1. Percent, average for the fourth quarter.
retail establishments, and reports of strain and greater quality problems are heardfrom businesses in other sectors as well.
On this interpretation, we have not materially altered our view of productivitytrends. Based on high levels of capital investment and continuing opportunitiesfor operational improvements that firms seem to be pursuing quite aggressively,we are assuming that the pace of structural improvement in NFB laborproductivity has stepped up to 3-1/4 percent per year. However, the appreciablemoderation in output growth that we project should generate some cyclical dragon productivity, as severely short-staffed firms fill some of the many jobvacancies they have been reporting. On balance, we are projecting that actualoutput per hour will rise a little less than 3 percent this year and next.
The expansion of supply has also been abetted by a considerable increase in thelabor force since last fall. The latest labor market reports have shownparticipation rates remaining around the 67-1/2 percent level-pretty much in line
with our March Greenbook expectation. The usual noise in the data and theunknown effects from temporary Census hiring make it difficult to judge thesignificance of the big jump in participation that has been recorded, but we
1-10 Part 1: Summary and Outlook, May II, 2000

Domestic Developments I-11
continue to think that some of the advance will prove to be a lasting response tothe ready availability of jobs.
Combining these factors, our assessment remains that potential GDP growth haspicked up from a little less than 4 percent on average in the past couple of yearsto about 4-1/4 percent per year in 2000-01. The behavior of the unemploymentrate to date seems consistent with this view, and going forward our Okun's lawmodel suggests that the jobless rate will remain near the April level.4
Wages and Prices. Incoming data bolster our view that the underlying trend inprices is now less favorable than it was last year. Although we think the Marchincrease in the core CPI of 0.4 percent exaggerates the problem, an acceleratingtrend in the index is consistent with anecdotal reports that firms are moreinclined to pass along increases in their costs. Wage inflation also appears to bepicking up, although the signals have been somewhat mixed. However, as wehave noted previously, given the methods firms are using to attract and retainworkers these days, none of the available pay data seems well suited to capturethe influence of labor costs on pricing decisions. Thus, while these costscertainly remain an important component of the inflation process in the realworld, our forecast of prices is not tied to our projections for the various officialmeasures of compensation in a tight quantitative manner.
We project that the ECI measure of compensation per hour will increase4.4 percent in 2000, compared with 3.4 percent in 1999. The projected rise thisyear is 1/2 percentage point greater than that in the March Greenbook andreflects both the tighter projected labor market and the surprisingly sharp jumpsin both the benefits and the wages-and-salaries components in the first quarter.Actually, the adjustment brings the forecast into closer alignment with thepredictions of our econometric models. In our previous forecast, we did nothave the courage of our models' convictions, given that the anecdotal evidenceremained ambiguous and the official statistics were providing no meaningfulhint of an acceleration in nominal pay rates; we opted therefore for a moregradual pickup over 2000 and 2001.
The largest acceleration in the compensation series in the first quarter was infinance, insurance, and real estate (FIRE). Competition for workers in thissector reportedly has been intense; even in investment banking, where huge pay
4. Although GDP growth falls noticeably below the assumed potential rate next year, oureconometric relationships indicate that employment tends to respond with a lag to outputmovements. This leads to a more gradual adjustment than a simple rule-of-thumb version ofOkun's law would suggest, limiting the upswing in the unemployment rate by a tenth or twowithin the forecast period.

I-12 Part 1: Summary and Outlook, May 11, 2000
Inflation Projections(Percent change, Q4 to Q4, except as noted)
Measure 1998 1999 2000 2001
PCE chain-weighted price index .9 2.0 2.4 2.2Previous 1.0 2.0 2.3 1.9
Excluding food and energy 1.3 1.5 2.2 2.4Previous 1.4 1.5 2.0 2.2
Consumer price index 1.5 2.6 3.0 2.4Previous 1.5 2.6 2.8 2.3
Food 2.3 1.9 2.8 2.7Previous 2.3 1.9 2.3 2.7
Energy -9.2 11.2 6.4 -3.2Previous -9.2 11.2 6.1 -4.8
Excluding food and energy 2.4 2.1 2.7 2.9Previous 2.4 2.1 2.5 2.8
GDP chain-weighted price index 1.0 1.6 2.3 2.0Previous 1.1 1.6 2.2 1.9
ECI for compensation of privateindustry workers 1 3.5 3.4 4.4 4.6
Previous 3.5 3.4 3.9 4.4
NFB compensation per hour 5.4 4.3 4.9 5.5Previous 5.3 4.3 4.9 5.3
Prices of core non-oilmerchandise imports -1.9 .2 1.8 3.0
Previous -1.9 .2 2.0 2.4
Percentage points
MEMO: Adjustments for technicalchanges to the CPI 2
Core CPI -.2 .0 .0 .0
1. December to December.2. Adjustments are calculated relative to the current methodological structure of
the CPI.
packages are not unheard of, firms are said to be having difficulty attractingtalent because workers prefer to chase the megabucks of the venture capital anddot-con enterprises. Yet, because pay increases in FIRE tend to be volatile andmay have been boosted by big commissions and bonus payments related to

exceptionally high levels of activity, our forecast also gives some weight to thenumbers excluding FIRE, which show a smaller but still noteworthyacceleration.
We expect the increase in ECI compensation to pick up just a little further in2001. The more muted acceleration compared with 2000 partly reflects thepeaking of oil prices this year, which should show up as a smaller cost-of-livingeffect next year. In addition, the moderation in the expansion of business salesand financial activity should cause bonus and commission increases to ease fromthis year's pace, and we do not expect a further escalation in the already steeprate of increase in health insurance benefit costs. The predicted gain in hourlycompensation next year is 0.2 percentage point larger than in our previousforecast, however, because of the tighter labor market and higher prices in thecurrent projection.5
In contrast to the ECI, the productivity and cost (P&C) measure of hourlycompensation showed a relatively subdued increase in the first quarter, as it didin the fourth. As we are discounting part of the surge in the ECI, we are alsoquestioning the signal in the recent movements in the P&C series. One reasonfor skepticism about these numbers is that the series does not yet incorporatewage and salary information from the unemployment insurance system beyondthe third quarter of last year or any timely benefits data. We would not besurprised to see upward revisions to the published P&C compensation readingsat some point, but for now we are simply projecting that the increases in comingquarters will be distinctly higher than they have been recently. We see the rise inP&C compensation per hour picking up from 4.3 percent in 1999 to 5.5 percentin 2001, an acceleration like that in the ECI. The projected gain this year is thesame as in the March Greenbook, with the negative surprise in the first quarteroutweighing the upward revisions later in the year, but the increase next year is alittle higher.
Turning to prices, we have boosted our forecast for food prices this year toreflect the heightened possibility that dry weather will hurt farm output; we nowsee food prices rising a little faster than core prices this year and slowing only atouch in 2001. Retail energy prices are projected to finish this year above theirlevel at the end of 1999; the rise over 2000 will be much smaller than thedouble-digit gain registered in 1999 but still above the inflation rate for otherconsumer items. In the near term, the decline in crude oil prices has caused the
5. As in the previous Greenbook, assumed increases in the minimum wage near the end ofthis year and next add 0.1 percentage point to our projection of the four-quarter change incompensation this year and 0.2 percentage point next year.
Domestic Developments 1-13

Part 1: Summary and Outlook, May 11, 2000
retail price of gasoline to ease a bit in recent weeks, although the effect onoverall energy prices will be offset a little by a further rise in natural gas prices,which, in turn, lifts feedstock costs and promises to make electricity moreexpensive. For 2001, we expect that energy prices will decline, holding downoverall inflation.
Excluding food and energy, we continue to project a substantial pickup inconsumer prices this year and a further acceleration in 2001. Although, as noted,we continue to resist tying our price forecast tightly to the behavior of anyparticular measure of compensation movements, we think that unit labor costpressures will in all likelihood provide an impetus to price increases. Theoutlook for core inflation also reflects the lagged effects of higher oil prices anda further firming of prices for non-oil imports. We expect that the slack inindustrial markets will continue to diminish, with factory utilization drifting upto the long-term average of 82 percent next year; although this level certainlydoes not suggest significant bottlenecks, it does mean that firms will have a bitless to worry about in regard to potential losses of market share if they attempt toraise prices.
We project that core PCE prices will accelerate almost 1 percentage pointbetween 1999 and 2001, with the inflation rate by this measure approaching2-1/2 percent. We are predicting about the same amount of acceleration in thecore CPI, which would put the inflation rate for that index at close to 3 percentnext year. However, because of the subdued behavior of energy prices over thecoming quarters, the headline inflation rates for both the PCE index and the CPIwill slow next year and run only 2-1/4 to 2-1/2 percent. That pattern should behelpful in containing core inflation in 2002, in part by damping cost-of-livingincreases; but avoidance of an ongoing deterioration in the underlying trend willlikely require a sharper deceleration in output and at least some loosening of thelabor market.
Financial Flows and ConditionsGrowth of domestic nonfinancial debt slowed in the first quarter of this yearfrom the pace of late 1999. Net borrowing by both households and businessesremained substantial, but this was damped by modest net bond issuance by stateand local governments and a continued paydown of federal debt.
Looking ahead, household borrowing is likely to diminish some as the demandfor consumer durables and housing moderates. However, in the business sector,corporate borrowing is expected to be buoyed by the widening gap betweeninternal cash flow and capital outlays. Net borrowing by state and local unitsshould remain sluggish: Bond issuance for public investment will likely bestrong, but so too will funds available from tax revenues and federal support of
I-14
construction. Moreover, retirements from earlier advance refunding activity willbe sizable this year and in 2001. Given the mushrooming federal surplus, thepaydown of Treasury debt will accelerate. Overall, domestic nonfinancial debtis projected to expand about 5 percent in 2000 and in 2001, down from thenearly 7 percent pace last year.
Corporate bond issuance has been slow since mid-March owing, at least in part,to the increase in the level and volatility of bond rates. Consequently, businesseshave apparently turned to other debt financing sources, causing both C&I loansfrom banks and commercial paper to grow briskly. In due course, bond marketparticipants presumably will adapt to the benchmarking problems that havearisen as a result of the reduced supply of Treasuries, so that this source ofilliquidity will diminish in importance. However, we anticipate that the bondmarket will remain less hospitable to riskier and to smaller, less liquid offeringsthan it was before the turmoil of 1998--especially against a backdrop ofcontinued substantial defaults especially on junk bonds that were underwrittenaggressively a few years ago. Firms that might otherwise have tapped the junkmarket will continue to look to a range of other public and private financingoptions. Banks probably will satisfy some of that demand for funds, but wewould expect the trend toward tighter lending standards and firmer pricing topersist--encouraged to some degree by admonitions from federal supervisors.All told, this firming of lending terms and availability, however, will notremotely resemble a credit crunch for business firms.
Tightening credit supply is likely to be even less of an issue for households.Interest rates on loans should move up with market rates, but we do not foreseean appreciable firming of underwriting standards. Although debt-serviceburdens probably will rise further, the continuation of quite solid employmentand income growth suggests that loan repayment difficulties will not increaseenough to scare lenders. Were there to be a sizable decline in the stock market,it undoubtedly would cause some particular discomfort for heavy spendinghouseholds that had, in effect, liquefied some of their gains through consumer ormortgage loans. However, this would seem unlikely itself to trigger widespreadloan defaults: Most people with significant shareholdings also have either otherfinancial assets or substantial labor income that could be tapped to service debts.
The financial health of states and localities should remain quite good,minimizing concerns about credit risk in the municipal bond market. This mayhave helped municipals outperform corporates of late. Looking ahead, as returnson stock portfolios prove disappointing, high-bracket investors could find theafter-tax yields on munis quite attractive, and the resultant demand might furtherreduce the ratio of muni yields to yields on taxable bonds. Nonetheless, withcorporate rates rising appreciably in our projection, we would expect muni rates
Domestic Developments I-15

to remain high enough to deter new advance refundings; with a sizable volumeof already refunded issues due to be retired, this suggests a considerable drag onstate and local debt growth through next year.
Based on our budget projections, the Treasury will have a bigger job to do inmanaging its debt retirements than it has yet faced up to publicly. It has movedto make the repurchase program more predictable in terms of timing, but thatwill not resolve all the issues related to market liquidity. While we remainuncertain that the widening of spreads that has occurred between Treasury andother debt is fully justified by the reality of the prospects for reduced supply ofTreasuries, that reality is not easy to define and neither is the degree to whichinvestors are being forced out of their preferred habitats. Under thecircumstances, we have assumed that spreads will remain similar to those nowprevailing, with the benchmark/pricing uncertainty premium diminishing, butcredit risk premiums increasing a bit.
The broad monetary aggregates expanded at a fast clip in March and April,boosted by the effects of above-average tax payments last month. For the yearas a whole, M2 velocity is expected to rise in response to higher short-terminterest rates. The damping effect of higher rates abates in 2001, bringing thegrowth of M2 back in line with the expansion of nominal income. M3 growth isexpected to outpace the growth of income in both years.
Alternative SimulationsWe have prepared four simulations with the FRB/US econometric model. In thefirst scenario, we allow the federal funds rate to remain at its current levelthrough 2001. In the second scenario, we assume tighter monetary policy than inour baseline projection, with the funds rate rising to 8 percent by the end of thisyear--fully 1 percentage point more than the market seems now to beanticipating. A third scenario explores the possibility of a stock marketcorrection, assuming that the Wilshire 5000 falls sharply over the next fewweeks to a level of 11,000 and remains at this level through the end of next year.Finally, we have included a continued bull market scenario, where the Wilshiretrends up to 16,000 by the end of 2001.
With no change in the nominal federal funds rate over the projection period, themodel calls for real GDP to continue rising at 4-3/4 percent per year--in excessof our baseline assumption of potential. The unemployment rate consequentlymoves down to less than 3-1/2 percent by the end of 2001. With this substantialfurther tightening of labor markets, core PCE inflation accelerates from a 2-1/4percent pace this year to a 3 percent rate in 2001; it clearly will step up rapidlybeyond the forecast period.
1-16 Part 1: Summary and Outlook, May 11, 2000

Domestic Developments I-17
Alternative Simulations(Percent change, Q4 to Q4, except as noted)
Measure 2000 2001
Real GDPBaseline 4.5 3.6
Flat funds rate 4.7 4.8
Tighter policy 4.4 3.2
Stock market correction 4.2 3.0
Continued stock market gains 4.6 4.0
Civilian unemployment rate'Baseline 3.8 4.0
Flat funds rate 3.7 3.4
Tighter policy 3.8 4.3
Stock market correction 3.9 4.2
Continued stock market gains 3.8 3.9
PCE prices excluding food and energyBaseline 2.2 2.4
Flat funds rate 2.2 3.0
Tighter policy 2.2 2.1
Stock market correction 2.2 2.3
Continued stock market gains 2.2 2.4
1. Average for the fourth quarter.
In contrast, the "tighter policy" scenario shows real GDP growth slowing to3-1/4 percent next year. The greater deceleration in activity adds only a fewtenths to the baseline unemployment rate by the end of 2001, so that the labormarket remains unsustainably taut. However, a significant short-rundisinflationary effect is predicted, as the increase in the core PCE price indexedges down a hair in 2001, rather than rising as in the baseline. According to themodel, the more aggressive monetary policy tightening damps inflation fairlyquickly through its effects both on the exchange rate and on expectations aboutthe future level of slack and, consequently, the long-run level of inflation.
A further stock market correction would raise the cost of equity finance and parethe household wealth-income ratio to a greater degree than in our baselineforecast. Operating through these channels, the drop in equity prices in thesimulation--bringing the Wilshire 5000 down about 20 percent from its first-quarter average--would reduce GDP growth to 4-1/4 percent this year and to
Domestic Developments 1-17

I-18 Part 1: Summary and Outlook May 11, 2000
3 percent next year. As in the tighter monetary policy scenario, theunemployment rate would rise to around 4-1/4 percent by the end of 2001;however, the disinflationary benefits are smaller because perceptions of thelong-run inflation goal of monetary policy are unchanged.
The scenario that calls for the stock market to trend upward yields somewhatstronger output growth than in our baseline projection, with GDP increasing alittle more than 4-1/2 percent this year and 4 percent next year. Labor marketsare a bit tighter at the end of next year, but the change is not large enough toproduce a noticeable effect on core inflation in 2001.

Strictly Confidential <FR>Class II FOMC
May 11, 2000STAFF PROJECTIONS OF CHANGES IN GDP, PRICES, AND UNEMPLOYMENT
(Percent, annual rate)
GDP chain-weighted Consumer UnemploymentNominal GDP Real GDP price index price index1 rate2
Interval 3/15/00 5/11/00 3/15/00 5/11/00 3/15/00 5/11/00 3/15/00 5/11/00 3/15/00 5/11/00
ANUAL
1997 6.2 6.2 4.5 4.2 1.7 1.9 2.3 2.3 4.9 4.91998 5.5 5.5 4.3 4.3 1.2 1.2 1.6 1.6 4.5 4.51999 5.6 5.7 4.1 4.1 1.4 1.4 2.2 2.2 4.2 4.22000 7.0 7.3 4.8 5.1 2.1 2.1 3.1 3.1 4.0 3.92001 5.7 5.9 3.8 3.8 1.9 2.0 2.1 2.4 4.1 3.9
QUARTERLY
1998 Q1 7.7 7.7 6.7 6.9 1.0 0.9 1.0 1.0 4.7 4.7Q2 3.4 3.4 2.1 2.2 1.1 1.1 1.7 1.7 4.4 4.4Q3 5.4 5.4 3.8 3.8 1.4 1.3 1.7 1.7 4.5 4.504 7.0 7.0 5.9 5.9 0.9 0.8 1.7 1.7 4.4 4.4
1999 Q1 5.7 5.7 3.7 3.7 2.0 2.0 1.7 1.7 4.3 4.3Q2 3.3 3.3 1.9 1.9 1.3 1.3 3.2 3.2 4.3 4.3Q3 6.8 6.8 5.7 5.7 1.1 1.1 2.4 2.4 4.2 4.204 9.1 9.4 7.0 7.3 2.0 2.0 2.9 2.9 4.1 4.1
2000 Q1 7.3 7.7 4.3 4.9 2.9 2.6 3-9 4.1 4.0 4.1Q2 7.6 7.9 4.9 5.3 2.6 2.7 4.4 3.5 4.0 3.9Q3 5.4 6.1 3.8 4.1 1.6 1.9 1.1 2.1 4.0 3.8Q4 5.5 5.9 3.8 4.0 1.7 1.8 1.7 2.3 4.0 3.8
2001 Q1 5.7 5.8 3.7 3-6 2.0 2.1 1.9 2.2 4.1 3.9Q2 5,4 5.6 3.6 3.6 1.8 1.9 2.3 2.5 4.1 3.9Q3 5.7 5.6 3.7 3.6 1.9 2.0 2.3 2.4 4.1 3.9Q4 5.8 5.7 3.7 3.6 1.9 2.0 2.5 2.6 4.2 4.0
TWO-QUARTER3
1998 Q204
1999 Q2Q4
2000 Q204
2001 Q204
FOCR-QUIXRTZER
1997 041998 Q41999 Q42000 Q42001 Q4
5.5 5.5 4.46.2 6.2 4.8
4.5 4.5 2.87.9 8.1 6.3
7.4 7.8 4.65.5 6.0 3.8
5.6 5.7 3.65.7 5.7 3.7
4-5 1.1 1.0 1.3 1.3 -0.3 -0.34.9 1.1 1.1 1.7 1.7 0.0 0.0
2.8 1.7 1.7 2.5 2.5 -0.1 -0.16.5 1.5 1.5 2.7 2.7 -0.2 -0.2
5.1 2.8 2.7 4.14.0 1.6 1.9 1.4
3.6 1.9 2.0 2.13.6 1.9 2.0 2.4
3.7 -0.1 -0.22.2 0.0 -0.1
2.3 0.1 0.12.5 0.1 0.1
-0.6 -0.6-0.3 -0.3-0.3 -0.3-0.1 -0.30.2 0.1
1. For all urban consumers.2. Level, except as noted.3. Percent change from two quarters earlier; for unemployment rate, change in percentage points.4. Percent change from four quarters earlier; for unemployment rate, change in percentage points.

Strictly Confidential <FR> REAL GROSS DOMESTIC PRODUCT AND RELATED ITEMS, ANNUAL VALUESClass II FOMC (Seasonally adjusted annual rate)
May 11, 2000
-- Projected --
Item Units1
1993 1994 1995 1996 1997 1998 1999 2000 2001
EXPENDITURES
Nominal GDPReal GDP
Real GDPGross domestic purchasesFinal salesPriv. dom. final purchases
Personal cons. expendituresDurablesNondurablesServices
Business fixed investmentEquipment & SoftwareNonres. structures
Residential structures
ExportsImports
Gov't. cons. & investmentFederal
DefenseState & local
Change in bus. inventoriesNonfarm
Net exports
Nominal GDP
SMPLOYMENT AND PRODUCTION
Nonfarm payroll employmentUnemployment rate
Industrial prod. indexCapacity util. rate - fg.
Housing startsLight motor vehicle sales
North Amer. producedOther
INCOME AND SAVIN
Nominal GNPNominal GNPNominal personal incomeReal disposable incomePersonal saving rate
Corp. profits, IVA & CCAdj.Profit share of GCNP
Excluding FR Banks
Federal surpl./deficitState & local surpl./def.Ex. social ins. funds
Gross natl. saving rateNet natl. saving rate
PRICES AND COSTS
GDP chn.-wt. price indexGross Domestic Purchases
chn.-wt- price index
PCE cbn.-wt. price indexEx. food and energy
CPIEx. food and energy
ECI, hourly compensation2
Nonfarm business sectorOutput per hourComvensation per HourUnit labor cost
Bill. $Bill. Ch. $
% change
Bill. Ch. $
% change
Millions
% change%
Millions
Bill. $% change
% change
Bill. $
. change
6642.3 7054.3 7400.5 7813.2 8300.8 8759.9 9256.1 9935.1 10523.57062.6 7347.7 7543.8 7813.2 8144.8 8495.7 8848.2 9302.9 9660.8
2.5 4.1 2.2 4.1 4.1 4.7 4.6 4.5 3.63.1 4.3 1.7 4.3 4.7 5.7 5.6 5.2 3.72.6 3.2 2.9 3.9 3.6 4.7 4.6 4.7 3.84.2 4.3 3.2 4.4 4.7 6.6 5.7 6.1 4.0
3.4 3.6 2.8 3.1 3.9 5.1 5.6 4.9 3.39.3 6.4 3.7 5.0 8.4 13.0 10.5 7.4 2.92.6 4.1 2.5 3.2 2.4 5.0 5.8 4.5 2.52.6 2.7 2.7 2.7 3.8 3.7 4.5 4.7 3.7
8.7 9.2 7.5 12.1 9.6 13.1 7.1 14.9 10.011.5 12.0 8.9 11.8 11.3 16.8 10.8 17.3 12.51.2 1.1 3.3 12.8 4.7 2.9 -3.9 7.1 1.37.8 4.0 -1.5 5.6 3.7 11.3 3.9 -1.5 -3.6
4.8 10.5 9.7 9.8 9.2 2.0 4.8 6.1 8.410.5 12.2 5.0 11.2 14.2 10.8 12.6 10.9 8.1
-0.8 0.2 -0.8 2.7 2.2 2.3 5.0 2.2 3.5-5.3 -3.7 -5.3 2.0 0.2 0.6 5.0 -2.0 1.3-6.4 -5.9 -4.7 0.8 -1.3 -1-1 5.1 -4.2 0.82.5 2.8 2.1 3.0 3.3 3.2 5.0 4.4 4.7
20.0 66.8 30.4 30.0 69.1 74.3 42.2 47.1 44.528.6 53.6 42.6 22.1 66.2 73.2 42.4 52.8 45.0-59.1 -86.5 -78.4 -89.0 -112.1 -217.6 -323.0 -409.7 -461.7
5.0 6.2 4.3 6.0 5.9 5.9 6.3 6.9 5.7
110.7 114.1 117.2 119.6 122.7 125-8 128.6 131.56.9 6.1 5.6 5.4 4.9 4.5 4.2 3.9
3.4 6.4 3.5 5.3 6.8 2.9 4.2 5.780.5 82.5 82.6 81.5 82.4 80.9 79.8 81.3
1.29 1.46 1.35 1.48 1.47 1.62 1.67 1.6613.87 15.01 14.77 15.05 15.05 15.45 16.76 17.3511.72 12.88 12.87 13.35 13.12 13.43 14.28 14.632.15 2.13 1,90 1.70 1.94 2.02 2.48 2.72
133.63.9
4.082.0
1.5716.5314.072.47
6666.7 7071.1 7420.9 7831.2 8305.0 8750.0 9236.2 9899.0 10474.64.9 6.2 4.4 5.9 5.7 5.6 6.1 6.9 5.63.7 5.1 4.3 5.9 6.4 6.0 5.9 6.8 6.11.3 2.9 1.7 2.6 3.9 4.3 3.7 3.8 3.97.1 6.1 5.6 4.8 4.5 3.7 2.4 0.7 1.2
18.0 12.3 11.3 11.4 10.1 -1.8 9.6 9.5 0.97.7 8.1 9.0 9.6 10-1 9.7 9.7 10.1 9.67.4 7.9 8.7 9.4 9.8 9.4 9.4 9.8 9.4
-274.1 -212.3 -192.0 -136.8 -48.8 46-9 115.4 205.6 233.91.5 8.6 15.3 21.4 27.5 41.7 51.0 56.1 52.4
-2.7 4.0 11.4 18.7 26.4 40.8 50.2 54.7 51.0
15.6 16.3 16.9 17.2 18.3 18.8 18.7 18.6 18.83-8 4.3 5.1 5.7 7.1 7.5 7.3 7.3 7.5
2.4
2.2
2.12.4
2.73.1
3.6
-0.21.31.6
2.1 2.1
2.1 2.1
2.1 2.12.3 2.3
2.6 2.72.8 3.0
3.1 2.6
1.9 1.8 1.0
1.9 1.3 0.7
2.3 1.6 0.91.8 1.7 1.3
3.1 1.9 1.52.6 2.2 2.4
3.1 3.4 3.5
1.1 1.1 2.3 1.9 3.32.2 2.7 3.2 4.3 5.41.0 1.5 0.9 2.3 2.0
1.6 2.3
1.9 2.2
2.0 2.41.5 2.2
2.6 3.02.1 2.7
3.4 4.4
3.7 2.84.3 4.90.6 2.1
1. Changes are from fourth quarter to fourth quarter.2. Private-industry workers.

Strictly Confidential <FR> REAL GROSS DOMESTIC PRODUCT AND RELATED ITEMS, QUARTERLY VALUESClass II FOMC (Seasonally adjusted, annual rate except as noted)
May 11, 2000
1997 1997 1997 1997 1998 1998 1998 1998 1999 1999Item Units Q1 Q2 Q3 04 Q1 Q2 Q3 Q4 Q1 Q2
EXPENDITURES
Nominal GDPReal GDP
Real GDPGross domestic purchasesFinal salesPriv. dom. final purchases
Personal cons. expendituresDurablesNondurablesServices
Business fixed investmentEquipment & SoftwareNonres. structures
Residential structures
ExportsImports
Gov't. cons. & investmentFederal
DefenseState & local
Change in bs,. inventoriesNonfarm
Net exports
Nominal GDP
MPLOYMENT AND PRODUCTION
Nonfazm payroll employmentUnemployment rate
Industrial prod. indexCapacity util- rate - mfg-
Housing startsLight motor vehicle sales
North Amer. producedOther
INCOME AND SAVING
Nominal WGPNominal NPNominal personal incomeReal disposable incomePersonal saving rate
Corp. profits, IVA & CCAdj.Profit share of GNP
Excluding FR Banks
Federal surpl./deficitState a local surpl./def.
Ex. social ins. funds
Gross natl. saving rateNet natl. saving rate
PRICES AND COSTS
GDP chn.-wt. price indexGross Domestic Purchases
chn.-wt. price index
PCE chn.-vt. price indexEx. food and energy
CPIEx. food and energy
ECI, hourly compensation1
Nonfarm business sectorOutput per hourCocmnsation per tourUnit labor cost
Bill. $Bill. C. $
t change
Bill. Ch. $
\ change
Millions
9 change
Millions
Bill. $% change
% change
Bill. $
9 change
8125.9 8259.5 8364.5 8453.0 8610.6 8683.7 8797.9 8947.6 9072.7 9146.28018.7 8115.4 8192.2 8253.2 8391.1 8436.3 8515.7 8639.5 8717.6 8758.3
4.5 4.9 3.8 3.0 6.9 2.2 3.8 5.9 3.7 1.95.4 5.4 4.6 3.4 8.8 4.2 4.6 5.5 5.8 3.23.5 2.9 5.6 2.4 5.2 5.1 2.4 6.3 4.6 3.45.0 2.8 7.4 3.4 9.0 7.4 3.6 6.4 7.0 5.4
4.4 1.5 6.4 3-3 5.8 6.1 4.0 4.6 6.5 5.110.9 -1.5 20.2 5.0 16.9 11.2 4.1 20.4 12.4 9.13.8 -0.2 5.7 0.3 5.8 6.7 2.4 5.0 8.9 3.33.4 3.0 4.2 4.5 3.7 4.9 4.7 1.5 4.2 5.2
9.6 9.9 16.0 3.2 26.7 12.1 0.0 15.3 7.8 7.010.1 15.2 17.7 2.8 34.7 13.8 2.4 18.6 12.5 11.28.0 -4.0 11.2 4.3 5.7 7.1 -6.6 5.8 -5.8 -5.33.0 4.7 0.6 6.6 14.0 13.6 8.0 9.8 12.9 5.5
8.3 15.9 11.3 1.7 -1.5 -3.9 -1.6 16.3 -5.5 4.015.5 19.1 17.6 5.2 14.4 13.0 5.2 10.8 12.5 14.4
1.5 5.6 1.6 -0.1 -1.0 6.0 1.3 2.9 5.1 1.3-2.9 9.8 -1.4 -4.2 -9.8 11.9 -2.3 3.9 -0.5 2.1-11.3 9.6 -0.2 -2.4 -17.0 11.1 7.0 -2.9 -4.0 -2.64.1 3.3 3.4 2.3 4.1 3.0 3.3 2-4 8.2 0.9
51.5 93.1 59.2 72.7 107.3 43.1 76.1 70.7 50.1 14.056.7 85.7 52.6 69.7 103.8 53.2 77.5 58.2 43.1 13.1
-92.6 -103.2 -121.3 -131.5 -174.5 -221.0 -240.3 -234.4 -286.6 -321.1
7.4 6.7 5.2 4.3 7.7 3.4 5.4 1.0 5.7 3.3
121.4 122.3 123.0 123.9 124.8 125.5 126.1 126.9 127.6 128.25.3 5.0 4.8 4.7 4.7 4.4 4.5 4.4 4.3 4.3
6.5 6.7 6.9 6.9 2.4 3.0 2.9 3.3 2.0 4.781.9 82.2 82.5 82.7 82.0 81.0 80.3 80-2 79.6 79.6
1.43 1.48 1.46 1.53 1.56 1.57 1.63 1.72 1.76 1.5915.35 14.54 15.26 15.06 15.18 16.09 14.52 16,01 16.24 16.7413.43 12.68 13.25 13.11 13.21 14.10 12.52 13.88 13.98 14.321.92 1.86 2.01 1.96 1.97 1.99 2.00 2.13 2.26 2.42
8131.1 8269.1 8366.5 8453.3 8613.7 8683.7 8772.2 8930.5 9058.2 9131.96.8 7.0 4.8 4.2 7.8 3.3 4.1 7.4 5.8 3.38.0 5.6 5.5 6-4 5.3 5.8 6.6 6.5 5.4 5.53.9 3.9 3.4 4.3 4.2 3.8 4.5 4.8 4.1 3.24.5 5.0 4.2 4.4 4.0 3.5 3.6 3-5 3.0 2.5
15.6 14.4 15.9 -4.1 1.9 -4.1 -1.2 -3.6 24.9 -2.99.9 10.1 10.3 10.1 10.0 9.8 9.7 9.4 9.8 9.69.6 9.8 10.0 9.8 9.7 9.5 9.4 9.1 9.5 9.4
-87.4 -63.2 -27.9 -16-8 24.9 43.5 59.6 59.7 97.6 118.125.9 23.7 30.9 29.7 32.0 30.9 49.9 54.2 48.7 37.624.3 22.4 29.9 28.9 31.1 29.9 48.9 53.4 48.2 36.8
17.7 18.4 18.5 18.6 18.8 18.6 19.0 18.9 19.1 18.76.4 7.2 7.3 7.4 7.6 7.2 7.6 7.6 7.8 7.3
0.3 3.0 3.23.6 2.6 4.43.3 -0.3 1.2
0.9
-0.1
0.31.1
1.02.8
3.0
4.74.90.2
1. Private-industry workers.

Strictly Confidantlal <FRoClass Zx ra
1-22
REAL GROSS DOIBSTIC PRODUCT AL~ RZLamTD ZIBHS, QUAR RLY VUALES(Seasonally adjusted, annual rate xcept as noted)
S- -. - -. - - Projected------ ---- ------
1999 1999 2000 2000 2000 2000 2001 2001 2001 2001Item Units 03 04 01 Q2 03 Q4 01 02 Q3 Q4
WXPBB TVhZB
Real GOPNeal GOP
Oross domestic purchasesFinal salesPriv. da. final parchases
Personal cons. apendituresDurablesMondurablesServices
Business fized investmentquaipent & Software
NonrM. *structuraeResidntial structures
EaportsImports
Gov't. cons. & iavestmentFederal
DefenseState & local
Chage in bus. iaventoriessontazi
Bet eSorts
BMainal GDP
EMPIUN T AD PRODUCTION
Monfaxm payroll 1eploymantUnemployment rate
Zudastrial prod. indexCapacity util. rate - mfg.
ousaing startsLight motor vehiole sales
North Amer. producedOther
ZSCOME AND BLV33M
Nominal GNPrniaaJl OIPNaminal GNPNoinal porsonal lacooneal disposable incomPersonal saving rate
Corp. profits, VA & CCAdj.Profit share of GPe
Excluding FR Banks
Federal saupl./deficitState & local surpl./daf.
tb. social ins. funds
Gros natl. saving ratoNet natl. saving rate
PRCZES AND COSTS
CP chn.-wt. price indexGross Damestic Purchases
chn.-wt. price iadex
PCw chn.-wt. price iadaxbe. food ead energy
CPIBe. food and energ
ZCI, hourly rcpensation1
ontfazr business sectorOutpat per hourCOmpnstion per hourUnit labor cost
Bill. $ 9297.8 9507.9 9685.7 9872.6 10018.8 10163.5 10307.3 10449.7 10594.0 10742.9Bill. Ch. $1 8879.8 9037.2 9145.0 9262.9 9355.5 9448.1 9532.2 9617.6 9703.3 9790.2
S change
Bill. Ch. $
% change
Millions
5 change
Millions
Bill. $% change
s
I change
Bill. $
% change
5.7 7.3 4.9 5.36.2 7.2 6.1 5.94.5 6.0 6.7 3.95.3 5.3 10.0 4.7
4.9 5.9 7.6 4.07.7 13.0 22.2 -0.73.6 7.6 6.2 4.55.0 3.7 5.4 4.8
10.9 2.9 24.8 10.615.7 4.0 29.1 10.6-3.8 -0.5 16.5 5.7-3.8 1.8 6.3 -2.2
11.5 10.1 0.2 11.014.9 8.7 10.1 14.3
4.5 9.3 -1.4 3.94.1 14.7 -15.S 8.7
11.2 17.2 -23.2 8.04.8 6.4 7.0 1.4
38.0 66.7 21.4 54.341.2 72.3 29.2 61.3
-340.4 -344.1 -378.2 -399.2
6.8 9.4 7.7 7.9
128.9 129.6 130.5 131.54.2 4.1 4.1 3.9
4.8 5.3 6.4 7.279.7 80.3 80.7 81.3
1.66 1.69 1.72 1.6517.16 16.89 18.13 17.3214.71 14.09 15.28 14.552.45 2.80 2.85 2.77
9282.3 9472.3 9653.4 9838.56.8 8.4 7.9 7.95.2 7.4 6.3 8.22.9 4.7 2.0 5.42.1 1.8 0.5 0.9
1.6 17.0 31.9 2.49.5 9.7 10.2 10.19.2 9.4 9.9 9.8
133.8 112.2 198.4 193.948.9 68.8 56.3 57.348.1 67.7 55.0 56.0
18.7 18.3 18.5 18.67.1 6.9 7.1 7.3
1.1 2.0 2.6 2.7
1.7 2.3 3.2 2.3
1.8 2.5 3.2 2.61.2 2.0 1.8 2.4
2.4 2.9 4.1 3.52.1 2.3 2.3 3.2
3.7 4.0 5.9 3.5
5.0 6.9 1.5 3.54.6 3.8 4.2 5.0
-0.3 -2.9 2.7 1.5
4.1 4.0 3.6 3.6 3.6 3.65.0 4.1 4.0 4.0 3.7 3.33.9 4.3 3.9 3.7 3.7 3.85.1 4.7 4.4 4.2 3.8 3.4
4.4 3.8 3.9 3.5 3.0 2.55.4 4.2 3.2 2.7 3.1 2.84.0 3.3 3.3 2.7 2.0 1.84.4 4.0 4.4 4.1 3.6 2.9
12.2 12.6 9.9 10.1 10.2 9.714.7 15.6 12.3 12.6 12.9 12.43.9 2.8 2.0 1.7 1.1 0.5-4.8 -5.0 -5.1 -3.2 -3.5 -2.6
4.0 9.4 4.5 8.3 8.7 12.010.7 8.6 7.0 9.8 8.2 7.4
3.5 2.8 3.5 3.5 3.6 3.61.2 -0.8 1.3 1.3 1.4 1.40.7 0.8 0.8 0.8 0.9 0.94.7 4.7 4.7 4.6 4.7 4.7
59.6 53.2 47.5 45.7 44.3 40.764.6 56.2 49.5 46.7 44.3 39.7
-427.3 -433.9 -448.0 -462.7 -470.4 -465.7
6.1 5.9 S.8 5.6 5.6 5.7
131.9 132.4 132.9 133.4 133.9 134.33.8 3.8 3.9 3.9 3.9 4.0
5.6 3.6 4.2 4.0 4.9 3.081.5 81.7 81.8 81.9 82.0 82.1
1.64 1.61 1.60 1.58 1.56 1.5617.09 16.87 16.63 16.51 16.50 16.4914.40 14.2 14.11 14.04 14.0 1.062.69 2.59 2.52 2.47 2.44 2.43
9982.0 10122.1 10261.7 10400.8 10544.9 10690.96.0 5.7 5.6 5.5 S.7 5.76.3 6.3 7.0 5.9 5.6 5.74.1 3.8 6.1 3.4 3.1 3.10.8 0.7 1.2 1.2 1.2 1.3
4.0 2.3 -2.5 0.1 2.6 3.410.0 9.9 9.7 9.6 9.6 9.59.8 9.7 9.5 9.4 9.3 9.3
212.2 217.7 204.4 223.9 248.4 258.953.8 56.9 58.8 55.7 49.8 45.252.4 55.5 57.4 54.3 48.4 43.8
18.6 18.6 18.7 18.7 18.8 18.97.3 7.3 7.4 7.4 7.6 7.7
1. Private-industry workers.
May 11, 2000

Strictly Confidential <FR>Class II FOMC
CONTRIBUTIONS TO GROWTH IN REAL GROSS DOMESTIC PRODUCT AND RELATED ITEMS
1997 1997 1998 1998 1998 1998 1999 1999 1999 9704/ 984/ 99Q4/Item Q3 Q4 Q1 Q2 Q3 Q4 Q1 Q2 Q3 96Q4 97Q4 98Q4
Real GDPGross dom. purchases
Final salesPriv. dom. final purchases
Personal con. expendituresDurablesNondurablesServices
Business fixed investmentEquipment & SoftwareNonres. struotures
Residential structures
Net exportsExportsImports
Government cons. 4 invest.Federal
DefenseNondefunse
State and local
Change in bus, inventoriesNonfarmFarm
3.8 3.0 6.9 2.2 3.8 5.9 3.7 1.9 5.7 4.1 4.7 4.64.7 3.5 8.9 4.2 4.7 5.6 5.9 3.3 6.4 4.7 5.8 5.7
5.5 2.3 5.2 5.1 2.4 6.2 4.5 3.4 4.5 3.6 4.7 4.66.1 2.8 7.4 6.1 3.0 5.3 5.9 4.5 4.5 3.8 5.4 4.8
1.4 0.01.2 0.20.2 -0.20.5 0.3
1.8 1.0 0.9 1.31.6 1.1 1.0 1.40.2 -0.2 -0.2 -0.10.4 0.5 0.2 -0.2
-0.8 -0.5 -1.9 -2.0 -0.8 0.3 -2.1 -1.4 -0.71.3 0.2 -0.2 -0.5 -0.2 1.7 -0.6 0.4 1.2
-2.1 -0.7 -1.8 -1.6 -0.7 -1.3 -1.5 -1.8 -1.9
0.3 -0.0 -0.2-0.1 -0.3 -0.6-0.0 -0.1 -0.8-0.1 -0.2 0.10.4 0.3 0.5
-1.6 0.7-1.6 0.8-0.0 -0.1
1.0 0.2 0.5 0.9 0.2 0.80.7 -0.1 0.2 -0.0 0,1 0.30.4 0.3 -0.1 -0.2 -0.1 0.40.3 -0.4 0.4 0.1 0.2 -0.20.3 0.4 0.3 0.9 0.1 0.6
1,6 -2.81.6 -2.30.0 -0.5
1.4 -0.3 -0.9 -1.5 1.11.1 -0.8 -0.6 -1.2 1.30.3 0.6 -0.2 -0.2 -0.2
2.60.60.51.5
1.11.00.10.1
-0.71.0
-1.7
0.40.0-0.10.10.4
0.50.5
-0.0
Note. Components may not sum to totals because of rounding.
May 11, 2000

Strictly Confidential <FR>Class II FOMC
CONTRIBUTION TO GROWTH IN REAL GROSS DOMESTIC PRODUCT AND RELATED ITEMS
Item
Real GDPGross dom. purchases
Final salesPriv. dom. final purchases
Personal cons. expendituresDurablesNondurablesServices
Business fixed investmentEquipment & SoftwareNonres, structures
.Residential structurea
Net exportsExportsImports
Governmaent ons. & invest.FederalDefenseNondefense
State and looal
Change in bus. inventoriesNonfarmFarm
1999 2000 2000 2000 2000 2001 2001 2001 2001 99Q4/ 00Q4/ 01o4/04 Q1 93 03 94 01 02 03 04 98Q4 9904 0004
7.3 4.9 5.3 4.1 4.0 3.6 3.6 3.6 3,6 4.6 4.5 3.67.4 6.3 6.1 5.2 4.2 4.1 4.2 3.9 3.4 5.7 5.4 3.9
6.0 6.7 3.9 3.8 4.3 3.8 3.7 3.7 3,8 4.6 4.7 3.74.5 0.4 4.0 4.3 4.0 3.7 3.6 3.3 2.9 4.8 3.1 3.4
4.1 5.1 2.7 3.0 2.6 2.7 2.4 2.1 1,71.0 1.7 -0.1 0.4 0.3 0.3 0.2 0.2 0.21.5 1.2 0.9 0.8 0.7 0,7 0.5 0.4 0.41.5 2.1 1.9 1.7 1.6 1.7 1.6 1.4 1.1
0.4 3.0 1.3 1.5 1.6 1.3 1.3 1,3 1,30.4 2.6 1.0 1.4 1.5 1.2 1.3 1.3 1.3
-0.0 0.5 0.2 0.1 0.1 0.1 0.1 0.0 0,00.1 0.3 -0.1 -0.2 -0.2 -0.2 -0.1 -0.1 -0.1
-0.1 -1.4 -0.8 -1.1 -0.2 -0.5 -0.5 -0.2 0.21.1 0.0 1.1 0.4 1.0 0.5 0.9 0.9 1.3
-1.2 -1.4 -1.9 -1.5 -1.2 -1.0 -1.4 -1.2 -1.1
1.6 -0.20.9 -1.00.7 -1.00.2 -0.00.8 0.6
1.2 -1.91.4 -1.8
-0.1 -0.0
0.6 0.5 0.6 0.6 0.6 0.60.1 -0.0 0.1 0.1 0.1 0,10.0 0.0 0.0 0.0 0.0 0.00.0 -0.1 0,0 0.0 0.0 0,00.5 0.5 0.5 0.5 0.5 0.5
0.2 -0.3 -0.2 -0.1 -0.1 -0.10.1 -0.3 -0.3 -0.1 -0.1 -0.20.1 0.1 0.0 0.0 0.0 0.0
3.70.61.11.8
0.91.0-0.10.2
-1.10.5-1,6
0.90.30.20.10.6
-0.00.2
-0.2
-0.1 -0.1-0.2 -0.20.0 0.0
Note. Components may not sum to totals because of rounding.
May 11, 2000
I

Strictly Confidential (FR)Class II FOMC
May 11, 2000Staff Projections of Federal Sector Accounts and Related Items
(Billions of dollars except as noted)
Fiscal year1 1999 2000 2001
Item 1998 a 19991 2000 2001 Qla Q2a Q03 Q4a QIP Q2 Q3 Q4 Ql Q2 Q3 Q4
Unified budget Not seasonally adjusted
Receipts 2 1722 1827 2010 2113 402 564 449 444 434 650 483 478 468 656 510 513Outlays 2 1653 1703 1786 1844 396 421 419 464 449 440 433 461 471 464 448 480Surplus/deficit 2 69 125 225 269 6 143 30 -21 -15 210 50 17 -2 192 62 32
On-budget -30 1 72 99 -49 88 21 -64 -45 146 33 -30 -31 119 41 -20Off-budget 99 124 153 170 55 55 9 43 30 64 17 48 29 73 21 52
Surplus excludingdeposit insurance 65 119 221 267 5 142 29 -20 -18 209 50 17 -3 192 62 32
Means of financingBorrowing -51 -88 -230 -267 7 -108 -20 48 -27 -192 -58 -36 -9 -157 -67 -58Cash decrease 5 -18 12 -0 -4 -31 -3 -27 39 -12 12 20 5 -30 5 20Other 3 -23 -19 -7 -1 -9 -4 -7 -0 4 -6 -4 -1 6 -5 -0 6
Cash operating balance,end of period 39 56 45 45 22 53 56 83 45 57 45 25 20 50 45 25
NIPA federal sector Seasonally adjusted annual rates
Receipts 1722 1839 1993 2112 1827 1853 1883 1922 1986 2017 2048 2080 2091 2122 2154 2187Expenditures 1694 1737 1814 1888 1729 1735 1749 1810 1787 1823 1836 1863 1887 1898 1905 1928
Consumption expenditures 452 467 492 509 467 465 475 492 482 496 499 498 510 513 515 518Defense 300 305 318 327 305 301 312 326 310 317 319 321 327 329 330 331Nondefense 153 162 174 182 162 164 163 167 173 179 180 177 183 184 185 187
Other expenditures 1242 1270 1322 1379 1262 1270 1274 1318 1304 1327 1337 1365 1377 1385 1390 1410Current account surplus 28 102 179 224 98 118 134 112 199 194 212 218 204 224 248 259Gross investment 84 92 99 103 90 96 95 102 97 98 100 101 102 103 104 105Current and capital
accountsurplus -56 10 80 121 7 22 39 11 102 96 113 117 102 121 144 154
Fiscal Indicators4
High-employment (HEB)
surplus/deficit -139 -91 -60 -31 -94 -74 -69 -116 -31 -52 -41 .39 -50 -31 -6 5Change in HEB, percent
of potential GDP -.9 -.6 -.4 -.3 -.4 -.2 -. 1 .5 -.9 .2 -. 1 -0 .1 -.2 -.2 -. 1Fiscal impetus (FI)
percent, calendar year 0 5 3 5 2 -.4 2 4 -5 4 .9 .8 2 .5 .4 .7
1, Fiscal year data for the unified budget come from OMB; quarterly data come from the Monthly Treasury Statement and may not sum to OMB fiscal year totals.2. OMB's February 2000 surplus estimates (assuming the enactment of the President's proposals) are $167 billion in FY2000 and $184 billion in FY2001. CBO's March 2000 baseline surplus estimates,
assuming discretionary spending grows with inflation beginning in FY 2001, are $179 billion in FY2000 and $181 billion in FY2001. Budget receipts, outlays, and surplus/deficit include correspondingsocial security (OASDI) categories. The OASDI surplus is excluded from the on-budget surplus and shown separately as off-budget, as classified under current law, The Postal Service deficit isincluded in off-budget outlays beginning in FY1990.
3. Other means of financing are checks issued less checks paid, accrued items, and changes in other financial assets and liabilities.4. HEB is the NIPA current and capital account surplus In current dollars, with cyclically sensitive receipts and outlays adjusted to the level of potential output associated with an unemployment rate of
6 percent. Quarterly figures for change in HEB and FI are not at annual rates. The sign on Change in HEB, as a percent of nominal potential GDP, is reversed. FI is the weighted difference of discretionarychanges in federal spending and taxes in chained (1996) dollars, scaled by real federal consumption plus investment. For change in HEB and FI, negative values indicate restraint.
a--Actual p--Preliminary

Strictly Confidential (FR)Class II FOMC
Change in Debt of the Domestic Nonfinancial Sectors(Percent)
Nonfederal
Households
Memo:Federal Home Consumer State and local Nominal
Period ] Total 2 government 3 Total 4 Total mortgages credit Business governments GDP
Year1991 4.3 11.1 2.2 4.5 6.1 -1.3 -1,6 8.6 4.01992 4.6 10.9 2.6 4.5 5.3 0.8 0.8 2.2 6.41993 4.9 8.3 3.7 5.4 4.5 7.3 1.4 6,0 5.01994 4.6 4.7 4.5 7.7 6.0 14.5 3.7 -4.0 6.2
1995 5,5 4.1 6,0 7.9 5.8 14.1 6.8 -4.6 4.31996 5.4 4.0 5.9 7.4 7.4 7.9 5.7 -0.6 6.01997 5.4 0.6 7.0 6.4 6.7 4.3 8.2 5.3 5.91998 6.6 -1.4 9.3 8.7- 9.7 5.4 10.5 7.2 5.9
1999 6.8 -1.9 9.4 9.4 10.4 7.3 10.6 4.4 6.32000 4.8 -8.5 8.4 8.9 9.1 9.3 9.1 2.5 6.92001 4.8 -8.6 7.8 7.5 8.3 5.4 9.2 2.5 5.7
Quarter1999:3 7.0 -2.2 9.6 9.9 11.3 5.6 10.2 4.6 6.8
4 6.5 -0,5 8.4 8.4 8.8 8.3 9.6 2.5 9.32000:1 5.7 -5.5 8.8 9.6 9.2 10.9 9.3 1.7 7.7
2 4.0 -12.2 8.2 8.7 9.0 9.1 8.7 2.7 7.93 5.0 -7.1 7.9 8.5 8.7 8.6 8.4 2.7 6.14 4.3 -10.3 7.7 7.8 8.4 7.3 8.6 2.8 5.9
2001:1 5.6 -3.8 7.7 7.7 8.3 6.5 8.8 2.8 5.82 4.7 -9,0 7.7 7.4 8.1 5.6 9.0 2.5 5.63 4.8 -8.7 7.6 7.3 7.9 4.9 8.9 2.4 5.64 3.8 -14.1 7.4 6.9 7.8 4.3 8.8 2.3 5.7
Note. Quarterly data are at seasonally adjusted annual rates.1. Data after 1999:Q4 are staff projections. Changes are measured from end of the preceding period to
end of period indicated except for annual nominal GDP growth, which is calculated from Q4 to Q4.2. On a monthly average basis, total debt is projected to grow 5.2 percent in 2000 and 4.8 percent in 2001.3. On a monthly average basis, federal debt is projected to grow -7.2 percent in 2000 and -8.2 percent in 2001.4. On a monthly average basis, nonfederal debt is projected to grow 8.5 percent in 2000 and 7.9 percent in 2001.
2.6.3 FOF
May 11, 2000

Class II FOMC (Billions of dollars except as noted)
Seasonally adjusted annual rates
Calendar year 1999 2000 2001
Category 1998 1999 2000 2001 Q3 Q4 Q1 Q2 Q3 Q4 QI Q2 Q3 Q4
Net funds raised by domesticnonfinancial sectors
1 Total2 Net equity issuance3 Net debt issuance
Borrowing sectorsNonfinancial business4 Financing gap I5 Net equity issuance6 Credit market borrowing
Households7 Net borrowing 28 Home mortgages9 Consumer credit
10 Debt/DPI (percent) 3
State and local governments11 Net borrowing12 Current surplus 4
Federal government13 Net borrowing14 Net borrowing (quarterly, n.s.a.)15 Unified deficit (quarterly, n.s.a.)
Depository institutions16 Funds supplied
Memo (percentage of GDP)17 Domestic nonfinancial debt518 Domestic nonfinancial borrowing19 Federal government 6
20 Nonfederal
744.3 963.3 767.8 809.0 1029.6 1065.8 1062.1 516.5 805.3 687.1 957.2 800.0 827.6 651.3-267.0 -142.7 -71.3 -62.0 -138.6 -41.6 62,8 -188.0 -80.0 -80.0 -62.0 -62.0 -62.0 -62.01011.3 1105.9 839,1 871.0 1168.2 1107.4 999.3 704.5 885.3 767.1 1019.2 862.0 889.6 713.3
134.4 159.2 177.5 262.1 174.5 182.8 122.2 173.9 197.1 217.0 227.7 250.8 274.1 295.7-267.0 -142.7 -71.3 -62.0 -138,6 -41.6 62.8 -188.0 -80.0 -80.0 -62.0 -62.0 -62.0 -62,0511.7 568.5 543.2 599.5 579.7 559.8 558.1 535.2 527.2 552.2 573.2 601.2 609.2 614.2
471.9 556.6 577.9 529.3 614.6 533.8 623.4 579.1 572,1 537.1 539.1 530.1 531.1 517.1359.8 421,7 408.5 404.2 482.4 385.9 411.2 413.2 407.2 402.2 404.2 404.2 404.2 404.267.6 96.8 132.5 85.0 77.3 115.9 155.2 134.0 129.0 112.0 102.0 89.0 79.0 70.090.3 93.2 95.7 97.3 93.8 94.3 95.2 95.5 96,1 96.6 96.6 97.0 97.5 98.0
80.3 52.7 31.2 32.4 57.0 30.7 21,8 33.4 34.4 35.4 35.4 32.4 31.4 30.4140.5 156.2 169.0 173.7 154.8 176,9 166.2 169.2 167.8 172.9 177.0 176.0 172.2 169.8
-52.6 -71.8 -313.3 -290.1 -83.1 -16.9 -204.0 -443.2 -248.3 -357.6 -128.5 -301.7 -282.1 -448.3-52.6 -71.8 -313.3 -290.1 -19.0 47.7 -27.5 -191.9 -58.3 -35.6 -8.6 -156.5 -66.7 -58.3-54.4 -158.3 -262.4 -283.8 -30.1 20.6 15.0 -210.1 -50.1 -17.2 2.3 -192.0 -61.9 -32.3
360.5 407.9 446.0 357.5 533.0 636.0 593.8 428.4 396.9 364.9 348.4 358.9 356.9 365.9
179.7 181.7 179.2 177.3 182.3 181.4 180.8 179.5 178.9 178.4 178.0 177.9 177.5 176.911.5 11.9 8.4 8.3 12.6 11.6 10.3 7.1 8.8 7.5 9.9 8.2 8.4 6.6-0.6 -0.8 -3.2 -2.8 -0.9 -0.2 -2.1 -4.5 -2.5 -3.5 -1.2 -2.9 -2.7 -4.212.1 12.7 11.6 11.0 13.5 11.8 12.4 11,6 11.3 11.1 11.1 11.1 11.1 10.8
Note. Data after 1999:Q4 are staff projections.1. For corporations: Excess of capital expenditures over U.S. internal funds,2. Includes change in liabilities not shown in lines 8 and 9.3. Average debt levels in the period (computed as the average of period-end debt positions)
divided by disposable personal income.
2.6.4 FOF
4. NIPA surplus less changes in retirement fund assets plus consumption of fixed capital.5. Average debt levels in the period (computed as the average of period-end debt positions) divided by nominal GDP.6. Excludes government-insured mortgage pool securities.
Strictly Confidential (FR) Flow of Funds Projections: Highlights May 11, 2000

International Developments
OverviewReadings on foreign economic activity since the March Greenbook have come insomewhat stronger than we expected, and we have raised our projection forforeign growth, particularly in the near term. Recent indicators point to a pickupof Japanese domestic demand in the first half, but significant doubts remainabout whether the improved pace will be sustained beyond mid-year. Canadahas continued to thrive on spillovers from the robust U.S. economy. Activity inthe euro area has benefited--and is likely to benefit further-from weakness of itscurrency. The outlook for growth of U.S. trading partners among the developingcountries remains solid. Recoveries of several Asian emerging-marketeconomies have settled back toward more sustainable rates. In Mexico, growthwas higher than expected in the first quarter, and key South American countrieshave continued to recover from recent recessions.
Although the recent spike in oil prices was reflected in upticks in headline priceindexes, the strengthening of foreign growth has occurred without any clearsigns of an acceleration of underlying inflation. Lately, higher oil prices and theending of pass-through effects from previous yen appreciation have causedJapanese consumer prices to decline a bit less rapidly, but looking ahead,inflation risks are minimal because ample economic slack remains. Even in theeuro area, where depreciation of the currency has been substantial, core inflationhas moved up only modestly. Inflation appears to be under control in theemerging-market economies as well.
The dollar moved up further during the intermeeting period, showing surprisingresilience in the face of falling U.S. equity prices and monetary policy firmingabroad. Accordingly, we have bowed in the direction of the dollar's persistentstrength and raised our outlook for the dollar's path. Nevertheless, in view ofthe large and widening U.S. current account deficit, we continue to project thatthe dollar will depreciate.
The upward revision to foreign growth only partially offsets the effect of thehigher dollar path on our projection for net exports. While we have revisedexports down, especially in the near term, the contribution of exports to U.S.GDP growth should increase next year. Demand for real imports should slackenover the forecast period as U.S. growth slows. The stronger dollar also shouldrestrain prices of core imports somewhat this year, but they are expected to riselater in the forecast period as the dollar depreciates. A lower path for oil pricesin the near term mostly reflects OPEC's decision in late March to increaseproduction, which should help keep import price pressures down as well. By theend of the forecast period, oil import prices should settle around $19.30 perbarrel, somewhat higher than in the March Greenbook.
Part 1: Summary and Outlook May 11 2000
Recent DevelopmentsInternational financial markets. Since the March FOMC meeting, thenominal exchange value of the dollar has risen about 3-1/2 percent, on balance,in terms of the major currencies index. The broad index has moved up about2-1/2 percent, as the dollar has gained less against currencies of other importanttrading partners. The dollar has been supported in part by higher U.S. interestrates, as the surprising pace of U.S. economic growth and indications ofheightened domestic price pressures have continued to fuel expectations of moreU.S. monetary tightening. Even when the U.S. stock market fell sharply inmid-April, sympathetic movements in other stock markets and a shift toward theperceived safety of dollar-denominated instruments belied what had been apopular "disaster scenario" for the dollar-that a break in the U.S. market wouldprecipitate a shift in investors' preferences toward foreign assets. The largestappreciation during the intermeeting period--about 7 percent--came against theeuro, with smaller gains against sterling, the yen, and the Canadian dollar. Thedollar is up somewhat against the Mexican peso and the Brazilian real as well.
In moves that were largely anticipated by the markets, the European CentralBank, the Swiss National Bank, the Bank of Canada, and the Reserve Bank ofAustralia all raised official rates during the intermeeting period. Authoritiespointed to concerns about potential inflation generally, with the ECB being moreexplicit than in previous official communications about concerns that euroweakness was adding to inflationary risks. Short-term and long-term interestrates moved up in Europe and Canada, but declined slightly in Japan.
.The Desk did not intervene during the period for the accounts of theSystem or the Treasury.
Economic activity abroad. Recent data from the industrial countries confirm afairly widespread strengthening of activity so far this year. A cluster of positiveindicators suggests that Japan is experiencing a rebound from its saggingperformance at the end of last year, although labor-market conditions still arevery soft. Even after allowing for leap-year effects that have boosted someindicators, improvements in industrial production, housing, and shipments ofmanufactures indicate that activity strengthened in the first quarter. Businessconfidence (as measured by the March Tankan survey) and other forward-looking indicators also have improved a bit.
The euro area has shown further indications of solid expansion. Unemploymentrates have continued to move down, while industrial production, construction,
1-30 ParT I: Summary and Outlook, May 11, 2000
and orders have remained firm. Areawide business sentiment stayed at its recordhigh level. Growth in Canada and the United Kingdom slowed in the firstquarter but still appears to be quite robust.
Higher energy prices raised headline inflation in recent months, but the latestdata suggest that these effects are waning. Core inflation rates have shown noclear signs of increasing. Higher oil prices nudged the twelve-month change ofJapanese wholesale prices into the positive range in recent months, but consumerprices and land prices have extended their prolonged declines.
The pace of activity in several key Asian economies that had been experiencingquite rapid growth--including Korea, China, and Taiwan--has slackened only abit. In Latin America, Mexico has continued to benefit from the strength of theU.S. economy; Mexico and other oil exporters in the region also have beenhelped by higher oil prices. Other Latin American countries, including Brazil,Argentina, and Chile, appear to be continuing to recover from their recentrecessions. Inflation has remained subdued on balance, although performanceshave varied somewhat across the emerging market economies.
Prices of internationally traded goods. After peaking in early March, oilprices fell substantially, mainly in response to OPEC's decision to increaseproduction. Oil production increases by Mexico and Norway and a boost inexports from Russia also contributed to the price decline. More recently, oilprices partially reversed their declines as a labor strike in Norway temporarilydisrupted oil shipments and as some OPEC members indicated that they may notincrease production in June as much as some market participants had expected.The spot price of West Texas intermediate currently is trading around $28 perbarrel, about $2 below the March average.
Prices of non-oil imports moved up 0.7 percent, a.r., in the first quarter, aboutthe same pace as in the fourth quarter of last year. Prices of imported core goods(which exclude oil, computers, and semiconductors) rose at about twice that rate,as higher prices of industrial supplies, automotive products, and foods wereoffset incompletely by a swing from increase to decrease in prices of machineryand consumer goods. Prices of computers and semiconductors also fell.
Prices of exports of core goods (nonagricultural goods other than computers andsemiconductors) increased 3.3 percent, a.r., a bit faster than in fourth quarter.First-quarter increases were led by a large jump in the price of industrialsupplies (which include oil and oil-related chemicals).
U.S. international transactions. In February, the U.S. trade deficit in goodsand services expanded by $1.8 billion to $29.2 billion. The combined deficit for
International Developments I-31

January and February was larger than that in the fourth quarter by $38 billion,s.a.a.r. Exports for January-February were 1/2 percent higher in value than inthe fourth quarter of last year, with moderate increases in most major tradecategories except aircraft, fuels, and chemicals, which declined. By exportmarket, Canada, Western Europe, and Mexico showed the greatest increases.The value of imports for January-February combined was 3-1/2 percent higherthan in the fourth quarter, with increases in all major trade categories exceptfoods.
After expanding strongly in the final two quarters of 1999, real exports areestimated to have made a zero contribution to GDP growth in the first quarter ofthis year. Rising imports continued to satisfy a significant part of the growth ofdomestic expenditures in the first quarter. In the NIPA, this is reflected in anestimated 1.4 percentage point "negative contribution" to GDP growth in2000:Q1 (slightly more negative than in the fourth quarter of last year, but lessso than during 1999 as a whole).
OutlookThe dollar. In light of the recent appreciation of the dollar, especially inrelation to the euro, we have shifted up the path of the dollar in the Greenbookoutlook. We have to admit to having no firm basis for determining the timing ofthe end to dollar appreciation. However, our reading of fundamentals convincesus that dollar appreciation cannot be sustained as U.S. economic growth slowsrelative to that abroad and as the expanding U.S. current account deficit strainsforeign investors' willingness to continue adding to their holding of U.S.obligations. We project that the real trade-weighted value of the dollar (asmeasured by our major-currencies index) will peak in the current quarter andthen depreciate gradually during the rest of the forecast period. By the fourthquarter of 2001, we forecast that it will have fallen to a level 4-1/2 percent belowits average level in the current quarter. This end-point still is almost 3 percenthigher than the level projected in the March Greenbook owing to the dollar'srecent upward movement.
Our exchange rate outlook embodies a fairly sizable real appreciation of the euroas well as more moderate real appreciations of the Canadian dollar, the Swissfranc, and sterling. During the second half of this year and 2000, the euro isexpected to recover from its recent lows, as the gap between U.S. and euro-areagrowth narrows and the ECB raises interest rates significantly. The ECB isexpected to react sooner (before midyear) and tighten somewhat more during theforecast period than assumed in the March Greenbook. Against the yen, incontrast, the dollar is projected to appreciate in real terms as a result of a flat
I-32 Part 1: Summary and Outlook, May 11, 2000

path for the yen/dollar exchange rate, continued deflation in Japan, and anincrease in core U.S. inflation.
We continue to project a slight depreciation of the dollar in real terms against thecurrencies of our other important trading partners, led by a decline against thecurrencies of emerging Asian economies. In contrast, the real value of the dollaris expected to hold roughly constant against the Mexican peso and major LatinAmerican currencies.
Foreign economic activity and prices. Total foreign real output growth(weighted by U.S. bilateral export shares) is projected to strengthen noticeably inthe first half of this year. Despite slowing in the second half and somewhatmore in 2001, growth during these six quarters is projected to average about 4percent. The level of GDP at the end of the forecast period is more than 1/2percent higher than projected in the March Greenbook. Aggregate foreigninflation is expected to rise modestly over the forecast period, to slightly below3-1/2 percent next year. Many key countries (including Japan and somedeveloping countries) still have substantial economic slack, and monetarytightening is expected to blunt inflationary pressure in countries in moreadvanced stages of economic recovery and expansion.
Summary of Staff Projections(Percent change, seasonally adjusted annual rate)
Projection
1999 1999 2000 2000 2001H1 H2 H1 H21
Foreign output 4.5 4.3 4.7 4.1 3.9March GB 4.4 4.0 3.9 3.9 3.8
Foreign CPI 2.3 2.9 2.3 3.6 3.4March GB 2.7 2.5 3.3 3.0 3.4
NOTE. Changes for years are measured as Q4/Q4; for half-years,Q2/Q4 or Q4/Q2.
Industrial countries. Export-weighted real GDP growth in the foreignindustrial countries is projected to remain at about 3-1/2 percent in 2000, beforeslowing to 3 percent in 2001. This forecast is about 1/2 percentage pointstronger for 2000 and nearly 1/4 percentage point stronger for 2001 than in theMarch Greenbook. It includes upward revisions to growth in Japan, the euro
International Developments I-33

Part 1: Summary and Outlook, May 11, 2000
area, and Canada. In Japan, recent indicators suggest that GDP is rebounding inthe first half after a very poor performance in the second half of last year.Japanese growth in the second half of 2000 and in 2001 is expected to besluggish, held down by the withdrawal of fiscal stimulus and by the effect onspending of uncertainties about employment and household income related inpart to corporate restructuring.
Growth in the euro area is projected to pick up from its 1999 rate of 3 percent toabout 3-3/4 percent on average during the forecast period as domestic demandgains momentum and external demand is boosted by the weak euro. TheCanadian economy, which surged in 1999 and early this year in concert with theU.S. economy, is expected to slow gradually toward its potential growth rate inresponse to tighter monetary policy and slower U.S. growth.
Inflation. Continued strong activity should intensify pressure on resources inmost foreign industrial economies, leading to a moderate increase in coreinflation rates. However, the effect on headline prices of the relatively gradualincrease in core measures will be offset by the retracing of some of the runup ofoil prices of the past year or so. Inflation in the euro area is expected to declinefrom its recent rate, which is near the ECB's target ceiling of 2 percent, to about1-1/2 percent by year-end, but to rise a bit in 2001 as economic slack diminishes.In the United Kingdom, where wage growth has picked up in response to tightlabor market conditions, inflation is projected to rise to the Bank of England's2-1/2 percent ceiling by the end of 2001. Japanese prices are expected tocontinue to decline over the next two years but at a lower rate than last year asthe deflationary effect of past yen appreciation wanes. Slower Japanesedeflation accounts for most of the rise in the import-weighted average of foreignindustrial country inflation rates from just over 1 percent in 1999 to between1-1/4 percent and 1-1/2 percent in 2000 and 2001.
Interest rates. We assume that the Bank of Japan will begin to move short-terminterest rates cautiously away from zero in the second half of this year, asfirst-half indicators confirm a return to positive growth. Japanese rate hikes areexpected to total only 25 basis points by the end of the forecast period, as growthwill remain tepid at best. Responding to concerns about euro weakness, butcognizant of the risks of restraining growth, the ECB is assumed to tightenpolicy by another 75 basis points this year-with a portion of this increase likelycoming relatively soon--and 50 basis points next year. That will bring therefinancing rate to 5 percent by mid-2001, 50 basis points higher than assumedin the March Greenbook. The Bank of England is assumed to tighten policy byan additional 50 basis points to contain inflationary pressures, but the strength ofthe pound against other European currencies should forestall any need for moreaggressive action. The Bank of Canada is expected to match the rises assumed

International Developments I-35
for U.S. policy rates. Long-term interest rates, which already incorporate someexpectations of future monetary tightening, should move up less than short ratesin most major foreign industrial economies.
Other countries. Growth of real GDP for the major developing-country tradingpartners of the United States is projected to average about 5-1/4 percent over theforecast period, only a slight moderation from the pace of last year. Thenear-term outlook has been raised slightly since the last Greenbook, reflectinggenerally stronger incoming data. Growth in the Asian developing economies isexpected to slow from about 8 percent in 1999 to somewhat below 7 percentthrough the end of next year. In contrast, Latin American growth is expected toedge up to about 4-1/4 percent during the forecast period, as severalcountries-including Brazil, Argentina, and Chile-continue to pull out of therecession that hit the region in late 1998. Growth in Mexico, which was amongthe economies least affected by the regional recession, is projected to slow froma 5-1/4 percent pace in 1999 to a 4-1/2 percent rate next year.
Inflation in developing countries is expected to pick up only modestly inresponse to strong activity, as inflationary pressures are limited by the still-highlevels of excess capacity remaining from the previous downturn, declining oilprices, and generally stable exchange rates.
Prices of internationally traded goods. Our predicted trajectory for oil pricesis notably flatter than in the previous Greenbook, with lower prices in the nearterm and somewhat higher prices toward the end of the forecast period. Thenear-term revision is due primarily to OPEC's decision in late March to increaseproduction by 1.7 million barrels per day. For 2001, our projection for the priceof imported oil is somewhat higher than in the previous Greenbook, reflectingSaudi Arabia's stated preference to keep the prices of WTI and Brent in therange of $20 to $25 per barrel. We project that the price of imported oil willdecline to nearly $23 per barrel by the fourth quarter of this year and tosomewhat above $19 by the end of 2001. Of course, given low inventory levels,oil prices likely will remain quite volatile.
International Developments I-35

Selected Trade Prices(Percent change except as noted; seasonally adjusted annual rate)
Projection
Trade category 1999 2000 2000 2000Q4 Q1 Q2 H2
ExportsNonagricultural (core) 2.9 3.3 1.8 0.7 0.8Agricultural 1.0 -3.6 11.8 3.7 3.5
ImportsNon-oil (core) 1.3 1.4 0.6 2.6 3.0Oil (level, dollars per barrel) 22.00 26.00 25.50 23.10 19.30
NOTE. Prices for nonagricultural exports and non-oil imports of goods,both excluding computers and semiconductors, are on a NIPA chain-weightedbasis. The price of imported oil for multi-quarter periods is the price for the finalquarter of the period. Changes for years are measured as Q4/Q4; for half-years,Q2/Q4 or Q4/Q2; and for quarters, from previous quarter.
Prices of core imports are projected to flatten out in the second quarter, but torise thereafter, largely reflecting the projected path of the dollar. Prices of coregoods exports are expected to decelerate as the run-up in prices of industrialsupplies (which includes petroleum products and petrochemicals) slows from therapid pace of last year.
U.S. International Transactions. Real exports of goods and services haveslowed in the opening months of this year from their rapid pace during thesecond half of 1999, but they should strengthen in the second half and somewhatmore next year. Over the four quarters of 2000, exports are projected to grow 6percent, somewhat more than last year, and to accelerate to 8-1/2 percent in2001. Robust real output growth abroad should help sustain the expansion ofcore exports throughout the forecast period. The firming of core export growthover the course of the forecast also reflects the boost to competitiveness of U.S.products implied by our projection for the exchange value of the dollar andprices here and abroad. Relative prices should shift from imparting slightrestraint on the growth of core exports during the first half of this year tostimulating their growth at rising rates over the forecast period.
I-36 Part 1: Summary and Outlook, May 11, 2000

International Developments 1-37
Summary of Staff Projections for Goods and Services(Percent change, seasonally adjusted annual rate)
ProjectionMeasure 1999 1999 2000 2000
H1 H2 H1 H2 2
Real exports -0.9 10.8 5.5 6.7 8.4March GB -0.9 10.1 7.5 7.0 8.7
Real imports 13.5 11.8 12.2 9.7 8.1March GB 13.5 12.5 13.5 9.0 8.5
NOTE. Changes for years are measured as Q4/Q4; for half-years,Q2/Q4 or Q4/Q2; and for quarters, from previous quarter.
Real imports of goods and services are projected to decelerate over the forecastperiod from about 12 percent growth at an annual rate during the second half of1999 and first half of 2000 to 8 percent growth in 2001. This pattern reflects theslower expected growth of imports of non-oil core goods and of services. Theprojected slowing of U.S. real GDP growth partly accounts for the deceleration.In addition, we expect that relative prices here and abroad, which have beenstrongly boosting growth of non-oil imports in recent quarters, will continue todo so only in the near term and will change to a slightly restraining factor nextyear. The quantity of imported oil is forecast to expand strongly in the nearterm, as stocks are replenished, but more moderately in 2001.
With regard to impacts on U.S. GDP growth, we expect exports to contribute 0.7percentage point this year and 0.9 percentage point in 2001, after contributing0.5 percentage point in 1999. We expect that imports will satisfy a sizable,though diminishing, part of the growth of domestic demand over the forecastperiod, subtracting 1.5 percentage points from real GDP growth in 2000 and 1.2percentage points in 2001. As a result, the contribution of net exports to GDPgrowth will move from negative 1.1 percentage point in 1999 to negative 0.9percentage point this year and negative 0.3 percentage point in 2001.
The U.S. current account deficit is projected to rise from 3.7 percent of GDP in1999 to 4.6 percent this year and 4.9 percent in 2001. Much of the projectedchange is in goods and services, but the net outflow of investment income alsoincreases notably. Net investment income payments are projected to increasesignificantly as the U.S. net liability position increases in tandem with the largecurrent account deficit.

Part 1: Summary and Outlook, May 11, 2000
Risks to the Foreign OutlookWeaker U.S. dollar. Because of the uncertainties surrounding the outlook forthe dollar, in the scenario below we have considered the effects of an additionalacross-the-board 10 percent nominal depreciation of the dollar that occurs in thecurrent quarter. In this scenario, the federal funds rate is assumed to remainunchanged from its baseline path, and the dollar stays about 10 percent belowbaseline over the remaining six quarters of the forecast period. The additionaldollar depreciation raises U.S. GDP growth about 1/4 percentage point relativeto baseline in 2000, and slightly over 1 percentage point in 2001. Inflation incore PCE prices (which exclude food and energy) is increased 1/4 percentagepoint in 2000 relative to baseline and slightly more than 1/2 percentage point in2001.
Impact of a Weaker Dollar'(Percent change, Q4 to Q4)
Measure 2000 2001
U.S. real GDPBaseline 4.6 3.6Weaker dollar 4.8 4.7
U.S. PCE prices ex. food and energyBaseline 2.2 2.4Weaker dollar 2.4 3.0
1. The dollar depreciates 10 percent below baseline in 2000:Q2and remains at this lower level through 2001:Q4. Simulations assumethe federal funds rate is unchanged from baseline.
I-38

Strictly Confidential (FR)Class II FOMC
OUTLOOK FOR FOREIGN
May 11, 2000
REAL GDP AND CONSUMER PRICES:(Percent, Q4 to Q4)
SELECTED COUNTRIES
--Projected--
Measure and country 1993 1994 1995 1996 1997 1998 1999 2000 2001
REAL GDP (1)
Total foreign 3.2 5.1 2.3 4.3 4.1 0.8 4.4 4.4 3.9
Industrial Countries 1.9 3.9 1.9 2.9 3.3 1.7 3.4 3.6 3.0of which:
Canada 2.9 5.5 1.4 2.4 4.4 2.8 4.7 3.9 3.4Japan 0.5 0.9 2.5 5.2 -0.5 -3,1 0.0 2.8 0.8United Kingdom 3.2 4.6 1,9 2.9 3.4 1.5 3,0 2.6 2.5Euro-ll 0.1 3.0 1.6 1.8 3.0 2.0 3.0 3.8 3.6Germany -0.3 2.8 1.1 1.4 1.5 1.2 2.3 3.7 3.7
Developing Countries 5.1 6.9 3.0 6.4 5.1 -0,3 5.8 5,5 5.1Asia 7.8 8.9 7.2 7.0 4.7 -1.9 8.2 6.9 6.6
Korea 6.3 9.4 7.2 6.8 3.7 -5.5 14.0 8.0 7.0China 6.1 16.3 12.6 9.2 8.2 9.5 6.2 8,0 8.0
Latin America 2.6 5,4 -3.9 6.3 6.1 1.0 3.8 4.5 4.2Mexico 1.9 5.2 -7.1 7.1 6.7 2.6 5.2 5.0 4.5Brazil 4.5 9,8 -1.9 5.5 2.2 -1.6 3.2 3.1 3.4
CONSUMER PRICES (2)
Industrial Countries 2.1 1.1 1.3 1.4 1.6 1.0 1.1 1.3 1.4of which:Canada 1.8 -0.0 2.1 2.0 1.0 1.1 2.4 2.3 2.3Japan 1.2 0.8 -0.8 0.1 2,0 0.8 -1.3 -0.7 -0.4United Kingdom (3) 2.7 2.2 2.9 3.2 2.7 2.5 2.2 2.4 2.5Euro-ll (4) NA NA NA 2.0 1.5 0.8 1.5 1.5 1.6
Germany 4.2 2.6 1.5 1.4 2.0 0.4 0.9 1.1 1.5
Developing Countries 24,7 22.7 17.0 11.0 6.9 9.0 4.7 5.3 6.1Asia 7.7 10.5 6.4 4.7 2.9 4.4 0.3 3.1 4.4
Korea 5.5 5.8 4.3 5.1 5.1 6.0 1.3 2.1 4.9China 17.3 26.9 11.0 6.8 0.9 -1.2 -0.9 3,2 4.2
Latin America 73.9 54.0 42.1 25.9 15.6 15.5 12.6 9.1 9.2Mexico 8.6 7.0 48.9 28.2 17.2 17.5 13.6 9.6 9.7Brazil 2272.4 1196.9 21.5 9.6 4.7 1.6 8.3 5.8 5.1
Foreign GDP aggregates calculated using shares of U.S. non-agricultural exports,Foreign CPI aggregates calculated using shares of U.S. non-oil imports.CPI excluding mortgage interest payments, which is the targeted inflation rate.Harmonized CPI's, weighted by shares in final consumption of households convertedcurrency using estimated PPP exchange rates.
to a common

Strictly Confidential (FR)Class II FOMC
OUTLOOK FOR FOREIGN REAL GDP AND CONSUMER PRICES: SELECTED COUNTRIES(Percent changes)
May 11, 2000
Measure and country
1999
Q1 Q2 Q3 Q4
----------------- Projected --------------------2000 2001
Q1 Q2 Q3 Q4 Q1 Q2 Q3 Q4
REAL GDP (1) -------------------- Quarterly changes at an annual rate ----------------
Total foreign
Industrial Countriesof which:
CanadaJapanUnited KingdomEuro-11Germany
Developing CountriesAsia
KoreaChina
Latin AmericaMexicoBrazil
CONSUMER PRICES (2)-------------------
Industrial Countriesof which:
CanadaJapanUnited Kingdom (3)Euro-11 (4)Germany
Developing CountriesAsia
KoreaChina
Latin AmericaMexicoBrazil
3.8 5.1 4.3 4.2
4.0 3.4 3.5 2.8
5.16,31.62.52.7
3.77.0
13.02.20.72.53.8
3.63.93.02.40.3
7.811.517.51.15.07.63.4
5.5-3.94,13.83.5
5.45.3
14.011.46.18.90.1
5.0 4.3
4.4 3.5
4.1 4.0
3.3 3.2
4.0 3.9 3.8 3.8
3.1 3.1 3.0 2.9
3.61.12.84.14.5
4.6-5.53.13.22.7
6.39.3
11.710.63.42.25.8
5.06.67.08.04.14.33.5
-------------------------- Four-quarter changes -----------------------
0.7 0.9 1.3 1.1
0.8-0.22.60.90.3
8.22.60.7
-1.516.418.62.0
1.6-0.42.31.00.5
7.00.90.6-2.115.818.03.4
5.90,20.7
-1.114.716.55.7
2.4-1.32.21.50.9
4.70.31.3-0.912.613.6
8.3
1.5 1.4 1.3 1.3
2.7-0.82.12.11.8
3.90.51.60.1
10.010.6
7.8
2.5-0.62.41.81.4
4.21.61.81.99.09.37.4
2.4-0.92.41.51.1
2.3-0.72.41.51.1
1.4 1.4 1.4 1.4
2.3-0.6
2.41.51.3
6.24,13.73.9
10,010.6
6.4
2.3-0.52.41.51.3
6.64,64.94.4
10.210.7
6.7
2.3-0.52.51.61.4
6.44.54.84.49.9
10.55.9
2.3-0.42.51.61.5
Foreign GDP aggregates calculated using shares of U.S. non-agricultural exports.Foreign CPI aggregates calculated using shares of U.S. non-oil imports.CPI excluding mortgage interest payments, which is the targeted inflation rate.Harmonized CPI's, weighted by shares in final consumption of households convertedcurrency using estimated PPP exchange rates.
to a common
I ~- - - - - I-

Strictly Confidential (FR)Class II FOMC
May 11, 2000
OUTLOOK FOR U.S. INTERNATIONAL TRANSACTIONS
Projected1993 1994 1995 1996 1997 1998 1999 2000 2001
NIPA REAL EXPORTS and IMPORTSPercentage point contribution to GDP growth, Q4/Q4
Net Goods & Services -0.6 -0.3 0.4 -0.2 -0.7 -1.1 -1.1 -0.9 -0.3Exports of G&S 0.5 1.0 1.0 1.1 1.0 0.2 0.5 0.7 0.9Imports of G&S -1.1 -1.3 -0.6 -1.3 -1.7 -1.3 -1.6 -1.5 -1.2
Percentage change, Q4/Q4
Exports of G&S 4.8 10.5 9.7 9.8 9.2 2.0 4.8 6.1 8.4Services 6.0 8.2 8.8 8.9 2.3 2.6 3.7 1.8 4.6Agricultural Goods -5.3 16.3 -4,0 3.7 3.3 0.3 -1.7 1.3 1.6Computers 17.3 27.2 39.1 21.6 26.1 7.1 12.0 35.4 36.0Semiconductors 31.1 66.9 79.6 44.6 21.0 9.3 33.4 35.1 41.1Other Goods 1/ 3.5 6.9 5.7 7.8 11.4 1.1 3.5 4.1 5.0
Imports of G&S 10.5 12.1 5.0 11.2 14.2 10.8 12.6 10.9 8.1Services 6.7 1.8 5.5 5.3 13,6 8.4 6.9 5,9 2.8Oil 10.1 -0.3 2.4 7.8 4.0 4.1 -3.3 13.4 0.4Computers 30.7 38.9 35.0 17.7 32.4 26.9 26.1 30.6 36.1Semiconductors 33.6 54.5 92.4 56.7 32,8 -7.4 35.4 38.5 42.4Other Goods 2/ 9.4 12.3 -1.2 10.4 12.7 11.3 13.4 8.9 5.6
Billions of chained 1996 dollars
Net Goods & Services -59.1 -86.5 -78.4 -88.9 -112.1 -217.6 -323.1 -409.7 -461.7Exports of G&S 672.7 732.8 808.2 874.2 983.1 1004.6 1042.4 1111.9 1195.0Imports of G&S 731.8 819.4 886.6 963.1 1095.2 1222.2 1365.4 1521.6 1656.7
Billions of dollars
US CURRENT ACCOUNT BALANCE -85.3 -121.7 -113.6 -129.3 -143.5 -220.6 -339.0 -458.8 -513.2Current Acct as Percent of GDP -1.3 -1.7 -1.5 -1.7 -1.7 -2.5 -3.7 -4,6 -4.9
Net Goods & Services (BOP) -69.9 -98.4 -97.5 -104.3 -104.7 -164.3 -267.6 -369.1 -410.7
Investment Income, Net 26.9 20.3 23.9 21.8 8.2 -7.0 -19.2 -36.4 -49.2Direct, Net 58.6 54.4 63.8 67.7 69.2 59.4 58.4 65.3 81.6Portfolio, Net -31.7 -34.1 -39.9 -46.0 -61.0 -66.4 -77.6 -101.7 -130.7
Other Income & Transfers,Net -42.2 -43.6 -39.9 -46.7 -46.9 -49.3 -52.2 -53.3 -53.3
1. Merchandise exports excluding agricultural products, computers, and semiconductors.2. Merchandise imports excluding oil, computers, and semiconductors.

Strictly Confidential (FR)Class II FOMC
May 11, 2000
OUTLOOK FOR U.S. INTERNATIONAL TRANSACTIONS
1996 1997 1998--------------------------- --------'~1---------------- "--------------------Q1 Q2 Q3 Q4 Q1 Q2 Q3 Q4 Q1 Q2 Q3 Q4
NIPA REAL EXPORTS and IMPORTSPercentage point contribution to GDP growth
Net Goods & Services -1.0 -0.8 -1.3 2.1 -0.9 -0.5 -0.8 -0.5 -1.9 -2.0 -0.8 0.3Exports of G&S 0.3 0.7 0.4 2.9 0.9 1.7 1.3 0.2 -0.2 -0.4 -0.2 1.7Imports of G&S -1.3 -1.6 -1.7 -0.8 -1.8 -2.2 -2.1 -0.7 -1,7 -1.6 -0.6 -1.3
Percentage change from previous period, s.a.a.r.
Exports of G&S 2.3 6.8 3.2 28.7 8.3 15.9 11.3 1.7 -1.5 -3.9 -1.6 16.3Services -3.9 12.9 -7.3 39.7 -4.9 10.4 7.2 -2.7 1,7 8.9 -8,4 9.2Agricultural Goods 15.0 -25.3 -4.6 41.3 -18.5 3.3 4.6 29.2 -11.0 -16.3 -16.5 62.7Computers 40.4 4.9 17.1 26.9 56,1 46.2 28.4 -13.6 -12.9 11.0 19,0 14.5Semiconductors 24.2 35.2 24.2 110.0 46.2 24.5 26.2 -6.7 1.3 -13.1 25,3 29.4Other Goods 1/ -0.4 7.0 7.8 17.7 13.6 17.2 11.7 3.5 -1.2 -9.2 0.6 15.6
Imports of G&S 10.8 13.3 14.4 6.3 15.5 19.0 17.6 5.2 14.4 13.0 5.2 10.8Services 5,7 4.0 11.7 0.0 20.8 8.5 20.7 5.3 16.9 9.6 6.5 1.5Oil -9.6 67.4 5.4 -15.3 -7.4 36.4 6.3 -13.0 6.5 42.1 2.4 -24.3Computers 10.4 21.0 19.2 20.5 45.0 48.5 34.3 6.2 35.7 23.0 11.4 39.4Semiconductors 30.0 18.9 58.4 146.3 77.6 28.1 28.8 6.1 1,3 -20.1 -3.0 -6.4Other Goods 2/ 13.5 10.2 13.7 4.6 11.9 16.5 15.6 6.9 13.5 12.9 4.9 14.2
Billions of chained 1996 dollars, s.a.a.r.
Net Goods & Services -75.0 -90.3 -115.9 -74,6 -92.6 -103.2 -121.3 -131.5 -174.5 -221.1 -240.4 -234.4Exports of G&S 846.1 860.1 867.0 923.5 942.1 977.6 1004.2 1008.4 1004,5 994,5 990.6 1028.7Imports of G&S 921.1 950.4 982.9 998.1 1034.7 1080.8 1125.5 1139.9 1179.0 1215.6 1231.0 1263.1
Billions of dollars, s.a.a.r.
US CURRENT ACCOUNT BALANCE -107.0 -125.8 -153.3 -131.1 -139,6 -125.9 -142.5 -165.9 -172.1 -209.6 -253.9 -246.7Current Account as % of GDP -1.4 -1.6 -2.0 -1.6 -1,7 -1.5 -1.7 -2.0 -2.0 -2.4 -2.9 -2.8
Net Goods & Services (BOP) -89.4 -105.9 -125.9 -96.1 -106.4 -96.8 -102.9 -112.8 -133.4 -167.8 -182.9 -173.1
Investment Income, Net 30.4 21.3 15.1 20.2 9.0 13.7 5.8 4.2 6.1 2.9 -22.5 -14.3Direct, Net 68.5 64.3 63.6 74.5 66.4 74.7 69.2 66.6 67.3 64.7 47.3 58.2Portfolio, Net -38.2 -43.0 -48.5 -54.3 -57.4 -60.9 -63.4 -62.4 -61.3 -61.8 -69.9 -72.5
Other Inc. & Transfers, Net -48.0 -41.2 -42.5 -55.2 -42.1 -42.9 -45.4 -57,3 -44.8 -44.7 -48.5 -59.3
1. Merchandise exports excluding agricultural products, computers, and semiconductors.2. Merchandise imports excluding oil, computers, and semiconductors.

Strictly Confidential (FR)Class II FOMC
May 11, 2000
OUTLOOK FOR U.S. INTERNATIONAL TRANSACTIONS
---------------------- Projected -------------------------
1999 2000 2001---------------------------- ----- I------------------- --- ~--'------------------Q1 Q2 Q3 Q4 Q1 Q2 Q3 Q4 Q1 Q2 Q3 Q4
NIPA REAL EXPORTS and IMPORTSPercentage point contribution to GDP growth
Net Goods & Services -2.1 -1.4 -0.7 -0.1 -1.4 -0.8 -1.1 -0.2 -0.5 -0.5 -0.2 0.2Exports of G&S -0.6 0.4 1.2 1.1 0.0 1.1 0.4 1.0 0.5 0.9 0.9 1.3Imports of G&S -1.5 -1.8 -1.9 -1.2 -1.4 -1.9 -1.5 -1.2 -1.0 -1.4 -1.2 -1.1
Percentage change from previous period, s.a.a.r,
Exports of G&S -5.5 4.0 11.5 10.1 0.2 11.0 4.0 9.4 4.5 8.3 8.7 12,0Services 4.1 3.1 0.1 7.5 0.1 2.0 1.4 3.5 4.6 4.8 4.5 4.3Agricultural Goods -38.1 29,3 27.3 -8.1 16.9 -7.1 -2.2 -0.9 -1.2 1.4 3.2 3.0Computers -3.1 32,0 28.2 -3.9 24.2 43.7 38.6 36.0 36.0 36.0 36.0 36.0Semiconductors 36.3 40,8 47.8 11.7 12.1 43.7 43.7 43.7 41.1 41.1 41.1 41.1Other Goods 1/ -9.3 -2.0 12.7 14.4 -3.8 12.6 -0.0 8.2 -1.0 4.9 5.3 11.2
Imports of G&S 12.5 14.4 14.9 8.7 10.1 14.3 10,7 8.6 7.0 9.8 8,2 7.4Services 12.1 8.9 3.6 3.4 6.0 8.5 5.7 3.5 2.2 2.7 3.1 3.3Oil 7.3 25.4 -11.6 -26.4 36.3 24.4 4.6 -6.8 -14.9 32.7 2.8 -12.6Computers 28.7 52.5 20.0 7.2 9.1 38.6 38.6 38.6 36.1 36.1 36.1 36.1Semiconductors 18.4 63.5 19.0 45.9 24.1 43.7 43.7 43.7 43.7 43.7 41.1 41.1Other Goods 2/ 11.3 10.3 19,7 12.6 8.1 11.3 8.8 7.3 6.1 5.5 5.4 5.4
Billions of chained 1996 dollars, s.a.a.r.
Net Goods & Services -286.6 -321.1 -340.4 -344.1 -378.2 -399.2 -427.3 -433.9 -448.0 -462.7 -470.4 -465,7Exports of G&S 1014.3 1024.3 1052.6 1078.2 1078.7 1107.3 1118.1 1143.6 1156.3 1179.7 1204.6 1239,3Imports of G&S 1300.9 1345.4 1393.0 1422.3 1456.9 1506.5 1545.4 1577,5 1604.3 1642.4 1674.9 1704,9
Billions of dollars, s.a.a.r.
US CURRENT ACCOUNT BALANCE -275.6 -324.6 -356.3 -399.2 -432,2 -445.0 -468.5 -489.6 -497.3 -512.7 -518.0 -524.9Current Account as % of GDP -3.0 -3.5 -3.8 -4.2 -4.5 -4.5 -4.7 -4.8 -4.8 -4.9 -4.9 -4.9
Net Goods & Services (BOP) -216.7 -261.2 -290.4 -302.1 -349.1 -360.1 -380.9 -386.4 -400,9 -412.9 -418.1 -411.0
Investment Income, Net -12.1 -13.2 -15.5 -35.9 -32,5 -34.3 -37.0 -41.7 -45.9 -49.1 -49.3 -52.3Direct, Net 59.0 55.7 66.2 52.9 60.9 63.4 66.9 70.1 72.9 76.9 85.3 91.1Portfolio, Net -71.1 -68.9 -81.7 -88.7 -93.4 -97.8 -103.9 -111.8 -118.8 -126.1 -134.6 -143.4
Other Inc. & Transfers, Net -46.8 -50.2 -50.4 -61.3 -50.6 -50.6 -50.6 -61.6 -50.6 -50.6 -50.6 -61,6
1. Merchandise exports excluding agricultural products, computers, and semiconductors.2. Merchandise imports excluding oil, computers, and semiconductors.