fomc 19940517 gb sup 19940513
TRANSCRIPT

Prefatory Note
The attached document represents the most complete and accurate version available based on original copies culled from the files of the FOMC Secretariat at the Board of Governors of the Federal Reserve System. This electronic document was created through a comprehensive digitization process which included identifying the best-preserved paper copies, scanning those copies,1 and then making the scanned versions text-searchable.2 Though a stringent quality assurance process was employed, some imperfections may remain.
Please note that this document may contain occasional gaps in the text. These gaps are the result of a redaction process that removed information obtained on a confidential basis. All redacted passages are exempt from disclosure under applicable provisions of the Freedom of Information Act.
1 In some cases, original copies needed to be photocopied before being scanned into electronic format. All scanned images were deskewed (to remove the effects of printer- and scanner-introduced tilting) and lightly cleaned (to remove dark spots caused by staple holes, hole punches, and other blemishes caused after initial printing). 2 A two-step process was used. An advanced optimal character recognition computer program (OCR) first created electronic text from the document image. Where the OCR results were inconclusive, staff checked and corrected the text as necessary. Please note that the numbers and text in charts and tables were not reliably recognized by the OCR process and were not checked or corrected by staff.
CONFIDENTIAL (FR)CLASS III FOMC
May 13, 1994
SUPPLEMENT
CURRENT ECONOMIC AND FINANCIAL CONDITIONS
Prepared for theFederal Open Market Committee
By the StaffBoard of Governors
of the Federal Reserve System
TABLE OF CONTENTS
Page
THE DOMESTIC NONFINANCIAL ECONOMY
Consumption. .... . . . . . . . . . . . . .. . . . . 1Business inventories . . . . . . . . . . . . . . . . . 2Prices . . . . . . ... . . . . . . . . . . .. . . . . 3
Tables
Retail sales . . . . . . . . . . . . . . . . . . .. . 5University of Michigan Survey Research Center:
Survey of Consumer Attitudes . . .. .. .. ... 6Changes in manufacturing and trade inventories . . . . 8Inventories relative to sales . . ... .. . . . . . 8Recent changes in consumer prices. . . . . . .. . . . 10Recent changes in producer prices. . . . . . . . . ... 10Inflation rates excluding food and energy. .... . .. 11Spot prices of selected commodities . . . . . . .. .12
Charts
Real PCE goods excluding motor vehicles . . . . . . . 5Housing attitudes/MBA data . . . .. . . . . . . . . . 7Ratio of inventories to sales. . ... . . . .. .. . 9Construction prices. . . . . . . .. . . . . . . . . 13
THE FINANCIAL ECONOMY
Senior Loan Officer Opinion Survey . . . . . . ... . 14
Table
Commercial bank credit and short- and intermediate-term business credit . . . . . . . . . . . . . . . 19
Selected financial market quotations . . . .. .. . . . 20
SUPPLEMENTAL NOTES
THE DOMESTIC NONFINANCIAL ECONOMY
Consumption
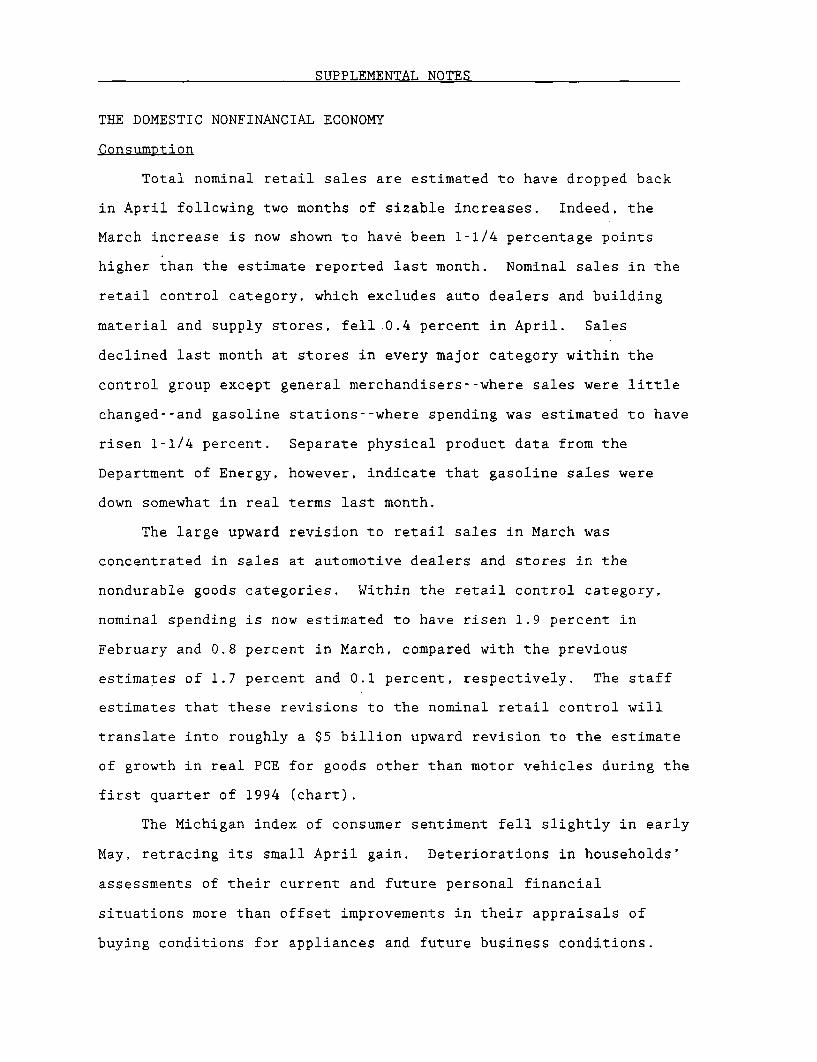
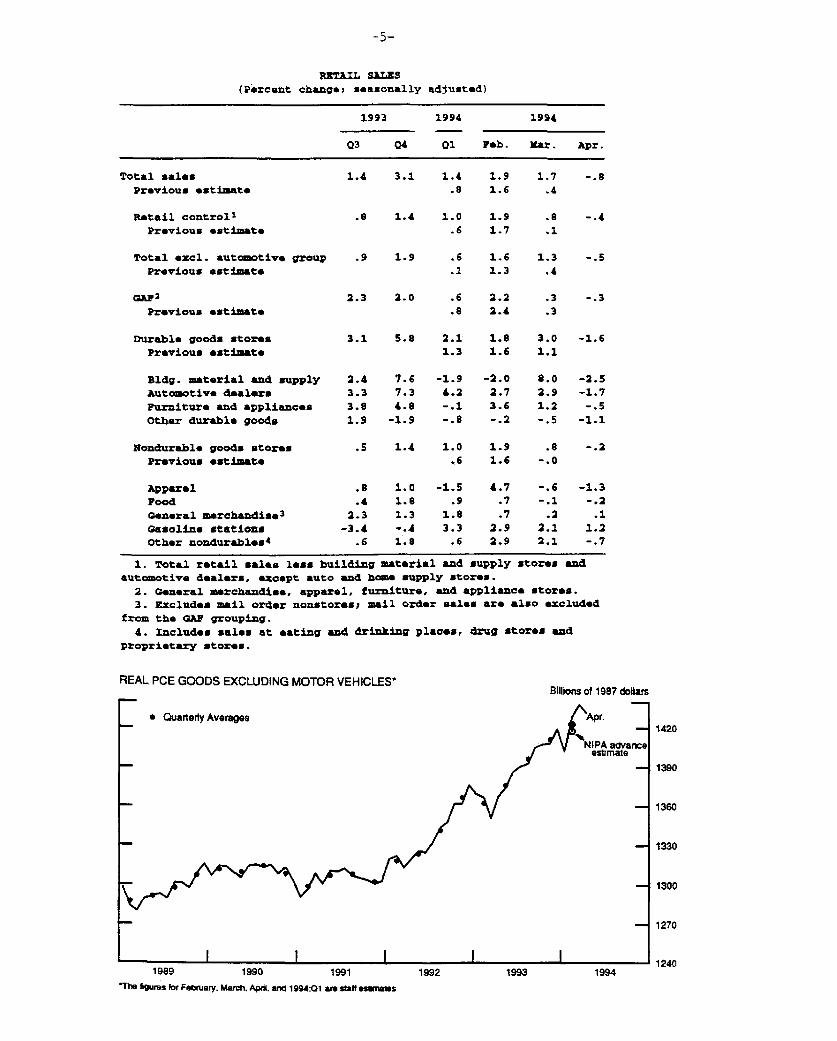
Total nominal retail sales are estimated to have dropped back
in April following two months of sizable increases. Indeed, the
March increase is now shown to have been 1-1/4 percentage points
higher than the estimate reported last month. Nominal sales in the
retail control category, which excludes auto dealers and building
material and supply stores, fell 0.4 percent in April. Sales
declined last month at stores in every major category within the
control group except general merchandisers--where sales were little
changed--and gasoline stations--where spending was estimated to have
risen 1-1/4 percent. Separate physical product data from the
Department of Energy, however, indicate that gasoline sales were
down somewhat in real terms last month.
The large upward revision to retail sales in March was
concentrated in sales at automotive dealers and stores in the
nondurable goods categories. Within the retail control category,
nominal spending is now estimated to have risen 1.9 percent in
February and 0.8 percent in March, compared with the previous
estimates of 1.7 percent and 0.1 percent, respectively. The staff
estimates that these revisions to the nominal retail control will
translate into roughly a $5 billion upward revision to the estimate
of growth in real PCE for goods other than motor vehicles during the
first quarter of 1994 (chart).
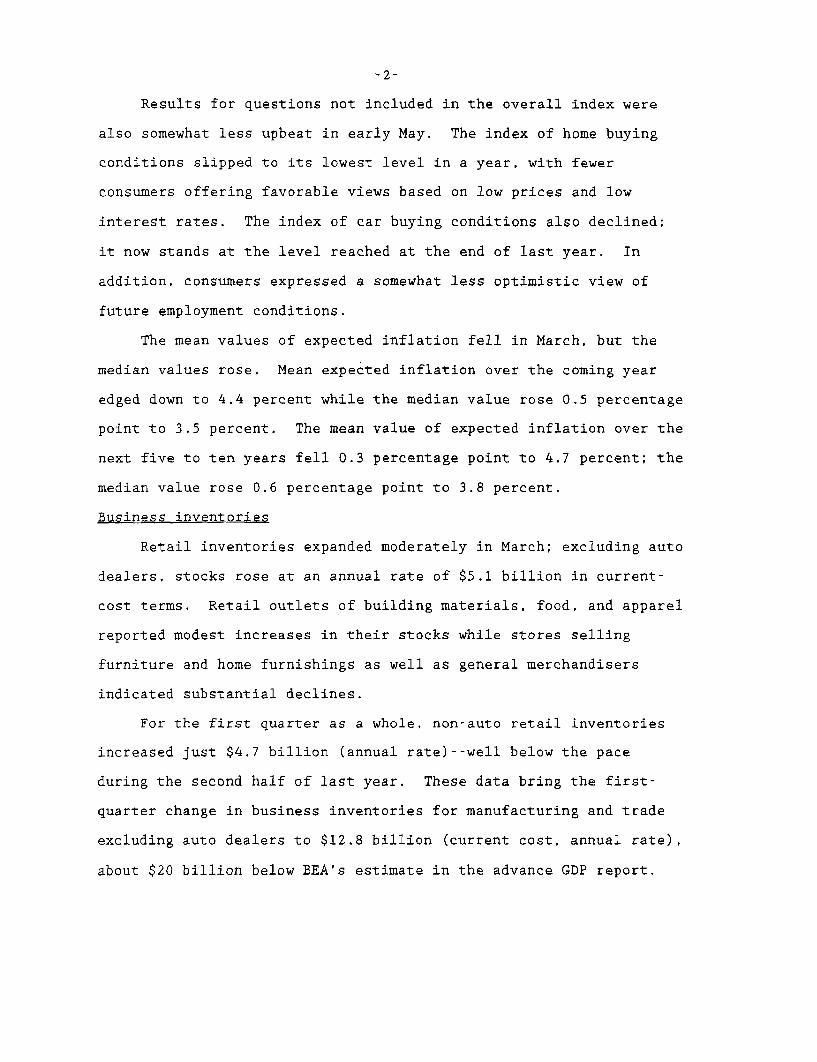
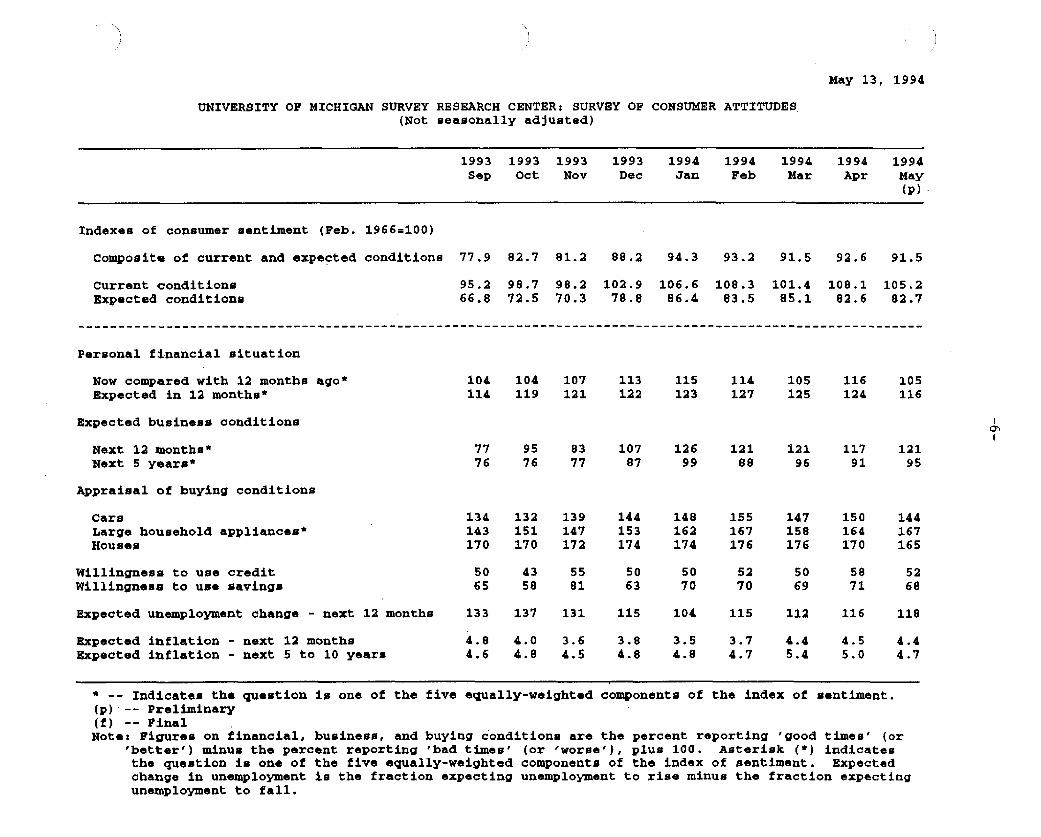
The Michigan index of consumer sentiment fell slightly in early
May, retracing its small April gain. Deteriorations in households'
assessments of their current and future personal financial
situations more than offset improvements in their appraisals of
buying conditions for appliances and future business conditions.
-2-
Results for questions not included in the overall index were
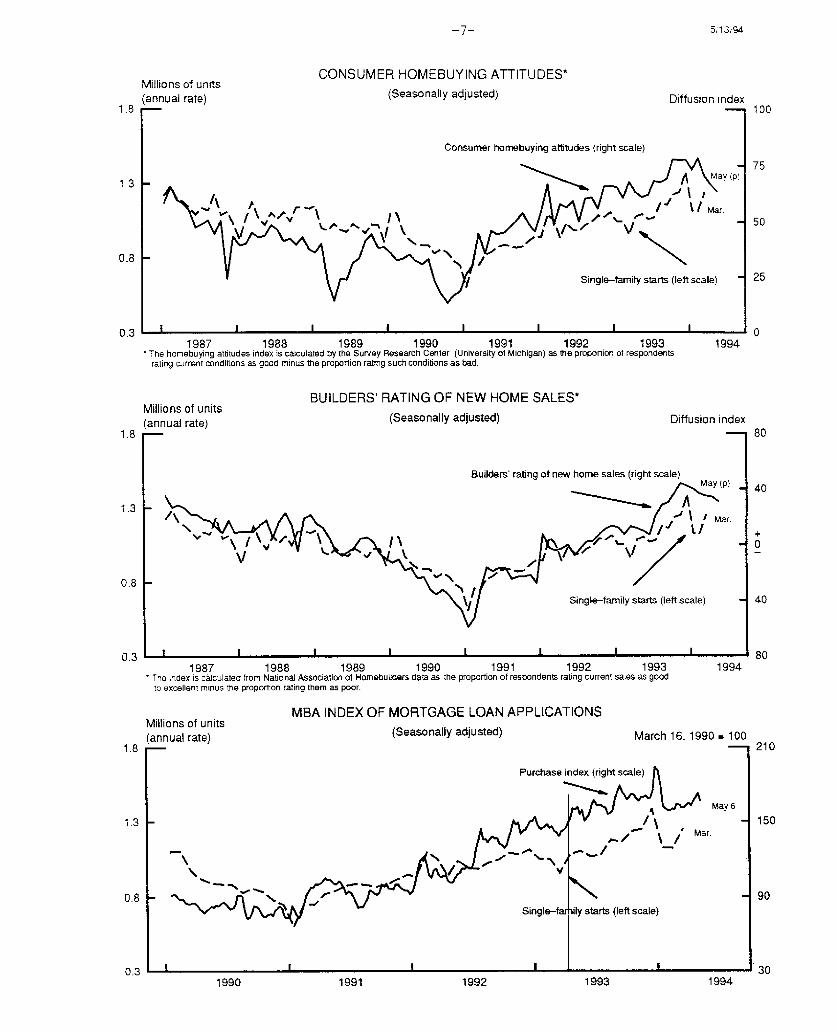
also somewhat less upbeat in early May. The index of home buying
conditions slipped to its lowest level in a year, with fewer
consumers offering favorable views based on low prices and low
interest rates. The index of car buying conditions also declined;
it now stands at the level reached at the end of last year. In
addition, consumers expressed a somewhat less optimistic view of
future employment conditions.
The mean values of expected inflation fell in March, but the
median values rose. Mean expected inflation over the coming year
edged down to 4.4 percent while the median value rose 0.5 percentage
point to 3.5 percent. The mean value of expected inflation over the
next five to ten years fell 0.3 percentage point to 4.7 percent; the
median value rose 0.6 percentage point to 3.8 percent.
Business inventories
Retail inventories expanded moderately in March; excluding auto
dealers, stocks rose at an annual rate of $5.1 billion in current-
cost terms. Retail outlets of building materials, food, and apparel
reported modest increases in their stocks while stores selling
furniture and home furnishings as well as general merchandisers
indicated substantial declines.
For the first quarter as a whole, non-auto retail inventories
increased just $4.7 billion (annual rate)--well below the pace
during the second half of last year. These data bring the first-
quarter change in business inventories for manufacturing and trade
excluding auto dealers to $12.8 billion (current cost, annual rate),
about $20 billion below BEA's estimate in the advance GDP report.
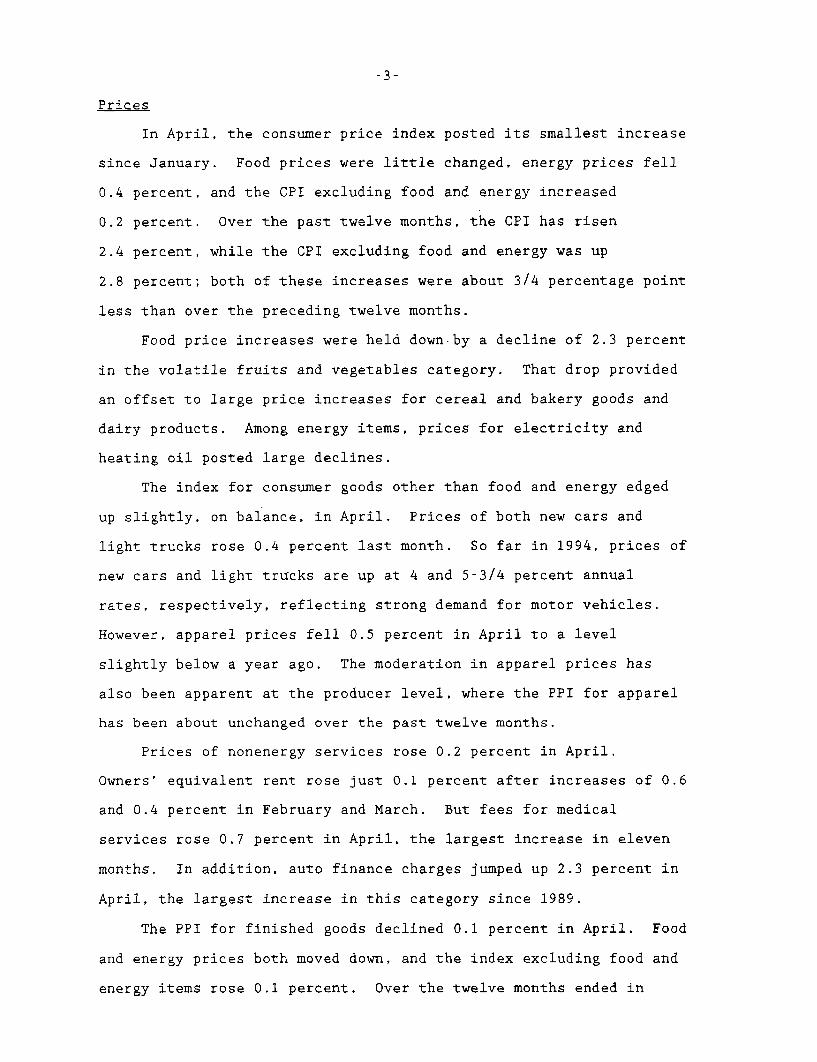
Prices
In April, the consumer price index posted its smallest increase
since January. Food prices were little changed, energy prices fell
0.4 percent, and the CPI excluding food and energy increased
0.2 percent. Over the past twelve months, the CPI has risen
2.4 percent, while the CPI excluding food and energy was up
2.8 percent; both of these increases were about 3/4 percentage point
less than over the preceding twelve months.
Food price increases were held down by a decline of 2.3 percent
in the volatile fruits and vegetables category. That drop provided
an offset to large price increases for cereal and bakery goods and
dairy products. Among energy items, prices for electricity and
heating oil posted large declines.
The index for consumer goods other than food and energy edged
up slightly, on balance, in April. Prices of both new cars and
light trucks rose 0.4 percent last month. So far in 1994, prices of
new cars and light trucks are up at 4 and 5-3/4 percent annual
rates, respectively, reflecting strong demand for motor vehicles.
However, apparel prices fell 0.5 percent in April to a level
slightly below a year ago. The moderation in apparel prices has
also been apparent at the producer level, where the PPI for apparel
has been about unchanged over the past twelve months.
Prices of nonenergy services rose 0.2 percent in April,
Owners' equivalent rent rose just 0.1 percent after increases of 0.6
and 0.4 percent in February and March. But fees for medical
services rose 0.7 percent in April, the largest increase in eleven
months. In addition, auto finance charges jumped up 2.3 percent in
April, the largest increase in this category since 1989.
The PPI for finished goods declined 0.1 percent in April. Food
and energy prices both moved down, and the index excluding food and
energy items rose 0.1 percent. Over the twelve months ended in
-4-
April, the overall PPI declined 0.4 percent while the PPI excluding
food and energy edged up 0.1 percent.
The drop in prices of finished foods in April offset an
equivalent increase in March. Over the past twelve months, food
prices have risen only 0.4 percent--well below the 3 percent
increase over the preceding twelve-month period. Energy prices were
little changed for a second month in April, as a 1 percent rise in
gasoline prices offset a sharp decline for fuel oil. Over the past
twelve months, finished energy prices have fallen 3.7 percent.
For goods excluding food and energy, the most notable price
change was a 1.6 percent jump in the price of light trucks, for
which supplies are tight. In the consumer goods category this
increase was offset by price declines for several nondurable goods,
including tobacco and apparel. However, prices of capital equipment
were up 0.4 percent in April; in addition to the increase in prices
of light trucks, higher prices were registered for tools and dies,
civilian aircraft, and construction machinery.
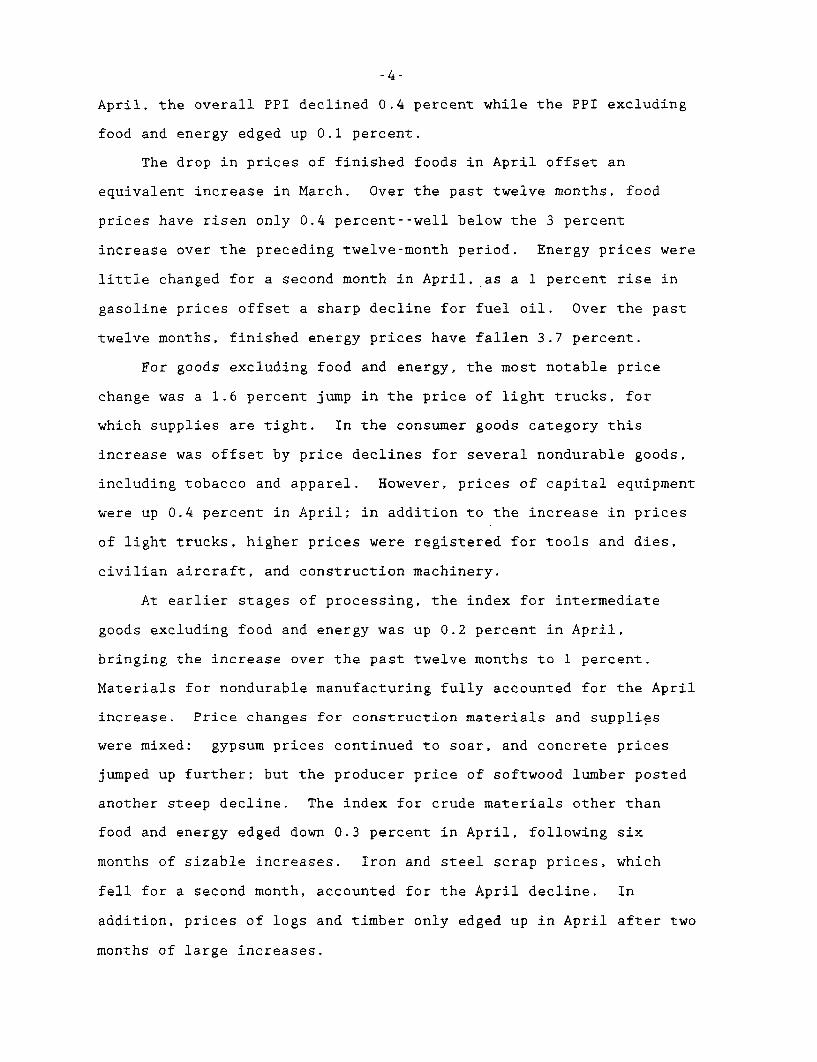
At earlier stages of processing, the index for intermediate
goods excluding food and energy was up 0.2 percent in April,
bringing the increase over the past twelve months to 1 percent.
Materials for nondurable manufacturing fully accounted for the April
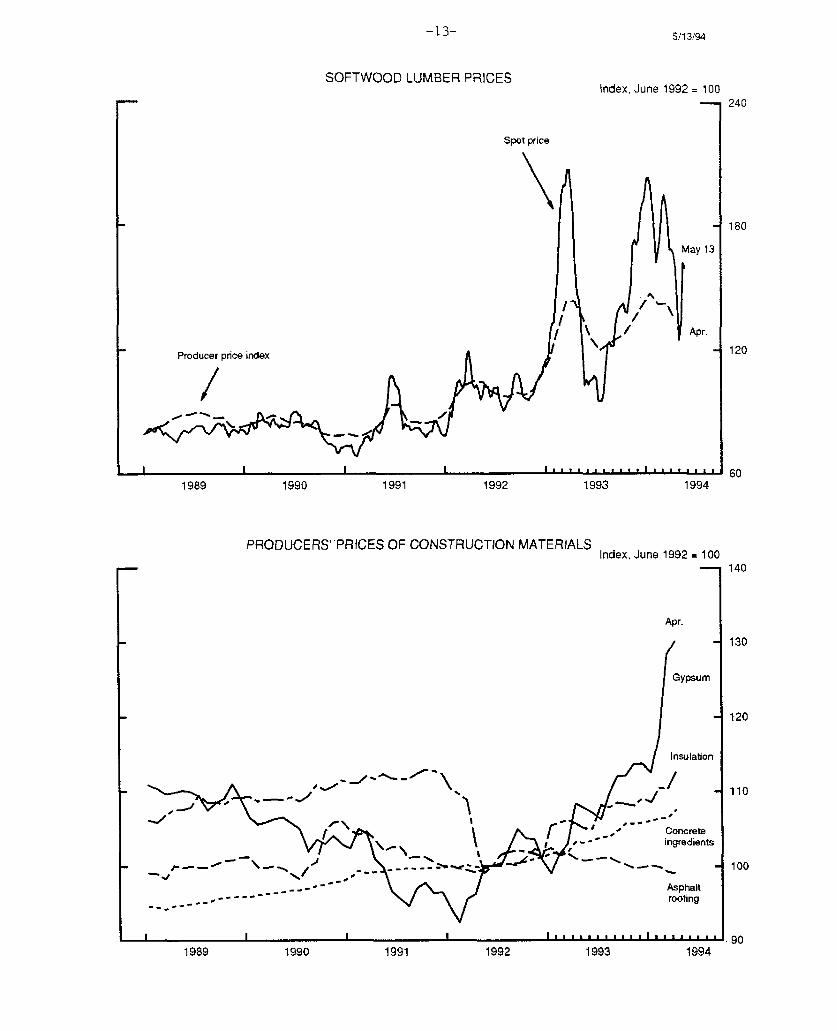
increase. Price changes for construction materials and supplies
were mixed: gypsum prices continued to soar, and concrete prices
jumped up further; but the producer price of softwood lumber posted
another steep decline. The index for crude materials other than
food and energy edged down 0.3 percent in April, following six
months of sizable increases. Iron and steel scrap prices, which
fell for a second month, accounted for the April decline. In
addition, prices of logs and timber only edged up in April after two
months of large increases.
RETAIL SALES(Percent change; seasonally adjusted)
1993 1994 1994
Q3 Q4 Q1 Feb. Mar. Apr.
Total sales 1.4 3.1 1.4 1.9 1.7 -.8Previous estimate .8 1.6 .4
Retail control1 .8 1.4 1.0 1.9 .8 -.4Previous estimato .6 1.7 .1
Total excl. automotive group .9 1.9 .6 1.6 1.3 -.5Previous estimate .1 1.3 .4
GAP2 2.3 2.0 .6 2.2 .3 -. 3Previous estimate .8 2.4 .3
Durable goods stores 3.1 5.8 2.1 1.8 3.0 -1.6Previous estimate 1.3 1.6 1.1
Bldg. material and supply 2.4 7.6 -1.9 -2.0 8.0 -2.5Automotive dealers 3.3 7.3 4.2 2.7 2.9 -1.7
Furniture and appliances 3.8 4.8 -.1 3.6 1.2 -.5
Other durable goods 1.9 -1.9 -. 8 -. 2 -. 5 -1.1
Nondurable goods stores .5 1.4 1.0 1.9 .8 -. 2Previous estimate .6 1.6 -. 0
Apparel .8 1.0 -1.5 4.7 -. 6 -1.3Food .4 1.8 .9 .7 -. 1 -. 2General arahandise 3 2.3 1.3 1.8 .7 .2 .1Gasoline stations -3.4 -. 4 3.3 2.9 2.1 1.2Other nondurables4 .6 1.8 .6 2.9 2.1 -.7
1. Total retail sales less building material and supply stores andautomotive dealers, except auto and hom supply stores.
2. General merchandise, apparel, furniture, and appliance stores.3. Excludes mail order nonstores; mail order sales are also excluded
from the GAF grouping.4. Includes sales at eating and drinking places, drug stores and
proprietary stores.
REAL PCE GOODS EXCLUDING MOTOR VEHICLES*Billions of 1987 dollars
* Quarterly Averages
1989 1990 1991The figures for Febuary. March, Apdi anM 1994:01 am staff es~ es
1992 1993 1994
May 13, 1994
UNIVERSITY OF MICHIGAN SURVEY RESEARCH CENTER: SURVEY OF CONSUMER ATTITUDES(Not seasonally adjusted)
1993 1993 1993 1993 1994 1994 1994 1994 1994Sep Oct Nov Dec Jan Feb Mar Apr May
(p)
Indexes of consumer sentiment (Feb. 1966=100)
Composite of current and expected conditions 77.9 82.7 81.2 88.2 94.3 93.2 91.5 92.6 91.5
Current conditionsExpected conditions
95.2 98.7 98.2 102.9 106.6 108.3 101.4 108.1 105.266.8 72.5 70.3 78.8 86.4 83.5 85.1 82.6 82.7
Personal financial situation
Now compared with 12 months ago*Expected in 12 months*
Expected business conditions
104 104 107 113 115 114 105 116 105114 119 121 122 123 127 125 124 116
Next 12 months*Next 5 years*
95 8376 77
126 12199 88
121 117 12196 91 95
Appraisal of buying conditions
CarsLarge household appliances*Houses
Willingness to use creditWillingness to use savings
Expected unemployment change - next 12 months
Expected inflation - next 12 monthsExpected inflation - next 5 to 10 years
134 132 139 144 148 155 147 150 144143 151 147 153 162 167 158 164 167170 170 172 174 174 176 176 170 165
133 137 131 115 104 115 112 116 118
4.8 4.0 3.6 3.8 3.5 3.7 4.4 4.5 4.44.6 4.8 4.5 4.8 4.8 4.7 5.4 5.0 4.7
* -- Indicates the question is one of the five equally-weighted components of the index of sentiment.(p) -- Preliminary(f) -- FinalNote: Figures on financial, business, and buying conditions are the percent reporting 'good times' (or
'better') minus the percent reporting 'bad times' (or 'worse'), plus 100. Asterisk (*) indicatesthe question is one of the five equally-weighted components of the index of sentiment. Expectedchange in unemployment is the fraction expecting unemployment to rise minus the fraction expectingunemployment to fall.
5/13/94
Millions of units(annual rate)
1.8 R-
CONSUMER HOMEBUYING ATTITUDES*(Seasonally adjusted) Diffusion index
Consumer homebuying attitudes (right scale)
0.8 -
Single-family starts (left scale)
1987 1988 1989 1990 1991 1992 1993The homebuying attitudes index is calculated by the Survey Research Center (University of Michigan) as the proportion of respondentsrating current conditions as good minus the proportion rating such conditions as bad.
BUILDERS' RATING OF NEW HOME SALES*Millions of units(annual rate) (Seasonally adjusted) C
1994
liffusion index
Builders'
1987 1988 1989 1990 1991 1992 1993 1994SThe index is calculated from National Association of Homebuilders data as the proportion of respondents rating current sales as good
to excellent minus the proportion rating them as poor.
MBA INDEX OF MORTGAGE LOAN APPLICATIONSMillions of units(annual rate) (Seasonally adjusted) March 16, 1990 = 100
1991 1992
I I I 1 1 I I I
1993 1994
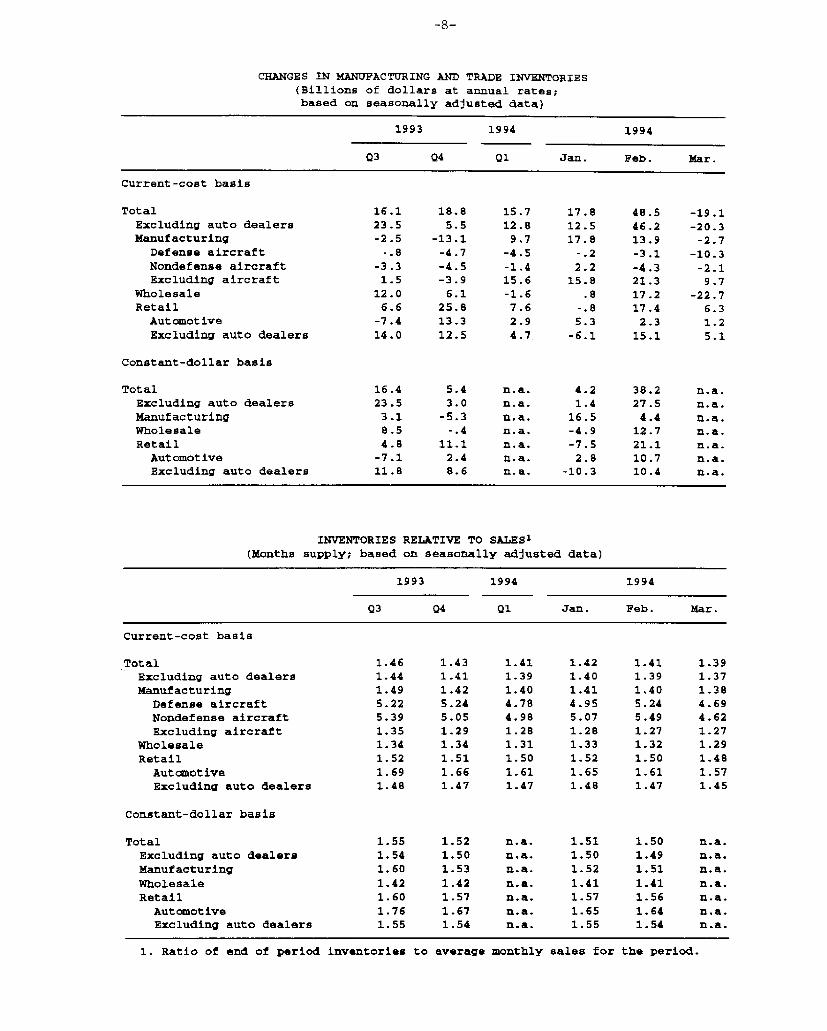
CHANGES IN MANUFACTURING AND TRADE INVENTORIES(Billions of dollars at annual rates;based on seasonally adjusted data)
1993 1994 1994
Q3 Q4 Q1 Jan. Feb. Mar.
Current-cost basis
Total 16.1 18.8 15.7 17.8 48.5 -19.1Excluding auto dealers 23.5 5.5 12.8 12.5 46.2 -20.3Manufacturing -2.5 -13.1 9.7 17.8 13.9 -2.7
Defense aircraft -.8 -4.7 -4.5 -.2 -3.1 -10.3Nondefense aircraft -3.3 -4.5 -1.4 2.2 -4.3 -2.1Excluding aircraft 1.5 -3.9 15.6 15.8 21.3 9.7
Wholesale 12.0 6.1 -1.6 .8 17.2 -22.7Retail 6.6 25.8 7.6 -.8 17.4 6.3
Automotive -7.4 13.3 2.9 5.3 2.3 1.2Excluding auto dealers 14.0 12.5 4.7 -6.1 15.1 5.1
Constant-dollar basis
Total 16.4 5.4 n.a. 4.2 38.2 n.a.Excluding auto dealers 23.5 3.0 n.a. 1.4 27.5 n.a.Manufacturing 3.1 -5.3 n.a. 16.5 4.4 n.a.Wholesale 8.5 -.4 n.a. -4.9 12.7 n.a.Retail 4.8 11.1 n.a. -7.5 21.1 n.a.Automotive -7.1 2.4 n.a. 2.8 10.7 n.a.Excluding auto dealers 11.8 8.6 n.a. -10.3 10.4 n.a.
INVENTORIES RELATIVE TO SALES1
(Months supply; based on seasonally adjusted data)
1993 1994 1994
03 04 Q1 Jan. Feb. Mar.
Current-cost basis
Total 1.46 1.43 1.41 1.42 1.41 1.39Excluding auto dealers 1.44 1.41 1.39 1.40 1.39 1.37Manufacturing 1.49 1.42 1.40 1.41 1.40 1.38
Defense aircraft 5.22 5.24 4.78 4.95 5.24 4.69Nondefense aircraft 5.39 5.05 4.98 5.07 5.49 4.62Excluding aircraft 1.35 1.29 1.28 1.28 1.27 1.27
Wholesale 1.34 1.34 1.31 1.33 1.32 1.29Retail 1.52 1.51 1.50 1.52 1.50 1.48Automotive 1.69 1.66 1.61 1.65 1.61 1.57Excluding auto dealers 1.48 1.47 1.47 1.48 1.47 1.45
Constant-dollar basis
Total 1.55 1.52 n.a. 1.51 1.50 n.a.Excluding auto dealers 1.54 1.50 n.a. 1.50 1.49 n.a.Manufacturing 1.60 1.53 n.a. 1.52 1.51 n.a.Wholesale 1.42 1.42 n.a. 1.41 1.41 n.a.Retail 1.60 1.57 n.a. 1.57 1.56 n.a.
Automotive 1.76 1.67 n.a. 1.65 1.64 n.a.Excluding auto dealers 1.55 1.54 n.a. 1.55 1.54 n.a.
1. Ratio of end of period inventories to average monthly sales for the period.
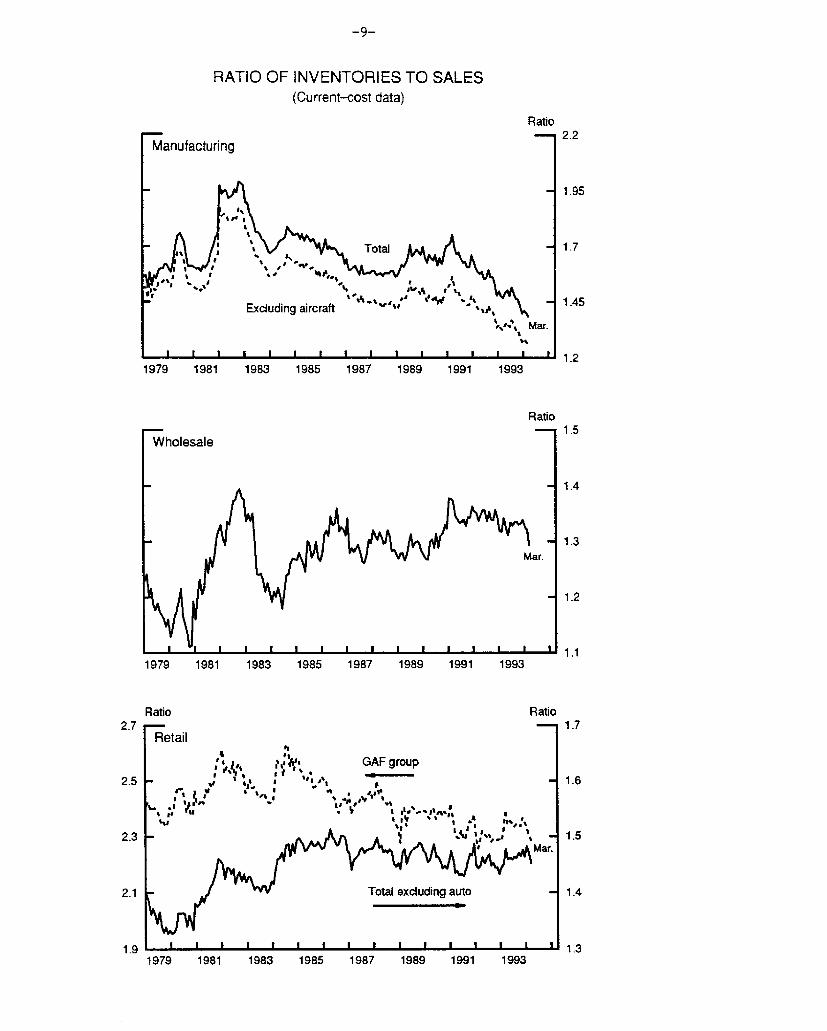
RATIO OF INVENTORIES TO SALES(Current-cost data)
Ratio2.2
Manufacturing
1.95
Total - 1.7
1.45
Excluding aircraft *3" 1,4
^,2 Mar.
S I I I I I I I I I I 1.2
1979 1981 1983 1985 1987 1989 1991 1993
RatioS1.5
Wholesale
S1.4
1.3Mar.
S1.2
I I I I I II I I. ,I - 1.11979 1981 1983 1985 1987 1989 1991 1993
Ratio Ratio2.7- 1.7
Retail
., 5' GAF group
2.5 - *', ' - 1.6
2.3 - ': ,,,J \ 1.5SMar.
2.1 - Total excludina auto - 1.4
1979 1981 1983 1985 1987 1989 1991 1993

-10-
RECENT CHANGES IN CONSUMER PRICES(Percent change; based on seasonally adjusted data)1
Relative 1993 1994 1994importance,Dec. 1993 1992 1993 Q3 Q4 Q1 Mar. Apr.
----- Annual rate------ -Monthly rate-
All items2 100.0 2.9 2.7 2.0 3.3 2.5 .3 .1Food 15.8 1.5 2.9 2.6 4.9 -1.1 .1 .1Energy 7.0 2.0 -1.4 -4.2 1.2 4.7 .4 -.4All items less food
and energy 77.2 3.3 3.2 2.1 3.4 2.9 .3 .2Commodities 24.4 2.5 1.6 .0 2.4 .6 .3 .1Services 52.8 3.7 3.9 3.5 3.7 4.2 .4 .2
Memo:CPI-W3 100.0 2.9 2.5 1.4 3.1 2.5 .3 .1
1. Changes are from final month of preceding period to final month of period indicated.2. Official index for all urban consumers.3. Index for urban wage earners and clerical workers.
RECENT CHANGES IN PRODUCER PRICES(Percent change; based on seasonally adjusted data)1
Relative 1993 1994 1994importance, ---
Dec. 1993 1992 1993 Q3 Q4 Q1 Mar. Apr.
----- Annual rate------ -Monthly rate-
Finished goods 100.0 1.6 .2 -2.5 -. 3 3.9 .2 -. 1Consumer foods 22.9 1.6 2.4 3.2 5.2 -.9 .5 -.5Consumer energy 13.3 -.3 -4.1 -7.4 -15.6 16.6 .0 -.1Other finished goods 63.7 2.0 .4 -3.5 .9 3.3 .2 .1
Consumer goods 40.3 2.1 -.4 -6.4 1.5 2.3 .1 -.1Capital equipment 23.4 1.7 1.8 2.2 .3 4.6 .3 .4
Intermediate materials2 95.2 1.1 .8 -1.0 -.3 2.8 .2 .0Excluding food and energy 82.3 1.2 1.6 1.0 1.6 1.6 .2 .2
Crude food materials 44.1 3.0 7.2 13.1 18.4 -4.8 -1.0 -1.1Crude energy 34.4 2.3 -12.3 -28.1 -22.1 18.9 9.3 -.1Other crude materials 21.5 5.7 10.7 -4.5 15.4 23.4 .9 -.3
1. Changes are from final month of preceding2. Excludes materials for food manufacturing
period to final month of period indicated.and animal feeds.
-11-
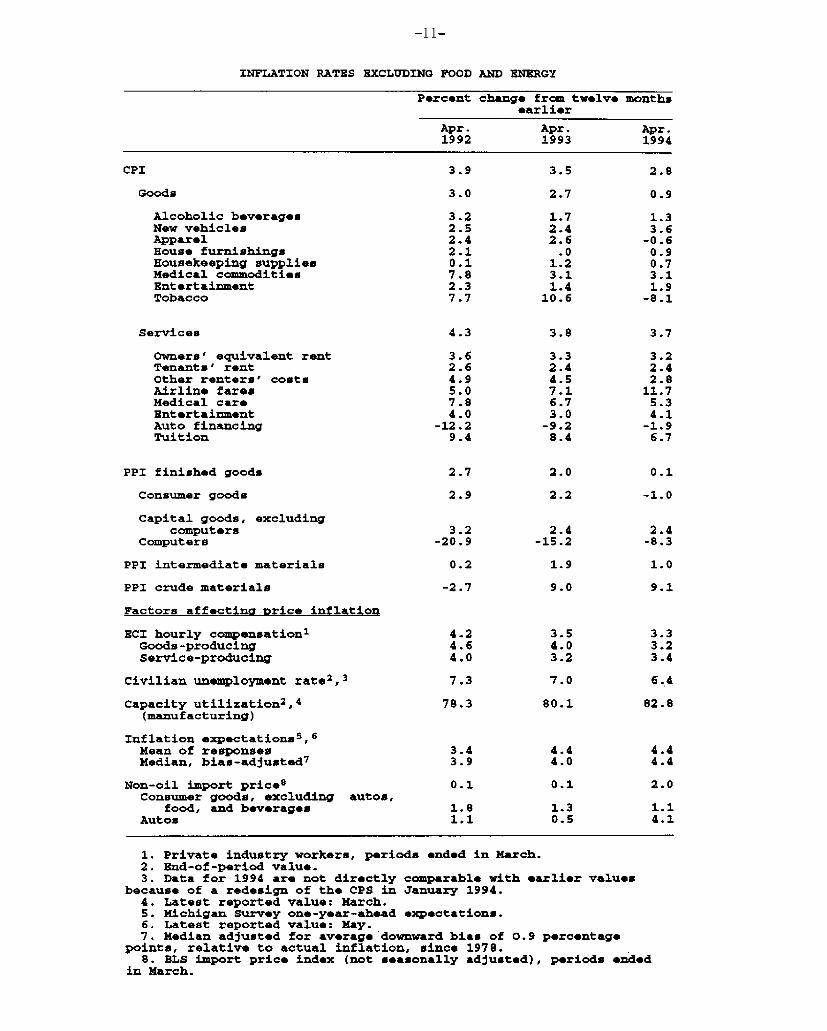
INFLATION RATES EXCLUDING FOOD AND ENERGY
Percent change from twelve monthsearlier
Apr. Apr. Apr.1992 1993 1994
CPI 3.9 3.5 2.8
Goods 3.0 2.7 0.9
Alcoholic beverages 3.2 1.7 1.3New vehicles 2.5 2.4 3.6Apparel 2.4 2.6 -0.6House furnishings 2.1 .0 0.9Housekeeping supplies 0.1 1.2 0.7Medical commodities 7.8 3.1 3.1Entertainment 2.3 1.4 1.9Tobacco 7.7 10.6 -8.1
Services 4.3 3.8 3.7
Owners' equivalent rent 3.6 3.3 3.2Tenants' rent 2.6 2.4 2.4Other renters' costs 4.9 4.5 2.8Airline fares 5.0 7.1 11.7Medical care 7.8 6.7 5.3Entertainment 4.0 3.0 4.1Auto financing -12.2 -9.2 -1.9Tuition 9.4 8.4 6.7
PPI finished goods 2.7 2.0 0.1
Consumer goods 2.9 2.2 -1.0
Capital goods, excludingcomputers 3.2 2.4 2.4
Computers -20.9 -15.2 -8.3
PPI intermediate materials 0.2 1.9 1.0
PPI crude materials -2.7 9.0 9.1
Factors affecting price inflation
ECI hourly compensation 1 4.2 3.5 3.3Goods-producing 4.6 4.0 3.2Service-producing 4.0 3.2 3.4
Civilian unemployment rate2 ,3 7.3 7.0 6.4
Capacity utilization2 ,4 78.3 80.1 82.8(manufacturing)
Inflation expectations 5 ,6
Mean of responses 3.4 4.4 4.4Median, bias-adjusted7 3.9 4.0 4.4
Non-oil import price8 0.1 0.1 2.0Consumer goods, excluding autos,
food, and beverages 1.8 1.3 1.1Autos 1.1 0.5 4.1
1. Private industry workers, periods ended in March.2. End-of-period value.3. Data for 1994 are not directly comparable with earlier values
because of a redesign of the CPS in January 1994.4. Latest reported value: March.5. Michigan Survey one-year-ahead expectations.6. Latest reported value: May.7. Median adjusted for average downward bias of 0.9 percentage
points, relative to actual inflation, since 1978.8. BLS import price index (not seasonally adjusted), periods ended
in March.
-12-
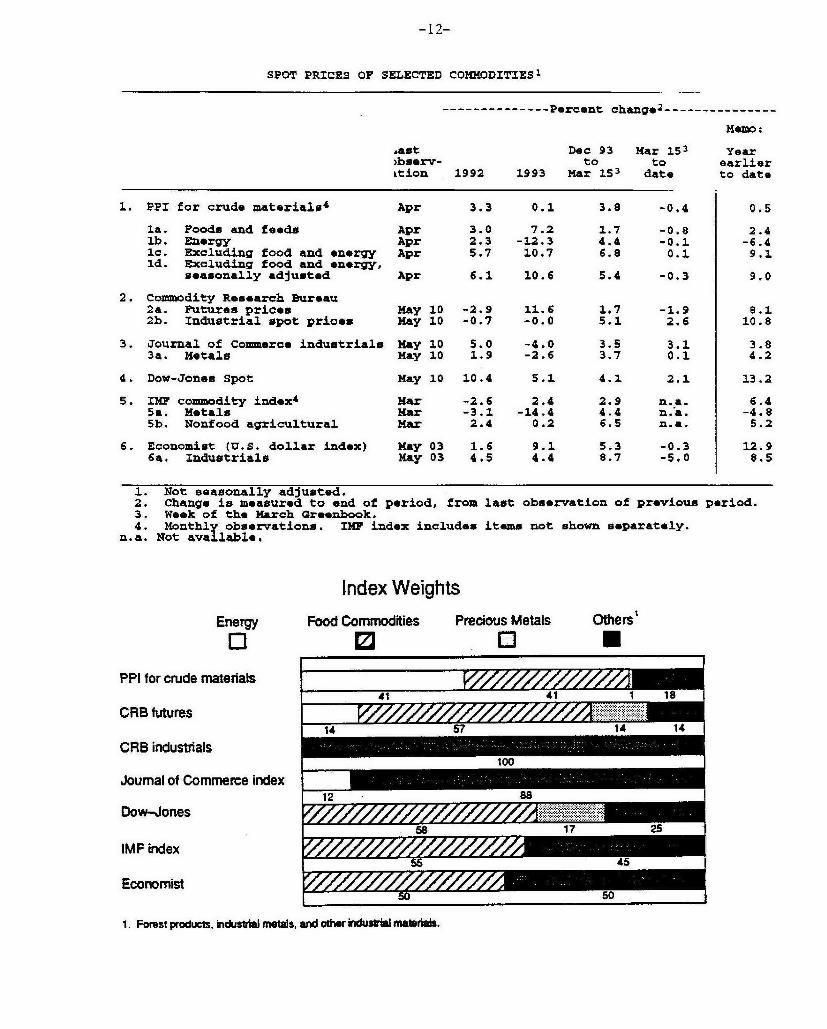
SPOT PRICES OF SELECTED COMMODITIES 1
-------------- Percent change ---------------
Memo:
jast Dec 93 Mar 153 Year>bserv- to to earlierktion 1992 1993 Mar 153 date to date
1. PPI for crude materials4 Apr 3.3 0.1 3.8 -0.4 0.5
la. Foods and feeds Apr 3.0 7.2 1.7 -0.8 2.4lb. Energy Apr 2.3 -12.3 4.4 -0.1 -6.41c. Excluding food and energy Apr 5.7 10.7 6.8 0.1 9.1Id. Excluding food and energy,
seasonally adjusted Apr 6.1 10.6 5.4 -0.3 9.0
2. Commodity Research Bureau2a. Futures prices May 10 -2.9 11.6 1.7 -1.9 8.12b. Industrial spot prices May 10 -0.7 -0.0 5.1 2.6 10.8
3, Journal of commerce industrials May 10 5.0 -4.0 3.5 3.1 3.83a. Metals May 10 1.9 -2.6 3.7 0.1 4.2
4. Dow-Jones Spot May 10 10.4 5.1 4.1 2.1 13.2
5. IMF commodity index 4 Mar -2.6 2.4 2.9 n.a. 6.45a. Metals Mar -3.1 -14.4 4.4 n.a. -4.85b. Nonfood agricultural Mar 2.4 0.2 6.5 n.a. 5.2
6. Economist (U.S. dollar index) May 03 1.6 9.1 5.3 -0.3 12.96a. Industrials May 03 4.5 4.4 8.7 -5.0 8.5
1. Not seasonally adjusted.2. Change is measured to end of period, from last observation of previous period.3. Week of the March Greenbook.4. Monthly observations. IMF index includes items not shown separately.
n.a. Not available.
Index Weights
Energy Food Commodities Precious Metals Others'
O 0 0PPI for crude materials
41 41 1 18
CRB futures14 57 14 14
CRB industrials100
Journal of Commerce index12 88
Dow-Jones58 17 25
IMF index
Economist
1. Forest products, industrial metals, and other industil materials.
55_; 4550 50
-13-
SOFTWOOD LUMBER PRICES
5/13/94
Index, June 1992= 100-- 240
Spot price
May 13
Apr.
Producer price index
rj~a
1989 1990 1993 1994
PRODUCERS' PRICES OF CONSTRUCTION MATERIALSIndex, June 1992 = 100
- -'- %
- -
Asphaltroofing
1991 1992
I I
1989 1990 1994
-14-
THE FINANCIAL ECONOMY
The May Senior Loan Officer Opinion Survey on Bank Lending Practices
The May 1994 Senior Loan Officer Opinion Survey on Bank Lending
Practices posed questions about changes in bank lending standards
and terms, changes in loan demand by businesses and households,
banks' holdings of securities, and real estate loans. Fifty-nine
domestic commercial banks and eighteen U.S. branches and agencies of
foreign banks participated in the survey.
As in the last several surveys, the results show an easing of
terms and standards on loans both to businesses and to households.
Respondents reported easing terms and standards on commercial and
industrial loans to firms of all size categories, with more banks
easing for middle-market firms than for larger and smaller firms.
As in the February survey, the responses indicated a slight easing
of standards for commercial real estate loans. Respondents reported
an increased willingness to make loans to individuals and indicated
that they had eased standards on home mortgage loans. Demand for
business credit surged. For each size category of borrower, a
larger fraction of banks reported increased demand than has so
reported since the questions were introduced at the end of 1991.
Respondents also reported that demand for business loans is now more
sensitive to changes in terms than it had been a year ago.
Household demand for credit, particularly for installment credit,
continued to grow, but demand for residential mortgages fell back a
bit.
Special questions on the survey explored the reasons for the
recent strength in banks' security holdings and weakness in banks'
real estate loans. Those respondents that had expanded their
holdings of Treasury securities stated they had done so primarily
because the recent decline in the price of those securities made
-15-
them an attractive investment. A majority of respondents who had
experienced decreased growth in their holdings of residential real
estate loans attributed the drop largely to a slowdown in
refinancing activity. However, more respondents reported increases
than decreases in holdings of commercial real estate loans.
Lending to Businesses
Commercial and industrial loans other than for mergers.
Domestic respondents reported some easing of credit standards for
firms in all size categories, with less than 10 percent easing for
large firms and small firms and around 15 percent easing for middle-
market firms. These figures are little changed from those in the
February survey. Two U.S. branches of foreign banks, or 11 percent
of the sample, eased lending standards, and none reported
tightening. With respect to loan terms, many banks reduced the
spreads of loan rates over base rates and the cost of credit lines.
About half of the domestic respondents reported reductions for large
and middle-market firms, and about a quarter indicated reductions
for small firms. Smaller fractions of respondents eased other
terms, such as loan covenants, credit line size, and
collateralization. Terms were eased the most for large firms and
the least for small firms. The fraction of foreign respondents that
eased terms was similar to that for domestic banks. Respondents
attributed their easing to various reasons, including increased
competition, a more favorable economic outlook, and a lessening of
industry-specific problems. 1
Commercial real estate loans. Domestic respondents indicated
that credit standards for commercial real estate loans eased
slightly. A couple of domestic banks reported a slight easing on
1. "Increased competition" was not offered as a reason for easingof terms and standards, but many banks wrote it in under the "Other"category. Increased competition was, in fact, the most popular andmost highly ranked response.

-16-
loans secured by commercial office buildings, and a few more
reported easing for other types of commercial real estate loans.
These results are similar to those reported in the February survey,
which represented the first sign of a backing-off in standards for
commercial real estate loans since the significant tightening in
1990-91. At U.S. branches and agencies of foreign banks, standards
for commercial real estate loans were essentially unchanged.
Demand. Demand for business loans was reported to have
strengthened considerably over the past three months. Between a
third and a half of domestic respondents experienced stronger
demand, particularly from middle-market and small firms. For each
size category of borrower, this survey's net share of respondents
reporting increased demand is the largest since the questions on
this subject were introduced on a regular basis at the end of 1991.
Respondents attributed the strength primarily to customers' greater
needs to finance inventories and investment in plant and equipment.
A few banks attributed the increase in demand to a reduction in
their customers' financing from nonbank sources. Foreign
respondents also noted increased demand. About half of both
domestic and foreign respondents stated that, for all size
categories of borrower, the demand for business loans is currently
more sensitive to changes in terms than it was a year ago.
Lending to Households
Respondents were also more willing to make consumer and
residential mortgage loans. More than a quarter of the respondents,
similar to the fractions in the February survey, indicated greater
willingness to make consumer installment and home equity loans.
Only a few banks reported having eased standards for approving
mortgage applications for purchasing houses during the past three
months.
-17-
Demand for household credit was said to have increased on net
from February to May. More than a third of the respondent banks
experienced an increase in demand for consumer installment loans, a
slightly higher proportion than reported in the February survey.
The respondents reporting declines in residential mortgage demand
exceeded those indicating increases, with several banks experiencing
substantial declines. However, demand for home equity lines of
credit picked up: On net, just under 10 percent of banks saw higher
demand. Demand for home equity loans had been weak in the last
couple of surveys, likely because of paydowns of these loans with
the proceeds from mortgage refinancings.
Securities
Nationwide, banks' holdings of U.S. Treasury and agency
securities grew rapidly in March and April. About 25 percent of the
survey respondents had stronger growth in their holdings of
securities over that period. About a third of these banks
experienced a pickup in growth only in agency securities. Those
banks that accelerated their purchases of Treasury securities did so
largely because the recent decline in the price of Treasuries has
made them more attractive investments.
Banks were also asked what actions they had taken in response
to FAS 115, which substantially increased the share of securities
that must be marked to market. The most common action was to
decrease the maturity of their security portfolios, although many
banks increased hedging activities and reduced security holdings.
Real Estate Loans
For the United States as a whole, the growth in commercial
banks' holdings of real estate loans slowed markedly in the first
quarter of this year. A majority of the domestic respondents
experienced a similar slowdown in residential real estate loan
-18-
growth. Of those banks that saw reduced growth, the most popular
explanation was a deceleration in refinancing activity, followed at
some distance by loss of business to competitors and a slowdown in
originations. The most common destination of lost mortgage business
appears to have been mortgage companies.
Despite the overall decline in real estate loans, respondents
characterized the growth at their bank of commercial real estate
loans as somewhat increased, on net, relative to growth in the
preceding three months. This finding is consistent with the greater
willingness to lend indicated in this and the February survey as
well as the pickup in the commercial real estate market reported in
the press.
-19-
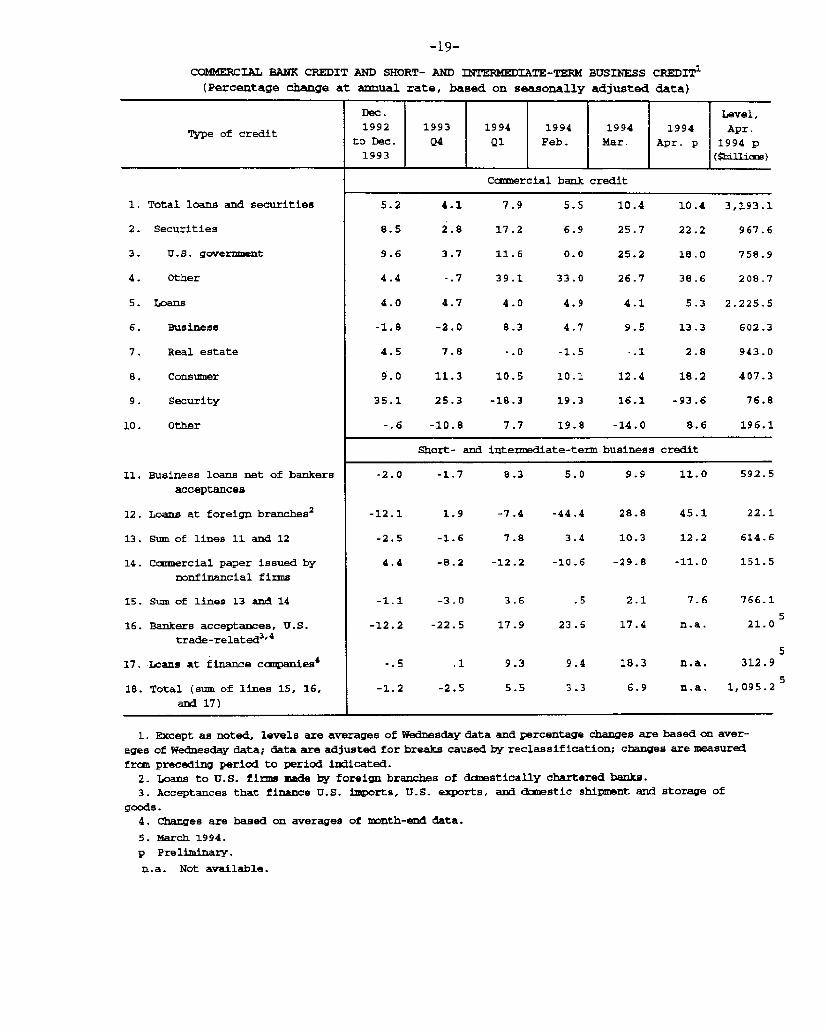
COMMERCIAL BANK CREDIT AND SHORT- AND INTERMEDIATE-TERM BUSINESS CREDIT(Percentage change at annual rate, based on seasonally adjusted data)
Dec. Level,
Type of credit 1992 1993 1994 1994 1994 1994 Apr.to Dec. Q4 Q1 Feb. Mar. Apr. p 1994 p
1993 (billions)
Commercial bank credit
1. Total loans and securities
2. Securities
3. U.S. government
4. Other
5. Loans
6. Business
7. Real estate
8. Consumer
9. Security
10. Other
11. Business loans net of bankers
acceptances
12. Loans at foreign branches2
13. Sum of lines 11 and 12
14. Commercial paper issued by
nonfinancial firms
15. Sum of lines 13 and 14
16. Bankers acceptances, U.S.
trade-related3 , 4
17. Loans at finance companies4
18. Total (sum of lines 15, 16,and 17)
5.2
8.5
9.6
4.4
4.0
-1.8
4.5
2.8 17.2
3.7 11.6
5.5 10.4 10.4 3,193.1
6.9 25.7 22.2 967.6
0.0 25.2 18.0 758.9
-. 7 39.1 33.0 26.7 38.6 208.7
4.7 4.0 4.9 4.1 5.3 2,225.5
-2.0
7.8 -. 0 -1.5
9.5 13.3 602.3
-. 1 2.8 943.0
9.0 11.3 10.5 10.1 12.4 18.2 407.3
35.1 25.3 -18.3 19.3 16.1 -93.6 76.8
-.6 -10.8 7.7 19.8 -14.0 8.6 196.1
Short- and intermediate-term business credit
-2.0 -1.7 8.3 5.0 9.9 11.0 592.5
-12.1 1.9 -7.4 -44.4 28.8 45.1
-2.5 -1.6
22.1
3.4 10.3 12.2 614.6
4.4 -B.2 -12.2 -10.6 -29.8 -11.0 151.5
-1.1 -3.0 3.6 .5 2.1 7.6 766.1
-12.2 -22.5 17.9 23.6 17.4 n.a.
.1 9.3-. 5
-1.2 -2.5
521.0
9.4 18.3 n.a. 312.9
3.3 6.9 n.a. 1,095.2 5
1. Except as noted, levels are averages of Wednesday data and percentage changes are based on aver-
ages of Wednesday data; data are adjusted for breaks caused by reclassification; changes are measured
from preceding period to period indicated.
2. Loans to U.S. firms made by foreign branches of dcmestically chartered banks.
3. Acceptances that finance U.S. imports, U.S. exports, and dcaestic shipment and storage of
goods.4. Changes are based on averages of month-end data.
5. March 1994.p Preliminary.
n.a. Not available.

-20-
SELECTED FINANCIAL MARKET QUOTATIONS(Percent except as noted)
Instrument
SHORT-TERM RATES2
Federal funds3
Treasury bills3-month6-month1-year
Commercial paper1 month3-month
Large negotiable CDs1-month3-month6-month
4Eurodollar deposits
1-month3-month
Bank prime rate
1993 1994
Mid-Oct FOMC.'ilows Feb 3 Mar 22 May 12
.1 - 1-Z 1
3.07
3.013.093.23
3.133.23
3.083.223.23
3.063.25
6.00
3.07 3.22 3.73
3.13 3.52 4.133.27 3.87 4.713.52 4.19 5.18
3.16 3.64 4.373.25 3.87 4.72
3.11 3.54 4.323.25 3.80 4.673.41 4.07 5.10
3.06 3.50 4.313.25 3.81 4.75
6.00 6.00 6.75
Change to May i2 1994
From Mid-Oct! Fromlows Feb 3
0.66
1.121 621 95
1 .24
1.49
1.24
1.451.87
1.251.50
0.75
0.66
1i.001.441.66
1.211.47
1.211.421.69
MFro FMMar 2:
0.51
0.610.840.99
0.730.85
0-780.871 .03
1.25 0.811.50 0.94
0.75
INTERMEDIATE- AND LONG-TERM RATES
U.S. Treasury (constant maturity)3-year
10-year30-year
5Municipal revenue
(Bond Buyer)
Corporate--A utility.recently offered
6Home mortgages
FHLMC 30-yr fixed rateFHLMC 1-yr adjustable rate
4.065.195.78
5.41
6.79
6.744.14
4.60 5.49 6.535.81 6.55 7.366.31 6.94 7.57
5.49 6.06 6.60
7.35 7.76 8.46
6.974.12
1989Record high
Stock exchange index Low.Level Date Jan. 3
7.76 8.534.60 5.25
1994
2.472.171.79
1.19
1.67
1 79
1.11
1 .040.810.63
0.54
.11 0 70
1.56 0.77
1.13 0.65
Percentage change to May 12
FromFOMC.' recordMar 22 May 12 high
From1989 From FOMC.low Mar 22
Dow-Jones IndustrialNYSE CompositeNASDAQ (OTC)Wilshire
3978.36 1/31/94267.71 2/2/94803.93 3/18/944804.31 2/2/94
One-day quotes except as noted.2. Average for two-week reserve maintenance
period closest to date shown. Last observationis average for maintenance period endingMay 11 1994.3. Secondary market.
Rates are as of the close-on March 21. 1994.
4. Bid rates for Eurodollardeposits at 11 a.m. London time.5. Most recent observation based on
one-day Thursday quote and futuresmarket index changes.6. Quotes for week ending Friday
previous to date shown.
0.75
2144.64154.00378.56
2718.59
3864.85259.91797.30
4705.03
3652.84245.55719.61
4408.29
-8.18-8.28
*10.49-8.24
70.3259.4590.0962.15
-5.49-5.52-9.74-6.31
111111~ r