fomc 19821005 blue book 19821001
TRANSCRIPT

Prefatory Note
The attached document represents the most complete and accurate version available based on original copies culled from the files of the FOMC Secretariat at the Board of Governors of the Federal Reserve System. This electronic document was created through a comprehensive digitization process which included identifying the best-preserved paper copies, scanning those copies,1 and then making the scanned versions text-searchable.2 Though a stringent quality assurance process was employed, some imperfections may remain.
Please note that this document may contain occasional gaps in the text. These gaps are the result of a redaction process that removed information obtained on a confidential basis. All redacted passages are exempt from disclosure under applicable provisions of the Freedom of Information Act.
1 In some cases, original copies needed to be photocopied before being scanned into electronic format. All scanned images were deskewed (to remove the effects of printer- and scanner-introduced tilting) and lightly cleaned (to remove dark spots caused by staple holes, hole punches, and other blemishes caused after initial printing). 2 A two-step process was used. An advanced optimal character recognition computer program (OCR) first created electronic text from the document image. Where the OCR results were inconclusive, staff checked and corrected the text as necessary. Please note that the numbers and text in charts and tables were not reliably recognized by the OCR process and were not checked or corrected by staff.

October 1, 1982Strictly Confidential (FR) Class I FOMC
MONETARY POLICY ALTERNATIVES
Prepared for the Federal Open Market Committee
By the staff Board of Governors of the Federal Reserve System

STRICTLY CONFIDENTIAL (FR) October 1, 1982CLASS I - FOMC
MONETARY POLICY ALTERNATIVES
Recent developments
(1) M1 increased at about an 8 percent annual rate from June
to September, and M2 by about 9-3/4 percent. The Committee's targets for
the period were 5 and 9 percent, respectively, but somewhat more growth
was considered to be acceptable depending on whether economic and financial
uncertainties seemed to be increasing liquidity demands and affecting
financial asset preferences.
(2) Expansion of M1 was strong in August and September, when
NOW accounts grew quite rapidly, in part reflecting the early impact of the
tax cut as well as precautionary behavior as the economy remained unexpectedly
sluggish. The reduced level of short-term market rates has considerably de-
creased the earnings disadvantage to keeping funds in NOW accounts. Demand
deposits also grew rather rapidly in September, perhaps partly in response
to increased securities markets activity and possibly to some increase in
compensating balances as the earnings value to banks of corporate deposits
declined.
(3) Following a very rapid expansion in August, M2 increased at
only a 5-1/4 percent annual rate in September, as growth in the nontrans-
action component decelerated unusually rapidly. Money market fund growth
slowed as their yields declined in lagged reaction to earlier reductions
in market rates. Growth in the total of small time and savings deposits
also slowed sharply. Thus, it would appear that some funds may have been
shifted out of M2 into market securities.
(4) Bank credit grew at a 6-1/2 percent annual rate in August,
and partial data for September indicate that growth has slowed somewhat

KEY MONETARY POLICY AGGREGATES
(Seasonally adjusted, annual rates of growth)
1982June 1981:Q4 toto 1982: 1982:
July Aug. Sept.2P/Sept.P-e Q3 P2/ Sept.£g/
Money and Credit Aggregates-0.3 10.4 14.0
9.7 14.2 5.2
8.1
9.8
5.8
(Nontransaction component)
Bank credit
12.9 15.4 2.6 10.3
12.6 18.4 3.5 11.6
6.4 6.4 3.5
11.2 10.8
10.7 10.63/ 3/
7.5 7.3
Reserve Measures
Nonborrowed reserves
Total reserves
Monetary base
13.1 15.9 11.1 13.5
-1.6 8.8 23.2 10.2
2.8 6.8 12.2
Memo: (Millions of dollars)
Adjustment borrowing
Excess reserves
641 422 816
314 312 369
pe - Partially estimated.
1/ Growth rates of reserve measures are adjusted to remove the effects of
discontinuities resulting from phased changes in reserve ratios under theMonetary Control Act.
2/ Nonborrowed reserves include special borrowing and other extended credit
from the Federal Reserve.3/ Measured from December-January average base.
5.1
5.8
7.6

-3-
further. This may reflect reduced demands for short-term credit as well
as, possibly, a degree of cautious behavior on the part of at least some
large banks in view of current economic and financial difficulties. Out-
standing large time deposits of banks contracted in September, on average,
the first such decline in almost a year. Business loan growth slowed
sharply in August, but appears to have picked up in the early weeks of
September, reflecting takedowns of loans related to recent merger activity.
Other forms of short-term borrowing by nonfinancial business have also been
weak; the volume of commercial paper outstanding edged down in August and
dropped further in September. In part the weakness in short-term borrowing
reflected a pick-up in bond market financing by nonfinancial businesses.
(5) Total reserves expanded at about a 9 percent annual rate in
August but growth accelerated to about a 23 percent annual rate in September
when expansion in M1 rose considerably above the 5 percent June-September
path. A little less than half of the growth in total reserves last month
was supplied by nonborrowed reserves. The increase in adjustment borrowing
in September stemmed partly from temporary borrowing related to special bank
funding problems (which was offset by reduced nonborrowed reserves) and
partly from the strength in M1 (though the implied rise in borrowing was
limited so as to be accommodative to some of the apparent increase in
liquidity demands).1/
(6) The federal funds rate has moved into a trading range generally
somewhat above the 10 percent discount rate, up from the 9 percent area that
had emerged in the market around the time of the August FOMC meeting when
expectations of continued declines in short-term rates were strong. The
1/ See Appendix I for intermeeting reserve path adjustments.

discount rate was lowered by 1/2 point to 10 percent shortly after the
meeting, but market expectations of further easing in money market condi-
tions dissipated with continued strength of the money supply. The short-
term rate structure generally came under upward pressure, but this was
reflected entirely in yields on private instruments, as market demand for
Treasury securities was intensified by heightened concerns about credit
quality. Long-term market interest rates have continued to trend down
since late August, with Treasury, corporate, and municipal rates dropping
1/4 to 3/4 of a percentage point. In the mortgage markets, the rate on
conventional fixed rate commitments has dropped about 1 percentage point
in typical lagged response to the decline in bond rates.
(7) The dollar has risen by about 3-1/2 percent on a weighted
average basis since the last Committee meeting, reaching a 13-year high.
Although the U.S. private short-term interest rates have backed up since
late August, while foreign interest rates have continued to edge down,
such a change in interest differentials may have been a less important
factor in the increased demand for dollar assets than worldwide political
and financial strains.

Alternative near-term targets
(8) The table below presents three alternative targets for M1
and M2 for the fourth quarter of 1982 and associated intermeeting ranges
for the federal funds rate. More detailed data for the alternatives are
shown in the table and charts on the next few pages. The quarterly
interest rate path underlying the staff's GNP projection is contained
in Appendix II.
Alt. A Alt. B Alt. C
Growth from Septemberto December
M1 5 2½ 0M2 9½ 8½ 7½
Federal funds raterange 7 to 11 8 to 12 9 to 13
(9) All of the alternatives imply a slowing of M1 and M2 growth
over the last three months of the year from their summer pace; however,
they generally also imply some overshoot of the FOMC's annual targets.
Alternative C would achieve the upper limit of the Committee's 2-1/2 to
5-1/2 percent longer-run M1 range for 1982, while the growth rates of
alternatives B and A would lead to overshoots in the 1/2 to 1 percentage
point range. Under all alternatives, M2 would remain above the upper end
of its 6 to 9 percent longer-run range.
(10) Alternative B, which calls for M1 growth from September to
December at a 2-1/2 percent annual rate, appears consistent with the federal
funds rate over the intermeeting period continuing on average to be a
little above the current discount rate, and with little net change in other
short-term rates. Total reserves under this alternative would expand at a
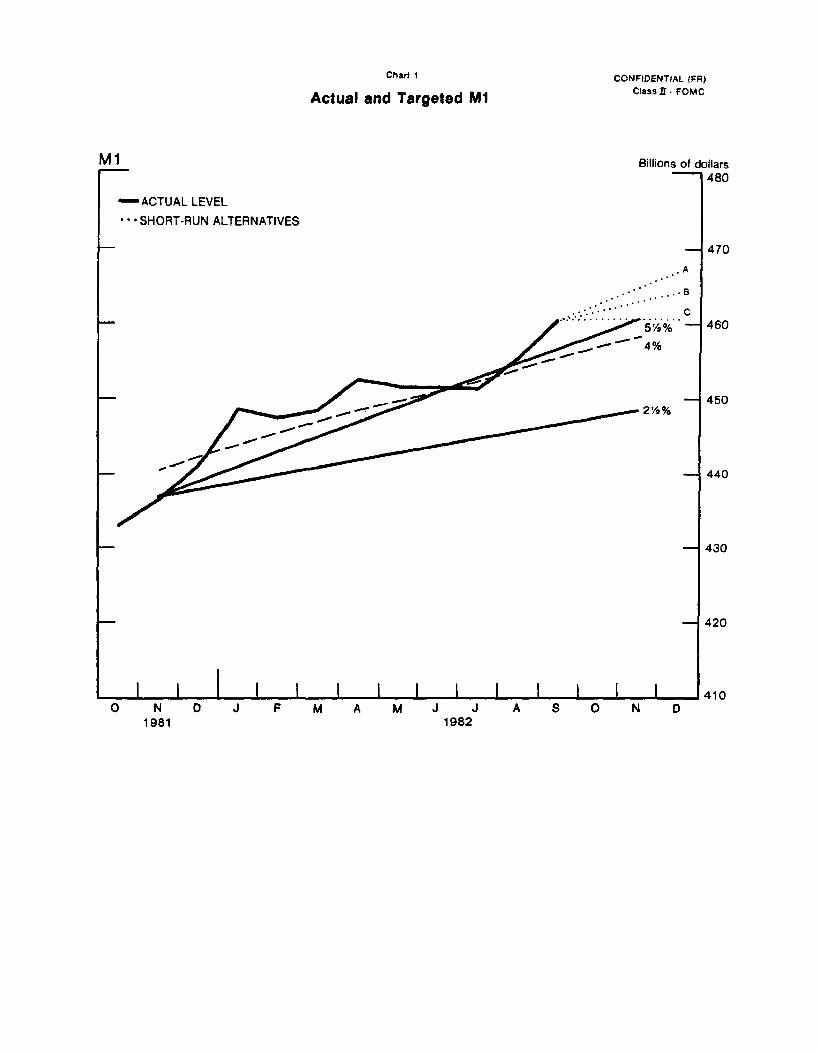
Chart 1
Actual and Targeted M1
CONFIDENTIAL (FRClass II FOMC
wVII Billions of dollars480
-ACTUAEVEL LEVEL* * * SHORT-RUN ALTERNATIVES
.A
. ' .* " , • c
2 /2%
470
460
-- 450
-- 440
-- 430
-- 420
I I i I 1 I I IO N D J F M A M J J A S 0 N D
I I I I I I 410
19821981

Chart 2
Actual and Targeted M2 and M3
CONFIDENTIAL (FR)Class II FOMC
M2
- ACTUAL LEVEL
* * SHORT-RUN ALTERNATIVES
2000
-41950
-- 1900
- 1850
-- 1800
I I I I I I I I I I IO N D J F M A M J J A S O N D
1981 1982
M3
- ACTUAL LEVEL* * SHORT-RUN ALTERNATIVES
- ff
11750
Billions of dollars
2400
-- 2350
6'/2%-- 2300
-- 2250
- 2200
-- 2150
I I I I I I I I I I I I 2100O N D J F M A M J J A S O N D
1981 1982
I I I
O...
I

Alternative Levels and Growth Rates for Key Monetary Aggregates
Alt. A Alt. B Alt. C Alt. A Alt. B Alt. C Alt. A Alt. B Alt. C
1982--JulyAugustSeptemberOctoberNovemberDecember
Growth RatesMonthly
1982--JulyAugustSeptemberOctoberNovemberDecember
Sept. - Dec.
Growth RatesQuarterly Average
1982--Q1Q2Q3Q4
Memo
Growth Rato1981Q4 - 1982Q4
451.3455.2460.5463.0464.6466.4
-0.310.414.0
6.54.14.6
5.1
10.43.33.57.9
451.3455.2460.5462.2462.8463.4
-0.310.414.04.41.61.6
2.5
10.43.33.56.2
451.3455.2460.5461.3461.1460.5
-0.310.414.0
2.1-0.5-1.6
0.0
10.43.33.54.6
1923.41946.21954.71964.41981.42000.5
9.714.2
5.26.0
10.411.6
9.4
9.89.59.78.4
1923.41946.21954.71963.11978.61995.7
9.714.2
5.25.29.5
10.3
8.4
9.89.59.77.8
1923.41946.21954.71961.81975.81991.0
9.714.2
5.24.48.89.2
7.4
9.89.59.77.2
2320.22355.72362.52372.92395.32412.4
12.618.4
3.55.3
11.38.6
8.4
8.710.712.0
8.1
2320.22355.72362.52371.62392.52407.6
2320.22355.72362.52370.32389.72402.9
12.618.4
3.54.6
10.67.6
7.6
12.618.4
3.54.09.86.6
6.8
8.710.712.0
7.6
8.710.712.07.1
5.5 9.7 9.5 9.36.4 6.0 10.2 10.1 10.0
5 percent annual rate over the fourth quarter. Borrowing from the Federal
Reserve would be around $450 million, and nonborrowed reserves would expand
at about a 9 percent annual rate.
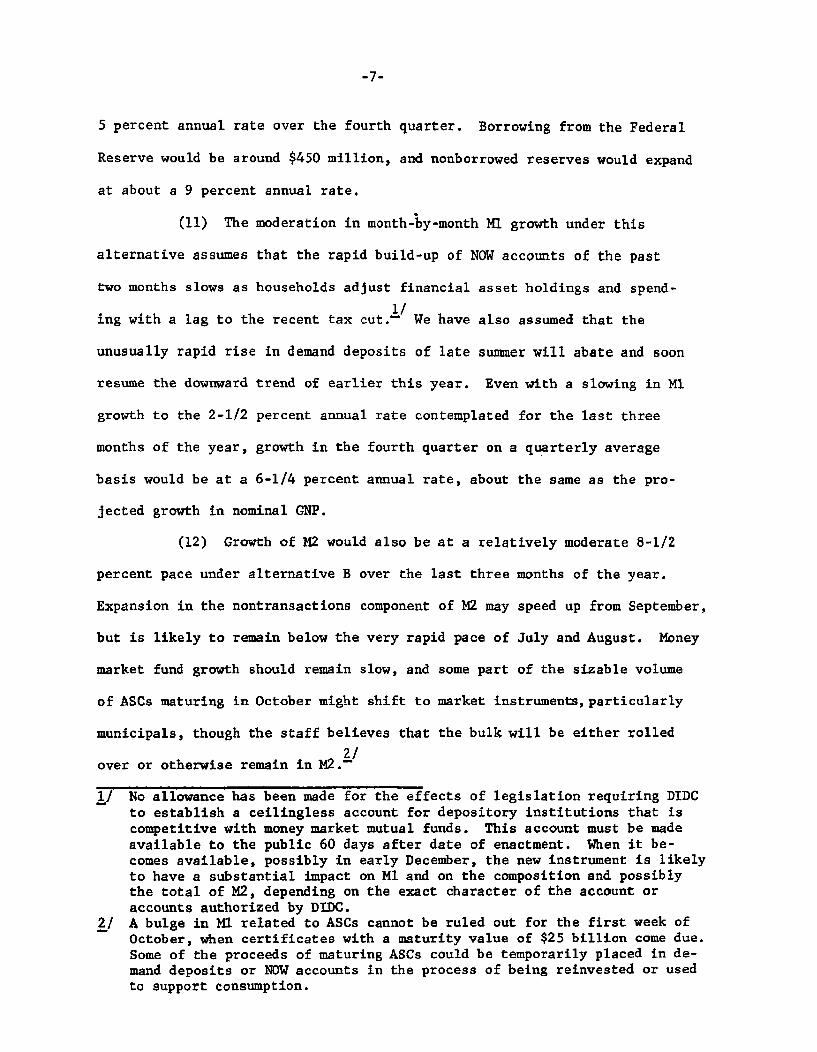
(11) The moderation in month-by-month M1 growth under this
alternative assumes that the rapid build-up of NOW accounts of the past
two months slows as households adjust financial asset holdings and spend-
1/ing with a lag to the recent tax cut.1/ We have also assumed that the
unusually rapid rise in demand deposits of late summer will abate and soon
resume the downward trend of earlier this year. Even with a slowing in M1
growth to the 2-1/2 percent annual rate contemplated for the last three
months of the year, growth in the fourth quarter on a quarterly average
basis would be at a 6-1/4 percent annual rate, about the same as the pro-
jected growth in nominal GNP.
(12) Growth of M2 would also be at a relatively moderate 8-1/2
percent pace under alternative B over the last three months of the year.
Expansion in the nontransactions component of M2 may speed up from September,
but is likely to remain below the very rapid pace of July and August. Money
market fund growth should remain slow, and some part of the sizable volume
of ASCs maturing in October might shift to market instruments, particularly
municipals, though the staff believes that the bulk will be either rolled
2/over or otherwise remain in M2.
1/ No allowance has been made for the effects of legislation requiring DIDCto establish a ceilingless account for depository institutions that iscompetitive with money market mutual funds. This account must be madeavailable to the public 60 days after date of enactment. When it be-comes available, possibly in early December, the new instrument is likelyto have a substantial impact on M1 and on the composition and possiblythe total of M2, depending on the exact character of the account oraccounts authorized by DIDC.
2/ A bulge in M1 related to ASCs cannot be ruled out for the first week ofOctober, when certificates with a maturity value of $25 billion come due.Some of the proceeds of maturing ASCs could be temporarily placed in de-mand deposits or NOW accounts in the process of being reinvested or usedto support consumption.

-8-
(13) Bond rates are likely to remain near current levels under
alternative B, and could even decline a bit further if investors continue
to see little, if any, sign of an economic recovery. Despite the further
reduction in deposit costs at S&Ls and MSBs--as higher-cost deposits are
rolled over--thrift hesitancy to commit funds and a leveling off of bond
rates is likely to keep mortgage rates from falling much below 15 percent.
(14) The growth of credit extended to all domestic nonfinancial
borrowers, including the Treasury, is expected to slow in the fourth quarter
from the third-quarter pace. However, this slowing does not reflect a
lessening of credit market pressures. The federal deficit in the current
quarter is expected to be slightly larger (seasonally adjusted) than in the
third. In the third quarter, the Treasury had borrowed heavily but also
had made some of these funds available to the market by adding substantially
to its assets in the form of cash balances. The fourth-quarter deficit
will be financed in part by liquidation of these assets as well as by further
borrowing. Flows of credit to private domestic nonfinancial sectors in
the fourth quarter are projected to remain close to the pace of the third
quarter, with the indebtedness of these sectors increasing at a 6-1/2
percent annual rate, about in line with projected GNP growth. Aggregate
business borrowing should moderate as external financing needs decline
with weakness in investment expenditures, but household credit usage is
likely to rise a little as housing and consumer durable purchases increase
somewhat in lagged response to the July tax cut and recent declines in
interest rates. For the third and fourth quarters together, credit raised
by all domestic nonfinancial sectors is projected to expand at a 9-1/2
percent annual rate, up from 8-1/2 percent in the first half of the year,
with increased borrowing by the Treasury more than accounting for the pickup
in the total.

(15) Alternative C calls for virtually no further growth in M1
from September to December, which would achieve the upper limit of the
FOMC's annual target for that aggregate. Total reserves would be expected
to expand at a 2 percent rate over the fourth quarter. Such reserve and
money growth would probably involve a federal funds rate moving rather
promptly into the 11 to 11-1/2 percent area. Assuming no change in the
discount rate, borrowing would likely be around $1 billion and nonborrowed
reserves would show little net change.
(16) The firming of the federal funds rate contemplated by this
alternative would probably cause quite a sharp reaction in short-term mar-
kets, particularly given present market concerns about the condition of
financial institutions and businesses. Private short-term rates may rise
substantially, accompanied by a smaller rise in Treasury bill rates. Bond
yields also would probably also come under considerable upward pressure
for a short while. However, such pressures would be likely to dissipate
over time as a tightening in money markets would tend to reduce expectations
of a business recovery next year and of inflation. A considerable further
strengthening of the dollar on exchange markets might develop, particularly
if money market rates abroad continue to ease.
(17) Alternative A, which targets M1 growth at a 5 percent and
M2 at a 9-1/2 percent annual rate from September to December, would probably
accommodate an easing in money market conditions over the months ahead.
The funds rate might fall to around 9 to 9-1/2 percent, with total reserves
rising at an 8 percent annual rate during the final three months of the
year. At the current discount rate, adjustment (plus seasonal) borrowing

-10-
would fall to frictional levels of $150 million or less, and nonborrowed
reserves would expand at a 15 percent annual rate. The market would come
to expect a further drop in the discount rate.
(18) In such an environment, substantial reductions in short-
term interest rates are likely, with the 3-month bill rate falling to
around 6-1/2 to 7 percent. The easing of money market conditions may
also improve investor attitudes toward private market instruments, parti-
cularly bank CDs, as the over-all economic and financial outlook is viewed
more favorably. Spreads between large CDs and bill rates will probably
narrow, but still remain historically high. With bank costs of funds and
other short-rates declining, there would be strong downward pressure on
the bank prime rate, with that rate perhaps declining to 12 percent or
somewhat lower. Reductions in bond rates could be appreciable if the
further decrease in returns on short-term investments brings more investors
into the long-term market in an effort to lock in relatively high yields.

-11-
Directive language
(19) Given below is a suggested operational paragraph for
the directive. The specifications adopted at the meeting on August 24 are
shown in strike-through form. The language in brackets, which indicates
that a shortfall in growth would be acceptable in the context of declining
interest rates, is suggested for consideration if the Committee were to
opt for alternative A, the most expansive alternative, although it may also
be useful for alternative B. This language would convey the Committee's
desire to have growth of money for the year closer to the longer-run
target should that turn out to be feasible.
In the short run, the Committee [DEL: continues to seek] SEEKS
behavior of reserve aggregates consistent with growth of M1 and M2
from [DEL: June to] September TO DECEMBER at annual rates of about [DEL: 5] ____
percent and about 9 ___ percent respectively. [DEL: Somewhat-more-rapid
growth would be acceptable depending on evidence that economic and
financial uncertainties are leading to exceptional liquidity
demands and changes in financial asset holdings.] [A SHORTFALL IN
GROWTH OF THE MONETARY AGGREGATES FROM THESE RATES WOULD BE
ACCEPTABLE IN THE CONTEXT OF DECLINING INTEREST RATES.] The Chairman
may call for Committee consultation if it appears to the Manager for
Domestic Operations that pursuit of the monetary objectives and
related reserve paths during the period before the next meeting is
likely to be associated with a federal funds rate persistently out-
side a range of [DEL: 7] ____ to [DEL: 11] ____ percent.

Appendix I
RESERVES TARGETS AND RELATED MEASURESINTERMEETING PERIOD
(Millions of dollars; not seasonally adjusted)
Reserves Targets
for Intermeeting
Sub-Period Projection of
(average for sub- Reserves Demanded Implied
period) (average for sub-period) Adjustment BorrowingFor Remaining
Non- Average Statement WeeksDate Reserves Total borrowed Total Required Excess for of Intermeeting
Path Constructed Reserves Reserves Reserves Reserves Reserves Sub-Period Period1/
_1) (2) (3) (4) (5) (6) (7)
3-Week Sub-Period: September 1 to September 15
August 27 39,510 39,160 39,510 39,210 300 350 350September 3 39,5732/ 39,2231/ 39,609 39,213 396 386 384
10 39,6632/ 39,0301/±/ 39,767 39,332 435 737 993
Actual 3-week
Average 39,793 38,982 39,793 39,330 463 811 --
3-Week Sub-Period: September 22 to October 6
September 17 39,933/ 39,583.5/ 40,227 39,927 300 644 644
24 39,7841/ 39,6826/7/ 40,278 40,010 268 597 550
October 1 39,784 39,7438/ 40,348 40,004 344 605 500
1/ Represents borrowing in remaining statement weeks (as intermeeting sub-period progresses) implied
by each weekly updating of the sub-period average nonborrowed reserves path. The movement in implied
borrowing represents deviations in total reserves from target as well as any compensation for misses in
nonborrowed reserves from target in earlier weeks of the intereeting sub-period.2/ Total and nonborrowed reserves paths adjusted upward by $63 million due to changes affecting thereserves multiplier.3/ Total and nonborrowed reserves paths adjusted upward by $90 million due to changes affecting thereserves multiplier (includes small revisions to required reserves and the reserves multiplier received
as the week progressed).4/ Nonborrowed reserves path adjusted downward by $283 million to take account of the increased demand
Tor borrowings in the September 8 and September 15 statement weeks.
5/ Total and nonborrowed reserves paths adjusted downward by $257 million due to changes affecting the
Ml reserves multiplier. Preliminary upward adjustments of $159 million, on net, had been taken earlier.
6/ Total and nonborrowed reserves paths adjusted downward by $149 million due to changes affecting the
~I reserves multiplier (includes small revisions to required reserves and the reserves multiplierreceived as the week progressed).7/ Nonborrowed reserves path adjusted upward by $248 million to accomodate the acceptably more rapidgrowth in money.8/ Nonborrowed reserves path adjusted upward by $61 million to keep reserves pressures about unchanged
in transition week just before the FOMC meeting.

APPENDIX II
INTEREST RATES UNDERLYING GREENBOOKGNP FORECAST
(Quarterly averages)
1982--Q3 (Actual)
FederalFunds11.01
10-1/4
1983--Q1
11-1/2
3-MonthTreasury
Bill9.32
7-3/4
8-1/2
9
10
RecentlyOffered AaaUtility Bond
14.56
13-1/2
13-3/4
14
14-1/4
Fixed-rateMortgageCommitment
16.17
14-3/4
14-3/4
15
15-1/4
14-1/4 15-1/412-1/2 10-1/2
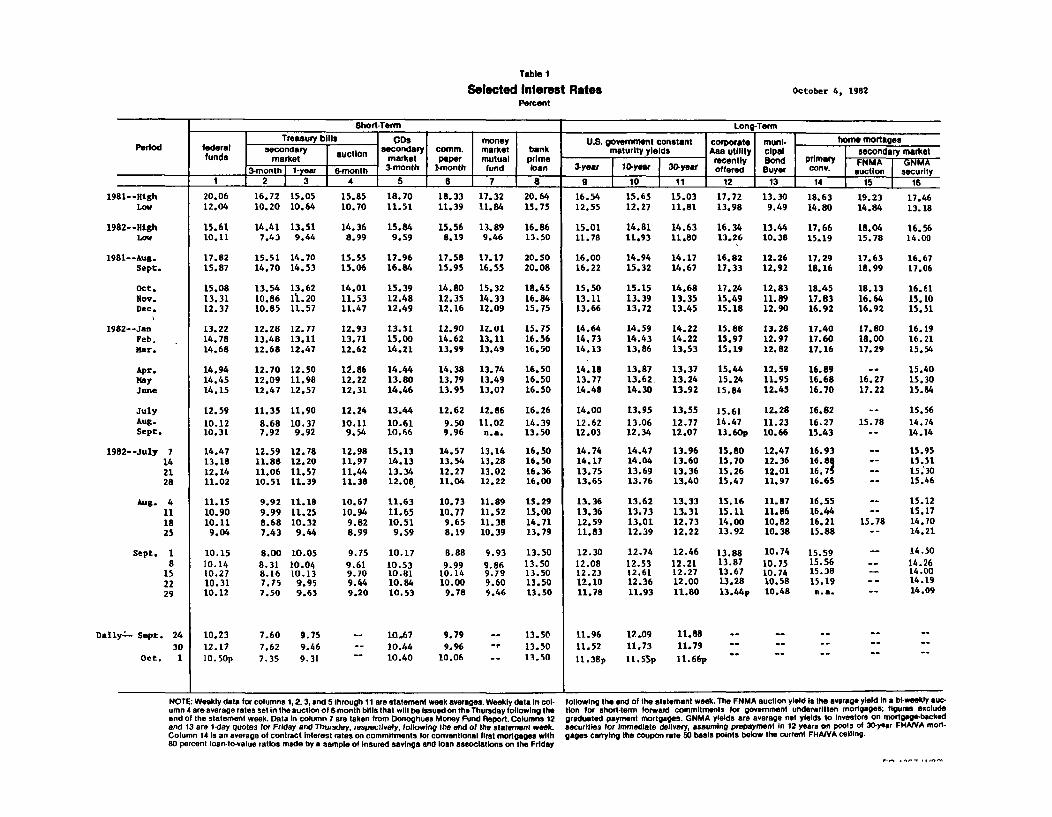
Table 1
Selected Interest RatesPercent
October 4, 1982
Short-Term Long-Term
Treasury bills CDs money U.S. government constant corporate muni- home mortagesPeriod federal secondary auctin secondary comm. market bank maturity yields Aaa utility cipal secondary market
funds market uin market paper mutual prime recently Bond primary FNMA GNm 1onth 1-year 8-month 3-month 1-month fund loan 3-year 10-year 30-year offered Buyer conv. auction security
1 2 3 4 5 6 7 8 9 10 11 12 13 14 15 16
1981--HighLow
1982--HighLow
1981--Aug.Sept.
Oct.Nov.Dec.
1982--JanFeb.Mar.
Apr.MayJune
JulyAug.Sept.
1982--July 7142128
Aug. 4111825
Sept. 18
152229
Dally-- Sept. 2430
Oct. 1
16.72 15.05 15.85 18.7020.0612.04
15.6110.11
17.8215.87
15.0813.3112.37
13.2214.7814.68
14.9414.4514.15
12.5910.1210.31
14.4713.1812.1411.02
11.1510.9010.119.04
10.1510.1410.2710.3110.12
10.2312.1710.50p
10.20 10.64
14.41 13.517.43 9.44
15.51 14.7014.70 14.53
13.54 13.6210.86 11.2010.85 11.57
12.28 12.7713.48 13.1112.68 12.47
12.70 12.5012.09 11.9812,47 12.57
11.35 11.908.68 10.377.92 9.92
12.59 12.7811.88 12.2011.06 11.5710.51 11.39
9.92 11.189.99 11.258.68 10.327.43 9.44
8.00 10.058.31 10.048.16 10.137.75 9.957.50 9.63
7.60 9.757.62 9.467.35 9.31
16.54 15.65 15.03 17.72 13.30 18.6310.70 11.51
14.36 15.848.99 9.59
15.55 17.9615.06 16.84
14.01 15.3911.53 12.4811.47 12.49
12.93 13.5113.71 15.0012.62 14.21
12.86 14.4412.22 13.8012.31 14.46
12.24 13.4410.11 10.619.54 10.66
12.98 15.1311.97 14.1311.44 13.3411.38 12.08
10.67 11.6310.94 11.659.82 10.518.99 9.59
9.75 10.179.61 10.539.70 10.819.44 10.849.20 10.53
-- 10.67
10.44S 10.40
18.33 17.32 20.6411.39 11.84 15.75
15.56 13.89 16.868.19 9.46 13.50
17.58 17.17 20.5015.95 16.55 20.08
14.80 15.32 18.4512.35 14.33 16.8412.16 12.09 15.75
12.90 12.01 15.7514.62 13.11 16.5613.99 13.49 16.50
14.38 13.74 16.5013.79 13.49 16.5013.95 13.07 16.50
12.62 12.86 16.269.50 11.02 14.399.96 n.a. 13.50
14.57 13.14 16.5013.54 13.28 16.5012.27 13.02 16.3611.04 12.22 16.00
10.73 11.89 15.2910.77 11.52 15.009.65 11.38 14.718.19 10.39 13.79
8.88 9.93 13.50
9.99 9.86 13.5010.14 9.79 13.5010.00 9.60 13.509.78 9.46 13.50
9.79 -- 13.50
9.96 -' 13.5010.06 -- 13.50
19.23 17.4614.84 13.18
18.04 16.5615.78 14.00
17.63 16.6718.99 17.06
18.13 16.6116.64 15.1016.92 15.51
17.80 16.1918.00 16.2117.29 15.54
- 15.4016.27 15.3017.22 15.84
-- 15.56
15.78 14.74S 14.14
- 15.95- 15.51
-- 1530- 15.46
-- 15.12- 15.17
15.78 14.70-- 14.21
- 14.50
-- 14.26- 14.00- 14.19- 14.09
12.55
15.0111.78
16.0016.22
15.5013.1113.66
14.6414.7314.13
14.1813.7714.48
14.0012.6212.03
14.7414.1713.7513.65
13.3613.3612.5911.83
12.3012.0812.2312.1011.78
11.9611.5211.38p
I INOTE: Weekly data for columns 1, 2, 3, and 5 through 11 are statement week averages. Weekly data in col- following the end of the statement week. The FNMA auction yield Is the average yield In a bi-weekly auc-umn 4 are average rates set in the auction of 6-month bills that will be Issued on the Thursday following the tion for short-term forward commitments for government underwritten mortgages; figures excludeend of the statement week. Data In column 7 are taken from Donoghues Money Fund Report. Columns 12 graduated payment mortgages. GNMA yields are average net yields to investors on mortgage-backedand 13 are 1-day quotes for Friday and Thursday, respectively, following the end of the statement week. securities for immediate delivery, assuming prepayment in 12 years on pools of 30-year FHA/VA mort-Column 14 is an average of contract Interest rates on commitments for conventional first mortgages with gages carrying the coupon rate 50 basis points below the current FHANA ceiling.80 percent loan-to-value ratios made by a sample of Insured savings and loan associations on the Friday
12.09 11.8811.73 11.7911.55p 11.66p
12.27 11.81 13.98 9.49 14.80
14.81 14.63 16.34 13.44 17.6611.93 11.80 13.26 10.38 15.19
14.94 14.17 16.82 12.26 17.2915.32 14.67 17.33 12.92 18.16
15.15 14.68 17.24 12.83 18.4513.39 13.35 15.49 11.89 17.8313.72 13.45 15.18 12.90 16.92
14.59 14.22 15.88 13.28 17.4014.43 14.22 15.97 12.97 17.6013.86 13.53 15.19 12.82 17.16
13.87 13.37 15.44 12.59 16.8913.62 13.24 15.24 11.95 16.6814.30 13.92 15.84 12.45 16.70
13.95 13.55 15.61 12.28 16.82
13.06 12.77 14.47 11.23 16.2712.34 12.07 13.60p 10.66 15.43
14.47 13.96 15.80 12.47 16.9314.04 13.60 15.70 12.36 16.8813.69 13.36 15.26 12.01 16.7513.76 13.40 15.47 11.97 16.65
13.62 13.33 15.16 11.87 16.55
13.73 13.31 15.11 11.86 16.4413.01 12.73 14.00 10.82 16.2112.39 12.22 13.92 10.38 15.88
12.74 12.46 13.88 10.74 15.59
12.53 12.21 13.87 10.75 15.5612.61 12.27 13.67 10.74 15.3812.36 12.00 13.28 10.58 15.19
11.93 11.80 13.44p 10.48 n.a.
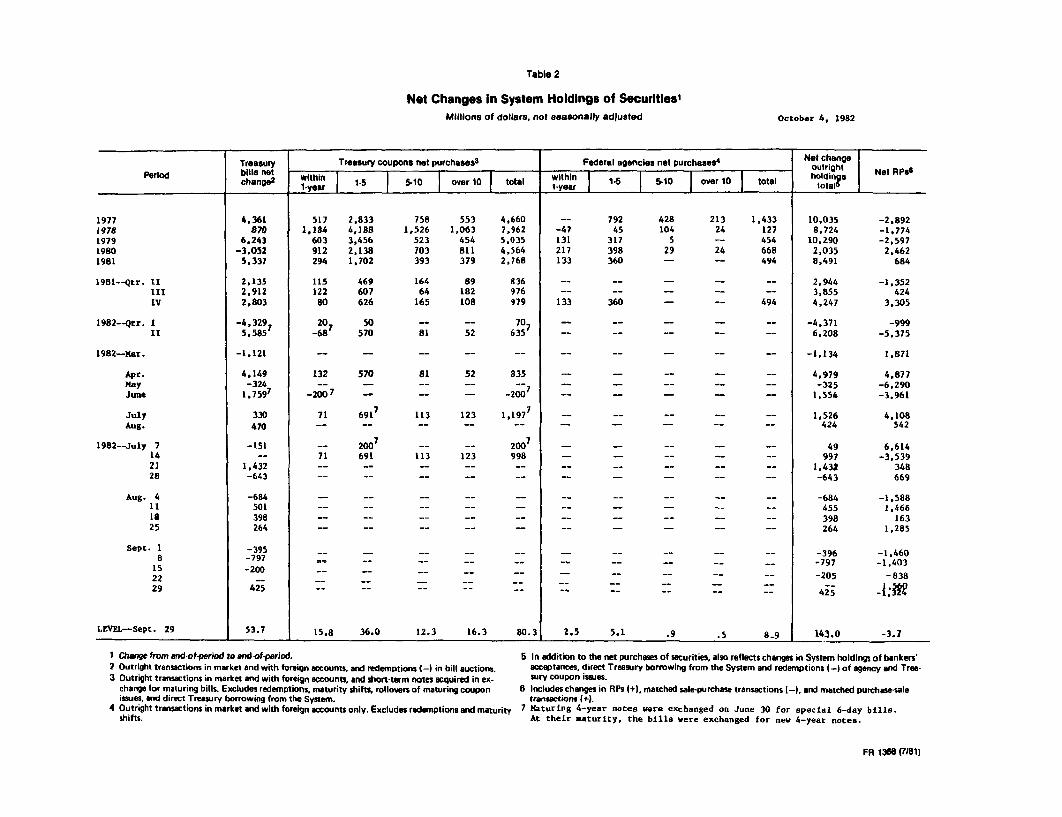
Table 2
Net Changes in System Holdings of Securities 1Millions of dollars, not seasonally adjusted October 4, 1982
Treasury Treasury coupons net purchases3 Federal agencies net purchases 4 Net changePeriod bills net ii outright Net RPs6chang
2 w-5 510 over 10 total witn 1.5 510 over 10 total ho
N e tal
1-year 1-110 1e 10 t 1-year total?
1977 4,361 517 2,833 758 553 4.660 -- 792 428 213 1,433 10,035 -2.8921978 870 1,184 4,188 1,526 1,063 7,962 -47 45 104 24 127 8,724 -1,7741979 6.243 603 3,456 523 454 5,035 131 317 5 -- 454 10,290 -2.5971980 -3.052 912 2.138 703 811 4.564 217 398 29 24 668 2,035 2.4621981 5.337 294 1,702 393 379 2,768 133 360 - -- 494 8,491 684
1981--Qtr. 11 2.135 115 469 164 89 836 -- -- -- - 2.944 -1,352III 2,912 122 607 64 182 976 - -- -- - - 3,855 424IV 2,803 80 626 165 108 979 133 360 - -- 494 4,247 3,305
1982--Qtr. I -4,329 20 50 -- -- 70 - - - - - -4,371 -999II 5.585 -68 570 81 52 635 - - - - - 6.208 -5.375
1982--Mar. -1,121 - - - - - - - - - - -1,134 1,871
Apr. 4,149 132 570 81 52 835 -- -- - - 4,979 4,877May -324 - - - - - - -325 -6,290June 1.7597 -2007 - - - -200 - - - - - 1.554 -3.961
July 330 71 6917 113 123 1,1977 - - - -- - 1,526 4,108Aug. 470 - - - -- -- - -- -- -- 424 542
1982--July 7 -151 -- 2007 - - 200 - -- - - - 49 6,61414 -- 71 691 113 123 998 - - -- - -- 997 -3,53921 1,432 -- - - - - -- - -- -- -- 1,432 34828 -643 - - -- -- - -- - - -- -- -643 669
Aug. 4 -684 - -- - - -- -- - - -- -- -684 -1,58811 501 - -- - - - -- -- -- -- - 455 1,46618 398 - - -- -- -- - - - - -- 398 16325 264 - - - - -- -- - -- -- - 264 1,285
Sept. 1 -395- - - - - - - - -396 -1.4608 -797 - -- -- - -- - - - -797 -1,403
15 -20022 -200 - - - - - -205 -838
29 425 4i -- ; -- - -- A :: :: :: :2j .l:i$
LEVEL--Sept. 29 53.7 15.8 36.0 12.3 16.3 80.3 2.5 5.1 .9 .5 8.9 143.0 -3.7
1 Change from end-ofperiod to endof-period. 5 In addition to the net purchases of securities, also reflects changes in System holdings of bankers'2 Outright transactions in market and with foreign accounts, and redemptions (-) in bill auctions, acceptances, direct Treasury borrowing from the System and redemptions (-) of agency and Tree-3 Outright transactions in market and with foreign accounts, and short-term notes acquired in ex- sury coupon issues.
change for maturing bills. Excludes redemptions, maturity shifts, rollovers of maturing coupon 6 Includes changes in RPs (+), matched sale-purchase transactions (-), and matched purchase-saleissues. and direct Treasury borrowing from the System. transactions (+).
4 Outright transactions in market and with foreign accounts only. Excludes redemptions and maturity 7 Maturing 4 -year notes were exchanged on June 30 for special 6-day bills.shifts. At their maturity, the bills were exchanged for new 4-year notes.
FR 1368 (7/81)

Table 3
Security Dealer Positions and Bank PositionsMillions of dollars
STRICTLY CONFIDENTIAL (FR)CLASS II-FOMC
October 4, 1982
Underwriting Member bank reserve positionsU.S. government securltlee dealer positions yndate poitions M borring at FRB pos
Ped cash futures and forwards corporate municipal reees extended tbills I coupons bills 1 coupons bonds bonds reserves adustent seaoal udes ca toa
1981--HighLow
1982--HighLow
1981-Aug.Sept.
Oct.Nov.Dec.
1982--Jan.Feb.Mar.
Apr.
MayJune
July
Aug.Sept.July 7
1421
Aug. 4111825
Sept. 18152229
15.668 4,633540 540
9,335 7.935-2,699 1,763
4,324 2,2425,611 1,614
4,781 1.6295,037 3,8212,185 2,289
3,704 5,0434,557 5.3276,588 5.656
7,721 4,8467,390 6,7137,286 3.791
5,768 3,4461,265 3,628
-1.157pa* 1,918pr*
4,183 2,9067,757 2,9216,612 3,2795,185 4,558
3,510 3.7484,672 4,256"2.393 4,039
-1,493 3,071
-2,699 2,919-348** 2,167**-156** 132**-366"** 1,267 **-2,219** 3,103**
-12.865 -4.676-4,535 -2,514
-11,077 -4,7408,032 -2,300**
-10,071 -2.972-9,830 -2,856
-8,575 -3,655-7,120 -4.307-5,416 -4,150
-6,344 -3,272-7,594 -3.173-6,696 -2,910
-5,552 -3.402-10,129 -4,350-6.194 -2,677
-1,432 -3,4366,266 -3.6095,
147p** -1,
681p**
-5,743 -2,785-4,013 -3,258
-928 -3.6691.806 -3,861
4,289. -3,6994.629 -3,8146,496 -4,2618,032 -3,280
7.485 -2,7417,719** -2,300**7,499** -1,434
"*
510 ** -810 **2,524** -1,118**
5950
1860
10
2
29
19521
08
106
23
8420
17
41U.a.
0
05440
2529
3277
00
25
6415
562-21
672
0
292414
278
344319
418304361
273
359308
314
312369p501184267
311
294326319260
3626453
08
p242p
291p
2,597145
1,547172
1.105933
591403433
1,2451.4261,073
1,156706859
420301714p
732258322336
493172228397
296726
1,124p591p51
3p
I __ _ _ _ _ _ _ _ _ _ _ _ __ _ _ _ _ _ _ _ _ _ _ _ _
NOTE: Government securities dealer cash positions consist of securities already delivered, commit. Weekly data are daily averages for statement weeks, except for corporate and municipal issues inments to buy (sell) securities on an outright basis for immediate delivery (5 business days or less), and syndicate, which are Friday figures. Monthly averages for excess reserves and borrowing are weightedcertain "when-issued" securities for delayed delivery (more than 5 business days). Futures and forward averages of statement week figures. Monthly data for dealer futures and forwards are end-of-monthpositions include all other commitments involving delayed delivery; futures contracts are arranged on figures for 1980.organized exchanges. Underwriting syndicate positions consists of issues in syndicate, excludingtrading positions. **Strictly confidential
FR 1369 (7/81)
2,912317
1,908369
1,4201,456
1,181663636
1.5181.7901,556
1,5681.1171,205
691515930p
1.070559594548
679369482609
507948
1,329p809p74 9 p