follow-up study of loyalty card customers...follow-up study of loyalty card customers 1. executive...
TRANSCRIPT

Follow-up study of
loyalty card
customers
Changes in gambling
behaviour over time
Authors: Heather Wardle, Elizabeth Fuller, Natalie Maplethorpe and Hollie Jones
Date: 25/01/2017
Prepared for: GambleAware

At NatCen Social Research we believe
that social research has the power to
make life better. By really understanding
the complexity of people’s lives and what
they think about the issues that affect
them, we give the public a powerful and
influential role in shaping decisions and
services that can make a difference to
everyone. And as an independent, not for
profit organisation we’re able to put all
our time and energy into delivering social
research that works for society.
NatCen Social Research
35 Northampton Square
London EC1V 0AX
T 020 7250 1866
www.natcen.ac.uk
A Company Limited by Guarantee
Registered in England No.4392418.
A Charity registered in England and Wales (1091768) and Scotland (SC038454)
This project was carried out in compliance with ISO20252

Acknowledgements A number of colleagues contributed to this report and our thanks are due to:
Si Ning Yeoh for helping with data management
Pablo Cabrera Alvarez for producing the weights
Carl Cullinane for statistical advice
Sonia Shrivington and Letticia Rushaija for overseeing the fieldwork
Malisha Begg for programming the questionnaire.
Finally, we thank all the participants who took part in each survey and made this report
possible.


NatCen Social Research | Follow-up study of loyalty card customers 1
Contents
Executive summary ........................................................... 1
1 Introduction and Background ...................................... 4
1.1 Background to research including overview of policy changes ............... 4
1.1.1 Background to research ........................................................................... 4
1.1.2 Overview of policy changes ..................................................................... 5
1.1.3 Baseline study ......................................................................................... 5
1.2 Aims and objectives ................................................................................ 6
1.3 Overview of methodological approach .................................................... 6
1.4 Profile of respondents ............................................................................. 7
1.5 Limitations ............................................................................................. 8
1.6 Structure of report ................................................................................... 8
1.7 Report conventions ................................................................................. 8
2 Changes in gambling participation ............................ 10
2.1 Introduction ........................................................................................... 10
2.2 Changes in gambling participation ........................................................ 10
2.2.1 Changes in gambling participation: specific activities ............................. 10
2.2.2 Changes in gambling participation: number of activities in the past four
weeks ................................................................................................... 11
2.2.3 Changes in gambling frequency: most frequent gambling activity .......... 12
2.3 Change in gambling participation on machines in bookmakers ............ 13
2.3.1 Past four week participation ................................................................... 13
2.3.2 Frequency of gambling on machines ..................................................... 15
2.3.3 Change in engagement in other activities .............................................. 16
3 Changes in problem gambling .................................. 18
3.1 Introduction ........................................................................................... 18
3.2 Caveats ........................................................................................... 18
3.3 Changes in problem gambling status .................................................... 19
3.4 Changes in problem gambling status by socio-economic factors.......... 22
3.5 Changes in problem gambling scores ................................................... 23
4 Predictors of problem gambling ................................ 26
4.1 Introduction ........................................................................................... 26
4.2 Socio-economic factors associated with becoming a problem gambler 26
4.3 Gambling activities associated with becoming a problem gambler ....... 27
5 Conclusions ............................................................... 29
Appendix A. Tables ......................................................... 31

2 NatCen Social Research | Follow-up study of loyalty card customers
Appendix B. Technical appendix ..................................... 45
Appendix C. Regression to the mean .............................. 49
Appendix D. References .................................................. 51
Appendix E. Questionnaire .............................................. 53
Figures Figure 2.1 Change in past four week gambling participation ................................... 11
Figure 2.2 Change in number of gambling activities undertaken in the past four weeks ................................................................................................ 11
Figure 2.3 Change in number of gambling activities undertaken in the past four weeks, by age group.......................................................................................... 12
Figure 2.4 Change in gambling frequency (on most frequent activity), by age group13
Figure 2.5 Change in past four week participation on machines in bookmakers, by age group ................................................................................................ 14
Figure 2.6 Change in past four week participation on machines in bookmakers, by economic activity ................................................................................... 15
Figure 2.7 Change in past four week participation on machines in bookmakers, by area deprivation ..................................................................................... 15
Figure 2.8 Change in past four week participation on machines in bookmakers, by area deprivation ..................................................................................... 16
Figure 2.9 Change in past four week participation on other gambling activities, by change in machine participation............................................................. 17
Figure 3.1 Problem gambling rates at baseline and follow-up ................................. 19
Figure 3.2 PGSI status change at follow-up ............................................................ 20
Figure 3.3 Change in PGSI status, by sex .............................................................. 21
Figure 3.4 Percentage of respondents becoming a problem gambler, by ethnic group ................................................................................................ 23
Figure 3.5 Change in PGSI scores between follow-up and baseline ....................... 24
Figure 3.5 Increase in PGSI, by ethnic group ......................................................... 25
Figure 3.7 Increase in PGSI, by personal income quartile ...................................... 25

NatCen Social Research | Follow-up study of loyalty card customers 1
Executive summary
Aims and objectives
This study is a follow-up to the 2014 study of holders of bookmakers loyalty cards,
commissioned by the Responsible Gambling Trust (now GambleAware), as part of
a programme of research looking at users of machines in bookmakers. The original
survey is called the baseline study hereafter.
This study was commissioned to
o explore changing patterns of gambling behaviour over time,
o examine changes in problem gambling behaviour, and
o identify who is more likely to change problem gambling status.
This report summarises headline findings on changes in behaviour over time,
changes in problem gambling status, and the characteristics of machine users who
are most at risk of becoming problem gamblers.
Survey design and approach
The sample included 3738 participants in the 2014 survey who had given
permission for further contact. NatCen’s Telephone Interviewing Unit attempted to
contact them in order to invite them to take part in a short interview. Interviewing
took place by telephone between May and August 2016. 1552 individuals took part
in the survey, a response rate of 42%. The main reason for non-participation was
failure to make contact, either because the original number was no longer valid or
because calls were not answered.
Changes to gambling behaviour
Change between baseline and follow-up in gambling participation in the past four
weeks was the norm. Two fifths (39%) of participants had increased the number of
activities they took part in; a slightly higher proportion (42%) had decreased the
number of activities they undertook.
People were also likely to change how often they participated in their most popular
activity: 28% participated more often, and the same percentage participated less
often.
Older participants had more stable patterns of gambling participation, even though
change was the norm for all age groups.
Despite change in behaviour being the norm generally, past four week participation
on machines in bookmakers was stable for the majority. Most people (76%) who
played these machines previously continued to do so. Likewise, the majority of
those had not played these machines previously still abstained (68%).
However, about a third of those who not gambled on machines previously started to
do so in the past four weeks. Equally, around a quarter of previous players stopped
gambling on these machines.

2 NatCen Social Research | Follow-up study of loyalty card customers
Those who were unemployed or who lived in the most deprived areas of England,
Scotland and Wales were more likely to start gambling on machines in bookmakers
than others. Likewise, the unemployed, those living in most deprived areas and
those from non-White ethnic groups were more likely to increase their frequency of
gambling on these machines. These groups are of interest as they are typically
viewed as those more vulnerable to gambling problems.
Participants who started gambling on bookmakers machines in the past four weeks
also tended to increase their engagement in other gambling activities (60%).
Similarly, those who stopped gambling on machines in bookmakers also tended to
reduce their participation in other forms of gambling (56%). In both cases, it seems
unlikely that machine gambling is being substituted for other forms, or vice versa.
Almost a quarter of people who stopped gambling on machines in bookmakers
increased their participation in other forms of gambling (24% of those who stopped
gambling on these machines). Likewise, there were people who started to gamble
on machines in bookmakers and stopped gambling on other things (13% of those
who started gambling on these machines). These people may be more likely to be
substituting one form of gambling for another; this would need to be explored in
more detail with the gamblers themselves.
Changes to problem gambling status
The evidence from this study suggests that stability in problem gambling
prevalence rates over time masks a great deal of variation in the problem gambling
status of individuals.
Problem gambling status was measured by the Problem Gambling Severity Index
(PGSI). Based on answers to nine questions, the PGSI categorises people as non-
problem gamblers, low risk gamblers, moderate risk gamblers or problem gamblers.
Nearly half of all participants changed their PGSI status at follow-up. This includes
6% who were non-problem, low risk or moderate risk gamblers at baseline and who
became problem gamblers, as well as 9% who moved from being problem
gamblers to a lower risk category. However, a majority (54%) of people maintained
the same PGSI status, which was reflected in mean changes in PGSI score, being
just 0.6 lower at follow-up than baseline.
Nearly a third of non-problem gamblers (29%) at baseline had increased their PGSI
scores so that they were, at least, low risk gamblers at follow-up, with 1% becoming
problem gamblers.
Around two in five problem gamblers (41%) had decreased their PGSI scores so
that they were no longer classified as problem gamblers at follow-up, including 7%
of problem gamblers at baseline who were non-problem gamblers at follow-up.
Women, those aged 44-65 and those from Black/Black British minority ethnic
groups were more likely to be classified as problem gamblers at follow-up than
previously. The findings for women are particularly interesting as women are
generally less likely to experience problems than men. It appears, however, that
among loyalty card holders for bookmakers, women maybe more likely to
experience problems with their gambling over time.
Those from minority ethnic groups and with lower levels of personal income were
more likely to have increased their PGSI scores than others. This is notable as

NatCen Social Research | Follow-up study of loyalty card customers 3
people from these groups have higher rates of problem gambling generally. An
increased propensity for higher PGSI scores at follow-up suggests that these
inequalities, especially among minority ethnic groups, are likely to be growing.
Predictors of problem gambling
6% of those who were not categorised as problem gamblers in the baseline survey
had become problem gamblers at the time of the follow-up.
Age, ethnicity and income were associated with the odds of becoming a problem
gambler. Compared with younger age groups, those aged 25-34 and those aged
45-64 had increased odds. Increased odds of becoming a problem gambler were
also found among those of Black/Black British ethnicity (compared to those of
White/White British ethnicity). Those in the highest income quintile had reduced
odds when compared with those in the lowest income quintile.
There was no relationship between the number of activities undertaken at least
once a week at baseline and the odds of subsequently becoming a problem
gambler.
There was no relationship between whether most gambling activities were
undertaken at least once a week at baseline and the odds of becoming a problem
gambler subsequently. There was a relationship between playing bookmakers
machines at least once a week and increased risk of becoming a problem gambler.
However, this finding must be treated with caution, given that the surveys are
based on a sample of holders of bookmakers loyalty cards and are not
representative of all gamblers or of the wider population.
Conclusions
To date policy makers have tended to focus on comparing prevalence rates over time to assess how gambling behaviour is changing. When looking at prevalence rates alone, trends in gambling behaviour and gambling problems can appear stable. However, there is a great deal of behaviour change among individuals.
In this study, people generally thought to be more vulnerable to gambling-related harm were those most likely to become problem gamblers or to increase their PGSI scores (those with low incomes or from non-White backgrounds). This both exacerbates existing inequalities and highlights the importance of focusing preventative action and policies on these groups.
The gambling industry should carefully consider what actions they should take to further prevent these groups from experiencing harm, in line with licensing objectives and the Gambling Commission’s recent emphasis on local area risk profiles.

4 NatCen Social Research | Follow-up study of loyalty card customers
1 Introduction and Background
1.1 Background to research including
overview of policy changes
1.1.1 Background to research
Gambling machines in bookmakers have attracted a great deal of political, media and
regulatory attention in recent years. This is partly due to the high stakes allowed on
these machines, the content which is offered, the setting in which these machines are
made available and the comparatively high proportion of people using these machines
who have gambling problems. These elevated rates of problem gambling are broadly
consistent over time, ranging from 11% of machine players in 2007 to 7% in 2012.1
However, this overall stability masks a complex pattern of change. The experience of
gambling problems over time is known to be fluid, with people moving in and out of
problems. This fluidity is not reflected by a simple comparison of prevalence rates over
time.
It is increasingly recognised that gambling behaviour can fluctuate and that patterns of
problematic behaviour can change over time (Reith & Dobbie, 2013; LaPlante et al,
2008, Breen & Hing, 2014). Qualitative studies have highlighted how patterns of
gambling behaviour can be intermittent and fluid and can be affected by social
circumstances and life events (Slutske, Blaszczynski & Martin, 2009; Slutske, Jackson
& Sher, 2003). Reith and Dobbie’s (2013) longitudinal qualitative study of gambling
behaviour over time emphasised this fluidity in gambling behaviours and highlighted
the role of social networks, context and life events in the initiation, continuation and
change of behaviours.
Other studies have quantitatively examined patterns of play. A recent study by Wardle
& Philo (2014) re-interviewed machine players and non-machine players who were
participants in the British Gambling Prevalence Survey (BGPS) 2010 and the
respective Health Surveys for England (HSE) and Scotland (SHeS) 2012 to learn about
the type of gambling these people were now engaged in. The study showed that
patterns of machine gambling were not static, but changed over time.
More needs to be learned about movement in problematic behaviour over time,
particularly within a British setting. Relatively little is known about which groups change
their gambling behaviour and why, or the factors associated with increasing or
1 These estimates are taken from the British Gambling Prevalence Survey 2007 and the Health
Survey for England 2012, respectively. In each study, the number of people identified who played gambling machines in bookmakers was low. Consequently the difference between the estimates of machine players who were problem gamblers from the two studies is not statistically significant. However, in both studies, people who played machines in bookmakers had higher rates of problem gambling than those who took part in many other activities.

NatCen Social Research | Follow-up study of loyalty card customers 5
decreasing gambling problems. This requires longitudinal information which tracks the
same people over a period of time.
In 2014, a survey of people who held a loyalty card for one of three major bookmakers
was conducted. At the end of that study (called the baseline study hereafter),
participants were asked if they would be willing to take in future research. This current
study follows up these people some two years later to see how their gambling
behaviour has changed.
1.1.2 Overview of policy changes
Since the original baseline study was conducted in 2014 there have been a number of
changes in policy, regulatory and social responsibilities practices. The ones most
pertinent to this study include:
New limitations on how maximum stakes on machines in bookmakers are placed.
Introduced in April 2015 this limited the way people could place higher stakes bets.
There are now two options if people want to place stakes of £50.01 or more on
machines in bookmakers, they must either place the bet over the counter with a
member of staff or use a validated account which allows their play to be tracked.
Preliminary evaluation of this initiative showed that fewer bets of £50 or more were
placed than previously. It was speculated that people preferred to bet at slightly
lower amounts (less than £50) and retain their anonymity than sign up for an
account, which tracks their play.
Publication of the Association of British Bookmaker’s Responsible Gambling Code,
2015. This builds on ABB’s 2013 Code of Conduct for Responsible Gambling. The
2015 code includes a number of elements, the most pertinent of which is the
mandatory requirement for all ABB members to allow machine players to be able to
set money and time limits on their play, along with the mandatory display of
responsible gambling messages once someone has played for 30 minutes or had
spent £250 in a single session. The code also includes various other commitments
around responsible gambling messages, self-exclusion and advertising.
Implementation of the ABB’s Player Awareness System for verified account
holders. This system uses behavioural algorithms to identify potentially harmful
gambling behaviour and sends alerts (via text message, email or on screen) to
gamblers about their play.
Launch of the high profile ‘when the fun stops, stop’ campaign.
All of these initiatives are disproportionately likely to impact upon follow-up study
participants, who were highly engaged users of machines in bookmakers, as evidenced
by their owning one or more loyalty cards.
1.1.3 Baseline study
The baseline survey was conducted in 2014 as part of Responsible Gambling Trust’s
(now called GambleAware) machines research programme. This aimed to examine

6 NatCen Social Research | Follow-up study of loyalty card customers
whether industry data generated by machines in bookmakers could be used to
distinguish between harmful and non-harmful patterns of play.
To do this, a survey of people who held a loyalty card for Ladbrokes, William Hill or
Paddy Power and had gambled on machines in bookmakers in the preceding six
months was conducted. The survey included questions about gambling behaviour and
questions which measured whether someone was a problem gambler or not.
Permission was sought to link participants’ survey data with their loyalty card data. This
linked data was then analysed by Featurespace and RTI International to see if it was
possible to predict who was a problem gambler by looking at industry data alone.
The baseline study showed that people who signed up for a loyalty card from a
bookmaker’s were heavily engaged in gambling. Compared with machines players
identified in the British Gambling Prevalence Survey 2010, loyalty card holders were
more likely to gamble at least once a week and to take part in more forms for gambling.
They were also more likely to be of non-White ethnic origin and to live in deprived
areas. Therefore, participants in both the baseline survey and this current follow-up are
not representative of all gamblers on machines in bookmakers but of a subset of very
engaged gamblers: those who held a loyalty card for a bookmaker in 2013/14.
1.2 Aims and objectives
There is significant policy and public interest in people who play machine in
bookmakers and their patterns of gambling behaviour. This study was commissioned to
build on the insight of the baseline study by following up participants two years later to:
explore changing patterns of gambling behaviour over time,
examine changes in problem gambling behaviour, and
identify who is more likely to change problem gambling status.
This report presents headline findings from the follow-up survey, documents the survey
process, gives an overview of gambling behaviour changes and highlights some
caveats of the research.
1.3 Overview of methodological approach
This section gives a brief overview of the methods used for the follow-up survey; full
technical details are provided in Appendix B.
This study was a follow-up to the 2014 survey of bookmakers loyalty card holders,
based on a sample of 4727 participants: the ‘baseline’ study (see Wardle et al, 2014).2
3988 participants (84%) from the baseline study agreed to be re-contacted about future
research and provided contact details; these formed the sample for the follow-up.
The sample was cleaned and cases where a forename, surname, address and mobile
number were not available were excluded from the sample. In total 3738 cases were
2 The sample for the 2014 survey comprised 27,565 loyalty card holders; the response rate was
between 17% and 19% once ineligible individuals had been taken into account.

NatCen Social Research | Follow-up study of loyalty card customers 7
issued in the final sample. An advance letter was sent to participants and they were
able to opt out by calling the Freephone number provided. Just four potential
participants (<1%) opted out of the study.
Fieldwork was conducted between May and August 2016. This timing was the same as
the baseline study to reduce the potential for any seasonal effects. Participants were
contacted by NatCen’s specialist Telephone Interviewing Unit.
All data were collected using computed assisted interviewing methods. The
questionnaire covered the following topics:
engagement in a range of gambling activities in the past four weeks;
frequency of gambling participation for each activity;
problem screening questions;
impact of changes in industry practice such as machine messaging and staff-
customer interaction
cognitive ability and thinking styles;
demographics;
permission for data linkage.
Much of the questionnaire was a repeat of the questions used previously and the order
in which the questions were asked replicated the baseline study. The questionnaire
took 25 minutes to complete on average. All participants who completed the
questionnaire were sent a £5 Post Office voucher to thank them for their time. Ethical
approval to conduct the study was obtained from NatCen’s independent Research
Ethics Committee.
Overall, 1552 people took part in the study. Taking into account those who were
identified as ineligible to participate during the interview process, the response rate for
this study was 42%. This means that more people did not take part in the study than
those who did. This introduces the potential for non-response bias, as those who did
take part may be different from those who did not. All analysis was weighted to try to
account for this bias and to adjust the survey results to take into account the unequal
probability of participation. Full details of the response rate calculations and weighting
strategy are given in Appendix B.
1.4 Profile of respondents
The socio-demographic and economic profiles of baseline and follow-up participants
after weighting are compared in Table A1.1. Overall, 88% of participants at follow-up
were men and 12% were women, the same as the baseline study. The age profile of
participants remained fairly consistent between baseline and follow-up, allowing for the
fact that participants were two years older for the latter. The other population
characteristics such as area of residence, ethnicity and employment status also
remained consistent between the surveys.
(Table A1.1)

8 NatCen Social Research | Follow-up study of loyalty card customers
1.5 Limitations
There are several limitations that need to be taken into account.
The response rate was relatively low, and whilst weighting has attempted to adjust
for potential non-response biases, we are restricted to the characteristics collected
within the baseline study, which were fairly limited.
Those who took part in both the baseline and follow-up surveys are heavily
engaged in gambling. They have a younger profile and live disproportionately in
deprived areas. These are characteristics typically associated with greater risk of
gambling problems. These findings are not surprising, as this is a survey of people
who signed up for a loyalty card, therefore one would expect them to be more
heavily engaged in gambling. The findings from this survey, however, should not be
extrapolated to all machine players, as loyalty card customers represent only one
segment of the player base.
All gambling behaviour analysed in this report is based on self-reported responses
to survey questions with attendant issues about honest reporting.
1.6 Structure of report
This headline report presents the following:
exploration of changes in participant’s gambling participation including prevalence,
number of activities and frequency of play (Chapter 2);
examination of changes in participants gambling on machines in bookmakers
(Chapter 2);
analysis of changes in problem gambling status including movement between
categories and mean movement in scores (Chapter 3);
examination of predictors of change in problem gambling status (Chapter 4); and
summary of key findings (Chapter 5).
1.7 Report conventions
The following conventions are used in this report.
The data used in this report have been weighted. The weighting strategy is
described in Appendix A. Both weighted and unweighted base sizes are shown at
the foot of each table. The weighted numbers reflect the relative size of each group
of the population, not the number of interviews achieved, which is shown by the
unweighted base.
Tables are presented in Appendix A at the end of this report.
Unless otherwise stated, the tables are based on the responding sample for each
individual question (i.e., item non-response is excluded): therefore bases may differ
slightly between tables.
The group to which each table refers is shown in the top left hand corner of each
table.

NatCen Social Research | Follow-up study of loyalty card customers 9
The following conventions have been used in the tables:
o - No observations (zero values)
o 0 Non-zero values of less than 0.5% and thus rounded to zero
o [ ] An estimate presented in square brackets warns of small sample base
sizes. If a group’s unweighted base is less than 30, data for that group are
not shown. If the unweighted base is between 30 and 49, the estimate is
presented in square brackets.
o * Estimates not shown because base sizes are less than 30.
o Because of rounding, row or column percentages in the tables may not
exactly add to 100%.
o A percentage may be presented in the text for a single category that
aggregates two or more percentages shown in the table. The percentage for
that single category may, because of rounding, differ by one percentage
point from the sum of the percentages in the table.
o Some questions were multi-coded (i.e., allowing the respondent to give
more than one answer). The column percentages for these tables sum to
more than 100%.
The term ‘significant’ refers to statistical significance (at the 95% level) and is not
intended to imply substantive importance.
Only results that are significant at the 95% level are presented in the report
commentary.

10 NatCen Social Research | Follow-up study of loyalty card customers
2 Changes in gambling participation
2.1 Introduction
As with the baseline survey, all participants were asked whether they had engaged in
one of 19 different forms of gambling activity in the past four weeks. The activities
represented all forms of gambling legally available in Great Britain and mirrored those
included in the health surveys for England and Scotland. Those who had taken part in
an activity in the past four weeks were asked how often they engaged in that activity.
The choice of a four-week reference period was deliberate to reduce participant
burden; loyalty card holders are highly engaged gamblers and take part in a large
number of activities.
This chapter compares past four week participation at baseline and follow-up to explore
behavior change among individuals. It also looks at changes in gambling on machines
in bookmakers specifically.
2.2 Changes in gambling participation
2.2.1 Changes in gambling participation: specific activities
Table A2.1 shows participation in a range of gambling activities in the past four weeks
both at baseline and follow-up. In both studies, gambling on machines in bookmakers
was the most popular activity followed by playing the national lottery, betting on horse
races and betting on other sports.
There were, however, some significant changes in past four week participation
between the two studies (see Figure 2.1). The most notable change was a reduction in
past four week participation on machines in bookmakers, falling from 75% of
participants at baseline to 65% at follow-up. Other activities which were less popular at
follow-up were other lotteries (29% at baseline; 21% at follow-up), scratchcards (42%
baseline; 38% follow-up) and betting on dog races (31% baseline; 26% follow-up).
Some activities were more popular among participants at follow-up than previously.
These included gambling online on casino, bingo or slot machine style games (22%
baseline; 27% follow-up), playing bingo in a club (8% baseline; 11% follow-up) and
online betting (31% baseline; 38% follow-up). For all other activities, rates of
participation in the past four weeks were broadly similar between the two studies.
(Figure 2.1, Table A2.1)

NatCen Social Research | Follow-up study of loyalty card customers 11
Figure 2.1 Change in past four week gambling participation
2.2.2 Changes in gambling participation: number of
activities in the past four weeks
Although the average number of activities undertaken in the past four weeks did not
vary overall between baseline and follow-up, this masks a great deal of individual
variation (see Figure 2.2). Only a minority of people gambled on exactly the same
number of activities at baseline and follow-up (19%). The majority either increased the
number of activities they engaged in (39%) or decreased the number of gambling
activities undertaken in the past four weeks (42%). In short, stability in the number of
gambling activities undertaken in the past four weeks was not the norm.
(Figure 2.2, Table A2.2)
Figure 2.2 Change in number of gambling activities undertaken in the past four
weeks

12 NatCen Social Research | Follow-up study of loyalty card customers
Those aged 35 and over were more likely than those aged 18-34 to gamble on the
same number of gambling activities at both baseline and follow-up (22-23% vs 14%).
Older participants, therefore, had somewhat more stable patterns of gambling
involvement than younger participants, even though change was the norm for all age
groups.
(Figure 2.3)
Figure 2.3 Change in number of gambling activities undertaken in the past four
weeks, by age group
2.2.3 Changes in gambling frequency: most frequent
gambling activity
All participants who had taken part in a particular activity in the past four weeks were
asked how often they gambled on that activity. The most frequent activity in which a
participant engaged was identified from all responses.
Table A2.3 shows changes in gambling frequency for the most popular activity between
baseline and follow-up. There was considerable variation in gambling frequency
between the two studies. For example, 44% of those who gambled every day on their
most frequent activity at baseline no longer did so at follow-up. 70% of those who
gambled less than once a week on their most frequent activity at baseline gambled
more often than this at follow-up, with 12% now gambling every day.
NatCen Social Research | Follow-up study of loyalty card customers 13
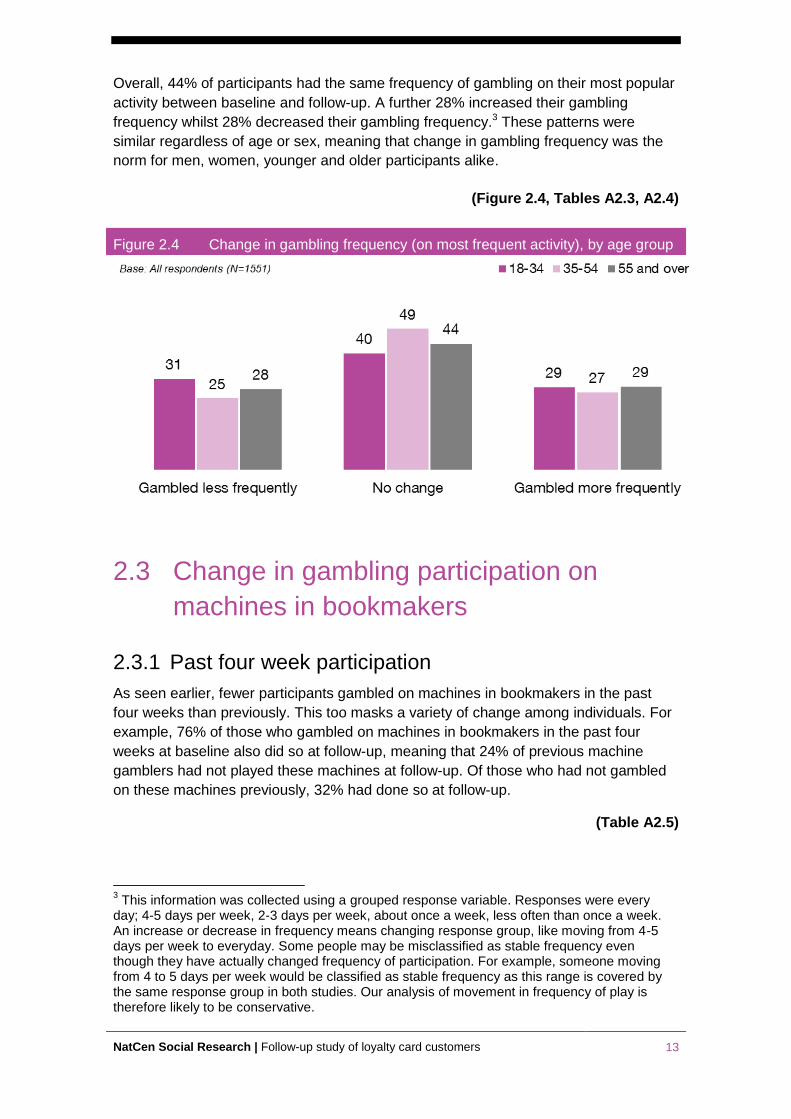
Overall, 44% of participants had the same frequency of gambling on their most popular
activity between baseline and follow-up. A further 28% increased their gambling
frequency whilst 28% decreased their gambling frequency.3 These patterns were
similar regardless of age or sex, meaning that change in gambling frequency was the
norm for men, women, younger and older participants alike.
(Figure 2.4, Tables A2.3, A2.4)
Figure 2.4 Change in gambling frequency (on most frequent activity), by age group
2.3 Change in gambling participation on
machines in bookmakers
2.3.1 Past four week participation
As seen earlier, fewer participants gambled on machines in bookmakers in the past
four weeks than previously. This too masks a variety of change among individuals. For
example, 76% of those who gambled on machines in bookmakers in the past four
weeks at baseline also did so at follow-up, meaning that 24% of previous machine
gamblers had not played these machines at follow-up. Of those who had not gambled
on these machines previously, 32% had done so at follow-up.
(Table A2.5)
3 This information was collected using a grouped response variable. Responses were every
day; 4-5 days per week, 2-3 days per week, about once a week, less often than once a week. An increase or decrease in frequency means changing response group, like moving from 4-5 days per week to everyday. Some people may be misclassified as stable frequency even though they have actually changed frequency of participation. For example, someone moving from 4 to 5 days per week would be classified as stable frequency as this range is covered by the same response group in both studies. Our analysis of movement in frequency of play is therefore likely to be conservative.

14 NatCen Social Research | Follow-up study of loyalty card customers
Whilst there was broad stability for the majority, more than a quarter increased or
decreased their engagement. Overall, 56% of participants gambled on machines in
bookmakers in the past four weeks at both baseline and follow-up. A further 17% of
participants had not gambled on these machines at either baseline or follow-up (called
stable machine players hereafter). 18% of participants had not gambled on these
machines in the prior four weeks at follow-up even though they had done so at baseline
(called stoppers hereafter) and 8% had gambled on these machines at follow-up even
though they had not done so previously (called starters hereafter).4
Those aged 18-34 were less likely than other age groups to have stable patterns of
machine participation. This was mainly because they were more likely to have stopped
gambling on these machines in the past four weeks than older age groups (see Figure
2.5).
(Figure 2.5, Tables A2.6)
Figure 2.5 Change in past four week participation on machines in bookmakers, by
age group
Rates of past four week machine participation change did not vary by ethnicity or
income. This means that those from non-White ethnic groups or with the lowest
incomes were just as likely to start or stop gambling on these machines as those from
White backgrounds or with higher incomes. (Data not shown).
However, as Figures 2.6 and 2.7 show, rates of starting gambling on these machines in
the past four weeks varied by economic activity and area deprivation. Compared with
employed participants, those who were unemployed at baseline were twice as likely to
have started gambling on machines in bookmakers at follow-up (8% vs 16%). Likewise,
13% of those living in the most deprived areas of England, Scotland or Wales at
baseline started to gamble on these machines at follow-up compared with 6% for those
living in less deprived areas.
(Figures 2.6, 2.7, Table A2.7)
4 The term stoppers and starters refers only to comparisons in past four week behaviour. People
may still play these machines but we only collected information about what was done in the four weeks prior to interview. This is a proxy for regular engagement but may miss some other important changes. Therefore, this analysis is also likely to be a conservative representation of change.
48
18 10
24
60
18 8
15
67
13 4
15
Stable: machine
gamblers in both
studies
Stable: non-machine
gamblers in both
studies
Started machine
gambling
Stopped machine
gambling
18-34 35-54 55 and overBase: All respondents (N=1552)

NatCen Social Research | Follow-up study of loyalty card customers 15
Figure 2.6 Change in past four week participation on machines in bookmakers, by
economic activity
Figure 2.7 Change in past four week participation on machines in bookmakers, by
area deprivation
2.3.2 Frequency of gambling on machines
Table A2.8 compares frequency of playing machines in bookmakers at baseline with
frequency of play at follow-up. There was considerable change in frequency of
gambling on these machines. For example, 71% of those who gambled every day on
these machines at baseline played them less often at follow-up, with 26% gambling on
these machines less than once a week. Some participants increased their frequency of
gambling on these machines. For example, 24% of those who had gambled on these
machines about once a week at baseline now played them more often.
55
18
8
19
67
11 2
20
62
19
6 12
56
15 16 13
Stable: machine
gamblers in both
studies
Stable: non-machine
gamblers in both
studies
Started machine
gambling
Stopped machine
gambling
Employed
Retired
Base: All respondents Base: All respondents (N=1482)
59
15
6
20
52
19 13 16
Stable: machine
gamblers in both
studies
Stable: non-machine
gamblers in both
studies
Started machine
gambling
Stopped machine
gambling
Less deprived areas
Most deprived areas
Base: All respondents Base: All respondents N=1497)

16 NatCen Social Research | Follow-up study of loyalty card customers
Overall, 52% of participants gambled on machines in bookmakers with similar
frequency at baseline and follow-up. However, 19% gambled on these machines more
frequently and 29% gambled on them less frequently than previously.
(Table A2.8)
Change in machine play frequency did not vary by age or income but did vary by
ethnicity, area deprivation and economic activity. Those from non-White ethnic groups
(29%) were more likely to have increased their machine play frequency than those from
White backgrounds (17%). Those living in the most deprived areas in England,
Scotland and Wales (25%) and those who were unemployed (28%) or economically
inactive because of a long term sickness (31%) were more likely to have increased
their machine play frequency than those living in the least deprived areas (17%) or
those who were in paid employment (17%).
(Figure 2.8, Table A2.9)
Figure 2.8 Change in past four week participation on machines in bookmakers, by
area deprivation
2.3.3 Change in engagement in other activities
Table A2.10 shows the relationship between changes in the number other gambling
activities undertaken and changes in the level of participation in gambling on machines
in bookmakers. To do this, the total number of other gambling activities undertaken
(excluding machines in bookmakers) in the past four weeks at both baseline and
follow-up was calculated. The number of other activities undertaken at baseline was
subtracted from the number undertaken at follow to show whether people had
increased or decreased the range of other gambling activities engaged in.
For all types of machine gamblers, ranging from those with stable participation to
stoppers and starters, there was notable change in the number of other gambling
activities also undertaken. Of those who gambled on machines in both waves, 42%
increased their engagement in other forms of gambling and 38% decreased their
engagement. Figure 2.9 shows increased and decreased engagement in other forms of
gambling for those who stopped and started playing machines in bookmakers.
50
17
33
53
25 22
No change Gambled more frequently on
machines
Gambled less frequently on
machines
Less deprived
More deprived
Base: All respondents N=1494)

NatCen Social Research | Follow-up study of loyalty card customers 17
Broadly speaking, those who stopped gambling on machines in bookmakers also
tended to reduce the other forms of gambling they engaged in (56%), though a minority
(24%) increased their participation in other forms of gambling despite not gambling on
machines in bookmakers anymore. Those who started gambling on machines in
bookmakers also tended to increase the number of other gambling activities
undertaken (60%), though 13% decreased the number of other forms of gambling
engaged in despite starting to play machines in bookmakers.
(Figure 2.9, Table A2.10)
Figure 2.9 Change in past four week participation on other gambling activities, by
change in machine participation
6 3 3
27
17
12
32
24
14 17
21
13 9
2
3-17 fewer
activities at
follow up
2 fewer
activities at
follow up
1 less
activity at
follow up
No change 1 more
activity at
follow up
2 more
activities at
follow up
3 or more
activities at
follow up
Started to gamble on machines
Stopped gambling on machines
Base: Responsents whose frequency of machine play changed (N=333)

18 NatCen Social Research | Follow-up study of loyalty card customers
3 Changes in problem gambling
3.1 Introduction
A key aim of this study was to examine the extent to which problem gambling
behaviour changed over time. It is increasingly recognised that patterns of gambling
behaviour varies and that stasis is not the norm (Reith & Dobbie, 2013).
In the baseline study, problem gambling was measured using the Problem Gambling
Severity Index (PGSI). Based on responses to nine questions, participants are given a
PGSI score between 0 and 27. A score of 0 is classified as non-problem gambling, a
score of 1-2 is low risk gambling, 3-7 is moderate risk gambling and 8 or more is
classified as problem gambling. In the follow-up study, problem gambling scores were
also collected using the PGSI. The questions were administered in the same way as
previously and were asked at the same point in the questionnaire to minimise the risk
of differences in scores being due to the way the questions were asked.
This chapter looks at movement and stability in problem gambling in two ways. The first
looks at the proportion of people who were classified as non-problem, low risk,
moderate risk and problem gamblers in the baseline study and whether people still
belonged to these respective groups at follow-up. The second looks at changes in
PGSI scores overall and identifies groups of people whose PGSI scores increased and
those whose scores decreased, regardless of their problem gambling status. For both,
variations by socio-demographic and economic status are presented.
3.2 Caveats
No measure of problem gambling is perfect and will be subject to some errors in
reliability when asked of the same people at different points in time. The same is true of
the PGSI. This means when repeating the PGSI questions in this follow-up study it is
possible that changes observed are a not a reflection of real changes in behaviour but
of measurement error. A key consideration when repeating measures like the PGSI
over time with the same people is regression to the mean. Regression to the mean is a
statistical phenomenon that can make variation in measures over time look like real
change (Barnett et al, 2005). It means that extreme measures (such as very high PGSI
scores) are likely to be closer to average the second time they are measured. This is
discussed further in Appendix C.

NatCen Social Research | Follow-up study of loyalty card customers 19
3.3 Changes in problem gambling status
Figure 3.1 shows problem gambling prevalence at baseline and follow-up for all
participants. As can be seen, rates are very similar between the two studies (20% of
participants were problem gamblers at baseline and 19% were problem gamblers at
follow-up). However, this masks a great deal of variation for individuals.
(Figure 3.1, Table A3.1)
Figure 3.1 Problem gambling rates at baseline and follow-up
Overall, 54% of participants had the same status at baseline and follow-up. Others
were more likely to reduce than increase their status level; 28% had reduced their
problem gambling risk, compared with 18% who had increased their risk category.
Figure 3.2 shows PGSI classification at follow-up for non-problem, low risk, moderate
risk and problem gamblers at baseline. Looking at non-problem gamblers first, 71% of
those who were non-problem gamblers at baseline remained non-problem gamblers at
follow-up. This means 29% of non-problem gamblers had increased their PGSI score
at follow-up so that they were now, at least, classified a low risk gambler (18%), with
1% increasing their PGSI scores so that they were classified as problem gamblers at
follow-up.
(Figure 3.2, Table A3.2)
32
22
26
20
34
24 23
19
Non-problem gambler Low risk gambler Moderate risk gambler Problem gambler
Baseline Follow-upBase: All respondents (N=1551)

20 NatCen Social Research | Follow-up study of loyalty card customers
Among low risk and moderate risk gamblers, movement between categories between
baseline and follow-up was the norm. Of low risk gamblers, 59% either increased or
decreased their PGSI score at follow-up so that they were no longer classified as a low
risk gambler, with 2% increasing their scores so that they were classified as a problem
gambler. Low risk gamblers whose status changed were more likely to move towards
non-problem gambling (40%) than moderate risk or problem gambling (19%). Of
moderate risk gamblers, 21% increased their PGSI score and were classified as
problem gamblers at follow-up whereas 38% decreased their PGSI scores and were
classified as low risk or non-problem gamblers subsequently.
Finally, 59% of problem gamblers at baseline remained problem gamblers at follow-up.
This meant that 41% of baseline problem gamblers decreased their PGSI scores so
that they were no longer classified as problem gamblers at follow-up. The majority of
this group moved into the moderate risk gambler group (27%) but 7% were classified
as non-problem gamblers.
This highlights the range of movement in problem gambling status at follow-up. For
non-problem gamblers, stability in behaviour was the norm but around three in ten
increased their PGSI scores. Likewise, among problem gamblers, maintenance of
problems was broadly the norm but there were decreases in PGSI scores for some.
Because of the number of PGSI status combinations between baseline and follow-up
(16 in total), these movements have been summarised as follows:
those for whom categorisation stayed the same (called stable PGSI gamblers
hereafter)
those who were non-problem or low risk gamblers at baseline and whose scores at
follow-up increased their PGSI status (called non-problem/low risk: increasers
hereafter)
71
40
9
7
18
41
29
7
10
17
41
27
1
2
21
59
Baseline:
non
problem
Baseline:
low risk
Baseline:
moderat
e risk
Baseline:
problem
gambler
Follow-up: non problem Follow-up: low risk
Follow-up: moderate risk Follow-up: problem gambler
Base: All respondents (N=1551)
Figure 3.2 PGSI status change at follow-up

NatCen Social Research | Follow-up study of loyalty card customers 21
those who were moderate risk or low risk gamblers at baseline and whose scores
at follow-up decreased their PGSI status (called moderate risk/low risk: decreasers
hereafter)
those who became problem gamblers at follow-up (called became problem
gamblers hereafter) and
those who were problem gamblers at baseline but were not at follow-up (called
stopped being problem gamblers hereafter).
Figure 3.3 shows the proportions of men and women falling into each category.
(Figure 3.3, Table A3.3)
Overall, the majority of people had a stable PGSI status between baseline and follow-
up (54%). However, nearly half changed status, including 6% of respondents who
became problem gamblers at follow-up and 9% of respondents who moved out of
problem gambling status. Looking only at those who were non-problem gamblers at
baseline (i.e. excluding stable problem gamblers), the proportion who became problem
gamblers at follow-up was slightly higher, with 7% of non-problem gamblers becoming
problem gamblers (6% for men and 13% for women).
The pattern varied significantly for men and women; women were more likely than men
to become problem gamblers (11%, compared with 5%) whilst the proportion moving
out of problem gambling was similar for men and women (10% and 7% respectively).
Figure 3.3 Change in PGSI status, by sex
53
12 19
5 10
55
11 16
11 7
54
12 19
6 9
Stable PGSI
status
Non-problem/low
risk: increaser
Moderate risk/low
risk: decreaser
Became problem
gamblers
Stopped being
problem gambler
Men Women AllBase: All respondents (N=1551)

22 NatCen Social Research | Follow-up study of loyalty card customers
3.4 Changes in problem gambling status by
socio-economic factors
Change in PGSI status was examined by age, ethnic group, educational qualifications,
employment status, personal income and whether someone lived in one of the most
deprived areas in England, Scotland or Wales.5 Prevalence rates of becoming a
problem gambler varied by age and ethnicity whereas rates of stopping being a
problem gambler varied only by educational status.
(Table A3.3)
Those aged 18-24 at baseline were least likely to become problem gamblers at follow-
up (0.5%) whereas those who were aged 45-64 were more likely to have become
problem gamblers (8-11%). These patterns are interesting as the youngest age group
at baseline were less likely to be problem gamblers generally (prevalence rates were
17% for those aged 18-24 vs 25-29% for those aged 24-54) and appear to be less
likely to develop gambling problems.
Looking at ethnicity, those from Black/Black British backgrounds were more likely to
become problem gamblers than those from other ethnic groups (see Figure 3.4). This
too is notable as those from Black/Black British groups had, along with those from
Asian/Asian British backgrounds, had higher rates of problem gambling to start with
(38% Black/Black British, 50% for Asian/Asian British vs 15% for those from
White/White British backgrounds).
Whilst rates of stopping being a problem gambler did not vary significantly by ethnic
group, it is notable that 14% of those who were Black/Black British moved from
problem gambling status to another category at follow-up. Nonetheless, higher baseline
rates of problem gambling and increased rates of moving into problem gambling at
follow-up suggest that loyalty card holders who are Black/Black British are at increased
risk experiencing gambling problems.
(Figure 3.4)
5 With the exception of education, this analysis used classification at baseline when assessing
PGSI status change.

NatCen Social Research | Follow-up study of loyalty card customers 23
The only variation in rates of stopping being a problem gambler was by educational
attainment, and then with no clear pattern. Rates of moving out of problem gambling
were higher among those with the highest levels of educational attainment (13% for
those with a professional qualification, 11% for those with a degree or higher) and
among those with no/other qualifications (11%).
Finally, whilst rates of starting or stopping gambling did not vary by employment status,
stability in PGSI status did. Those who were unemployed (63%) or were other
economically activity (such as being a student or looking after the family/home) had the
highest rates of stable PGSI status (63% and 66% respectively).
With respect to unemployment, this is notable as those who were unemployed had the
higher rates of at-risk and problem gambling prevalence at baseline (39% vs 21% for
those who were employed) and lowest rates of non-problem gambling (21% vs 31% for
those who were employed). Relatively higher rates of stable PGSI status suggests that
those who are unemployed should still be considered at risk for the maintenance of
gambling problems.
3.5 Changes in problem gambling scores
In addition to looking a movement between PGSI categories, we also look at changes
in PGSI scores overall. Figure 3.5 shows the distribution of changes in PGSI scores
overall (subtracting scores at baseline from scores at follow-up). Minus values mean
that scores at follow-up are lower than at baseline whereas positive values mean that
scores at follow-up were higher than at baseline.
(Figure 3.5)
5 5
13
1
White/White British Asian/Asian British Black/Black British Other
Base: All respondents (N=3004)
Figure 3.4 Percentage of respondents becoming a problem gambler, by ethnic
group

24 NatCen Social Research | Follow-up study of loyalty card customers
Overall, the mean change in PGSI scores between follow-up and baseline was -0.6
meaning that PGSI scores were marginally lower at follow-up than baseline. The
median change in PGSI scores was 0. For nearly half of all respondents, the change in
PGSI score between follow-up and baseline was less than +/- 1. Around 10% of
respondents increased their PGSI score by four or more and between 10-15% of
respondents decreased their PGSI score by four or more.
A change score of 1 on the PGSI instrument means changing a single response to one
of the nine questions from either never to sometimes, sometimes to most of the time or
most of the time to always. This may not represent real behaviour change but rather
measurement variability.
In order to better identify people whose change in PGSI scores were more likely to
reflect behaviour change, those whose scores were +/- one standard deviation from the
mean (4.6) were categorised as PGSI increasers or PGSI decreasers. This resulted in
8% of respondents being categorised as having increased their PGSI score, 11% as
reduced their PGSI score and 82% as neither.6
As with changes in PGSI status, changes in PGSI scores were examined by age, sex,
educational attainment, ethnicity, employment status, income and area deprivation.
The proportion of respondents who reduced their PGSI score did not significantly vary
by any of these factors, neither did mean PGSI scores.
(Table A3.4)
6 Vladimirov et al (2015) have taken a similar approach when looking at changes in units of
alcohol consumed. See Vladimirov D, Niemelä S, Auvinen J, Timonen M, Keinänen-Kiukaanniemi s, Ala-Mursula L, Laitinen J, Miettunen J. 2015. Changes in alcohol use in relation to sociodemographic factors in early Midlife. Scandinavian Journal of Public Health. 1-9.
-8
-5
-3 -2 -2
-1 -1 0 0 0 0 0 0
1 1 2 2
4
6
-10
-8
-6
-4
-2
0
2
4
6
8
5 10 15 20 25 30 35 40 45 50 55 60 65 70 75 80 85 90 95
Percentile
Base: All respondents (N=1551)
Figure 3.5 Change in PGSI scores between follow-up and baseline

NatCen Social Research | Follow-up study of loyalty card customers 25
However, rates of increasing PGSI scores varied significantly by ethnicity and income
(see Figures 3.6 and 3.7 respectively). Those from non-White British ethnic
backgrounds (between 15-20%) were more likely to have increased their PGSI scores
than those who were White/White British (6%). With regards to income, the proportion
of respondents who increased their PGSI score increased as personal income
decreased, ranging from 14% for those with the lowest income to 5% for those with the
highest income.
(Figures 3.6, 3.7)
6
15
18 20
White/White British Asian/Asian British Black/Black British Other
Base: All respondents (N=1549)
14
10
6 5
Lowest income 2nd 3rd Highest income
Base: All respondents (N=1421)
Figure 3.5 Increase in PGSI, by ethnic group
Figure 3.7 Increase in PGSI, by personal income quartile

26 NatCen Social Research | Follow-up study of loyalty card customers
4 Predictors of problem gambling
4.1 Introduction Chapter 3 of this report examines how problem gambling behaviour changed in the two
years between the baseline survey in 2014 and the follow-up in 2016. Using the
Problem Gambling Severity Index (PGSI) it compared the problem gambling scores of
participants to assess how much problem gambling status changes over time. Among
individuals who responded to both surveys, there was stability overall in the proportions
categorised as non-problem, low risk, moderate risk and problem gamblers, but this
masked changes in problem gambling status among a substantial minority of
participants. These changes were in both directions, representing both increasing and
decreasing problem gambling scores, and included a small proportion of participants
(6%) who had moved from a lower risk category to become problem gamblers in the
follow-up study.
This chapter examines the characteristics at baseline that were associated with an
increased risk of becoming a problem gambler at the follow-up study. The analysis
uses multivariate regression models in order to control for underlying associations
between individual characteristics. For example, age and ethnicity may each be
associated with an increased risk of becoming a problem gambler. But different ethnic
groups within the sample have different age profiles. Multivariate regression models
enable the effects of each characteristic to be assessed independently, by controlling
for the impact of other characteristics in the model.
Similar analyses are also used to explore possible associations between gambling
activities at baseline and becoming a problem gambler at the time of the follow-up
study.
The analysis is based on participants who were not problem gamblers at the time of the
baseline survey, 77% of the follow-up sample, of whom 7% had become problem
gamblers by the time of the follow-up.7
4.2 Socio-economic factors associated with
becoming a problem gambler Seven different factors were entered simultaneously into the model: sex; age; ethnicity;
educational attainment; employment status; income; and area deprivation. Table A4.1
shows the factors associated with becoming a problem gambler at the follow-up. Only
factors that were significant in the final model are shown in the table. Odds ratios are
shown for each category of the independent variables. These odds are expressed in
7 There were insufficient women who had become problem gamblers in the sample to enable
separate models to be run for men and women, and some categories for specific characteristics were grouped for the same reason.

NatCen Social Research | Follow-up study of loyalty card customers 27
relation to a reference category; an odds ratio of 1 or more indicates increased odds of
becoming a problem gambler, and an odds ratio of less than 1 means lower odds than
the reference category. 95% confidence intervals are shown; if the confidence interval
spans 1, the difference in odds is not statistically significant.
(Table A4.1)
Age was a significant predictor of non-problem gamblers at baseline becoming
problem gamblers at the follow-up. Compared with 18-24 year olds, older adults in
three age groups had increased odds of becoming problem gamblers: those aged 25-
34, 45-54 and 55-64. Note that the odds ratios for these groups are very high –
between 25 and 35 times the odds of the reference group, aged 18-24 at baseline. This
is because young adults were very unlikely to become problem gamblers.
Ethnicity was also a predictor of becoming a problem gambler at the follow-up.
Compared with those of White/White British ethnicity, Those of Black/Black British
ethnicity had 2.75 times the odds of becoming problem gamblers at the follow-up.
Finally, income at baseline was associated with becoming a problem gambler at
follow-up. Compared with the lowest quartile (those with an income of up to £10,400
per year), those in the highest income quartile (earning £26,000 or more) had reduced
odds of becoming problem gamblers; the highest income group had odds 0.28 times
lower than the lowest income group.
Sex, educational attainment, employment status and area deprivation at the time of the
baseline study were not significantly associated with whether participants became
problem gamblers at the follow-up study.
4.3 Gambling activities associated with
becoming a problem gambler To explore whether particular activities were associated with the risk of subsequently
becoming a problem gambler, gambling activities at baseline were included in further
multivariate regression models. The baseline survey collected information on the
frequency with which participants engaged in 17 individual gambling behaviours in the
past four weeks.8
Separate models were constructed that included whether participants had engaged in
each of these activities at least once a week in the past four weeks. The profiles of
those who took part in each activity were not the same and the models included
personal characteristics to account for this: sex, age, ethnicity and income. (Apart from
sex, other characteristics that were not significant predictors of becoming a problem
gambler were excluded in order to increase the efficiency of the models.)
Problem gamblers tend to take part in a range of gambling activities and involvement in
a range of gambling activity more broadly can attenuate the association between
8 As shown in Table A2.1; playing poker in a pub has been excluded from this analysis as
frequency information at baseline was not available.

28 NatCen Social Research | Follow-up study of loyalty card customers
specific gambling activities and problem gambling (LaPlante et al, 2009; LaPlante,
Nelson & Gray, 2014). To control for this without including every activity in each model,
a summary variable of the number of different activities engaged in at least once a
week in the past four weeks was included in the models.9 The number of activities
engaged in weekly was not itself a significant predictor of becoming a problem
gambler, once sex, age, ethnicity and income had been controlled for.
For 16 of the 17 activities modelled in this way, there was no association between
engaging at least once a week in that activity in the last four weeks in the baseline
study and an increased likelihood of subsequently becoming a problem gambler.10 The
exception was playing machines in a bookmaker; participants who did this at least
weekly at baseline had increased odds of 2.29 times those who did not play
bookmakers machines or did not play them that frequently in the last four weeks.
(Table A4.2)
It should be remembered that this is a sample of individuals already likely to be
engaged with playing machines in bookmakers, as evidenced by their possession of
one or more bookmakers loyalty cards. As Chapter 2 shows, 75% of the follow-up
survey sample had played bookmakers machines in the last four weeks at baseline,
and 65% had done so in the four weeks preceding the follow-up survey. In both
surveys, machines were the most frequently mentioned gambling activity. The nature of
the sample makes it impossible to tell whether a broader sample of individuals whose
gambling activities did not include machine play, or for whom machine play was a
relatively insignificant element in their overall play, would show similar results.11
9 This broadly replicates the analytical procedure used by LaPlante et al 2009, though the
models included in this chapter included controls for demographic profile as well as gambling involvement. The number of gambling activities undertaken weekly was chosen as the measure of gambling involvement as it represents the most regular levels of engagement among this sample of frequent gamblers. Analysis was also conducted using the number of gambling activities undertaken in the past four weeks as a control for gambling involvement which gave broadly similar results (results available from authors on request). 10
There was a significant association between playing the National Lottery at least once a week and subsequently becoming a problem gambler; weekly players had reduced odds of 0.48 of becoming a problem gambler compared with those who did not play the National Lottery at least once a week at baseline. 11
Models for weekly participation in betting on non-sports events other than online and for football pools indicated risks that were just outwith the 95% confidence interval that is used in this research to indicate statistical significance.
NatCen Social Research | Follow-up study of loyalty card customers 29
5 Conclusions
To date, evidence about British gambling behaviour has tended to focus on cross-
sectional studies, such as the British Gambling Prevalence Survey series, that describe
behavior at a particular time. Change has been measured by comparing these discrete
studies across time. Whilst these studies provide an overview of how gambling
behaviour may vary for the whole population, they do not tell us how gambling changes
for individuals.
This study has addressed this lack by following up individuals two years after they were
originally interviewed to see how their gambling behaviour had changed. Comparing
results from the baseline and follow-up studies highlights how trends in prevalence
rates mask broader changes. Problem gambling rates were similar at baseline and
follow-up, but there was a great deal of movement in problem gambling scores among
individuals. 46% of participants did not have the same problem gambling status as
previously, with 6% of participants becoming problem gamblers at follow up and 9% of
participants moving from problem gambling to at risk or non-problem gambling status.
As well as identifying those who became problem gamblers, this study explores the
characteristics of these people. Those with low incomes and from non-White ethnic
backgrounds were more likely to become problem gamblers than other groups. These
groups are typically viewed as being more vulnerable to gambling problems and this
study provides further evidence that they should be considered risk groups. It also
suggests that inequalities among these groups may be growing and that inequality in
the experience of gambling problems is both relative and absolute. For example, those
with the lowest levels of personal income had rates of increasing PGSI scores that
were nearly three times higher than those with the highest levels of income. Of the
various gambling activities undertaken at baseline, only playing machines in
bookmakers on a weekly basis was significantly associated with becoming a problem
gambler once overall gambling engagement was taken into account. This is broadly in
line with previous analysis conducted by LaPlante et al (2009). However, some caution
should be taken with this finding. In both the baseline and follow up surveys, machines
were the most frequently mentioned gambling activity. It is not clear whether a broader
sample of individuals for whom machine play was a relatively insignificant element in
their overall play would show similar results.
There was also a great deal of change in gambling participation generally; indeed,
change was the norm. Over the period between the two surveys, people were likely to
change the range of activities they took part in and change the frequency with which
they gambled. These changes were in both directions, with some people increasing
their gambling engagement and others decreasing their involvement. As Reith and
Dobbie noted, stasis was not the norm (2013).
That said, those who played machines in bookmakers previously tended to continue to
gamble on these machines (76%). However, for some, their frequency of gambling on
these machines varied, with over half of participants changing how often they gambled
on these machines. Notably, those who were more likely to increase their engagement
on machines in bookmakers were those generally considered vulnerable to gambling

30 NatCen Social Research | Follow-up study of loyalty card customers
problems, namely those who were unemployed, who lived in deprived areas and those
from non-White ethnic backgrounds.
Looking at changing machine gambling in context, it is the case that those who started
to gamble on machines in bookmakers also tended to increase their interest in other
forms of gambling. Likewise, those who stopped gambling on machines tended to
reduce the other forms of gambling they took part in. There was little evidence of
people substituting machine gambling for other forms of engagement, though this was
potentially the case for a minority of people. Of course, understanding how machine
gambling fits within people’s broader gambling repertoire and who engages in what,
when and why needs more detailed investigation. We would recommend more detailed
follow up with those who changed gambling behaviour to better understand this.

NatCen Social Research | Follow-up study of loyalty card customers 31
Appendix A. Tables
Table A1.1 Profile of loyalty card respondents
Socio-economic/demographic characteristics
Baseline Follow-up
% %
Sex
Men 88 88
Women 12 12
Age
16-24 16 12
25-34 23 23
35-44 19 19
45-54 22 22
55-64 13 15
65-74 6 7
75+ 1 2
Government Office Region
North East 7 8
North West 11 11
Yorkshire and the Humber 8 9
East Midlands 6 5
West Midlands 7 7
East of England 7 7
London 19 18
South East 8 8
South West 6 6
Wales 4 4
Scotland 16 16
Index of multiple deprivation - England
Less deprived 64 67
Most deprived (80th
centile or above) 36 33
Index of multiple deprivation - Wales
Less deprived 62 64
Most deprived (80th
centile or above) 38 36
Index of multiple deprivation - Scotland
Less deprived 66 62
Most deprived (80th
centile or above) 34 38
Ethnic Group
White/White British 82 82
Asian/Asian British 6 6
Black/Black British 7 6
Other ethnic group 5 6

32 NatCen Social Research | Follow-up study of loyalty card customers
Table A1.1 Profile of loyalty card respondents (continued) Baseline Follow-up
% %
Employment status
Paid employment 66 66
Unemployed 11 9
Looking after family/home 4 3
Student 3 2
Retired 9 10
Long term sick/disabled/other 7 10
Bases (unweighted) 4727 1552
Bases (weighted) 4726 1552

NatCen Social Research | Follow-up study of loyalty card customers 33
Table A2.1 Past four weeks gambling prevalence,
baseline and follow-up
Those who took part in both studies aged 18 and over
Gambling activities Baseline Follow-up
% %
Lotteries and related
products
National Lottery 54 56
Scratchcards 42 38
Other lotteries 29 21
Machines/Games
Football pools 15 15
Bingo 8 11
Machines in bookmakers 75 65
Fruit machines 30 32
Table games in a casino 14 12
Poker in a pub 6 5
Gambled online on casino
games/slots/bingo 22 27
Betting activities
Bet online 31 38
Betting exchanges 7 7
Bet on horses (not online) 52 50
Bet on dogs (not online) 31 26
Bet on sports events (not
online) 47 47
Bet on other events (not
online) 13 13
Spread bet 5 4
Private bet 16 14
Bases (unweighted) 1552 1552
Bases (weighted) 1552 1552

34 NatCen Social Research | Follow-up study of loyalty card customers
Table A2.2 Change in number of activities undertaken in past four weeks, by
age group Base: All respondents
Change in number of gambling
activities undertaken in past
four weeks
Age group All
18-34 35-54 55 and over
% % % %
3-17 activities fewer at follow-up 23 11 8 15
2 activities less at follow-up 10 12 11 11
1 less activity at follow-up 12 18 22 17
No change 14 22 23 19
1 activity more at follow-up 11 15 19 14
2 activities more at follow-up 11 12 8 11
3+ activities more at follow-up 19 11 10 14
Bases (unweighted) 312 707 527 1551
Bases (weighted) 608 633 306 1550
Table A2.3 Frequency of participating in most popular activity, baseline and
follow-up Base: All respondents
Frequency of participation
at follow-up
Frequency of participation at baseline
Every day 4-5 days per
week
2-3 days per
week
About once
a week
Less often
than once a
week
% % % % %
Every day 56 24 15 5 12
4-5 days per week 15 23 14 10 3
2-3 days per week 19 38 51 31 38
About once a week 3 12 12 38 16
Less often than once a week 6 3 7 16 30
Bases (unweighted) 472 261 543 179 96
Bases (weighted) 397 233 537 216 166

NatCen Social Research | Follow-up study of loyalty card customers 35
Table A2.4 Change in gambling frequency on most popular activity, by
age group Base: All respondents
Change in number of
gambling activities
undertaken in past four
weeks
Age group All
18-34 35-54 55 and over
% % % %
No change 40 49 44 44
Increased frequency of
gambling
29 27 29 28
Decreased frequency of
gambling 31 25 28 28
Bases (unweighted) 312 707 527 1551
Bases (weighted) 608 633 306 1550
Table A2.5 Gambling on machines in bookmakers, baseline and
follow-up Base: All respondents
Follow-up Baseline
Did not gamble on
machines in
bookmakers in past four
weeks
Did gamble on
machines in
bookmakers in past four
weeks
% %
Gambled on machines in
bookmakers in past four weeks 32 76
Did not gamble on machines in
bookmakers in past four weeks 68 24
Bases (unweighted) 1314 238
Bases (weighted) 1160 392

36 NatCen Social Research | Follow-up study of loyalty card customers
Table A2.6 Change in participation in gambling on machines in bookmakers,
by age group Base: All respondents
Change in participation Age group All
18-34 35-54 55 and over
% % % %
Stable: gambled on machines
at baseline and follow-up 48 60 67 56
Stable: did not gamble on
machines at baseline and
follow-up
18 18 13 17
Starters: gambled on
machines at follow-up but not
baseline
10 8 4 8
Stoppers: gambled on
machines at baseline but not
follow-up
24 15 15 18
Bases (unweighted) 313 707 527 1552
Bases (weighted) 609 633 306 1552
Table A2.7 Change in participation in gambling on machines in bookmakers by socio-economic characteristics Base: All respondents
Characteristics Change in frequency of gambling on machines
in bookmakers
Bases
Stable:
both
baseline
and follow-
up
Stable:
neither
baseline or
follow-up
Starters Stoppers Un-
weighted
Weighted
All % 56 17 8 18 1552 1552
Economic activity
Employed % 55 18 8 19 947 1023
Retired % 67 11 2 20 244 143
Long term sick % 62 19 6 12 126 108
Unemployed % 56 15 16 13 169 177
Other % 51 21 10 18 62 99
Area deprivation
Less deprived area %
59 15 6 20 977 1004
Most deprived (80th
centile
or above): England,
Scotland and Wales
%
52 19 13 16 524 490

NatCen Social Research | Follow-up study of loyalty card customers 37
Table A2.8 Frequency of gambling on machines in bookmakers, baseline and
follow-up Base: All respondents
Frequency of participation
at follow-up
Frequency of participation at baseline
Every day 4-5 days per
week
2-3 days per
week
About once
a week
Less often
than once a
week
% % % % %
Every day 29 18 8 3 3
4-5 days per week 16 21 11 3 2
2-3 days per week 20 31 38 17 7
About once a week 10 18 17 31 11
Less often than once a week 26 11 26 46 77
Bases (unweighted) 218 158 454 281 437
Bases (weighted) 146 105 362 271 665
Table A2.9 Change in frequency of gambling on machines in bookmakers by socio-
economic characteristics
Base: All respondents
Characteristics Change in frequency of gambling on
machines in bookmakers
Bases
No change Increased
frequency
Reduced
frequency
Unweighted Weighted
All % 52 19 29 1548 1549
Ethnicity
White/White British % 53 17 29 1320 1270
Non White British % 44 29 27 226 279
Economic activity
Employed % 53 17 30 945 1021
Retired % 47 19 34 243 143
Long term sick % 45 31 23 125 108
Unemployed % 46 28 25 169 177
Other % 63 18 19 62 99
Area deprivation
Most deprived (80th
centile
or above): England,
Scotland and Wales
% 53 25 22 523 490
Less deprived area % 50 17 33 974 1002

38 NatCen Social Research | Follow-up study of loyalty card customers
Table A2.10 Change in number of other gambling activities undertaken in
past four weeks, by change in machine participation Change in number of other
gambling activities
undertaken in past four
weeks
Change in past four week participation on machines in
bookmakers
Stable:
gambled on
machines at
baseline and
follow-up
Stable: did not
gamble on
machines at
baseline and
follow-up
Starters:
gambled on
machines at
follow-up but
not baseline
Stoppers:
gambled on
machines at
baseline but
not follow-up
% % % %
3-17 activities fewer at follow-
up
10 11 6 24
2 activities less at follow-up 11 9 3 14
1 less activity at follow-up 17 16 3 17
No change 20 29 27 21
1 activity more at follow-up 15 12 17 13
2 activities more at follow-up 12 15 12 9
3+ activities more at follow-up 15 9 32 2
Bases (unweighted) 1071 147 91 242
Bases (weighted) 876 267 125 282
Table A3.1 PGSI status at baseline by PGSI status at follow-up Base: All respondents
PGSI status at follow-
up
PGSI status at baseline
Non-problem
gambler
Low risk gambler Moderate risk
gambler
Problem gambler
% % % %
Non-problem gambler 71 40 9 7
Low risk gambler 18 41 29 7
Moderate risk gambler 10 17 41 27
Problem gambler 1 2 21 59
Bases (unweighted) 452 343 421 335
Bases (weighted) 444 374 373 359
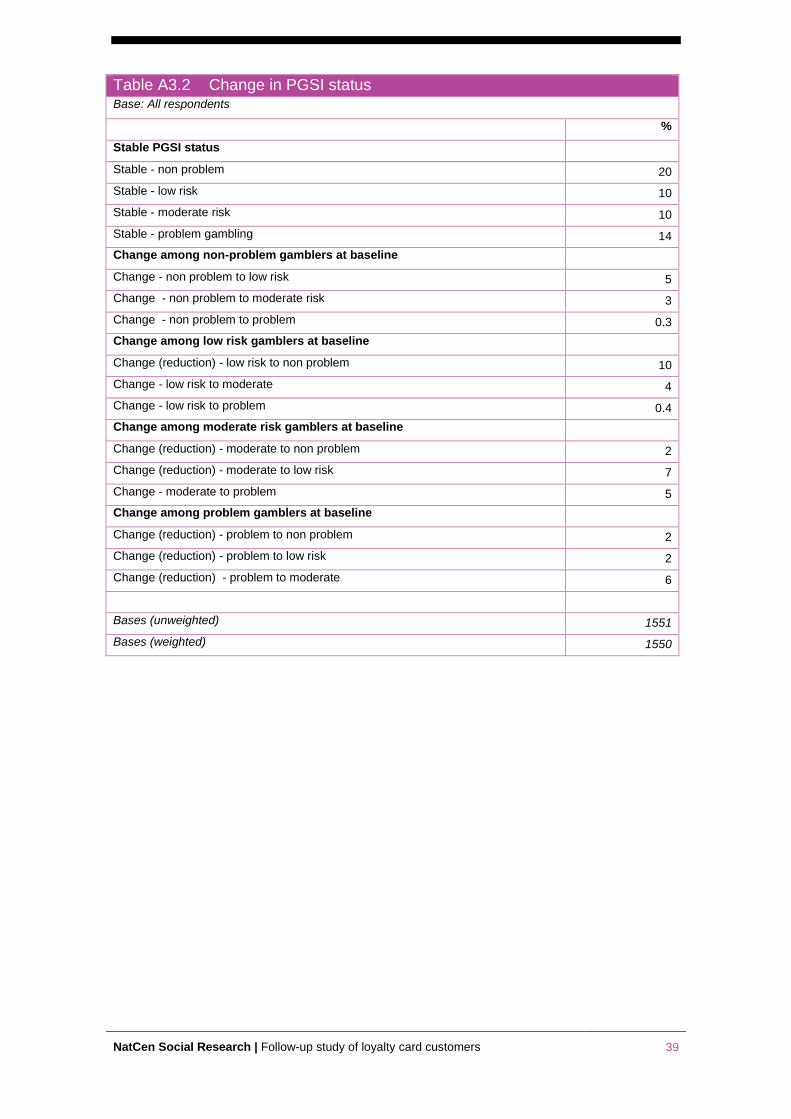
NatCen Social Research | Follow-up study of loyalty card customers 39
Table A3.2 Change in PGSI status Base: All respondents
%
Stable PGSI status
Stable - non problem 20
Stable - low risk 10
Stable - moderate risk 10
Stable - problem gambling 14
Change among non-problem gamblers at baseline
Change - non problem to low risk 5
Change - non problem to moderate risk 3
Change - non problem to problem 0.3
Change among low risk gamblers at baseline
Change (reduction) - low risk to non problem 10
Change - low risk to moderate 4
Change - low risk to problem 0.4
Change among moderate risk gamblers at baseline
Change (reduction) - moderate to non problem 2
Change (reduction) - moderate to low risk 7
Change - moderate to problem 5
Change among problem gamblers at baseline
Change (reduction) - problem to non problem 2
Change (reduction) - problem to low risk 2
Change (reduction) - problem to moderate 6
Bases (unweighted) 1551
Bases (weighted) 1550

40 NatCen Social Research | Follow-up study of loyalty card customers
Table A3.3 Change in PGSI status, by demographic and socio-economic factors Base: All respondents
Change in PGSI status Bases
Stable
PGSI
status
Non-
problem/low
risk: problems
increased
Low risk/
moderate
risk:
problems
decreased
Became
problem
gambler
Stopped
being
problem
gambler
Un-
weighted
Weighted
All % 54 12 19 6 9 1551 1550
Sex
Men % 53 12 19 5 10 1377 1364
Women % 55 11 16 11 7 174 186
Age
18-24 % 56 14 25 .5 5 108 260
25-34 % 51 10 21 7 12 204 348
35-44 % 58 14 14 3 11 245 300
45-54 % 54 11 17 8 10 462 333
55-64 % 51 11 19 11 9 325 208
65+ % 52 19 17 4 8 202 98
Ethnicity
White/White British % 52 13 21 5 8 1322 1271
Asian/Asian British % 71 5 7 5 12 67 88
Black/Black British % 58 9 7 13 14 83 96
Other % 56 12 12 1 19 77 95
Educational
attainment
Degree or higher % 49 15 18 7 11 192 269
Professional
qualification, below
degree level % 46 15 22 5 13 236 253
A-levels or
equivalent % 58 9 24 6 3 201 207
GCSEs or
equivalent % 57 12 17 5 9 435 458
Other/None % 56 11 18 5 11 484 360
Employment
Paid
employment/self
employed
% 52 13 22 5 9 947 1023
Retired % 43 16 20 8 13 244 143
Long-term sick % 56 12 11 10 12 126 108
Unemployed % 63 10 10 4 14 169 177
Other % 66 7 15 8 3 61 97

NatCen Social Research | Follow-up study of loyalty card customers 41
Table A3.4 Change in PGSI status, by demographic and socio-economic factors Change in PGSI status Bases
Stable
PGSI
status
Non-
problem/low
risk: problems
increased
Low risk/
moderate
risk:
problems
decreased
Became
problem
gambler
Stopped
being
problem
gambler
Un-
weighted
Weighted
Personal income
Lowest income
quartile % 58 11 12 9 11 347 345
2nd
% 51 8 28 5 8 293 294
3rd
% 54 12 18 7 10 343 340
Highest income
quartile % 53 15 20 4 8 438 451
Area deprivation
Less deprived
area % 54 11 21 5 9 976 1003
Most deprived
(80th
centile or
above): England,
Scotland and
Wales
% 53 14 16 6 11 524 490

42 NatCen Social Research | Follow-up study of loyalty card customers
Table A3.5 Change in PGSI score, by demographic and socio-economic
factors Base: All respondents
Demographic/socio-
economic factor
Change in PGSI status Bases
No change in
PGSI score
PGSI score
reduced
PGSI score
increased
Unweighted Weighted
Sex
Men % 81 11 7 1377 1364
Women % 83 7 11 174 186
All % 82 11 8 1551 1550
Age
18-24 % 88 6 6 108 260
25-34 % 78 15 7 204 348
35-44 % 83 10 7 245 300
45-54 % 77 12 11 462 333
55-64 % 83 10 7 325 208
65+ % 88 8 4 202 98
Ethnicity
White/White British % 84 10 6 1322 1271
Asian/Asian British % 74 11 15 67 88
Black/Black British % 69 12 18 83 96
Other % 67 14 20 77 95
Educational attainment
Degree or higher % 84 9 7 192 269
Professional qualification,
below degree level % 82 13 5 236 253
A-levels or equivalent % 87 8 5 201 207
GCSEs or equivalent % 80 9 11 435 458
Other/None % 78 15 7 484 360
Employment
Paid employment/self
employed % 83 10 7 947 1023
Retired % 82 11 8 244 143
Long-term sick % 73 15 12 126 108
Unemployed % 72 16 12 169 177
Other % 92 4 4 61 97
Personal income
Lowest income quartile % 74 12 14 347 345
2nd
% 81 9 10 293 294
3rd
% 82 12 6 343 340
Highest income quartile % 85 10 5 438 451

NatCen Social Research | Follow-up study of loyalty card customers 43
Table A3.6 Change in PGSI score, by demographic and socio-economic
factors (continued) Demographic/socio-
economic factor
Change in PGSI status Bases
No change in
PGSI score
PGSI score
reduced
PGSI score
increased
Unweighted Weighted
Area deprivation
Less deprived area % 84 10 6 976 1003
Most deprived (80th
centile
or above): England,
Scotland and Wales
% 77 14 10 524 490
Table A4.1 Odds of becoming a problem gambler, by demographic and
socio-economic factors
Base: All non-problem gamblers at baseline
PGSI status at baseline
Odds ratio Confidence interval
(lower)
Confidence interval
(upper
Age (p<0.001)
18-24 1
25-34 25.9 2.8 238.7
35-44 8.9 0.9 89.2
45-54 34.3 3.5 333.4
55-64 30.8 2.8 337.2
65 and over 8.0 0.5 119.8
Ethnicity (p<0.05)
White/White British 1
Asian/Asian British 1.63 0.39 6.81
Black/Black British 2.75 1.07 7.06
Other 0.20 0.04 1.10
Income (p<0.05)
Lowest income quartile 1
2nd
0.55 0.21 1.42
3rd
0.67 0.30 1.49
Highest income
quartile 0.28 0.11 0.73
Income not known 0.13 0.03 0.53

44 NatCen Social Research | Follow-up study of loyalty card customers
Table A4.2 Odds of becoming a problem gambler, by whether gambled on
machines in bookmakers once a week or more in the last four weeks
Base: All non-problem gamblers at baseline
PGSI status at baseline
Odds ratio Confidence interval
(lower)
Confidence interval
(upper
Machines in
bookmakers (p<0.05)*
Did not do weekly at
baseline
1
Gambled weekly at
baseline 2.29 1.02 5.15
*model included number of activities undertaken weekly at baseline as a control for gambling involvement.
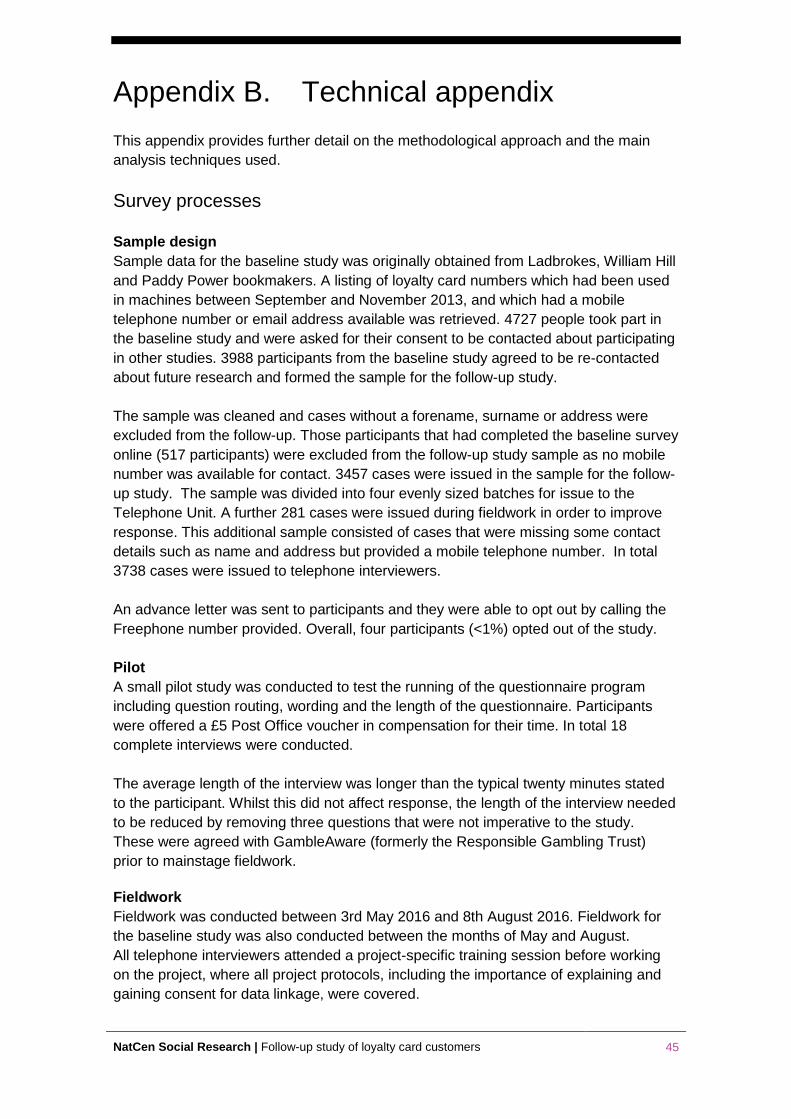
NatCen Social Research | Follow-up study of loyalty card customers 45
Appendix B. Technical appendix
This appendix provides further detail on the methodological approach and the main
analysis techniques used.
Survey processes
Sample design
Sample data for the baseline study was originally obtained from Ladbrokes, William Hill
and Paddy Power bookmakers. A listing of loyalty card numbers which had been used
in machines between September and November 2013, and which had a mobile
telephone number or email address available was retrieved. 4727 people took part in
the baseline study and were asked for their consent to be contacted about participating
in other studies. 3988 participants from the baseline study agreed to be re-contacted
about future research and formed the sample for the follow-up study.
The sample was cleaned and cases without a forename, surname or address were
excluded from the follow-up. Those participants that had completed the baseline survey
online (517 participants) were excluded from the follow-up study sample as no mobile
number was available for contact. 3457 cases were issued in the sample for the follow-
up study. The sample was divided into four evenly sized batches for issue to the
Telephone Unit. A further 281 cases were issued during fieldwork in order to improve
response. This additional sample consisted of cases that were missing some contact
details such as name and address but provided a mobile telephone number. In total
3738 cases were issued to telephone interviewers.
An advance letter was sent to participants and they were able to opt out by calling the
Freephone number provided. Overall, four participants (<1%) opted out of the study.
Pilot
A small pilot study was conducted to test the running of the questionnaire program
including question routing, wording and the length of the questionnaire. Participants
were offered a £5 Post Office voucher in compensation for their time. In total 18
complete interviews were conducted.
The average length of the interview was longer than the typical twenty minutes stated
to the participant. Whilst this did not affect response, the length of the interview needed
to be reduced by removing three questions that were not imperative to the study.
These were agreed with GambleAware (formerly the Responsible Gambling Trust)
prior to mainstage fieldwork.
Fieldwork
Fieldwork was conducted between 3rd May 2016 and 8th August 2016. Fieldwork for
the baseline study was also conducted between the months of May and August.
All telephone interviewers attended a project-specific training session before working
on the project, where all project protocols, including the importance of explaining and
gaining consent for data linkage, were covered.
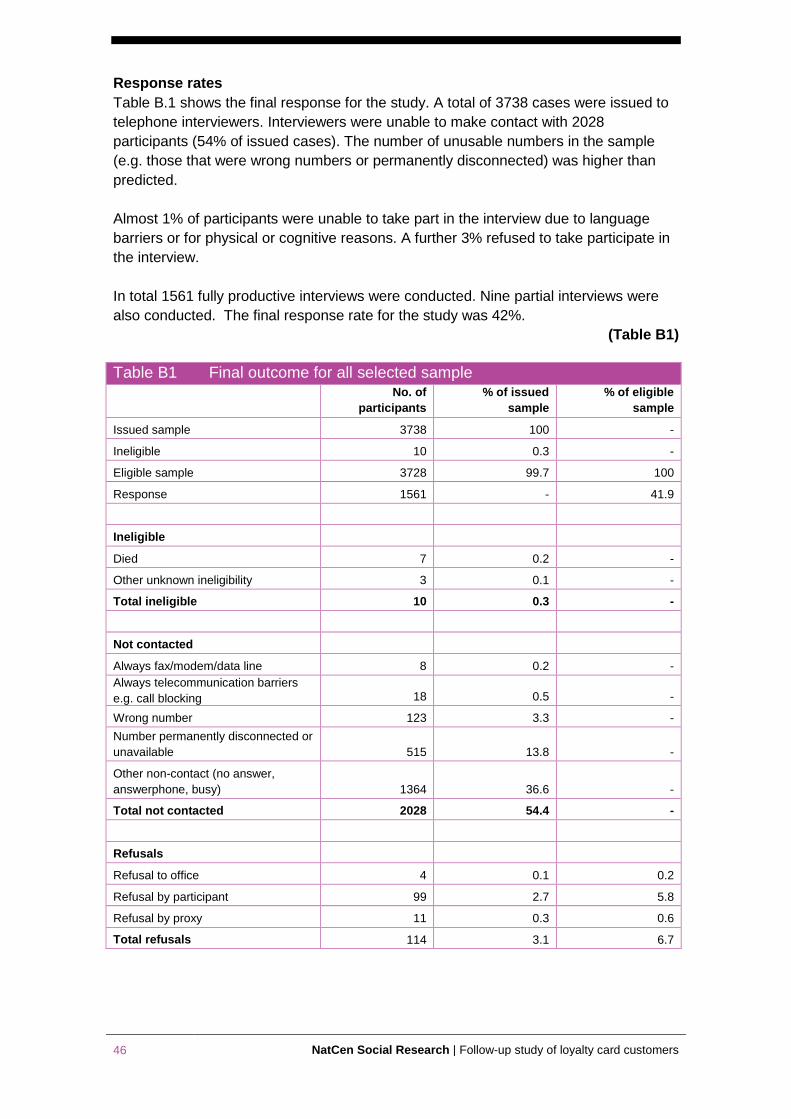
46 NatCen Social Research | Follow-up study of loyalty card customers
Response rates
Table B.1 shows the final response for the study. A total of 3738 cases were issued to
telephone interviewers. Interviewers were unable to make contact with 2028
participants (54% of issued cases). The number of unusable numbers in the sample
(e.g. those that were wrong numbers or permanently disconnected) was higher than
predicted.
Almost 1% of participants were unable to take part in the interview due to language
barriers or for physical or cognitive reasons. A further 3% refused to take participate in
the interview.
In total 1561 fully productive interviews were conducted. Nine partial interviews were
also conducted. The final response rate for the study was 42%.
(Table B1)
Table B1 Final outcome for all selected sample No. of
participants
% of issued
sample
% of eligible
sample
Issued sample 3738 100 -
Ineligible 10 0.3 -
Eligible sample 3728 99.7 100
Response 1561 - 41.9
Ineligible
Died 7 0.2 -
Other unknown ineligibility 3 0.1 -
Total ineligible 10 0.3 -
Not contacted
Always fax/modem/data line 8 0.2 -
Always telecommunication barriers
e.g. call blocking 18 0.5 -
Wrong number 123 3.3 -
Number permanently disconnected or
unavailable 515 13.8 -
Other non-contact (no answer,
answerphone, busy) 1364 36.6 -
Total not contacted 2028 54.4 -
Refusals
Refusal to office 4 0.1 0.2
Refusal by participant 99 2.7 5.8
Refusal by proxy 11 0.3 0.6
Total refusals 114 3.1 6.7

NatCen Social Research | Follow-up study of loyalty card customers 47
Table B2 Final outcome for all selected sample (continued) No. of
participants
% of issued
sample
% of eligible
sample
Other unproductive
Ill/away during survey period 6 0.2 0.4
Physically or mentally unable 7 0.2 0.4
Language barriers 12 0.3 0.7
Total other unproductives 25 0.7 1.5
Productive interviews
Fully productive interview 1552 41.6 90.8
Partial productive interview 9 0.2 0.5
Total productive interviews 1561 41.9 91.3
Weighting
Two weights were computed to adjust the follow-up survey estimates in order to tackle
non-response: one for all participants to the survey at follow-up and the other for those
who agreed to link their responses to other records at follow-up. The weights were
computed using information collected at baseline as well as population information
included in the sample frame. Using this approach we ensure that the distribution of
some key variables in the sample match the population figures or estimates from the
baseline study. To compute these weights we followed a two-step approach: first we
computed a sample weight to make the sample of those issued at follow-up
representative of the population. We computed this sample weight because the cases
excluded from the issue at follow-up were those who did not provide any contact details
and these cases were likely to differ from the participants that completed the
questionnaire. This weight was used as a starting point to calculate final weights
calibrated to the population profile of the baseline study.
The population for this study is defined as all 181,581 loyalty cards which was our total
sampling population. Only anonymized data for these 181,581 loyalty cards were
available to NatCen and people who sign up to loyalty cards for operators agree to their
using these data for a variety of purposes in the terms and conditions.
Sample weight
The sample weight adjusts for the differences between the cases issued at follow-up
and all the participants at baseline. This interim weight was included as the cases not
issued at follow-up were the ones who failed to complete the questionnaire and provide
contact details. Another reason to compute the sample weight, instead of omitting this
step, is that the information from baseline used at the follow-up weight was missing for
most of the cases as they did not through the whole questionnaire (note that the
sociodemographic information is asked at the end of the questionnaire).
To compute this weight we built a logistic regression model using the variables
included in the baseline weighting. The dependent variable was whether the case was
selected for issue at follow-up. The model was weighted by the baseline calibration
weight. The sample weight is equal to the inverse of the probability of being issued.

48 NatCen Social Research | Follow-up study of loyalty card customers
Calibration weights
Calibration weighting was used to weight the participants at follow-up (and those who
agreed to data linkage) back to the population of card holders using the variables
included in the weighting at baseline plus some variables collected at baseline:
operator or the bookmaker where the card was held;
player loss which indicates the money won or lost between September and November;
playing habits which is a combination of three variables: the longest session played (less than 30 minutes; 30 minutes or more); the maximum number of consecutive days they played (less than three days; three or more days); and the average of sessions per day (less than one; one or more). This variable has six categories to measure card holders’ engagement, from low (1) to high engagement (6);
whether the card holder ever staked £100 in a single bet;
PGSI or level of risk of suffering gambling problems;
and sociodemographic information such as age grouped, sex, ethnic minority, economic activity, equivalised income in quintiles, government office region and household type.

NatCen Social Research | Follow-up study of loyalty card customers 49
Appendix C. Regression to the mean
Regression to the mean (RTM) is an issue to be treated carefully with when it comes to
repeated measures such as those used in this project. RTM is best understood as the
consequence of random error in measurement. On first observation, if a measure has
an extreme value in comparison to the true, underlying value, then on second
observation it is much more likely to be closer to the true value than further away. This
phenomenon has consequences for measuring individual as well as group change.
Individuals at the extreme ends of the distribution at the first measure are more likely to
have values closer to the centre of the distribution at second measure. The danger is
misinterpreting this random error as true change.
While regression to the mean amongst some individuals in such a study is almost
inevitable, the key question is to whether this random error is playing a role in the data
as a whole, leading to overinterpretation of results.
Our approach to this issue took two main forms:
Interrogating the data itself for evidence of regression to the mean; and
Conducting the analysis in such a way as to avoid the potential pitfalls of RTM.
In common with Kruse et al (2016), a scatterplot was produced showing the level of
change across the distribution of PGSI scores in the first wave. The classical
manifestation of regression to the mean would indicate greater incidence of reduction
at the top end of the distribution, and increase at the bottom end of the distribution.
This pattern does not appear to hold in our data, particularly among low PGSI scores,
which show less change than the middle of the distribution. It is not clear that there is
any more change at the fringes of the distribution than there is at the centre.
(Figure C1)
This is reinforced by Table A3.1, which breaks down the PGSI scores into four
categories of analysis. What this shows is that there is in fact more stability between
baseline and follow-up at the top and bottom of the distribution than there is in the
middle. 71% of those with no problem at baseline remained in the non-problem
category, along with 59% of problem gamblers remained problem gamblers. This is
compared with 41% of the low and moderate risk categories who stayed the same.
This is counter to what one would expect if regression to the mean was significantly
confounding results.
Nonetheless, as stated above, some mean regression among individuals remains
likely. In order to avoid overinterpretation of random fluctuations in PGSI score, when
analysing changes in scores in Chapter 3, we have defined change as someone whose
score has changed by more than +/- one standard deviation. This is a relatively strict
definition that counteracts the potential for mischaracterising measurement variation as
real change. Regression to the mean causes the greatest problems in a trial scenario
where a treatment has been offered and one wishes to compare follow-up outcomes
between those with extreme scores at baseline compared to others. This type of
analysis has been avoided.

50 NatCen Social Research | Follow-up study of loyalty card customers
Two similar studies to this one (Wiebe et al, 2003 and Kruse et al, 2016), both checked
for evidence of regression to the mean in their data, and, in common with this study,
found no obvious confounding issues.
Figure C1 Change in PGSI score between baseline and follow-up, by baseline
PGSI score

NatCen Social Research | Follow-up study of loyalty card customers 51
Appendix D. References
Breen, H., Hing, N. (2014) Life course analysis of gambling trajectories: an indigenous
Australian Study. International Gambling Studies, 14(3): 357-373.
Kruse, K., White, J., Walton. DK., Tu. D. (2016) Changes in risky gambling prevalence among a New Zealand population cohort, International Gambling Studies, 16:2, 328-346.
LaPlante, D., Nelson, S.E., LaBrie, R., Shaffer, H.J. (2008) Stability and progression of
disordered gambling: Lessons from longitudinal studies. The Canadian Journal of
Psychiatry, 53: 52-60.
LaPlante, D. A., Nelson, S. E., LaBrie, R. A., Shaffer, H. J. (2009). Disordered
gambling, type of gambling and gambling involvement in the British Gambling
Prevalence Survey 2007. European Journal of Public Health, 21(4): 532-537.
LaPlante, D.A., Nelson, S.E., Gray, H (2014) Breadth and depth involvement:
Understanding Internet gambling involvement and its relationship to gambling
problems. Psychology of Addictive Behaviours. 28(2): 396-403.
Reith, G., Dobbie, F. (2013) Gambling careers: a longitudinal qualitative study of
gambling behaviour. Addiction Research and Theory, 21 (5): 376-390.
Slutske, W., Jackson, J., Sher., K. (2003) The natural history of problem gambling
from age 18 to 29. Journal of Abnormal Psychology. 112: 263-274.
Slutske, W., Blaszczynski, A., Martin, G. (2009) Sex differences in the rate of recovery,
treatment seeking, and natural recovery in pathological gambling. Results from an
Australian community-based twin survey. Twin Research and Human Genetics. 12:
425-432.
Vladimirov D, Niemelä S, Auvinen J, Timonen M, Keinänen-Kiukaanniemi s, Ala-
Mursula L, Laitinen J, Miettunen J. 2015. Changes in alcohol use in relation to
sociodemographic factors in early Midlife. Scandinavian Journal of Public Health. 1-9.
Wardle, H., Moody, A., Spence, S., Orford, J., Volberg, R., Griffiths, M., Jotangia, D.,
Hussey, D., Dobbie, F. (2011) British Gambling Prevalence Survey 2010. Gambling
Commission: Birmingham.
Wardle, H., Excell, D., Ireland, E., Iliac, N., Sharman, S., (2014a) Report 2:
Identifying problem gambling: findings from a survey of loyalty card customers.
London: Responsible Gambling Trust.
Wardle, H., Philo, D. (2014) Changes in machine gambling behaviour. Headline
findings from a follow-up study of participants to the Health Survey for England 2012,

52 NatCen Social Research | Follow-up study of loyalty card customers
Scottish Health Survey 2012 and the British Gambling Prevalence Survey 2010.
London: Responsible Gambling Trust.
Wiebe J, Single E, Falkowaski-Ham A (2003) The evolution of problem gambling: a one
year follow-up study. Canada: Responsible Gambling Council.

NatCen Social Research | Follow-up study of loyalty card customers 53
Appendix E. Questionnaire
NOTE: All questions are single code unless otherwise specified
Introduction and eligibility
Good morning / afternoon / evening, my name is [NAME] and I am calling from NatCen
Social Research, the UK’s leading social research institute.
Last year you took part in a survey of bookmaker loyalty card customers. We are
following up on the letter we sent to you to ask for your help with a new study.
The interview varies in length depending on your answers to certain questions. For
most people it will take around 25 minutes. You can skip any question you prefer not to
answer. You will receive a £5 post office voucher as a ‘thank you’ for taking part in the
survey.
Would you like to take part in the interview now?
INTERVIEWER: PLEASE CODE WHETHER TO PROCEED
1 Yes, will take part now
2 Yes, will take part but not available now – make APPOINTMENT
3 No, definitely does not want to take part
{Ask all}
Intro
Thank you for agreeing to take part in this survey. We want to speak to people who
previously took part in a survey about gaming and betting and that have loyalty cards
for a bookmaker so, for example, the Ladbrokes 'The Grid' card or the Paddy Power
'VIP' card.
{Ask all}
{CODE ALL THAT APPLY}
Activity
I'm going to read out a list of activities. Please tell me whether you have spent any
money on any of the following activities in the last 4 weeks that is since {TEXT FILL OF
DATE FOUR WEEK PRIOR TO INTERVIEW},
CODE ALL THAT APPLY
1. Tickets for the National Lottery Draw (including Thunderball and Euromillions
and tickets bought online)
2. Scratchcards (not online, newspaper or magazine scratchcards)
3. Tickets for any other lottery, including charity lotteries
4. The football pools
5. Bingo cards or tickets, including playing at a bingo hall (not online)

54 NatCen Social Research | Follow-up study of loyalty card customers
6. Gaming machines in a bookmaker’s to bet on roulette, poker, blackjack or other
games
7. Fruit or slot machines somewhere else
8. Table games (roulette, cards or dice) in a casino
9. Playing poker in a pub tournament/ league or at a club
10. Online gambling like playing poker, bingo, instant win/scratchcard games, slot
machine style games or casino games for money
11. Online betting with a bookmaker on any event or sport
12. Online betting exchange (This is where you lay or back bets against other
people using a betting exchange. There is no bookmaker to determine the
odds. This is sometimes called 'peer to peer' betting)
13. Betting on horse races in a bookmaker, by phone or at the track
14. Betting on dog races in a bookmaker, by phone or at the track
15. Betting on sports events in a bookmaker, by phone or at the venue
16. Betting on other events in a bookmaker, by phone or at the venue
17. Spread-betting (In spread-betting you bet that the outcome of an event will be
higher or lower than the bookmaker's prediction. The amount you win or lose
depends on how right or wrong you are)
18. Private betting or gambling for money with friends, family or colleagues
19. Another form of gambling in the last 4 weeks
20. None of these
{Ask if ACTIVITY does not include BOOKMACHINES}
Machines12
Have you spent money on machines in a bookmakers in the past 12 months?
1. Yes
2. No
{Ask if have not played any gambling activities in the past 4 weeks (activity) and
machine12 = No or DK or RF}
Gam12
Have you spent money on any gambling activity in the past 12 months?
1. Yes
2. No
Frequency of participation – for all activities undertaken in the last 4 weeks
{Ask if activity = NL}
NLFREQ
In the past 4 weeks, how often have you bought tickets for the National Lottery Draw
(including Thunderball, Euromillions)? This can be from a shop or online. READ OUT
1. Every day/almost every day
2. 4-5 days per week
3. 2-3 days per week
4. About once a week
5. Less than once a week

NatCen Social Research | Follow-up study of loyalty card customers 55
{Ask if activity = sc}
scFREQ
In the past 4 weeks, how often have you bought scratchcards? Please do not include
anything bought online or from a newspaper or magazine. READ OUT
1. Every day/almost every day
2. 4-5 days per week
3. 2-3 days per week
4. About once a week
5. Less than once a week
{Ask if activity = olot}
olotFREQ
In the past 4 weeks, how often have you bought tickets for any other lottery, including
charity lotteries? READ OUT
1. Every day/almost every day
2. 4-5 days per week
3. 2-3 days per week
4. About once a week
5. Less than once a week
{Ask if activity = pools}
poolsFREQ
In the past 4 weeks, how often have you spent money on the football pools? READ
OUT
1. Every day/almost every day
2. 4-5 days per week
3. 2-3 days per week
4. About once a week
5. Less than once a week
{Ask if activity = bingo}
bingoFREQ
In the past 4 weeks, how often have you spent money on bingo cards or tickets (please
do not include online bingo)? READ OUT
1. Every day/almost every day
2. 4-5 days per week
3. 2-3 days per week
4. About once a week
5. Less than once a week
{Ask if activity = bookmachines}
bkmachineFREQ

56 NatCen Social Research | Follow-up study of loyalty card customers
In the past 4 weeks, how often have you spent money on gaming machines in a
bookmakers? READ OUT
1. Every day/almost every day
2. 4-5 days per week
3. 2-3 days per week
4. About once a week
5. Less than once a week
{Ask if activity = fruit}
fruitFREQ
In the past 4 weeks, how often have you spent money on fruit or slot machines? READ
OUT
1. Every day/almost every day
2. 4-5 days per week
3. 2-3 days per week
4. About once a week
5. Less than once a week
{Ask if activity = casino}
casinoFREQ
In the past 4 weeks, how often have you spent money on table games (roulette, cards
or dice) in a casino? Please do not include online casinos. READ OUT
1. Every day/almost every day
2. 4-5 days per week
3. 2-3 days per week
4. About once a week
5. Less than once a week
{Ask if activity = poker}
PokerFREQ
In the past 4 weeks, how often have you spent money playing poker in a pub
tournament/ league or at a club? READ OUT
1. Every day/almost every day
2. 4-5 days per week
3. 2-3 days per week
4. About once a week
5. Less than once a week
{Ask if activity = online}
onlineFREQ
In the past 4 weeks, how often have you spent money gambling online on poker, bingo,
instant win/scratchcard games, slot machine style games or casino games? READ
OUT
1. Every day/almost every day
2. 4-5 days per week

NatCen Social Research | Follow-up study of loyalty card customers 57
3. 2-3 days per week
4. About once a week
5. Less than once a week
{Ask if activity = onbet}
onbetFREQ
In the past 4 weeks, how often have you spent money betting online with a bookmaker
on any event or sport? READ OUT
1. Every day/almost every day
2. 4-5 days per week
3. 2-3 days per week
4. About once a week
5. Less than once a week
{Ask if activity = betex}
betexFREQ
In the past 4 weeks, how often have you spent money betting online on betting
exchanges? READ OUT
1. Every day/almost every day
2. 4-5 days per week
3. 2-3 days per week
4. About once a week
5. Less than once a week
{Ask if activity = horse}
horseFREQ
In the past 4 weeks, how often have you spent money betting on horse races in a
bookmakers, by phone or at the track? Please do not include bets made online. READ
OUT
1. Every day/almost everyday
2. 4-5 days per week
3. 2-3 days per week
4. About once a week
5. Less than once a week
{Ask if activity = dog}
dogFREQ
In the past 4 weeks, how often have you spent money betting on dog races in a
bookmakers, by phone or at the track? Please do not include bets made online. READ
OUT
1. Every day/almost everyday
2. 4-5 days per week
3. 2-3 days per week
4. About once a week
5. Less than once a week

58 NatCen Social Research | Follow-up study of loyalty card customers

NatCen Social Research | Follow-up study of loyalty card customers 59
{Ask if activity = sports}
sportsFREQ
In the past 4 weeks, how often have you spent money betting on sports events in a
bookmakers, by phone or at the track? Please do not include bets made online. READ
OUT
1. Every day/almost every day
2. 4-5 days per week
3. 2-3 days per week
4. About once a week
5. Less than once a week
{Ask if activity = othbet}
othbetFREQ
In the past 4 weeks, how often have you spent money betting on other events in a
bookmakers, by phone or at the track? Please do not include bets made online. READ
OUT
1. Every day/almost every day
2. 4-5 days per week
3. 2-3 days per week
4. About once a week
5. Less than once a week
{Ask if activity = spread}
spreadFREQ
In the past 4 weeks, how often have you spent money spread-betting? READ OUT
1. Every day/almost every day
2. 4-5 days per week
3. 2-3 days per week
4. About once a week
5. Less than once a week
{Ask if activity = private}
privFREQ
In the past 4 weeks, how often have you bet or gambled privately for money with
friends, family or colleagues? READ OUT
1. Every day/almost every day
2. 4-5 days per week
3. 2-3 days per week
4. About once a week
5. Less than once a week
{Ask if activity = other}
othFREQ
In the past 4 weeks, how often have you spent money on other forms of gambling?
READ OUT

60 NatCen Social Research | Follow-up study of loyalty card customers
1. Every day/almost every day
2. 4-5 days per week
3. 2-3 days per week
4. About once a week
5. Less than once a week
{Ask All}
Loyalty
Do you currently have a loyalty card or machine card for any bookmaker’s?
1. Yes
2. No
{If Loyalty =Yes}
Loynum
How many loyalty or machine cards for different bookmaker’s do you have?
Range 1..20
{If Loyalty=Yes}
Loytype
Which loyalty and machine cards do you have? READ OUT
CODE ALL THAT APPLY
1. Ladbrokes ‘The Grid’ card
2. William Hill ‘Linked’ card
3. Paddy Power ‘VIP card
4. Coral ‘Connect’ card
5. Betfred ‘VIP’ card
6. Other loyalty or machine card (please specify)
{If Loytype=other}
LoyOth
Please specify the other type of loyalty or machine card that you have
{Ask if Activity includes Gambling machines in bookmakers (code 6) OR Machines12 =
Yes AND Loyalty=Yes}
Loyfreq
When playing machines at a bookmaker's, how often do you use your loyalty or
machine card? READ OUT
1. Always
2. Most of the time
3. Some of the time
4. Rarely
5. Never

NatCen Social Research | Follow-up study of loyalty card customers 61
Gambling behaviours
{Ask if Activity includes any valid response OR Machines12 = Yes OR Gambling12 =
Yes}
IntroPGSI
I am now going to ask you a set of questions about gambling, please indicate the
extent to which each one has applied to you in the past 12 months
{Ask if Activity includes any valid response OR Machines12 = Yes OR Gambling12 =
Yes}
pgsi1
In the past 12 months, how often have you bet more than you could afford to lose?
READ OUT
1. Almost always
2. Most of the time
3. Sometimes
4. Never
{Ask if Activity includes any valid response OR Machines12 = Yes OR Gambling12 =
Yes}
pgsi2
In the past 12 months, how often have you needed to gamble with larger amounts of
money to get the same excitement? READ OUT
1. Almost always
2. Most of the time
3. Sometimes
4. Never
{Ask if Activity includes any valid response OR Machines12 = Yes OR Gambling12 =
Yes}
pgsi3
In the past 12 months, how often have you gone back to try to win back the money
you'd lost READ OUT
1. Almost always
2. Most of the time
3. Sometimes
4. Never
{Ask if Activity includes any valid response OR Machines12 = Yes OR Gambling12 =
Yes}
pgsi4
In the past 12 months, how often have you borrowed money or sold anything to get
money to gamble? READ OUT
1. Almost always
2. Most of the time

62 NatCen Social Research | Follow-up study of loyalty card customers
3. Sometimes
4. Never
{As if Activity includes any valid response OR Machines12 = Yes OR Gambling12 =
Yes}
pgsi5
In the past 12 months, how often have you felt that you might have a problem with
gambling? READ OUT
1. Almost always
2. Most of the time
3. Sometimes
4. Never
{Ask if Activity includes any valid response OR Machines12 = Yes OR Gambling12 =
Yes}
pgsi6
In the past 12 months, how often have you felt that gambling has caused you any
health problems, including stress or anxiety? READ OUT
1. Almost always
2. Most of the time
3. Sometimes
4. Never
{Ask if Activity includes any valid response OR Machines12 = Yes OR Gambling12 =
Yes}
pgsi7
In the past 12 months, how often have people criticised your betting, or told you that
you have a gambling problem, whether or not you thought it is true? READ OUT
1. Almost always
2. Most of the time
3. Sometimes
4. Never
{Ask if Activity includes any valid response OR Machines12 = Yes OR Gambling12 =
Yes}
pgsi8
In the past 12 months, how often have you felt your gambling has caused financial
problems for you or your household? READ OUT
1. Almost always
2. Most of the time
3. Sometimes
4. Never

NatCen Social Research | Follow-up study of loyalty card customers 63
{Ask if Activity includes any valid response OR Machines12 = Yes OR Gambling12 =
Yes}
pgsi9
In the past 12 months, how often have you felt guilty about the way you gamble or what
happens when you gamble? READ OUT
1. Almost always
2. Most of the time
3. Sometimes
4. Never
{Ask if activity includes bookmachine OR machine12 = yes}
machprob
In the past 12 months, how often have you felt that you might have a problem with your
gaming machine play? READ OUT
1. Almost always
2. Most of the time
3. Sometimes
4. Never
{Ask if Activity includes any valid response OR Machines12 = Yes OR Gambling12 =
Yes}
Arguments
How often in the past 12 months have you had arguments with your family about your
gambling? READ OUT
1. Never
2. Less than monthly,
3. Monthly,
4. Weekly
5. Daily or almost daily
{Ask if Activity includes any valid response OR Machines12 = Yes OR Gambling12 =
Yes}
Expect
How often in the past 12 months have you failed to do what was normally expected
from you because of your gambling? READ OUT
1. Never
2. Less than monthly,
3. Monthly,
4. Weekly
5. Daily or almost daily

64 NatCen Social Research | Follow-up study of loyalty card customers
{Ask if Activity includes any valid response OR Machines12 = Yes OR Gambling12 =
Yes}
Without
How often in the past 12 months have you or someone in your household, had to go
without something you needed, because you spent too much money on gambling?
READ OUT
1. Never
2. Less than monthly,
3. Monthly,
4. Weekly
5. Daily or almost daily
{Ask if Activity includes any valid response OR Machines12 = Yes OR Gambling12 =
Yes}
Change
Thinking about all different types of gambling we’ve just asked you about, in the past
12 months would you say that your overall gambling involvement has increased,
decreased or stayed the same? READ OUT
1. Increased
2. Decreased
3. Stayed the same
{If Change = increased}
ChangeI
Did it increase a little or a lot?
1. A little
2. A lot
{If Change = decreased}
ChangeD
Did it decrease a little or a lot?
1. A little
2. A lot
{If Change = increased}
Whyincrease
Which of the following were the main reasons for your increased gambling
involvement?
READ OUT AND CODE ALL THAT APPLY
1. I‘ve more money to spend now
2. I’ve more time now
3. I’ve more opportunities to gamble
4. Because of family and friends
5. Because I wanted to

NatCen Social Research | Follow-up study of loyalty card customers 65
6. There was a change in my health
7. To support charity
8. I increased gambling following a win
9. I wanted to make money
10. Other
{If Whyincrease=other}
WhyincO
Please specify other reason for increase in gambling
{If Change=decreased}
Whydecrease
Which of the following were the main reasons for your decreased involvement?
READ OUT AND CODE ALL THAT APPLY
1. I have less money to spend now
2. I wanted to save money/spend money on other things
3. I have less time now
4. I have fewer opportunities to gamble
5. I’ve lost interest in gambling
6. My priorities have changed
7. There was a change in my health
8. Other
{If Whydecrease=other}
WhydecO
Please specify other reason for decrease in gambling
{If whyincrease or whydecrease = change in health}
Health
Did your health get better or worse?
1 Got better
2 Got worse.
{Ask all machine players (if activity = 6 or machines12= yes)}
Limits
The next few questions are about your play on machines in bookmakers
In the past 12 months have you set any limits on the amount of money or time you
spend on machines in bookmakers?
1. Yes
2. No
{If Limits = Yes}
Limittype

66 NatCen Social Research | Follow-up study of loyalty card customers
Did you set a limit on the amount of money you spent on machines, the amount of time
you spent or both?
1 Money limits only
2 Time limits only
3 Both
{If Limits = Yes}
Limitfreq
When you played machines in bookmakers, how often did you set money or time limits
on machines? READ OUT
1 Almost always
2 Most of the time
3 Sometimes
4 Rarely/never
{If Limits = Yes}
Limitaction
And when you reached the money and/or time limit that you’d set did you tend to stop
playing the machines or to carry on?
1 Stopped playing
2 Carried on
3 Spontaneous only: it varied
{Ask all machine players (if activity = 6 or machines12= yes)}
Otherlimits
In the past 12 months, has a message appeared on the machine telling you that you’ve
played machines for more than 30 minutes or spent more than £250?
1 Yes
2 No
{If Otherlimits = Yes}
Limitaction2
And when you saw this message did you tend to stop playing the machines or to carry
on?
1 Stopped playing
2 Carried on
3 Spontaneous only: it varied
{Ask all machine players (if activity = 6 or machines12= yes)}
Staff
In the past 4 weeks when playing on machines in bookmakers, has a member of staff
spoken to you about your machine play?
1 Yes
2 No

NatCen Social Research | Follow-up study of loyalty card customers 67
{Ask All} Intro
The next few questions are about you generally and how you think and feel.
{Ask All}
Intro2
I am going to read out a number of statements that may apply to you. Answer the
following statements as honestly as possible. Please tell us how much you agree or
disagree with the following statements. Please tell me if you strongly agree, agree,
neither agree nor disagree, disagree or strongly disagree.
{Ask All}
REI1
I don't like to have to do a lot of thinking. READ OUT
1. Strongly agree
2. Agree
3. Neither agree nor disagree
4. Disagree
5. Strongly disagree
{Ask All}
REI2
I try to avoid situations that require thinking in depth about something. READ OUT (IF
NECESSARY)
1. Strongly agree
2. Agree
3. Neither agree nor disagree
4. Disagree
5. Strongly disagree
{Ask All}
REI3
I prefer to do something that challenges my thinking abilities rather than something that
requires little thought. READ OUT (IF NECESSARY)
1. Strongly agree
2. Agree
3. Neither agree nor disagree
4. Disagree
5. Strongly disagree
{Ask All}
REI4
I prefer complex to simple problems. READ OUT (IF NECESSARY)
1. Strongly agree
2. Agree

68 NatCen Social Research | Follow-up study of loyalty card customers
3. Neither agree nor disagree
4. Disagree
5. Strongly disagree
{Ask All}
REI5
Thinking hard and for a long time about something gives me little satisfaction READ
OUT (IF NECESSARY)
6. Strongly agree
7. Agree
8. Neither agree nor disagree
9. Disagree
10. Strongly disagree
{Ask All}
REI6
I trust my initial feelings about people READ OUT (IF NECESSARY)
1. Strongly agree
2. Agree
3. Neither agree nor disagree
4. Disagree
5. Strongly disagree
{Ask All}
REI7
I believe in trusting my hunches. READ OUT (IF NECESSARY)
1. Strongly agree
2. Agree
3. Neither agree nor disagree
4. Disagree
5. Strongly disagree
{Ask All}
REI8
My initial impressions of people are almost always right. READ OUT (IF NECESSARY)
1. Strongly agree
2. Agree
3. Neither agree nor disagree
4. Disagree
5. Strongly disagree

NatCen Social Research | Follow-up study of loyalty card customers 69
{Ask All}
REI9
When it comes to trusting people, I can usually rely on my "gut feelings." READ OUT
(IF NECESSARY)
1. Strongly agree
2. Agree
3. Neither agree nor disagree
4. Disagree
5. Strongly disagree
{Ask All}
REI10
I can usually feel when a person is right or wrong even if I can't explain how I know
READ OUT (IF NECESSARY)
1. Strongly agree
2. Agree
3. Neither agree nor disagree
4. Disagree
5. Strongly disagree
{Ask All}
IntroBis
For the next set of questions I’m going to ask how often the statement applies to you.
Please tell me whether your answer is rarely or never, occasionally, often or almost
always or always.
{Ask All}
bis1
I don't “pay attention.” READ OUT
1. Rarely or never
2. Occasionally
3. Often
4. Almost always or always
{Ask All}
Bis2
I say things without thinking. READ OUT (IF NECESSARY)
1. Rarely or never
2. Occasionally
3. Often
4. Almost always or always
{Ask All}
Bis3
I act “on impulse.” READ OUT (IF NECESSARY)

70 NatCen Social Research | Follow-up study of loyalty card customers
1. Rarely or never
2. Occasionally
3. Often
4. Almost always or always
{Ask All}
Bis4
I act on the spur of the moment. READ OUT (IF NECESSARY)
1. Rarely or never
2. Occasionally
3. Often
4. Almost always or always
{Ask All}
Bis5
I save regularly. READ OUT (IF NECESSARY)
1. Rarely or never
2. Occasionally
3. Often
4. Almost always or always
{Ask All}
Bis6
I plan for job security. READ OUT (IF NECESSARY)
1. Rarely or never
2. Occasionally
3. Often
4. Almost always or always
{Ask All}
Bis7
I am future oriented. READ OUT (IF NECESSARY)
1. Rarely or never
2. Occasionally
3. Often
4. Almost always or always
{Ask All}
IntroCRT
I am going to read out a number of brief puzzles involving numbers. Please give the
numerical answer that you think is the correct solution. You do not need a pen and
paper. Please give me the answer you have worked out in your head. You will have
one minute to answer each question. I will let you know when the time is up.

NatCen Social Research | Follow-up study of loyalty card customers 71
INTERVIEWER INSTRUCTION: You may repeat each question up to 3 times. The
participant will have one minute to answer each question. The countdown timer will
indicate when one minute has passed.
{Ask All}
CRT1
A bat and a ball cost £1.10 in total. The bat costs £1.00 more than the ball. How much
does the ball cost?
INTERVIEWER INSTRUCTION: Please record answer in pounds and pence e.g. if
participant answers 20 pence then record as 0.20 using a decimal point. If participant is
unable to answer question please record as don’t know.
0..100.
{Ask All}
CRT2
If it takes 5 machines 5 minutes to make 5 widgets, how many minutes would it take
100 machines to make 100 widgets?
INTERVIEWER INSTRUCTION: If participant is unable to answer question please
record as don’t know.
0..1000
{Ask All}
CRT3
In a lake, there is a patch of lily pads. Every day, the patch doubles in size. If it
takes 48 days for the patch to cover the entire lake, how many days would it take
for the patch to cover half of the lake?
INTERVIEWER INSTRUCTION: If participant is unable to answer question please
record as don’t know.
0..100
Demographics
{Ask All}
Demintro
I am now going to ask you a few questions about yourself
{Ask All}
Introwell
I would like to ask you four questions about your feelings on aspects of your life. There
are no right or wrong answers. For each of these questions I’d like you to give an
answer on a scale of nought to 10, where nought is ‘not at all’ and 10 is ‘completely’.

72 NatCen Social Research | Follow-up study of loyalty card customers
{Ask All}
Satis
Overall, how satisfied are you with your life nowadays? Interviewer instruction: where
nought is ‘not at all satisfied’ and 10 is ‘completely satisfied’
: 0…10
{Ask All}
Worth
Overall, to what extent do you feel that the things you do in your life are worthwhile?
: 0…10
{Ask All}
Happy
Overall, how happy did you feel yesterday?
:0…10
{Ask All}
Anxious
On a scale where nought is ‘not at all anxious’ and 10 is ‘completely anxious’, overall,
how anxious did you feel yesterday?
: 0…10
{Ask All}
Lifevents
I’m going to read out a list of events, please can you tell me which, if any, you have
experienced in the past 12 months?
1. Got married
2. Got divorced or separated from a long term partner
3. Had children/new family additions
4. Children left home
5. Experienced the death of someone close to you
6. Retired
7. Lost your job/was made redundant
8. Started work/employment
9. Started full time education
10. Experienced trouble at work with colleagues/boss
11. Experienced legal difficulties
12. Major changes to your financial situation
13. Experienced major illness or injury
14. Took on mortgage or large loan
15. Moved house
16. Moved city or town
17. None of these
{If lifevents = major changes to my financial situation}

NatCen Social Research | Follow-up study of loyalty card customers 73
Finance
Did your financial situation get better or become worse?
1. Got better
2. Got worse
{Ask All}
Genhealth
How is your health in general, would you say it is…
1. Very good
2. Good
3. Fair
4. Bad
5. Very bad?
{Ask All}
Age
What is your age?
RANGE: 18...100
{Ask All}
Sex
Are you male or female?
1. Male
2. Female
{Ask All}
Marstat
Are you…READ OUT…
1. Single, that is never married
2. Married and living with husband/wife
3. A civil partner in a legally recognised civil partnership and living with your
partner
4. Married and separated from [wife] / [husband]
5. Divorced
6. Widowed
7. SPONTATEOUS ONLY – civil partner – separated
8. SPONTANTEOUS ONLY – civil partner – partnership legally dissolved
9. SPONTANTEOUS ONLY – civil partner – widowed.
{Ask All}
Econact
In the last 7 days were you mainly: READ OUT
1. Working as an employee (or temporarily away)

74 NatCen Social Research | Follow-up study of loyalty card customers
2. On a government sponsored training scheme
3. Self-employed or freelance
4. Doing other paid work
5. Retired
6. A student
7. Looking after the home or family
8. Long-term sick or disabled
9. None of these
{Ask All}
Topqual
Can you tell me the highest educational qualification you have obtained? Is it.. READ
OUT…
1. Degree or higher
2. Professional qualification below degree level
3. A-levels or equivalent
4. GCSE/O-levels or equivalent
5. Other
6. None
{Ask All}
WIntro
I am now going to ask you some questions about your income.
{Ask All}
WIncBW
Thinking of your own personal income from all sources, before any deductions for
income tax, National Insurance, and so on, is it £26,000 per year or more?
1. Yes
2. No
{Ask if WIncBW=Yes}
WIncUp
And is it £40,000 per year or more?
1. Yes
2. No
{Ask if WIncUp=Yes}
WincUp1
And is it…
1. Between £40,000 and £46,799
2. Between £46,800 and £51,999
3. £52,000 or more
{Ask if WIncUp=No}
WIncUp2

NatCen Social Research | Follow-up study of loyalty card customers 75
And is it…
1. Between £26,000 and £31,199
2. Between £31,200 and £36,399
3. Between £36,400 and £39,999
{Ask if WIncBW=No}
WIncDw
Is it less than £10,400 per year?
1. Yes
2. No
{Ask if WIncDw=Yes}
WincDw1
And is it…
1. Up to £2,599
2. Between £2,600 and £5,199
3. Between £5,200 and £10,399
{Ask if WIncDw=No}
WIncDw2
And is it…
1. Between £10,400 and £15,599
2. Between £15,600 and £20,799
3. Between £20,800 and £25,999
{Ask All}
hhold
Do you live with other people?
1. Yes
2. No
{Ask if hhold = yes}
{CODE ALL THAT APPLY}
Hhold2
Who else do you live with?
1. Spouse or partner
2. Your own children under the age of 16
3. Your own children over the age of 16
4. Other children under the age of 16
5. Other adult family members
6. Other adults - non family members
{Ask if who = childu16}
howmanyC16

76 NatCen Social Research | Follow-up study of loyalty card customers
How many of your own children under the age of 16 do you live with?
RANGE: 1...15
{Ask if who = childO16}
howmanyO16
How many of your own children over the age of 16 do you live with?
RANGE: 1...15
{Ask if who = childOth}
howmanyOC
How many other children do you live with?
RANGE: 1...15
{Ask if who = Other adult family members}
howmanyOa
How many other adult family members do you live with?
RANGE: 1...15
{Ask if who = Other adults – non family members}
howmanyOn
How many other adults do you live with?
RANGE: 1...15
Data linking and final questions
{Ask All}
Link
Thanks for all the information you've given us so far.
{If Loyalty=Yes}
You mentioned that you sometimes use a loyalty card for a bookmakers.
In order to make your survey responses even more useful, we'd like to link your survey
answers to information from the bookmaker's loyalty card records. This is so that we
can see how play varies for different types of people.
We will only use this for research purposes; your personal details will be kept
completely confidential. All information will be treated in line with the Data Protection
Act
Are you happy for us to link your survey answers with loyalty card records?
IF NECESSARY: What data do we mean?

NatCen Social Research | Follow-up study of loyalty card customers 77
The information we are talking about is information recorded by the machine about the
amount staked, the length of time spent playing, games played, amount won etc.
Each machine records all of this data for each transaction - this is completely
anonymous
IF NECESSARY: Why are we doing this?
The machine gives us more accurate information than asking people can. For example
if we asked you how much time you spent playing gaming machines in the past 6
months, it is likely that you will not accurately remember, whereas the machine records
the exact amount of time.
IF NECESSARY: What will we do with the data once we've linked it?
We will use the data to look at your survey answers about your machine play and other
types of gambling activity etc, and compare this with the machine data on your length
of play, type of games played, amount spent etc. This will give us an accurate overall
picture of machine play for one person - we will then do the same with lots of other
people to build up an overall picture of different types of machine play.
1. Yes
2. No
{If Link=Yes}
To link your data to your loyalty card records I need to collect some details about you.
LinkDOB
What is your date of birth? Please can you give me the day, month and full year.
{If Link=Yes}
Linkname
What is your first name?
String[50]
{If Link=Yes}
Linksurname
What is your surname?
String[50]
{If Link=Yes}
LinkPCode
What is your postcode?
String[50]

78 NatCen Social Research | Follow-up study of loyalty card customers
{If provided name and postcode at Link}
Address2
We would like to send you a £5 post office voucher as a thank you for taking part in the
survey. To do this, I need your name and address details. I've got your name recorded
as Linkname Linksurname and your postcode recorded as LinkPCode
{if Link=No}
Address2
We would like to send you a £5 post office voucher as a thank you for taking part in the
survey. To do this, I need your full address
{Ask All}
Forename2
Please enter your first name
String[50]
{Ask All}
Surname2
Please enter your surname
String[50]
{Ask All}
Address1a
First line of address
String[100]
{Ask All}
Address2a
Second line of address
String [100]
{Ask All}
Address3a
Town or city
String[100]
{Ask All}
Postcode2
Postcode
String[100]

NatCen Social Research | Follow-up study of loyalty card customers 79
{Ask All}
IF any (Address1-Postcode) is empty, DK, RF THEN
AddCheck
Without your full address details, we won’t be able to send your £5 thank you voucher
to you. Please press PREVIOUS to enter your details.
{Ask All}
Home
Is this your home address?
1. Yes
2. No
{Ask All}
Recontact
If at some future date we wanted to talk to you further, may we contact you to see if
you are willing to help us again?
1. Yes
2. No
{Ask All}
END
That's the end of the questionnaire, thank you for your time.