fog spatial distributions over the central namib desert
TRANSCRIPT

Fog spatial distributions over the Central Namib Desert - an isotope approach
Kudzai Farai Kaseke1, Chao Tian1, Lixin Wang1*, Mary Seely2, 3, Roland Vogt4, Theo Wassenaar3, Roland Mushi3
1 Department of Earth Sciences, Indiana University-Purdue University Indianapolis, Indianapolis, IN 46202, USA
2 Desert Research Foundation of Namibia, 7 Rossini Street, Windhoek, Namibia 3 Gobabeb Research and Training Centre, Walvis Bay, Namibia
4 Research Group Meteorology, Climatology, and Remote Sensing, University of Basel, Basel, Switzerland
Abstract
Fog is a characteristic feature of the Namib Desert and is essential to life in this fog dependent system. It is often acknowledged that advective fog is the dominant fog type over the Namib Desert fog-zone but recent evidence suggests that other fog types occur in this area. Knowledge of the existence and spatial distribution of different fog types will enhance the mechanistic understanding of fog formation and potential changes in this region, but such knowledge is limited in literature. In this study, we investigated fog spatial variations within the Namib Desert fog-zone by applying stable isotope (δ18O and δ2H) techniques to differentiate various fog types and identify their source waters. Isotope based results showed that at least three types of fog (advective, radiation and mixed) occurred in this region and what appears as a single fog event may include all three types. Results suggest that radiation fog was the dominant fog type during our study period. The results also suggest that advective fog (with Atlantic Ocean origins) either dissipated 30-50 km inland and the residual humidity combined with locally derived moisture to form mixed fog or advective fog incorporated local moisture along its trajectory inland resulting in mixed fog. Fog in the Namib Desert was consistently depleted in 18O and 2H compared to rainfall and this was attributed to sub-cloud evaporation of the rainfall as well as different sources of fog and rainfall. Sub-cloud evaporation led to enrichment of 18O and 2H in rainfall beyond that of the first stage condensate, fog. Advective fog is often considered the architect of the fog-zone in the Namib Desert, but our results demonstrated multiple dominant fog types during the study period, suggesting knowledge of both fog frequency and fog type is needed to better predict climate change impacts on the fog-zone.
Keywords: Advective; Climate change; Ecohydrology, Isotopes; Mixed; Radiation; δ18O; δ2H
___________________________________________________________________
This is the author's manuscript of the article published in final edited form as:Kaseke, K. F., Tian, C., Wang, L., Seely, M., Vogt, R., Wassenaar, T., & Mushi, R. (2018). Fog Spatial Distributions over the Central Namib Desert-An Isotope Approach. Aerosol and Air Quality Research, 18(1), 49-61.http://dx.doi.org/10.4209%2faaqr.2017.01.0062

2
INTRODUCTION
Non-rainfall waters (e.g., fog and dew) are the least studied hydrological components in most
ecosystems. However, these non-rainfall water components play an important role in ecosystem
dynamics and are particularly important for water-limited ecosystems (Wang et al., 2016). In arid
ecosystems, non-rainfall waters can exceed rainfall and can be the sole source of water for plants
(Agam and Berliner, 2006), thus the ecophysiology of these organisms is geared towards
obtaining non-rainfall waters (Henschel and Seely, 2008).
According to Byers (1959), it is challenging to provide an exact definition of fog because fog
formation occurs under a variety of conditions and is dependent on the observer’s perspective and
research interests (George, 1951; Tardif and Rasmussen, 2007). However, for practical purposes,
fog is defined as the suspended water droplets or ice crystals that are near the surface and lead to
horizontal visibility below 1 km (WMO, 1992). Fog formation is influenced by thermodynamic
or radiative cooling, aerosol concentration, microphysical processes and surface conditions
(Gultepe et al., 2007a), thus classification is often based on different combinations of these
factors. George (1951) restricted fog classification to six categories: advection, radiation
(restricted heating or air drainage), advection-radiation, pre-warmfrontal and mixed radiation.
However, given the location of the Central Namib Desert (the region of interest in this study), the
first three categories are of interest, thus we present general definitions of these categories.

3
Advective fog is formed in one area and transported to the site of interest (Degefie et al., 2015).
Radiation fog is formed from radiative cooling of stagnant air close to the surface (Gultepe et al.,
2007b). Advection-radiation fog occurs in coastal areas and is formed from the advection of
moist air inland during daylight hours followed by radiative cooling (Ryznar, 1977).
Fog has been recognized as an important component of hydrologic and nutrient cycling in
forest ecosystems of coastal areas (Weathers and Likens, 1996; Dawson, 1998; Wang et al.,
2016). It is often assumed that fog in these coastal regions is advected from the ocean and the
majority of authors agree that advective sea fog dominates the south-west coast of Africa (Seely,
1979; Olivier, 2004; Jacobson et al., 2015). The most visible impacts of this advective fog on
ecophysiology in the Namib Desert are thought to extend about 60 km inland, a region known as
the fog-zone (Seely, 1979; Lancaster, 1984; Olivier, 1995). However, recent studies show that
other fog types may be a regular occurrence in the Namib fog-zone, especially along ephemeral
rivers and other low laying areas (Eckardt et al., 2013; Kaseke et al., 2017). Therefore we could
be under-estimating the significance of other fog types, which hinders the understanding of the
potential impact of global climate change on these fog dominated environments.
Despite the ecohydrological significance of fog to many arid and semi-arid ecosystems, coastal
regions and tropical montane forests (Schemenauer and Cereceda, 1991; Dawson, 1998; Ebner et
al., 2011; Nørgaard et al., 2012), we still do not fully understand the spatial variation and/or

4
origin of fog in these environments. Cereceda et al. (2002) suggests advective fog in the Atacama
Desert dissipates and persists as an area of high humidity, which can be transported further inland.
If the high humidity is radiatively cooled, it can result in localized condensation and forms
radiation fog (some would call it advection-radiation fog (George, 1951; Ryznar, 1977)).
Alternatively, inland fog could be generated from condensation of localized evaporation from the
salt flats of the Atacama Desert and classified as radiation fog (Cereceda et al., 2002). The inland
fog could also be generated from possible mixing of different air masses to form mixed fog
(Degefie et al., 2015). Therefore, in addition to the traditional fog classification techniques, there
is a critical need for an objective method that will enable reliable fog differentiation over a large
geographic area.
Stable isotopes are one of the best tools available to trace fog water movement because isotope
fractionation imparts unique signatures that can be used as environmental tracers (Ingraham and
Matthews, 1988). Over the years, stable isotopes have been successfully applied to different fog
studies and have shown that in some environments fog contributes to groundwater recharge
(Ingraham and Matthews, 1988, 1990; Scholl et al., 2002) and vegetation water use (Dawson,
1998; Limm et al., 2009; Simonin et al., 2009). Although the spatial variation of fog has been
investigated at some sites (Tardif and Rasmussen, 2007; Bari et al., 2016), the classification
methods are often based on subjective algorithms. As George (1951) points out that there will

5
always be exceptions to classification based on meteorology or aviation forecasting. Here we
utilize a classification system based on the isotope approach composed of three fog classes:
advective (externally sourced), radiation (locally generated), mixed fog (advection + radiation).
The objectives of this study were to identify the fog classes of each fog event at multiple sites,
identify source waters of different fog types during each fog event and understand the spatial
distribution of these fog types within the Namib Desert.
METHODS
Site description
This study was conducted in the central Namib Desert located on the south-western edge of the
summer rainfall zone (Schulze, 1969) (Fig. 1). The central Namib Desert receives less than 25
mm annual rainfall (Eckardt et al., 2013), while the western half receives less than 12 mm
(Henschel and Seely, 2008), resulting in an east-west decreasing rainfall gradient (Lancaster,
1984; Hachfeld et al., 2000). Fog occurs throughout the year but peak seasons differ between the
coast and the interior. The peak fog season for the coast is winter while that for the interior is
summer. However, the greatest fog intensity for all sites is between June and July (Lancaster,
1984). There is a west-east gradient with decreasing fog frequency (Lancaster, 1984). Rainfall
and groundwater availability are often the primary determinants of species distribution in the
Namib Desert (Schachtschneider and February, 2010), with large trees confined to the eastern

6
edge of the desert and along ephemeral water courses (Burke, 2006) where they access the
shallow alluvial aquifers (Lange, 2005). The sampling sites were located between the Swakop
and Kuiseb ephemeral rivers (Fig. 1).
[Figure 1 here]
Fog samples were collected from a total of 13 stations. Eight stations were part of the Southern
African Science Service Centre for Climate Change and Adaptive Land Management
(SASSCAL) or FogNet (FN) project, while the remaining five were temporary stations (Fig. 1
and Table S1). The FN stations were equipped with automated meteorological instrumentation
along with a passive cylindrical fog collector facilitating fog collection and correlation with local
meteorological conditions (Fig. 1). Data was recorded at hourly intervals from the FN stations
and consisted of wind speed, air temperature, soil temperature (10 cm depth), rainfall, relative
humidity (RH) and leaf wetness. Because atmospheric pressure was only recorded at Coastal
MET FN and Vogelfederberg FN stations, specific humidity was only computed for these two
stations. Each temporary station (station 1 to 5) consisted of a passive flat fog collector (1m2)
after Schemenauer and Cereceda (1994) and was established primarily to increase spatial
sampling coverage. The total area covered by all fog stations was about 1700 km2 and a roundtrip
visit was about 250 km (Fig. 1). Fieldwork was conducted from the 9th June – 22nd June 2016 and
involved daily site visits to all stations to inspect and collect fog samples (Fig. 1). Fog events

7
were identified by the presence of sample in the fog collectors. At the FN stations this was in
conjunction with wetness recorded on the leaf wetness sensor (0.1 m). The leaf wetness data
enabled determination of the duration of the fog event and associated meteorological conditions.
Fog samples were transferred into 15 ml Qorpak clear French square bottles with black phenolic
polycone lined caps, labelled appropriately with the sample type, location and date and stored at
the Gobabeb Research and Training Centre (Gobabeb), until they were shipped to Indiana
University-Purdue University Indianapolis (IUPUI) Ecohydrology Lab for isotope analysis.
We used a Triple Water Vapor Analyzer (Los Gatos Research Inc., Mountain View, CA,
USA), for isotopic analysis with a precision of 0.2‰ δ18O and 0.8‰ δ2H similar to those reported
elsewhere (Wang et al., 2009). Data was reported in δ notation relative to VSMOW-SLAP scale
as
, (1)
where Rsample and RVSMOW are the molar ratios of heavy to light isotopes (2H/H or 18O/16O) of the
sample and international standard - Vienna Standard Mean Ocean Water (VSMOW).
Differentiation of fog sources based on isotopes
Isotope fractionation imparts unique signatures on meteoric water that can be combined with
deuterium excess, defined as d = δ2H – 8 x δ18O (Dansgaard, 1964), to determine source origins
and evaporative conditions (Merlivat and Jouzel, 1979). Because fog is a first-stage condensate

8
controlled by equilibrium fractionation processes, it should plot on a meteoric water line
reflecting its origins (Gonfiantini and Longinelli, 1962; Majoube, 1971; Stewart, 1975; Jouzel,
1986). We thus assumed fog formed from oceanic vapour would plot on the global meteoric
water line (GMWL), fog formed from local meteoric waters on the local meteoric water line
(LMWL) and fog formed from a mixture of the two air masses would plot between the two
meteoric water lines (Kaseke et al., 2017). Since transpiration and equilibrium fractionation do
not alter d (Dansgaard, 1964; Gat, 2005), fog d derived from transpired vapor would be similar to
LMWL d, while advective d would be similar to that of GMWL, +10‰. However, because
evaporation increases d of vapor relative to evaporating water (Salati et al., 1979; Gat and Matsui,
1991), fog formed from evaporated vapor should have a larger d than the LMWL. Therefore if
radiation fog plots on the LMWL we assume it did not undergo evaporative enrichment after
formation. If its d is smaller or equal to the LMWL d, this suggests transpiration is the main
vapor transport pathway and transpired vapor is used for fog formation. If its d is larger than the
LMWL, this suggests a significant contribution of vapor from evaporation of local water sources.
Admixture of different air masses will lead to significantly greater d compared to LMWL d (Gat
and Matsui, 1991; Martinelli et al., 1996; Liu et al., 2007), thus we expect mixed fog d to have a
larger d than LMWL. From Kaseke et al. (2017), despite being transported 60 km inland,
advective fog plotted around the GMWL and had an isotopic composition similar to that sampled

9
from the coast. Therefore, we should be able to identify advective fog isotopically from all
sampling sites as the furthest sites were located about 60 km inland (Fig. 1).
Because the stations were remote and receive similar amounts of rainfall, typically less than
20 mm annual rainfall (Henschel and Seely, 2008), defining a LMWL for each site would be
challenging. Instead, we assumed similar meteorological conditions across the sites given their
close proximity (Fig. 1). This assumption enabled the application of the LMWL defined for
Gobabeb, δ2H = 7.01 x δ18O - 0.6 (Kaseke et al., 2017), to all sites. This LMWL was generated
from precipitation, ephemeral water and groundwater samples obtained from Gobabeb (2014 -
2015) and excluded fog and dew. Because transpiration is non-fractionating, transpired vapor is
isotopically similar to source waters (Wang et al., 2010; Wang et al., 2012), hence groundwater
was included to the LMWL to account for possible vegetation groundwater uptake along the
riverbeds (Fig.1).
Trajectory analyses
All FN stations received rainfall on the 6th and 7th June 2016, supporting the assumption of
similar meteorological conditions across sites (Table 1). Hybrid Single Particle Lagrangian
Trajectory Model (HYSPLIT) (Stein et al., 2015) was used to model the origin of these rain
events for each of the FN stations. Based on the data from each FN station, we calculated
dewpoint temperature (Berry et al., 1945) at the start of the rainfall event at each station. We used

10
this value to calculate an approximate cloud height, lifted condensation level (LCL), for the rain
event at the station. The back-trajectory of the rain producing air-mass was then computed based
on the LCL to identify origins (Soderberg et al., 2013). However, because there may be
microclimatological differences among sites, we analysed air temperature, soil temperature and
RH among sites and classified the sites into two groups: northern (Coastal MET, Kleinberg,
Station 3, Station 4, Sophies Hoogte and Marble Koppie) and southern sites (Vogelfederberg,
Station 8, Aussinanis, Gobabeb, Station 1, Station 2 and Station 5,) (Fig. 1). Statistical analysis
was performed in PAST 3 (Paleontological Statistics, Natural History Museum, University of
Oslo), with parametric methods for normally distributed data and non-parametric methods for
non-normally distributed data.
RESULTS AND DISCUSSION
Classification of fog on the 10th June 2016
Sufficient sample for isotopic analysis on the 10th June 2016 was obtained from eleven of the
twelve sites (station 5 was not set up yet). Nine of these fog samples plotted on the LMWL,
suggesting they were derived from local meteoric waters (Fig. 2). These samples were defined by
the regression line δ2H = 6.17 x δ18O – 1.2 and we did not find any significant differences in
either slope or intercept between the fog line and LMWL (One-Way ANCOVA, p > 0.05). There
were also no significant differences between fog d (-0.9‰ ± 1.2) and LMWL (+3.6‰ ± 8.8)

11
(One-way ANOVA, Welch F test p > 0.05), thus we concluded these samples were generated
entirely from local meteoric waters, radiation fog (δ18O (-0.2‰ ± 0.4), δ2H (-2.4‰ ± 2.7) and d (-
0.9‰ ± 1.2) (n = 9)) (Fig. 2 and Fig. 3) (Kaseke et al., 2017).
The remaining fog samples plotted between the GMWL and LMWL, suggesting admixture of
different air masses (Gat and Matsui, 1991; Martinelli et al., 1996; Liu et al., 2007), mixed fog
(Kaseke et al., 2017) (Fig. 2). However, the Aussinanis sample plotted to the right of the mixed
fog line suggesting evaporative enrichment of the sample (Fig. 2). The enriched isotopic
composition and low d (-1.8‰) of the Aussinanis sample relative to other samples was consistent
with this conclusion (Table S1). Therefore we did not characterize mixed fog because the
Gobabeb fog sample was the only unevaporated mixed fog sample, d (+5.5‰). Both mixed fog
and radiation fog require similar conditions for formation e.g., radiative cooling and calm winds
(< 2.5 m/s) (Roach et al., 1976; Meyer and Lala, 1990; Tardif and Rasmussen, 2007), conditions
that were prevalent during the fog events at all sites (Table S2). However, there was a noticeable
difference in the degree of radiative cooling and RH during the fog event between the mixed fog
sites and the radiation fog sites. Mixed fog sites had a 6.5°C temperature drop with 94.6% RH
while radiation fog sites had a 3.2°C temperature drop with 98.8% RH (Table S2). The dominant
wind direction was variable among sites indicating micro-climatological differences (Table S2).
[Figure 2 here]

12
[Figure 3 here]
Kaseke et al. (2017) attributed radiation fog around Gobabeb to local evapotranspiration from
the ephemeral Kuiseb River and/or recent rainfall. Vegetation is restricted to ephemeral water
courses and the eastern edge of the Namib Desert (Burke, 2006). Therefore, radiation fog
originating from groundwater would be restricted to sites along the ephemeral rivers e.g., Stations
1, 2, 5 and Gobabeb, while that from rainfall would be widespread but generally restricted to
topographic lows e.g., inter dunes (Eckardt et al., 2013) (Fig. 1). Given the location of the study
area, between two ephemeral rivers, transpiration of groundwater by ephemeral vegetation could
be a source of moisture that generated this fog. This would account for the similarity between
radiation fog d and LMWL. However, because the area received rainfall on the 6th and 7th June
(Table 1 and Fig. S1), the high soil moisture coupled with conducive micro-climatological
conditions at each site could also account for the formation of radiation fog over such a large area
(Fig. 3). Therefore, radiation fog on the 10th June 2016 could have been derived from either the
soil evaporate and/or transpired vapor from the ephemeral rivers. The groundwater isotopic
composition of the Swakop River (Marx, 2009) plotted on the LMWL defined for Gobabeb,
suggesting similar sources and conditions (Fig. S2).
[Table 1 here]

13
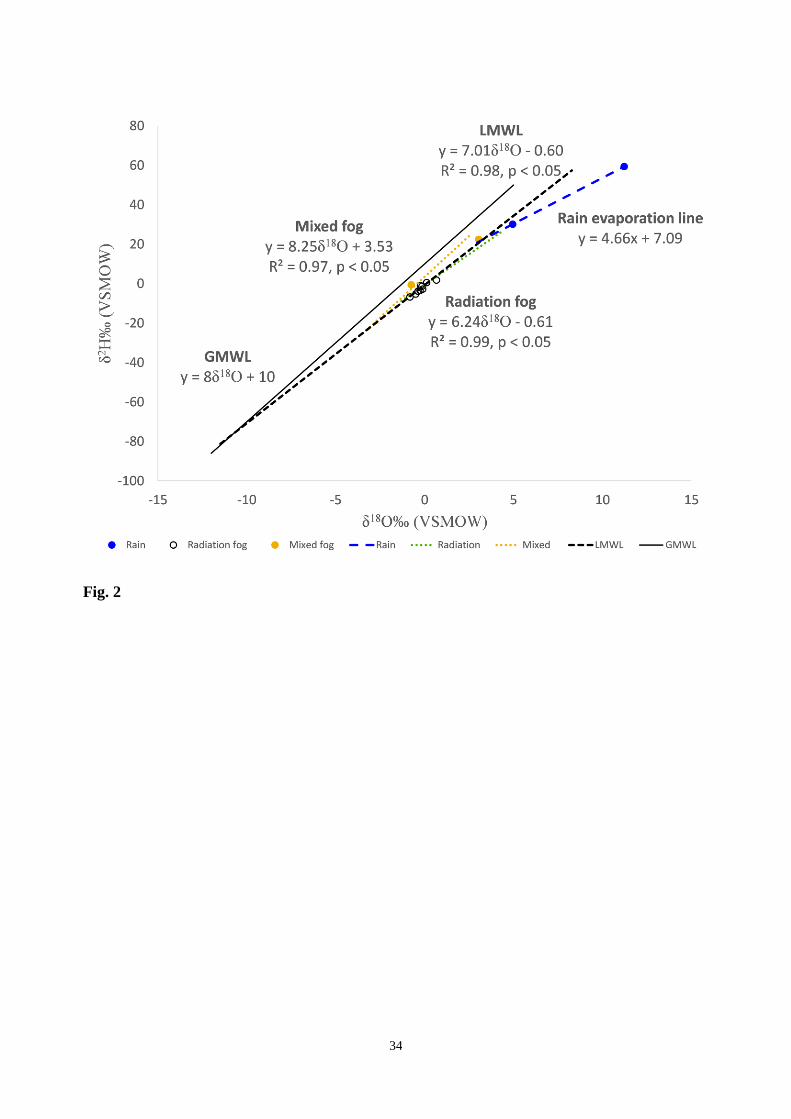
The source isotopic composition of rainfall (δ18O +3.27‰ and δ2H +22.34‰) received on the
6th and 7th June was enriched relative to radiation fog sampled on the 10th June 2016 (Fig. 2). Fog
has been reported to be isotopically enriched relative to local rainfall (if they are from the same
source) because it is a first stage condensate and formed at generally higher temperatures than
rainfall (Gonfiantini and Longinelli, 1962; Ingraham and Matthews, 1988; Scholl et al., 2011).
However, local rainfall can be more enriched isotopically than fog in some arid environments
because sub-cloud evaporation could result in enrichment beyond that observed in the first stage
condensates alone (Kaseke et al., 2017). Backward trajectory analysis of rainfall received on the
6th and 7th June 2016 showed that both rainfall events originated from the Indian Ocean (Fig. 4).
The rain isotopic composition was consistent with enrichment predictions due to sub-cloud
evaporation for the Namib Desert since its d (-3.8‰) was lower than the LMWL (+3.6‰) (Fig.
4) (Kaseke et al., 2016). We thus concluded that fog observed on the 10th June 2016 was derived
from local meteoric waters through evapotranspiration (Fig. 2).
[Figure 4 here]
Classification of fog on the 17th June 2016
Fog collected on the 17th June 2016 was observed at seven sites and the majority of samples
showed evidence of evaporative enrichment but plotted close to the LMWL (Fig. 5). This was
supported by the significantly lower fog d (-4.1‰ ± 3.3) compared to the LMWL (+3.6‰) and
the low fog yield at Sophies Hoogte, Marble Koppie and Vogelfederberg (Table S3) (One-way

14
ANOVA, Welch test p < 0.05). Therefore we did not characterize the isotopic composition of fog
sampled on the 17th June. However, we defined a fog evaporation line δ2H = 6.24δ18O - 5.98 (R2
= 0.99) for these fog samples and found no significant difference in either slope or intercept
between the fog evaporation line and the LMWL (One-way ANCOVA, p > 0.05). Coupled with
the puddle in Figure S1 which persisted until the 19th June 2016, these results suggest that the
rainfall events on the 6th and 7th may have had an ecohydrological impact beyond their onset date.
Therefore, we concluded these fog samples were derived from local meteoric waters and
classified as radiation fog.
[Figure 5 here]
Wind speeds during the fog event on the 17th June 2016 were generally calm (< 2.5 m/s) with
the exception of Vogelfederberg (Table S2). However, the dominant wind direction for all sites
had easterly origins eliminating the ocean as the source because advective fog would have either
north-westerly (Seely and Henschel, 1998) or south-westerly origins (Eckardt et al., 2013) (Table
S2). Advection-radiation fog is associated with an increase in specific humidity due to inflow
from the ocean during the daylight hours (Bari et al., 2016). However, although Volgefederberg
showed an initial increase in specific humidity on the 16th June 2016, by end of the daylight hours
this had decreased and only increased during the night by 0.8 g / kg just before fog onset at 0:00
hrs (Fig. S3). In the hours preceding fog onset, the wind originated from an easterly direction.

15
The Coastal MET site showed a similar but smaller increase (0.4 g / kg) in specific humidity
during the fog event. These results therefore do not support advection-radiation (mixed) fog
classification but support our classification of fog on the 17th June 2016 being radiation fog.
Fog on the 17th June 2016 was restricted to the northern sections of the study area while absent
from the southern sections (Fig. 3). Because fog occurs only when particular atmospheric
conditions are met (Jacobs et al., 2002), this implies conditions conducive for fog formation were
not met in the southern sites on the 17th June 2016 (Fig. 3). We analyzed 2016 meteorological
data and did not find any significant differences in RH, air and soil temperature (Mann Whitney
U tests, Bonferroni p > 0.05) among the northern sites or among the southern sites indicating
similar meteorological conditions within the northern and southern sites. However, inter-region
(north vs south) comparisons showed that RH in the northern sites (66.95%) was significantly
higher than in the southern sites (53.60%) (Mann Whitney U test, p < 0.05). Air temperature was
significantly lower at the northern sites (18.87°C ± 2.6) compared to the southern sites (20.72°C
± 2.4) (ANOVA, p < 0.05). There was no significant difference in soil temperature at 10 cm
depth between the sites: northern sites (24.6°C ± 3.5) compared to southern sites (25.8°C ± 3.8).
These results suggest that conditions in the northern sites were more conducive for radiation fog
formation than the southern sites because of the higher RH and lower air temperature. Therefore,
we attribute the absence of radiation fog in the southern sites on the 17th June, to

16
microclimatological differences between the northern (cooler and more humid) and southern
(warmer and drier) sites (Fig. 3). However, the differences between the northern and southern
sites in air temperature and RH could also be due to higher fog frequency at the northern sites.
Classification of fog on the 18th June 2016
Fog on the 18th June 2016 was observed at all sites; however, isotopic analysis suggested three
types of fog occurred over the area (Fig. 3). Advective fog was observed at four sites, radiation
fog at seven sites and mixed fog at one site (Fig. 6). The sample obtained from Station 8 was
insufficient for isotopic analysis and was not classified (Fig. 3). Advective fog plotted close but
to the right of the GMWL and the advective fog line from Kaseke et al. (2017), suggesting
evaporative enrichment of the samples (Fig. 6). The advective fog samples were defined by the
regression line δ2H = 9.93δ18O +7.74 (R2 = 0.77) and there was no significant difference in slope
between this line and the advective fog line from Kaseke et al. (2017) (ANCOVA, p > 0.05).
However, d of these samples (+6‰) was significantly lower than that of the advective fog line
(+7.6‰) and GMWL (10‰) (One-way ANOVA, Welch F test, p < 0.05), which could be taken
as evidence of evaporative enrichment, thus we did not characterize advective fog. Wind data was
consistent with this classification, showing westerly and north-westerly origins of fog for Coastal
MET and Kleinberg stations (Fig. 3 and Table S2).
Computing forward trajectories of advective fog observed at Coastal MET and Kleinberg based
on the dominant winds, we expected the fog to extend to Sophies Hoogte (~50 km inland) but the
17
sample obtained from Sophies Hoogte was classified as mixed fog based on isotopes (Fig. 6).
This suggests either, dissipation of advective fog downwind and the mixing of residual humidity
with locally derived moisture followed by radiative cooling of the mixed air mass to generate
mixed fog, or, advective fog incorporating substantial amounts of local moisture along its inland
trajectory altering its isotopic composition to that of mixed fog while maintaining the same RH
(Fig. 3 and Table S2). The dominant wind direction at Sophies Hoogte (342°) suggests advective
fog or residual moisture may have entered the Namib Desert north of the Swakop River,
incorporating transpired vapor along the river transforming into mixed fog as it extended
southwards (Fig. 1 and Table S2). As the fog extended south, it may have also incorporated soil
evaporate (Fig. S1), resulting in the mixed fog isotopic composition of the sample obtained from
Sophies Hoogte (Fig. 3).
[Figure 6 here]
Seven fog samples from the 18th June were classified as locally generated, radiation fog
samples (Fig. 3). Three samples plotted directly on the LMWL consistent with local origins of
fog (δ18O -2.8‰, δ2H -20.1‰), while the remaining plotted to the right of the LMWL suggesting
evaporative enrichment and were excluded from isotopic characterization (Fig. 6). Radiation fog
d (+2.1‰ ± 0.6) was similar to LMWL (+3.6‰ ± 8.8) (One-way ANOVA, Welch F test p >
0.05) suggesting local origins of the fog. Interestingly, all sites classified as having received

18
radiation fog had on average lower RH during the fog event than sites with samples classified as
advective and mixed fog (Fig. 3 and Table S2).
Marble Koppie was dominated by westerly winds during the fog event, suggesting
extension of mixed fog further inland (~60 km), but the isotopic composition was consistent with
local origins (Fig. 3 and Table S2). Coupled with the decrease in RH, these results suggest that
the advecting mixed fog/moisture incorporated more local moisture increasing its contribution
while RH decreased. This resulted in a change in the isotopic composition to reflect the
dominance of the local moisture contribution to fog ~60 km inland, radiation fog (Fig. 3 and Fig.
6). Taking into account the west-east and north-south wind trajectories during the fog occurrence
at Kleinberg and Sophies Hoogte, respectively (Table S2), it suggests convergence of these
systems about 50 km inland, extending fog in a south-easterly direction to about 60 km inland
(Fig. 3). However, fog samples obtained from sites 60 km inland were classified as radiation fog,
suggesting that either the fog observed at Sophies Hoogte dissipated before 60 km and the fog
observed at these sites was generated from local moisture (6th and 7th June rains) or the mixed fog
observed at Sophies Hoogte incorporated more local moisture along its trajectory inland altering
the isotopic composition to that of radiation fog (Fig. 3 and Fig. 6). The dominant winds during
the fog event at the southern sites (~60 km inland) was variable e.g., Gobabeb and Station 8 had
southerly origins, Aussinanis (north-westerly) while Vogelfederberg had easterly origins (Table

19
S2). The southerly wind origins at Gobabeb suggest that transpiration from the Kuiseb River may
have contributed moisture to radiation fog (Fig. 1 and Fig. 3).
Interestingly, Station 2 (~30 km inland, 215 m a.s.l) was classified as radiation fog and
received less input than Stations 3 and 4 (~ 33 km inland, 185 m a.s.l) which were classified as
advective fog (Fig. 3 and Table S4). This suggests substantial amounts of locally derived
moisture was added to advective fog/moisture within ~30 km from the coast, altering the isotopic
composition to reflect the dominance of the local moisture input component to the fog observed
at Station 2 (Fig. 3). This local moisture could have been generated from the residual soil
moisture (6th and 7th June rains) and the ephemeral vegetation given the proximity of Station 2 to
the Kuiseb River (Fig. 1). Similarly, the fog samples from Station 1, 5 and Gobabeb located along
the Kuiseb River were also classified as locally generated fog (Fig. 1 and Fig. 3).
These results suggest that the observed widening or extension of the Namib fog-zone to
about 60 km inland between the Swakop and Kuiseb rivers could be due to the perpetuation of
‘advective’ fog by evapotranspiration from river vegetation in addition to the effect of
topography (Lancaster, 1984; Cermak, 2012) (Fig. 1).
Classification of fog on the 19th June 2016
Fog on the 19th June 2016 was experienced at all 13 stations. However, there was insufficient
sample for analysis from the Coastal MET station (Fig. 3). The five fog samples classified as
mixed fog: δ18O (-1.1‰ ± 0.4), δ2H (-5.1‰ ± 3.4) and d (+3.9‰ ± 0.8) (Fig. 3 and Fig. 7) were

20
restricted to the northern sites (Fig. 3). Although mixed fog d (+3.9‰) was not significantly
larger than the LMWL (+3.6‰) (One-way ANOVA, Welch F test, p > 0.05), the samples plotted
between the GMWL and LMWL on the mixed fog line from Kaseke et al. (2017) suggesting
admixture of different air masses, mixed fog (Fig. 7). Although somewhat similar to the 18th June
fog, the fog on the 19th June was unique in that local moisture inputs to advective moisture/fog
was substantial to alter the isotopic composition of the fog at all northern sites, to form mixed fog
(Fig. 3). Because the fog yield on the 19th was generally lower than on the 18th June 2016,
suggests a light advective fog (low preciptable water) and the local moisture additions along the
trajectory increased the fog preciptable water resulting in a west-east increasing fog yield
gradient (Table S3).
All fog samples collected from the southern sites plotted on the LMWL and there was no
significant difference between fog d (+0.1‰ ± 1.2) and LMWL (+3.6‰), hence classified as
radiation fog (δ18O (-1.3‰ ± 1.7), δ2H (-10.5‰ ± 3.9)) (Fig. 3 and Fig. 7). This fog may have
been formed by radiative cooling of moisture derived from local waters as wind directions were
variable among sites while wind speeds at each site were consistent with those associated with
radiation fog (< 2.5 m/s) (Roach et al., 1976; Meyer and Lala, 1990; Tardif and Rasmussen,
2007) (Table S2). Or this fog is formed by the perpetuation of mixed fog inland with addition of
local moisture along its trajectory similar to that proposed for the 18th June 2016. Therefore,

21
although fog observed over the area on the 19th June may appear like a single fog event, the
isotopic data suggests this was composed of mixed fog in the northern sections and radiation fog
in the southern sites (Fig. 3).
[Figure 7 here]
The relationships between radiation fog isotopic compositions and physical factors
We analyzed meteorological data of all FN radiation fog samples that did not show evidence of
evaporative enrichment (plotted on the LMWL) and defined these as δ2H = 7.15 x δ18O – 1.42
(R2 = 0.99, n =13). There was no significant difference between the LMWL and the radiation fog
line in either slope or intercept (One-way ANCOVA, p > 0.05). There was also no significant
difference between the d of the LMWL (+3.6‰) and the radiation fog line (-0.1‰ ± 1.6) (One-
way ANOVA Welch F test, p > 0.05). Therefore we concluded that these fog samples were
derived from local meteoric waters.
Our results show that radiation fog δ18O and δ2H were positively correlated with soil
temperature (at 10 cm depth) (p < 0.05) (Fig. 8a and Fig. 8b). The recent rains received over the
area (Table 1 and Fig. 4) resulted in saturation of the soil surface with surface storage at some
sites (Fig. S1). However, these soils were exposed to evaporative conditions, which resulted in
drying of the soil, creating unsaturated conditions from the surface. Overtime, soil tortuosity
increases and vapor movement becomes the dominant avenue for water transfer to the surface
(Philip, 1957). Vapor movement in arid soils is an important means of water transfer (Evans and
22
Thames, 1981) and nocturnal cooling may generate a thermal gradient sufficient for upward
vapor movement from soil to atmosphere (Philip, 1957; Francis et al., 2007). On average, our
sites show a 4.9°C nighttime soil-atmosphere temperature gradient during radiation fog events,
which would facilitate nighttime evaporation from the soil (Table S2). Soil water becomes
enriched in both 18O and 2H at the soil surface due to evaporation that is dominated by kinetic
fractionation effects (Allison and Barnes, 1983). The resulting vapor transferred into the
atmosphere is thus isotopically depleted in 18O and 2H compared to the soil water. Condensation
of this vapor during fog formation (equilibrium fractionation) results in a condensate that is
depleted in 18O and 2H compared to the soil water or rain (Fig. 2). As soil temperatures increase,
kinetic fractionation effects are reduced causing an increase in δ18O and δ2H in the vapor and
consequently 18O and 2H enrichment in fog condensed from this vapor (Fig. 8a and Fig. 8b).
Interestingly, we did not find any significant correlation between radiation fog δ18O and δ2H and
air temperature.
[Figure 8 here]
Radiation fog δ18O and δ2H was also positively correlated with RH (Fig. 8c and Fig. 8d) (p <
0.05). Since the observed radiation fog was likely derived from soil moisture, this means RH was
related to the amount of soil moisture transferred into the atmosphere. Because evaporation from
the drying soil is dominated by kinetic fractionation effects resulting in a vapor depleted in 18O

23
and 2H, condensation at low humidity results in fog with low δ18O and δ2H values. However, as
more moisture is transferred into the atmosphere increasing RH, this also increases vapor δ18O
and δ2H values and condensation of this vapor under equilibrium conditions should result in an
increase in δ18O and δ2H in the resulting condensate (Fig. 8c and Fig. 8d).
We acknowledge the limitations of our study such as the limited dataset and the unusually
large winter rainfall, which may not reflect typical conditions over the study area. However,
despite these limitations, this study demonstrated that besides advective fog, radiation and mixed
fog occurred regularly in this section of the Namib Desert, at least during the observation period.
Furthermore, stable isotope analysis of fog suggests co-occurrence of different types of fog
during what appears as a single fog event over a large geographic area, similar to the observations
of Bari et al. (2016) in Morocco. This suggests that our current understanding of fog dominated
ecosystems could be overly simplistic thus there is a need for further studies to understand spatial
variability of fog types, their significance to ecohydrology and how shifts or changes might affect
the composition of endemic flora and fauna in the future. The study also suggests a north-south
decreasing fog gradient similar to that reported by Olivier (1995).
CONCLUSIONS
Local precipitation over the Namib Desert had impacts on fog formation beyond their onset
resulting in localized fog, radiation fog. Formation of this localized fog was dependent on micro-

24
climatological conditions at each site and occurred more frequently in the more humid and cooler
northern sites compared to the southern sites. Evapotranspiration from the Swakop and Kuiseb
rivers could be influential in perpetuating fog inland, creating the observed extension / bulge of
the fog-zone inland, in the area between these ephemeral rivers. It is important to acknowledge
the short span of the observations in this study, thus future studies using this novel isotope
framework are needed to confirm the observed spatial trend. Nonetheless, isotope analyses have
demonstrated spatial variations of fog over this area and that what appears as a single fog event
may be a mix of different fog types with different formation processes. Such information is
particularly important for the Namib Desert because the response of fog dependent desert
organisms to climate change is dependent or linked to the source of the fog: ocean or locally
generated.
ACKNOWLEDGMENTS
We would like to acknowledge Gobabeb Research and Training Centre for access to the
FogNet weather stations and for the logistical support and fieldwork assistance. We would also
like to thank Dr. Jia Hu, Dr. Martha Stroll and one anonymous reviewer for their constructive
comments to improve the quality of this manuscript. Funding for this work was made available
from the U.S. National Science Foundation (IIA-1427642 and EAR-1554894).

25
DISCLAIMER
Reference to any companies or specific commercial products does not constitute an
endorsement of these products.

26
REFERENCES
Agam, N. and Berliner, P. (2006). Dew formation and water vapor adsorption in semi-arid environments—a review.
Journal of Arid Environments 65: 572-590.
Allison, G. and Barnes, C. (1983). Estimation of evaporation from non-vegetated surfaces using natural deuterium.
Bari, D., Bergot, T. and El Khlifi, M. (2016). Local meteorological and large-scale weather characteristics of fog
over the grand casablanca region, morocco. Journal of Applied Meteorology and Climatology 55: 1731-
1745.
Berry, F.A., Bollay, E. and Beers, N.R. (1945). Handbook of meteorology.
Burke, A. (2006). Savanna trees in namibia - factors controlling their distribution at the arid end of the spectrum.
Flora 201: 189-201.
Byers, H.R. (1959). General meteorology, In General meteorology, McGraw-Hill.
Cereceda, P., Osses, P., Larrain, H., Farıas, M., Lagos, M., Pinto, R. and Schemenauer, R. (2002). Advective,
orographic and radiation fog in the tarapacá region, chile. Atmospheric Research 64: 261-271.
Cermak, J. (2012). Low clouds and fog along the south-western african coast—satellite-based retrieval and spatial
patterns. Atmospheric Research 116: 15-21.
Dansgaard, W. (1964). Stable isotopes in precipitation. Tellus, 16: 436-468.
Dawson, T.E. (1998). Fog in the california redwood forest: Ecosystem inputs and use by plants. Oecologia 117: 476-
485.
Degefie, D., El-Madany, T.-S., Hejkal, J., Held, M., Dupont, J.-C., Haeffelin, M. and Klemm, O. (2015).
Microphysics and energy and water fluxes of various fog types at sirta, france. Atmospheric Research 151:
162-175.
Ebner, M., Miranda, T. and Roth-Nebelsick, A. (2011). Efficient fog harvesting by stipagrostis sabulicola (namib
dune bushman grass). Journal of Arid Environments 75: 524-531.
Eckardt, F., Soderberg, K., Coop, L., Muller, A., Vickery, K., Grandin, R., Jack, C., Kapalanga, T. and Henschel, J.
(2013). The nature of moisture at gobabeb, in the central namib desert. Journal of Arid Environments 93: 7-
19.
Evans, D.D. and Thames, J.L. (1981). Water in desert ecosystems. Water in Desert Ecosystems.
Francis, M., Fey, M., Prinsloo, H., Ellis, F., Mills, A. and Medinski, T. (2007). Soils of namaqualand:
Compensations for aridity. Journal of Arid Environments 70: 588-603.
Gat, J. (2005). Some classical concepts of isotope hydrology, In Isotopes in the water cycle, Springer, pp. 127-137.
Gat, J. and Matsui, E. (1991). Atmospheric water balance in the amazon basin: An isotopic evapotranspiration
model. Journal of Geophysical Research: Atmospheres 96: 13179-13188.
George, J.J. (1951). Fog, In Compendium of meteorology, Springer, pp. 1179-1189.
Gonfiantini, R. and Longinelli, A. (1962). Oxygen isotopic composition of fogs and rains from the north atlantic.
Experientia 18: 222-223.

27
Gultepe, I., Pagowski, M. and Reid, J. (2007a). A satellite-based fog detection scheme using screen air temperature.
Weather and forecasting 22: 444-456.
Gultepe, I., Tardif, R., Michaelides, S., Cermak, J., Bott, A., Bendix, J., Müller, M., Pagowski, M., Hansen, B. and
Ellrod, G. (2007b). Fog research: A review of past achievements and future perspectives. Pure and Applied
Geophysics 164: 1121-1159.
Hachfeld, B., Jürgens, N., Deil, U. and Loidi, J. In (Ed.)^(Eds.) Vegetation and climate. A selection of contributions
presented at the 42nd Symposium of the International Association of Vegetation Science, Bilbao, Spain, 26-
30 July 1999., 2000, Gebrüder Borntraeger Verlagsbuchhandlung, pp. 567-589.
Henschel, J.R. and Seely, M.K. (2008). Ecophysiology of atmospheric moisture in the namib desert. Atmospheric
Research 87: 362-368.
Ingraham, N.L. and Matthews, R.A. (1988). Fog drip as a source of groundwater recharge in northern kenya. Water
Resources Research 24: 1406-1410.
Ingraham, N.L. and Matthews, R.A. (1990). A stable isotopic study of fog: The point reyes peninsula, california,
u.S.A. Chemical Geology: Isotope Geoscience section 80: 281-290.
Jacobs, A.F., Heusinkveld, B.G. and Berkowicz, S.M. (2002). A simple model for potential dewfall in an arid region.
Atmospheric Research 64: 285-295.
Jacobson, K., van Diepeningen, A., Evans, S., Fritts, R., Gemmel, P., Marsho, C., Seely, M., Wenndt, A., Yang, X.
and Jacobson, P. (2015). Non-rainfall moisture activates fungal decomposition of surface litter in the namib
sand sea.
Jouzel, J. (1986). Isotopes in cloud physics: Multiphase and multistage condensation processes. Handbook of
Environmental Isotope Geochemistry 2: 61-112.
Kaseke, K.F., Wang, L. and Seely, M.K. (2017). Nonrainfall water origins and formation mechanisms. Science
Advances 3: e1603131.
Kaseke, K.F., Wang, L., Wanke, H., Turewicz, V. and Koeniger, P. (2016). An analysis of precipitation isotope
distributions across namibia using historical data. PloS one 11.
Lancaster, M. (1984). Climate of the central namib desert. Madoqua 14: 5-61.
Lange, J. (2005). Dynamics of transmission losses in a large and stream channel. Journal of Hydrology 306: 112-
126.
Limm, E.B., Simonin, K.A., Bothman, A.G. and Dawson, T.E. (2009). Foliar water uptake: A common water
acquisition strategy for plants of the redwood forest. Oecologia 161: 449-459.
Liu, W.J., Liu, W.Y., Li, P.J., Gao, L., Shen, Y.X., Wang, P.Y., Zhang, Y.P. and Li, H.M. (2007). Using stable
isotopes to determine sources of fog drip in a tropical seasonal rain forest of xishuangbanna, sw china.
Agricultural and Forest Meteorology 143: 80-91.
Majoube, M. (1971). Δ18o and deuterium fractionation between water and steam Journal De Chimie Physique Et De
Physico-Chimie Biologique 68: 1423.

28
Martinelli, L.A., Victoria, R.L., Sternberg, L.S.L., Ribeiro, A. and Moreira, M.Z. (1996). Using stable isotopes to
determine sources of evaporated water to the atmosphere in the amazon basin. Journal of hydrology 183:
191-204.
Marx, V. (2009). Impacts of upstream uses on the alluvial aquifer of the swakop river, namibia. Germany:
Diplomarbeit, Albert Ludwig University of Freiburg.
Merlivat, L. and Jouzel, J. (1979). Global climatic interpretation of the deuterium-18o relationship for precipitation.
J. Geophys. Res. 84: 5029-5033.
Meyer, M.B. and Lala, G.G. (1990). Climatological aspects of radiation fog occurrence at albany, new york. Journal
of Climate 3: 577-586.
Nørgaard, T., Ebner, M. and Dacke, M. (2012). Animal or plant: Which is the better fog water collector? PloS one 7:
e34603.
Olivier, J. (1995). Spatial distribution of fog in the namib. Journal of Arid Environments 29: 129-138.
Olivier, J. (2004). Fog-water harvesting along the west coast of south africa: A feasibility study. Water SA 28: 349-
360.
Philip, J.R. (1957). Evaporation, and moisture and heat fields in the soil. Journal of meteorology 14: 354-366.
Roach, W., Brown, R., Caughey, S., Garland, J. and Readings, C. (1976). The physics of radiation fog: I–a field
study. Quarterly Journal of the Royal Meteorological Society 102: 313-333.
Ryznar, E. (1977). Advection-radiation fog near lake michigan. Atmospheric Environment (1967) 11: 427-430.
Salati, E., Dall'Olio, A., Matsui, E. and Gat, J.R. (1979). Recycling of water in the amazon basin: An isotopic study.
Water Resources Research 15: 1250-1258.
Schachtschneider, K. and February, E.C. (2010). The relationship between fog, floods, groundwater and tree growth
along the lower kuiseb river in the hyperarid namib. Journal of Arid Environments 74: 1632-1637.
Schemenauer, R.S. and Cereceda, P. (1991). Fog-water collection in arid coastal locations. Ambio: 303-308.
Schemenauer, R.S. and Cereceda, P. (1994). A proposed standard fog collector for use in high-elevation regions.
Journal of Applied Meteorology 33: 1313-1322.
Scholl, M., Eugster, W. and Burkard, R. (2011). Understanding the role of fog in forest hydrology: Stable isotopes as
tools for determining input and partitioning of cloud water in montane forests. Hydrological Processes 25:
353-366.
Scholl, M.A., Gingerich, S.B. and Tribble, G.W. (2002). The influence of microclimates and fog on stable isotope
signatures used in interpretation of regional hydrology: East maui, hawaii. Journal of Hydrology 264: 170-
184.
Schulze, B. (1969). The climate of gobabeb. Scientific Papers of the Namib Desert Research Station 1969: 5-12.
Seely, M. (1979). Irregular fog as a water source for desert dune beetles. Oecologia 42: 213-227.
Seely, M. and Henschel, J. In (Ed.)^(Eds.) Proceedings of the First International Conference on Fog and Fog
Collection, 1998, pp. 19-24.
Simonin, K.A., Santiago, L.S. and Dawson, T.E. (2009). Fog interception by sequoia sempervirens (d. Don) crowns
decouples physiology from soil water deficit. Plant, cell & environment 32: 882-892.

29
Soderberg, K., Good, S.P., O'Connor, M., Wang, L., Ryan, K. and Caylor, K.K. (2013). Using atmospheric
trajectories to model the isotopic composition of rainfall in central kenya. Ecosphere 4: art33.
Stein, A., Draxler, R., Rolph, G., Stunder, B., Cohen, M. and Ngan, F. (2015). Noaa’s hysplit atmospheric transport
and dispersion modeling system. Bulletin of the American Meteorological Society 96: 2059-2077.
Stewart, M.K. (1975). Stable isotope fractionation due to evaporation and isotopic exchange of falling waterdrops:
Applications to atmospheric processes and evaporation of lakes. Journal of Geophysical Research 80: 1133-
1146.
Tardif, R. and Rasmussen, R.M. (2007). Event-based climatology and typology of fog in the new york city region.
Journal of applied meteorology and climatology 46: 1141-1168.
Wang, L., Caylor, K. and Dragoni, D. (2009). On the calibration of continuous, high-precision δ18o and δ2h
measurements using an off-axis integrated cavity output spectrometer Rapid Communications in Mass
Spectrometry 23: 530-536.
Wang, L., Caylor, K.K., Villegas, J.C., Barron‐Gafford, G.A., Breshears, D.D. and Huxman, T.E. (2010).
Partitioning evapotranspiration across gradients of woody plant cover: Assessment of a stable isotope
technique. Geophysical Research Letters 37.
Wang, L., Good, S.P., Caylor, K.K. and Cernusak, L.A. (2012). Direct quantification of leaf transpiration isotopic
composition. Agricultural and Forest Meteorology 154-155: 127-135.
Wang, L., Kaseke, K.F. and Seely, M.K. (2017). Effects of non-rainfall water inputs on ecosystem functions. WIREs
30: 2077–2086 doi:10.1002/wat1002.1179.
Weathers, K.C. and Likens, G.E. (1996). Clouds in southern chile: An important source of nitrogen to nitrogen-
limited ecosystems? Environmental Science & Technology 31: 210-213.
WMO (1992). International meteorological vocabulary, 2 ed. World Meteorological Organization.

30
Table 1 Rainfall amounts recorded at each FogNet site in the Central Namib Desert, June 2016.
Site
6 June 2016 7 June 2016 Rainfall (mm) Rainfall (mm)
Coastal MET 2.4 1.7 Kleinberg 3.8 0.3 Sophies Hoogte 4.7 3.7 Marble Koppie 4.4 3.0 Vogelfedeberg 3.1 4.6 Station 8 4.4 9.0 Aussinanis 3.7 13.3 Gobabeb 3.8 8.7

31
Figure Captions
Fig. 1. Map indicating the location and extent of the Namib Desert and Namib fog-zone in
southern Africa, with the spatial distribution of the individual sampling stations. FN (FogNet)
denotes a station that is part of the SASSCAL network and the photo shows a typical setup of the
automated weather station. The Swakop River groundwater sampling points were obtained from
Marx (2009).
Fig. 2. Isotopic classification of fog samples collected from 10 sites in the Central Namib Desert
on the 10th June 2016 into mixed fog and radiation fog. The GMWL, LMWL, and radiation fog
line were used as references and adapted from Kaseke et al. (2017).
Fig. 3. Temporal and spatial variation of fog classification in the Central Namib Desert, June
2016.
Fig. 4. Map of Southern Africa showing origins of rain that fell over the Central Namib Desert on
the 6th, 7th and 14th June 2016. These trajectories were calculated using HYSPLIT for each of the
eight FogNet stations that were included in the study.
Fig. 5. Isotopic classification of fog samples collected from the Central Namib Desert on the 17th
June 2016. The GMWL, LMWL, and radiation fog line were used as references and adapted from
Kaseke et al. (2017).

32
Fig. 6. Isotopic classification of fog samples collected from 12 sites in the Central Namib Desert
on the 18th June 2016 into advective fog, mixed fog and radiation fog. The GMWL, LMWL,
advective fog line, mixed fog line and radiation fog line were used as references and adapted
from Kaseke et al. (2017).
Fig. 7. Isotopic classification of fog samples collected from 13 sites in the Central Namib Desert
on the 19th June 2016 into mixed and radiation fog types. The GMWL, LMWL, mixed fog line
and radiation fog line were used as references and adapted from Kaseke et al. (2017).
Fig. 8. The relationship between soil temperature at 10 cm depth and radiation fog isotopes a)
δ18O and b) δ2H. The relationship between relative humidity and radiation fog c) δ18O and d)
δ2H).

33
Fig. 1
34
Fig. 2

35
Fig. 3

36
Fig. 4

37
Fig. 5

38
Fig. 6

39
Fig. 7

40
a)
b)
c)
d)
Fig. 8