fodder estimations for dairy activity in tribal area of
TRANSCRIPT
Applied Ecology and Environmental Sciences, 2021, Vol. 9, No. 5, 557-574 Available online at http://pubs.sciepub.com/aees/9/5/7 Published by Science and Education Publishing DOI:10.12691/aees-9-5-7
Fodder Estimations for Dairy Activity in Tribal Area of Upper Pravara Basin in Maharashtra (India)
Pandharinath T. Karande1,*, Vijay S. Bhagat2, Rajendra B. Zolekar3
1Department of Geography, Adv. M. N. Deshmukh Arts, Science and Commerce College Rajur, Affiliated to Savitribai Phule Pune University, Pune, India, 422604
2Post-graduate Research Center in Geography, Agasti Arts, Commerce and Dadasaheb Rupwate Science College Akole, Affiliated to Savitribai Phule Pune University, Pune, India, 422601
3Department of Geography, K.V.N. Naik Shikshan Prasarak Sanstha’s Arts, Commerce and Science College, Nashik, Affiliated to Savitribai Phule Pune University, Pune, India, 422002
*Corresponding author:
Received April 17, 2021; Revised May 22, 2021; Accepted May 30, 2021
Abstract Livestock is a continuous and major source of income to the tribal people in India. The scarcity of fodder is a major constraint observed for dairy activity in rural and tribal zones. Therefore, the fodder was estimated to understand the fodder source and budgeting for planning and management of sustainable dairy activity in the study region. The grazing on forest and open lands and stall feeding of harvested fodder are major feeding methods observed in the study area. The grazing estimates about 59% of fodder requirements and stall feeding estimates about 41%. The significant positive correlation was estimated for 1) 6 months grazing period with forest land, grasses reported as crop, other crops and area not available for cultivation, 2) 7 months grazing period with net sown area, good soil, rice crop, fallow land and private grasslands, 3) 8 months grazing period with an area not available for cultivation, good soil quality, good rainfall, more other crops, fallow land and grass reported as a crop and 4) 9 months grazing period with forest and area under crops. Green fodder shows deficit of about 80.6% of requirements in 95% villages with an adverse effect on dairy activity. Surplus green fodder is available only in villages having perennial irrigation facilities. Dry fodder estimated about 13.7% surplus which tribal people are using as supportive fodder in shortage period. These methods are useful for estimations and analysis of available fodder in rural and tribal zones of Indian and developing countries.
Keywords: fodder estimations, fodder availability, fodder requirements, fodder scarcity
Cite This Article: Pandharinath T. Karande, Vijay S. Bhagat, and Rajendra B. Zolekar, “Fodder Estimations for Dairy Activity in Tribal Area of Upper Pravara Basin in Maharashtra (India).” Applied Ecology and Environmental Sciences, vol. 9, no. 5 (2021): 557-574. doi: 10.12691/aees-9-5-7.
1. Introduction
Animal husbandry [1] is a supported occupation of agriculture and a major source of income as well as employment in India [2]. Two-third of the total population and three-fourth of the total workforce of India is depending upon agriculture and agro-based business [3]. The majority of the farmers are keeping animals for milk, meat, leather, bones, dung-manure, etc. as support business to the agriculture. Most of the farmers are keeping animals as main business, traditionally. In India, about three-fourth of the population is living in rural areas and about 38% of them are poor [4]. The animals are the main source of proteins and income to the poor population [1,5] and one of the ways of poverty alleviation [6]. Dairy farming is an important source of income to small landholders of dry, drought-prone and hilly zones [4,7]. Fodder is a prime need of dairy activity. Shortage of feeds and fodders are major constraints scattered and small size
landholders [8,9]. Scholars [9,10,11] have reported shortfalls of fodder supply and minimal milk production in the dry season for farmers.
Researchers [12] have recently calculated the deficit of green fodder is 23%, dry fodder 31%, and concentrates feeds 47% in India. Reports on the 12th plan [13] have focused that the development of fodder and feed resources as necessary to sustain livestock in India. The country faces a deficit in 2010 is about 35.7% green fodder, 10.9% dry fodder and 44% concentrate feeds. In the year 2050 demand for total fodder is increasing by 23.9% compared to the year 2010 [13]. In the future to sustain livestock and dairy farming, the growth of green fodder is essential in the study as well as in the country. Therefore, the present study has focused on fodder estimations for dairy activity.
The availability of fodder and lack of sound scientific techniques for measuring the amount of fodder required per animal has imposed severe limitations on the research carried out in this field. In the given study area, the need for fodder is mostly met by grazing the animals in the forest, thus making it difficult to measure the fodder

558 Applied Ecology and Environmental Sciences
obtained from it. Furthermore, the grazing months vary from person to person as well as from time to time, depending upon the duration of the rains received in the area. Generally, the farmers neither equally distribute nor keep an exact account of the amount of fodder provided at their places. In this respect, the present research study will be quite beneficial for the development of dairy business not only in the given study area but also in other rural areas of the country as it concentrates on the study of different types of feeding methods, grazing patterns, weight of fodder obtained from crops, total availability of fodder, quantity of fodder required per animal and quantification of the need and shortage of fodder.
2. Study Area
The study area is located in the upper Pravara basin of Ahmednagar district (Maharashtra) in India (Figure 1). This study area including 44 villages and it is tribal. The study area lies between 19°28’03.97”N to 19°38’40.28” N latitudes and 73°36’58.01” E to 73°54’40.44”E longitudes in Akole tehsil (Figure 1). The River Pravara flows West to the East forming the center of the study area. The offshoots i.e. Kulangarh-Navarichadongar-Kalsubai (1646m) at North and Sipnur-Ratangarh (1237m) at South extended from West to East from the Mountain Sahyadri (Western Ghats) are borders of the region. The slopes are very steep at top of the ridges and have shallow soils
whereas comparatively deep soils are distributed at foothill zones. The water holding capacity of the soils are varied according to slopes. The deep soils sustain the wetness for a long time as compared to the shallow. They are supplying fodder to domestic animals in the region.
Deep soils are covered by medium to dense deciduous, evergreen monsoon forests and grasses at places. The Pravara is a major non-perennial river flowing West to East. The major reservoir (Wilson dam) is located in the central part of the study area and Ghatghar dam at the West, Nilwande dam at the center and small dams on small tributaries in the north part. The river sometimes has water downstream of the dam in the period of rotations given to agriculture. Therefore, the study area has a perennial water supply for dairy farming near rivers and dams.
Rice is a major crop in the region that has the potentials for fodder supply in the dry season. A tribal population is a major group living in the region engaged in agriculture and animal rearing. The Dangi cow, the local breed is sustained in the contrasted condition i.e. heavy rainfall followed by a dry season. They are rearing the cows as well as buffaloes for milk and bull productions for self-sustenance. The small amount of milk from some families is supplying to the promoter for processing and earning some amount for domestic purposes. The standard of living is poor and needs to be improved soon. Therefore, the present study is proposed to estimation of fodder for improvement of the dairy activity in the tribal area.
Figure 1. Study area
Applied Ecology and Environmental Sciences 559
3. Methodology The methodology was prepared for estimations of
requirements and availability and fodder and its budget. The analyses in the research are fully replying on a primary survey and secondary data. Finally, surplus and deficit villages were identified based on estimated availability and requirement of fodder for livestock in the study using book keeping methods.
3.1. Data Out of 44 villages, 10 villages were selected for
selecting the farmers for primary data using pre-tested questionnaires and interviews. About 245 milk producing farmers were selected from selected villages (10 villages) using random sampling method. The scholars [12,14,15,16,17] have used pre-tested questionnaires and [16,18] have used personal interviews for collection of information about feeds and fodder. This study is based on primary data collected about fodder and type of feeding for calculating the availability of fodder in the study area.
Information about land use and livestock were procured from Akole tehsil office and Livestock Census of Akole Tehsil (2012), respectively. The population Census (2011) report of the Ahmednagar district was used for the analysis of the village-wise forest area for calculating the fodder. Similar data was used by scholars [19,20,21] for fodder analysis. The Census [22] was used for the calculation of fodder requirements in the study area.
3.2. Estimations Availability and requirements of fodder were calculated
than surplus and deficit villages were identified in the study area. 1) The availability of fodder was calculated through land use and cropping pattern and 2) requirements were estimated based on fodder need for livestock units. Deficit and surplus villages were identified based on the difference between availability and requirements of fodder in the study region.
3.2.1. Availability of Fodder The fodder availability depends on land use and cropping
pattern. The scholars [19,23,24,25,26] have used land use, whereas [27,28,29,30] have used cropping pattern for fodder estimations. Similarly, land use and cropping patterns were used as basic data for these calculations. The primary data about per unit fodder production by using a questionnaire filled by randomly selected farmers sampled villages in the study area.
The per unit fodder production was calculated for 1) all crops including Rice, Nagali, Varai, Bajra, Jawar, Hulaga, Chawali, Tur, Mug, Groundnut, Khurasani and Soybean, 2) fodder crops like Maize, Napier grass and Lasung has and 3) grasses reported as crops in government reports (Table 1). Here, fodder was calculated for crops based on residues after harvesting for major production. Similarly, researchers [31,32,33] have used crop residues calculating for fodder estimations whereas the weights of fodder crops and grasses were used by scholars [12,34,35] for estimations of the availability of fodder.
Table 1. Methods of fodder calculations
Sr. No. Name of crops Unit of fodder Fodder calculations 1. Rice, Nagali, Varai, Bajra, Jawar, Maize, Grasses Sheaf Per hector sheaf production × average weight 2. Hulaga, Chawali, Tur, Mug, Groundnut, Khurasani, Soybean Bags Per hector bags × average weight 3. Napier grass Sheaf Per hector sheaf × average weight × cutting (5 times) 4. Lasunghas Sheaf Per hector sheaf × average weight × cutting (12 times) Crop wise average fodder production (T/Ha) was calculated to estimate the available fodder in the village and in the
study area (Table 2).
Table 2. Crop wise average fodder production
Crops No. of samples Average production (T/Ha) STD Rice 245 1.13 0.23 Nagali 230 1.05 0.17 Varai 180 1.05 0.20 Bajra 50 1.83 0.30 Jawar 30 2.05 0.36 Hulaga 50 1.54 0.26 Chawali 50 1.54 0.28 Tur 50 1.54 0.34 Mug 50 1.54 0.34 Groundnut 80 1.54 0.33 Khurasani 80 1.54 0.26 Soybean 50 1.88 0.29 Maize 50 60.00 6.51 Napier grass 30 320.00 23.60 Lasunghas 30 126.00 13.37 Grasses 245 0.55 0.05

560 Applied Ecology and Environmental Sciences
3.2.2. Requirement of Fodder The fodder requirements are differ according to feeding
patterns and type of livestock (species, age, sex, and status of cattle as milch or dry). Reliable estimates of feed demand are not available, so different treats have use for estimation of feed demand [36]. Therefore, the requirements of fodder are estimated based on the feeding patterns and livestock distributions in the study area.
A) Feeding patterns Yearly distribution of month wise feeding varies
according to regional variation. Two methods of feeding for livestock are observed in the study region: 1) slot-wise feeding pattern including grazing and stall feeding, and 2) mixed feeding pattern showing both grazing and stall feeding throughout the year. Ten villages were selected for data collection, analysis and estimations of fodder requirements in the study area. The feeding patterns for these selected villages were identified based on data collected using questionnaires circulated to dairy farmers in these selected villages. Finally, the average feeding pattern for the region (Figure 8) was identified based on the feeding patterns estimated for the sample villages.
The duration of livestock grazing in the region was identified based on data collected from the farmers and analyzed to identify the grazing patterns as: 1) six months grazing, 2) seven months grazing, 3) eight months grazing, and 4) nine months grazing.
B) Distribution of livestock Breed-wise livestock distribution is essential for
calculating the requirement of fodder in the study region.
Livestock variety: crossbreed cows, indigenous cows (Dangi cow), buffaloes and goats are observed in the study area [12]. Further, cattle and buffalo are classified milch, dry, bullock, and calf for calculating the fodder requirements.
Village wise livestock distribution is obtaining from Livestock Census of Akole Tehsil, (2012) as male and female calf, male and female adult (breeding cow and buffalo). The percentage of the milch and dry adult female cattle and buffaloes were estimated based on information available in Maharashtra state [22] (Table 3).
Table 3.Milch and dry adult female livestock in the study area
Adult female Milch Dry Total
No. % No. % No. Crossbreed cows 368 71 151 29 519 Indigenous cows 2191 57 1655 43 3846
Buffaloes 1415 67 697 33 2112 The pet animal-wise requirements of fodder are varying
according to the type of livestock, variety, age, sex, lactation period, etc., [37]. Researchers [6,17,28,33,38] have calculated the requirements of fodder for the dairy activity. The sex and age of livestock were used for calculating the requirement of fodder in the study area. The requirements are given by the scholar [28] were used for the fodder estimation of indigenous cows, buffaloes and goats for the study area. Further, the primary survey was conducted for estimations of fodder required for crossbreed cows (Table 4).
Table 4. Requirement offodder
Animal category Subcategory Fodder weight (Kg/ /day/animal)
Green fodder Dry fodder Total fodder Concentrated food
Crossreed cows
In-milk 12.04 6.02 18.06 3.50 Dry 10.76 5.38 16.14 2.04
Adult male 10.80 5.40 16.20 0.68 Calf 4.88 2.44 7.32 0.72
Indigenous cows
In-milk 4.75 5.50 10.25 0.64 Dry 3.40 4.02 7.42 0.40
Adult male 4.06 6.03 10.09 0.33 Calf 2.18 2.13 4.31 0.18
Buffaloes
In-milk 5.96 6.34 12.3 1.05 Dry 5.44 4.95 10.39 0.52
Adult male 4.04 7.47 11.51 0.36 Calf 2.29 2.22 4.51 0.19
Goats - 1.04 0.20 1.24 0.06 The animal wise yearly requirements of fodder in the
study area were calculated using the following formula:
( ) ( )( )
365
Animalwise yearly requirement of fodderTA GFR TA DFR= × + × ×
(1)
TA = Total animal GFR = Green fodder requirement per day DFR = Dry fodder requirement per day
The requirement of fodder depends on fodder feeding methods. Grazing, stall feeding and mixed feeding methods are used in the area. Mainly requirement of fodder classified into 1) grazing and 2) stall feeding. The feeding method-wise percentage was calculated by using
primary data collected from the dairy farmers. The availability was calculated based on the fodder requirements of grazing animals. It is assumed that livestock gets as much fodder as they need in the form of grazing.
3.2.3. Budgeting Fodder budgeting was performed based on the
availability and requirement of fodder for livestock in dairy activity. Scholars [6,9,12,39,40,41] have revealed the shortage of feeds and fodders by suing fodder budget. India’s livestock feed consumption and projections are studied by researcher [28] which is useful to prepare the fodder budget in the study area. Scholars [42] have

Applied Ecology and Environmental Sciences 561
revealed tree leaves and shrubs budget and nutritional values. These methods compile to analyze the fodder budget in the study area. Fodder demand and supply were studied by Meena [43] for fodder budgeting as surplus or deficit. The methodology by researcher [43] was used for fodder budgeting in this study.
/ Surplus deficit fodder AF RF= − (2)
AF = Available fodder RF = Requirement of fodder.
If the value is positive then fodder is surplus and negative value presents deficit fodder for dairy activities. The village wise surplus or deficit fodder situation was estimated which will be helpful to improve dairy farming in the study area.
4. Results and Discussion
4.1. Availability of Fodder Livestock is an asset of farmers and agricultural laborers.
Livestock is for milk, meat, skin, energy for agriculture, manure, etc. [1,10,11,16,39]. Livestock rearing depends on the availability of fodder. Therefore, it is necessary to know the available fodder for the planning and management of livestock in any region. However, reliable data for fodder supply is not available at regional as well as national levels [36,44,45,46,47,48]. Therefore, the availability of fodder was estimated based on agriculture and fallow lands for livestock planning in the region.
Fodder is available from various sources: residues of crops (cereals, pulses, oilseed crops, etc.), fodder crops and grasses in the study region. The spatial distribution of fodder varies according to the geographical conditions in the region.
4.1.1. Crops Residues The farmers are using crop residues for animal feed,
mushroom production, fertilizer, industry material, bioenergy, etc. [32,33]. Crop residues (basically straw of rice and wheat) are useful as fodder in dairy activity [49,50] as a supplement to green fodder [51] in the dry and rainy season [9]. Crop residues are important for animal feeding in developing countries to improve the nutritional values of animal productions [31,52]. Further, demand for crop residues in India is very high and small dairy farmers have increased 50% the milk production using crop residues [53]. These crop residues help to fulfill the fodder deficit [21]. The farmers are rearing milch animals depends on crop residues in India [54]. It has higher potentials for dairy farming [31] and the management of crop residues [27]. Crops residues are major supportive fodder in the study area. The availability of fodder depends on crop residues in the study area. The crops in the region are Rice, Nagali, Varai, Bajra and Jawar.
1) Cereals Rice is a major crop in the study area which is grown
over 36 % of the NSA. Rice produces fodder higher than the other crops. It was estimated about 7549.9 T (40%) of total fodder production (Table 5) and main fodder for
Dangi cows and buffaloes in the region. Villages like Murshet (86.4%), Chichondi (83.4%), RanadBk. (83.2%), Ambewangan (82.8%), Kodani (81.2%), Bari (79.6%), Shendi (74.7%) and Pendshet (74.3%) show a higher proportion of fodder production from Rice residues. All these villages are located on the Western part of the study area with heavy rainfall and less fodder production observed on the Eastern part with less rainfall. Chitalwedhe (0.7%), Nilwande (1.8%), Jamgaon (10.5%), Digambar (10.9%) show less fodder production from Rice (Table 6 and Figure 2).
Other cereals (Nagali, Varai, Bajra and Jawar) produce about 1816.6 T (9.7%), (Table 5). Nagali and Varai crops are observed on the sloping lands around the Rice crop fields. Whereas Bajra and Jawar crops are growing in the Eastern parts with less precipitation areas. More fodder production from these cereals is observed in the villages like Digambar (34.8%), Dongarwadi (34.0%), Babhulwandi (33.1%) and Pimparkane (30.6%) and villages like RanadBk. (1.0%), Ladgaon (1.2%), Padhulwandi (1.4%), Deogaon (1.7%), Murshet (2.1%) and Kelungan (3.0%) show very less production (Table 7 and Figure 3). Bajra crop is grown over 2.53% NSA and fodder production is very less (0.02%) but the Jawar crop gives comparatively more fodder production in Eastern parts.
Table 5. Fodder production-cereals
Cereals Area Fodder Production
Ha % NSA T/Ha T % Rice 6681.30 36.39 1.13 7549.9 40.38
Nagali 644.20 3.51 1.05 676.4 3.62 Varai 272.27 1.48 1.05 285.9 1.53 Bajra 464.62 2.53 1.83 850.3 0.02 Jawar 2.04 0.01 2.05 4.0 4.55 Total 8064.43 43.92 -- 9366.5 50.10
Table 6. Fodder production-rice
Classes No. of villages ˂ Mean – 1 STD 5 Mean – 1 STD to Mean 23 Mean to Mean + 1 STD 5 Mean + 1 STD to Mean + 2 STD 11 Total villages 44 Mean fodder production (%) 44.7 STD fodder production (%) 23.3 Maximum fodder production (%) 86.4 Minimum fodder production (%) 0.7
Table 7. Fodder production- other cereals
Classes No. of villages ˂ Mean – 1 STD 3 Mean – 1 STD to Mean 22 Mean to Mean + 1 STD 15 Mean + 1 STD to Mean + 2 STD 0 ˃ Mean + 2 STD 4 Total villages 44 Mean fodder production (%) 10.4 STD fodder production (%) 8.9 Maximum fodder production (%) 34.8 Minimum fodder production (%) 1.0

562 Applied Ecology and Environmental Sciences
Figure 2. Fodder production-rice
Figure 3. Fodder production- other cereals

Applied Ecology and Environmental Sciences 563
2) Pulses Farmers are using fodder produced from pulses crops
(Hulaga, Chawali, Tur and Mug) residues as a subsidiary fodder in this region. It produces only 292.1 T (1.56%) fodder (Table 8). The mean of fodder from pulses is 1.8% and 26 villages produce less fodder than the mean. Pabhulwandi (10.3%) is a higher producer village and ShenitKh., Nilwande, Dongarwadi (0.1%) are the lesser producers. The villages like Terungan (7.1%), Koltembhe (4.4%), Bhandardara (4.3%), Ratanwadi (4.1%) ShenitBk., Katalapur (0.2%), Jamgaon (0.3%) and Chitalwedhe (0.4%) (Table 9 and Figure 4) also show minor fodder production from the pulses. The fodder production from pulses is proportional to the area under these crops.
Table 8. Fodder production- pulses
Pulses Area Fodder Production
Ha % NSA T/Ha T % Hulaga 182.86 1.00 1.54 281.6 1.51 Chawali 5.64 0.03 1.54 8.7 0.05
TurandMug 1.15 0.01 1.54 1.8 0.01 Total 189.65 1.04 -- 292.1 1.56
Table 9. Fodder production- pulses
Classes No. of villages Mean – 1 STD to Mean 26 Mean to Mean + 1 STD 12 Mean + 1 STD to Mean + 2 STD 4 ˃ Mean + 2 STD 2 Total villages 44 Mean fodder production (%) 1.8 STD fodder production (%) 2.0 Maximum fodder production (%) 10.3 Minimum fodder production (%) 0.0
3) Oilseeds Oilseeds are included Groundnut, Khurasani and
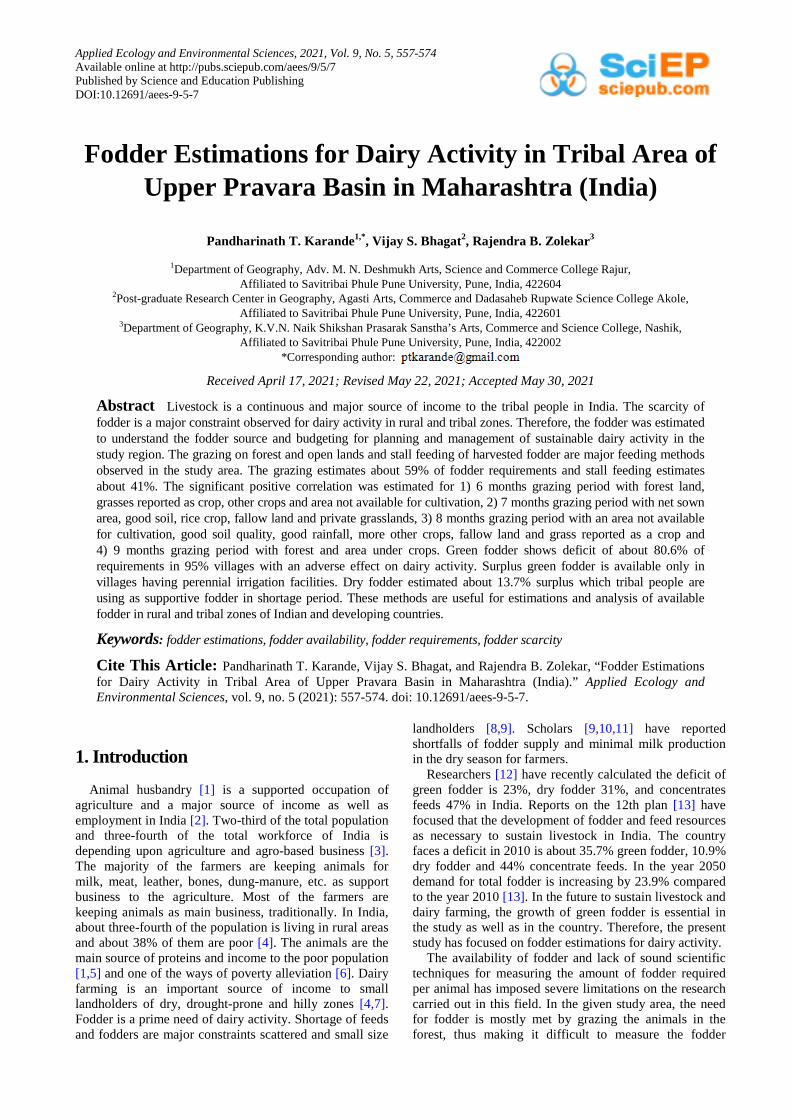
Soybean and produce 1539.4 T (8.0%) fodder useful to support dairy farming in the study region (Table 10). The area under and fodder production from Groundnut and Khurasani is approximately similar and Soybean (1.04%) shows less fodder production. Maximum fodder production from oilseeds is observed in the villages i.e. Kohandi (31.6%), Jamgaon (28.6%), Rajur (22.1%), Shelwihire (21.0%), Malegaon (18.0%), etc. and less in Murshet (0.8%), Bari (1.2%), Panjare (1.3%), Ambewangan, Ranad Bk. (1.5%), etc. (Table 11 and Figure 5).
Table 10. Fodder production- oilseeds
Oilseeds Area Fodder Production
Ha % NSA T/ Ha T % Groundnut 468.61 2.55 1.54 721.7 3.86 Khurasani 404.45 2.20 1.54 622.9 3.33 Soybean 103.65 0.56 1.88 194.9 1.04
Total 976.71 5.32 -- 1539.4 8.23
Table 11. Fodder production- oilseeds
Classes No. of villages ˂ Mean – 1 STD 1 Mean – 1 STD to Mean 24 Mean to Mean + 1 STD 12 Mean + 1 STD to Mean + 2 STD 5 ˃ Mean + 2 STD 2 Total villages 44 Mean fodder production (%) 8.8 STD fodder production (%) 7.8 Maximum fodder production (%) 31.6 Minimum fodder production (%) 0.8
Figure 4. Fodder production-pulses
564 Applied Ecology and Environmental Sciences
Figure 5. Fodder production- oilseeds
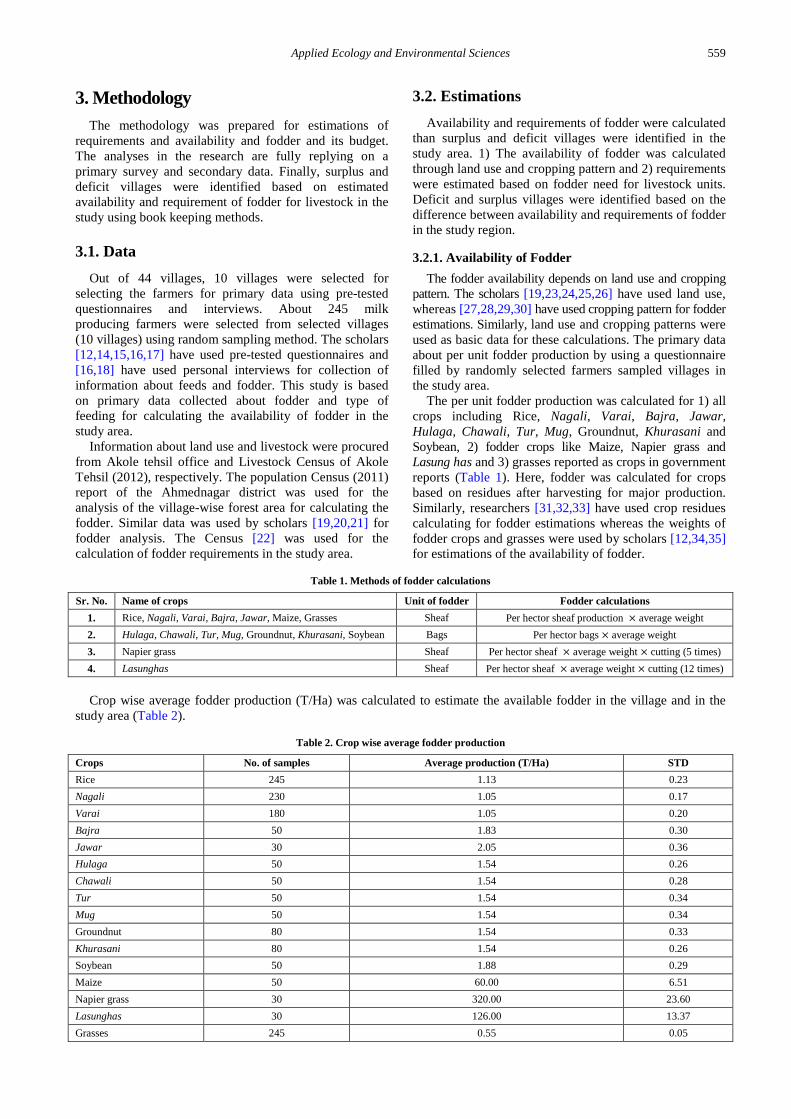
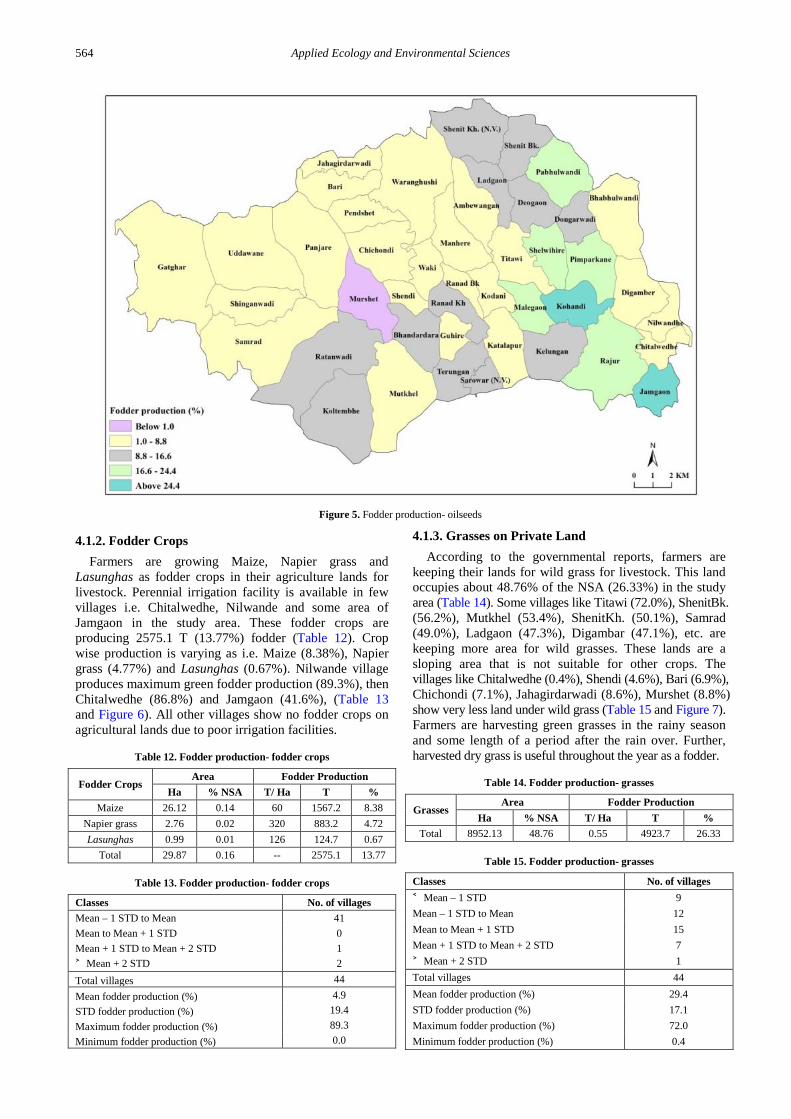
4.1.2. Fodder Crops Farmers are growing Maize, Napier grass and
Lasunghas as fodder crops in their agriculture lands for livestock. Perennial irrigation facility is available in few villages i.e. Chitalwedhe, Nilwande and some area of Jamgaon in the study area. These fodder crops are producing 2575.1 T (13.77%) fodder (Table 12). Crop wise production is varying as i.e. Maize (8.38%), Napier grass (4.77%) and Lasunghas (0.67%). Nilwande village produces maximum green fodder production (89.3%), then Chitalwedhe (86.8%) and Jamgaon (41.6%), (Table 13 and Figure 6). All other villages show no fodder crops on agricultural lands due to poor irrigation facilities.
Table 12. Fodder production- fodder crops
Fodder Crops Area Fodder Production
Ha % NSA T/ Ha T % Maize 26.12 0.14 60 1567.2 8.38
Napier grass 2.76 0.02 320 883.2 4.72 Lasunghas 0.99 0.01 126 124.7 0.67
Total 29.87 0.16 -- 2575.1 13.77
Table 13. Fodder production- fodder crops
Classes No. of villages Mean – 1 STD to Mean 41 Mean to Mean + 1 STD 0 Mean + 1 STD to Mean + 2 STD 1 ˃ Mean + 2 STD 2 Total villages 44 Mean fodder production (%) 4.9 STD fodder production (%) 19.4 Maximum fodder production (%) 89.3 Minimum fodder production (%) 0.0
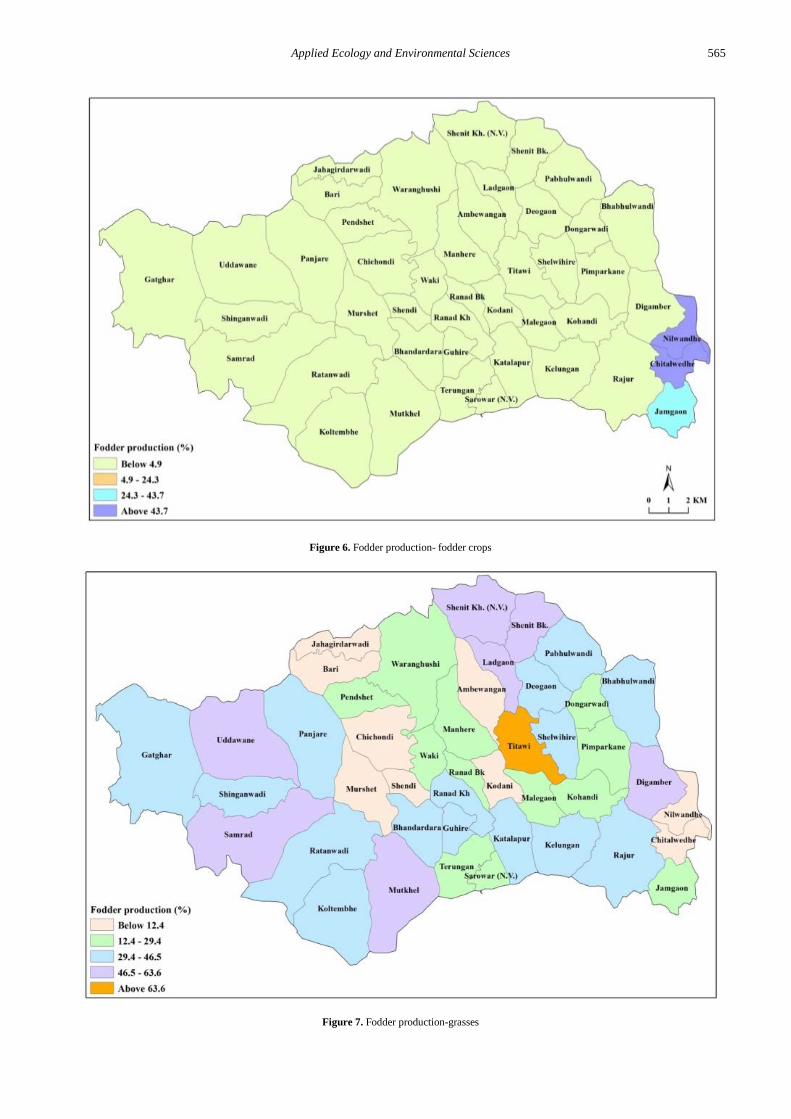
4.1.3. Grasses on Private Land According to the governmental reports, farmers are
keeping their lands for wild grass for livestock. This land occupies about 48.76% of the NSA (26.33%) in the study area (Table 14). Some villages like Titawi (72.0%), ShenitBk. (56.2%), Mutkhel (53.4%), ShenitKh. (50.1%), Samrad (49.0%), Ladgaon (47.3%), Digambar (47.1%), etc. are keeping more area for wild grasses. These lands are a sloping area that is not suitable for other crops. The villages like Chitalwedhe (0.4%), Shendi (4.6%), Bari (6.9%), Chichondi (7.1%), Jahagirdarwadi (8.6%), Murshet (8.8%) show very less land under wild grass (Table 15 and Figure 7). Farmers are harvesting green grasses in the rainy season and some length of a period after the rain over. Further, harvested dry grass is useful throughout the year as a fodder.
Table 14. Fodder production- grasses
Grasses Area Fodder Production
Ha % NSA T/ Ha T % Total 8952.13 48.76 0.55 4923.7 26.33
Table 15. Fodder production- grasses
Classes No. of villages ˂ Mean – 1 STD 9 Mean – 1 STD to Mean 12 Mean to Mean + 1 STD 15 Mean + 1 STD to Mean + 2 STD 7 ˃ Mean + 2 STD 1 Total villages 44 Mean fodder production (%) 29.4 STD fodder production (%) 17.1 Maximum fodder production (%) 72.0 Minimum fodder production (%) 0.4
Applied Ecology and Environmental Sciences 565
Figure 6. Fodder production- fodder crops
Figure 7. Fodder production-grasses

566 Applied Ecology and Environmental Sciences
4.1.4. Gross fodder Dairy activity is depending on the availability of green
and dry fodder production throughout the year. Fodder crops, wild grass and residues of cereals, pulses, oil seed crops are sources of fodder in the study region. About 99.2% of NSA is under crops and useful for fodder production. It is notable that, private grasslands are considered as agricultural lands in the study area. These lands produce about 18696.7 T. Maximum fodder (76.43%) is producing from cereals (50.10%) and grasses (26.33%) (Table 16). Pulses, oilseeds and fodder crops give very less fodder production. The commercial dairy activity requires perennial green fodder however geographical situation is not a suitable supply of perennial supply of the green fodder.
Table 16. Gross fodder production
Crops Area Fodder Production
Ha NSA % T % Cereals 8064.43 43.93 9366.4 50.10 Pulses 189.65 1.03 292.1 1.56
Oilseeds 976.71 5.32 1539.4 8.23 Fodder crops 29.87 0.16 2575.1 13.77
Grasses 8952.13 48.76 4923.7 26.33 Total 18212.79 99.2 18696.7 100.00
4.2. Requirement of Fodder The fodder requirements are differ according to
livestock species, age, sex, and status of cattle as milch or dry. Reliable estimates of feed demand are not available, so different treats have use for estimation of feed demand [36]. Many researchers have estimated the fodder requirements based on availability and fodder production and considered equal values for the same. Dairy farmers aren’t keeping any records about the available and required fodder [28]. Scholars [55,56] have reported variations in fodder requirements for cattle and buffalo. Therefore, estimations of actual fodder requirements for cattle and buffaloes in particular region is very difficult. Here, the required fodder is estimated based on the feeding approach therefore the data about feeding methods and livestock distributions were used for the estimations.
A) Feeding methods Feeding management is affecting daily milk yield from
livestock [57]. Different feeding methods like traditional feeding, total mixed feeding, silage free-feeding were reported by researchers [58]. Further, stall feeding and mixed feeding (grazing and stall feeding) methods are observed for indigenous cattle in Karnataka [5] and the data was used for the estimations of fodder requirements. Similarly, grazing, stall feeding and mixed method of feeding was observed in the study area. Therefore, similar approach was used estimations of fodder requirements of livestock in the study area.
Two methods of feeding for livestock was observed in the study region: 1) slot-wise feeding includes grazing and stall feeding according the time span and 2) mixed feeding shows both grazing and stall feeding method throughout the year. The proportion of fodder requirements varies according to seasons and physiographic characteristics of
the region. Primary data was collected and used for estimations of fodder requirements in the study area. Some of the dairy farmers are grazing their pet animal for 7 months and they contribute 41% of the total fodder whereas some of them are raring livestock across the year and contributing 18 % of the total fodder required. Stall feeding contributes about 41% of the total fodder including 26% from 5 months fully stall feeding and 15% from mix feeding throughout the year (Table 17).
Table 17. Distribution of feeding
Type of feeding
Slot-wise feeding (%)
Mixed feeding (%)
Total (%)
Grazing 41 18 59 Stall feeding 26 15 41
Total 67 33 100 Monthly distribution of grazing The grazing period in the year is important for feeding
the livestock in the region. Increasing length of grazing season [34] is useful to save the cost of required fodder in stall feeding [59]. This is the main fodder source in the study area and average grazing period is 7 months with equal distribution in the study region. The maximum (7.5 months) period of grazing is observed in Sarowarwadi and minimum (7.1 months) in Pabhuwandi village (Table 18).
Table 18. Village wise average months of grazing
Sr. No. Village Average months of grazing 1. Pabhuwandi 7.1 2. Titawi 7.3 3. Bahulwandi 7.4 4. Rajur 7.3 5. Jahagirdarwadi 7.4 6. RanadBk. 7.2 7. Wananghushi 7.4 8. Udadawane 7.2 9. Ratanwadi 7.4
10. Sarowarwadi 7.5 Feeding patterns Five patterns of grazing and stall feeding are observed
in the study area: 1) six months grazing and six months stall feeding, 2) seven months grazing and five months stall feeding, 3) eight months grazing and four months stall feeding, 4) nine months grazing and three months stall feeding and 5) twelve months mix feeding (Table 19 and Figure 8).
Table 19. Monthly distribution of fodder
Grazing and stall feeding months
Mixed (Months)
Grazing (Months)
Stall (Months) %
July to Dec. and Jan. to June Nil 6 6 13
July to Jan. and Feb. to June Nil 7 5 19
July to Feb. and Mar. to June Nil 8 4 33
July to Mar. and April to June Nil 9 3 2
January to December 12 0 0 33 Total 100

Applied Ecology and Environmental Sciences 567
Figure 8. Monthly distribution of fodder
Table 20. Relationship of duration of grazing with different parameters
Elements 6 months grazing ‘r’ values
7 months grazing ‘r’ values
8 months grazing ‘r’ values
9 months grazing ‘r’ values
Net Sown Area -0.289 0.541 -0.186 -0.286 Fallow land -0.271 0.102 0.094 -0.363 Area not available for cultivation 0.035 -0.666 0.736 -0.136 Forest 0.406 -0.394 -0.099 0.493 Rice -0.246 0.131 -0.150 0.156 Grass as a crop 0.183 0.100 0.088 -0.241 Other crops 0.170 -0.654 0.171 0.247 Rainfall -0.002 -0.209 0.250 -0.069 Soil quality -0.316 0.219 0.287 -0.649
Grazing pattern Four grazing patterns are observed in the study area:
1) six months grazing, 2) seven months grazing, 3) eight months grazing, and 4) nine months grazing (Table 20). The correlation of grazing patterns were estimated with parameters like NSA, fallow land, area not available for cultivation, forest, crops (rice, grasses and other crops), rainfall and soil in the study area. Karl Pearson correlation technique with multifaceted manner was used for this analysis. The table value was 0.735 at the 0.01 significance level.
1) Six months grazing pattern The positive correlation between six months grazing
period was estimated with forest, grass as crop, other crops and area not available for cultivation (Table 20). The correlate with forest (0.406) and grass as a crop (0.183) observed more area under forest area in the villages like Sarowarwadi (60%), Udadawane (53%), Ratanwadi (40%). These villages are dependent on the forested area for six months for grazing. Secondly, private grass lands are observed more in the villages like Titawi (85%), Udadawane (67%), Rajur (60%), Ratanwadi (58%), Pabhulwandi (57%), Babhulwandi (54%), etc. The negative correlation was observed
between six months grazing pattern with soil type, NSA, fallow land, rice crop and rainfall. Therefore, forest and private grass lands are important for six months grazing in the study area.
2) Seven months grazing pattern Further, positive correlation of seven months grazing
period was observed with NSA, soil, rice crop, fallow land and private grass lands (Table 20). It has more correlation with NSA (0.541) and soil (0.219) qualities. Maximum area under NSA is observed in the villages like Ranad Bk. (94%), Titawi (84%), Pabhulwandi (73%), Babhulwandi (71%) Jahagirdarwadi (72%), etc. and these villages are depending on NSA for seven months grazing. Comparatively, good soils for the grass are observed in the villages like Babhulwandi, Pabhulwandi, Titawi, Ratanwadi, Jahagirdarwadi and Waranghudhi. These villages are depending for seven months grazing in the rainy season. After the rainy season stall feeding is used by dairy farmers using available fodder from crops. There is a negative correlation between seven months grazing pattern with an area not available for cultivation, other crops, forest and rainfall. Therefore, NSA and soil quality is positively correlating with seven months of grazing period in the study area.

568 Applied Ecology and Environmental Sciences
3) Eight months grazing pattern There is a positive correlation between eight months
grazing period with an area not available for cultivation, soil quality, rainfall, other crops, fallow land and grass as a crop (Table 20). Mainly, eight months grazing is significantly correlating with an area not available for cultivation (0.736) at 0.01 the significance level. The maximum area not available for cultivation is observed in the villages like Ratanwadi (27%), Jahagirdarwadi (14%), Titawi (8%) and Rajur (8%) and these lands are under wild grass which is useful for grazing for eight months. Comparatively, good soils for grass are observed in the villages like Babhulwandi, Pabhulwandi, Titawi, Ratanwadi, Jahagirdarwadi and Waranghudhi. There are a negative correlations found between eight months grazing pattern with NSA, rice crop and forest. Therefore, area not available for cultivation and soil qualities are important for eight months grazing in the study area.
4) Nine months grazing pattern There is a positive correlation between nine months
grazing period with forest and area under crops (Table 20). Mainly, nine months grazing is highly correlating with forest (0.493) and crops (0.247) expect rice. The maximum forest area is observed in the villages like Sarowarwadi (60%), Udadawane (53%), Ratanwadi (40%). These villages are depending on forest land for nine months grazing. Secondly, area under other crops is observed in the villages like Sarowarwadi (23%), Babhulwandi (22%), Ratanwadi (21%), Jahagirdarwadi (18%), Pabhulwandi (17%), etc. There is a negative correlation between nine months grazing pattern observed
with soil qualities, fallow lands, NSA, private area under grass, area not available for cultivation and rainfall. Therefore, forest and area under crops expect rice is important parameters for nine months grazing in the study area.
B) Livestock distribution Distribution of livestock was used for estimation of
fodder expenditure [28,36,55,56] for green and dry fodder, concentrate feeds, size of cowshed, veterinary services, need of fresh water for drinking and washing purpose, labor for dairy farm work, labor cost, feed cost, equipment, transport cost, maintenance, etc., [9,12,54,60,61,63,64,65].
Livestock is also essential for calculating production of milk, manure, animal power, source of asset, employment, etc. [1,7,10,11,16,64,66,67,68,69,70,71]. Here, livestock distributed in the region was analysed for estimation of fodder requirements and budgeting.
The fodder requirements vary according to livestock species, age, sex, and status of cattle as milch or dry [6,12,17,28,21,33,38,43,60]. Therefore, the fodder required for the livestock was estimated based on distribution according to species, sex, milking condition of cows, buffaloes and goats (Table 21). It is also vary according to breed of the livestock. The requirement of green fodder is estimated about 32340.4 T and dry fodder 34585.8 T in the study region. Approximately, the demand for green and dry fodder is similar. Breed-wise demand of fodder is 59.8% for indigenous cattle, 25.8% for buffalo, 7.3% for goats and 7.1% for crossbreed cattle (Table 22). The farmers are raring mainly indigenous breed of the cattle and crossbreed cows are very meager.
Table 21. Category wise livestock
Types Milch Dry Adult male Calf Total Crossbreed cattle 368 151 96 335 950 Indigenous cattle 2191 1655 6187 2897 12930 Buffalo 1415 697 1384 1486 4982 Goat 10758 10758 Total livestock 29620
Table 22. Livestock wise yearly fodder requirements
Fodder type Crossbreed cattle Indigenous cattle Buffalo Goat Gross Total
T % T % T % T % T % Green Fodder 3185.4 4.8 17326.2 25.9 7745.1 11.6 4083.7 6.1 32340.4 48.3
Dry fodder 1592.7 2.3 22696.4 33.9 9511.4 14.2 785.3 1.2 34585.8 51.7 Total fodder 4778.1 7.1 40022.5 59.8 17256.5 25.8 4869.1 7.3 66926.2 100
Table 23. Livestock category wise yearly fodder requirements
Animal category Sub- category Green fodder Dry fodder Total fodder
T % T % T %
Crossbreed cattle
In-milk 1617.2 2.4 808.6 1.2 2425.8 3.6 Dry 593.0 0.9 296.5 0.4 889.6 1.3
Adult male 378.4 0.6 189.2 0.3 567.6 0.8 Calf 596.7 0.9 298.4 0.4 895.1 1.3
Indigenous cattle
In-milk 3798.6 5.7 4398.4 6.6 8197.1 12.2 Dry 2053.9 3.1 2428.4 3.6 4482.2 6.7
Adult male 9168.5 13.7 13617.3 20.3 22785.8 34.0 Calf 2305.1 3.4 2252.3 3.4 4557.4 6.8
Buffaloes
In-milk 3078.2 4.6 3274.5 4.9 6352.6 9.5 Dry 1384.0 2.1 1259.3 1.9 2643.3 3.9
Adult male 2040.8 3.0 3773.5 5.6 5814.4 8.7 Calf 1242.1 1.9 1204.1 1.8 2446.2 3.7
Goats -- 4083.7 6.1 785.3 1.2 4869.1 7.3 Total 32340.4 48.3 34585.8 51.7 66926.2 100.0
Applied Ecology and Environmental Sciences 569
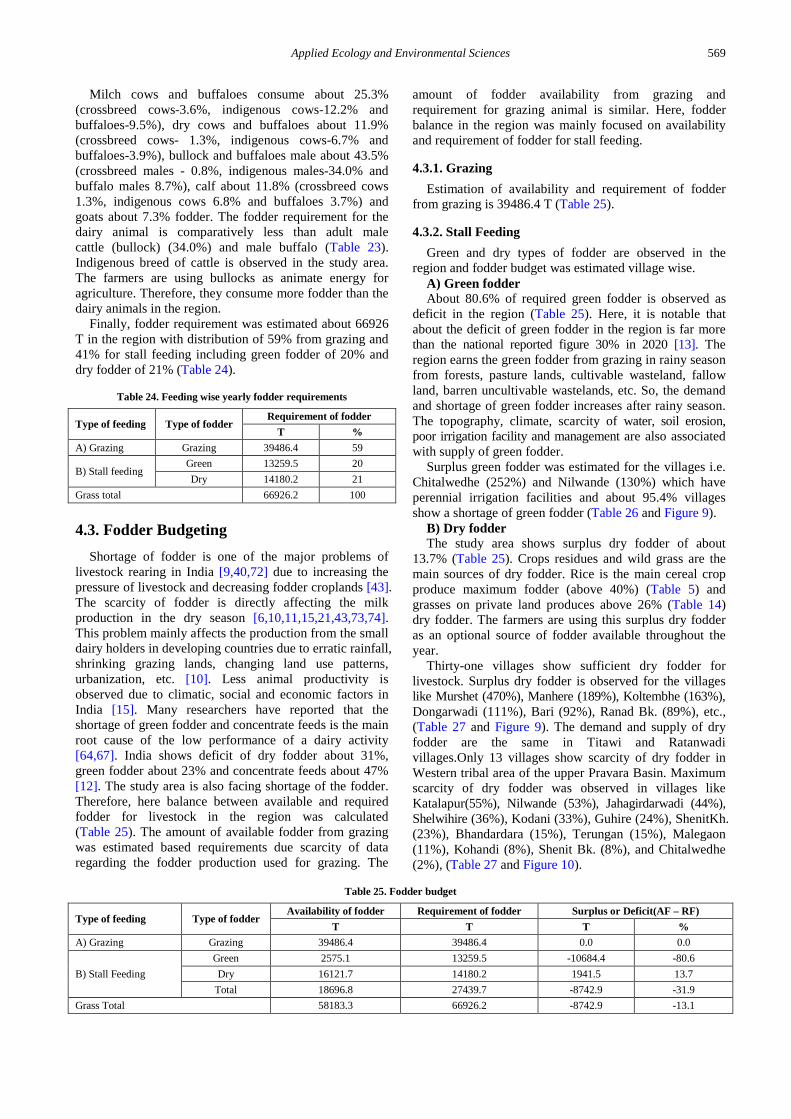
Milch cows and buffaloes consume about 25.3% (crossbreed cows-3.6%, indigenous cows-12.2% and buffaloes-9.5%), dry cows and buffaloes about 11.9% (crossbreed cows- 1.3%, indigenous cows-6.7% and buffaloes-3.9%), bullock and buffaloes male about 43.5% (crossbreed males - 0.8%, indigenous males-34.0% and buffalo males 8.7%), calf about 11.8% (crossbreed cows 1.3%, indigenous cows 6.8% and buffaloes 3.7%) and goats about 7.3% fodder. The fodder requirement for the dairy animal is comparatively less than adult male cattle (bullock) (34.0%) and male buffalo (Table 23). Indigenous breed of cattle is observed in the study area. The farmers are using bullocks as animate energy for agriculture. Therefore, they consume more fodder than the dairy animals in the region.
Finally, fodder requirement was estimated about 66926 T in the region with distribution of 59% from grazing and 41% for stall feeding including green fodder of 20% and dry fodder of 21% (Table 24).
Table 24. Feeding wise yearly fodder requirements
Type of feeding Type of fodder Requirement of fodder
T % A) Grazing Grazing 39486.4 59
B) Stall feeding Green 13259.5 20 Dry 14180.2 21
Grass total 66926.2 100
4.3. Fodder Budgeting Shortage of fodder is one of the major problems of
livestock rearing in India [9,40,72] due to increasing the pressure of livestock and decreasing fodder croplands [43]. The scarcity of fodder is directly affecting the milk production in the dry season [6,10,11,15,21,43,73,74]. This problem mainly affects the production from the small dairy holders in developing countries due to erratic rainfall, shrinking grazing lands, changing land use patterns, urbanization, etc. [10]. Less animal productivity is observed due to climatic, social and economic factors in India [15]. Many researchers have reported that the shortage of green fodder and concentrate feeds is the main root cause of the low performance of a dairy activity [64,67]. India shows deficit of dry fodder about 31%, green fodder about 23% and concentrate feeds about 47% [12]. The study area is also facing shortage of the fodder. Therefore, here balance between available and required fodder for livestock in the region was calculated (Table 25). The amount of available fodder from grazing was estimated based requirements due scarcity of data regarding the fodder production used for grazing. The
amount of fodder availability from grazing and requirement for grazing animal is similar. Here, fodder balance in the region was mainly focused on availability and requirement of fodder for stall feeding.
4.3.1. Grazing Estimation of availability and requirement of fodder
from grazing is 39486.4 T (Table 25).
4.3.2. Stall Feeding Green and dry types of fodder are observed in the
region and fodder budget was estimated village wise. A) Green fodder About 80.6% of required green fodder is observed as
deficit in the region (Table 25). Here, it is notable that about the deficit of green fodder in the region is far more than the national reported figure 30% in 2020 [13]. The region earns the green fodder from grazing in rainy season from forests, pasture lands, cultivable wasteland, fallow land, barren uncultivable wastelands, etc. So, the demand and shortage of green fodder increases after rainy season. The topography, climate, scarcity of water, soil erosion, poor irrigation facility and management are also associated with supply of green fodder.
Surplus green fodder was estimated for the villages i.e. Chitalwedhe (252%) and Nilwande (130%) which have perennial irrigation facilities and about 95.4% villages show a shortage of green fodder (Table 26 and Figure 9).
B) Dry fodder The study area shows surplus dry fodder of about
13.7% (Table 25). Crops residues and wild grass are the main sources of dry fodder. Rice is the main cereal crop produce maximum fodder (above 40%) (Table 5) and grasses on private land produces above 26% (Table 14) dry fodder. The farmers are using this surplus dry fodder as an optional source of fodder available throughout the year.
Thirty-one villages show sufficient dry fodder for livestock. Surplus dry fodder is observed for the villages like Murshet (470%), Manhere (189%), Koltembhe (163%), Dongarwadi (111%), Bari (92%), Ranad Bk. (89%), etc., (Table 27 and Figure 9). The demand and supply of dry fodder are the same in Titawi and Ratanwadi villages.Only 13 villages show scarcity of dry fodder in Western tribal area of the upper Pravara Basin. Maximum scarcity of dry fodder was observed in villages like Katalapur(55%), Nilwande (53%), Jahagirdarwadi (44%), Shelwihire (36%), Kodani (33%), Guhire (24%), ShenitKh. (23%), Bhandardara (15%), Terungan (15%), Malegaon (11%), Kohandi (8%), Shenit Bk. (8%), and Chitalwedhe (2%), (Table 27 and Figure 10).
Table 25. Fodder budget
Type of feeding Type of fodder Availability of fodder Requirement of fodder Surplus or Deficit(AF – RF)
T T T % A) Grazing Grazing 39486.4 39486.4 0.0 0.0
B) Stall Feeding Green 2575.1 13259.5 -10684.4 -80.6 Dry 16121.7 14180.2 1941.5 13.7
Total 18696.8 27439.7 -8742.9 -31.9 Grass Total 58183.3 66926.2 -8742.9 -13.1

570 Applied Ecology and Environmental Sciences
Figure 9. Fodder budget- green fodder
Figure 10. Fodder budget- dry fodder
Applied Ecology and Environmental Sciences 571
Table 26. Fodder budget: green fodder
Remark Classes No. of villages
Deficit Below -85 41 -85 To 0 1
Surplus 0 To 85 0
85 To 170 1 Above 170 1
Total villages 44 Mean (%) -85 STD (%) 63 Maximum (%) 252 Minimum (%) -100
Table 27. Fodder budget-dry fodder
Remark Classes No. of villages
Deficit Below -32 5
-32To 0 9
Surplus 0 To 32 15
32 To 64 7 Above 64 8
Total villages 44 Mean (%) 32 STD (%) 84 Maximum (%) 470 Minimum (%) -55
The total deficit of green and dry fodder was estimated
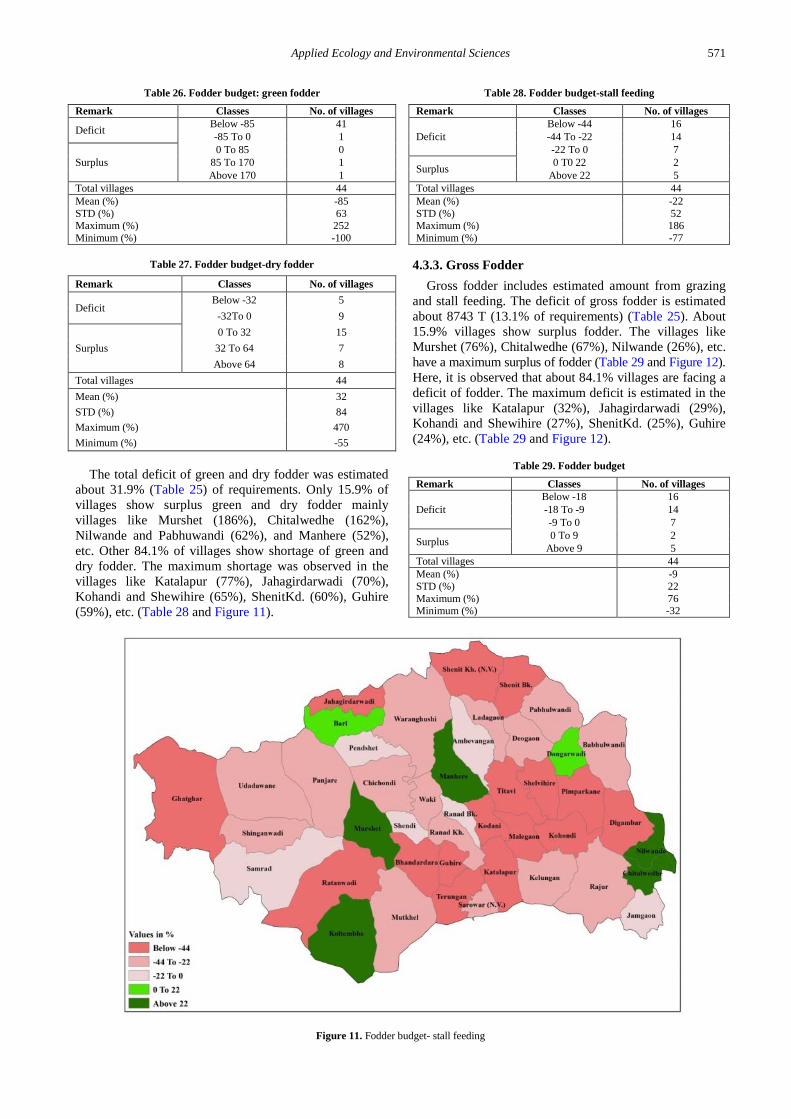
about 31.9% (Table 25) of requirements. Only 15.9% of villages show surplus green and dry fodder mainly villages like Murshet (186%), Chitalwedhe (162%), Nilwande and Pabhuwandi (62%), and Manhere (52%), etc. Other 84.1% of villages show shortage of green and dry fodder. The maximum shortage was observed in the villages like Katalapur (77%), Jahagirdarwadi (70%), Kohandi and Shewihire (65%), ShenitKd. (60%), Guhire (59%), etc. (Table 28 and Figure 11).
Table 28. Fodder budget-stall feeding
Remark Classes No. of villages
Deficit Below -44 16 -44 To -22 14 -22 To 0 7
Surplus 0 T0 22 2 Above 22 5
Total villages 44 Mean (%) -22 STD (%) 52 Maximum (%) 186 Minimum (%) -77
4.3.3. Gross Fodder Gross fodder includes estimated amount from grazing
and stall feeding. The deficit of gross fodder is estimated about 8743 T (13.1% of requirements) (Table 25). About 15.9% villages show surplus fodder. The villages like Murshet (76%), Chitalwedhe (67%), Nilwande (26%), etc. have a maximum surplus of fodder (Table 29 and Figure 12). Here, it is observed that about 84.1% villages are facing a deficit of fodder. The maximum deficit is estimated in the villages like Katalapur (32%), Jahagirdarwadi (29%), Kohandi and Shewihire (27%), ShenitKd. (25%), Guhire (24%), etc. (Table 29 and Figure 12).
Table 29. Fodder budget
Remark Classes No. of villages
Deficit Below -18 16 -18 To -9 14 -9 To 0 7
Surplus 0 To 9 2 Above 9 5
Total villages 44 Mean (%) -9 STD (%) 22 Maximum (%) 76 Minimum (%) -32
Figure 11. Fodder budget- stall feeding

572 Applied Ecology and Environmental Sciences
Figure 12. Village wise fodder budget
5. Conclusions
Fodder availability from cereals, pulses, oilseeds, fodder crops, grassland, etc., livestock distribution, fodder feeding methods, the requirement of fodder and fodder budget have been discussed in the paper to understand the feasibility of dairy activity. The grazing estimates about 59% of total fodder requirements and stall feeding estimated 41%. The significant positive correlation was estimated for 1) six months grazing period with forest land, grasses reported as crop, other crops and area not available for cultivation, 2) seven months grazing period with net sown area, good soil, rice crop, fallow land and private grasslands, 3) eight months grazing period with an area not available for cultivation, good soil quality, good rainfall, more other crops, fallow land and grass reported as a crop and 4) nine months grazing period with forest and area under crops. Green fodder shows deficit of about 80.6% of requirements in 95% villages with an adverse effect on dairy activity. Surplus green fodder is available only in villages having perennial irrigation facilities. Dry fodder estimated about 13.7% surplus which tribal people are using as supportive fodder in shortage period. These methods are useful for estimations and analysis of available fodder in rural and tribal zones of Indian and developing countries.
References [1] Patil, S.S., Bhavani, K., Hiremath, G.K., 2010. Pattern of milk
production, consumption and sale in different dairy units of north Karnataka. Karnataka Jr. Agric. Science 23(2), 374-375.
[2] Bhagat, V., Kadam, A., 2001. A geographical study of distribution and marketing of Onion in Maharashtra. Bhugolshastra Sanshodhan Patrika, VX(1), 37-50.
[3] Bhagat, V.S., 2002. Agro-based model for sustainable development in the Purandhar Tahsil of the Pune district, Maharashtra. Unpublished Ph. D. thesis submitted to Savitribai Phule Pune University, Pune.
[4] Karmarkar, K.G., Banerjee, G.D., 2006. Opportunities and challenges in the Indian Dairy Industry. Technological Digest 9, 24-27.
[5] FAO, 2006. Report of Food and Agriculture Organization of the United Nations, Rome.
[6] Seife, A., Alan, D., Asamoah, L., Troung, T.K., 2012. Enhancing innovation in livestock value chains through networks: Lessons from fodder innovaton case studies in developing countries. Science and Public Policy 39, 333-346.
[7] Bohra, B., Singh, M., Kumar, A., Singh, V., 2001. Milk production marketing and consumption pattern at peri-urban dairy farms in the mountains: A case from Lohaghat in Uttarnchal. ENVIS Bulletin, 12(1), 30-37.
[8] Devendra, C., 2001. Smallholder dairy production systems in devoloping countries characetistics, potential and opportunities for improvement. Asian-Aust. Sci., 14(1), 104-113.
[9] Singh, P.R., Singh, M., Jaiswal, R.S., 2004. Constraints and strategies in rural livestock farming in Almora district of hilly Uttaranchal. Indian J. Anim. Res., 38(2), 91-96.
[10] Ayele, S., Duncan, A., Larbi, A., Khanh, T.T., 2012. Enhancing innovation in livestock value chains through networks: Lessons from fodder innovation case studies in developing countires. Science and Public Policy, 39, 333-346.
[11] Deshmukh, R.D., 2012. Dairy farming in India. Indian Streams Research Journal, 2(3), 1-4.
[12] Pandey, R., Mishra, A., 2011. Livestock fodder requirements and household characteristics in rural economy of hilly region, Uttarakhand. ENVIS Bulletin: Himalayan Ecology, 19, 4-8.
[13] Vision, 2050. Report on 12th five year plan document, Indian Grassland and Fodder Research Institute (Indian Council of Agricultural Research) Gwalior Road Jhansi - 284 003 http://www.igfri.res.in.
[14] Prashantkumar, R.W., Kiresur, V.R., 2005. Pattern of feeding milch animals in different size categories of farmers in Northern Karnataka. Karnataka Agric. Sci., 18 (2), 524-529.
[15] Patil, A.P., Gawande, S.H., Nande, M.P., Gobade, M.R., 2009. Constraints faced by the dairy farmers in Nagpur district while adopting animal management practices. Veterinary World, 2(3), 111-112.

Applied Ecology and Environmental Sciences 573
[16] Radder, K.S., Bhanj, S.K., Kaul, P.N., 2010. Cattle rearing patterns of farmers in Northern Karnataka. International Journal of Rural Studies, 17(1), 1-5.
[17] Bhanderi, B.M., Garg, M.R., Sherasia, P.L., 2014. Mineral status of feeds, fodder and dairy animals in Jalgaon district of Maharashtra state. Sch. J. Agric. Vet. Sci., 1(4A), 222-226.
[18] Manhas, J.S., Sharma, V.P., 2008. Constraints in dairy farming in Jammu district of Jammu and Kashmir. Indian J. Anim. Res., 42(1), 49-52.
[19] Tassew, A., Seifu, E., 2009. Smallholder dairy production system and emergence of dairy cooperatives in Bahir Dar Zuria and Mecha Woredas, Northwestern Ethiopia. World Journal of Dairy and Food Sciences 4(2), 185-192.
[20] Maske, S.S., Phule, B.R., 2011. A concentration analysis of buffalo farming in Solapur district. Golden Research Thoughts, 1(6), 1-4.
[21] Datta, D., 2013. Indian fodder management towards 2030: A case of vision or myopia. International Journal of Management and Social Sciences Research, 2(2), 33-41.
[22] Census of livestock, 2012. Maharashtra State, Department of Animal Husbandry, Pune.
[23] Tulay, C., Cengiz, A., 2009. Application of analytical hierarchy process and geographic information systems in land-use suitability evaluation: a case study of Dumrek village (Canakkale, Turkey). International Journal of Sustainable Development and World Ecology, 16(4), 286-294.
[24] Kavoi, M.M., Hoag, D.L., Pritchett, J., 2010. Measurement of economic efficiency for smallholder dairy cattle in the marginal zones of Kenya. Journal of Development and Agricultural Economics, 2(4), 122-137.
[25] Aurelie, T., Georges, S., Dominique, H., Sylvie, L., 2011. Livelihood strategies and land use changes in response to conservation: Pitfalls of community-based forest management in Madagascar. Journal of Sustainable Forestry, 30, 20-56.
[26] Novo, A.M., Slinger land, M., Jansen, K., Kanellopoulos, A., Giller, K.E., 2013. Feasibility and competitiveness of intensive smallholder dairy farming in Brazil in comparison with Soya and Sugarcane: Case study of the Balde Cheio Programme. Agricultural Systems, 1-10.
[27] Prasad, R., Power, J.F., 1991. Crop residue management. Inc. Advances in Soil Science, 15, 205-251.
[28] Dikshit, A.K., Birthal, P.S., 2010. India’s livestock feed demand: Estimates and projections. Agricultural Economics Research Review, 23(1), 15-28.
[29] Sathyanarayan, K., Jagadeeswary, V., Murthy, V.C., Ruban S.W., Sudha, G., 2010. Socio-economic status of livestock farmers of Narasapura village: A benchmark analysis. Veterinary World, 3(5), 215-218.
[30] Shinde, S.V., 2011. Socio-economic Profile of dairy farmers in Solapur district of Maharashtra State. Indian Streams Research Journal, 1(1), 86-100.
[31] Terry, K., 1978. Chemical treatment of crop residues. Journal of Animal Science, 46(3), 41-48.
[32] Liu, H., Jianga, G.M., Zhuangd, H.Y., Wang, K.J., 2008. Distribution, utilization structure and potential of biomass resources in rural China: With special references of crop residues. Science Direct Renewable and Sustainable Energy Reviews, 12, 1402-1418.
[33] Dong, J., Dafang, Z., Jinying, F., Yaohuan, H., Kege, W., 2012. Bioenergy potential from crop residues in China: Availability and distribution. Renewable and Sustainable Energy Reviews, 16, 1377-1382.
[34] Creighton, P., Kennedy, E., Shalloo, L., Boland, T.M., Donovan, M.O., 2011. A survey analysis of grassland dairy farming in Ireland, investigating grassland management, technology adoption and sward renewal. Grass and Forage Science, 66, 251-264.
[35] Kellerman, M., Salhofer, K., 2014. Dairy farming on permanent grassland: Can it keep up. J. Dairy Sci., 97, 1-15.
[36] Singh, P., Mujumdar, A.B., 1992. Current status of feed and forage management of livestock in India. Agriculture Situation in India, 47(5), 375-382.
[37] Dijkhuizen, A.A., 1984. Economic aspects of reproductive failure in dairy cattle I. Financial loss at farm level. Prevent Veterinary Medicine, 3, 251-263.
[38] Flaten, O., Bakken, A.K., Randby, A.T., 2015. The profitability of harvesting grass silages at early maturity stages: An analysis of
dairy farming systems in Norway. Agricultural Systems, 136, 85-95.
[39] Kumar, S., Chander, M., Harbola, P.C., 2000. Livestock based farming system: A case study of Kumaon hills. ENVIS Bulletin, 8(2), 1-7.
[40] Haan, N.C., Romney, D., Bezkorowajnyj, P., Olufajo, O., 2006. Feeding livestock through partnerships. Knowledge Management for Development Journal, 2 (3), 123-135.
[41] Yadav, M.L., Rajput, D.S., Chand, S., Sharma, N.K., 2014. Constraints in Livestock Management Practices Perceived by Tribal Livestock Owners of Banswara district of Rajasthan. Indian Res. J. Ext. Edu., 14 (4), 37-41.
[42] Gaikwad, U.S., Pawar, A.B., Kadlag, A.D., 2017. Nutritional status of fodder tree leaves and shrubs of scarcity zone of Maharashtra. Advances in Life Sciences, 7(1), 11-14.
[43] Meena, M.S., Singh, K.M., 2014. Fodder production scenario and strategies for revitalizing fodder production technologies. MPRA, 56367, 1-14.
[44] GoI, 1974. Report of the Committee on Livestock Feed and Fodder. Ministry of Agriculture,Government of India, New Delhi.
[45] Hazra, C.R., Rekib, A., 1991. A forage production scenario in the country - A national perspective in technology development and transfer. Agricultural Situation in India, 46(7), 581-588.
[46] Pandey, U.K., 1995. The livestock economy of India: A profile. Indian Journal of Agricultural Economics, 50(3), 264- 282.
[47] Singh, K., Habib, G., Siddiqui, M.M., Ibrahim, M.N.M., 1997. Dynamics of feed resources in mixed farming systems of South Asia. In: crop residues in sustainable mixed crop/livestock farming systems, Ed: C. Renard. CAB International, Wallingford, UK/ICRISAT (International Crops Research Institute for the Semi- Arid Tropics), Patancheru, India/ILRI (International Livestock Research Institute), Nairobi, Kenya, 113-130.
[48] Ramachandra, K.S., Taneja, V.K., Sampath, K.T., Anandan, S., Angadi, U.B., 2007. Livestock feed resources in different agro-ecosystems of India: Availability, requirement and their management. Published by National Institute of Animal Nutrition and Physiology, Bangalore.
[49] Iqubal, A., 2010. Role of livestock husbandry rural transformation in north India: A case study. Revija za geografijo Journal of Geography, 5(2), 83-94.
[50] Kumar, B., Kumar, U., 2011. Ground water recharge zonation mapping and modeling using Geomatics techniques. International Journal of Environmental Sciences, 1(7), 1670-1681.
[51] Chaudhry, A.S., 2008. Forage based animal production systems and sustainability, an invited keynote. R. Bras. Zootec., 37, 78-84.
[52] Rao, K.H., Raju, P.N., 2003. Prospects and challenges for Indian dairy industry to export dairy products. Indian Journal of Dairy and Biosciences, 14, 72-78.
[53] Herrero, M., Thornton, P.K., Notenbaert, A.M., Wood, S., Msangi, S., Freeman, H.A., Bossio, D., Dixon, J., Peters, M., Steeg, J.V., Lynam, J., Parthasarathy, R.P., Macmillan, S., Gerard, B., McDermott, J., Sere, C., Rosegrant, M., 2010. Smart investments in sustainable food production: Revisiting mixed crop-livestock systems. Science, 327, 822-825.
[54] Raval J., Chandawat, M.S., 2011. Extent of knowledge of improved animal husbandry practices and socio-economical characteristics of dairy farmers of district Kheda, Gujarat. International Journal of Farm Sciences, 1(2), 129-137.
[55] Amble, V.N., Murty, V.V.R., Sathe, K.V., Goel, B.B.P.S., 1965. Milk production of bovines in India and their feed availability. Indian Journal of Veterinary Science, 35(3), 221-238.
[56] Jain, J.P., Singh, S., 1990. Qualitative and quantitative insufficiency of livestock feed by 2001 AD and possibilities of bridging gap. Indian Journal of Animal Science, 60(10), 1224-1229.
[57] Bidwe, K.U., Chavan, S.D., Nage, S.P., Bansod, P.H., 2009. Path coefficient analysis of buffalo production in Buldana district of Maharashtra. Veterinary World, l.2(3), 103-104.
[58] Bittante, G., Cipolat-Gotet, C., Malchiodi, F., Sturaro, E., Tagliapietra, F., Schiavon, S., Cecchinato, A., 2015. Effect of dairy farming system, herd, season, parity, and days in milk on modeling of the coagulation, curd firming, and syneresis of bovine milk. Journal of Dairy Science, 98(4), 1-16.
[59] Parker, W.J., Muller, L.D., Buckmaster, D.R., 1992. Management and economic implications of intensive grazing on dairy farms in the Northeastern states. J. Dairy Science, 75, 2587-2597.

574 Applied Ecology and Environmental Sciences
[60] Kiruiro, E.M., Kihanda, F., Okuro, J.O., 2001. Maize leaves as fodder: The potentials for enhancing feed availability on smallholder farms in Kenya. Report of seventh Eastern and Southern Africa Regional Maize Conference, 457-462.
[61] Staal, S.J., Baltenweck, I., Waithaka, M.M., Wolff, T.D., Njoroge L., 2002. Location and uptake: Integrated household and GIS analysis of technology adoption and land use, with application to smallholder dairy farms in Kenya. Agricultural Economics, 27, 295-315.
[62] Kumar, A., 2010. Milk marketing chains in Bihar: Implications for dairy farmers and traders. Agricultural Economics Research Review, 23, 469-477.
[63] Novo, A., Jansen, K., Slingerland, M., 2014. The novelty of simple and known technologies and the rhythm of farmer-centred innovation in family dairy farming in Brazil. International Journal of Agricultural Sustainability, 1-15.
[64] Selvakumar, M., 2014. An overview of major issues affecting milk production in dairy sector with reference to Tamilnadu. Indian Streams Research Journalm, 4(7), 1-4.
[65] Tesfay, G., 2014. Dairy cattle production system in central zone of Tigray: The case of Aksum and Adwa. Global Journal of Animal Scientific Research, 2(2), 151-158.
[66] Rao, S.V.N., Ramkumar, S., Waldie, K., 2002. Dairy farming by landless women in Southern States of India. International workshop on Livestock Services and the Poor at Bhubaneshwar in India, 73-86.
[67] Sathiadhas, R., Noble, D., Immanuel, S., Jayan, K.N., Sadanandan, S., 2003. Adoption level of scientific dairy farming practices by IVLP farmers in the coastal agro ecosystem of Kerala. Indian Journal of Social Research, 44(3), 243-250.
[68] Kamble, A.S., 2012. Performance of dairy industry in India: Challenges and opportunities. Golden Research Thoughts, 2(4), 1-5.
[69] Pandey, J., Singh, A., 2012. Opportunities and constraints in organic farming: An Indian perspective. Journal of Scientific Research, 56, 47-72.
[70] Uddin, M.N., Uddin, M.B., Al, M.M., Hassan, M.M., Khan, M.M.H., 2012. Small scale dairy farming for livelihoods of rural farmers: Constraint and prospect in Bangladesh. Journal of Animal Science Advances, 2(6), 543-550.
[71] Tesfay, G., Mekuriaw, Z., Gangwar, S.K., Hailemichael, A., 2012. Socio-economic characteristics and purpose of keeping dairy cattle in central zone of Tigray, Northern Ethiopia. International Journal of Advanced Biological Research, 2(2), 256-265.
[72] De, A., Goswami, A., Mazumder, D., 2014. Adoption behaviour of livestock farmers in Paschim Medinipore district of West Bengal, India. Int. J. Curr. Microbiol. App. Science, 3(8), 666-672.
[73] Kumar, P., Kher, S.K., Dwivedi, S., 2012. An analytical study of livestock in Jammu and Kashmir. International Journal of Plant, Animal and Environmental Sciences, 2(3), 169-177.
[74] Kumar, A., Parappurathu, S., Joshi, P.K., 2013. Structural transformation in dairy sector of India. Agricultural Economics Research Review, 26(2), 209-219.
©The Author(s) 2021. This article is an open access article distributed under the terms and conditions of the Creative Commons Attribution (CC BY) license (http://creativecommons.org/licenses/by/4.0/).