focusing your organization on strategy—with the brilliant ...€¦ · anced scorecard in your...
TRANSCRIPT

Included with this collection:
www.hbr.org
C O L L E C T I O N
2
Putting the Balanced Scorecard to Work
by Robert S. Kaplan and David P. Norton
19
Measuring the Strategic Readiness of Intangible Assets
by Robert S. Kaplan and David P. Norton
35
Using the Balanced Scorecard as a Strategic
Management System
by Robert S. Kaplan and David P. Norton
49
Having Trouble with Your Strategy? Then Map It
by Robert S. Kaplan and David P. Norton
Focusing Your Organization on Strategy—with the Balanced Scorecard, 2nd Edition
Your strategy’s brilliant—but can you
execute
it?
Product 5933
Collection Overview The Articles
page 1
CO
PYR
IGH
T ©
200
4 H
AR
VA
RD
BU
SIN
ESS
SC
HO
OL
PU
BLI
SHIN
G C
OR
PO
RA
TIO
N. A
LL R
IGH
TS
RE
SER
VE
D.
The Balanced Scorecard has transformed companies around the globe. This revolu-tionary performance management sys-tem has been helping top executives set corporate strategy and objectives—and translate them into a coherent set of mea-sures—since 1992.
What makes the Balanced Scorecard so powerful? It transforms strategy into a continuous process owned by every em-ployee, not just top managers. It also en-ables you to communicate high-level goals down to all organizational levels. Employees know not only
what
to do, but
why
.
But most important, the Balanced Score-card doesn’t treat strategy from only a fi-nancial perspective; it augments financial measures with objectives and metrics in three additional “perspectives”—cus-tomer relationships, internal processes, and learning and growth.
These less tangible areas are notoriously difficult to measure and influence. In 2004, Robert Kaplan and David Norton augmented the Scorecard methodology to include new tools that enable you to further unleash the power of intangible assets. In the article “Measuring the Strate-gic Readiness of Intangible Assets,” they describe how to assess how prepared your company’s people, systems, and cul-ture are to carry out your strategy—and turn it into long-term tangible results.
The four articles in this collection, all writ-ten by Kaplan and Norton, give you the tools to start building and using a Bal-anced Scorecard in your firm.
3
Article Summary
4
Putting the Balanced Scorecard to Work
by Robert S. Kaplan and David P. NortonYour Balanced Scorecard provides a top-down description of your company’s strategy and your assumptions about the corporate objectives and measures needed to implement that strategy.
To begin building your scorecard, ask: “If we successfully implement our strategy, how will we look different to our shareholders and customers? How will our internal processes change? What will happen to our ability to innovate and grow? What are each scorecard perspective’s critical success factors? What metrics will tell us whether we’re addressing those factors as planned?”
18
Further Reading
20
Article Summary
21
Measuring the Strategic Readiness of Intangible Assets
by Robert S. Kaplan and David P. NortonIt’s not enough to clarify your strategy; you must measure your intangible assets’ strategic readiness—how well your employees’ skills, information and technical systems, and leader-ship and culture align with your strategy. These intangible assets directly enhance the inter-nal processes that generate revenue needed to meet your long-term financial goals.
To measure strategic readiness, identify the intangible assets you need to perform the inter-nal processes
most
critical to your strategy. Then assess your current capabilities in all these areas, identifying changes needed to improve alignment.
34
Further Reading
36
Article Summary
37
Using the Balanced Scorecard as a Strategic Management System
by Robert S. Kaplan and David P. NortonYou’ve defined strategic objectives and measures and measured your intangible assets’ stra-tegic readiness. Now link employees’ everyday actions to your company’s long-term goals: translate your vision into metrics everyone can understand; communicate high-level goals and link them to individual performance and compensation; and use scorecard data to test and revise your theories about which actions generate which results.
48
Further Reading
50
Article Summary
51
Having Trouble with Your Strategy? Then Map It
by Robert S. Kaplan and David P. NortonTo execute your strategy, you must communicate it throughout your organization so em-ployees see how their everyday actions support—or hamper—the strategy. How to send a clear, compelling message? Use a strategy map—a one-page, graphic depiction of the cause-and-effect connections among your Balanced Scorecard’s four perspectives. Concise and clear, your strategy map tells employees throughout your organization how to turn re-sources (especially intangible ones) into the tangible results promised by your strategy.
61
Further Reading
1st article from the collection:
Focusing Your Organization on Strategy—with the Balanced Score-card, 2nd Edition
page 2
Putting the Balanced Scorecard to Work
by Robert S. Kaplan and David P. Norton
Included with this full-text
Harvard Business Review
article:
The Idea in Brief—the core idea
The Idea in Practice—putting the idea to work
3
Article Summary
4
Putting the Balanced Scorecard to Work
A list of related materials, with annotations to guide further
exploration of the article’s ideas and applications
18
Further Reading
Product 4118

Putting the Balanced Scorecard to Work
page 3
The Idea in Brief The Idea in Practice
CO
PYR
IGH
T ©
200
0 H
AR
VA
RD
BU
SIN
ESS
SC
HO
OL
PU
BLI
SHIN
G C
OR
PO
RA
TIO
N. A
LL R
IGH
TS
RE
SER
VE
D.
What makes a balanced scorecard special? Four characteristics stand out:
1. It is a top-down reflection of the com-pany’s mission and strategy.
By contrast, the measures most companies track are bottom-up: deriving from local activities or ad hoc processes, they are often irrelevant to the overall strategy.
2. It is forward-looking.
It addresses cur-rent and future success. Traditional financial measures describe how the company per-formed during the last reporting period—without indicating how managers can im-prove performance during the next.
3. It integrates external and internal mea-sures.
This helps managers see where they have made trade-offs between perfor-mance measures in the past, and helps en-sure that future success on one measure does not come at the expense of another.
4. It helps you focus.
Many companies track more measures than they can possi-bly use. But a balanced scorecard requires managers to reach agreement on only those measures that are most critical to the success of the company's strategy. Fifteen to twenty distinct measures are usually enough, each measure custom-designed for the unit to which it applies.
Linking measurements to strategy is the heart of a successful scorecard development pro-cess. The three key questions to ask here:
1. If we succeed with our vision and strategy, how will we look different
•
to our shareholders and customers?
•
in terms of our internal processes?
•
in terms of our ability to innovate and grow?
2. What are the critical success factors in each of the four scorecard perspectives?
3. What are the key measurements that will tell us whether we’re addressing those success factors as planned?
The balanced scorecard also brings an organi-zational focus to the variety of local change programs under way in a company at any given time. As the benchmark against which all new projects are evaluated, the scorecard functions as more than just a measurement system. In the words of FMC Corp. executive Larry Brady, it becomes “the cornerstone of the way you run the business,” that is, “the core of the management system” itself.
Example:
Rockwater, an underwater engineering and construction firm, crafted a five-pronged strategy: to provide services that surpassed customers’ expectations and needs; to achieve high levels of customer satisfaction; to make continuous improvements in safety, equipment reliability, responsive-ness, and cost effectiveness; to recruit and retain high-quality employees; and to real-ize shareholder expectations. Using the bal-anced scorecard, Rockwater’s senior man-agement translated this strategy into tangible goals and actions.
• The financial measures they chose in-cluded return-on-capital employed and cash flow, because shareholders had indi-cated a preference for short-term results.
• Customer measures focused on those clients most interested in a high value-added relationship.
•
The
company introduced new bench-marks that emphasized the integration of key internal processes. It also added a safety index as a means of controlling indirect costs associated with accidents.
• Learning and growth targets emphasized the percentage of revenue coming from new services and the rate of improve-ment of safety and rework measures.
Putting the Balanced Scorecard to Work
by Robert S. Kaplan and David P. Norton
harvard business review • september–october 1993 page 4
CO
PYR
IGH
T ©
199
3 H
AR
VA
RD
BU
SIN
ESS
SC
HO
OL
PU
BLI
SHIN
G C
OR
PO
RA
TIO
N. A
LL R
IGH
TS
RE
SER
VE
D.
What do companies like Rockwater, Apple Computer, and Advanced
Micro Devices have in common? They’re using the scorecard to
measure performance and set strategy.
Today’s managers recognize the impact thatmeasures have on performance. But theyrarely think of measurement as an essentialpart of their strategy. For example, executivesmay introduce new strategies and innovativeoperating processes intended to achievebreakthrough performance, then continue touse the same short-term financial indicatorsthey have used for decades, measures like re-turn-on-investment, sales growth, and operat-ing income. These managers fail not only tointroduce new measures to monitor new goalsand processes but also to question whether ornot their old measures are relevant to the newinitiatives.
Effective measurement, however, must bean integral part of the management process.The balanced scorecard, first proposed in theJanuary-February 1992 issue of HBR (“The Bal-anced Scorecard—Measures that Drive Perfor-mance”), provides executives with a compre-hensive framework that translates acompany’s strategic objectives into a coherentset of performance measures. Much more than
a measurement exercise, the balanced score-card is a management system that can moti-vate breakthrough improvements in such criti-cal areas as product, process, customer, andmarket development.
The scorecard presents managers with fourdifferent perspectives from which to choosemeasures. It complements traditional financialindicators with measures of performance forcustomers, internal processes, and innovationand improvement activities. These measuresdiffer from those traditionally used by compa-nies in a few important ways:
Clearly, many companies already have myr-iad operational and physical measures for localactivities. But these local measures are bottom-up and derived from ad hoc processes. Thescorecard’s measures, on the other hand, aregrounded in an organization’s strategic objec-tives and competitive demands. And, by re-quiring managers to select a limited number ofcritical indicators within each of the four per-spectives, the scorecard helps focus this strate-gic vision.
Putting the Balanced Scorecard to Work
harvard business review • september–october 1993 page 5
In addition, while traditional financial mea-sures report on what happened last periodwithout indicating how managers can improveperformance in the next, the scorecard func-tions as the cornerstone of a company’s cur-rent
and
future success.Moreover, unlike conventional metrics,
the information from the four perspectivesprovides balance between external measureslike operating income and internal measureslike new product development. This balancedset of measures both reveals the trade-offs thatmanagers have already made among perfor-mance measures and encourages them toachieve their goals in the future without mak-ing trade-offs among key success factors.
Finally, many companies that are now at-tempting to implement local improvementprograms such as process reengineering, totalquality, and employee empowerment lack asense of integration. The balanced scorecardcan serve as the focal point for the organiza-tion’s efforts, defining and communicating pri-orities to managers, employees, investors, evencustomers. As a senior executive at one majorcompany said, “Previously, the one-year bud-get was our primary management planning de-vice. The balanced scorecard is now used asthe language, the benchmark against which allnew projects and businesses are evaluated.”
The balanced scorecard is not a templatethat can be applied to businesses in general oreven industrywide. Different market situa-tions, product strategies, and competitive envi-ronments require different scorecards. Busi-ness units devise customized scorecards to fittheir mission, strategy, technology, and cul-ture. In fact, a critical test of a scorecard’s suc-cess is its transparency: from the 15 to 20 score-card measures, an observer should be able tosee through to the business unit’s competitivestrategy. A few examples will illustrate howthe scorecard uniquely combines managementand measurement in different companies.
Rockwater: Responding to a Changing Industry
Rockwater, a wholly owned subsidiary ofBrown & Root/Halliburton, a global engineer-ing and construction company, is a worldwideleader in underwater engineering and con-struction. Norman Chambers, hired as CEO inlate 1989, knew that the industry’s competi-tive world had changed dramatically. “In the
1970s, we were a bunch of guys in wet suitsdiving off barges into the North Sea withburning torches,” Chambers said. But compe-tition in the subsea contracting business hadbecome keener in the 1980s, and manysmaller companies left the industry. In addi-tion, the focus of competition had shifted.Several leading oil companies wanted to de-velop long-term partnerships with their sup-pliers rather than choose suppliers based onlow-price competition.
With his senior management team, Cham-bers developed a vision: “As our customers’preferred provider, we shall be the industryleader in providing the highest standards ofsafety and quality to our clients.” He also de-veloped a strategy to implement the vision.The five elements of that strategy were: ser-vices that surpass customers’ expectations andneeds; high levels of customer satisfaction;continuous improvement of safety, equip-ment reliability, responsiveness, and cost ef-fectiveness; high-quality employees; and real-ization of shareholder expectations. Thoseelements were in turn developed into strate-gic objectives (see the chart “Rockwater’sStrategic Objectives”). If, however, the strate-gic objectives were to create value for thecompany, they had to be translated into tangi-ble goals and actions.
Rockwater’s senior management teamtransformed its vision and strategy into thebalanced scorecard’s four sets of performancemeasures (see the chart “Rockwater’s Bal-anced Scorecard”):
Financial Measures:
The financial perspec-tive included three measures of importance tothe shareholder. Return-on-capital-employedand cash flow reflected preferences for short-term results, while forecast reliability signaledthe corporate parent’s desire to reduce the his-torical uncertainty caused by unexpected vari-ations in performance. Rockwater manage-ment added two financial measures. Projectprofitability provided focus on the project asthe basic unit for planning and control, andsales backlog helped reduce uncertainty ofperformance.
Customer Satisfaction:
Rockwater wantedto recognize the distinction between its twotypes of customers: Tier I customers, oil com-panies that wanted a high value-added rela-tionship, and Tier II customers, those thatchose suppliers solely on the basis of price. A
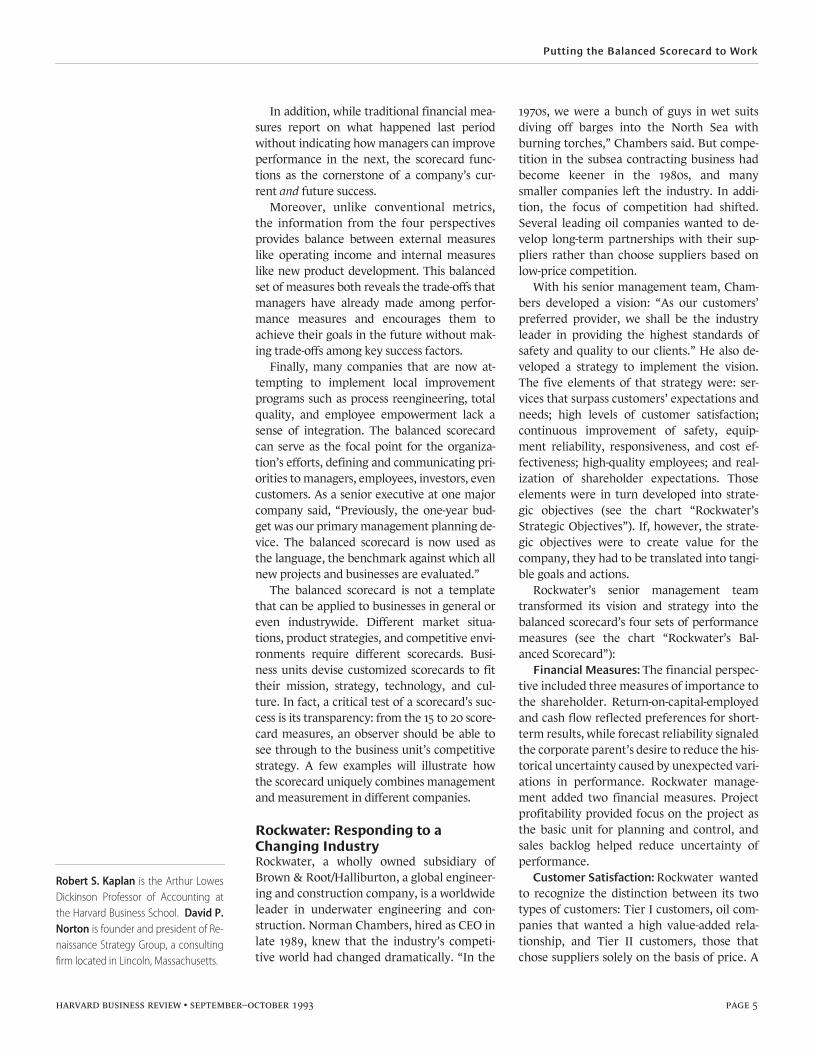
Robert S. Kaplan
is the Arthur LowesDickinson Professor of Accounting atthe Harvard Business School.
David P.Norton
is founder and president of Re-naissance Strategy Group, a consultingfirm located in Lincoln, Massachusetts.

Putting the Balanced Scorecard to Work
harvard business review • september–october 1993 page 6
price index, incorporating the best availableintelligence on competitive position, was in-cluded to ensure that Rockwater could still re-tain Tier II customers’ business when requiredby competitive conditions.
The company’s strategy, however, was toemphasize value-based business. An indepen-dent organization conducted an annual surveyto rank customers’ perceptions of Rockwater’sservices compared to those of its competitors.In addition, Tier I customers were asked tosupply monthly satisfaction and performanceratings. Rockwater executives felt that imple-menting these ratings gave them a direct tie totheir customers and a level of market feedbackunsurpassed in most industries. Finally, mar-ket share by key accounts provided objectiveevidence that improvements in customer satis-faction were being translated into tangiblebenefits.
Internal Processes:
To develop measures ofinternal processes, Rockwater executives de-fined the life cycle of a project from launch(when a customer need was recognized) tocompletion (when the customer need had
been satisfied). Measures were formulated foreach of the five business-process phases in thisproject cycle (see the chart “How RockwaterFulfills Customer Needs”):
•
Identify:
number of hours spent with pros-pects discussing new work;
•
Win:
tender success rate;•
Prepare and Deliver:
project performanceeffectiveness index, safety/loss control, rework;
•
Closeout
: length of project closeout cycle.The internal business measures emphasized
a major shift in Rockwater’s thinking. For-merly, the company stressed performance foreach functional department. The new focusemphasized measures that integrated key busi-ness processes. The development of a compre-hensive and timely index of project perfor-mance effectiveness was viewed as a key corecompetency for the company. Rockwater feltthat safety was also a major competitive factor.Internal studies had revealed that the indirectcosts from an accident could be 5 to 50 timesthe direct costs. The scorecard included a safetyindex, derived from a comprehensive safetymeasurement system, that could identify and
Rockwater’s Strategic Objectives
The Vision
“As our customers’preferred provider,we shall be theindustry leader.This is our mission.”
Strategy
Services that Surpass Needs
Customer Satisfaction
Continuous Improvement
Quality of Employees
Shareholder Expectations
Fin
anci
alC
ust
om
erIn
tern
alG
row
th
Return on Capital
Cash Flow
Project Profitability
Reliability of Performance
Value for Money Tier ICompetitive Price Tier IIHassle-Free RelationshipHigh-Performance ProfessionalsInnovation
Shape Customer RequirementTender EffectivenessQuality ServiceSafety/Loss ControlSuperior Project Management
Continuous Improvement
Product and Service Innovation
Empowered Work Force

Putting the Balanced Scorecard to Work
harvard business review • september–october 1993 page 7
classify all undesired events with the potentialfor harm to people, property, or process.
The Rockwater team deliberated about thechoice of metric for the identification stage. Itrecognized that hours spent with key prospectsdiscussing new work was an input or processmeasure rather than an output measure. Themanagement team wanted a metric thatwould clearly communicate to all members ofthe organization the importance of buildingrelationships with and satisfying customers.The team believed that spending quality timewith key customers was a prerequisite for in-fluencing results. This input measure was de-liberately chosen to educate employees aboutthe importance of working closely to identifyand satisfy customer needs.
Innovation and Improvement:
The inno-vation and learning objectives are intended todrive improvement in financial, customer,and internal process performance. At Rockwa-ter, such improvements came from productand service innovation that would create newsources of revenue and market expansion, aswell as from continuous improvement in in-
ternal work processes. The first objective wasmeasured by percent revenue from new ser-vices and the second objective by a continuousimprovement index that represented the rateof improvement of several key operationalmeasures, such as safety and rework. But inorder to drive both product/service innovationand operational improvements, a supportiveclimate of empowered, motivated employeeswas believed necessary. A staff attitude surveyand a metric for the number of employee sug-gestions measured whether or not such a cli-mate was being created. Finally, revenue peremployee measured the outcomes of em-ployee commitment and training programs.
The balanced scorecard has helped Rockwa-ter’s management emphasize a process view ofoperations, motivate its employees, and incor-porate client feedback into its operations. Itdeveloped a consensus on the necessity of cre-ating partnerships with key customers, the im-portance of order-of-magnitude reductions insafety-related incidents, and the need for im-proved management at every phase of multi-year projects. Chambers sees the scorecard as
Rockwater’s Balanced Scorecard
Customer Perspective
Financial Perspective
Internal Business Perspective
Innovation and LearningPerspective
Pricing Index Tier II CustomersCustomer Ranking SurveyCustomer Satisfaction IndexMarket Share
Business Segment, Tier I Customers, Key Accounts
Return-on-Capital-Employed
Cash Flow
Project Profitability
Profit Forecast Reliability
Sales Backlog
Hours with Customers on New WorkTender Success RateReworkSafety Incident IndexProject Performance IndexProject Closeout Cycle
% Revenue from New ServicesRate of Improvement IndexStaff Attitude Survey# of Employee SuggestionsRevenue per Employee

Putting the Balanced Scorecard to Work
harvard business review • september–october 1993 page 8
an invaluable tool to help his company ulti-mately achieve its mission: to be number onein the industry.
Apple Computer: Adjusting Long-Term Performance
Apple Computer developed a balanced score-card to focus senior management on a strat-egy that would expand discussions beyondgross margin, return on equity, and marketshare. A small steering committee, intimatelyfamiliar with the deliberations and strategicthinking of Apple’s Executive ManagementTeam, chose to concentrate on measurementcategories within each of the four perspectivesand to select multiple measurements withineach category. For the financial perspective,Apple emphasized shareholder value; for thecustomer perspective, market share and cus-tomer satisfaction; for the internal processperspective, core competencies; and, finally,for the innovation and improvement perspec-tive, employee attitudes. Apple’s manage-ment stressed these categories in the follow-ing order:
Customer Satisfaction:
Historically, Applehad been a technology- and product-focusedcompany that competed by designing bettercomputers. Customer satisfaction metrics arejust being introduced to orient employees to-ward becoming a customer-driven company.J.D. Power & Associates, a customer-surveycompany, now works for the computer indus-try. However, because it recognized that itscustomer base was not homogeneous, Applefelt that it had to go beyond J.D. Power & As-sociates and develop its own independent sur-veys in order to track its key market segmentsaround the world.
Core Competencies:
Company executiveswanted employees to be highly focused on a
few key competencies: for example, user-friendly interfaces, powerful software archi-tectures, and effective distribution systems.However, senior executives recognized thatmeasuring performance along these compe-tency dimensions could be difficult. As a re-sult, the company is currently experimentingwith obtaining quantitative measures of thesehard-to-measure competencies.
Employee Commitment and Alignment:
Apple conducts a comprehensive employeesurvey in each of its organizations every twoyears; surveys of randomly selected employeesare performed more frequently. The surveyquestions are concerned with how well em-ployees understand the company’s strategy aswell as whether or not they are asked to de-liver results that are consistent with that strat-egy. The results of the survey are displayed interms of both the actual level of employee re-sponses and the overall trend of responses.
Market Share:
Achieving a critical thresh-old of market share was important to seniormanagement not only for the obvious salesgrowth benefits but also to attract and retainsoftware developers to Apple platforms.
Shareholder Value:
Shareholder value is in-cluded as a performance indicator, eventhough this measure is a result—not adriver—of performance. The measure is in-cluded to offset the previous emphasis ongross margin and sales growth, measures thatignored the investments required today togenerate growth for tomorrow. In contrast,the shareholder value metric quantifies theimpact of proposed investments for businesscreation and development. The majority ofApple’s business is organized on a functionalbasis—sales, product design, and worldwidemanufacturing and operations—so share-holder value can be calculated only for the en-tire company instead of at a decentralizedlevel. The measure, however, helps seniormanagers in each major organizational unitassess the impact of their activities on the en-tire company’s valuation and evaluate newbusiness ventures.
While these five performance indicatorshave only recently been developed, they havehelped Apple’s senior managers focus theirstrategy in a number of ways. First of all, thebalanced scorecard at Apple serves primarilyas a planning device, instead of as a control de-vice. To put it another way, Apple uses the
How Rockwater Fulfills Customer Needs
CustomerNeed
Recognized
CustomerNeedMet
Identify Win Prepare Perform Closeout
#1 #2 #3 #4 #5
DevelopmentCycle
Supply Cycle
Putting the Balanced Scorecard to Work
harvard business review • september–october 1993 page 9
Building a Balanced Scorecard
Each organization is unique and so follows its own path for building a balanced scorecard. At Apple and AMD, for instance, a senior finance or business development executive, intimately familiar with the strategic thinking of the top management group, constructed the initial score-card without extensive delibera-tions. At Rockwater, however, senior management had yet to define sharply the organization’s strategy, much less the key performance levers that drive and measure the strategy’s success.
Companies like Rockwater can fol-low a systematic development plan to create the balanced scorecard and encourage commitment to the score-card among senior and mid-level managers. What follows is a typical project profile:
1. Preparation
The organization must first define the business unit for which a top-level scorecard is appropriate. In general, a scorecard is appropriate for a business unit that has its own customers, distribution channels, production facilities, and financial performance measures.
2. Interviews: First Round
Each senior manager in the business unit—typically between 6 and 12 ex-ecutives—receives background mate-rial on the balanced scorecard as well as internal documents that describe the company’s vision, mission, and strategy.
The balanced scorecard facilitator (either an outside consultant or the company executive who organizes the effort) conducts interviews of ap-proximately 90 minutes each with the senior managers to obtain their
input on the company’s strategic ob-jectives and tentative proposals for balanced scorecard measures. The fa-cilitator may also interview some principal shareholders to learn about their expectations for the business unit’s financial performance, as well as some key customers to learn about their performance expecta-tions for top-ranked suppliers.
3. Executive Workshop: First Round
The top management team is brought together with the facilitator to undergo the process of developing the scorecard (see the chart “Begin by Linking Measurements to Strat-egy”). During the workshop, the group debates the proposed mission and strategy statements until a con-sensus is reached. The group then moves from the mission and strategy statement to answer the question, “If I succeed with my vision and strat-egy, how will my performance differ for shareholders; for customers; for internal business processes; for my ability to innovate, grow, and im-prove?”
Videotapes of interviews with shareholder and customer represen-tatives can be shown to provide an external perspective to the delibera-tions. After defining the key success factors, the group formulates a pre-liminary balanced scorecard contain-ing operational measures for the strategic objectives. Frequently, the group proposes far more than four or five measures for each perspective. At this time, narrowing the choices is not critical, though straw votes can be taken to see whether or not some of the proposed measures are viewed as low priority by the group.
4. Interviews: Second Round
The facilitator reviews, consolidates, and documents the output from the executive workshop and interviews each senior executive about the ten-tative balanced scorecard. The facili-tator also seeks opinions about is-sues involved in implementing the scorecard.
5. Executive Workshop: Second Round
A second workshop, involving the se-nior management team, their direct subordinates, and a larger number of middle managers, debates the orga-nization’s vision, strategy state-ments, and the tentative scorecard. The participants, working in groups, comment on the proposed measures, link the various change programs under way to the measures, and start to develop an implementation plan. At the end of the workshop, partici-pants are asked to formulate stretch objectives for each of the proposed measures, including targeted rates of improvement.
6. Executive Workshop: Third Round
The senior executive team meets to come to a final consensus on the vi-sion, objectives, and measurements developed in the first two workshops; to develop stretch targets for each measure on the scorecard; and to identify preliminary action programs to achieve the targets. The team must agree on an implementation program, including communicating the scorecard to employees, integrat-ing the scorecard into a manage-ment philosophy, and developing an information system to support the scorecard.
Putting the Balanced Scorecard to Work
harvard business review • september–october 1993 page 10
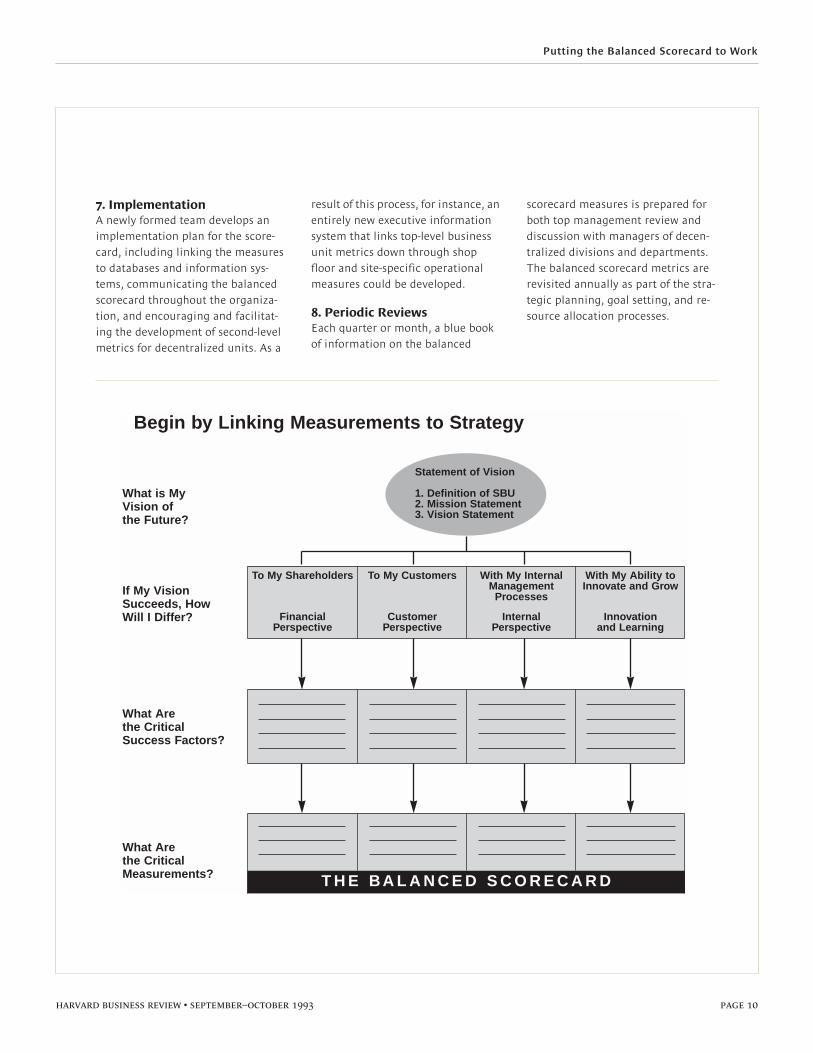
7. Implementation
A newly formed team develops an implementation plan for the score-card, including linking the measures to databases and information sys-tems, communicating the balanced scorecard throughout the organiza-tion, and encouraging and facilitat-ing the development of second-level metrics for decentralized units. As a
result of this process, for instance, an entirely new executive information system that links top-level business unit metrics down through shop floor and site-specific operational measures could be developed.
8. Periodic Reviews
Each quarter or month, a blue book of information on the balanced
scorecard measures is prepared for both top management review and discussion with managers of decen-tralized divisions and departments. The balanced scorecard metrics are revisited annually as part of the stra-tegic planning, goal setting, and re-source allocation processes.
With My Ability toInnovate and Grow
Innovationand Learning
To My Shareholders
FinancialPerspective
With My InternalManagement
Processes
Internal Perspective
To My Customers
CustomerPerspective
Begin by Linking Measurements to Strategy
T H E BA L A N C E D S C O R E C A R D
If My VisionSucceeds, HowWill I Differ?
What is MyVision ofthe Future?
What Arethe CriticalSuccess Factors?
What Arethe CriticalMeasurements?
Statement of Vision
1. Definition of SBU2. Mission Statement3. Vision Statement
Putting the Balanced Scorecard to Work
harvard business review • september–october 1993 page 11
measures to adjust the “long wave” of corpo-rate performance, not to drive operatingchanges. Moreover, the metrics at Apple, withthe exception of shareholder value, can bedriven both horizontally and vertically intoeach functional organization. Considered ver-tically, each individual measure can be brokendown into its component parts in order toevaluate how each part contributes to thefunctioning of the whole. Thought of horizon-tally, the measures can identify how, for ex-ample, design and manufacturing contributeto an area such as customer satisfaction. In ad-dition, Apple has found that its balancedscorecard has helped develop a language ofmeasurable outputs for how to launch and le-verage programs.
The five performance indicators at Appleare benchmarked against best-in-class organi-zations. Today they are used to build businessplans and are incorporated into senior execu-tives’ compensation plans.
Advanced Micro Devices: Consolidating Strategic Information
Advanced Micro Devices (AMD), a semicon-ductor company, executed a quick and easytransition to a balanced scorecard. It alreadyhad a clearly defined mission, strategy state-ment, and shared understanding among se-nior executives about its competitive niche. Italso had many performance measures frommany different sources and information sys-tems. The balanced scorecard consolidatedand focused these diverse measures into aquarterly briefing book that contained sevensections: financial measures; customer-basedmeasures, such as on-time delivery, lead time,and performance-to-schedule; measures ofcritical business processes in wafer fabrica-tion, assembly and test, new product develop-ment, process technology development (e.g.,submicron etching precision), and, finally,measures for corporate quality. In addition,organizational learning was measured by im-posing targeted rates of improvements for keyoperating parameters, such as cycle time andyields by process.
At present, AMD sees its scorecard as a sys-tematic repository for strategic informationthat facilitates long-term trend analysis forplanning and performance evaluation.
Driving the Process of Change
The experiences of these companies and oth-ers reveal that the balanced scorecard is mostsuccessful when it is used to drive the processof change. Rockwater, for instance, came intoexistence after the merger of two different or-ganizations. Employees came from differentcultures, spoke different languages, and haddifferent operating experiences and back-grounds. The balanced scorecard helped thecompany focus on what it had to do well inorder to become the industry leader.
Similarly, Joseph De Feo, chief executive ofService Businesses, one of the three operatingdivisions of Barclays Bank, had to transformwhat had been a captive, internal supplier ofservices into a global competitor. The score-card highlighted areas where, despite apparentconsensus on strategy, there still was consider-able disagreement about how to make thestrategy operational. With the help of thescorecard, the division eventually achievedconsensus concerning the highest priorityareas for achievement and improvement andidentified additional areas that needed atten-tion, such as quality and productivity. De Feoassessed the impact of the scorecard, saying,“It helped us to drive major change, to becomemore market oriented, throughout our organi-zation. It provided a shared understanding ofour goals and what it took to achieve them.”
Analog Devices, a semiconductor company,served as the prototype for the balanced score-card and now uses it each year to update thetargets and goals for division managers. JerryFishman, president of Analog, said, “At the be-ginning, the scorecard drove significant andconsiderable change. It still does when wefocus attention on particular areas, such as thegross margins on new products. But its mainimpact today is to help sustain programs thatour people have been working on for years.”Recently, the company has been attempting tointegrate the scorecard metrics with
hoshin
planning, a procedure that concentrates an en-tire company on achieving one or two key ob-jectives each year. Analog’s hoshin objectiveshave included customer service and new prod-uct development, for which measures alreadyexist on the company’s scorecard.
But the scorecard isn’t always the impetusfor such dramatic change. For example,AMD’s scorecard has yet to have a significantimpact because company management didn’t
The scorecard enables
managers to see the
breadth and totality of
company operations.

Putting the Balanced Scorecard to Work
harvard business review • september–october 1993 page 12
use it to drive the change process. Before turn-ing to the scorecard, senior managers had al-ready formulated and gained consensus for thecompany’s mission, strategy, and key perfor-mance measures. AMD competes in a singleindustry segment. The top 12 managers are in-timately familiar with the markets, engineer-ing, technology, and other key levers in thissegment. The summary and aggregate infor-mation in the scorecard were neither new norsurprising to them. And managers of decen-tralized production units also already had asignificant amount of information about theirown operations. The scorecard did enablethem to see the breadth and totality of com-pany operations, enhancing their ability to be-come better managers for the entire company.But, on balance, the scorecard could only en-capsulate knowledge that managers in generalhad already learned.
AMD’s limited success with the balancedscorecard demonstrates that the scorecard hasits greatest impact when used to drive achange process. Some companies link compen-sation of senior executives to achieving stretchtargets for the scorecard measures. Most areattempting to translate the scorecard into op-erational measures that become the focus forimprovement activities in local units. Thescorecard is not just a measurement system; itis a management system to motivate break-through competitive performance.
Implementing the Balanced Scorecard at FMC Corporation: An Interview with Larry D. Brady
FMC Corporation is one of the most diversifiedcompanies in the United States, producing morethan 300 product lines in 21 divisions organizedinto 5 business segments: industrial chemicals,performance chemicals, precious metals, de-fense systems, and machinery and equipment.Based in Chicago, FMC has worldwide revenuesin excess of $4 billion.
Since 1984, the company has realized annualreturns-on-investment of greater than 15%. Cou-pled with a major recapitalization in 1986, thesereturns resulted in an increasing shareholdervalue that significantly exceeded industrial aver-ages. In 1992, the company completed a strategicreview to determine the best future course tomaximize shareholder value. As a result of thatreview, FMC adopted a growth strategy to com-plement its strong operating performance. Thisstrategy required a greater external focus and ap-preciation of operating trade-offs.
To help make the shift, the company decidedto use the balanced scorecard. In this interviewconducted by Robert S. Kaplan, Larry D. Brady,executive vice president of FMC, talks about thecompany’s experience implementing the score-card.
Robert S. Kaplan:
What’s the status of thebalanced scorecard at FMC?
Larry D. Brady:
Although we are just com-pleting the pilot phase of implementation, Ithink that the balanced scorecard is likely to be-
The Scorecard’s Impact on External Reporting
Several managers have asked whether or not the balanced scorecard is applicable to external reporting. If the scorecard is indeed a driver of long-term performance, shouldn’t this information be relevant to the investment community?
In fact, the scorecard does not translate easily to the investment community. A scorecard makes sense primarily for busi-ness units and divisions with a well-defined strategy. Most companies have several divi-sions, each with its own mission and strat-egy, whose scorecards cannot be aggre-gated into an overall corporate scorecard. And if the scorecard does indeed provide a
transparent vision into a unit’s strategy, then the information, even the measures being used, might be highly sensitive data that could reveal much of value to competi-tors. But most important, as a relatively re-cent innovation, the scorecard would bene-fit from several years of experimentation within companies before it becomes a sys-tematic part of reporting to external constit-uencies.
Even if the scorecard itself were better suited to external reporting, at present the financial community itself shows little inter-est in making the change from financial to strategic reporting. One company president
has found the outside financial community leery of the principles that ground the score-card: “We use the scorecard more with our customers than with our investors. The fi-nancial community is skeptical about long-term indicators and occasionally tells us about some empirical evidence of a nega-tive correlation between stock prices and at-tention to total quality and internal pro-cesses.”
However, the investment community has begun to focus on some key metrics of new product performance. Could this be an early sign of a shift to strategic thinking?
Putting the Balanced Scorecard to Work
harvard business review • september–october 1993 page 13
come the cornerstone of the management sys-tem at FMC. It enables us to translate businessunit strategies into a measurement system thatmeshes with our entire system of management.
For instance, one manager reported thatwhile his division had measured many operat-ing variables in the past, now, because of thescorecard, it had chosen 12 parameters as thekey to its strategy implementation. Seven ofthese strategic variables were entirely newmeasurements for the division. The managerinterpreted this finding as verifying whatmany other managers were reporting: thescorecard improved the understanding andconsistency of strategy implementation. An-other manager reported that, unlike monthlyfinancial statements or even his strategic plan,if a rival were to see his scorecard, he wouldlose his competitive edge.
It’s rare to get that much enthusiasm among di-visional managers for a corporate initiative. Whatled you and them to the balanced scorecard?
FMC had a clearly defined mission: to be-come our customers’ most valued supplier. Wehad initiated many of the popular improve-ment programs: total quality, managing by ob-jectives, organizational effectiveness, buildinga high-performance organization. But these ef-forts had not been effective. Every time wepromoted a new program, people in each divi-sion would sit back and ask, “How is that sup-posed to fit in with the six other things we’resupposed to be doing?’’
Corporate staff groups were perceived byoperating managers as pushing their pet pro-grams on divisions. The diversity of initia-tives, each with its own slogan, created con-fusion and mixed signals about where toconcentrate and how the various programsinterrelated. At the end of the day, with allthese new initiatives, we were still asking di-vision managers to deliver consistent short-term financial performance.
What kinds of measures were you using?
The FMC corporate executive team, likemost corporate offices, reviews the financialperformance of each operating divisionmonthly. As a highly diversified company thatredeploys assets from mature cash generatorsto divisions with significant growth opportuni-ties, the return-on-capital-employed (ROCE)measure was especially important for us. Wewere one of the few companies to inflation-ad-just our internal financial measures so that we
could get a more accurate picture of a divi-sion’s economic profitability.
At year-end, we rewarded division manag-ers who delivered predictable financial perfor-mance. We had run the company tightly forthe past 20 years and had been successful. Butit was becoming less clear where future growthwould come from and where the companyshould look for breakthroughs into new areas.We had become a high return-on-investmentcompany but had less potential for furthergrowth. It was also not at all clear from our fi-nancial reports what progress we were makingin implementing long-term initiatives. Ques-tions from the corporate office about spendingversus budget also reinforced a focus on theshort-term and on internal operations.
But the problem went even deeper thanthat. Think about it. What is the value addedof a corporate office that concentrates on mak-ing division managers accountable for finan-cial results that can be added up across divi-sions? We combine a business that’s doing wellwith a business that’s doing poorly and have atotal business that performs at an averagelevel. Why not split the company up into inde-pendent companies and let the market reallo-cate capital? If we were going to create valueby managing a group of diversified companies,we had to understand and provide strategicfocus to their operations. We had to be surethat each division had a strategy that wouldgive it sustainable competitive advantage. Inaddition, we had to be able to assess, throughmeasurement of their operations, whether ornot the divisions were meeting their strategicobjectives.
If you’re going to ask a division or the cor-poration to change its strategy, you had betterchange the system of measurement to be con-sistent with the new strategy.
How did the balanced scorecard emerge asthe remedy to the limitations of measuring onlyshort-term financial results?
In early 1992, we assembled a task force tointegrate our various corporate initiatives. Wewanted to understand what had to be done dif-ferently to achieve dramatic improvements inoverall organizational effectiveness. We ac-knowledged that the company may have be-come too short-term and too internally fo-cused in its business measures. Defining whatshould replace the financial focus was moredifficult. We wanted managers to sustain their
“The diversity of
initiatives, each with its
own slogan, created
confusion and mixed
signals.”

Putting the Balanced Scorecard to Work
harvard business review • september–october 1993 page 14
search for continuous improvement, but wealso wanted them to identify the opportunitiesfor breakthrough performance.
When divisions missed financial targets, thereasons were generally not internal. Typically,division management had inaccurately esti-mated market demands or had failed to fore-cast competitive reactions. A new measure-ment system was needed to lead operatingmanagers beyond achieving internal goals tosearching for competitive breakthroughs inthe global marketplace. The system wouldhave to focus on measures of customer service,market position, and new products that couldgenerate long-term value for the business. Weused the scorecard as the focal point for thediscussion. It forced division managers to an-swer these questions: How do we become ourcustomers’ most valued supplier? How do webecome more externally focused? What is mydivision’s competitive advantage? What is itscompetitive vulnerability?
How did you launch the scorecard effort atFMC?
We decided to try a pilot program. We se-lected six division managers to develop proto-type scorecards for their operations. Each divi-sion had to perform a strategic analysis toidentify its sources of competitive advantage.The 15 to 20 measures in the balanced score-card had to be organization-specific and had tocommunicate clearly what short-term mea-sures of operating performance were consis-tent with a long-term trajectory of strategicsuccess.
Were the six division managers free to developtheir own scorecard?
We definitely wanted the division managersto perform their own strategic analysis and todevelop their own measures. That was an es-sential part of creating a consensus betweensenior and divisional management on operat-ing objectives. Senior management did, how-ever, place some conditions on the outcomes.
First of all, we wanted the measures to beobjective and quantifiable. Division managerswere to be just as accountable for improvingscorecard measures as they had been for usingmonthly financial reviews. Second, we wantedoutput measures not process-oriented mea-sures. Many of the improvement programsunder way were emphasizing time, quality,and cost measurements. Focusing on T-Q-Cmeasurements, however, encourages manag-
ers to seek narrow process improvements in-stead of breakthrough output targets. Focus-ing on achieving outputs forces divisionmanagers to understand their industry andstrategy and help them to quantify strategicsuccess through specific output targets.
Could you illustrate the distinction betweenprocess measures and output measures?
You have to understand your industry wellto develop the connection between process im-provements and outputs achieved. Take threedivisional examples of cycle-time measure-ment, a common process measure.
For much of our defense business, no pre-mium is earned for early delivery. And the con-tracts allow for reimbursement of inventoryholding costs. Therefore, attempts to reduceinventory or cycle times in this business pro-duce no benefit for which the customer is will-ing to pay. The only benefits from cycle timeor inventory reduction occur when reductionin factory-floor complexity leads to real reduc-tions in product cost. The output performancetargets must be real cash savings, not reducedinventory levels or cycle times.
In contrast, significant lead-time reductionscould be achieved for our packaging machin-ery business. This improvement led to lowerinventory and an option to access an addi-tional 35% of the market. In this case, thecycle-time improvements could be tied to spe-cific targets for increased sales and marketshare. It wasn’t linear, but output seemed toimprove each time we improved throughputtimes.
And in one of our agricultural machinerybusinesses, orders come within a narrow timewindow each year. The current build cycle islonger than the ordering window, so all unitsmust be built to the sales forecast. This processof building to forecast leads to high inven-tory—more than twice the levels of our otherbusinesses—and frequent overstocking and ob-solescence of equipment. Incremental reduc-tions in lead time do little to change the eco-nomics of this operation. But if the build cycletime could be reduced to less than the six-weekordering time window for part or all of thebuild schedule, then a breakthrough occurs.The division can shift to a build-to-order sched-ule and eliminate the excess inventory causedby building to forecasts. In this case, the bene-fit from cycle-time reductions is a step-func-tion that comes only when the cycle time
“If you’re going to ask a
division or the
corporation to change its
strategy, you had better
change the system of
measurement.”

Putting the Balanced Scorecard to Work
harvard business review • september–october 1993 page 15
drops below a critical level.So here we have three businesses, three dif-
ferent processes, all of which could have elabo-rate systems for measuring quality, cost, andtime but would feel the impact of improve-ments in radically different ways. With all thediversity in our business units, senior manage-ment really can’t have a detailed understand-ing of the relative impact of time and qualityimprovements on each unit. All of our seniormanagers, however, understand output tar-gets, particularly when they are displayed withhistorical trends and future targets.
Benchmarking has become popular with a lotof companies. Does it tie in to the balanced score-card measurements?
Unfortunately, benchmarking is one ofthose initially good ideas that has turned into afad. About 95% of those companies that havetried benchmarking have spent a lot of moneyand have gotten very little in return. And thedifference between benchmarking and thescorecard helps reinforce the difference be-tween process measures and output measures.It’s a lot easier to benchmark a process than tobenchmark an output. With the scorecard, weask each division manager to go outside theirorganization and determine the approachesthat will allow achievement of their long-termoutput targets. Each of our output measureshas an associated long-term target. We havebeen deliberately vague on specifying whenthe target is to be accomplished. We want tostimulate a thought process about how to dothings differently to achieve the target ratherthan how to do existing things better. The ac-tivity of searching externally for how othershave accomplished these breakthroughachievements is called target verification notbenchmarking.
Were the division managers able to developsuch output-oriented measures?
Well, the division managers did encountersome obstacles. Because of the emphasis onoutput measures and the previous focus on op-erations and financial measures, the customerand innovation perspectives proved the mostdifficult. These were also the two areas wherethe balanced scorecard process was most help-ful in refining and understanding our existingstrategies.
But the initial problem was that the man-agement teams ran afoul of both conditions:the measures they proposed tended to be non-
quantifiable and input- rather than output-oriented. Several divisions wanted to conductcustomer surveys and provide an index of theresults. We judged a single index to be of littlevalue and opted instead for harder measuressuch as price premiums over competitors.
We did conclude, however, that the full cus-tomer survey was an excellent vehicle for pro-moting external focus and, therefore, decidedto use survey results to kick-off discussion atour annual operating reviews.
Did you encounter any problems as youlaunched the six pilot projects?
At first, several divisional managers wereless than enthusiastic about the additionalfreedom they were being given from head-quarters. They knew that the heightened visi-bility and transparency of the scorecard tookaway the internal trade-offs they had gainedexperience in making. They initially inter-preted the increase in visibility of divisionalperformance as just the latest attempt by cor-porate staff to meddle in their internal busi-ness processes.
To offset this concern, we designed targetsaround long-term objectives. We still closelyexamine the monthly and quarterly statistics,but these statistics now relate to progress inachieving long-term objectives and justify theproper balance between short-term and long-term performance.
We also wanted to transfer quickly thefocus from a measurement system to achiev-ing performance results. A measurement ori-entation reinforces concerns about control anda short-term focus. By emphasizing targetsrather than measurements, we could demon-strate our purpose to achieve breakthroughperformance.
But the process was not easy. One divisionmanager described his own three-stage imple-mentation process after receiving our directiveto build a balanced scorecard: denial—hope itgoes away; medicinal—it won’t go away, solet’s do it quickly and get it over with; owner-ship—let’s do it for ourselves.
In the end, we were successful. We nowhave six converts who are helping us to spreadthe message throughout the organization.
I understand that you have started to applythe scorecard not just to operating units but tostaff groups as well.
Applying the scorecard approach to staffgroups has been even more eye-opening than
“I see the scorecard as a
strategic measurement
system, not a measure of
our strategy.”
Putting the Balanced Scorecard to Work
harvard business review • september–october 1993 page 16
our initial work with the six operating divi-sions. We have done very little to define ourstrategy for corporate staff utilization. I doubtthat many companies can respond crisply tothe question, “How does staff provide competi-tive advantage?’’ Yet we ask that questionevery day about our line operations. We havejust started to ask our staff departments to ex-plain to us whether they are offering low costor differentiated services. If they are offeringneither, we should probably outsource thefunction. This area is loaded with real poten-tial for organizational development and im-proved strategic capability.
My conversations with financial people in or-ganizations reveal some concern about the ex-panded responsibilities implied by developingand maintaining a balanced scorecard. Howdoes the role of the controller change as a com-pany shifts its primary measurement system froma purely financial one to the balanced scorecard?
Historically, we have had two corporate de-partments involved in overseeing business unitperformance. Corporate development was incharge of strategy, and the controller’s officekept the historical records and budgeted andmeasured short-term performance. Strategistscame up with five- and ten-year plans, control-lers one-year budgets and near-term forecasts.Little interplay occurred between the twogroups. But the scorecard now bridges the two.The financial perspective builds on the tradi-tional function performed by controllers. Theother three perspectives make the division’slong-term strategic objectives measurable.
In our old environment, division managerstried to balance short-term profits with long-term growth, while they were receiving differ-ent signals depending on whether or not theywere reviewing strategic plans or budgets. Thisstructure did not make the balancing of short-term profits and long-term growth an easytrade-off, and, frankly, it let senior manage-ment off the hook when it came to sharing re-sponsibility for making the trade-offs.
Perhaps the corporate controller shouldtake responsibility for all measurement andgoal setting, including the systems required toimplement these processes. The new corporatecontroller could be an outstanding system ad-ministrator, knowledgeable about the varioustrade-offs and balances, and skillful in report-ing and presenting them. This role does noteliminate the need for strategic planning. It
just makes the two systems more compatible.The scorecard can serve to motivate and evalu-ate performance. But I see its primary value asits ability to join together what had beenstrong but separated capabilities in strategy de-velopment and financial control. It’s the oper-ating performance bridge that corporationshave never had.
How often do you envision reviewing a divi-sion’s balanced scorecard?
I think we will ask group managers to re-view a monthly submission from each of theirdivisions, but the senior corporate team willprobably review scorecards quarterly on a ro-tating basis so that we can review up to sevenor eight division scorecards each month.
Isn’t it inconsistent to assess a division’s strat-egy on a monthly or quarterly basis? Doesn’t sucha review emphasize short-term performance?
I see the scorecard as a strategic measure-ment system, not a measure of our strategy.And I think that’s an important distinction.The monthly or quarterly scorecard measuresoperations that have been configured to beconsistent with our long-term strategy.
Here’s an example of the interaction be-tween the short and the long term. We havepushed division managers to choose measuresthat will require them to create change, for ex-ample, penetration of key markets in whichwe are not currently represented. We can mea-sure that penetration monthly and get valu-able short-term information about the ulti-mate success of our long-term strategy. Ofcourse, some measures, such as annual marketshare and innovation metrics, don’t lendthemselves to monthly updates. For themost part, however, the measures are calcu-lated monthly.
Any final thoughts on the scorecard?
I think that it’s important for companiesnot to approach the scorecard as the latest fad.I sense that a number of companies are turn-ing to scorecards in the same way they turnedto total quality management, high-perfor-mance organization, and so on. You hearabout a good idea, several people on corporatestaff work on it, probably with some expensiveoutside consultants, and you put in a systemthat’s a bit different from what existed before.Such systems are only incremental, and youdon’t gain much additional value from them.
It gets worse if you think of the scorecard asa new measurement system that eventually re-
Putting the Balanced Scorecard to Work
harvard business review • september–october 1993 page 17
quires hundreds and thousands of measure-ments and a big, expensive executive informa-tion system. These companies lose sight of theessence of the scorecard: its focus, its simplic-ity, and its vision. The real benefit comes frommaking the scorecard the cornerstone of theway you run the business. It should be the coreof the management system, not the measure-ment system. Senior managers alone will de-termine whether the scorecard becomes a
mere record-keeping exercise or the lever tostreamline and focus strategy that can lead tobreakthrough performance.
Reprint 93505;
Harvard Business Review
OnPoint 4118
To order, see the next pageor call 800-988-0886 or 617-783-7500or go to www.hbr.org

Putting the Balanced Scorecard to Work
To Order
For reprints, Harvard Business Review OnPoint orders, and subscriptions to Harvard Business Review:Call 800-988-0886 or 617-783-7500.Go to www.hbr.org
For customized and quantity orders of reprints and Harvard Business Review OnPoint products:Call Frank Tamoshunas at 617-783-7626, or e-mail him at [email protected]
page 18
Further ReadingA R T I C L E SThe Balanced Scorecard: Measures That Drive Performanceby Robert S. Kaplan and David P. NortonHarvard Business ReviewJanuary–February 1992Product no. 4096
This article introduced the concept of a bal-anced scorecard to Harvard Business Review readers. Traditional performance measure-ment systems focus on control, the authors argue—for example, measuring the number of widgets produced against the number budgeted. But a balanced scorecard approach to performance focuses on vision and strat-egy. It provides a comprehensive snapshot of a business by combining financial measures with metrics for customer satisfaction, key in-ternal processes, and organizational learning and growth.
Using the Balanced Scorecard as a Strategic Management Systemby Robert S. Kaplan and David P. NortonHarvard Business ReviewJanuary–February 1996Product no. 4126
Traditional management systems that rely heavily on financial metrics are typically un-able to link a company’s long-term strategy with its short-term actions. In their third Har-vard Business Review article about the bal-anced scorecard, Kaplan and Norton demon-strate how the scorecard helps a company clarify and update strategy, communicate that strategy throughout the company, align unit and individual goals with the strategy, link strategic objectives to long-term targets and annual budgets, and conduct periodic perfor-mance reviews to improve the strategy. In es-sence, a balanced scorecard functions best as the cornerstone of a strategic management system.
The Performance Measurement Manifestoby Robert G. EcclesHarvard Business ReviewJanuary–February 1991Product no. 91103
Eccles’s main contention echoes that of Ka-plan and Norton: the leading indicators of business performance cannot be found in fi-nancial data alone. More and more managers are changing their company’s performance measurement systems to track nonfinancial measures and reinforce new competitive strategies. Five activities are essential, writes the author: developing an information archi-tecture; putting the technology in place to support this architecture; aligning bonuses and other new incentives with the system; drawing on outside resources; and designing an internal process to ensure that the other four activities occur.
B O O KThe Balanced Scorecard: Translating Strategy into Actionby Robert S. Kaplan and David P. NortonHarvard Business School Press1996Product no. 6513
Developing and using a balanced scorecard helps executives solve what is perhaps their most central issue: how to implement strat-egy, particularly one that requires radical change. This book builds on the authors’ three Harvard Business Review articles, providing ad-ditional insight into the mechanics of choos-ing measures for each of the four scorecard perspectives. Extended examples from indus-tries such as oil, banking, insurance, and retail-ing demonstrate how companies have built scorecards tailored to their particular compet-itive challenges and strategic goals.

2nd article from the collection: Focusing Your Organization on Strategy—with the Balanced Score-card, 2nd Edition
page 19
Measuring the Strategic Readiness of Intangible Assets
by Robert S. Kaplan and David P. Norton
Included with this full-text Harvard Business Review article:
The Idea in Brief—the core idea
The Idea in Practice—putting the idea to work
20 Article Summary
21 Measuring the Strategic Readiness of Intangible Assets
A list of related materials, with annotations to guide further
exploration of the article’s ideas and applications
34 Further Reading
Product 5887

Measuring the Strategic Readiness of Intangible
Assets
page 20
The Idea in Brief The Idea in Practice
CO
PYR
IGH
T ©
200
4 H
AR
VA
RD
BU
SIN
ESS
SC
HO
OL
PU
BLI
SHIN
G C
OR
PO
RA
TIO
N. A
LL R
IGH
TS
RE
SER
VE
D.
You’ve formulated a sound strategy—but can you execute it? To answer that, mea-sure the strategic readiness of your intan-gible assets: how well your employees’ skills, your information and technical sys-tems, and your leadership and organiza-tional culture align with your strategy.
But how do you measure this alignment? Using Balanced Scorecard assessment tools, determine how strongly your intangi-ble assets enhance the processes—creat-ing, producing, and delivering valuable of-ferings to customers—that generate the revenue needed to meet your long-term fi-nancial goals.
When you measure your intangible assets’ alignment with your strategy, you more easily see ways to improve each asset’s alignment. For example:
• Strengthen skills of employees in the most strategically critical jobs—rather than all employees.
• Put the right technical systems in place (customer databases, knowledge man-agement systems) to execute your strat-egy.
• Cultivate exceptional leaders and a cohe-sive workforce committed to sharing knowledge and achieving strategic goals.
By assessing and then enhancing the align-ment of your company’s human, informa-tion, and organizational capital, you un-leash those intangible assets’ full power.
To measure your intangible assets’ strategic readiness, determine what human, informa-tion, and organizational capital your company needs to perform the internal processes most critical to your strategy. Then assess your cur-rent capabilities in all three areas. Finally, iden-tify and address gaps.
HUMAN CAPITAL
Certain jobs have a particularly significant im-pact on your organization’s ability to perform the processes most critical to your strategy. These strategic job families often employ less than 10% of a company’s workforce. Identify the strategic job families in your company, then list the knowledge and skills employees in those job families require. Watch for gaps between employees’ required and current ca-pabilities.
Example:Consumer Bank shifted its strategy from promoting individual products to offering customers one-stop financial-solutions shopping. For its critical internal process “cross-sell the product line,” financial plan-ning was the most crucial job—which re-quired solution selling, relationship man-agement, and other fundamental skills.
The bank estimated it needed 100 skilled fi-nancial planners for effective cross-selling. But assessments revealed only 40 proficient planners. The bank knew where to invest to improve its human capital’s strategic readi-ness.
INFORMATION CAPITAL
To gauge how well your information capital (IC) supports your organization’s strategy, identify the IT systems needed to support each critical internal process. These may in-clude infrastructure (central servers, commu-nication networks), software applications, and managerial expertise (standards, disaster plan-ning, security).
Determine whether needed systems:
• are available and operating normally
• have been identified and funded but aren’t installed or operational
• have been identified but not funded
To get the fullest picture of your IC readiness, combine these qualitative assessments with quantitative ones—such as user-satisfaction surveys and analyses of IT operations and maintenance costs.
ORGANIZATIONAL CAPITAL
To measure your organizational capital’s (OC) readiness, ask these questions:
• Culture: Which corporate-wide and unit-specific behaviors and attitudes (for exam-ple, commitment to customer satisfaction, respect, innovativeness) does executing your strategy require?
• Leadership: What competencies (ability to inculcate specific values or encourage teamwork and accountability) do your firm’s leaders need to implement strategy?
• Alignment: What communications (town meetings, training programs) and incen-tives (rewards for meeting personal and corporate targets) would help employees understand the strategy and their roles in supporting it?
• Teamwork and knowledge sharing: What must you do to encourage employees to share their ideas and knowledge with oth-ers? What formal knowledge management systems would help?

Measuring the Strategic Readiness of Intangible Assets
by Robert S. Kaplan and David P. Norton
harvard business review • february 2004 page 21
CO
PYR
IGH
T ©
200
4 H
AR
VA
RD
BU
SIN
ESS
SC
HO
OL
PU
BLI
SHIN
G C
OR
PO
RA
TIO
N. A
LL R
IGH
TS
RE
SER
VE
D.
A real—and revolutionary—opportunity lies in studying and
assessing how well prepared a company’s people, systems, and culture
are to carry out its strategy.
How valuable is a company culture that en-ables employees to understand and believe intheir organization’s mission, vision, and corevalues? What’s the payoff from investing in aknowledge management system or in a newcustomer database? Is it more important toimprove the skills of all employees or focus onthose in just a few key positions?
Measuring the value of such intangible as-sets is the holy grail of accounting. Employees’skills, IT systems, and organizational culturesare worth far more to many companies thantheir tangible assets. Unlike financial and phys-ical ones, intangible assets are hard for com-petitors to imitate, which makes them a pow-erful source of sustainable competitiveadvantage. If managers could find a way to es-timate the value of their intangible assets, theycould measure and manage their company’scompetitive position much more easily and ac-curately.
But that’s simpler said than done. Unlike fi-nancial and physical assets, intangible assetsare worth different things to different people.
An oil well, for example, is almost as valuableto a retail firm as it is to an oil exploration cor-poration because either company could sell itswiftly if necessary. But a workforce with astrong sense of customer service and satisfac-tion is worth far more to the retailer than itwould be to the oil company. Also, unlike tan-gible assets, intangible assets almost never cre-ate value by themselves. They need to be com-bined with other assets. Investments in IT, forexample, have little value unless comple-mented with HR training and incentive pro-grams. And, conversely, many HR training pro-grams have little value unless complementedwith modern technology tools. HR and IT in-vestments must be integrated and aligned withcorporate strategy if the organization is to real-ize their full potential. Indeed, when compa-nies separate functions like HR and IT organi-zationally, they usually end up with competingsilos of technical specialization. The HR de-partment argues for increases in employeetraining, while the IT department lobbies forbuying new hardware and software packages.

Measuring the Strategic Readiness of Intangible Assets
harvard business review • february 2004 page 22
What’s more, intangible assets seldom af-fect financial performance directly. Instead,they work indirectly through complex chainsof cause and effect. Training employees inTotal Quality Management and Six Sigma, forinstance, should improve process quality. Thatimprovement should then increase customersatisfaction and loyalty—and also create someexcess resource capacity. But only if the com-pany can transform that loyalty into improvedsales and margins and eliminate or redeploythe excess resources will the investment intraining pay off. By contrast, the impact of anew tangible asset is immediate: When a re-tailer develops a new site, it sees financial ben-efits from the sales in the newly opened outletright away.
Although these characteristics make it im-possible to value intangible assets on a free-standing basis, they also point the way to anew approach for quantifying how intangibleassets add value to the company. By under-standing the problems associated with valuingintangible assets, we learn that the measure-ment of the value they create is embedded inthe context of the strategy the company is pur-suing. Companies such as Dell, Wal-Mart, orMcDonald’s that are following a low-cost strat-egy derive value from Six Sigma and TQMtraining because their strategies are predicatedon continuous process improvement. Thestrategy of offering customers integrated solu-tions (rather than discrete products) pursuedby Goldman Sachs, IBM Consulting, and thelike requires employees good at establishingand maintaining long-term customer relation-ships. An organization cannot possibly assign ameaningful financial value to an intangibleasset like “a motivated and prepared work-force” in a vacuum because value can be de-rived only in the context of the strategy. Whatthe company can measure, however, iswhether its workforce is properly trained andmotivated to pursue a particular goal.
Viewed in this light, it becomes clear thatmeasuring the value of intangible assets is re-ally about estimating how closely alignedthose assets are to the company’s strategy. Ifthe company has a sound strategy and if the in-tangible assets are aligned with that strategy,then the assets will create value for the organi-zation. If the assets are not aligned with thestrategy or if the strategy is flawed, then intan-gible assets will create little value, even if large
amounts have been spent on them.In the following pages, we will draw on the
concepts and tools of the Balanced Scorecardto present a way to systematically measure thealignment of the company’s human, informa-tion, and organization capital—what we callits strategic readiness—without which even thebest strategy cannot succeed.
Defining Strategic ReadinessIn developing the Balanced Scorecard morethan a decade ago, we identified, in its Learn-ing and Growth Perspective, three categoriesof intangible assets essential for implement-ing any strategy:
• Human Capital: the skills, talent, andknowledge that a company’s employees pos-sess.
• Information Capital: the company’s data-bases, information systems, networks, andtechnology infrastructure.
• Organization Capital: the company’s cul-ture, its leadership, how aligned its people arewith its strategic goals, and employees’ abilityto share knowledge.
To link these intangible assets to a com-pany’s strategy and performance, we devel-oped a tool called the “strategy map,” whichwe first introduced in our previous article forHarvard Business Review, “Having Troublewith Your Strategy? Then Map It” (Septem-ber–October 2000). As the exhibit “The Strat-egy Map” shows, intangible assets influence acompany’s performance by enhancing the in-ternal processes most critical to creating valuefor customers and shareholders. Companiesbuild their strategy maps from the top down,starting with their long-term financial goalsand then determining the value propositionthat will deliver the revenue growth specifiedin those goals, identifying the processes mostcritical to creating and delivering that valueproposition, and, finally, determining the hu-man, information, and organization capitalthe processes require.
This article focuses on the bottom—thefoundation—of the map and will show how in-tangible assets actually determine the perfor-mance of the critical internal processes. Oncethat link has been established, it becomes easyto trace the steps back up the map to see ex-actly how intangible assets relate to the com-pany’s strategy and performance. That, inturn, makes it possible to align those assets
Robert S. Kaplan ([email protected]) isthe Marvin Bower Professor of Leader-ship Development at Harvard BusinessSchool in Boston. David P. Norton([email protected]) is the founderand president of the Balanced Score-card Collaborative (www.bscol.com) inLincoln, Massachusetts. This article isbased on their book Strategy Maps:Converting Intangible Assets into Tan-gible Outcomes (Harvard BusinessSchool Press, 2004).
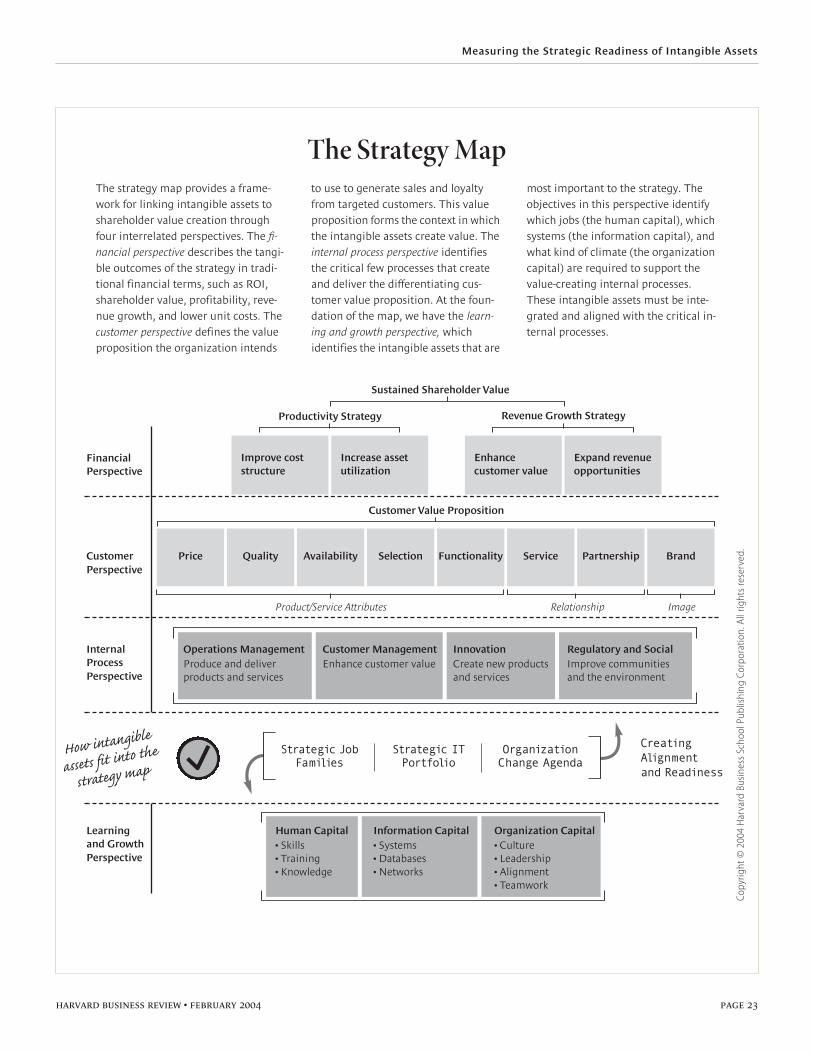
Measuring the Strategic Readiness of Intangible Assets
harvard business review • february 2004 page 23
The Strategy MapThe strategy map provides a frame-work for linking intangible assets to shareholder value creation through four interrelated perspectives. The fi-
nancial perspective describes the tangi-ble outcomes of the strategy in tradi-tional financial terms, such as ROI, shareholder value, profitability, reve-nue growth, and lower unit costs. The customer perspective defines the value proposition the organization intends
to use to generate sales and loyalty from targeted customers. This value proposition forms the context in which the intangible assets create value. The internal process perspective identifies the critical few processes that create and deliver the differentiating cus-tomer value proposition. At the foun-dation of the map, we have the learn-
ing and growth perspective, which identifies the intangible assets that are
most important to the strategy. The objectives in this perspective identify which jobs (the human capital), which systems (the information capital), and what kind of climate (the organization capital) are required to support the value-creating internal processes. These intangible assets must be inte-grated and aligned with the critical in-ternal processes.
Learning and GrowthPerspective
Productivity Strategy Revenue Growth Strategy
Sustained Shareholder Value
Operations Management Produce and deliver products and services
Customer Management Enhance customer value
InnovationCreate new products and services
Regulatory and SocialImprove communities and the environment
Customer Value Proposition
Human Capital• Skills• Training• Knowledge
Information Capital• Systems• Databases• Networks
Organization Capital• Culture• Leadership• Alignment• Teamwork
Financial Perspective
CustomerPerspective
Internal ProcessPerspective
Improve cost structure
BrandPrice Quality Availability Selection Functionality Service Partnership
Relationship ImageProduct/Service Attributes
Increase assetutilization
Enhance customer value
Expand revenueopportunities
Strategic JobFamilies
Strategic ITPortfolio
CreatingAlignment and Readiness
OrganizationChange Agenda
Co
pyrig
ht ©
200
4 H
arva
rd B
usin
ess
Scho
ol P
ublis
hing
Cor
pora
tion.
All
right
s re
serv
ed.
Measuring the Strategic Readiness of Intangible Assets
harvard business review • february 2004 page 24
with the strategy and measure their contribu-tion to it. The degree to which the current setof assets does—or does not—contribute to theperformance of the critical internal processesdetermines the strategic readiness of those as-sets and thus their value to the organization.The strategic readiness of each type of intangi-ble asset can be thought of as follows:
Human Capital (HC): In the case of humancapital, strategic readiness is measured bywhether employees have the right kind andlevel of skills to perform the critical internalprocesses on the strategy map. The first step inestimating HC readiness is to identify the stra-tegic job families—the positions in which em-ployees with the right skills, talent, and knowl-edge have the biggest impact on enhancingthe organization’s critical internal processes.The next step is to pinpoint the set of specificcompetencies needed to perform each ofthose strategic jobs. The difference betweenthe requirements needed to carry out thesejobs effectively and the company’s current ca-pabilities represents a “competency gap” thatmeasures the organization’s HC readiness.
Information Capital (IC): The strategicreadiness of information capital is a measureof how well the company’s strategic IT portfo-lio of infrastructure and applications supportsthe critical internal processes. Infrastructurecomprises hardware—such as central serversand communication networks—and the man-agerial expertise—such as standards, disasterplanning, and security—required to effec-tively deliver and use applications. Two cate-gories of applications, in turn, are built on thisinfrastructure: Transaction-processing applica-tions, such as an ERP system, automate thebasic repetitive transactions of the enterprise.Analytic applications promote analysis, inter-pretation, and sharing of information andknowledge. Either type may or may not bea transformational application—one thatchanges the prevailing business model of theenterprise. Levi’s uses a transformational ap-plication to tailor jeans to individual custom-ers. Home Shopping Network uses a transfor-mational application to measure the “profitsper second” being generated by currently of-fered merchandise. Transformational applica-tions have the most potential impact on stra-tegic objectives and require the greatestdegree of organization change to deliver theirbenefits.
Organization Capital (OC): Organizationcapital is perhaps the least understood of theintangible assets, and the task of measuring itis correspondingly difficult. But in looking atthe strategic priorities that companies in ourdatabase of Balanced Scorecard implementa-tions used for their organization capital objec-tives, we found a consistent picture. Success-ful companies had a culture in which peoplewere deeply aware of and internalized themission, vision, and core values needed to exe-cute the company’s strategy. These companiesstrove for excellent leadership at all levels,leadership that could mobilize the organiza-tion toward its strategy. They strove for a clearalignment between the organization’s strate-gic objectives and individual, team, and de-partmental goals and incentives. Finally, thesecompanies promoted teamwork, especially thesharing of strategic knowledge throughoutthe organization. Determining OC readiness,we concluded, would involve first identifyingthe changes in organization capital requiredby the new strategy—what we call the “orga-nization change agenda”—and then sepa-rately identifying and measuring the state ofreadiness of the company’s cultural, leader-ship, alignment, and teamwork objectives.
Strategic readiness is related to the conceptof liquidity, which accountants use to classifyfinancial and physical assets on a company’sbalance sheet. Accountants divide a firm’s as-sets into various categories, such as cash, ac-counts receivable, inventory, property, plantand equipment, and long-term investments.These are ordered hierarchically according tothe ease and speed with which they can beconverted to cash—in other words, accordingto the degree of their liquidity. Accounts re-ceivable is more liquid than inventory, andboth accounts receivable and inventory areclassified as short-term assets since they typi-cally convert to cash within 12 months, fasterthan the cash recovery cycle from such illiquidassets as plant and equipment. Strategic readi-ness does much the same for intangible as-sets—the higher their state of readiness, thefaster they contribute to generating cash.
Human Capital ReadinessAll jobs are important to the organization;otherwise, people wouldn’t be hired and paidto perform them. Organizations may requiretruck drivers, computer operators, production

Measuring the Strategic Readiness of Intangible Assets
harvard business review • february 2004 page 25
Human Capital Readiness at Consumer BankHere we can see how human capital at our composite company, Consumer Bank, is linked to its critical strategic processes and how well the company scores in terms of the skills and capa-bilities it needs. The top row lists the internal processes the bank identified as critical to delivering its value propo-sition. The second row shows the jobs that have the greatest influence on those processes—the strategic job fami-
lies. The third row lists the competen-
cies needed for each job, and the fourth row specifies the number of people with those skills the company requires.
The bottom row shows how ready Consumer Bank’s human capital is for its new strategy. Taken together, these internal assessments indicate the ex-tent to which the bank actually has the capacity it needs. The bank is in excel-lent shape for its two operations man-agement processes (100% and 90%
readiness) but deficient for the two customer management processes (only 40% and 50% readiness) and for one of the innovation processes (20% readiness). The aggregate measure of 65% human capital readiness (in the red zone) is a weighted average of readiness scores for all seven strategic job families. In terms of human capi-tal, this report tells executives how quickly they can implement their new strategy.
Strategic JobReadiness
Operations Management Customer Management
• Six Sigma program
• Problemmanagementsystem
• Customer interactioncenter
• Problemmanagementsystem
• Team building
• Solutionsselling
• Relationshipmanagement
• Product-lineknowledge
• Professionalcertification
• Communityroots
• Public relations
• Legal frameworks
NumberRequired
Qualitymanager
Call center representative
Certified financialplanner
Telemarketer Consumermarketer
Joint venturemanager
Communityrecruiter
StrategicProcesses
Strategic Job Families
CompetencyProfile
InnovationRegulatory and Social
Minimize problems
Cross-sell theproduct line
Provide rapid response
Shift to appropriatechannel
Understandcustomersegments
Develop new products
Diversifyworkforce
• Phone selling
• Product-lineknowledge
• Order managementsystem
• Market research
• Marketcommuni-cation
• Cross-businessprocess
• Relationshipmanagement
• Negotiation
• E-commerceknow-how
30
?100% 90% 40% 50% 20% 70% 80% 65%
Overall Assessmentof Human CapitalReadiness
20 100 20 10 30 10
x x x x
Copy
right
© 2
004
Har
vard
Bus
ines
s Sc
hool
Publ
ishi
ng C
orpo
ratio
n. A
ll rig
hts
rese
rved
.
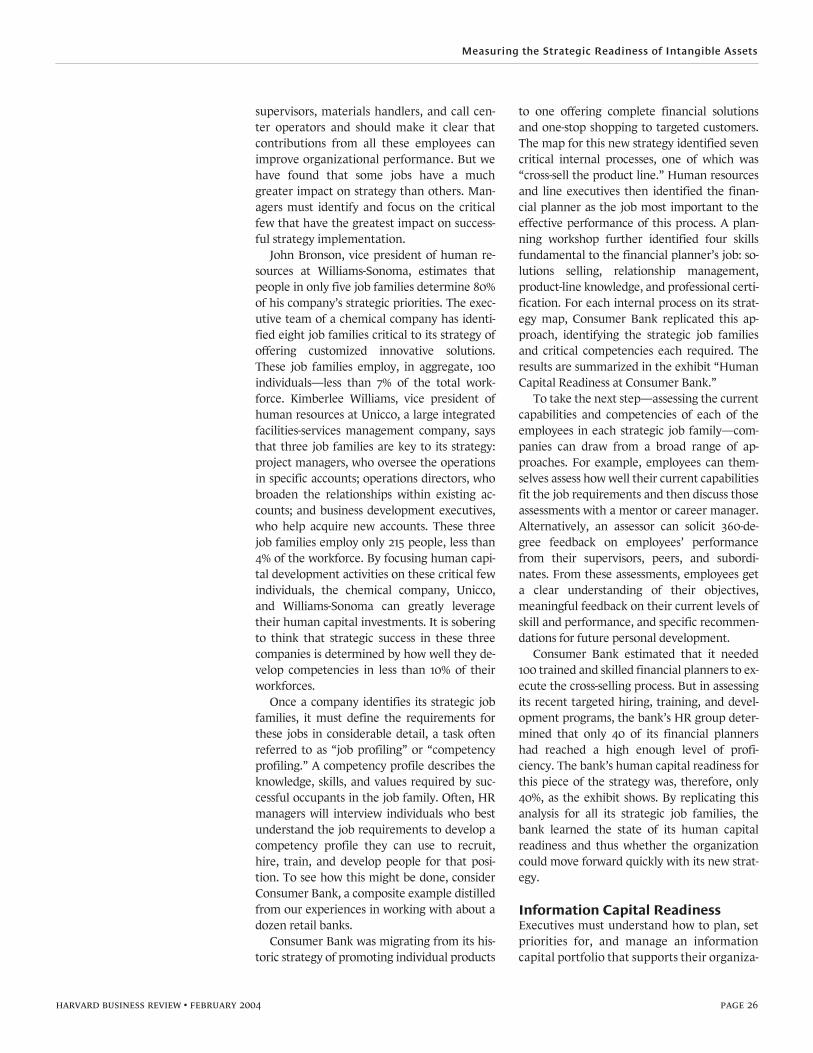
Measuring the Strategic Readiness of Intangible Assets
harvard business review • february 2004 page 26
supervisors, materials handlers, and call cen-ter operators and should make it clear thatcontributions from all these employees canimprove organizational performance. But wehave found that some jobs have a muchgreater impact on strategy than others. Man-agers must identify and focus on the criticalfew that have the greatest impact on success-ful strategy implementation.
John Bronson, vice president of human re-sources at Williams-Sonoma, estimates thatpeople in only five job families determine 80%of his company’s strategic priorities. The exec-utive team of a chemical company has identi-fied eight job families critical to its strategy ofoffering customized innovative solutions.These job families employ, in aggregate, 100individuals—less than 7% of the total work-force. Kimberlee Williams, vice president ofhuman resources at Unicco, a large integratedfacilities-services management company, saysthat three job families are key to its strategy:project managers, who oversee the operationsin specific accounts; operations directors, whobroaden the relationships within existing ac-counts; and business development executives,who help acquire new accounts. These threejob families employ only 215 people, less than4% of the workforce. By focusing human capi-tal development activities on these critical fewindividuals, the chemical company, Unicco,and Williams-Sonoma can greatly leveragetheir human capital investments. It is soberingto think that strategic success in these threecompanies is determined by how well they de-velop competencies in less than 10% of theirworkforces.
Once a company identifies its strategic jobfamilies, it must define the requirements forthese jobs in considerable detail, a task oftenreferred to as “job profiling” or “competencyprofiling.” A competency profile describes theknowledge, skills, and values required by suc-cessful occupants in the job family. Often, HRmanagers will interview individuals who bestunderstand the job requirements to develop acompetency profile they can use to recruit,hire, train, and develop people for that posi-tion. To see how this might be done, considerConsumer Bank, a composite example distilledfrom our experiences in working with about adozen retail banks.
Consumer Bank was migrating from its his-toric strategy of promoting individual products
to one offering complete financial solutionsand one-stop shopping to targeted customers.The map for this new strategy identified sevencritical internal processes, one of which was“cross-sell the product line.” Human resourcesand line executives then identified the finan-cial planner as the job most important to theeffective performance of this process. A plan-ning workshop further identified four skillsfundamental to the financial planner’s job: so-lutions selling, relationship management,product-line knowledge, and professional certi-fication. For each internal process on its strat-egy map, Consumer Bank replicated this ap-proach, identifying the strategic job familiesand critical competencies each required. Theresults are summarized in the exhibit “HumanCapital Readiness at Consumer Bank.”
To take the next step—assessing the currentcapabilities and competencies of each of theemployees in each strategic job family—com-panies can draw from a broad range of ap-proaches. For example, employees can them-selves assess how well their current capabilitiesfit the job requirements and then discuss thoseassessments with a mentor or career manager.Alternatively, an assessor can solicit 360-de-gree feedback on employees’ performancefrom their supervisors, peers, and subordi-nates. From these assessments, employees geta clear understanding of their objectives,meaningful feedback on their current levels ofskill and performance, and specific recommen-dations for future personal development.
Consumer Bank estimated that it needed100 trained and skilled financial planners to ex-ecute the cross-selling process. But in assessingits recent targeted hiring, training, and devel-opment programs, the bank’s HR group deter-mined that only 40 of its financial plannershad reached a high enough level of profi-ciency. The bank’s human capital readiness forthis piece of the strategy was, therefore, only40%, as the exhibit shows. By replicating thisanalysis for all its strategic job families, thebank learned the state of its human capitalreadiness and thus whether the organizationcould move forward quickly with its new strat-egy.
Information Capital ReadinessExecutives must understand how to plan, setpriorities for, and manage an informationcapital portfolio that supports their organiza-

Measuring the Strategic Readiness of Intangible Assets
harvard business review • february 2004 page 27
The first two rows of the information capital readiness report, like the human capital report, list the
company’s critical internal processes and its strategic job families. The remaining five rows specify the
various items in the IC portfolio, assigning scores indicating how well developed each item is. In this
example, Consumer Bank has the IC portfolio it needs to support innovation but is less able to support
the jobs most critical to its customer management and operational excellence goals.
Information Capital Readiness at Consumer Bank
Operations Management Customer Management
Service qualityanalysis 2
Customer self-help 4
Customerprofitability3
Technology Infrastructure
Quality manager
Call center representative
Certified financial planner
Telemarketer Consumermarketer
Joint venturemanager
StrategicProcesses
Strategic Job Families
AnalyticalApplications
Innovation
Minimize problems
Cross-sell theproduct line
Provide rapid response
Shift to appropriatechannel
Understandcustomersegments
Develop new products
?
Incident tracking 6
Problem management 2
Best-practicecommunityknowledgemanagementsystem3
Transforma-tional Appli-cations
Transaction-ProcessingApplications
CombinedReadiness Level
CRM packagedsoftware 2
CRM packagedsoftware 2
Web enabled 3
Web enabled 3
Computer telephony integrated 4
Web enabled 3
Computer telephony integration 4
Computer telephony integration 4
Interactivevoice response 3
Customerportfolio self-management4
Integratedcustomer file2
Best-practicecommunityknowledgemanagementsystem2
CRM/leadmanagement6
CRM/ordermanagement2
CRM/salesforce auto-mation4
Customerprofitability3
Best-practicecommunityknowledgemanagementsystem2
Customerfeedback2
Project management2
Strategic Information Capital Portfolio
Ratings
1OK
2Minor enhance-ments needed
3New developmentunder way
4New developmentbehind schedule
5Major enhance-ments required
6New application required
Workforcescheduling 3
Problem management 2
x x x
Copy
right
© 2
004
Har
vard
Busi
ness
Sch
ool P
ublis
hing
Corp
orat
ion.
All
right
s re
serv
ed.

Measuring the Strategic Readiness of Intangible Assets
harvard business review • february 2004 page 28
tion’s strategy. As with human capital, thestrategy map serves as a starting point for de-lineating a company’s IC objectives. In thecase of Consumer Bank, the chief informationofficer led an initiative to identify the specificinformation capital needs of each of the seveninternal processes previously identified as crit-ical to the bank’s new value proposition.
For the customer management process“cross-sell the product line,” the workshopteam identified an application for customersto analyze and manage their portfolios bythemselves (a customer portfolio self-manage-ment system) as a transformational applica-tion. The workshop team identified an analyti-cal application for the same process (acustomer profitability system) and a transac-tion-processing application (an integrated cus-tomer file). The internal process “understandcustomer segments” also needed a customerprofitability system, as well as a separatecustomer feedback system to support marketresearch. The process “shift to appropriatechannel” required a strong foundation oftransactional systems, including a packagedCRM software suite that included modules forlead management, order management, andsales force automation. For the operations pro-cess “provide rapid response,” participantsidentified a transformational application (cus-tomer self-help) as well as an analytic applica-tion (a best-practice community knowledgemanagement system) for sharing successfulsales techniques among telemarketers. Finally,the “minimize problems” process required ananalytical application (service quality analy-sis) to identify problems and two related trans-action-level systems (one for incident trackingand another for problem management).
After defining its portfolio of IC applica-tions, the project team identified several re-quired components of IT infrastructure. Someapplications needed a CRM transactions data-base. Others required that a Web-enabled in-frastructure be integrated into the bank’s over-all Web site architecture. The team alsolearned about the need for an internal R&Dproject to develop a new interactive voice-re-sponse technology. All together, the bank’splanning process defined an information capi-tal portfolio made up of 14 unique applications(some of which supported more than one in-ternal process) and four IT infrastructureprojects. (See the exhibit “Information Capital
Readiness at Consumer Bank.”)The team then turned to assessing the readi-
ness of the bank’s existing portfolio of IC infra-structure and applications, assigning a numeri-cal indicator from 1 to 6 to each system. Ascore of 1 or 2 indicates that the system is al-ready available and operating normally, per-haps needing only minor enhancements. Ascore of 3 or 4 indicates that the system hasbeen identified and funded but is not yet in-stalled or operational. In other words, currentcapability does not yet exist but developmentprograms are under way to close the gap. Ascore of 5 or 6 signals that a new infrastructureor application is needed to support the strat-egy, but nothing has yet been done to create,fund, and deliver the capability. Managers re-sponsible for the IC development programsprovided the subjective judgments for this sim-ple measurement system, and the CIO was re-sponsible for assessing the integrity of the re-ported numbers. In the IC exhibit, we can alsosee that Consumer Bank aggregated the readi-ness measures of individual applications andinfrastructure programs—designating themgreen, yellow, or red, based on the worst-caseapplication in the category—to create a portfo-lio status report. With such a report, managerscan see the strategic readiness of the organiza-tion’s information capital at a glance, easilypinpointing the areas in which more resourcesare needed. It is an excellent tool for monitor-ing a portfolio of information capital develop-ment programs.
Many sophisticated IT organizations al-ready use more quantitative, objective assess-ments of their information capital portfoliosthan the subjective process we’ve just de-scribed for Consumer Bank. These organiza-tions survey users to assess their satisfactionwith each system. They perform financial anal-yses to determine the operating and mainte-nance costs of each application. Some conducttechnical audits to assess the underlying qual-ity of the code, ease of use, quality of docu-mentation, and frequency of failure for eachapplication. From this profile, an organizationcan build strategies for managing its portfolioof existing IC assets just as one would managea collection of physical assets like machineryor a fleet of trucks. Applications with high lev-els of maintenance can be streamlined, for ex-ample, applications with high operating costscan be optimized, and applications with high

Measuring the Strategic Readiness of Intangible Assets
harvard business review • february 2004 page 29
levels of user dissatisfaction can be replaced.This more comprehensive approach can be ef-fective for managing a portfolio of applica-tions that are already operational.
Organization Capital ReadinessSuccess in performing the critical internal pro-cesses identified in an organization’s strategymap invariably requires an organization tochange in fundamental ways. Assessing OCreadiness is essentially about assessing howwell the company can mobilize and sustainthe organization change agenda associatedwith its strategy. For instance, if the strategyinvolves focusing on the customer, the com-pany needs to determine whether its existingculture is customer-centric, whether its lead-ers have the requisite skills to foster such a cul-ture, whether employees are aware of the goaland are motivated to deliver exceptional cus-tomer service, and, finally, how well employ-ees share with others their knowledge aboutthe company’s customers. Let’s explore howcompanies can make these kinds of assess-ments for each of the four OC dimensions.
Culture. Of the four, culture is perhaps themost complex and difficult dimension to un-derstand and describe because it encompassesa wider range of behavioral territory than theothers. That’s probably why “shaping the cul-ture” is the most often-cited objective in theLearning and Growth section of our BalancedScorecard database. Executives generally be-lieve that changes in strategy require basicchanges in the way business is conducted at alllevels of the organization, which means, ofcourse, that people will need to develop newattitudes and behaviors—in other words,change their culture.
Assessment of cultural readiness reliesheavily on employee surveys. But in preparingsurveys, companies need to distinguish clearlybetween the values that all employees share—the company’s base culture—and the percep-tions that employees have of their existing sys-tem—the climate. The concept of base culturehas its roots in anthropology, which defines anorganization’s culture as the symbols, myths,and rituals embedded in the group conscious-ness (or subconscious). To describe a com-pany’s base culture, therefore, you have to un-cover the organization’s systems of sharedmeanings, assumptions, and values.
The concept of climate has its roots in social
psychology and is determined by the way orga-nizational influences—such as the incentivestructure or the perceived warmth and supportof superiors and peers—affect employees’ mo-tivation and behavior. The anthropologicalcomponent reflects employees’ shared atti-tudes and beliefs independent of the actual or-ganizational infrastructure, while climate re-flects their shared perception of existingorganizational policies, practices, and proce-dures, both formal and informal.
Surveying perceptions of existing organiza-tional policies and practices is a fairly straight-forward task, but getting at the base culture re-quires a little more digging. Anthropologistsusually rely on storytelling to identify sharedbeliefs and images, but that approach is inade-quate for quantifying the alignment of cultureto strategy. Organizational behavior scholarshave developed measurement instruments,such as Charles O’Reilly and colleagues’ Orga-nizational Culture Profile, in which employeesrank 54 value statements according to theirperceived importance and relevance in the or-ganization. Once ranked, an organization’s cul-ture can be described with a reasonable degreeof reliability and validity. Then the organiza-tion can assess to what extent the existing cul-ture is consistent with its strategy and whatkinds of changes may be needed.
One caveat: Managers do need to be awarethat some variations in culture are necessaryand desirable in different operating units orfunctions. The culture of an R&D group, forexample, should be different from the cultureof a manufacturing unit; the culture of anemergent business unit should be differentfrom the culture of a mature one. Executivesshould strive for agreement throughout the or-ganization about corporatewide values such asintegrity, respect, treatment of colleagues, andcommitment to customer satisfaction. Butsome value statements in the survey instru-ment should refer to the culture of specific op-erating units. So, for example, surveys of theemployees in operations and service-deliveryunits would include statements about qualityand continuous improvement, whereas theR&D department survey might include state-ments about creativity and innovation. Foremployees involved in customer acquisition,statements might relate to retention andgrowth or to a deep understanding of individ-ual customers’ preferences and needs.
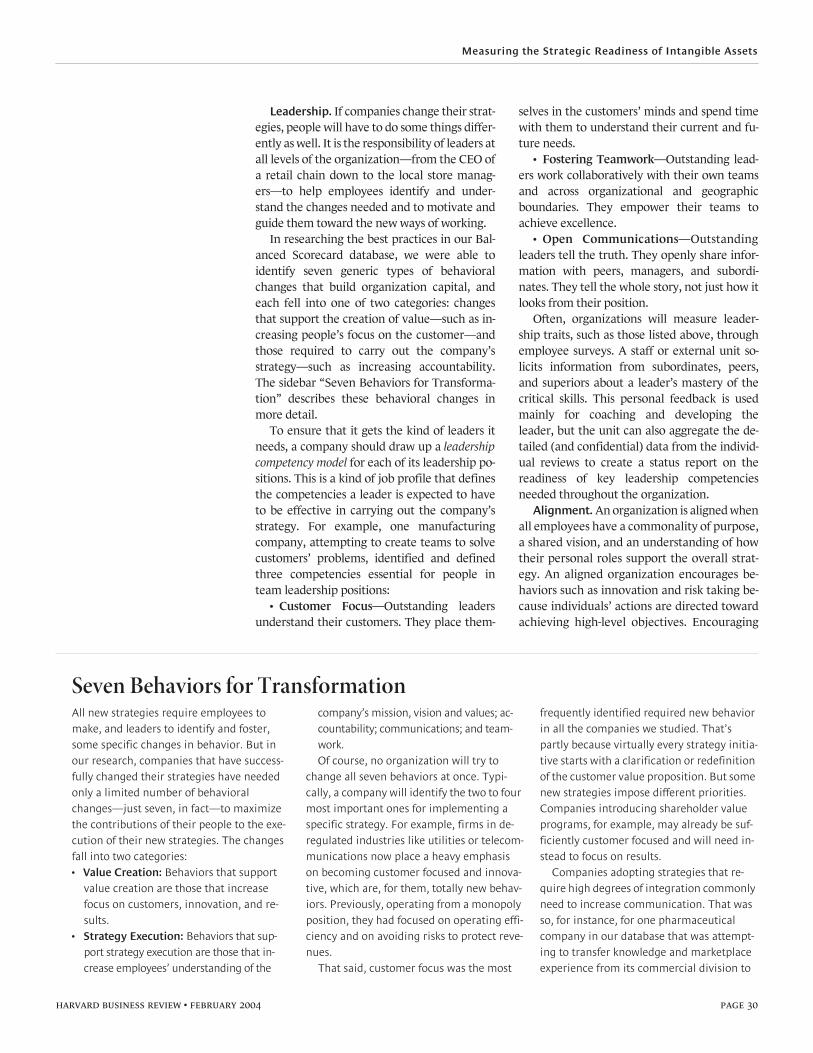
Measuring the Strategic Readiness of Intangible Assets
harvard business review • february 2004 page 30
Leadership. If companies change their strat-egies, people will have to do some things differ-ently as well. It is the responsibility of leaders atall levels of the organization—from the CEO ofa retail chain down to the local store manag-ers—to help employees identify and under-stand the changes needed and to motivate andguide them toward the new ways of working.
In researching the best practices in our Bal-anced Scorecard database, we were able toidentify seven generic types of behavioralchanges that build organization capital, andeach fell into one of two categories: changesthat support the creation of value—such as in-creasing people’s focus on the customer—andthose required to carry out the company’sstrategy—such as increasing accountability.The sidebar “Seven Behaviors for Transforma-tion” describes these behavioral changes inmore detail.
To ensure that it gets the kind of leaders itneeds, a company should draw up a leadershipcompetency model for each of its leadership po-sitions. This is a kind of job profile that definesthe competencies a leader is expected to haveto be effective in carrying out the company’sstrategy. For example, one manufacturingcompany, attempting to create teams to solvecustomers’ problems, identified and definedthree competencies essential for people inteam leadership positions:
• Customer Focus—Outstanding leadersunderstand their customers. They place them-
selves in the customers’ minds and spend timewith them to understand their current and fu-ture needs.
• Fostering Teamwork—Outstanding lead-ers work collaboratively with their own teamsand across organizational and geographicboundaries. They empower their teams toachieve excellence.
• Open Communications—Outstandingleaders tell the truth. They openly share infor-mation with peers, managers, and subordi-nates. They tell the whole story, not just how itlooks from their position.
Often, organizations will measure leader-ship traits, such as those listed above, throughemployee surveys. A staff or external unit so-licits information from subordinates, peers,and superiors about a leader’s mastery of thecritical skills. This personal feedback is usedmainly for coaching and developing theleader, but the unit can also aggregate the de-tailed (and confidential) data from the individ-ual reviews to create a status report on thereadiness of key leadership competenciesneeded throughout the organization.
Alignment. An organization is aligned whenall employees have a commonality of purpose,a shared vision, and an understanding of howtheir personal roles support the overall strat-egy. An aligned organization encourages be-haviors such as innovation and risk taking be-cause individuals’ actions are directed towardachieving high-level objectives. Encouraging
Seven Behaviors for TransformationAll new strategies require employees to make, and leaders to identify and foster, some specific changes in behavior. But in our research, companies that have success-fully changed their strategies have needed only a limited number of behavioral changes—just seven, in fact—to maximize the contributions of their people to the exe-cution of their new strategies. The changes fall into two categories:• Value Creation: Behaviors that support
value creation are those that increase focus on customers, innovation, and re-sults.
• Strategy Execution: Behaviors that sup-port strategy execution are those that in-crease employees’ understanding of the
company’s mission, vision and values; ac-countability; communications; and team-work.Of course, no organization will try to
change all seven behaviors at once. Typi-cally, a company will identify the two to four most important ones for implementing a specific strategy. For example, firms in de-regulated industries like utilities or telecom-munications now place a heavy emphasis on becoming customer focused and innova-tive, which are, for them, totally new behav-iors. Previously, operating from a monopoly position, they had focused on operating effi-ciency and on avoiding risks to protect reve-nues.
That said, customer focus was the most
frequently identified required new behavior in all the companies we studied. That’s partly because virtually every strategy initia-tive starts with a clarification or redefinition of the customer value proposition. But some new strategies impose different priorities. Companies introducing shareholder value programs, for example, may already be suf-ficiently customer focused and will need in-stead to focus on results.
Companies adopting strategies that re-quire high degrees of integration commonly need to increase communication. That was so, for instance, for one pharmaceutical company in our database that was attempt-ing to transfer knowledge and marketplace experience from its commercial division to

Measuring the Strategic Readiness of Intangible Assets
harvard business review • february 2004 page 31
and empowering individual initiative in anunaligned organization leads to chaos, as theinnovative risk takers pull the organization incontradictory directions.
Achieving alignment is a two-step process.First, managers communicate the high-levelstrategic objectives in ways that all employeescan understand. This involves using a widerange of communication mechanisms: bro-chures, newsletters, town meetings, orienta-tion and training programs, executive talks,company intranets, and bulletin boards. Thegoal of this step is to create intrinsic motiva-tion, to inspire employees to internalize the or-ganization’s values and objectives so that theywant to help the organization succeed. Thenext step uses extrinsic motivation. The orga-nization has employees set explicit personaland team objectives aligned to the strategy
and establishes incentives that reward employ-ees when they meet personal, departmental,business unit, and corporate targets.
Measuring alignment readiness is relativelystraightforward. Many survey instruments arealready available for assessing how much em-ployees know about and how well they under-stand high-level strategic objectives. It is alsofairly easy to see whether or not individuals’personal objectives and the company’s existingincentive schemes are consistent with thehigh-level strategy.
For example, a large property and casualtyinsurance company adopted a new strategy in-tended to reduce its underwriting losses by cre-ating a tighter link between the underwriters,who decide whether to accept a new piece ofbusiness, and the claims agents, who deal withthe consequences from poor underwriting de-
The various measures for organization capital readiness should be put together in a readiness
report, which shows, for all the components of organization capital, where the company needs to
introduce changes to its behaviors and policies. The report shown here is a simplified version of
one prepared by a company in our Balanced Scorecard database.
Teamwork
Develop leaders at all levelswho can mobilize the organi-zation toward its strategy
Alignment
Attribute
Leadership
Culture
x
Strategic Objective Strategic Measure Target Actual
Foster awareness and internalization of the mission, vision, and corevalues needed to executethe strategy
Align goals and incentiveswith the strategy at all levelsof the organization
Ensure that knowledge andstaff assets that have strate-gic potential are shared
Leadership gap (percentage of key attributes in competencymodel rated above threshold)
Customer-focused (customer survey; percentage who understandthe organization’s mission)
Strategic awareness (percentage ofstaff who can identify organization’sstrategic priorities)
Sharing best practices (numberof knowledge management system hits per employee)
80%
80%
68%
52%
90% 92%
80% 75%
100% 60%
5.0 6.1
Other core values (employee changereadiness survey)
Strategic alignment (percentage ofstaff whose objectives and incentiveslink to Balanced Scorecard)
Organization Capital Readiness Report
x
xx
Copy
right
© 2
004
Har
vard
Bus
ines
s Sc
hool
Pub
lishi
ng C
orpo
ratio
n. A
ll rig
hts
rese
rved
.
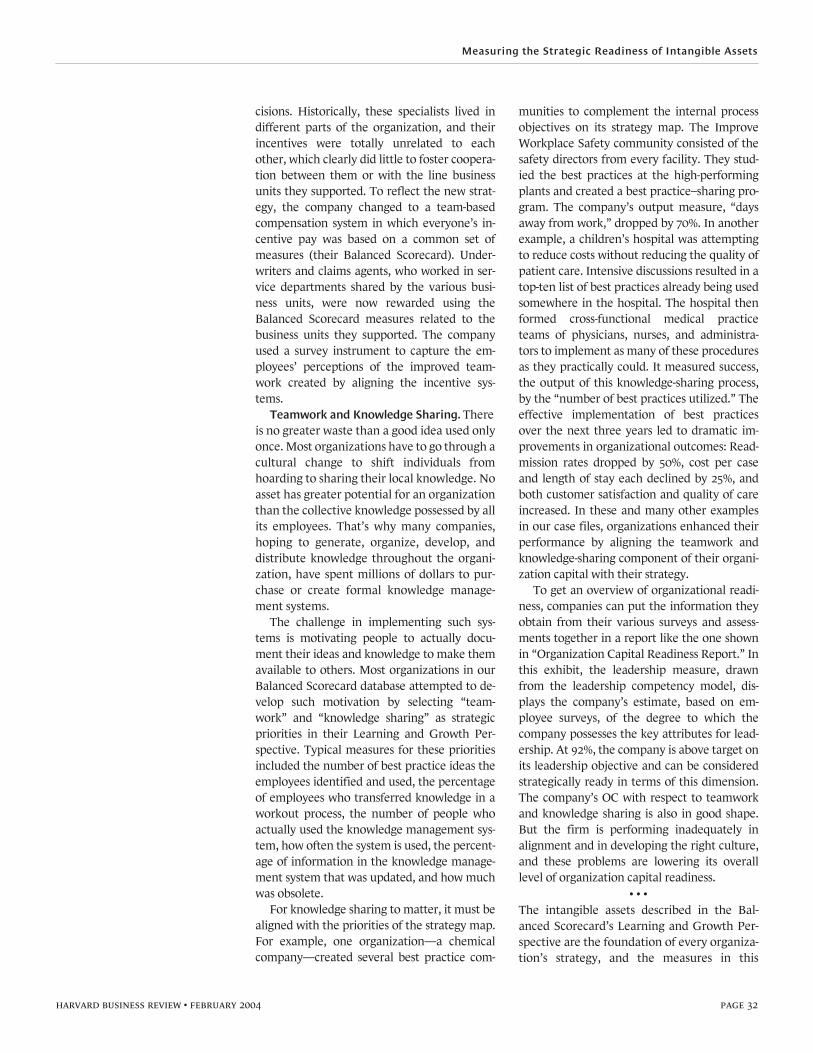
Measuring the Strategic Readiness of Intangible Assets
harvard business review • february 2004 page 32
cisions. Historically, these specialists lived indifferent parts of the organization, and theirincentives were totally unrelated to eachother, which clearly did little to foster coopera-tion between them or with the line businessunits they supported. To reflect the new strat-egy, the company changed to a team-basedcompensation system in which everyone’s in-centive pay was based on a common set ofmeasures (their Balanced Scorecard). Under-writers and claims agents, who worked in ser-vice departments shared by the various busi-ness units, were now rewarded using theBalanced Scorecard measures related to thebusiness units they supported. The companyused a survey instrument to capture the em-ployees’ perceptions of the improved team-work created by aligning the incentive sys-tems.
Teamwork and Knowledge Sharing. Thereis no greater waste than a good idea used onlyonce. Most organizations have to go through acultural change to shift individuals fromhoarding to sharing their local knowledge. Noasset has greater potential for an organizationthan the collective knowledge possessed by allits employees. That’s why many companies,hoping to generate, organize, develop, anddistribute knowledge throughout the organi-zation, have spent millions of dollars to pur-chase or create formal knowledge manage-ment systems.
The challenge in implementing such sys-tems is motivating people to actually docu-ment their ideas and knowledge to make themavailable to others. Most organizations in ourBalanced Scorecard database attempted to de-velop such motivation by selecting “team-work” and “knowledge sharing” as strategicpriorities in their Learning and Growth Per-spective. Typical measures for these prioritiesincluded the number of best practice ideas theemployees identified and used, the percentageof employees who transferred knowledge in aworkout process, the number of people whoactually used the knowledge management sys-tem, how often the system is used, the percent-age of information in the knowledge manage-ment system that was updated, and how muchwas obsolete.
For knowledge sharing to matter, it must bealigned with the priorities of the strategy map.For example, one organization—a chemicalcompany—created several best practice com-
munities to complement the internal processobjectives on its strategy map. The ImproveWorkplace Safety community consisted of thesafety directors from every facility. They stud-ied the best practices at the high-performingplants and created a best practice–sharing pro-gram. The company’s output measure, “daysaway from work,” dropped by 70%. In anotherexample, a children’s hospital was attemptingto reduce costs without reducing the quality ofpatient care. Intensive discussions resulted in atop-ten list of best practices already being usedsomewhere in the hospital. The hospital thenformed cross-functional medical practiceteams of physicians, nurses, and administra-tors to implement as many of these proceduresas they practically could. It measured success,the output of this knowledge-sharing process,by the “number of best practices utilized.” Theeffective implementation of best practicesover the next three years led to dramatic im-provements in organizational outcomes: Read-mission rates dropped by 50%, cost per caseand length of stay each declined by 25%, andboth customer satisfaction and quality of careincreased. In these and many other examplesin our case files, organizations enhanced theirperformance by aligning the teamwork andknowledge-sharing component of their organi-zation capital with their strategy.
To get an overview of organizational readi-ness, companies can put the information theyobtain from their various surveys and assess-ments together in a report like the one shownin “Organization Capital Readiness Report.” Inthis exhibit, the leadership measure, drawnfrom the leadership competency model, dis-plays the company’s estimate, based on em-ployee surveys, of the degree to which thecompany possesses the key attributes for lead-ership. At 92%, the company is above target onits leadership objective and can be consideredstrategically ready in terms of this dimension.The company’s OC with respect to teamworkand knowledge sharing is also in good shape.But the firm is performing inadequately inalignment and in developing the right culture,and these problems are lowering its overalllevel of organization capital readiness.
• • •The intangible assets described in the Bal-anced Scorecard’s Learning and Growth Per-spective are the foundation of every organiza-tion’s strategy, and the measures in this
Measuring the Strategic Readiness of Intangible Assets
harvard business review • february 2004 page 33
perspective are the ultimate lead indicators.Human capital becomes most valuable whenit is concentrated in the relatively few strate-gic job families implementing the internalprocesses critical to the organization’s strat-egy. Information capital creates the greatestvalue when it provides the requisite infra-structure and strategic applications that com-plement the human capital. Organizations in-troducing a new strategy must create a cultureof corresponding values, a cadre of excep-tional leaders who can lead the changeagenda, and an informed workforce aligned tothe strategy, working together, and sharingknowledge to help the strategy succeed.
Some managers shy away from measuringtheir intangible assets because these measuresare usually “softer,” or more subjective, thanthe financial measures they conventionally useto motivate and assess performance. The Bal-anced Scorecard movement has encouragedorganizations to face the measurement chal-
lenge. Using the systematic approaches set outin this article, companies can now measurewhat they want, rather than wanting onlywhat they can currently measure. Even if themeasures are imprecise, the simple act of at-tempting to gauge the capabilities of employ-ees, information systems, and organizationcapital communicates the importance of thesedrivers for value creation. In the course of ourwork, we have seen many companies find newways to measure—and consequently new waysto enhance the value of—their intangible as-sets. The measurement and management ofthese assets played a prominent role in theirtransformation into successful, strategy-focused organizations.
Reprint R0402C; Harvard Business Review OnPoint 5887To order, see the next pageor call 800-988-0886 or 617-783-7500or go to www.hbr.org
Measuring the Strategic Readiness of Intangible
Assets
To Order
For reprints, Harvard Business Review OnPoint orders, and subscriptions to Harvard Business Review:Call 800-988-0886 or 617-783-7500.Go to www.hbr.org
For customized and quantity orders of reprints and Harvard Business Review OnPoint products:Call Frank Tamoshunas at 617-783-7626, or e-mail him at [email protected]
page 34
Further ReadingA R T I C L E SThe Growth Crisis—and How to Escape Itby Adrian J. Slywotzky and Richard WiseHarvard Business ReviewJuly 2002Product no. 5577
These authors describe additional intangible assets and explain how to leverage them for impressive financial results. Beyond human, information, and organizational capital, your company has accumulated hidden assets in the normal course of doing business. These include customer relationships (your reputa-tion for expertise, your high level of customer interaction), strategic “real estate” (your strong market position, your place in the value chain), and networks (your installed product base, user communities, supplier links).
Hidden assets offer numerous advantages: They generate more growth than product ex-tensions and pose less risk than new products or new markets. They reinforce—not canni-balize—your core product business. And rivals can’t easily replicate them.
Sears, for example, leveraged its reputation for expertise to enter the home-renovation mar-ket. Sears Great Indoors provides full-spec-trum remodeling services—from design and financing to construction and installation. It streamlines customers’ shopping time and project planning, and improves the quality of the finished renovation. It also enabled Sears to build a strong position in this market.
Coming Up Short on Nonfinancial Performance Measurementby Christopher D. Ittner and David F. LarckerHarvard Business ReviewNovember 2003Product no. 5380
Ittner and Larcker agree that measuring intan-gible assets is crucial to achieving your com-pany’s strategic objectives. But too many companies, they maintain, don’t identify, ana-lyze, and act on the right measures. Nor do they demonstrate clear connections between improvements in nonfinancial areas, such as customer loyalty or employee satisfaction, and financial results, such as profit or stock price. The consequences? Misdirected invest-ments and unfulfilled strategies
To complete the picture of your company’s strategic performance, create a causal model linking nonfinancial drivers to financial perfor-mance. For example, “Better employee selec-tion will increase employee satisfaction and performance, which will drive customer satis-faction, purchase frequency, and retention—improving growth, earnings, and cash flow.” Verify the assumptions in your causal model; for instance, ask “What kind of supervision and support drive employee satisfaction? How do satisfied employees increase customer satis-faction?” Then set reasonable performance targets for your intangible assets. For example, don’t aim for 100% customer satisfaction if completely satisfied customers spend no more than mostly satisfied ones. And use valid measures to assess your assets—such as cus-tomer surveys with sufficient breadth or depth of questions—and consistent measure-ment techniques across all departments.
3rd article from the collection: Focusing Your Organization on Strategy—with the Balanced Score-card, 2nd Edition
page 35
Using the Balanced Scorecard as a Strategic Management System
by Robert S. Kaplan and David P. Norton
Included with this full-text Harvard Business Review article:
The Idea in Brief—the core idea
The Idea in Practice—putting the idea to work
36 Article Summary
37 Using the Balanced Scorecard as a Strategic Management System
A list of related materials, with annotations to guide further
exploration of the article’s ideas and applications
48 Further Reading
Product 4126

Using the Balanced Scorecard as a Strategic
Management System
page 36
The Idea in Brief The Idea in Practice
CO
PYR
IGH
T ©
200
0 H
AR
VA
RD
BU
SIN
ESS
SC
HO
OL
PU
BLI
SHIN
G C
OR
PO
RA
TIO
N. A
LL R
IGH
TS
RE
SER
VE
D.
Why do budgets often bear little direct rela-tion to a company’s long-term strategic ob-jectives? Because they don’t take enough into consideration. A balanced scorecard augments traditional financial measures with benchmarks for performance in three key nonfinancial areas:
• a company’s relationship with its cus-tomers
• its key internal processes
• its learning and growth.
When performance measures for these areas are added to the financial metrics, the result is not only a broader perspective on the company’s health and activities, it’s also a powerful organizing framework. A sophis-ticated instrument panel for coordinating and fine-tuning a company’s operations and businesses so that all activities are aligned with its strategy.
The balanced scorecard relies on four pro-cesses to bind short-term activities to long-term objectives:
1. Translating the vision. By relying on measurement, the scorecard forces manag-ers to come to agreement on the metrics they will use to operationalize their lofty vi-sions.
Example:A bank had articulated its strategy as pro-viding “superior service to targeted cus-tomers.” But the process of choosing opera-tional measures for the four areas of the scorecard made executives realize that they first needed to reconcile divergent views of who the targeted customers were and what constituted superior service.
2. Communicating and linking. When a scorecard is disseminated up and down the organizational chart, strategy becomes a tool available to everyone. As the high-level scorecard cascades down to individual busi-ness units, overarching strategic objectives and measures are translated into objectives and measures appropriate to each particular group. Tying these targets to individual per-formance and compensation systems yields “personal scorecards.” Thus, individual em-ployees understand how their own produc-tivity supports the overall strategy.
3. Business planning. Most companies have separate procedures (and sometimes units) for strategic planning and budgeting. Little wonder, then, that typical long-term planning is, in the words of one executive, where “the rubber meets the sky.” The disci-pline of creating a balanced scorecard forces companies to integrate the two functions, thereby ensuring that financial budgets do indeed support strategic goals. After agreeing on performance measures for the four scorecard perspectives, compa-nies identify the most influential “drivers” of the desired outcomes and then set mile-
stones for gauging the progress they make with these drivers.
4. Feedback and learning. By supplying a mechanism for strategic feedback and re-view, the balanced scorecard helps an or-ganization foster a kind of learning often missing in companies: the ability to reflect on inferences and adjust theories about cause-and-effect relationships.
Feedback about products and services. New learning about key internal processes. Tech-nological discoveries. All this information can be fed into the scorecard, enabling strategic refinements to be made continually. Thus, at any point in the implementation, managers can know whether the strategy is working—and if not, why.
Using the Balanced Scorecard as a Strategic Management System
by Robert S. Kaplan and David P. Norton
harvard business review • january–february 1996 page 37
CO
PYR
IGH
T ©
199
6 H
AR
VA
RD
BU
SIN
ESS
SC
HO
OL
PU
BLI
SHIN
G C
OR
PO
RA
TIO
N. A
LL R
IGH
TS
RE
SER
VE
D.
Building a scorecard can help managers link today’s actions with
tomorrow’s goals.
As companies around the world transformthemselves for competition that is based oninformation, their ability to exploit intangibleassets has become far more decisive than theirability to invest in and manage physical assets.Several years ago, in recognition of thischange, we introduced a concept we called thebalanced scorecard. The balanced scorecardsupplemented traditional financial measureswith criteria that measured performance fromthree additional perspectives—those of cus-tomers, internal business processes, and learn-ing and growth. (See the chart “TranslatingVision and Strategy: Four Perspectives.”) Ittherefore enabled companies to track finan-cial results while simultaneously monitoringprogress in building the capabilities and ac-quiring the intangible assets they would needfor future growth. The scorecard wasn’t a re-placement for financial measures; it was theircomplement.
Recently, we have seen some companiesmove beyond our early vision for the scorecardto discover its value as the cornerstone of a
new strategic management system. Used thisway, the scorecard addresses a serious defi-ciency in traditional management systems:their inability to link a company’s long-termstrategy with its short-term actions.
Most companies’ operational and manage-ment control systems are built around finan-cial measures and targets, which bear little re-lation to the company’s progress in achievinglong-term strategic objectives. Thus the em-phasis most companies place on short-term fi-nancial measures leaves a gap between thedevelopment of a strategy and its implemen-tation.
Managers using the balanced scorecard donot have to rely on short-term financial mea-sures as the sole indicators of the company’sperformance. The scorecard lets them intro-duce four new management processes that,separately and in combination, contribute tolinking long-term strategic objectives withshort-term actions. (See the chart “ManagingStrategy: Four Processes.”)
The first new process—translating the vision—
Using the Balanced Scorecard as a Strategic Management System
harvard business review • january–february 1996 page 38
helps managers build a consensus around theorganization’s vision and strategy. Despite thebest intentions of those at the top, lofty state-ments about becoming “best in class,” “thenumber one supplier,” or an “empowered or-ganization” don’t translate easily into opera-tional terms that provide useful guides to ac-tion at the local level. For people to act on thewords in vision and strategy statements, thosestatements must be expressed as an integratedset of objectives and measures, agreed upon byall senior executives, that describe the long-term drivers of success.
The second process—communicating andlinking—lets managers communicate theirstrategy up and down the organization andlink it to departmental and individual objec-tives. Traditionally, departments are evaluatedby their financial performance, and individualincentives are tied to short-term financialgoals. The scorecard gives managers a way ofensuring that all levels of the organization un-derstand the long-term strategy and that bothdepartmental and individual objectives arealigned with it.
The third process—business planning—en-ables companies to integrate their businessand financial plans. Almost all organizationstoday are implementing a variety of changeprograms, each with its own champions, gurus,and consultants, and each competing for se-nior executives’ time, energy, and resources.Managers find it difficult to integrate those di-verse initiatives to achieve their strategicgoals—a situation that leads to frequent disap-pointments with the programs’ results. Butwhen managers use the ambitious goals set forbalanced scorecard measures as the basis forallocating resources and setting priorities, theycan undertake and coordinate only those initi-atives that move them toward their long-termstrategic objectives.
The fourth process—feedback and learn-ing—gives companies the capacity for what wecall strategic learning. Existing feedback andreview processes focus on whether the com-pany, its departments, or its individual em-ployees have met their budgeted financialgoals. With the balanced scorecard at the cen-ter of its management systems, a company canmonitor short-term results from the threeadditional perspectives—customers, internalbusiness processes, and learning and growth—and evaluate strategy in the light of recent per-
formance. The scorecard thus enables compa-nies to modify strategies to reflect real-timelearning.
None of the more than 100 organizationsthat we have studied or with which we haveworked implemented their first balancedscorecard with the intention of developing anew strategic management system. But ineach one, the senior executives discovered thatthe scorecard supplied a framework and thus afocus for many critical management processes:departmental and individual goal setting, busi-ness planning, capital allocations, strategic ini-tiatives, and feedback and learning. Previ-ously, those processes were uncoordinated andoften directed at short-term operational goals.By building the scorecard, the senior execu-tives started a process of change that has gonewell beyond the original idea of simply broad-ening the company’s performance measures.
For example, one insurance company—let’scall it National Insurance—developed its firstbalanced scorecard to create a new vision foritself as an underwriting specialist. But onceNational started to use it, the scorecard al-lowed the CEO and the senior managementteam not only to introduce a new strategy forthe organization but also to overhaul the com-pany’s management system. The CEO subse-quently told employees in a letter addressed tothe whole organization that National wouldthenceforth use the balanced scorecard andthe philosophy that it represented to managethe business.
National built its new strategic manage-ment system step-by-step over 30 months, witheach step representing an incremental im-provement. (See the chart “How One Com-pany Built a Strategic Management System.”)The iterative sequence of actions enabled thecompany to reconsider each of the four newmanagement processes two or three times be-fore the system stabilized and became an es-tablished part of National’s overall manage-ment system. Thus the CEO was able totransform the company so that everyone couldfocus on achieving long-term strategic objec-tives—something that no purely financialframework could do.
Translating the VisionThe CEO of an engineering construction com-pany, after working with his senior manage-ment team for several months to develop a
Robert S. Kaplan is the Arthur LowesDickinson Professor of Accounting atthe Harvard Business School in Boston,Massachusetts. David P. Norton isthe founder and president of Renais-sance Solutions, a consulting firm inLincoln, Massachusetts. They are theauthors of “The Balanced Scorecard—Measures That Drive Performance”(HBR January–February 1992) and“Putting the Balanced Scorecard toWork” (HBR September–October1993). Kaplan and Norton have alsowritten a book on the balanced score-card to be published in September1996 by the Harvard Business SchoolPress.
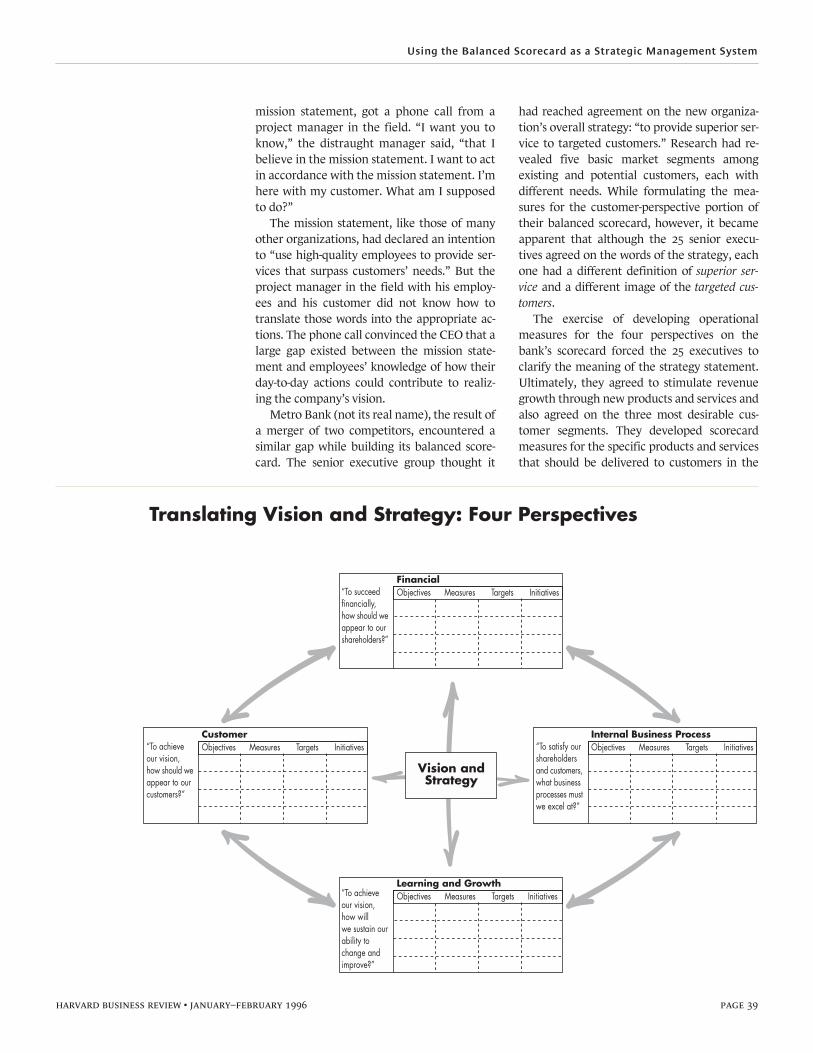
Using the Balanced Scorecard as a Strategic Management System
harvard business review • january–february 1996 page 39
mission statement, got a phone call from aproject manager in the field. “I want you toknow,” the distraught manager said, “that Ibelieve in the mission statement. I want to actin accordance with the mission statement. I’mhere with my customer. What am I supposedto do?”
The mission statement, like those of manyother organizations, had declared an intentionto “use high-quality employees to provide ser-vices that surpass customers’ needs.” But theproject manager in the field with his employ-ees and his customer did not know how totranslate those words into the appropriate ac-tions. The phone call convinced the CEO that alarge gap existed between the mission state-ment and employees’ knowledge of how theirday-to-day actions could contribute to realiz-ing the company’s vision.
Metro Bank (not its real name), the result ofa merger of two competitors, encountered asimilar gap while building its balanced score-card. The senior executive group thought it
had reached agreement on the new organiza-tion’s overall strategy: “to provide superior ser-vice to targeted customers.” Research had re-vealed five basic market segments amongexisting and potential customers, each withdifferent needs. While formulating the mea-sures for the customer-perspective portion oftheir balanced scorecard, however, it becameapparent that although the 25 senior execu-tives agreed on the words of the strategy, eachone had a different definition of superior ser-vice and a different image of the targeted cus-tomers.
The exercise of developing operationalmeasures for the four perspectives on thebank’s scorecard forced the 25 executives toclarify the meaning of the strategy statement.Ultimately, they agreed to stimulate revenuegrowth through new products and services andalso agreed on the three most desirable cus-tomer segments. They developed scorecardmeasures for the specific products and servicesthat should be delivered to customers in the

Using the Balanced Scorecard as a Strategic Management System
harvard business review • january–february 1996 page 40
targeted segments as well as for the relation-ship the bank should build with customers ineach segment. The scorecard also highlightedgaps in employees’ skills and in informationsystems that the bank would have to close inorder to deliver the selected value propositionsto the targeted customers. Thus, creating a bal-anced scorecard forced the bank’s senior man-agers to arrive at a consensus and then totranslate their vision into terms that hadmeaning to the people who would realize thevision.
Communicating and Linking“The top ten people in the business now un-derstand the strategy better than ever before.It’s too bad,” a senior executive of a major oilcompany complained, “that we can’t put thisin a bottle so that everyone could share it.”With the balanced scorecard, he can.
One company we have worked with deliber-ately involved three layers of management inthe creation of its balanced scorecard. The se-nior executive group formulated the financialand customer objectives. It then mobilized thetalent and information in the next two levelsof managers by having them formulate theinternal-business-process and learning-and-growth objectives that would drive the
achievement of the financial and customergoals. For example, knowing the importanceof satisfying customers’ expectations of on-time delivery, the broader group identified sev-eral internal business processes—such as orderprocessing, scheduling, and fulfillment—inwhich the company had to excel. To do so, thecompany would have to retrain frontline em-ployees and improve the information systemsavailable to them. The group developed per-formance measures for those critical processesand for staff and systems capabilities.
Broad participation in creating a scorecardtakes longer, but it offers several advantages:Information from a larger number of manag-ers is incorporated into the internal objectives;the managers gain a better understanding ofthe company’s long-term strategic goals; andsuch broad participation builds a strongercommitment to achieving those goals. But get-ting managers to buy into the scorecard is onlya first step in linking individual actions to cor-porate goals.
The balanced scorecard signals to everyonewhat the organization is trying to achieve forshareholders and customers alike. But to alignemployees’ individual performances with theoverall strategy, scorecard users generally en-gage in three activities: communicating andeducating, setting goals, and linking rewards toperformance measures.
Communicating and Educating. Implement-ing a strategy begins with educating those whohave to execute it. Whereas some organizationsopt to hold their strategy close to the vest, mostbelieve that they should disseminate it fromtop to bottom. A broad-based communicationprogram shares with all employees the strategyand the critical objectives they have to meet ifthe strategy is to succeed. Onetime events suchas the distribution of brochures or newslettersand the holding of “town meetings” might kickoff the program. Some organizations post bul-letin boards that illustrate and explain the bal-anced scorecard measures, then update themwith monthly results. Others use groupwareand electronic bulletin boards to distribute thescorecard to the desktops of all employees andto encourage dialogue about the measures. Thesame media allow employees to make sugges-tions for achieving or exceeding the targets.
The balanced scorecard, as the embodimentof business unit strategy, should also be com-municated upward in the organization—to

Using the Balanced Scorecard as a Strategic Management System
harvard business review • january–february 1996 page 41
corporate headquarters and to the corporateboard of directors. With the scorecard, busi-ness units can quantify and communicate theirlong-term strategies to senior executives usinga comprehensive set of linked financial andnonfinancial measures. Such communicationinforms the executives and the board in spe-cific terms that long-term strategies designedfor competitive success are in place. The mea-sures also provide the basis for feedback andaccountability. Meeting short-term financialtargets should not constitute satisfactory per-formance when other measures indicate thatthe long-term strategy is either not working ornot being implemented well.
Should the balanced scorecard be communi-cated beyond the boardroom to external share-holders? We believe that as senior executivesgain confidence in the ability of the scorecardmeasures to monitor strategic performance andpredict future financial performance, they willfind ways to inform outside investors aboutthose measures without disclosing competi-tively sensitive information.
Skandia, an insurance and financial servicescompany based in Sweden, issues a supple-ment to its annual report called “The BusinessNavigator”—“an instrument to help us navi-gate into the future and thereby stimulate re-newal and development.” The supplement de-scribes Skandia’s strategy and the strategicmeasures the company uses to communicateand evaluate the strategy. It also provides a re-port on the company’s performance alongthose measures during the year. The measuresare customized for each operating unit and in-clude, for example, market share, customersatisfaction and retention, employee compe-tence, employee empowerment, and technol-ogy deployment.
Communicating the balanced scorecardpromotes commitment and accountability tothe business’s long-term strategy. As one exec-utive at Metro Bank declared, “The balancedscorecard is both motivating and obligating.”
Setting Goals. Mere awareness of corporategoals, however, is not enough to change manypeople’s behavior. Somehow, the organization’shigh-level strategic objectives and measuresmust be translated into objectives and measuresfor operating units and individuals.
The exploration group of a large oil companydeveloped a technique to enable and encourageindividuals to set goals for themselves that were
consistent with the organization’s. It created asmall, fold-up personal scorecard that peoplecould carry in their shirt pockets or wallets. (Seethe exhibit “The Personal Scorecard.”) Thescorecard contains three levels of information.The first describes corporate objectives, mea-sures, and targets. The second leaves room fortranslating corporate targets into targets foreach business unit. For the third level, the com-pany asks both individuals and teams to articu-late which of their own objectives would beconsistent with the business unit and corporateobjectives, as well as what initiatives they wouldtake to achieve their objectives. It also asksthem to define up to five performance mea-sures for their objectives and to set targets foreach measure. The personal scorecard helps tocommunicate corporate and business unit ob-jectives to the people and teams performing thework, enabling them to translate the objectivesinto meaningful tasks and targets for them-selves. It also lets them keep that informationclose at hand—in their pockets.
Linking Rewards to Performance Mea-sures. Should compensation systems be linkedto balanced scorecard measures? Some com-panies, believing that tying financial compen-sation to performance is a powerful lever,have moved quickly to establish such a link-age. For example, an oil company that we’llcall Pioneer Petroleum uses its scorecard asthe sole basis for computing incentive com-pensation. The company ties 60% of its execu-tives’ bonuses to their achievement of ambi-tious targets for a weighted average of fourfinancial indicators: return on capital, profit-ability, cash flow, and operating cost. It basesthe remaining 40% on indicators of customersatisfaction, dealer satisfaction, employee sat-isfaction, and environmental responsibility(such as a percentage change in the level ofemissions to water and air). Pioneer’s CEOsays that linking compensation to the score-card has helped to align the company with itsstrategy. “I know of no competitor,” he says,“who has this degree of alignment. It is pro-ducing results for us.”
As attractive and as powerful as such link-age is, it nonetheless carries risks. For instance,does the company have the right measures onthe scorecard? Does it have valid and reliabledata for the selected measures? Could unin-tended or unexpected consequences arise fromthe way the targets for the measures are
The personal scorecard
helps to communicate
corporate and unit
objectives to the people
and teams performing
the work.
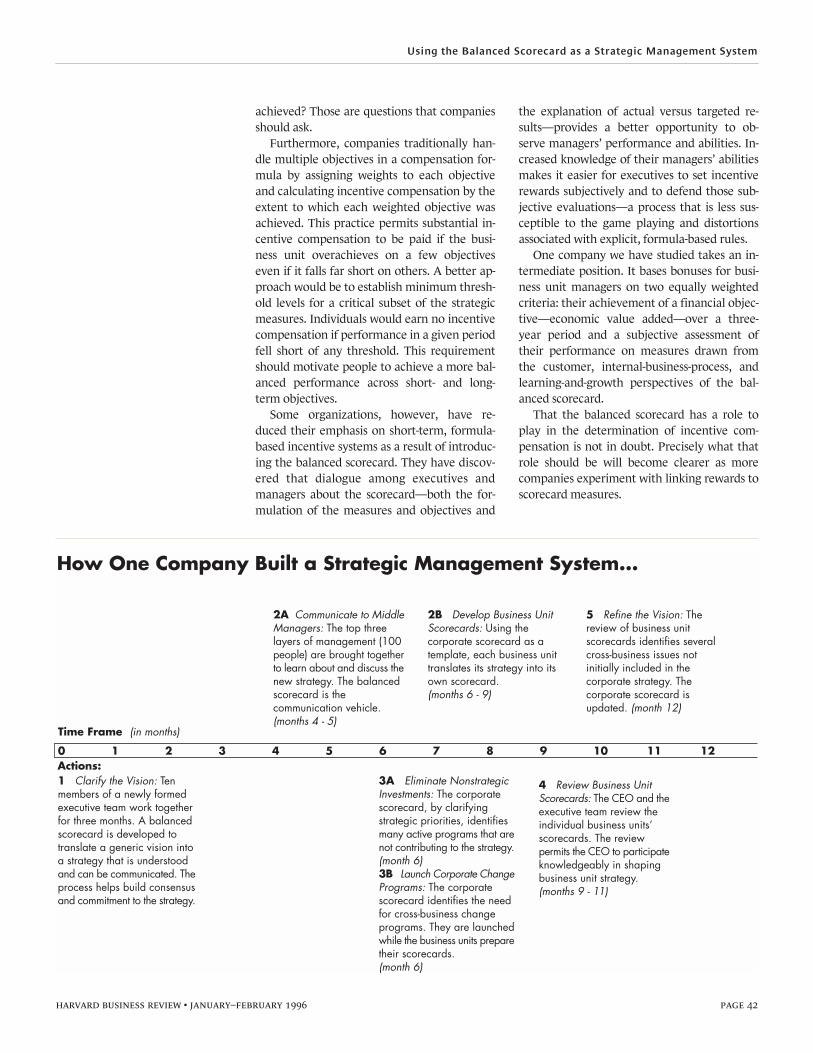
Using the Balanced Scorecard as a Strategic Management System
harvard business review • january–february 1996 page 42
achieved? Those are questions that companiesshould ask.
Furthermore, companies traditionally han-dle multiple objectives in a compensation for-mula by assigning weights to each objectiveand calculating incentive compensation by theextent to which each weighted objective wasachieved. This practice permits substantial in-centive compensation to be paid if the busi-ness unit overachieves on a few objectiveseven if it falls far short on others. A better ap-proach would be to establish minimum thresh-old levels for a critical subset of the strategicmeasures. Individuals would earn no incentivecompensation if performance in a given periodfell short of any threshold. This requirementshould motivate people to achieve a more bal-anced performance across short- and long-term objectives.
Some organizations, however, have re-duced their emphasis on short-term, formula-based incentive systems as a result of introduc-ing the balanced scorecard. They have discov-ered that dialogue among executives andmanagers about the scorecard—both the for-mulation of the measures and objectives and
the explanation of actual versus targeted re-sults—provides a better opportunity to ob-serve managers’ performance and abilities. In-creased knowledge of their managers’ abilitiesmakes it easier for executives to set incentiverewards subjectively and to defend those sub-jective evaluations—a process that is less sus-ceptible to the game playing and distortionsassociated with explicit, formula-based rules.
One company we have studied takes an in-termediate position. It bases bonuses for busi-ness unit managers on two equally weightedcriteria: their achievement of a financial objec-tive—economic value added—over a three-year period and a subjective assessment oftheir performance on measures drawn fromthe customer, internal-business-process, andlearning-and-growth perspectives of the bal-anced scorecard.
That the balanced scorecard has a role toplay in the determination of incentive com-pensation is not in doubt. Precisely what thatrole should be will become clearer as morecompanies experiment with linking rewards toscorecard measures.
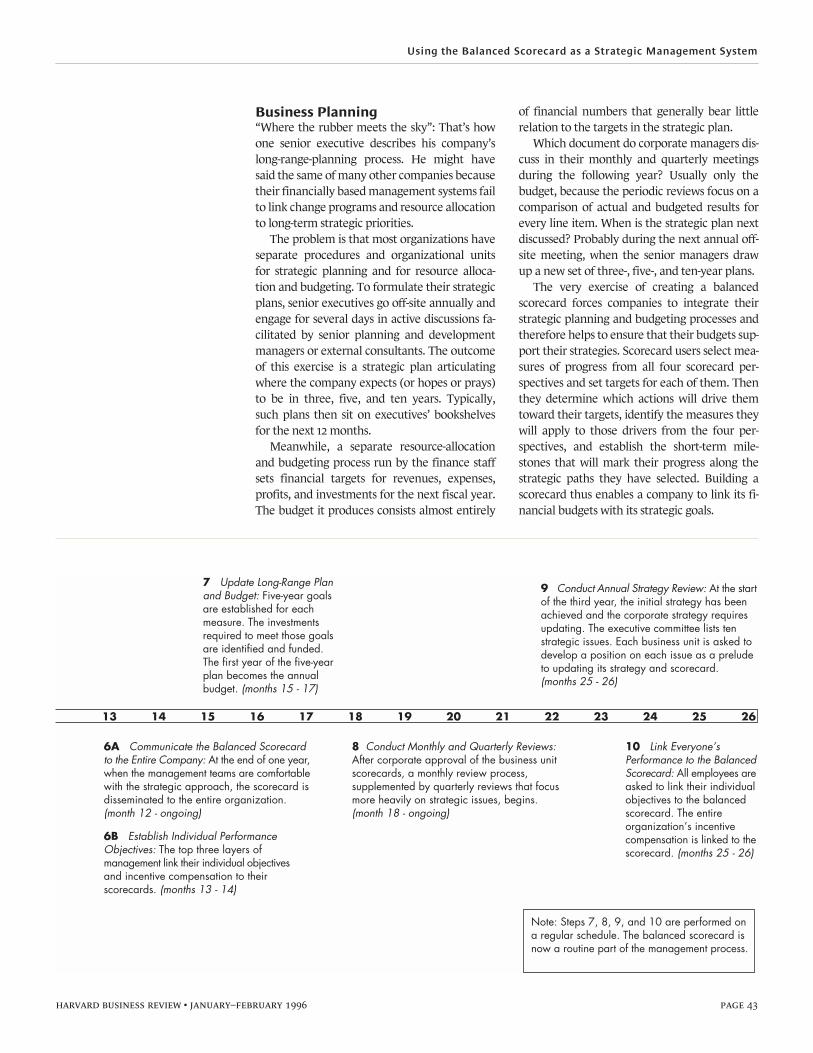
Using the Balanced Scorecard as a Strategic Management System
harvard business review • january–february 1996 page 43
Business Planning“Where the rubber meets the sky”: That’s howone senior executive describes his company’slong-range-planning process. He might havesaid the same of many other companies becausetheir financially based management systems failto link change programs and resource allocationto long-term strategic priorities.
The problem is that most organizations haveseparate procedures and organizational unitsfor strategic planning and for resource alloca-tion and budgeting. To formulate their strategicplans, senior executives go off-site annually andengage for several days in active discussions fa-cilitated by senior planning and developmentmanagers or external consultants. The outcomeof this exercise is a strategic plan articulatingwhere the company expects (or hopes or prays)to be in three, five, and ten years. Typically,such plans then sit on executives’ bookshelvesfor the next 12 months.
Meanwhile, a separate resource-allocationand budgeting process run by the finance staffsets financial targets for revenues, expenses,profits, and investments for the next fiscal year.The budget it produces consists almost entirely
of financial numbers that generally bear littlerelation to the targets in the strategic plan.
Which document do corporate managers dis-cuss in their monthly and quarterly meetingsduring the following year? Usually only thebudget, because the periodic reviews focus on acomparison of actual and budgeted results forevery line item. When is the strategic plan nextdiscussed? Probably during the next annual off-site meeting, when the senior managers drawup a new set of three-, five-, and ten-year plans.
The very exercise of creating a balancedscorecard forces companies to integrate theirstrategic planning and budgeting processes andtherefore helps to ensure that their budgets sup-port their strategies. Scorecard users select mea-sures of progress from all four scorecard per-spectives and set targets for each of them. Thenthey determine which actions will drive themtoward their targets, identify the measures theywill apply to those drivers from the four per-spectives, and establish the short-term mile-stones that will mark their progress along thestrategic paths they have selected. Building ascorecard thus enables a company to link its fi-nancial budgets with its strategic goals.

Using the Balanced Scorecard as a Strategic Management System
harvard business review • january–february 1996 page 44
For example, one division of the Style Com-pany (not its real name) committed to achiev-ing a seemingly impossible goal articulated bythe CEO: to double revenues in five years. Theforecasts built into the organization’s existingstrategic plan fell $1 billion short of this objec-tive. The division’s managers, after consideringvarious scenarios, agreed to specific increases infive different performance drivers: the numberof new stores opened, the number of new cus-tomers attracted into new and existing stores,the percentage of shoppers in each store con-verted into actual purchasers, the portion of ex-isting customers retained, and average sales percustomer.
By helping to define the key drivers of reve-nue growth and by committing to targets foreach of them, the division’s managers eventu-ally grew comfortable with the CEO’s ambitiousgoal.
The process of building a balanced score-card—clarifying the strategic objectives andthen identifying the few critical drivers—alsocreates a framework for managing an organiza-tion’s various change programs. These initia-tives—reengineering, employee empowerment,time-based management, and total quality man-agement, among others—promise to deliver re-sults but also compete with one another for
scarce resources, including the scarcest resourceof all: senior managers’ time and attention.
Shortly after the merger that created it,Metro Bank, for example, launched more than70 different initiatives. The initiatives were in-tended to produce a more competitive and suc-cessful institution, but they were inadequatelyintegrated into the overall strategy. After build-ing their balanced scorecard, Metro Bank’smanagers dropped many of those programs—such as a marketing effort directed at individu-als with very high net worth—and consolidatedothers into initiatives that were better alignedwith the company’s strategic objectives. For ex-ample, the managers replaced a program aimedat enhancing existing low-level selling skillswith a major initiative aimed at retraining sales-persons to become trusted financial advisers, ca-pable of selling a broad range of newly intro-duced products to the three selected customersegments. The bank made both changes be-cause the scorecard enabled it to gain a betterunderstanding of the programs required toachieve its strategic objectives.
Once the strategy is defined and the driversare identified, the scorecard influences manag-ers to concentrate on improving or reengineer-ing those processes most critical to the organiza-tion’s strategic success. That is how thescorecard most clearly links and aligns actionwith strategy.
The final step in linking strategy to actions isto establish specific short-term targets, or mile-stones, for the balanced scorecard measures.Milestones are tangible expressions of manag-ers’ beliefs about when and to what degree theircurrent programs will affect those measures.
In establishing milestones, managers are ex-panding the traditional budgeting process to in-corporate strategic as well as financial goals. De-tailed financial planning remains important,but financial goals taken by themselves ignorethe three other balanced scorecard perspec-tives. In an integrated planning and budgetingprocess, executives continue to budget forshort-term financial performance, but they alsointroduce short-term targets for measures in thecustomer, internal-business-process, and learn-ing-and-growth perspectives. With those mile-stones established, managers can continuallytest both the theory underlying the strategy andthe strategy’s implementation.
At the end of the business planning process,managers should have set targets for the long-

Using the Balanced Scorecard as a Strategic Management System
harvard business review • january–february 1996 page 45
term objectives they would like to achieve in allfour scorecard perspectives; they should haveidentified the strategic initiatives required andallocated the necessary resources to those initia-tives; and they should have established mile-stones for the measures that mark progress to-ward achieving their strategic goals.
Feedback and Learning“With the balanced scorecard,” a CEO of anengineering company told us, “I can continu-ally test my strategy. It’s like performing real-time research.” That is exactly the capabilitythat the scorecard should give senior manag-ers: the ability to know at any point in its im-plementation whether the strategy they haveformulated is, in fact, working, and if not,why.
The first three management processes—translating the vision, communicating andlinking, and business planning—are vital forimplementing strategy, but they are not suffi-cient in an unpredictable world. Together theyform an important single-loop-learning pro-cess—single-loop in the sense that the objec-tive remains constant, and any departure fromthe planned trajectory is seen as a defect to be
remedied. This single-loop process does not re-quire or even facilitate reexamination of eitherthe strategy or the techniques used to imple-ment it in light of current conditions.
Most companies today operate in a turbu-lent environment with complex strategies that,though valid when they were launched, maylose their validity as business conditionschange. In this kind of environment, wherenew threats and opportunities arise constantly,companies must become capable of what ChrisArgyris calls double-loop learning—learningthat produces a change in people’s assump-tions and theories about cause-and-effect rela-tionships. (See “Teaching Smart People Howto Learn,” HBR May–June 1991.)
Budget reviews and other financially basedmanagement tools cannot engage senior exec-utives in double-loop learning—first, becausethese tools address performance from only oneperspective, and second, because they don’t in-volve strategic learning. Strategic learning con-sists of gathering feedback, testing the hypoth-eses on which strategy was based, and makingthe necessary adjustments.
The balanced scorecard supplies three ele-ments that are essential to strategic learning.

Using the Balanced Scorecard as a Strategic Management System
harvard business review • january–february 1996 page 46
First, it articulates the company’s shared vi-sion, defining in clear and operational termsthe results that the company, as a team, is try-ing to achieve. The scorecard communicates aholistic model that links individual efforts andaccomplishments to business unit objectives.
Second, the scorecard supplies the essentialstrategic feedback system. A business strategycan be viewed as a set of hypotheses aboutcause-and-effect relationships. A strategic feed-back system should be able to test, validate,and modify the hypotheses embedded in abusiness unit’s strategy. By establishing short-term goals, or milestones, within the business
planning process, executives are forecastingthe relationship between changes in perfor-mance drivers and the associated changes inone or more specified goals. For example, exec-utives at Metro Bank estimated the amount oftime it would take for improvements in train-ing and in the availability of information sys-tems before employees could sell multiple fi-nancial products effectively to existing andnew customers. They also estimated how greatthe effect of that selling capability would be.
Another organization attempted to validateits hypothesized cause-and-effect relationshipsin the balanced scorecard by measuring thestrength of the linkages among measures inthe different perspectives. (See the chart “HowOne Company Linked Measures from the FourPerspectives.”) The company found significantcorrelations between employees’ morale, ameasure in the learning-and-growth perspec-tive, and customer satisfaction, an importantcustomer perspective measure. Customer satis-faction, in turn, was correlated with faster pay-ment of invoices—a relationship that led to asubstantial reduction in accounts receivableand hence a higher return on capital em-ployed. The company also found correlationsbetween employees’ morale and the numberof suggestions made by employees (twolearning-and-growth measures) as well as be-tween an increased number of suggestions andlower rework (an internal-business-processmeasure). Evidence of such strong correlationshelp to confirm the organization’s businessstrategy. If, however, the expected correlationsare not found over time, it should be an indica-tion to executives that the theory underlyingthe unit’s strategy may not be working as theyhad anticipated.
Especially in large organizations, accumulat-ing sufficient data to document significant cor-relations and causation among balanced score-card measures can take a long time—months oryears. Over the short term, managers’ assess-ment of strategic impact may have to rest onsubjective and qualitative judgments. Eventu-ally, however, as more evidence accumulates,organizations may be able to provide more ob-jectively grounded estimates of cause-and-effectrelationships. But just getting managers tothink systematically about the assumptions un-derlying their strategy is an improvement overthe current practice of making decisions basedon short-term operational results.
Using the Balanced Scorecard as a Strategic Management System
harvard business review • january–february 1996 page 47
Third, the scorecard facilitates the strategyreview that is essential to strategic learning. Tra-ditionally, companies use the monthly or quar-terly meetings between corporate and divisionexecutives to analyze the most recent period’sfinancial results. Discussions focus on past per-formance and on explanations of why financialobjectives were not achieved. The balancedscorecard, with its specification of the causal re-lationships between performance drivers andobjectives, allows corporate and business unitexecutives to use their periodic review sessionsto evaluate the validity of the unit’s strategyand the quality of its execution. If the unit’s em-ployees and managers have delivered on theperformance drivers (retraining of employees,availability of information systems, and new fi-nancial products and services, for instance),then their failure to achieve the expected out-comes (higher sales to targeted customers, forexample) signals that the theory underlying thestrategy may not be valid. The disappointingsales figures are an early warning.
Managers should take such disconfirming ev-idence seriously and reconsider their sharedconclusions about market conditions, customervalue propositions, competitors’ behavior, andinternal capabilities. The result of such a reviewmay be a decision to reaffirm their belief in thecurrent strategy but to adjust the quantitativerelationship among the strategic measures onthe balanced scorecard. But they also mightconclude that the unit needs a different strategy(an example of double-loop learning) in light ofnew knowledge about market conditions andinternal capabilities. In any case, the scorecardwill have stimulated key executives to learnabout the viability of their strategy. This capac-ity for enabling organizational learning at theexecutive level—strategic learning—is what dis-tinguishes the balanced scorecard, making it in-valuable for those who wish to create a strategicmanagement system.
Toward a New Strategic Management SystemMany companies adopted early balanced-scorecard concepts to improve their perfor-mance measurement systems. They achievedtangible but narrow results. Adopting those
concepts provided clarification, consensus,and focus on the desired improvements in per-formance. More recently, we have seen com-panies expand their use of the balanced score-card, employing it as the foundation of anintegrated and iterative strategic manage-ment system. Companies are using the score-card to
• clarify and update strategy,• communicate strategy throughout the
company,• align unit and individual goals with the
strategy,• link strategic objectives to long-term tar-
gets and annual budgets,• identify and align strategic initiatives, and• conduct periodic performance reviews to
learn about and improve strategy.The balanced scorecard enables a company
to align its management processes and focusesthe entire organization on implementing long-term strategy. At National Insurance, thescorecard provided the CEO and his managerswith a central framework around which theycould redesign each piece of the company’smanagement system. And because of thecause-and-effect linkages inherent in the score-card framework, changes in one component ofthe system reinforced earlier changes madeelsewhere. Therefore, every change made overthe 30-month period added to the momentumthat kept the organization moving forward inthe agreed-upon direction.
Without a balanced scorecard, most organi-zations are unable to achieve a similar consis-tency of vision and action as they attempt tochange direction and introduce new strategiesand processes. The balanced scorecard pro-vides a framework for managing the imple-mentation of strategy while also allowing thestrategy itself to evolve in response to changesin the company’s competitive, market, andtechnological environments.
Reprint 96107; Harvard Business Review OnPoint 4126To order, see the next pageor call 800-988-0886 or 617-783-7500or go to www.hbr.org

Using the Balanced Scorecard as a Strategic
Management System
To Order
For reprints, Harvard Business Review OnPoint orders, and subscriptions to Harvard Business Review:Call 800-988-0886 or 617-783-7500.Go to www.hbr.org
For customized and quantity orders of reprints and Harvard Business Review OnPoint products:Call Frank Tamoshunas at 617-783-7626, or e-mail him at [email protected]
page 48
Further ReadingA R T I C L E SPutting the Balanced Scorecard to Workby Robert S. Kaplan and David P. NortonHarvard Business ReviewSeptember–October 1993Product no. 4118
In this development of their initial article, the authors argue that the balanced scorecard is more than a measurement system. Four char-acteristics make it distinctive: it is a top-down reflection of the company’s mission and strat-egy, it is forward-looking, it integrates external and internal measures, and it helps a com-pany focus. Together, these characteristics en-able a scorecard to serve as a means for moti-vating and implementing breakthrough performance.
Profit Priorities from Activity-Based Costingby Robin Cooper and Robert S. KaplanHarvard Business ReviewMay–June 1991Product no. 3588
When used as the financial metric of a bal-anced scorecard, activity-based costing (ABC) can help managers find the places in their or-ganizations where improvement is likely to have the greatest payoff. ABC involves sepa-rating whatever expenses are required to pro-duce individual products from those required to process batches, to maintain a product, or to keep a manufacturing facility up and run-ning. Since management cannot control costs at the aggregate level of cost of goods sold or administrative expenses, ABC analysis pro-vides a valuable tool that enables managers to look into a specific part of the business and at all of its related activities. By looking at how those activities are linked to revenue genera-tion and expenses, managers can understand the cause-and-effect relationships and pin-point the changes required to increase profits.
The Balanced Scorecard—Measures that Drive Performanceby Robert S. Kaplan and David P. NortonHarvard Business ReviewJanuary–February 1992Product no. 4096
This article introduced the concept of a bal-anced scorecard to HBR readers. Traditional performance measurement systems focus on control, the authors argue—for example, measuring the number of widgets produced against the number budgeted. But a balanced scorecard approach to performance focuses on vision and strategy. It provides a compre-hensive snapshot of a business by combining financial measures with metrics for customer satisfaction, key internal processes, and orga-nizational learning and growth.
B O O KThe Balanced Scorecard: Translating Strategy Into Actionby Robert S. Kaplan and David P. NortonHarvard Business School Press1996Product no. 6513
Developing and using a balanced scorecard helps executives solve what is perhaps their most central issue: how to implement strat-egy, particularly one that requires radical change. This book builds on the authors’ three Harvard Business Review articles, providing ad-ditional insight into the mechanics of choos-ing measures for each of the four scorecard perspectives. Extended examples from indus-tries such as oil, banking, insurance, and retail-ing demonstrate how companies have built scorecards tailored to their particular compet-itive challenges and strategic goals.

4th article from the collection: Focusing Your Organization on Strategy—with the Balanced Score-card, 2nd Edition
page 49
TOOL KIT
Having Trouble with Your Strategy? Then Map It
by Robert S. Kaplan and David P. Norton
Included with this full-text Harvard Business Review article:
The Idea in Brief—the core idea
The Idea in Practice—putting the idea to work
50 Article Summary
51 Having Trouble with Your Strategy? Then Map It
A list of related materials, with annotations to guide further
exploration of the article’s ideas and applications
61 Further Reading
Product 5165
T O O L K I T
Having Trouble with Your Strategy? Then Map It
page 50
The Idea in Brief The Idea in Practice
CO
PYR
IGH
T ©
200
0 H
AR
VA
RD
BU
SIN
ESS
SC
HO
OL
PU
BLI
SHIN
G C
OR
PO
RA
TIO
N. A
LL R
IGH
TS
RE
SER
VE
D.
How does Mobil make sure that every gas station owner understands the company’s strategy—and implements it each time a customer drives up to his pumps? How did Mobil become the industry’s profit leader and boost its cash flow by $1 billion+ per year? By using a strategy map—a powerful new tool built on the balanced scorecard.
The balanced scorecard measures your company’s performance from four perspec-tives—financial, customer, internal processes, and learning and growth. A strategy map is a visual framework for the corporate objec-tives within those four areas. The authors created strategy map templates for various industries, including retail, telecommunica-tions, and e-commerce.
Strategy maps put into focus the often-blurry line of sight between your corporate strategy and what your employees do every day—significantly enhancing collab-oration and coordination.
WHY STRATEGY MAPS?
Strategy maps are essential in the information age, when intangible assets—customer rela-tionships, employee skills, the ability to inno-vate—are competitive advantages. But these assets have value only within the context of a strategy.
For example, a growth-oriented strategy might require in-depth customer knowledge, sales training, and incentive-based compen-sation. But none of these, alone, would be enough to implement that strategy. Strategy maps quantify the value of tangible and intan-gible assets—linking them all to your over-arching strategy.
BUILDING YOUR STRATEGY MAP
Step 1.Clarify your mission and strategic vision. Mobil sought “to be the best integrated refiner-marketer in the U.S. by efficiently delivering unprecedented value to customers.”
Step 2.Specify objectives in the four scorecard areas to realize your company’s vision.
• Financial. Balance revenue growth and productivity improvement.
Example:Mobil grew revenue by selling more non-gasoline products and services and more premium gas. It improved productivity by slashing operating expenses (e.g., reducing refinery downtime).
• Customer. Differentiate your firm from competitors. Choose one of these value propositions: operational excellence, cus-tomer intimacy, or product leadership.
Example:Mobil emphasized customer intimacy, tar-geting premium customers by offering fast, friendly, and safe service. Satisfied custom-ers gladly paid more.
• Internal Processes. Identify operational, customer-relationship, and innovation processes to support your customer and financial goals.
Example:Mobil reduced environmental and safety incidents (operational), built best-in-class franchise teams (customer relationships), and developed non-gasoline services (in-novation).
• Learning and Growth. Define the skills, technologies, and corporate culture needed to support your strategy.
Example:Mobil’s objectives were: increase employee knowledge of refining business; nurture leadership skills necessary to articulate its vision.
Mobil’s strategy map linked the four perspec-tives, providing all its business units clear di-rection for creating their own more detailed maps.
TOOL KIT
Having Trouble with Your Strategy? Then Map It
by Robert S. Kaplan and David P. Norton
harvard business review • september–october 2000 page 51
CO
PYR
IGH
T ©
200
0 H
AR
VA
RD
BU
SIN
ESS
SC
HO
OL
PU
BLI
SHIN
G C
OR
PO
RA
TIO
N. A
LL R
IGH
TS
RE
SER
VE
D.
The key to executing your strategy is to have people in your
organization understand it—including the crucial but perplexing
processes by which intangible assets will be converted into tangible
outcomes. Strategy maps can help chart this difficult terrain.
Imagine that you are a general taking yourtroops into foreign territory. Obviously, youwould need detailed maps showing the impor-tant towns and villages, the surrounding land-scape, key structures like bridges and tunnels,and the roads and highways that traverse theregion. Without such information, youcouldn’t communicate your campaign strat-egy to your field officers and the rest of yourtroops.
Unfortunately, many top executives are try-ing to do just that. When attempting to imple-ment their business strategies, they give em-ployees only limited descriptions of what theyshould do and why those tasks are important.Without clearer and more detailed informa-tion, it’s no wonder that many companies havefailed in executing their strategies. After all,how can people carry out a plan that theydon’t fully understand? Organizations needtools for communicating both their strategyand the processes and systems that will helpthem implement that strategy.
Strategy maps provide such a tool. They
give employees a clear line of sight into howtheir jobs are linked to the overall objectives ofthe organization, enabling them to work in acoordinated, collaborative fashion toward thecompany’s desired goals. The maps provide avisual representation of a company’s criticalobjectives and the crucial relationships amongthem that drive organizational performance.
Strategy maps can depict objectives for rev-enue growth; targeted customer markets inwhich profitable growth will occur; value prop-ositions that will lead to customers doing morebusiness and at higher margins; the key role ofinnovation and excellence in products, ser-vices, and processes; and the investments re-quired in people and systems to generate andsustain the projected growth.
Strategy maps show the cause-and-effectlinks by which specific improvements createdesired outcomes—for example, how fasterprocess-cycle times and enhanced employeecapabilities will increase retention of custom-ers and thus increase a company’s revenues.
From a larger perspective, strategy maps
Having Trouble with Your Strategy? Then Map It • TOOL KIT
harvard business review • september–october 2000 page 52
show how an organization will convert its initi-atives and resources—including intangible as-sets such as corporate culture and employeeknowledge—into tangible outcomes.
Why Strategy Maps?In the industrial age, companies created valueby transforming raw materials into finishedproducts. The economy was primarily basedon tangible assets—inventory, land, factories,and equipment—and an organization coulddescribe and document its business strategyby using financial tools such as general led-gers, income statements, and balance sheets.
In the information age, businesses must in-creasingly create and deploy intangible as-sets—for instance, customer relationships; em-ployee skills and knowledge; informationtechnologies; and a corporate culture that en-courages innovation, problem solving, andgeneral organizational improvements.
Even though intangible assets have becomemajor sources of competitive advantage, notools existed to describe them and the valuethey can create. The main difficulty is that thevalue of intangible assets depends on their or-ganizational context and a company’s strategy.For example, a growth-oriented sales strategymight require knowledge about customers, ad-ditional training for salespeople, new data-bases and information systems, a different or-ganizational structure, and an incentive-basedcompensation program. Investing in just oneof those items—or in a few of them but notall—would cause the strategy to fail. The valueof an intangible asset such as a customer data-base cannot be considered separately from theorganizational processes that will transform itand other assets—both intangible and tangi-ble—into customer and financial outcomes.The value does not reside in any individual in-tangible asset. It arises from the entire set ofassets and the strategy that links them to-gether.
To understand how organizations createvalue in the information age, we developedthe balanced scorecard, which measures acompany’s performance from four major per-spectives: financial, customer, internal process,and learning and growth.1 Briefly summarized,balanced scorecards tell you the knowledge,skills, and systems that your employees willneed (their learning and growth) to innovateand build the right strategic capabilities and ef-
ficiencies (the internal processes) that deliverspecific value to the market (the customers),which will eventually lead to higher share-holder value (the financials).
Since we introduced the concept in 1992,we have worked with hundreds of executiveteams from various organizations, in both theprivate and public sectors. From this extensiveresearch, we have noticed certain patterns andhave brought them into a common visualframework—a strategy map—that embeds thedifferent items on an organization’s balancedscorecard into a cause-and-effect chain, con-necting desired outcomes with the drivers ofthose results.
We have developed strategy maps for com-panies in various industries, including insur-ance, banking, retail, health care, chemicals,energy, telecommunications, and e-commerce.The maps have also been useful for nonprofitorganizations and government units. Fromthis experience, we have developed a standardtemplate that executives can use to developtheir own strategy maps. (See the exhibit “TheBalanced Scorecard Strategy Map.”) The tem-plate contains four distinct regions—financial,customer, internal process, and learning andgrowth—that correspond to the four perspec-tives of the balanced scorecard.
The template provides a common frame-work and language that can be used to de-scribe any strategy, much like financial state-ments provide a generally accepted structurefor describing financial performance. A strat-egy map enables an organization to describeand illustrate, in clear and general language,its objectives, initiatives, and targets; the mea-sures used to assess its performance (such asmarket share and customer surveys); and thelinkages that are the foundation for strategicdirection.
To understand how a strategy map is built,we will study Mobil North American Market-ing and Refining, which executed a new strat-egy to reconstruct itself from a centrally con-trolled manufacturer of commodity productsto a decentralized, customer-driven organiza-tion. As a result, Mobil increased its operatingcash flow by more than $1 billion per year andbecame the industry’s profit leader.
From the Top DownThe best way to build strategy maps is fromthe top down, starting with the destination
Robert S. Kaplan ([email protected]) isthe Marvin Bower Professor of Leader-ship Development at Harvard BusinessSchool in Boston. David P. Norton([email protected]) is founder andpresident of the Balanced ScorecardCollaborative (www.bscol.com) basedin Lincoln, Massachusetts. This article isadapted from their book The Strategy-Focused Organization: How BalancedScorecard Companies Thrive in theNew Business Environment (HarvardBusiness School Press, September2000). The strategy maps concept wasintroduced in issues of The BalancedScorecard Report, a newsletter pub-lished jointly by the Balanced Score-card Collaborative and Harvard Busi-ness School Publishing.
Having Trouble with Your Strategy? Then Map It • TOOL KIT
harvard business review • september–october 2000 page 53
and then charting the routes that will leadthere. Corporate executives should first re-view their mission statement and their corevalues—why their company exists and what itbelieves in. With that information, managerscan develop a strategic vision, or what thecompany wants to become. This vision shouldcreate a clear picture of the company’s overallgoal—for example, to become the profitleader in an industry. A strategy must then de-fine the logic of how to arrive at that destina-tion.
Financial Perspective. Building a strategymap typically starts with a financial strategyfor increasing shareholder value. (Nonprofitand government units often place their cus-tomers or constituents—not the financials—atthe top of their strategy maps.) Companieshave two basic levers for their financial strat-egy: revenue growth and productivity. Theformer generally has two components: buildthe franchise with revenue from new markets,new products, and new customers; and in-crease value to existing customers by deepen-ing relationships with them through expandedsales—for example, cross-selling products oroffering bundled products instead of singleproducts. The productivity strategy also usu-ally has two parts: improve the company’s coststructure by reducing direct and indirect ex-penses, and use assets more efficiently by re-ducing the working and fixed capital needed tosupport a given level of business.
In general, the productivity strategy yieldsresults sooner than the growth strategy. Butone of the principal contributions of a strategymap is to highlight the opportunities for en-hancing financial performance through reve-nue growth, not just by cost reduction and im-proved asset utilization. Also, balancing thetwo strategies helps to ensure that cost andasset reductions do not compromise a com-pany’s growth opportunities with customers.
Mobil’s stated strategic vision was “to be thebest integrated refiner-marketer in the UnitedStates by efficiently delivering unprecedentedvalue to customers.” The company’s high-levelfinancial goal was to increase its return on cap-ital employed by more than six percentagepoints within three years. To achieve that, ex-ecutives used all four of the drivers of a finan-cial strategy that we break out in the strategymap—two for revenue growth and two forproductivity. (See the financial portion of the
exhibit “Mobil’s Strategy Map.”)The revenue growth strategy called for
Mobil to expand sales outside of gasoline by of-fering convenience store products and ser-vices, ancillary automotive services (carwashes, oil changes, and minor repairs), auto-motive products (oil, antifreeze, and wiperfluid), and common replacement parts (tiresand wiper blades). Also, the company wouldsell more premium brands to customers, and itwould increase sales faster than the industryaverage. In terms of productivity, Mobilwanted to slash operating expenses per gallonsold to the lowest level in the industry and ex-tract more from existing assets—for example,by reducing the downtime at its oil refineriesand increasing their yields.
Customer Perspective. The core of anybusiness strategy is the customer value propo-sition, which describes the unique mix ofproduct and service attributes, customer rela-tions, and corporate image that a company of-fers. It defines how the organization will dif-ferentiate itself from competitors to attract,retain, and deepen relationships with targetedcustomers. The value proposition is crucial be-cause it helps an organization connect its in-ternal processes to improved outcomes withits customers.
Typically, the value proposition is chosenfrom among three differentiators: operationalexcellence (for example, McDonald’s and DellComputer), customer intimacy (for example,Home Depot and IBM in the 1960s and 1970s),and product leadership (for example, Intel andSony).2 Companies strive to excel in one of thethree areas while maintaining threshold stan-dards in the other two. By identifying its cus-tomer value proposition, a company will thenknow which classes and types of customers totarget. In our research, we have found that al-though a clear definition of the value proposi-tion is the single most important step in devel-oping a strategy, approximately three-quartersof executive teams do not have consensusabout this basic information.
The inset of the exhibit “The BalancedScorecard Strategy Map” highlights the differ-ent objectives for the three generic strategyconcepts of operational excellence, customerintimacy, and product leadership. Specifically,companies that pursue a strategy of opera-tional excellence need to excel at competitivepricing, product quality and selection, speedy

Having Trouble with Your Strategy? Then Map It • TOOL KIT
harvard business review • september–october 2000 page 54
order fulfillment, and on-time delivery. Forcustomer intimacy, an organization muststress the quality of its relationships with cus-tomers, including exceptional service and thecompleteness of the solutions it offers. Andcompanies that pursue a product leadershipstrategy must concentrate on the functional-ity, features, and overall performance of itsproducts or services.
Mobil, in the past, had attempted to sell afull range of products and services to all con-sumers, while still matching the low prices ofnearby discount stations. But this unfocusedstrategy had failed, leading to poor financialperformance in the early ’90s. Through mar-ket research, Mobil discovered that price-sensi-tive consumers represented only about 20% ofgasoline purchasers, while consumer segments
representing nearly 60% of the market mightbe willing to pay significant price premiumsfor gasoline if they could buy at stations thatwere fast, friendly, and outfitted with excellentconvenience stores. With this information,Mobil made the crucial decision to adopt a“differentiated value proposition.” The com-pany would target the premium customer seg-ments by offering them immediate access togasoline pumps, each equipped with a self-pay-ment mechanism; safe, well-lit stations; cleanrestrooms; convenience stores stocked withfresh, high-quality merchandise; and friendlyemployees.
Mobil decided that the consumer’s buyingexperience was so central to its strategy that itinvested in a new system for measuring itsprogress in this area. Each month, the com-
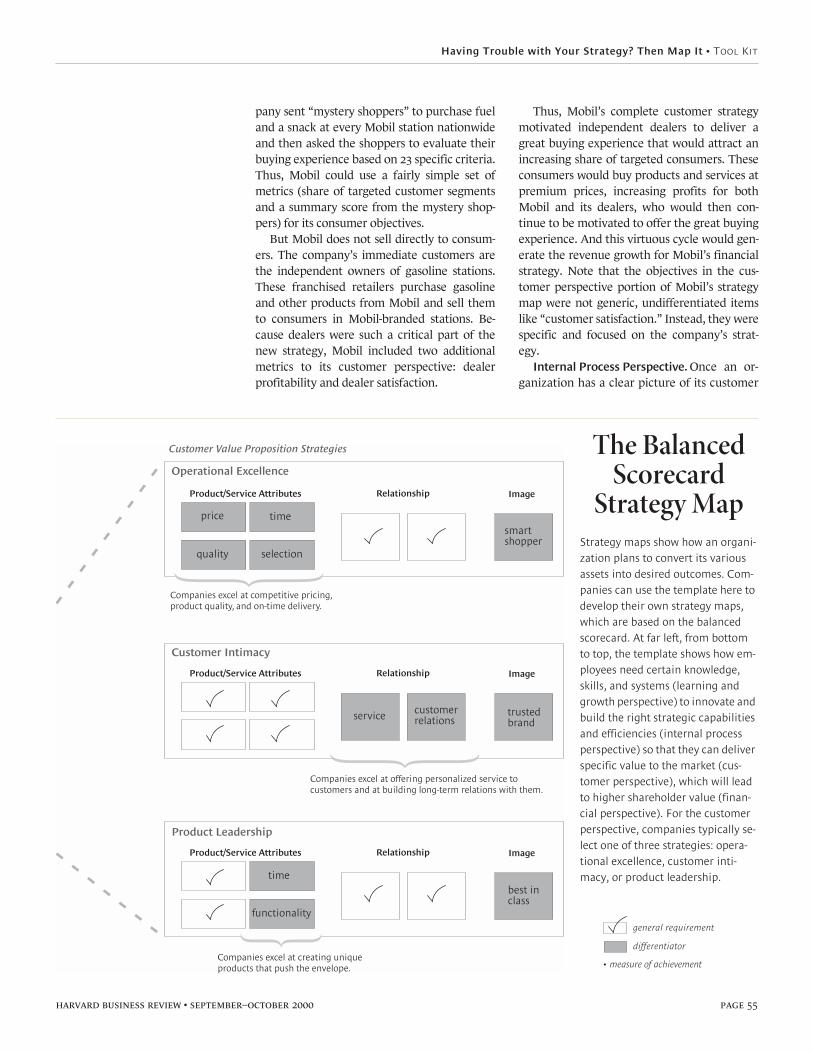
Having Trouble with Your Strategy? Then Map It • TOOL KIT
harvard business review • september–october 2000 page 55
pany sent “mystery shoppers” to purchase fueland a snack at every Mobil station nationwideand then asked the shoppers to evaluate theirbuying experience based on 23 specific criteria.Thus, Mobil could use a fairly simple set ofmetrics (share of targeted customer segmentsand a summary score from the mystery shop-pers) for its consumer objectives.
But Mobil does not sell directly to consum-ers. The company’s immediate customers arethe independent owners of gasoline stations.These franchised retailers purchase gasolineand other products from Mobil and sell themto consumers in Mobil-branded stations. Be-cause dealers were such a critical part of thenew strategy, Mobil included two additionalmetrics to its customer perspective: dealerprofitability and dealer satisfaction.
Thus, Mobil’s complete customer strategymotivated independent dealers to deliver agreat buying experience that would attract anincreasing share of targeted consumers. Theseconsumers would buy products and services atpremium prices, increasing profits for bothMobil and its dealers, who would then con-tinue to be motivated to offer the great buyingexperience. And this virtuous cycle would gen-erate the revenue growth for Mobil’s financialstrategy. Note that the objectives in the cus-tomer perspective portion of Mobil’s strategymap were not generic, undifferentiated itemslike “customer satisfaction.” Instead, they werespecific and focused on the company’s strat-egy.
Internal Process Perspective. Once an or-ganization has a clear picture of its customer
The Balanced Scorecard
Strategy MapStrategy maps show how an organi-zation plans to convert its various assets into desired outcomes. Com-panies can use the template here to develop their own strategy maps, which are based on the balanced scorecard. At far left, from bottom to top, the template shows how em-ployees need certain knowledge, skills, and systems (learning and growth perspective) to innovate and build the right strategic capabilities and efficiencies (internal process perspective) so that they can deliver specific value to the market (cus-tomer perspective), which will lead to higher shareholder value (finan-cial perspective). For the customer perspective, companies typically se-lect one of three strategies: opera-tional excellence, customer inti-macy, or product leadership.

Having Trouble with Your Strategy? Then Map It • TOOL KIT
harvard business review • september–october 2000 page 56
and financial perspectives, it can then deter-mine the means by which it will achieve thedifferentiated value proposition for customersand the productivity improvements to reachits financial objectives. The internal processperspective captures these critical organiza-tional activities, which fall into four high-levelprocesses: build the franchise by innovatingwith new products and services and by pene-trating new markets and customer segments;increase customer value by deepening rela-tionships with existing customers; achieve op-erational excellence by improving supplychain management, the cost, quality, andcycle time of internal processes, asset utiliza-tion, and capacity management; and becomea good corporate citizen by establishing effec-tive relationships with external stakeholders.
An important caveat to remember here isthat while many companies espouse a strategythat calls for innovation or for developingvalue-adding customer relationships, they mis-takenly choose to measure only the cost andquality of their operations—and not their in-novations or their customer management pro-cesses. These companies have a complete dis-connect between their strategy and how theymeasure it. Not surprisingly, these organiza-tions typically have great difficulty implement-ing their growth strategies.
The financial benefits from improved busi-ness processes typically reveal themselves instages. Cost savings from increased operationalefficiencies and process improvements createshort-term benefits. Revenue growth from en-hanced customer relationships accrues in theintermediate term. And increased innovationcan produce long-term revenue and marginimprovements.
Thus, a complete strategy should involvegenerating returns from all three of these in-ternal processes. (See the internal process por-tion of the exhibit “Mobil’s Strategy Map.”)
Mobil’s internal process objectives includedbuilding the franchise by developing newproducts and services, such as sales from con-venience stores; and enhancing customervalue by training dealers to become bettermanagers and by helping them generate prof-its from nongasoline products and services.The plan was that if dealers could capture in-creased revenues and profits from productsother than gasoline, they could then rely lesson gasoline sales, allowing Mobil to capture a
Mobil’s Strategy Map
Shown here is a map for the strategy that Mobil North American Marketing and Re-fining used to transform itself from a cen-trally controlled manufacturer of com-modity products to a decentralized customer-driven organization. A major part of the strategy was to target consum-ers who were willing to pay price premi-ums for gasoline if they could buy at fast, friendly stations that were outfitted with excellent convenience stores. Their pur-chases enabled Mobil to increase its profit margins and its revenue from nongaso-line products. Using the strategy map shown here, Mobil increased its operating cash flow by more than $1 billion per year.
**To account for Mobil’s independent-dealer customers—not just consum-ers—the company adapted the strategy map template to factor in dealer rela-tionships.
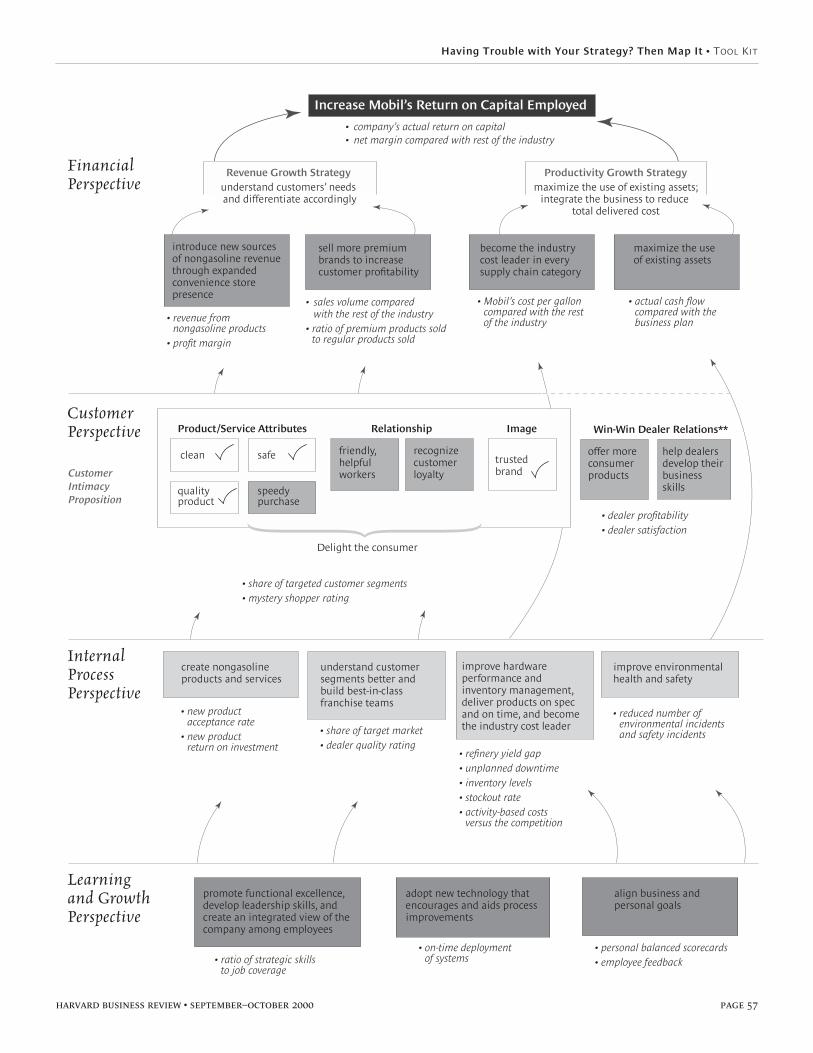
Having Trouble with Your Strategy? Then Map It • TOOL KIT
harvard business review • september–october 2000 page 57

Having Trouble with Your Strategy? Then Map It • TOOL KIT
harvard business review • september–october 2000 page 58
larger profit share of its sales of gasoline todealers.
For its customer intimacy strategy, Mobilhad to excel at understanding its consumersegments. And because Mobil doesn’t sell di-rectly to consumers, the company also had toconcentrate on building best-in-class franchiseteams.
Interestingly, Mobil placed a heavy empha-sis on objectives to improve its basic refiningand distribution operations, such as loweringoperating costs, reducing the downtime ofequipment, and improving product qualityand the number of on-time deliveries.
When a company such as Mobil adopts acustomer intimacy strategy, it usually focuseson its customer management processes. ButMobil’s differentiation occurred at the dealerlocations, not at its own facilities, which basi-cally produced commodity products (gasoline,heating oil, and jet fuel). So Mobil could notcharge its dealers higher prices to make up for
any higher costs incurred in its basic manufac-turing and distribution operations. Conse-quently, the company had to focus heavily onachieving operational excellence throughoutits value chain of operations.
Finally, as part of both its operational-excel-lence and corporate-citizen themes, Mobilwanted to eliminate environmental and safetyaccidents. Executives believed that if therewere injuries and other problems at work,then employees were probably not paying suf-ficient attention to their jobs.
Learning and Growth Perspective. Thefoundation of any strategy map is the learningand growth perspective, which defines thecore competencies and skills, the technolo-gies, and the corporate culture needed to sup-port an organization’s strategy. These objec-tives enable a company to align its humanresources and information technology with itsstrategy. Specifically, the organization mustdetermine how it will satisfy the requirements
Having Trouble with Your Strategy? Then Map It • TOOL KIT
harvard business review • september–october 2000 page 59
from critical internal processes, the differenti-ated value proposition, and customer relation-ships. Although executive teams readily ac-knowledge the importance of the learning andgrowth perspective, they generally have trou-ble defining the corresponding objectives.
Mobil identified that its employees neededto gain a broader understanding of the market-ing and refining business from end to end. Ad-ditionally, the company knew it had to nurturethe leadership skills that were necessary for itsmanagers to articulate the company’s visionand develop employees. Mobil identified keytechnologies that it had to develop, includingautomated equipment for monitoring the re-fining processes and extensive databases andtools to analyze consumers’ buying experi-ences.
Upon completing its learning and growthperspective, Mobil now had a complete strat-egy map linked across the four major perspec-tives, from which Mobil’s different businessunits and service departments could developtheir own detailed maps for their respectiveoperations. This process helped the companydetect and fill major gaps in the strategiesbeing implemented at lower levels of the orga-nization. For example, senior management no-ticed that one business unit had no objectivesor metrics for dealers (see the exhibit “What’sMissing?”). Had this unit discovered how to by-pass dealers and sell gasoline directly to con-sumers? Were dealer relationships no longerstrategic for this unit? Another business unithad no measure for quality. Had the unitachieved perfection? Strategy maps can helpuncover and remedy such omissions.
Strategy maps also help identify whenscorecards are not truly strategic. Many organi-zations have built stakeholder scorecards, notstrategy scorecards, by developing a seeminglybalanced measurement system around threedominant groups of constituents: employees,customers, and shareholders. A strategy, how-ever, must describe how a company willachieve its desired outcome of satisfying em-ployees, customers, and shareholders. The“how” must include the value proposition inthe customer perspective; the innovation, cus-tomer management, and operating processesin the internal process perspective; and theemployee skills and information technologycapabilities in the learning and growth per-spective. These elements are as fundamental
to the strategy as the projected outcome of thestrategy.
Another limitation occurs when companiesbuild key performance indicator (KPI) score-cards. For example, one financial services orga-nization identified the four Ps in its balancedscorecard: profits, portfolio (the volume ofloans), process (the percentage of processesthat are ISO certified), and people (the diver-sity of new employees). Although this ap-proach was more balanced than using just fi-nancial measures, a comparison of the four Pswith a strategy map revealed several missingcomponents: no customer measures, only asingle internal-process metric—which was fo-cused on an initiative, not an outcome—andno defined role for information technology, astrange omission for a financial services orga-nization. In actuality, KPI scorecards are an adhoc collection of measures, a checklist, or per-haps elements in a compensation plan, butthey don’t describe a coherent strategy. Unlessthe link to strategy has been clearly thoughtthrough, a KPI scorecard can be a dangerous il-lusion.
Perhaps the greatest benefit of strategymaps is their ability to communicate strategyto an entire organization. The power of doingso is amply demonstrated by the story of howMobil developed Speedpass, a small device car-ried on a keychain that, when waved in frontof a photocell on a gasoline pump, identifiesthe consumer and charges the appropriatecredit or debit card for the purchase. The ideafor Speedpass came from a planning managerin the marketing technology group wholearned from Mobil’s balanced scorecardabout the importance of speed in the purchas-ing transaction. He came up with the conceptof a device that could automatically handle theentire purchasing transaction. He worked witha gasoline-pump manufacturer and a semicon-ductor company to turn that idea into reality.After its introduction, Speedpass soon becamea strong differentiator for Mobil’s value propo-sition of fast, friendly service. From 1997 on,executives modified Mobil’s balanced score-card to include new objectives for the numberof consumers and dealers that adopted Speed-pass.
With all its employees now aligned to thenew strategy, Mobil North American Market-ing and Refining executed a remarkable turn-around in less than two years to become the in-

Having Trouble with Your Strategy? Then Map It • TOOL KIT
harvard business review • september–october 2000 page 60
dustry’s profit leader from 1995 up through itsmerger with Exxon in late 1999. The divisionincreased its return on capital employed from6% to 16%; sales growth exceeded the industryaverage by more than 2% annually; cash ex-penses decreased by 20%; and in 1998, the divi-sion’s operating cash flow was more than $1billion per year higher than at the launch ofthe new strategy.
These impressive financial results weredriven by improvements throughout Mobil’sstrategy map: mystery-shopper scores anddealer quality increased each year; the numberof consumers using Speedpass grew by onemillion annually; environmental and safety ac-cidents plunged between 60% and 80%; lostoil-refinery yields due to systems downtimedropped by 70%; and employee awareness andcommitment to the strategy more than qua-drupled.
Not an Art FormWe do not claim to have made a science ofstrategy; the formulation of great strategies isan art, and it will always remain so. But thedescription of strategy should not be an art. Ifpeople can describe strategy in a more disci-plined way, they will increase the likelihood ofits successful implementation. Strategy mapswill help organizations view their strategies ina cohesive, integrated, and systematic way.They often expose gaps in strategies, enabling
executives to take early corrective actions. Ex-ecutives can also use the maps as the founda-tion for a management system that can helpan organization implement its growth initia-tives effectively and rapidly.
Strategy implies the movement of an orga-nization from its present position to a desir-able but uncertain future position. Because theorganization has never been to this futureplace, the pathway to it consists of a series oflinked hypotheses. A strategy map specifiesthese cause-and-effect relationships, whichmakes them explicit and testable. The key,then, to implementing strategy is to have ev-eryone in the organization clearly understandthe underlying hypotheses, to align all organi-zational units and resources with those hy-potheses, to test the hypotheses continually,and to use those results to adapt as required.
1. See Robert S. Kaplan and David P. Norton’s, The BalancedScorecard: Translating Strategy into Action (Harvard Busi-ness School Press, 1996).
2. These three generic value propositions were initially ar-ticulated in Michael Treacy and Fred Wiersema’s The Disci-pline of Market Leaders (Addison-Wesley, 1995).
Reprint R00509; Harvard Business Review OnPoint 5165To order, see the next pageor call 800-988-0886 or 617-783-7500or go to www.hbr.org
T O O L K I T
Having Trouble with Your Strategy? Then Map It
To Order
For reprints, Harvard Business Review OnPoint orders, and subscriptions to Harvard Business Review:Call 800-988-0886 or 617-783-7500.Go to www.hbr.org
For customized and quantity orders of reprints and Harvard Business Review OnPoint products:Call Frank Tamoshunas at 617-783-7626, or e-mail him at [email protected]
page 61
Further ReadingA R T I C L E SThe Balanced Scorecard—Measures that Drive Performanceby Robert S. Kaplan and David P. NortonHarvard Business ReviewJanuary–February 1992Product no. 4096
This article introduced the balanced scorecard—and lays the foundation for understanding strat-egy maps. It clarifies why no single perspective fully captures a company’s health. Instead, bal-ance four perspectives—financial, customer, in-ternal business processes, and innovation and learning—and track performance in each.
Putting the Balanced Scorecard to Workby Robert S. Kaplan and David P. NortonHarvard Business ReviewSeptember–October 1993Product no. 4118
Before building your strategy map, learn how to create a balanced scorecard that reflects your company’s mission and strategy. Define corpo-rate objectives and metrics within each of the four scorecard perspectives. These metrics will clarify how different you’ll look to customers and share-holders when you reach your goals. They will also indicate how your internal processes, as well as your ability to innovate and grow, should change.
Using the Balanced Scorecard as a Strategic Management Systemby Robert S. Kaplan and David P. NortonHarvard Business ReviewJanuary–February 1996Product no. 4126
A strategy map helps employees know how their everyday actions support the company’s goals. This article outlines four steps for ensur-ing that those short-term actions lead to the right outcomes: 1) Communicate strategy throughout the organization. 2) Align unit and individual goals with the strategy. 3) Link strate-gic objectives to long-term targets and bud-gets. 4) Conduct performance reviews to hone the strategy.
B O O K SThe Balanced Scorecard: Translating Strategy into Actionby Robert S. Kaplan and David P. NortonHarvard Business School Press1996Product no. 6513
Your balanced scorecard and strategy map help you focus on implementing strategy. This book provides greater insight into how to choose objectives and metrics to guide your strategy execution. Extended examples show how actual companies have used these tools.
The Strategy-Focused Organization: How Balanced Scorecard Companies Thrive in the New Business Environmentby Robert S. Kaplan and David P. NortonHarvard Business School Press2000Product no. 2506
This latest book by Kaplan and Norton expands on the theme of strategy focus and execution. They emphasize the importance of making strat-egy absolutely clear to—and a continuous pro-cess for—everyone. Drawing on 10 years of re-search into more than 200 companies, the authors use in-depth case examples to show how balanced scorecard adopters have taken this groundbreaking tool to the next level—put-ting strategy at the center of management pro-cesses and systems. This research resulted in a series of industry-specific strategy maps that any company can use to build its own.
N E W S L E T T E RBalanced Scorecard ReportThis newsletter is published by the Balanced Scorecard Collaborative and Harvard Business School Publishing. It brings you the most cur-rent thinking of scorecard originators Robert Kaplan and David Norton, along with exclusive field reports, case studies, and analysis.