focused on today… poised for tomorrow…
DESCRIPTION
ttTRANSCRIPT

Annual Report 2007
Focused on today... Poised for tomorrow...
Ed
ited
& P
ub
lish
ed b
y G
lob
al C
orp
ora
te C
om
mu
nic
atio
ns
at R
anb
axy;
Co
nce
pt
& D
esig
n b
y U
nit
ed A
dve
rtis
ing
; Ph
oto
gra
ph
y b
y A
dit
ya A
rya;
Pri
nte
d b
y T
ho
mso
n P
ress
Focused on today... Poised for tomorrow...
Annual Report 2007
Plot No. 90, Sector 32, Gurgaon – 122 001, Haryana (India) Tel.: +91-124-4135000. Fax : +91-124-4135001
www.ranbaxy.com

Emerging markets, niche and specialty
segments, First-to-File (FTF) products in the US,
the NDDR de-merger...indeed, there's a lot new
on Ranbaxy's horizon this year. And while change
is already underway, this is just the beginning,
with several new initiatives lined up for the
immediate future.
As your Company pushes the frontiers of
possibility, both horizontally and vertically,
growth through scientific breakthroughs and
strategic initiatives is just around the corner.
The clear aspiration is to achieve global sales of
US $ 5 Bn by 2012 and position Ranbaxy among
the top 5 global generic companies.
Focused on Today... Poised for Tomorrow...
It is indeed a pleasant surprise when you discover something valuable and priceless in
something as ordinary as an Oyster. But at Ranbaxy, we have always sensed it was
there. The 'Pearl of Success' veiled beyond sight in markets yet untapped and in those
wonderfully elusive niche areas, untouched.
It took dogged pursuit, and an uncanny sense for business to unravel the marvel and
prize it open, discovering along the way, the joys of first mover advantage.
With a determined eye squarely on the future, we are ready for today and are well poised
to bathe in the pearly glow of success, beyond tomorrow.

Chairman’s Message........................................................2
CEO & Managing Director’s Message ............................4
COO’s Message .................................................................8
Key Markets Review ........................................................12
Therapy Focus..................................................................16
Research & Development ..............................................18
Financial Review .............................................................20
Global Human Resources...............................................21
Corporate Social Responsibility and .............................22Environment, Health & Safety
Corporate Governance ...................................................23
Certificate from CEO and Vice President & Head-Global Finance.........................31
Board of Directors...........................................................32
Report of the Directors...................................................33
Ten Years at a Glance .....................................................46
Auditors’ Report ..............................................................47
Financial Statements of Ranbaxy
Standalone.......................................................................50
Consolidated Indian GAAP..............................................79
Consolidated US GAAP .................................................105
Contents
*Including CIS ROW : Rest of the World
455
Europe*
37%
North America
7%
Asia
16%
ROW
62%
419 425 215
Key Markets - Dosage Form Sales (2007) US $ Mn
20062007
1,339 1,619
US $ Mn
Profit After Tax
Global SalesUS $ Mn
20062007
114
190

CHAIRMAN’s MESSAGE
Dear Shareholder,
It gives me pleasure to say that the year 2007 has been a year of positive change for the Company. On several parameters starting with financial performance, your Company has improved outcomes and simultaneously undertaken several initiatives to better position itself for the future.
For an international company, it is prudent to diversify its market base as well as balance it from a financial standpoint, so that exigencies in one do not have a sweeping impact on the overall earnings. At Ranbaxy, we have diligently pursued this strategy and are today at a stage where our geographic mix of global sales is better balanced, substantially de-risked and not overtly dependant on any single region or country.
It is evident that India, given its strengths in science, will play a pivotal role in the pharmaceutical R&D space. Ranbaxy clearly sees this as a thrust area and has committed itself to a strategy to fastrack efforts in New Drug Discovery Research (NDDR). The Board has accordingly approved the scheme of de-merger for the NDDR into a separate entity, Ranbaxy Life Science Research Limited (RLSRL). We strongly believe that this will result in generating greater commitment with dedicated resources for path-breaking research by better aligning assets with priorities. The operational
Ranbaxy Laboratories Limited Annual Report 2007 Chairman’s Message
The year saw the Management's focus on efficiency, productivity, cost containment and quality improvement through a variety of initiatives lead by the senior management team. Processes and systems were reviewed with rigour, as were departments and businesses. Plans and actions have been taken in many areas including decisions on outsourcing lower value-add activities, embedding best practices, streamlining processes and focusing on profit maximisation. These actions will help tone the organisation and will, over time, help consolidate the competitive advantage for the sustained growth of the Company.
Consistently over the years, your Board of Directors have emphasised the need for creating an enabling culture in the organisation in which performance with ethical practices receives the highest emphasis. To push the envelope on enablement, the Management undertook special programmes during the year with the objective of achieving greater engagement, better communication and an appreciation driven culture in the Company. This focus on the softer side of culture, has led to greater team spirit, motivation and sincerity with which employees approach their tasks in meeting corporate objectives.
No company functions in an isolated environment. The final flavour of our Corporate Citizenship will be significantly defined by how well we pursue causes that are beyond our immediate business concerns. It is a matter of pride that your Company is well recognised for performance in the complex world of global pharma and has earned accolades from diverse quarters for itself and the Country. Somewhat less known, are our efforts in Community Health and our support of research through the Ranbaxy Science Foundation. In the coming years, we hope to further enhance these efforts and extend such contributions to other areas as well.
It is common practice to refer to human resources as one amongst other resources such as land, equipment and capital that are needed for the production and sale of any product or service. Whilst this has been the well-acknowledged view, may I suggest a slight change in
32Harpal SinghNon-Executive Chairman
March 29, 2008
emphasis to highlight the importance and distinctive character of human resources. I do this partly to appreciate the special efforts being put in by the Management to recognise the importance of human resources but more importantly to draw attention to the unique position that human resources must enjoy as compared with the other resources mentioned above. Whilst land, equipment and capital can be termed as “Resources”, I do believe that when it comes to “Humans” we should not refer to them as resources but as “the Source” of all economic activity. It is only when we accord our human assets this level of prominence, can we recognise their true contribution to the success of our endeavours. The Ranbaxy family has been the source of all our successes to date and it goes without saying that we cannot, but depend upon them for our future successes as well. I make these comments to acknowledge our appreciation for the dedication and commitment of every member of the Ranbaxy team, and to each one of them and their families, I wish good tidings on behalf of the Board.
Whilst thanking all our well wishers, stakeholders and our Board of Directors for their whole-hearted support through the year, I must also thank my predecessor,Mr Tejendra Khanna, for having held the helm of the Company with such calm and dignity during his tenureas Chairman. His emphasis on value based leadershipwas the natural corollary to the path set by the Late Dr Parvinder Singh, to whom we owe a deep debt of gratitude for giving us the opportunity to be partners of a great enterprise called Ranbaxy.
By any standard, this will be a hard act to follow. But with your continued support and the confidence you have placed in the Management and in the Company's Directors, I have no doubt that we will surpass your expectations and resolutely stay on course to achieving the Company's
Vision. Earning global respect will be our guiding principle.
EXPLORING A BROADER
SPECTRUM
The Management undertook special programmes during the year with the objective of achieving greater engagement, better communication and an appreciation driven culture in the Company
We have put in place robust business and work processes that are benchmarked against the world's best
freedom and flexibility available to RLSRL will open up new growth opportunities.
Pursuant to the emergence of specialty and niche segments in several therapy areas, we see tremendous scope for alliances and partnerships at the cutting edge of technology. Your Company is seeking and has entered into several such alliances to expand its therapeutic range, acquire new competencies and to access new markets. As early entrants, we see this as an important growth driver which will deliver handsome gains in the years ahead.
As a true multinational company, Ranbaxy is exposed to the operating and regulatory complexities of an intensely competitive and global environment. We
have put in place robust business and work processes that are benchmarked against the
world's best. A strong Board with independent Directors, guides and works through C o r p o r a t e G o v e r n a n c e C o m m i t t e e s t h a t f o c u s o n a s p e c t s l i k e A u d i t , C o m p e n s a t i o n , S c i e n c e , Share Transfer, Shareholder G r i e v a n c e s e t c . T h e C o m m i t t e e s r e g u l a r l y scrutinise the policies and p r o p o s a l s m a d e b y t h e Operating Management and also provide an unbiased independent assessment of the state of robustness of the business processes in place. They also guide management to cont inuously upgrade standards and proactively address potential vulnerability areas.
We are today at a stage where our geographic mix of global
sales is better balanced, substantially de-risked and not overtly dependant on any single
region or country.
Greater Engagement
Better Communication
Appreciation Driven Culture
Harpal Singh, Non-Executive Chairman

CEO & MANAGING DIRECTOR'sMESSAGE
Dear Shareholder,
Ranbaxy made strong progress during the year 2007, scaling new heights and achieving new milestones. Our energies and efforts throughout the year were focused on delivering the twin objectives of a strong operating performance and securing the growth drivers of the future.
Global Sales recorded a robust growth of 21% and exceeded US $ 1.6 Bn for the year. The Profit after Tax grew 67% to US $ 190 Mn, on the back of well rounded growth, across geographies.
Our emerging markets portfolio continued to perform well, led by strong growth in India, CIS, Romania, South Africa and Brazil. These markets now account for more than half of our global revenues and are a key growth driver of the business. The developed markets progressed well on the back of a strong year for the European business with the markets of UK, Germany and France recording a strong performance for the year. The US business was bolstered by the launch of our second consecutive First-to-File (FTF) product, Pravastatin 80mg, and good growth in the branded portfolio, led by performance of the f lagship brand, Sotret and consolidation of the acquired dermatological products range.
As you are aware, towards the end of 2005, we had
that are contributing to this change are rising costs, falling success rates of innovation, expanding proportion of biologics in the new drugs pipeline, an expanding footprint of generics enabled by regulatory changes and the emerging markets becoming the key growth drivers of future. As an outcome of these and related factors, pharmaceutical companies globally are re-defining the business models to focus on their core competencies while entering into strategic alliances and collaborations to effectively capture the growth opportunities and address the key gaps in their value chain. As the new operating models evolve further, we expect to see broader and deeper strategic partnerships become the order of the day.
Ranbaxy, as an industry leader, has been highly conscious of these emerging trends in the pharmaceuticals industry. We have been proactive in our approach to gain from these changes and in the process have undertaken strategic initiatives, which include partnering with companies focused on research and manufacturing in specialty and niche areas.
Specifically, in the Indian context, a significant initiative in terms of a new operating model was also seen in the area of innovation, wherein the New Drug Discovery Research (NDDR) activities are being segregated and organised into a separate entity. This is an outcome of an assessment to identify the set of assets or strategic units that have a significantly high potential for growth and value creation, w h i c h c a n b e b e t t e r leveraged through a different organisational structure. In this
already begun to re-orient the geographic mix of our business in favour of the emerging markets. These markets offer a higher growth with the attendant benefit of healthier and sustained profitability. During the year, we worked aggressively on optimising resource allocation, leading to a significant reduction of over 3% in gross working capital, which was utilised to further stimulate the core generics engine of the business. This tightening of the overall resource allocation, coupled with higher operating profits, led to a stronger cash flow position.
At the beginning of 2007, a new operating structure headed by Mr Atul Sobti, was crafted to further strengthen the operations of the business. This new structure has evolved
comprehensively and is now firmly established. In this process, leadership in certain critical functions like Generics R&D, Quality and Regulatory h a s b e e n s t r e n g t h e n e d and with some structural realignment and consolidation of functions, the overall efficiency of the organisation has been enhanced .
New Operating Models
The operating models of the pharmaceuticals industry are undergoing a signif icant change emanating from the altered fundamental dynamics of a highly fragmented value chain. Some of the key factors
direction, Ranbaxy has set in process, the de-merger of its NDDR unit into a separate entity, Ranbaxy Life Science Research Limited. The move will create an independent pathway for our NDDR and is expected to result in long-term value building by providing flexibility and operational freedom to our drug discovery programmes. The separate listing of the entity, as planned, while delivering commensurate value to the shareholders, will fuel the investment plans essential for realising the opportunity for substantial growth and value creation in the long term.
India: Emerging as a Hub for Global Pharma
Over the last many years the Indian pharma industry has been extensively engaged in honing its skills and competencies to fructify and accentuate the sustainable 'India Advantage' in the space of Contract Manufacturing, Drug Development and Drug Discovery and Research. India has arguably one of the strongest streamsof scientific talent flow, an established reputation
o f c o m p l i a n c e w i t h t h e highest quality and regulatory s tandards , d is t inct cost advantages in manufacturing and drug development, a large naive patient pool with some of the fastest patient recruitment rates and an innovation and original research engine, which has exhibited success in its research collaborations with the global innovator companies. Related to each of these three segments of the pharma industry, India's set of competitive advantages are being increasingly recognised by the global industry as distinct and sustainable.
Ranbaxy Laboratories Limited Annual Report 2007 CEO & MD’s Message
NEW
FACETS OF GROWTH
54
Global Sales recorded a robust growth of 21% and exceeded US $ 1.6 Bn for the year. Profit after Tax grew 67% to US $ 190 Mn, on the back of well rounded growth, across geographies
Emerging markets now account for more than half of our global revenues and are a key growth driver of the business
We strongly believe that our entry into high potential
segments, such as Bio-generics, Oncology, Penems, Limuses, Peptides, etc. holds the key to
the future. Our intent now will be to deploy our regulatory expertise and front-end
infrastructure to introduce and leverage the potential of these products across geographies.
Emerging 54% Developed 40%
Ot ers 6%h
Global Markets Mix 2007
US $
1. Bn6
21%
EMERGING MARKETS
54%Total Revenue
Malvinder Mohan Singh,CEO & Managing Director

Looking into the future, one feels confident of the fact that the Indian industry is well poised to re-define and significantly expand its role in the global pharma space by emerging as the global hub for Manufacturing, Drug Discovery and Development.
Growth Frontiers for Tomorrow
Your Company has been focusing on future growth drivers that can propel the business towards the stated aspirations of 2012. During the year, we concentrated on entering the specialty and niche therapeutic areas that offer high growth potential, sustainable earnings and healthy margins. We strongly believe that our entry into high potential segments, such as Bio-generics, Oncology, Penems, Limuses, Peptides, etc. holds the key to the future. Our intent now will be to deploy our regulatory expertise and front-end infrastructure, to introduce and leverage the potential of these products across geographies.
In this direction, we have expanded our partnership with Zenotech Laboratories Limited to work on the two key therapy areas of Oncology and Bio-generics, that hold immense potential. The global biopharmaceuticals market is valued at approximately US $ 65 Bn, at innovator prices, of which products over US $ 21 Bn are expected to go off patent in the next 4-5 years. Similarly, the global Oncology market also offers a huge opportunity and is worth over US $ 35 Bn. We have entered into a global supply agreement for Peptides and have also identified a basket of high-value drugs that come under the category of Penems and Limuses. These complex segments add significant depth to our existing product pipeline and we plan to roll-out these niche products in the developed and emerging markets in the coming years.
Our innovation engine in the generics R&D space continues to create significant value for the business in the form of Para IV and FTF pipeline. We effectively optimised our FTF opportunities and entered into 3 independent litigation settlements with innovator companies, GlaxoSmithKline (GSK) for Valacyclovir (Valtrex) and Sumatriptan (Imitrex) and with Boehringer Ingelheim / Astellas Pharma for Tamsulosin (Flomax). This provides assured visibility and certainty of revenue flows, 2008 onwards. Based on the available US FDA data and our internal analysis, we believe that Ranbaxy today has one of the largest product pipeline in the US that includes 18 potential FTF opportunities with a commanding market size of around US $ 27 Bn, at innovator prices. While on the one hand, we will step up our innovation efforts to ensure that high value opportunities are created for the future, on the other, we will evolve a strategy to address the opportunities presented by our existing pipeline of FTF products, to maximise the potential of our Intellectual Property assets.
The right mix of global markets plays a very important role in garnering and sharpening the pace of growth going into the future. We will optimise our market related resource allocation strategy in line with the growth opportunities, as they unfold across developed and emerging markets. Our endeavour will be to continuously evaluate and align the flow of resources in a manner that best enables us to sustain a premium over the growth rate afforded by the local market environment.
While aggressively pursuing organic growth across all our markets in the coming years, we intend to employ the route of inorganic activities to supplement the organic growth momentum. We will be actively looking at opportunities in the high potential emerging markets like India. At the same time, we will also be looking at building further, our portfolio of specialty products and niche technologies to strengthen the future growth potential.
Witnessing significant traction in the above set of levers, gives us the confidence that we are well on our way to ensuring sustained and profitable growth for the Company in the future.
People Development
The success of our organisation is fundamentally linked to our people. To build resources and
Ranbaxy Laboratories Limited Annual Report 2007 CEO & MD’s Message
competencies required for the future and realise our aspirations, we have focussed on comprehensive talent management and development and are systematically investing in our people to strengthen the foundationsof human capital. The Company has institutionalised a process of recognising, appreciating and rewarding individuals and teams who have excelled in their respective areas.
Gearing up for the future challenges and exciting opportunities, we are reinvigorating our work culture, enriching it through a more open and conducive environment for sharing ideas and propagating teamwork. While at the same time we are re-enforcing our unique organisational trait of providing a highly empowered environment to all employees, thereby propagating out-of-box thinking along with a strong sense of ownership and accountability. Synergistic benefits derived from the pooling of knowledge and experience from within the organisation will be our cornerstone for the future.
Conclusion
I am happy that we have emerged as a Company that is focused on the present with an eye on the future. A company that is Focused on Today and Poised for Tomorrow.
On the one hand, we have the benefit of strong momentum behind us, built over the past two years through consistently high double-digit top line growth. While on the other, is our well honed strategy for sustaining and expanding this growth momentum in the future.
Our steady investments in high potential therapy areas and specialty portfolios in value-added and differentiated products, in an appropriate combination of in-house investments and strategic partnerships and in a balanced geographic business structure, will guide and enable our progress to being among the top 5 Global Generic companies, by 2012.
Let me take the opportunity to thank my global team who constantly strive to achieve excellence and set new benchmarks.
I would also like to thank all our shareholders for their enduring support and look forward to jointly celebrating many more successful years.
Malvinder Mohan SinghCEO & Managing Director
March 29, 2008
76
Our Innovation engine in the Generics R&D space continues to create significant value for the business in the form of Para IV andFTF pipeline
We have focused on comprehensive talent management and development and are systematically investing in our people to strengthen the foundations of human capital
Cn apa itm au lH
FTF
Para IV
D&R scireneG

COO's MESSAGE
Ranbaxy has had a very good year, with strong growth in revenues, profits and key operational and financial parameters. The year was also an important one, in terms of certain strategic initiatives, that will hold us in good stead for the future, and further improve our operational performance.
Ranbaxy achieved Global Sales of US $ 1,619 Mn, a growth of 21%. Emerging markets strengthened their presence in the Company's overall sales mix, and comprised 54% of the total sales (49% in 2006). These markets, primarily branded generic in nature, and therefore potentially more profitable, grew a robust 32%, driven by performance in India, CIS, Romania, South Africa and Brazil.
The developed markets saw a much improved performance from UK, Germany, France and Canada and on an overall basis, grew by 13%. The US base business achieved good growth, despite severe constraints.
The consolidated Profit b e f o r e I n t e r e s t , Depreciation, Amortisation and Impairment, grew by 59%, to US $ 329 Mn. Profit before Tax was US $ 242 Mn, reflecting a growth of 68%. Profit after Tax was US $ 190 Mn, a growth of 67%.
Focused efforts towards reducing Working Capital have resulted in a stronger cash flow position for t h e C o m p a n y . B e t t e r receivables and inventory
an impressive performance with Germany and UK recording sales growth of 69% and 36% respectively.
Romania, our largest market in EU, registered a 22% growth in sales to US $ 121 Mn. Impending healthcare reforms in the market place is leading to a delay in the government's product and price approval list, and adding to the uncertainty amongst the customers and suppliers. This impacted our growth plans and more specifically, our new product introductions. We expect clarity and certainty to emerge through the course of the current year, and provide us with a more stable and conducive business environment.
The India business continued with its strong growth momentum, and recorded sales of US $ 301 Mn, a growth of 22 %. New product introductions, a shift towards the faster growing Chronic therapy product segment, robust performance in Novel Drug Delivery System (NDDS) products, an increasing number of in-licensing arrangements, and new initiatives taken in the retail and extra-urban market, have enabled us to be amongst the leading companies in the domestic market. Amongst “New Product Introductions,” we had the highest number of brands in the Top 30 leading launches over the last 2 years, specifically Volix, Synasma, Volitra and Gembax. Some significant recent launches include Caldrink, Osonase Nasal Spray and Coviro.
Other key markets such as Russia, Ukraine, Brazil and South Africa have added to the growth momentum in our emerging markets. In South Africa, not only have we grown
management helped in the reduction in Working Capital by more than 3% of total sales.
Within our Global Pharmaceutical Business, the US continued to be the largest market of the Company, generating sales of US $ 390 Mn. We also launched Pravastatin tablets, 80mg, which represented a First-to-File (FTF) opportunity, providing us 180 days of marketing exclusivity. While approximately two-thirds of the business comprises the commodity Generics segment, the Branded Generics and Over-the-Counter (OTC) segments helped us achieve a more balanced business and profit mix in the US
market.
The base generics business (excluding the impact of FTF product revenues in 2007 and 2006)
witnessed a growth of 20%.
Ranbaxy Pharmaceuticals Canada Inc. is today ranked 9th in the Canadian market, with sales of approximately US $ 29 Mn in 2007 (US $12 Mn in 2006). Our business in Canada continues to be on a high growth trajectory and it has emerged as one of the most successful new operations of the Company.
The Company's operations in the European Union (EU) markets also saw a significant improvement, recording a sales growth of 24% (US $ 365 Mn including Romania). The key western markets of UK, Germany and France turned in
well, we have also effectively integrated the acquired Be-Tabs business and initiated plans for capacity expansion and upgradation. We are now ranked No. 5 in South Africa.
In Japan, there is considerable excitement on the prospect for high generic growth, following an expected policy initiative in March/April 2008.
The Company's Global Anti-retroviral (ARV) business continued to perform well, with sales of US $ 54 Mn during the year, recording a growth of 15%.
The Global Consumer Healthcare business registered excellent growth at 41%, with sales of US $ 62 Mn globally. The International Over-the-Counter (OTC) business grew by 57%, registering sales of US $ 25 Mn. India registered a sales growth of 32% to US $ 37 Mn. Revital, the flagship brand, garnered 84% market share (ORG-SSA Nov.' 07) in India. A key addition to the portfolio was the launch of Volini cream during the year. The division also introduced a sugar free Chyawanprash under the brand name 'Chyawan Active'.
Our Active Pharmaceutical Ingredients (API) business contributed US $ 105 Mn, with a clear shift towards developed markets , and contribution from key supply agreements.
With a view to enhance our presence in the specialty products segment, we have i n c r e a s e d o u r s t a k e i n Zenotech Laboratories Limited from the previous 7% to approximately 47% at present. Zenotech, with its requisite skill sets and capabilities in the
Ranbaxy Laboratories Limited Annual Report 2007 COO’s Message
98
We have consolidated well in 2007 with a strong
performance on all key financial and operating
parameters. Looking ahead at 2008, we expect to build
further on the momentum in our business while retaining
an emphasis on margins and cash.
Atul Sobti, Chief Operating Officer
LEVERAGING
FORESIGHT
The Global Consumer Healthcare business registered excellent growth at 41%, with sales of US $ 62 Mn globally
41%
GlobalConsumer Healthcare
Ranbaxy's Global ARV business continued to perform well with sales of US $ 54 Mn during the year, recording a growth of 15%
US $ 54 Mn
ARV Business
15%

development and manufacture of Bio-similars, Oncology and general injectable products, provides us a strategic fit t o f u r t h e r l e v e r a g e o u r existing marketing and regulatory expertise across developed and emerging countries. We have already init iated plans to commercialise the existing Bio-similars portfolio in select emerging markets. This will be followed by the developed markets of Europe and US. In addition, we have filed 7 general injectable Abbreviated New Drug Applications (ANDAs) in 2007, for the US market.
Our in-house capabilities in Penems, Limuses and non-oral high potency Cytotoxic products will further bolster our presence in the fast growing and highly profitable specialty products segment.
To meet our increasing requirements on account of new products and higher volumes, Global Manufacturing undertook the modernisation and capacity expansion of a number of plants during the year. In India, Paonta Sahib, Himachal Pradesh (HP) and Dewas, Madhya Pradesh (MP), capacities were upgraded; a multi-function API facility was set up at Toansa, Punjab. In Malanpur, MP, the API facility was upgraded; a Bio-Equivalence facility at Terapia Ranbaxy, Romania, was set up; and capacity enhancement projects were also initiated in Malaysia, Nigeria and South Africa. To enter markets for select specialty products, a new facility at our Batamandi, HP, plant is also under way.
The manufacturing facilities at Ohm, USA, were enhanced to increase their solid and liquid dosage form capacities. Ohm is now the second largest dosage form manufacturing operation in Ranbaxy's global network.
We have also received all necessary approvals from the Government of India for our Special Economic Zone (SEZ) at Mohali in Punjab.
As a testimony to our Good Manufacturing Practice (GMP) standards, our key API plants at Toansa and Mohali in Punjab, received ISO 14001 certification in 2007.
During the year, we discontinued operations at Mohali 1, Punjab and Jejuri, Maharashtra, with orderly redeployment/separation packages for the employees.
Our Global Supply Chain supported growth by ensuring the on-time delivery of products to meet varied customer requirements. Many new products were launched across the world. APO (Advance Planner and Optimiser) was implemented in many countries and across select manufacturing locations. Various other initiatives such as harmonisation of product packs, enhanced focus on inventories, projects to reduce overall logistic costs, were also carried out during the year.
Global Material Sourcing enhanced its focus on e-Sourcing, sourcing from low cost countries, introduction of new sources for key intermediates and APIs - all of which have helped us in optimising costs, and minimising risk, on a consistent basis. This was despite extremely high prices prevailing for PenG.
In Research & Development, the Company made significant progress in its developmental programmes. We filed 28 ANDAs in the US, and received 18 approvals. The cumulative ANDA filings stood at 239 with 141 approvals as on December 31, 2007. From the ANDAs pending approval,
we believe that we have a potential First-to-File opportunity on 18 products, valued at an innovator market size of around US $ 27 Bn.
In the European Union, the Company received 50 National approvals in 8 EU Reference Member States and 4 Mutual Recognition Procedure (MRP) approvals in 21 EU Concerned Member States. The Company also received 3 approvals under de-centralised procedure in 24 EU Concerned Member States in a record time of 10-14 months, thereby reflecting the quality of submissions.
On a global basis, the Company made 526 product filings, comprising various drug formulations across multiple therapies, and received approval for 457.
1110
The Company continued with its effort to develop safe and effective herbal drugs that comply with international quality standards. During 2007, the Company launched two herbal products viz. Chericof Herbal and Chyawan Active, in the Indian market and three other products in the international market.
The power of technology was harnessed to further improve productivity, automate functions and enable business growth. The Information Technology efforts also focused on accelerating product speed to market, while improving compliance.
Over half of the ANDA submissions to the US FDA in 2007 were electronic, utilising the industry approved eCTD format. It is a significant achievement as FDA has stated, that electronically submitted ANDAs will get priority treatment. Additionally, the upgradation of our global pharmacovigilance platform is facil itating the streamlining and automation of the function, while at the same time, helping to ensure continued product safety compliance with the most current FDA and EMEA regulations. Ranbaxy is one of the first 8 companies worldwide to implement E2B gateway for electronic submission of Adverse Events to FDA. Ranbaxy was a recipient of the SAP “Ace” Award for the “Best Pharmaceutical” implementation of SAP in India and was recognised as one of the 12 companies globally to receive a SAP Customer Competency Center of the Quarter award.
On the Human Resources front, a Global Employee Engagement Survey was undertaken. A significant amount of organisational energy has been devoted to ensure that the talent within is optimally engaged and developed. Hence there has been emphasis on continuous learning and development and on-going recognition and appreciation has been well imbibed across geographies and functions.
In summary, we have consolidated well in 2007 with a strong performance on all key financial and operating parameters. Looking ahead at 2008, we expect to build further on the momentum in our business while retaining an emphasis on margins and cash. We are also working on strategic initiatives related with our geographic and therapeutic mix. These coupled with our consistent focus on improving operational performance, should see the organisation build steadily towards a leadership position in the global generics industry.
Atul SobtiChief Operating Officer
March 29, 2008
Ranbaxy Laboratories Limited Annual Report 2007 COO’s Message
141141
The cumulative ANDA filings stood at 239 with 141 approvals as on December 31, 2007
Our Global Supply Chain supported growth by ensuring on-time delivery of products to meet varied customer requirements

KEY MARKETS REVIEW
In the year 2007, all key markets recorded strong performances, with North America recording sales of US $ 419 Mn, Asia garnering US $ 425 Mn and Europe (including CIS) achieving sales of US $ 455 Mn. Rest of the World contributed US $ 215 Mn to the overall formulations business which was at US $ 1514 Mn.
North America
The North American business, covering USA and Canada, constituted around 26% of Ranbaxy's global revenues. The Company further consolidated and enhanced its position in this highly competitive and dynamic market, primarily due to a greater number of product offerings being commercialised, enhanced customer satisfaction, stronger partnerships and aggressive filings with the US FDA. The Company's sales in this region grew by approx. 7% to US $ 419 Mn in 2007 with US contributing US $ 390 Mn and Canada o p e r a t i o n s d e l i v e r i n gUS $ 29 Mn. Human capital remained the core business strength of Ranbaxy's North America operations. In 2007, the human resources in the r e g i o n e x c e e d e d 6 0 0 employees. Investing in people and facilities has been a focus and the Company's emphasis in its corporate value will continue in North America to further expand its business.
USA
In the US, the core business u n d e r t h e R a n b a x y P h a r m a c e u t i c a l s I n c . (RPI), celebrated its 10th anniversary since gaining the first Abbreviated New Drug Application (ANDA) approval in 1997. RPI's product port fo l io now includes 54 molecules in diversified formulations, mapping individualised customer needs. Year 2007 marked the launch of 11 new
FDA approved formulations, to further strengthen Ranbaxy's product portfolio in the generic, branded and Over-the-Counter (OTC) segment.
Amidst more competition and pricing pressures, generic products continued to gain traction in the US. Factors like ageing demographics, the drive to reduce escalating government healthcare costs, attractive margins and broader acceptance of generic drugs, facilitated the expansion of the generics market. In all, around 63% of all prescriptions written
Ranbaxy Laboratories Limited Annual Report 2007 Key Markets Review
Ranbaxy announced three major litigation settlements with innovator companies on Para IV FTF products. These products will be launched in 2008 (Sumatriptan), 2009 (Valacyclovir) and 2010 (Tamsulosin), on an exclusive basis
It was the second year in a row that Ranbaxy had the highest number of brands featuring amongst the Top 30 leading launches in the Indian pharmaceutical industry
BUSINESS BEYOND BOUNDARIES...
1312
short span of time, having attained the 9th rank in the generics market, in terms of sales. The total sales during 2007 more than doubled to US $ 29 Mn, exceeding the growth rate of the Canadian generic market. The key products that contributed to RPCI's growth were
Cefprozil, Pravastatin, and Lisinopril and all of them achieved noteworthy market shares for their respective molecules. RPCI received approval for 6 ANDAs from Health Canada in 2007, adding further depth to its product portfolio which now comprises 14 products.
European Union
T h e y e a r 2 0 0 7 w a s a t rans format iona l year for Ranbaxy's European business as the region recorded robust sales growth of 24% at US $ 365 Mn. The key markets of Western Europe comprising UK, Germany and France delivered a robust performance, accounting for 47% of the total EU sales. The Company revitalised its EU business by further strengthening the product portfolio, stepping up Day-1 launches, intensifying its focus on the tendering business and restructuring sales and marketing operations in some countries. This has set the momentum and will certainly lead to an improved performance in the coming years.
UK
Ranbaxy UK accomplished a strong turnaround during the year and is confidently poised for 2008. The total sales registered an impressive growth of 36% at US $ 47 Mn which was significantly higher than the overall UK generic market growth of less than 10%. Ranbaxy launched 8 new products during the year and achieved a noteworthy market share for some of its existing and new key products such as Gabapentin 600 mg, Risperidone Plain and OD, Simvastatin 40 mg, and Ferrous Sulphate. The branded business led by the Easyhaler range of dry powder inhalers, registered an increase in sales by 27% with the Easyhaler range doubling its turnover. Formoterol Easyhaler was launched in 2007.
Germany
This market clocked sales of US $ 49 Mn with a growth of 69 % over the previous year's sales of US $ 29 Mn. The German healthcare system during the year witnessed dynamic changes that resulted in regulatory amendments and price erosion. Pre-empting this scenario, the Company had earlier restructured its sales and marketing operations that allowed us to mitigate any negative impact. Ranbaxy won 11 products in the
in the US, used generic formulations and these drugs constituted nearly 70% of our total sales in the US.
A key milestone for RPI was the commercialisation of
Pravastatin 80 mg tablets that represented a First-to-File (FTF) approval, entailing 180 days of sales exclusivity.
In the branded segment, Ranbaxy Laboratories' Inc.
flagship product Sotret (Isotretinoin capsules), achieved impressive growth, becoming a market leader in October 2007, with a market share that exceeded 50%. The segment experienced strong growth with an increase of 14% in total prescriptions written during 2007. In line with our commitment to Dermatology, Ranbaxy emerged as a major player with an impressive product range. During the year, the Company acquired a total of 13 established Dermatology brands from Bristol Myers Squibb. These brands were re-launched under the Ranbaxy label with a renewed and expanded marketing effort.
The sales and marketing team of Ohm Laboratories Inc. (Ohm) made focused efforts to boost the sales in the OTC private label segment. Further inroads were made into the OTC market with the launch of two Anti-histamine
products, Loratadine orally disintegrating tablets and
Cetirizine tablets. Ohm also provided crucial manufacturing support, played a pivotal role in new launches and added further strength to our solid and liquid dosage form capabilities.
As on December 2007, Ranbaxy made cumulative filings of 239 ANDAs with a total of 141 approvals. The Company made 28 ANDA filings during the year and received 18 approvals from the US FDA.
Ranbaxy announced three major litigation settlements with innovator companies on Para IV FTF products. These products have a combined market size of over US $ 3.5 Bn (at innovator prices) and will be launched in 2008
(Sumatriptan) , 2009 (Valacyclovir) and 2010
(Tamsulosin), on an exclusive basis. We believe that the Company has one of the largest product pipeline in the US that includes 18 potential FTF opportunities commanding a market size of around US $ 27 Bn, at innovator prices.
In a business arrangement with Zenotech Laboratories Ltd., 7 ANDAs for injectibles were filed and 2 filings were made through a business a g r e e m e n t w i t h I P C A Pharmaceuticals Inc. The year also marked the entry into the authorised generic space with the commercialisation of
Isoptin SR in an agreement with FSC Laboratories.
Canada
Since its inception in 2005, Ranbaxy Pharmaceuticals Canada Inc. (RPCI) has played a vital role in providing Canadian patients with affordable generic alternatives. The Company has achieved vibrant growth in a
Para IV First-to-File Products in the US
Sumatriptan
2008
Valacyclovir2009Tamsulosin
2010
I YN RTD SIA P UNH D A IM AR LEUTC IA C
2006
2007
Peter Burema, President,Global Pharmaceutical Business
Nick Haggar,Regional Director, Europe
K Venkatachalam,Vice President & Regional Director,North America
In the US, Ranbaxy's product portfolio now includes 54 molecules in diversified formulations, mapping
individualised customer needs. Year 2007 marked the launch of
11 new FDA approved formulations, to further
strengthen Ranbaxy's product portfolio in the generic, branded
and OTC segment.

AOK (Germany's largest general local health insurance) tender during the year and launched six new products Alendorate, Lamotrigin, Lansoprazol, Tamsulosin, Tranadol MR and Risperisone (Day-1 launch).
France
Ranbaxy's performance in France reflected a marked improvement over the previous year and registered sales of US $ 74 Mn, a growth of 7%. The Company introduced a total of 20 products and closed the year on a positive note with 6 Day-1 launches. A realigned management structure, a diverse product basket and manufacturing switch to India, helped the business operations in France to record a superior performance.
Romania
Sales in Romania touched a new high at US $ 121 Mn, achieving a growth of 22%. Terapia Ranbaxy attained the No. 1 slot amongst the generic companies with a market share of 11.2% and was ranked No. 6 among all the pharma companies. During 2007, the Company received manufacturing and import authorisation as per EU norms and standards, thereby getting the go ahead for batch testing and release activities for products manufactured outside the EU. Subsequently, the Bucharest based production facility received a renewal of Certification for Good Manufacturing Practice (GMP) standards of all manufacturing flows. Maintaining a steady product flow, Terapia Ranbaxy was granted 47 new market authorisations and launched 13 new products during the year. The Company has the largest sales force in Romania and serves over 5000 retail pharmacies and 400 hospitals. The headquarters of Terapia Ranbaxy was relocated to a new location, situated in Pipera area, Bucharest.
Dermatology, Cosmetology, Orthopedics and Gastro-intestinal segments. Leviosa 299 v (Probiotic), Fleet Phosphosoda (Phosphosoda) and Eligard (Depot Leuprolide) were some of the new/differentiated products launched during the period.
One of the Company's leading brands, Volix (Voglibose) received the award for 'Marketing Excellence' in the 'New Pharmaceutical Products' category from the Organisation of Pharmaceutical Producers in India (OPPI).
India is today grappling with the emergence of endemic diseases like AIDS. Committed to develop innovative Anti-retroviral (ARV) medicines at affordable cost, Ranbaxy launched Coviro-LS kid and Coviro-LS kid DS, both double ARV and fixed dose combination dispersible tablets for children.
Asia Pacific (excluding India)
The Asia Pacific region witnessed a robust 24% growth in sales at US $ 88 Mn. The performance in the region was led by China, Thailand and Malaysia. In China, the focus was to expand market coverage by identifying new markets and enabling deeper penetration of the products manufactured by Ranbaxy Guangzhou China Limited. Sales in China saw an upward trend growing by 33% to US $ 17 Mn with strong performances from leading brands such as Cifran (Ciprofloxacin), Keflor (Cefaclor) and Simcor which emerged as the No. 1 generic Simvastatin. Sales of Ranbaxy Malaysia grew by 12% at US $ 24 Mn. It was primarily driven by government supplies for Oseltamivir Capsules (Fluhalt), eight new product launches and four first to launch products. In Thailand, sales grew by 48% at US $ 14 Mn.
Middle East and Sri Lanka
Ranbaxy's operations in Middle East and Sri Lanka recorded sales of US $ 23 Mn, outperforming the market. The Company expanded its operations in the Middle East by making an entry into Yemen. In Oman, a major in-licensing agreement was signed with a local manufacturing company and five agreements were made that will ensure an incremental revenue stream. Ranbaxy further consolidated its position as the top generic company in the UAE. During 2007, 19 new products were launched including Storvas in Oman, which has in a short span of time become a leading statin brand. Lovir emerged as the No. 1 Antiviral drug in the UAE.
Russia & Ukraine belt
Russia and Ukraine belt, achieved sales of US $ 90 Mn, reflecting a growth of 22%. Ranbaxy Russia closed the year with sales of US $ 52 Mn as against US $ 44 Mn in 2006. The Company moved up by two ranks to occupy the 11th position in the Russian generic market (IMS MAT Q3'07) that registered a growth of 19% at US $ 5.4 Bn (Pharmexpert MAT Q3'07). The performance was led by ethical and OTC segments with products like Ketanov (Ketorolac), Faringosept (Ambazone) and Coldact Flu Plus (Paracetamol+Phenylephrine+Chlorphenamine), playing a vital role. Sales of Ranbaxy Ukraine belt grew by 28% at US $ 38 Mn. The Company achieved market
Rest of Europe
Ranbaxy's sales in the Rest of Europe region was up at US $ 74 Mn, reflecting a buoyant 20% growth. Contributing to the growth were the notable performances from Portugal, Italy and Spain that jointly contributed US $ 22 Mn to the total sales. Ranbaxy successfully launched 10 new molecules in the Italian market including the Day-1 launch of Simvastatin, Loratadine and Finasteride. The Company's wide product portfolio that now comprises 32 molecules, including 20 products acquired from Allen, is one of its key strengths in Italy.
India
The vigorous momentum in the Indian business led to a significant upside, with sales touching US $ 301 Mn. The overall business grew by 22% despite a slow down in the domestic market. Demonstra t ing s t rong market ing and sel l ing capabil i t ies, Ranbaxy's branded product portfolio registered a fast paced growth at 32% with 18 brands in the Top 300 list and 9 brands in the Top 100 list. It was the second year in a row that Ranbaxy had the highest number ofbrands featuring amongst the Top 30 leading launches in the industry.
Both the chronic franchise and acute ailments segment showed impressive growth with contribution of chronic therapy to total sales rising to 24% against 21% in 2006. Novel Drug Delivery Systems (NDDS) and in-licensing opportunities emerged as the key to sustainable competitiveness and profitability. The NDDS segment contributed 9% of the total sales. Ranbaxy launched 13 new NDDS formulations in 2007 and further consolidated its position among the top companies in this segment with a 7% market share (November, 2007 MAT). The Urology segment was further augmented with the launch of three NDDS products, Niftran (extended release Nitrofurantoin), Roliflo OD (Tolterodine and Tamsulosin) and Eligard (Depot Leuprolide).
Ranbaxy had many 'Firsts' to its credit. The Company launched Osovair (Formoterol and Ciclesonide) dry powder inhaler, a unique combination drug meant for the treatment of Asthma; Osonase (Ciclesonide), an Anti-allergic aqueous nasal spray and Caldrink (Calcium Pidolate and Vitamin D3) for the calcium supplementation therapy. The Anti-infective segment witnessed the launch of two advanced generation antibiotics, Tevran (Tigecycline) and Zivator (Ertapenem).
The Company entered into nine in-licencing agreements, encompassing various therapeutic areas and filled therapy gaps in Oncology,
Ranbaxy Laboratories Limited Annual Report 2007 Key Markets Review
14
The year 2007 was a transformational year for Ranbaxy's European business as the region recorded robust sales growth of 24% at US $ 365 Mn
S
t
a
hw
el
ros
G
24%
Terapia Ranbaxy attained the No. 1 slot amongst the generic companies with a market share of 11.2% in Romania
1MARKET SHARE 11.2%
B e - T a b s w a s s u c c e s s f u l l y i n t e g r a t e d , strengthening Ranbaxy's basket of products in Africa
Be- aT bs
Sanjeev I Dani,Sr. Vice President &Regional Director, Asia & CIS
leadership for its top selling brands - Loxof (Levofloxacin), Ketanov (Ketorolac) & Cifran (Ciprofloxacin).
Japan
Ranbaxy's joint venture in Japan, Nihon Pharmaceuticals Industry Co. Ltd. (with Nippon Chemiphar) further consolidated its presence in the market, achieving sales of US $ 25 Mn. Though the world's second largest pharma market, Japan still has a predominantly low generics penetration. However in view of the rapidly ageing population and spiraling healthcare costs, the government is now taking active steps to promote the use of generic drugs. Japan's generics market is expected to reach 30% in volumes in the next five years. This augurs well and supports Ranbaxy's business expansion plans as the Company already has a strong foothold in the market.
Africa
The African continent recorded vibrant sales growth of 42% atUS $ 126 Mn. All key countries in Africa grew strongly, led by South Africa, Central and South East Africa and the French West Region. The South African business achieved sales of US $ 53 Mn. Be-Tabs was s u c c e s s f u l l y i n t e g r a t e d , strengthening Ranbaxy's basket of products, especially in the acute and OTC product streams. It marked a sales contribution US $ 25 Mn to the total revenues.
Ranjan Chakravarti,Vice President &Regional Director,Africa & Latin America
15

Anti-infectives
The global Anti-infectives market is estimated to grow at a
Compound Average Growth Rate (CAGR) of 4.8% (2005-
2011), and Ranbaxy is well positioned to leverage and
monetise this opportunity. The Anti-infectives segment
sustained its dynamic momentum and remained the
largest therapeutic segment for the Company during
2007, generating 42% of global dosage form sales.
Co-amoxyclav was the top-selling product with sales of
over US $ 89 Mn. Adding depth to the Company's product
line of Anti-infectives in the US was Clarithromycin Oral
Suspension. Being the first to receive approval for this
product, Ranbaxy is one of the few companies that now
offers the complete range of this molecule in the
US market. The Company has
further expanded its generic
product portfolio in Canada
after receiving approval for
tablets and powder for oral
suspension of Cefprozil.
During the year, Ranbaxy also
entered into a settlement
with GlaxoSmithKline (GSK) in
the US for Valacyclovir
Hydrochlor ide tab le ts ,
paving the way for the launch
of the product in the US
market in 2009 with a 180
days marketing exclusivity .
In India, Ranbaxy continued to
enjoy its dominant position in
the Penems' portfolio and
captured a market share of
Musculoskeletal
This therapeutic segment posted a robust growth of
26%. Rheumatology & Musculoskeletal drugs grossed
about US $ 111 Mn with Diclofenac and its combination
being the primary contributor. The Company received
approval for the combination of Hydrocodone and
Acetaminophen in the US. In the Indian market, topical
Volitra performed well featuring amongst the Top 30
brands of the year.
Central Nervous System (CNS)
The CNS segment recorded a healthy growth of 23%,
contributing US $ 104 Mn to the total sales. Gabapentin
and Sertraline were the key products in this segment. The
Company launched Risperidone on Day-1 in major
markets of Europe. Sertraline and Zolpidem were also
launched in the US. Tentative approval was received from
the US FDA to manufacture and market Galantamine
tablets for which a 180 days
shared exclusivity period is
anticipated.
Respiratory
Ranbaxy's growing presence in
the Respiratory segment
received a boost, registering a
double-digit growth of 10%. The
Company once again achieved
the distinction of being the first
in the world to commercialise
the ICS/LABA combination,
Osovair (Formoterol and
C i c l e s o n i d e ) i n h a l a t i o n
around 30%. During the year Gembax (Gemifloxacin)
featured in the Top 30 new product launches in the
Indian market while Zivator (Ertapenem), a new
addition to the Penems segment, further
strengthened the Company's market leadership
position in this area. Cilanem (Imipenem + Cilastatin),
first launched in India in 2003, has now been filed in
international markets such as Europe, Canada,
South Africa, Thailand and Russia.
Cardiovasculars
Cardiovasculars continued to be a leading
therapeutic segment during the year. Simvastatin
was the second best-selling product for Ranbaxy in
this segment, with sales of about
US $ 86 Mn. The Company
launched Pravastatin 80 mg in
the US, generating over 30% of
the prescription market share
during the 180 days marketing
exclusivity period. Ranbaxy
a l s o a c q u i r e d t h e N e w
Drug Application (NDA) of
Isoptin SR (Verapamil SR) and
commercialised it in the US.
F u r t h e r , a p p r o v a l s w e r e
received for Pravastatin and
Lisinopril tablets in Canada.
The Company also launched
the first generic version of
Atorvastatin in Europe, in
Denmark.
capsules. In this segment, Ranbaxy's product portfolio was
further strengthened with the launch of Osonase
(Ciclesonide) nasal spray. The branded division in UK
received a strong push with the introduction of Easyhaler
Formoterol. The approval of Cetrizine Hydrochloride
underscored Ranbaxy's OTC presence in the US. The
Company also received tentative approval from the US FDA
to manufacture and market Fexofenadine Hydrochloride
Tablets.
Dermatologicals
The Dermatological franchise received a major thrust this
year with the acquisition of 13 Dermatology brands from
Bristol Myers Squibb, USA. This aided Ranbaxy in
capitalising on the existing strong franchise of Isotretinoin.
The Company's flagship brand in this segment, Sotret
attained market leadership position by garnering more
than 50% market share, with the 30 mg dosage strength
capturing 68% share in the US.
Other Milestones
Ranbaxy signed an exclusive in-
licensing agreement with Sirtex
Medical, Australia, to promote and
market SIR-Spheres in India. The
biocompatible radio-active micro-
spheres, employs Select ive
Internal Radiation Therapy for
treatment of liver cancer and will
strengthen Ranbaxy's foothold in
the Oncology segment.
Ranbaxy Laboratories Limited Annual Report 2007 Therapy Focus
1716
Co-amoxyclav was the top-selling product with sales of over US $ 89 Mn
The Dermatological franchise received a major thrust in 2007 with the acquisition of 13 Dermatology brands from Bristol Myers Squibb, USA
Simvastatin was the second best-selling product for
Ranbaxy in the Cardiovascular segment, with sales of about
US $ 86 Mn. Ranbaxy launched Pravastatin 80 mg in the US generating over 30% of the prescription market share
during the 180 day marketing exclusivity period.
9
US 8 M$
n
am aCo- oxycl v
Bristol Myers Squibb
USA
13 Dermatology Brands
EXTENDING THE
HEALINGTOUCH
THERAPY FOCUS

Pharmaceutical Research (Immediate Release and Value added Drug Delivery Systems)
During the year, Ranbaxy made a record submission of 29 Abbreviated New Drug Applications (ANDAs) with the US FDA, including 4 Oral Controlled Release products and one President's Emergency Plan for Aids Relief (PEPFAR)-ANDA. For the first time, Ranbaxy filed 9 ANDAs in a newly identified specialised area of general injectables (7 of these injectables through Zenotech). These ANDAs also included 3 potential Para-IV First-to-File (FTF) Products. Filings in Canada were significantly ramped up from 1 in 2006 to 9 in 2007.
In the European Union (EU), the Company made filings for 10 products, resulting in 49 National Filings in 12 EU Reference Member States and 4 filings under De-Centralised Procedure in 25 EU Concerned Member States. In addition, 13 products were filed under Mutual Recognition Procedure in 26 EU Concerned Member States.
In line with the increasing focus on Japan, the Company filed 2 products. In the emerging markets covering Brazil, Russia, India, China & South Africa, a total of 98 filings were made, including 9 in Brazil, 35 in Russia (including CIS Countries), 30 in India, 3 in China and 21 in South Africa. 6 products were filed in Australia and New Zealand.
Ranbaxy launched 58 products in India, including 7 Oral Controlled Release Products (OCRS).
Novel Drug Delivery Systems (NDDS)
Ranbaxy filed 4 OCRS with the US FDA and introduced 7 OCRS in India (Budesonide ER, Didanosine SR, Gabapentin SR, Metoprolol XR, Nitrofurantoin ER, Rabeprazole + Itopride OD, Tamsulosin SR + Tolterodine SR caps).
Going forward, the Company intends to bring in greater value addition to its generics portfolio through enhanced emphas is on Complex 'difficult-to-make' products including OCRS, Para IV FTFs and specialised segments s u c h a s B i o s i m i l a r s , Oncology/ Cytotoxics Oral Contraceptives, Respiratory and Dermatology.
D u r i n g t h e y e a r , t h e Company filed 49 patents
including 15 patents in the OCRS segment in India, through Pharmaceutical Research alone.
Chemical and Fermentation Research (Active Pharmaceutical Ingredients)
During the year, scale-up and technology transfer was completed for 14 new Active Pharmaceutical Ingredients (APIs). The emphasis has been on developing novel (patentable), safe and environment friendly processes for the production of APIs meeting International quality specifications. The Company also filed 330 Drug Master Files comprising 54 APIs and a key drug intermediate across various countries, and 37 patents in India.
Herbal Drug Research
The Herbal Drug Research division of Ranbaxy successfully launched two products viz. Chericof Herbal and Chyawan Active (sugar free based traditional Chyawanprash) in the Indian market and three products in the international market viz. Olesan Cough syrup for adults and Olesan Cough syrup for kids in Malaysia and Leav (a natural sweetener) in UAE.
Ranbaxy continued with the biological activity guided fractionation of medicinal plants through an alliance with Anna University, India. As a result, it has identified two single-plant extracts for Diabetes and Inflammation and has isolated and characterised biologically active compounds. Although none of these compounds is a candidate for further lead optimisation, but they will be used as chemical markers for standardisation of the extracts as well as pharmacodynamic studies. These two extracts show pronounced activities in relevant in-vitro, ex-vivo and in-vivo assays for Diabetes and Inflammation
and are currently being profiled for pharmacology and safety. Plans are
underway to initiate clinical studies on these extracts.
Ranbaxy has been selected as a Member of the IPC USP D i e t a r y S u p p l e m e n t s -Botanicals Advisory Panel for the development of monographs on Ind ian medicinal plants.
The Company's Herbal Drug Research team has filed 11 patents in 2007.
Ranbaxy Laboratories Limited Annual Report 2007 Research & Development
RESEARCH & DEVELOPMENT
DESTINATION
DISCOVERY…
1918
Countries Jan-Dec 2007 Approvals Filings*
USA 18 29**European Union 57 66– National 50@ 49***- Mutual Recognition Procedure 4@@ 13****- De-centralized Procedure 3@@@ 4*****BRICS Total 75 98- Brazil 11 9- Russia (including CIS) 22 35- India 27 30- China - 03- South Africa 15 21Rest of the World (ROW) 307 333- Australia & New Zealand 9 6- Canada 6 9- Japan 1 3- Others 291 315
Total 457 526
Global Regulatory Filings & Approvals (Dosage Forms)
@ Approvals for 13 products in 8 RMS@@ Approvals for 4 products in 21 CMS@@@ Approvals for 3 products in 24 CMS* Incl fresh / new filings only; incl OTC & ARV products; incl filings for
2 Out-sourced products** Incl. 1 ANDA filing under PEPFAR*** Filings for 10 products in 12 RMS**** Filings for 13 products in 26 CMS***** Filings for 4 products in 25 CMS
Filings* Accepted / Granted / Patents**
Area India USA Total India USA TotalAPIs 37 - 37 01 01 02Dosage Forms 34 - 34 02 - 02NDDS 15 - 15 - - -Herbal 11 - 11 - - -NDDR 23 - 23 - 03 03Packaging 02 - 02 - - -
Total 122 - 122 03 04 07
* These are first time (fresh) filings; not international or national filings of earlier applications filed in India
** These are unique patents - meaning any equivalent patents granted in other countries or published under PCT have not been counted.
Patent Applications Filings and Approvals (Jan-Dec 2007)
Markets Approvals Filings*
USA 06 13@Europe 32# 245##Brazil 03 02Russia (incl Ukraine) 01 09China - -South Africa 01 13ROW 09 48
Total 52 330
Global DMF Filings and Approvals APIs (Jan-Dec 2007)*
* Doesn't include re-registrations & outsourced APIs @ Includes DMF on 1 Intermediate# Include approval for 3 APIs under MRP ## Include Filings for 5 APIs under MRP
DMF: Drug Master FileMRP: Mutual Recognition Procedure
Dr Pradip Kumar Bhatnagar,Sr Vice President, New Drug Discovery Research
Dr Himadri Sen,President, R&D (Generics & NDDS)
Dr Vijay Kumar Batra,Sr Vice President, Generics/NDDS/Drug Development
New Drug Discovery Research (NDDR)
Ranbaxy's commitment to New Chemical Entity (NCE) research, received a boost with the proposed de-merger of its NDDR unit into a separate entity, Ranbaxy Life Science Research Limited (subject to requisite approvals). The move will create an independent pathway for Drug Discovery Research (DDR), with dedicated resources. This fortifies the Company's will to emerge as a leading research based international pharmaceutical company. The new entity will have operational freedom and greater flexibility to carry out path breaking innovative research with more room to explore synergistic partnerships and alliances. Further, it will be able to leverage the existing state-of-the-art research infrastructure and the highly skilled scientific talent pool that Ranbaxy possesses. It will also result in cost savings for Ranbaxy.
Ranbaxy continued to progress on its Anti-malarial molecule. After successfully completing the Phase-I trials of Arterolane (RBx-11160) in combinat ion with Piperaquine, the Phase-II trials have been initiated in Thailand and India. The Company also filed an application with t h e r e s p e c t i v e r e g u l a t o r y agency of Tanzania and Kenya f o r i n i t i a t i n g t h e p e d i a t r i c efficacy/pharmacokinetics trials. RBx-11160 in combination with Piperaquine, is expected to be an effective Anti-malarial molecule that will reduce the onset of resistance and will be developed as a combination product. Being a synthetic compound, supply issues will not be a hindrance to meet the potential large demand.
Ranbaxy received a milestone payment from PPD Inc., USA, for the completion of the Phase-I clinical trials of its out-licensed novel statin molecule,RBx-10558.
The Company also completed exploratory toxicity studies and initiated Investigational New Drug (IND) enabling studies on three molecules, developed in-house, viz, a PDE-4 Inhibitor for Chronic Obstructive Pulmonary Disease (COPD) and Asthma, a Muscarinic Receptor Antagonist for COPD and a Ketolide for Community Acquired Respiratory Tract Infection. In the area of Oncology, screens for two new programmes are in place and screening of the Ranbaxy Compound Library is in progress. Several early hits have been identified and are currently being profiled.
Ranbaxy made significant progress on its two collaborative research programs with
GlaxoSmithKline in the Anti-infective and Respiratory segments. In this direction, selection of a clinical candidate in the
Respiratory segment was a major landmark that also resulted in milestone payment to Ranbaxy. The alliance was enhanced during the year, providing Ranbaxy with expanded drug deve lopment responsibilities and further financial opportunities. It now envisages potential work on a range of therapeut ic areas, inc luding Oncology and Inflammation areas.
During the year, the drug discovery team filed 23 patent applications in India.

GLOBAL HUMAN RESOURCES
At Ranbaxy, we believe in creating a culture of performance
and excellence to continually keep our workforce truly
engaged and committed. Today the Company has a strong
multi-cultural representation of over 12,000 people, from
more than 50 nationalities, across 49 countries, working
concurrently in different time zones. The combined efforts
of Ranbaxy's Global Human Resource team, plays a critical
role in the strategic and business growth of the Company.
Building on the foundation of robust systems and
processes, our goal is to build a shared vision and create an
energised organisation by enabling, enriching and
empowering our workforce.
The Ranbaxy Human Resources team plays a critical
role in this strategic endeavour, focusing on eliciting
synergies for effective performance through team
engagement initiatives.
Appreciation of talent, respect of human dignity and
celebration of success, is core to the Ranbaxy
Human Resource philosophy. We encourage our
people to think differently. This independence
given to our employees early in their
careers also sets the base for the
expression of individual abilities and
creates a culture of recognition and
appreciation.
The commitment for perseverance
and performance is a key value
instilled in our culture. The year 2007
saw the streamlining of our reward
phi losophy, wi th the senior
leadership moving to a 'Partners in
Performance' plan. Significant
emphasis has also been placed on
managing the career of our people, increasing their
ownership in the success of the Company.
In 2007, the Global Appreciate Program was inaugurated
with an aim to formalise the Company's approach to
recognising achievement and employee contributions in
all aspects of business. This program was rolled out
globally and now serves as a benchmark to
simultaneously communicate with and nurture our people
across the world. Going forward, we aim to make
appreciation a way of life at Ranbaxy.
In tandem, we have also made a paradigm shift in our
philosophy by moving from a mere training intervention
approach to a learning solution oriented organisation,
where efforts are directed towards acquiring strategic
future critical skills.
In order to focus on the need for better work-life balance
and facilitate the awareness of well-being, we are
inculcating a practice of felicitating moments
of joy. Several initiatives such as Fun@Work,
Jadoo ki Jhappi, get-togethers and
other events were organised to
encourage employee participation.
Great companies are built by the
efforts of resolute and passionate
individuals. Our aim is to leverage
our human assets and prepare our
dynamic talent pool to face the
challenges and emerge victorious
in their quest for success.
21Omesh Sethi,Vice President & Head, Global Finance
The year 2007 was another successful year, witnessing robust growth in sales, profits and an all round improvement in the key operating parameters.
Consolidated sales during the year stood at US $ 1,619 Mn (Rs 66,927 Mn), a growth of 21% in dollar terms. Consolidated Profit before Interest, Depreciation, Tax & Amortisation was at Rs 13,581 Mn, reflecting a growth of 45% over 2006. Profit before Tax stood at Rs 9,985 Mn which grew by 53% and Profit after Tax and Minority Interest registered a growth of 52% at Rs 7,745 Mn. Return on Capital employed increased from 13.2% in 2006 to 16.2% in 2007.
Ranbaxy's sales growth was a result of an all-round performance from key geographies comprising North America, Europe and the Asia Pacific region. US remained the largest market with a healthy growth in the base business (excluding First-to-File product sales). Europe recorded a strong performance led by the key markets of Romania, Germany and UK. Growth in the Asia Pacific region was led by India and CIS countries. The performance in the Rest of the World markets was driven by business operations in the African and Latin American continent.
T h e i m p r o v e d f i n a n c i a l performance was also a result of the Company's focused efforts on i m p r o v i n g p r o d u c t i v i t y a n d optimising cost structures across the entire value chain. These are the crucial factors that would enable further growth and strengthen the Company's competitive positioning and market standing in the fast changing and dynamic generics landscape.
The year witnessed stronger cash flows from the business vis-à-vis the prior years. This was led by the higher profits and improved working capital position. Better receivables and inventory management, reflected in gross working capital, reduced by more than 3% of total sales.
Ranbaxy's foreign exchange management strategy enabled the Company to mitigate the impact of significant appreciation in the Rupee vis-à-vis the US dollar. We continue to evaluate and undertake various measures to manage the impact of currency fluctuations as they relate to the business operations.
The momentum of Company's M&A initiatives continued in 2007. Besides concluding its acquisition of Be-Tabs in South Africa, which makes Ranbaxy the 5th largest generic pharmaceutical company in South Africa, the Company acquired 13 Dermatalogy products from Bristol Myers Squibb in the USA. This acquisition further strengthens and extends the franchise of Ranbaxy in the Dermatology arena. Further to consolidate the Company's position in Biologics and specialty injectables, Ranbaxy increased its stake in Zenotech Laboratories Limited from 7% to around 47% currently. The Company also acquired a strategic stake of 14.9% in Jupiter Biosciences Limited,which would provide access to the fast growing
and niche therapeutic segment of Peptides.
Ranbaxy will continue to make efforts to strengthen its systems and processes across all key functions, so as to enhance the control and risk management environment across the organisation.
T o s u m m a r i s e , w e b e l i e v e that Ranbaxy is in a stronger position with a well spread market presence and good product portfolio. Going forward, the Company's planned investments and judicious resource allocation will help in achieving robust growth.
FINANCIAL REVIEW
PBIDTA -Profit before Interest, Depreciation, Tax and AmortisationPAT - Profit after TaxROCE - Return on Capital EmployedRONW - Return on Net Worth
BANKING UPON VISIONA NEW
20
11.88.5
PAT to Sales (%)
20072006
20.3
15.5
PBIDTA to Sales (%)
20072006
Bhagwat Yagnik,Vice President & Head, Global Human Resources
CREATING ANENABLINGCULTURE
Key Parameters Consolidated

TAKING SMILES ACROSS MORE MILES
Ramesh L Adige,Executive Director, Corporate Affairs &Global Corporate Communications
Corporate Social Responsibility (CSR)
We at Ranbaxy firmly believe that Corporate Social Responsibility is the key towards enhancing the deep symbiotic relationship that exists between us and the communities we constantly engage with.
Ranbaxy Community Health Care Society (RCHS), the Company's apex CSR vehicle, provides free integrated healthcare at the doorstep of about 175000 people in 83 villages, largely identified as 'unserved'.
Ranbaxy today offers a range of curative, preventive and health promotive services, ably supported by laboratory facilities covering areas of maternal child health, family planning, adolescent health, reproductive health and health education including AIDS awareness. The services are delivered through six well-equipped mobile healthcare vans operating in the Indian states of Punjab, Haryana, Himachal P r a d e s h a n d M a d h y a Pradesh.
During the year, community health was monitored through regular mobile field clinics and home visits. The twilight (old) areas witnessed a further reduction in the Birth Rate (BR) and Infant Mortality Rates (IMR) and no maternal death was reported. In the intensive (new) areas too, IMR showed a further decline and the Maternal Mortality Rate (MMR) came down to nil, although there was not much change in the Birth Rate.
Environment, Health & Safety (EHS)
In line with the Company's value statement, 'Managing our operations with a high concern for safety and environment' and to 'Be a responsible corporate citizen,' EHS has been extensively promoted at Ranbaxy with the prime objective of protecting the environment and all internal and external stakeholders including the communities in and around our operating sites.
Environment
The Company's manufacturing sites continued to remain fully compliant with regards to the applicable
Environmental Regulations. The equipments and infrastructure for environmental management
were kept operational and met regulatory standards.
O c c u p a t i o n a l H e a l t h a n d Safety
Ranbaxy strongly believes that all workplace illnesses and injuries are preventable and walks the extra mile to ensure that its work centers are safe and protected at all times. Some of the initiatives include round-the-clock safety surveillance and workplace m o n i t o r i n g a t k e y manufacturing sites. External safety audits by the National Safety Council were also successfully conducted at Dewas and Mohali.
CORPORATE SOCIAL RESPONSIBILITY ANDENVIRONMENT, HEALTH & SAFETY
22
RCHS, the company's apex CSR vehicle, provides integrated healthcare at the doorsteps of about 1,75,000 people in 83 villages
The Company's manufacturing sites continued to remain fully compliant with regards to the applicable Environmental Regulations
RCHS
RY
ANX
BAoir nv mne e nt
g f orni t h r ea
C
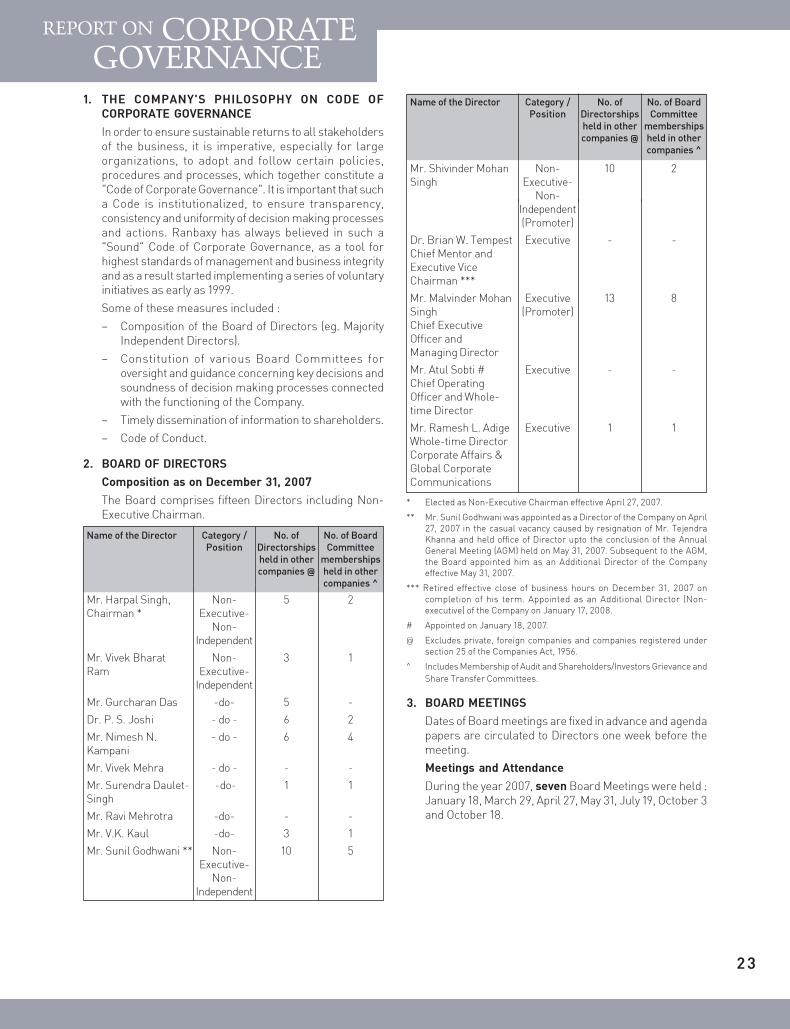
23
CORPORATEREPORT ON
GOVERNANCE
Name of the Director Category / No. of No. of BoardPosition Directorships Committee
held in other membershipscompanies @ held in other
companies ^
Mr. Shivinder Mohan Non- 10 2Singh Executive-
Non-Independent(Promoter)
Dr. Brian W. Tempest Executive - -Chief Mentor andExecutive ViceChairman ***
Mr. Malvinder Mohan Executive 13 8Singh (Promoter)Chief ExecutiveOfficer andManaging Director
Mr. Atul Sobti # Executive - -Chief OperatingOfficer and Whole-time Director
Mr. Ramesh L. Adige Executive 1 1Whole-time DirectorCorporate Affairs &Global CorporateCommunications
* Elected as Non-Executive Chairman effective April 27, 2007.
** Mr. Sunil Godhwani was appointed as a Director of the Company on April27, 2007 in the casual vacancy caused by resignation of Mr. TejendraKhanna and held office of Director upto the conclusion of the AnnualGeneral Meeting (AGM) held on May 31, 2007. Subsequent to the AGM,the Board appointed him as an Additional Director of the Companyeffective May 31, 2007.
*** Retired effective close of business hours on December 31, 2007 oncompletion of his term. Appointed as an Additional Director (Non-executive) of the Company on January 17, 2008.
# Appointed on January 18, 2007.
@ Excludes private, foreign companies and companies registered undersection 25 of the Companies Act, 1956.
^ Includes Membership of Audit and Shareholders/Investors Grievance and
Share Transfer Committees.
3. BOARD MEETINGS
Dates of Board meetings are fixed in advance and agendapapers are circulated to Directors one week before themeeting.
Meetings and Attendance
During the year 2007, seven Board Meetings were held :January 18, March 29, April 27, May 31, July 19, October 3and October 18.
1. THE COMPANY'S PHILOSOPHY ON CODE OFCORPORATE GOVERNANCE
In order to ensure sustainable returns to all stakeholdersof the business, it is imperative, especially for largeorganizations, to adopt and follow certain policies,procedures and processes, which together constitute a"Code of Corporate Governance". It is important that sucha Code is institutionalized, to ensure transparency,consistency and uniformity of decision making processesand actions. Ranbaxy has always believed in such a"Sound" Code of Corporate Governance, as a tool forhighest standards of management and business integrityand as a result started implementing a series of voluntaryinitiatives as early as 1999.
Some of these measures included :
– Composition of the Board of Directors (eg. MajorityIndependent Directors).
– Constitution of various Board Committees foroversight and guidance concerning key decisions andsoundness of decision making processes connectedwith the functioning of the Company.
– Timely dissemination of information to shareholders.
– Code of Conduct.
2. BOARD OF DIRECTORS
Composition as on December 31, 2007
The Board comprises fifteen Directors including Non-Executive Chairman.
Name of the Director Category / No. of No. of BoardPosition Directorships Committee
held in other membershipscompanies @ held in other
companies ^
Mr. Harpal Singh, Non- 5 2Chairman * Executive-
Non-Independent
Mr. Vivek Bharat Non- 3 1Ram Executive-
Independent
Mr. Gurcharan Das -do- 5 -
Dr. P. S. Joshi - do - 6 2
Mr. Nimesh N. - do - 6 4Kampani
Mr. Vivek Mehra - do - - -
Mr. Surendra Daulet- -do- 1 1Singh
Mr. Ravi Mehrotra -do- - -
Mr. V.K. Kaul -do- 3 1
Mr. Sunil Godhwani ** Non- 10 5Executive-
Non-Independent
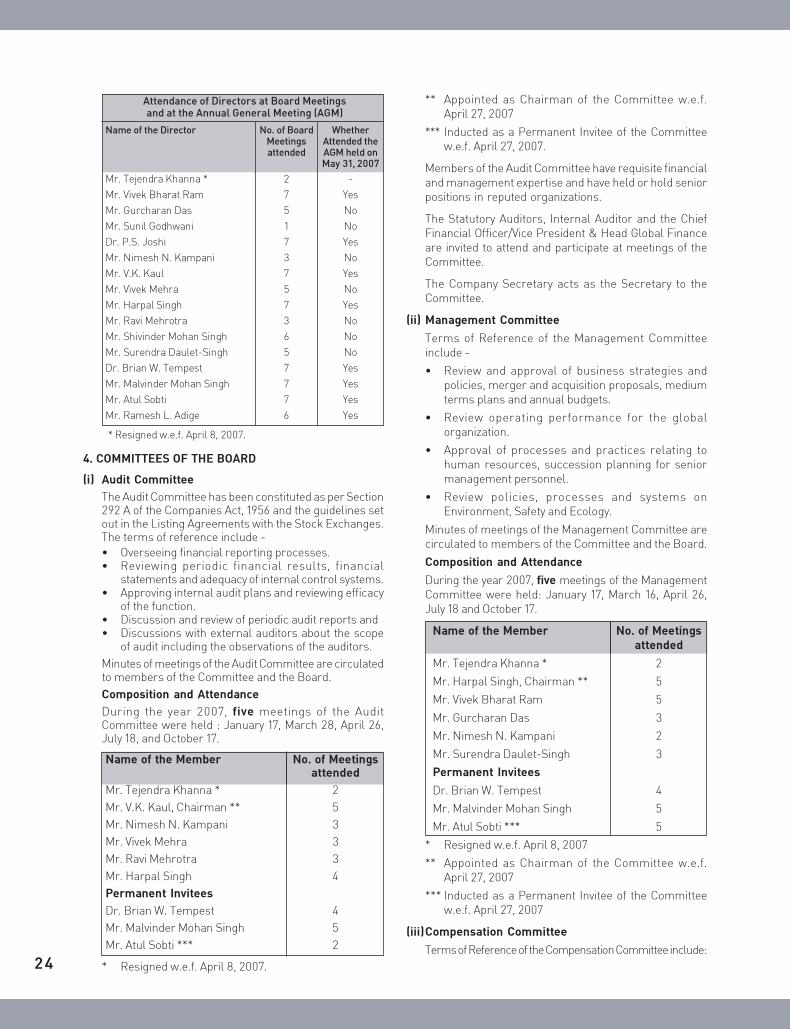
24
Attendance of Directors at Board Meetingsand at the Annual General Meeting (AGM)
Name of the Director No. of Board WhetherMeetings Attended theattended AGM held on
May 31, 2007
Mr. Tejendra Khanna * 2 -
Mr. Vivek Bharat Ram 7 Yes
Mr. Gurcharan Das 5 No
Mr. Sunil Godhwani 1 No
Dr. P.S. Joshi 7 Yes
Mr. Nimesh N. Kampani 3 No
Mr. V.K. Kaul 7 Yes
Mr. Vivek Mehra 5 No
Mr. Harpal Singh 7 Yes
Mr. Ravi Mehrotra 3 No
Mr. Shivinder Mohan Singh 6 No
Mr. Surendra Daulet-Singh 5 No
Dr. Brian W. Tempest 7 Yes
Mr. Malvinder Mohan Singh 7 Yes
Mr. Atul Sobti 7 Yes
Mr. Ramesh L. Adige 6 Yes
* Resigned w.e.f. April 8, 2007.
4. COMMITTEES OF THE BOARD
(i) Audit Committee
The Audit Committee has been constituted as per Section292 A of the Companies Act, 1956 and the guidelines setout in the Listing Agreements with the Stock Exchanges.The terms of reference include -• Overseeing financial reporting processes.• Reviewing periodic financial results, financial
statements and adequacy of internal control systems.• Approving internal audit plans and reviewing efficacy
of the function.• Discussion and review of periodic audit reports and• Discussions with external auditors about the scope
of audit including the observations of the auditors.
Minutes of meetings of the Audit Committee are circulatedto members of the Committee and the Board.
Composition and Attendance
During the year 2007, five meetings of the AuditCommittee were held : January 17, March 28, April 26,July 18, and October 17.
Name of the Member No. of Meetingsattended
Mr. Tejendra Khanna * 2
Mr. V.K. Kaul, Chairman ** 5
Mr. Nimesh N. Kampani 3
Mr. Vivek Mehra 3
Mr. Ravi Mehrotra 3
Mr. Harpal Singh 4
Permanent Invitees
Dr. Brian W. Tempest 4
Mr. Malvinder Mohan Singh 5
Mr. Atul Sobti *** 2
* Resigned w.e.f. April 8, 2007.
** Appointed as Chairman of the Committee w.e.f.April 27, 2007
*** Inducted as a Permanent Invitee of the Committeew.e.f. April 27, 2007.
Members of the Audit Committee have requisite financialand management expertise and have held or hold seniorpositions in reputed organizations.
The Statutory Auditors, Internal Auditor and the ChiefFinancial Officer/Vice President & Head Global Financeare invited to attend and participate at meetings of theCommittee.
The Company Secretary acts as the Secretary to theCommittee.
(ii) Management Committee
Terms of Reference of the Management Committeeinclude -
• Review and approval of business strategies andpolicies, merger and acquisition proposals, mediumterms plans and annual budgets.
• Review operating performance for the globalorganization.
• Approval of processes and practices relating tohuman resources, succession planning for seniormanagement personnel.
• Review policies, processes and systems onEnvironment, Safety and Ecology.
Minutes of meetings of the Management Committee arecirculated to members of the Committee and the Board.
Composition and Attendance
During the year 2007, five meetings of the ManagementCommittee were held: January 17, March 16, April 26,July 18 and October 17.
Name of the Member No. of Meetingsattended
Mr. Tejendra Khanna * 2
Mr. Harpal Singh, Chairman ** 5
Mr. Vivek Bharat Ram 5
Mr. Gurcharan Das 3
Mr. Nimesh N. Kampani 2
Mr. Surendra Daulet-Singh 3
Permanent Invitees
Dr. Brian W. Tempest 4
Mr. Malvinder Mohan Singh 5
Mr. Atul Sobti *** 5
* Resigned w.e.f. April 8, 2007
** Appointed as Chairman of the Committee w.e.f.April 27, 2007
*** Inducted as a Permanent Invitee of the Committeew.e.f. April 27, 2007
(iii)Compensation Committee
Terms of Reference of the Compensation Committee include:

25
• Administration and superintendence of Employees Stock Option Schemes (ESOS).
• Formulation of the detailed terms and conditions of the ESOS.
• Grant of stock options.
• Recommendation for fixation and periodic revision of compensation of the Managing Director and Executive Directorsto the Board for approval and Review and approve compensation policy (including performance bonus, incentives,perquisites and benefits) for senior management personnel.
Minutes of meetings of the Compensation Committee are circulated to members of the Committee and the Board.
Composition and Attendance
During the year 2007, two meetings of the Compensation Committee were held : January 17 and March 28.
Name of the Member No. of Meetings attended
Mr. Tejendra Khanna * 2Mr. Vivek Bharat Ram, Chairman** 2Mr. Nimesh N. Kampani 2Mr. V.K. Kaul 2Mr. Harpal Singh 2Mr. Surendra Daulet-Singh 2Permanent InviteesDr. Brian W. Tempest 1Mr. Malvinder Mohan Singh 2
* Resigned w.e.f. April 8, 2007.
** Appointed as Chairman of the Committee w.e.f. April 27, 2007
Remuneration Policy
The Remuneration Policy of the Company for managerial personnel is primarily based on the following criteria :– Performance of the Company, its divisions and units.– Track record, potential and performance of individual managers and– External competitive environment.
Remuneration of Directors
Remuneration of Executive Directors is decided by the Board based on recommendations of the Compensation Committeeas per the remuneration policy of the Company, within the ceilings fixed by the shareholders. Remuneration of the ExecutiveDirectors for the year ended December 31, 2007 was as follows :
Ranbaxy Laboratories Limited Annual Report 2007 Corporate Governance
Executive Directors
Name of the Salary & Commission Perquisites Retiral Stock Service Contract
Director Allowances Benefits* Options ** Tenure Notice(granted on Period17-1-2007)
—————————— Rs.Lacs ———————————-
Dr. Brian W. 322.04 255.00 64.92 27.91 40,000 Up to 12Tempest 31.12.07 months
Mr. Malvinder 900.18 1000.00 9.21 49.19 – Up to 12Mohan Singh 17.01.11 months
Mr. Atul Sobti 201.75 150.00 0.52 8.81 20,000 Up to 1217.01.12 months
Mr. Ramesh 71.01 35.00 0.42 3.30 10,000 Up to 12L. Adige 17.01.10 months
subject to superannuation policyof the Company.
* Exclusive of provision for future liabilities in respect of retirement benefits (which are based on actuarial valuation done on overall Companybasis).
** Each vested option is exercisable into one fully paid-up Equity Share against payment of Rs. 430 per share. Market price of the share onJanuary 16, 2007 was Rs. 429.65 per share; hence stock options were not at a discount. The options granted are exercisable till expiry often years from the date of grant. Vesting period will commence on the expiry of one year from the date of grant of options and theentitlement will be in the graduated scale over a period of five years as provided in the Employees Stock Option Scheme of the Company.

26
programmes and laying down a policy framework forcollaborative R&D programmes.
Minutes of meetings of the Science Committee arecirculated to members of the Committee and the Board.
Composition and Attendance
During the year 2007, two meetings of the ScienceCommittee were held : April 26 and October 17.
Name of the Member No. of Meetingsattended
Dr. P.S. Joshi, Chairman 2
Mr. Tejendra Khanna * -
Dr. Brian W. Tempest 2
Mr. Vivek Bharat Ram 2
Mr. Gurcharan Das 1
Mr. V.K. Kaul 2
Mr. Malvinder Mohan Singh 2
Mr. Harpal Singh ** 1
Permanent Invitees
Dr. Nityanand 2
Mr. Atul Sobti *** 1
* Resigned w.e.f. April 8, 2007
** Co-opted as member of the Committee w.e.f.April 27, 2007
*** Inducted as a Permanent Invitee of the Committeew.e.f. April 27, 2007
(v) Shareholders/Investors Grievance and ShareTransfer Committee
Composition and Attendance
During the year 2007, seven meetings of the Committeewere held - February 5, March 14, May 8, June 12,August 13, October 10 and December 21.
Name of the Member No. of Meetingsattended
Mr. Tejendra Khanna * 2
Mr. Harpal Singh, Chairman ** 5
Mr. Vivek Bharat Ram 5
Mr. V.K. Kaul 7
Mr. Malvinder Mohan Singh *** 5
* Resigned w.e.f. April 8, 2007.
** Co-opted as a member and appointed as Chairmanof the Committee w.e.f. April 27, 2007
*** Co-opted as a member of the Committee w.e.f.April 27, 2007
The Company addresses all complaints, suggestions andgrievances expeditiously and replies have been sent/issues resolved usually within 15 days except in case ofdispute over facts or other legal constraints.
The Company received 73 shareholders' complaintswhich inter-alia include non-receipt of dividend, annualreport, split shares, etc. The complaints were duly
Remuneration to Non-executive Directors
Remuneration to Non-Executive Directors comprisescommission and sitting fees.
Commission is paid on the basis of
a. Membership of the Board and
b. The number of Committees of the Board that theyserve as members.
Remuneration paid to the Non-Executive Directors for theyear ended December 31, 2007 was as follows:
Name of the Director Commission Sitting Fees(Rs.Lacs) (Rs.Lacs)
Mr. Harpal Singh 17.00 4.00
Mr. Vivek Bharat Ram 14.00 3.40
Mr. Gurcharan Das 11.00 1.80
Mr. Sunil Godhwani 2.50 0.25
Dr. P.S. Joshi 8.00 1.80
Mr. Nimesh N. Kampani 14.00 2.00
Mr. V.K. Kaul 14.00 4.40
Mr. Vivek Mehra 8.00 1.60
Mr. Shivinder Mohan Singh 5.00 1.20
Mr. Surendra Daulet-Singh 11.00 2.00
Mr. Ravi Mehrotra does not accept payment ofcommission / sitting fee in view of the policy of hisorganization.
Details of Shareholding of Non-Executive Directors as onDecember 31, 2007
Name of the Director No. ofShares held
Mr. Harpal Singh –
Mr. Vivek Bharat Ram –
Mr. Gurcharan Das –
Mr. Sunil Godhwani –
Dr. P.S. Joshi –
Mr. Nimesh N. Kampani –
Mr. Ravi Mehrotra –
Mr. V.K. Kaul 200
Mr. Vivek Mehra –
Mr. Shivinder Mohan Singh 2,120,742
Mr. Surendra Daulet-Singh 9348
(iv) Science Committee
Terms of Reference of Science Committee include -
• Approval of focus areas of research, especially NewDrug Discovery Research (NDDR) and Novel DrugDelivery Systems (NDDS), R&D organizationalstructure and policies for the research anddevelopment function of the Company; and
• Monitoring progress of NDDR and NDDS

27
Ranbaxy Laboratories Limited Annual Report 2007 Corporate Governance
attended to and the Company has furnished necessarydocuments/information to the shareholders.
The Shareholders/Investors Grievance and ShareTransfer Committee reviews complaints received andaction taken by the Company in this regard.
5. GENERAL BODY MEETINGS
Details of the Annual General Meetings held in the last three years :
Year Date Day Time Venue Special Resolutions Passed
2005 30-6-2005 Thursday 11.00 A.M. The National Institute of - Approval under Section 81(1A)Pharmaceutical Education & of the Companies Act, 1956Research, Sector 67, for issuance up to 40 lacsS.A.S. Nagar, Punjab stock options under Employees’
Stock Option Scheme of theCompany.
- Sub-division of Equity Sharesof the face value of Rs. 10 eachinto 2 equity shares of Rs.5 eachand consequent amendmentsto the Memorandum andArticles of Association of theCompany.
2006 28-6-2006 Wednesday 11.00 A.M. The National Institute of No Special ResolutionPharmaceutical Education &Research, Sector 67,S.A.S. Nagar, Punjab
2007 31-5-2007 Thursday 11.00 A.M. The National Institute of No Special ResolutionPharmaceutical Education &Research, Sector 67,S.A.S. Nagar, Punjab
6. CODE OF CONDUCT
The Code of Conduct for the Directors and Employees of the Company is posted on the website of the Company.
Declaration as required under Clause 49 of the Listing Agreement
All Directors and Senior Management personnel of the Company have affirmed compliance with the provisions of theRanbaxy’s Code of Conduct for the financial year ended December 31, 2007.
Malvinder Mohan SinghCEO & Managing Director
Gurgaon, HaryanaMarch 28, 2008
7. Certificate from CEO and Vice President & Head Global Finance
Certificate from CEO and Vice President & Head Global Finance for the financial year ended December 31, 2007 has beenprovided elsewhere in the Annual Report.
8. DISCLOSURES
A. Related Party Transactions
The Company has not entered into any transaction of material nature with the promoters, the Directors or themanagement, their subsidiaries or relatives etc. that may have any potential conflict with the interests of the Company.
B. Compliances by the Company
During the last three years, no penalties or strictures have been imposed on the Company by the Stock Exchanges orSEBI or any other statutory authorities on matters related to capital markets.
No requests for share transfers are pending except thosethat are disputed or sub-judice.
Mr. S.K. Patawari, Company Secretary is the ComplianceOfficer of the Company.

28
C. The Company has complied with all the mandatoryrequirements and has adopted non-mandatoryrequirements as per details given below :
(1) The Board
The Company maintains the Office of the Non-Executive Chairman at its Corporate Office at PlotNo. 90, Sector 32, Gurgaon-122001 (Haryana) andalso reimburses the expenses incurred inperformance of his duties.
There is no fixed tenure for Independent Directors.
(2) Remuneration Committee
The Company has constituted CompensationCommittee as detailed in 4(iii) hereinabove. TheChairman of the Compensation Committee is anIndependent Director and was present at the lastAnnual General Meeting.
(3) Shareholders’ Rights
The quarterly financial results are published in thenewspapers as mentioned under the heading"Means of Communication" at Sl. No. 9hereinbelow and also displayed on the website ofthe Company. The results are not separatelycirculated to the shareholders.
(4) Audit qualifications
There are no audit qualifications in the Company'sfinancial statements for the year under reference.
(5) Training of Board Members
No specific training programme was arranged forBoard members. However, at the Board/Committee meetings detailed presentations aremade by Professionals, Consultants as well asSenior Executives of the Company on the businessrelated matters, risk assessment, strategy, effectof the regulatory changes etc.
(6) Mechanism for evaluating non-executiveBoard Members
The Company has not adopted any mechanism forevaluating individual performance of Non-Executive Directors.
(7) Whistle Blower Policy
The Company has laid down a Code of Conductfor all its employees across the organisation. TheCode of Conduct of the Company lays down thatthe employees shall promptly report any concernor breach and suggests not to hesitate in reportinga violation or raising a policy concern to the CodeCompliance Cell or concerned superior. The Codeprovides that the Company shall support andprotect employees for doing so. The Companydoes not have Whistle Blower Policy.
9. MEANS OF COMMUNICATION
(a) The Company regularly intimates unaudited as wellas audited financial results to the Stock Exchangesimmediately after these are taken on record by theBoard. These financial results are normally publishedin the Business Standard/Financial Express, the
Tribune (Punjabi Edition) and are displayed on thewebsite of the Company www.ranbaxy.com andsimultaneously posted on the Electronic DataInformation Filing and Retrieval website namelywww.sebiedifar.nic.in. The website is also accessiblethrough a hyperlink 'EDIFAR' from SEBI's officialwebsite, www.sebi.gov.in. Further in compliance ofClause 52 of the Listing Agreement, the aboveinformation and other communications sent to StockExchanges have also been filed under Corporate FilingDissemination System (CFDS) and are available atwebsite, www.corpfiling.com.
The official news releases and the presentations madeto the investors/analysts are also displayed on theCompany's website.
(b) Management Discussion and Analysis Report formspart of the Report of the Directors.
10. SHAREHOLDER INFORMATION
Annual General Meeting
Date : May 30, 2008
Time : 11.00 A.M.
Venue : The National Institute of PharmaceuticalEducation and Research (NIPER)Sector-67, S.A.S. Nagar(Mohali) - 160 062 (Punjab)
No Special resolution is proposed to be passed by Postalballot at the aforesaid Annual General Meeting.
Financial Calendar -
Adoption of Quarterly Results 3rd / 4th week offor the quarter ending
June 30, 2008 July 2008
September 30, 2008 October 2008
December 31, 2008 January 2009
March 31, 2009 April 2009
Book Closure Dates
May 23, 2008 to May 30, 2008(both days inclusive)
Dividend Payment Date
On or before June 4, 2008
LISTING ON STOCK EXCHANGES
The Equity Shares of the Company are listed on theBombay Stock Exchange Ltd. and National StockExchange of India Ltd. at Mumbai. Global DepositoryReceipts (GDRs) are listed on the Stock Exchange atLuxembourg. Foreign Currency Convertible Bonds(FCCBs) have been listed with the Singapore ExchangeSecurities Trading Limited.
The Company has paid annual listing fees due to the StockExchanges for the year 2007-2008.
STOCK CODE
1. The National StockExchange of India Ltd. - Ranbaxy
2. Bombay Stock Exchange Ltd. - 359 (Physical)
500359 (Demat)

29
Ranbaxy Laboratories Limited Annual Report 2007 Corporate Governance
REGISTRAR AND TRANSFER AGENT
M/s Alankit Assignments Ltd. (Alankit), 2E/8, 1st Floor,Jhandewalan Extension, New Delhi-110 055 are theRegistrar and Share Transfer Agent for physical sharesof the Company. Alankit is also the depository interfaceof the Company with both National Securities DepositoryLtd. (NSDL) and Central Depository Services (India) Ltd.(CDSL).
However, keeping in view the convenience ofshareholders, documents relating to shares will continueto be received by the Company at Corporate Office of theCompany at Plot No. 90, Sector 32, Gurgaon-122001(Haryana) Tel No. 91-124-4135000, Registered Officeat A-11, Industrial Area, Sahibzada Ajit Singh Nagar(Mohali)-160055, (Punjab) and Head Office at 12th Floor,Devika Tower, 6, Nehru Place, New Delhi-110019Tel No. +91-11-26237508;email address: [email protected].
Market Price Data (Rs.)
Month Bombay Stock National StockExchange Exchange
(BSE) (NSE)
High Low High Low
January 2007 445.00 390.00 444.90 383.35
February 2007 426.00 335.00 426.00 325.25
March 2007 355.05 305.50 359.80 304.50
April 2007 376.00 330.00 376.40 329.15
May 2007 406.50 372.15 406.95 372.00
June 2007 394.00 341.50 394.90 341.95
July 2007 392.80 339.50 392.70 339.25
August 2007 393.85 342.25 393.90 342.00
September 2007 436.40 391.00 435.50 392.00
October 2007 459.15 390.00 459.80 391.10
November 2007 490.00 376.00 457.85 370.05
December 2007 428.50 385.00 449.95 360.40
Stock Price Performance - Ranbaxy Vs BSE Sensex
Year 2007
SHARE TRANSFER SYSTEM
With a view to expedite the process of share transfers, theBoard of Directors of the Company has delegated the powerof share transfer to some of the Directors with appropriateindividual limits. The delegated Director(s) attend(s) to theshare transfer formalities at least once in a fortnight. Theshares for transfers received in physical form are transferredexpeditiously, provided the documents are complete and theshares under transfer are not under any dispute. The sharecertificates duly endorsed are returned immediately toshareholders. Confirmation in respect of the requests fordematerialisation of shares is sent to the respectivedepositories i.e. NSDL and CDSL expeditiously.
DEMATERIALIZATION OF SHARES
The shares of the Company are in compulsory dematsegment and are available for trading in the depositorysystems of both NSDL and CDSL. As on December 31, 2007,362,497,986 Equity Shares of the Company, forming 97.17%of the Share Capital of the Company, stand dematerialised.
International Securities Identification Number -INE015A01028 (with NSDL and CDSL)
Shareholding Pattern as on December 31, 2007
Category No. of Percentage ofShares held Shareholding (%)
Promoters 129936214 34.83
Mutual Funds & UTI 18927418 5.07
Banks, FinancialInstitutions, InsuranceCompanies 75196255 20.16
FIIs 52041745 13.95
Private Corporate Bodies 11339626 3.04
Indian Public 69103724 18.52
Foreign Nationals 5136 0.00
NRIs/OCBs 5711969 1.53
GDRs 10808742 2.90
Grand Total 373070829 100.00
Distribution of Shareholding as on December 31, 2007
From To No. of Shareholders No. of Shares
Number % Total Number % Total
1 - 50 98990 50.40 2589898 0.6951 - 100 33765 17.19 3005522 0.80
101 - 200 20237 10.30 3307571 0.89201 - 300 7858 4.00 2064492 0.55301 - 400 6316 3.21 2228301 0.60401 - 500 4453 2.27 2110661 0.57501 - 600 2760 1.40 1549235 0.41601 - 700 2352 1.20 1537595 0.41701 - 800 1682 0.86 1288371 0.34801 - 900 1165 0.59 1001584 0.27901 - 1000 2218 1.13 2170345 0.58
1001 - 2000 7142 3.64 10395924 2.792001 - 3000 2801 1.43 6938212 1.863001 - 4000 1469 0.75 5057543 1.364001 - 5000 771 0.39 3494017 0.94
5001 & above 2434 1.24 324331558 86.94
Total 196413 100.00 373070829 100.00

30
Auditors' certificate on compliance with the conditions of corporate
governance under clause 49 of the listing agreements
To the members ofRanbaxy Laboratories Limited
We have examined the compliance of conditions of corporate governance by Ranbaxy Laboratories Limited("the Company") for the year ended on December 31, 2007, as stipulated in clause 49 of the listing agreements ofthe Company with the stock exchanges.
The compliance of conditions of corporate governance is the responsibility of the management. Our examination waslimited to procedures and implementation thereof, adopted by the Company, for ensuring the compliance of theconditions of corporate governance. It is neither an audit nor an expression of opinion on the financial statements ofthe Company.
In our opinion and to the best of our information and according to the explanations given to us, we certify that theCompany has complied with the conditions of corporate governance as stipulated in the abovementioned listingagreement.
We further state that such compliance is neither an assurance as to the future viability of the Company nor theefficiency or effectiveness with which the management has conducted the affairs of the Company.
For Walker, Chandiok & CoChartered Accountants
Vinod ChandiokPlace : Gurgaon PartnerDated : March 28, 2008 Membership No. 10093
Liquidity of Shares
The Equity Shares of the Company have been included in theSensex of the leading Stock Exchanges.
Outstanding Stock Options
Number of Stock Options outstandingas on December 31, 2007 - 7,168,956 *
Out of which 82,830 Stock Options exercised were pendingallotment.
* Options granted upto October 3, 2002 are entitled foradditional shares on a proportionate basis in view of issue ofbonus shares by the Company in the ratio of 3 for 5 in October2002.
There are no outstanding warrants as on December 31, 2007.
The Company had raised US$ 440,000,000 in the year 2006through Zero Coupon Convertible Bonds. The Bonds areconvertible any time on or after April 27, 2006 upto March 8,2011 by the holders into fully paid Equity Shares of Rs. 5 eachof the Company, which may subject to certain conditions, berepresented by Global Depository Shares (GDS) with eachGDS representing one share at a conversion price of Rs.716.32 per share, which is subject to adjustment in certaincircumstances. In case if the Bonds are not converted intoshares, the Company will redeem each Bond at 126.765% ofits principal amount on the maturity date i.e. March 18, 2011.
10,808,742 GDRs representing 10,808,742 Equity Shares ofRs. 5 each constituting 2.90% of the issued subscribed andpaid-up share capital of the Company, were outstanding ason December 31, 2007.
Plant Locations of the Company
1. A-8, A-9, A-10 & A-11, Industrial Area, Phase - III,Sahibzada Ajit Singh Nagar, (Mohali) – 160 055 (Punjab)
2. Village Toansa, P.O. Railmajra, Distt. Nawansahar(Punjab), 144 533
3. A-41, Industrial Area Phase VIII-A,Sahibzada Ajit Singh Nagar, (Mohali) – 160 072 (Punjab)
4. Industrial Area 3, A.B. Road,Dewas – 450 001, Madhya Pradesh
5. Village & PO GanguwalaTeh. Paonta Sahib 173 025, Distt. Sirmour (H.P.)
6. Village BatamandiTehsil Paonta Sahib - 173 025, Distt. Sirmour (H.P.)
7. E-47/9, Okhla Industrial AreaPhase-II, Okhla, New Delhi - 110 020
8. Plot No. B-2, Madkaim Industrial Estate, Ponda, Goa
9. K-5, 6, 7, Ghirongi, Malanpur, Distt. Bhind - 477 116, (M.P.)
Address for Correspondence
Shareholders are requested to contact -Mr. S. K. PatawariCompany SecretaryRanbaxy Laboratories Ltd.Plot No. 90, Sector 32, Gurgaon – 122 001, HaryanaTel. No. : 91-124-4185888, 4135000.Fax No.: 91-124-4106490Email address : [email protected]

31
To the Board of Directors of Ranbaxy Laboratories Ltd.
We, Malvinder Mohan Singh, CEO & Managing Director and Omesh Sethi, Vice President & Head-Global Financecertify that :
(a) We have reviewed financial statements and the cash flow statement for the year ended December 31, 2007and that to the best of our knowledge and belief :
(i) these statements do not contain any materially untrue statement or omit any material fact or containstatements that might be misleading;
(ii) these statements together present a true and fair view of the Company's affairs and are in compliancewith existing Accounting Standards, applicable laws and regulations.
(b) There are, to the best of our knowledge and belief, no transactions entered into by the Company during theyear which are fraudulent, illegal or violative of the Company's Code of Conduct.
(c) We accept responsibility for establishing and maintaining internal controls for financial reporting and haveevaluated the effectiveness of internal control systems of the Company pertaining to financial reporting andwe have disclosed to the auditors and the Audit Committee, deficiencies in the design or operation of suchinternal controls, if any, of which we are aware and the steps we have taken or propose to take to rectify thesedeficiencies.
(d) We have indicated to the Auditors and the Audit Committee that -
(i) there has not been any significant changes in internal control over financial reporting during the yearunder reference;
(ii) there has not been any significant changes in accounting policies during the year requiring disclosure inthe notes to the financial statements; and
(iii) there has not been any instances during the year of significant fraud of which we had become aware andthe involvement therein, if any, of the management or an employee having a significant role in theCompany's internal control system over financial reporting.
Malvinder Mohan Singh Omesh SethiCEO & Managing Director Vice President & Head
Global Finance
Place : GurgaonDate : March 28, 2008
CEO AND
VICE PRESIDENT&HEAD-GLOBAL FINANCE
CERTIFICATE FROM

32
Mr. Harpal SinghNon-Executive Chairman
Mr. Vivek Bharat Ram
Mr. Gurcharan Das
Mr. Sunil Godhwani
Dr. P.S. Joshi
Mr. Nimesh N. Kampani
Mr. V.K. Kaul
Mr. Vivek Mehra
Mr. Ravi Mehrotra
Mr. Shivinder Mohan Singh
Mr. Surendra Daulet-Singh
Dr. Brian W. Tempest
Mr. Malvinder Mohan SinghChief Executive Officer and Managing Director
Mr. Atul SobtiChief Operating Officer & Whole-time Director
Mr. Ramesh L. AdigeWhole-time Director – Corporate Affairs &
Global Corporate Communications
SECRETARYMr. S. K. Patawari
REGIONAL HEADQUARTERSGurgaon (India), London (UK), Johannesburg (South Africa), New Jersey (USA)
Rio de Janerio (Brazil), Singapore (Singapore)
MARKETING OFFICESDoula (Cameroon), Kiev (Ukraine), Moscow (Russia), Ho Chi Minh City (Vietnam), Kaunas (Lithuania), Nairobi (Kenya)
Abidjan (Ivory Coast), Warsaw (Poland), Yangon (Myanmar), Almaty (Kazakhstan), Dubai (UAE),Harare (Zimbawe), Casablanca (Morocco), Sofia (Bulgaria)
STATUTORY AUDITORSWalker, Chandiok & Co, L-41, Connaught Circus, New Delhi - 110 001
INDEPENDENT AUDITORS (US GAAP)Grant Thornton, L-41, Connaught Circus, New Delhi - 110 001
SOLICITORSKhaitan Jayakar Sud & Vohra, D-41, Defence Colony, New Delhi-110024
BANKERSABN AMRO Bank NV, Bank of America NA, Calyon Bank, Citibank NA, Deutsche Bank AG
Hong Kong & Shanghai Banking Corporation, Punjab National Bank, Standard Chartered Bank
REGISTERED OFFICEA-11, Industrial Area, Sahibzada Ajit Singh Nagar (Mohali) - 160 055, Punjab (India)
Ph : (91-172) 2271450. Fax : (91-172) 2226925
CORPORATE OFFICEPlot No. 90, Sector 32, Gurgaon – 122 001, Haryana (India) Ph : (91-124) 4135000. Fax : (91-124) 4135001
HEAD OFFICE12th Floor, Devika Tower, 6, Nehru Place, New Delhi - 110 019 (India) Ph : (91-11) 26452666. Fax : (91-11) 26225987
DIRECTORSBOARD OF

33
Your Directors have pleasure in presenting this 47th Annual Report and Audited Accounts for the year ended 31st December,2007.
WORKING RESULTS
Rs. in Million
Year ended Year endedDecember 31, December 31,
2007 2006
Net Sales 40,712.87 39,720.51
Profit before Interest, Depreciation, Amortization and Impairment 9,865.63 6,081.70
Interest 934.26 584.44
Depreciation, Amortization and Impairment 1,187.31 1,067.50
Profit before Tax 7,744.06 4,429.76
Provision for Tax 1,566.86 624.33
Profit After Tax 6,177.20 3,805.43
Tax - earlier years – 145.84
Balance as per last balance sheet 471.18 560.34
Transfer from Foreign projects reserve 24.87 22.95
Balance available for appropriation 6,673.25 4,534.56
Appropriations:
Dividend
Interim 932.12 3,168.94
Final 2,239.42 –
Tax on Dividend 539.02 444.44
Transfer to :
General Reserve 800.00 450.00
Surplus carried forward 2,162.69 471.18
6,673.25 4,534.56
CONSOLIDATED WORKING RESULTS (UNDER INDIAN GAAP)
Net Sales 66,926.74 60,652.24
Profit before Interest, Depreciation, Amortization and Impairment 13,580.64 9,389.54
Interest 1,411.88 1,036.32
Depreciation, Amortization and Impairment 2,183.41 1,842.88
Profit before Tax 9,985.35 6,510.34
Provision for Tax 2,118.86 1,356.74
Profit After Tax 7,866.49 5,153.60
Add: Share in profit & loss of associates (Net) 2.10 –
Less: Minority Interests 123.74 50.21
Profit After Tax and Minority Interests 7,744.85 5,103.39
Tax - earlier years 1.01 148.06
Balance as per last balance sheet 2,464.96 1,253.94
Transfer from Foreign projects reserve 24.87 22.95
Balance available for appropriation 10,235.69 6,528.34
Appropriations:
Dividend
Interim 932.13 3,168.94
Final 2,239.42 –
Tax on Dividend 539.02 444.44
Transfer to :
General Reserve 800.00 450.00
Surplus carried forward 5,725.12 2,464.96
10,235.69 6,528.34
DIRECTORSREPORT OF THE

34
CONSOLIDATED FINANCIAL STATEMENTS
Consolidated Financial Statements for the year ended December 31, 2007, under Indian GAAP and US GAAP form part of theAnnual Report.
OPERATIONS
The Company had a successful year registering an improved performance on the key parameters. Consolidated net sales atRs. 66,927 millions grew by 10.3% in 2007, while Profit After Tax registered a robust growth of 53% over the previous year.The performance during the year was driven by growth in sales of dosage forms across developed and emerging markets,increased operating efficiencies, a continuing focus on cost optimization and better management of working capital.
Dosage form sales constituted 94% of global sales in 2007 (91% in 2006) reflecting the Company's focus on moving up thevalue curve. Overseas markets contributed 78% of total sales.
DIVIDEND
Interim Dividend of Rs.2.50 per share was paid in November, 2007. Your Directors now recommend a final dividend of Rs.6.00 per share for the year ended December 31, 2007, taking the total dividend to Rs. 8.50 per share of par value of Rs. 5 each(2006 - total dividend Rs.8.50 per share).
CHANGES IN CAPITAL STRUCTURE
Issue of shares on exercise of Employees' Stock Options
The Company allotted Equity Shares (on pari-passu basis) pursuant to exercise of Stock Options by eligible employees, assummarized below:
Date of Allotment No. of Shares
April 13, 2007 81,658
July 12, 2007 95,384
October 10, 2007 114,966
January 10, 2008 82,830
SUBSIDIARIES AND JOINT VENTURES
A statement pursuant to section 212 of the Companies Act, 1956, relating to subsidiary companies is attached to theaccounts. In terms of approval granted by the Central Government under section 212(8) of the Companies Act, 1956, theaudited accounts of the subsidiary companies are not attached to this Annual Report. However, the consolidated financialstatements prepared in accordance with Accounting Standard 21 of the Institute of Chartered Accountants of India presentedin this Annual Report includes the financial information of subsidiary companies.
MERGER & ACQUISITIONS
1. Demerger of New Drug Discovery Research Unit
The Board of Directors of the Company at its meeting held on February 19, 2008, approved a Scheme of Arrangement forDemerger (Scheme) of New Drug Discovery Research (NDDR) Unit of the Company into Ranbaxy Life Sciences ResearchLimited ("RLS"), a subsidiary of the Company, subject to requisite approvals. The Appointed Date for the purpose ofdemerger has been fixed as 1st January 2008. Under the Scheme, shareholders of the Company will be entitled toreceive one equity share of Re. 1.00 each of RLS without any payment for every four equity shares of Rs. 5.00 each held inthe Company as on the Record Date to be fixed for this purpose. This is a significant step in creating an independentpathway for NDDR with dedicated resources and an enhanced focus for long-term growth. In terms of the ListingAgreements with the stock exchanges, The National Stock Exchange of India Ltd. and Bombay Stock Exchange Limitedhave conveyed their “No Objection” to the Scheme.
2 . Zenotech Laboratories Limited
The Company increased its equity stake in Zenotech Laboratories Ltd., Hyderabad, from 6.94% to 46.95%. This wouldprovide a strong platform in high growth areas like Biologics and Speciality injectables including Oncology products,across emerging and developed markets to the Company.
3 . Jupiter BioSciences Limited
The Company acquired a strategic stake of 14.9% in Jupiter Biosciences Limited, Hyderabad, through equity warrants.The total investment for this would be Rs. 470 million. This would provide the Company access to the fast growing andniche therapeutic segment of Peptides.
4 . Be-Tabs Pharmaceuticals (Proprietary) Limited (South Africa)
The Company concluded the acquisition of Be-Tabs in South Africa through Ranbaxy Netherlands B.V (RNBV), a whollyowned subsidiary of the Company. This has resulted in making Ranbaxy the fifth largest generic pharmaceuticalcompany in South Africa.

35
Ranbaxy Laboratories Limited Annual Report 2007 Report of the Directors
5 . Dermatalogy Brands of Bristol Myers Squibb(USA)
The Company, through RNBV acquired 13 dermatalogy products from Bristol Myers Squibb (BMS) in the USA forconsideration of US $ 26 Mn. This has further strengthened and extended the franchise of the Company in the dermatologyarena.
MANAGEMENT DISCUSSION AND ANALYSIS REPORT
Management Discussion and Analysis Report, as required under the Listing Agreements with the Stock Exchanges, isenclosed at Annexure 'A'.
EMPLOYEES' STOCK OPTION SCHEME
Information regarding the Employees' Stock Option Scheme is enclosed at Annexure 'B'.
LISTING AT STOCK EXCHANGE
The Equity Shares of the Company continue to be listed on Bombay Stock Exchange Ltd. and The National Stock Exchange ofIndia Ltd. Global Depository Shares are listed on the Stock Exchange at Luxembourg and Foreign Currency ConvertibleBonds are listed on the Singapore Exchange Securities Trading Limited. The annual listing fees for the year 2007-2008 havebeen paid to these Exchanges.
DISCLOSURE OF PARTICULARS
As required by the Companies (Disclosure of Particulars in the Report of Board of Directors) Rules 1988, the relevantinformation and data is given at Annexure 'C'.
FIXED DEPOSITS
The Company has not invited / received any fixed deposits during the year.
DIRECTORS' RESPONSIBILITY STATEMENT
In terms of provisions of Section 217(2AA) of the Companies Act, 1956, (Act) your Directors confirm that:
(i) In the preparation of the annual accounts, the applicable accounting standards have been followed along with properexplanation relating to material departures, wherever applicable.
(ii) The Directors have selected such accounting policies and applied them consistently and made judgments and estimatesthat are reasonable and prudent so as to give a true and fair view of the state of affairs of the Company as at the end ofthe accounting year and of the profit of the Company for the year.
(iii) The Directors have taken proper and sufficient care for the maintenance of adequate accounting records in accordancewith the provisions of this Act for safeguarding the assets of the Company and for preventing and detecting fraud andother irregularities.
(iv) The Directors have prepared the annual accounts on a going concern basis.
DIRECTORS
Mr. Harpal Singh was elected as Non-Executive Chairman of the Board of Directors effective April 27, 2007 consequent toresignation of Mr. Tejendra Khanna from the position of Chairman and Director on his appointment as Lieutenant Governorof Delhi.
Dr. Brian W. Tempest retired as Chief Mentor and Executive Vice Chairman of the Board of Directors of the Company effectiveclose of business hours on December 31, 2007 on completion of his term. He was subsequently appointed as an AdditionalDirector (Non-executive) of the Company effective January 17, 2008 and holds office upto the date of this Annual GeneralMeeting.
Mr. Shivinder Mohan Singh was appointed as a Director of the Company effective January 18, 2006 in the casual vacancycaused by resignation of Mr. J.W. Balani and holds office upto the date of this Annual General Meeting.
Mr. Sunil Godhwani was appointed as a Director of the Company on April 27, 2007 in the casual vacancy caused by resignationof Mr. Tejendra Khanna and held office of Director upto the conclusion of the Annual General Meeting (AGM) held on May 31,2007. Subsequent to the AGM, the Board appointed him as an Additional Director of the Company effective May 31, 2007.
The Company has received Notices along with requisite fee from members under Section 257 of the Companies Act, 1956proposing the candidatures of Dr. Brian W. Tempest, Mr. Shivinder Mohan Singh and Mr. Sunil Godhwani as Directors of theCompany.
In accordance with the Articles of Association of the Company, Mr. Surendra Daulet-Singh, Mr. Nimesh N. Kampani,Mr. Harpal Singh and Mr. V. K. Kaul, retire by rotation as Directors at the ensuing Annual General Meeting and are eligiblefor re-appointment.
CORPORATE GOVERNANCE
Report on Corporate Governance along with the Certificate of the Auditors, M/s Walker, Chandiok & Co. confirming complianceof conditions of Corporate Governance as stipulated under Clause 49 of the Listing Agreements with the stock exchangesform part of the Annual Report.

36
COST AUDIT
The reports of M/s R.J. Goel & Co., Cost Accountants, in respect of audit of the cost accounts relating to formulations and bulkdrugs for the year ended December 31, 2007, will be submitted to the Central Government in due course.
AUDITORS
M/s Walker, Chandiok & Co., Chartered Accountants, retire as Auditors of the Company at the conclusion of the ensuingAnnual General Meeting and have confirmed their eligibility and willingness to accept the office of the Auditors, if re-appointed.
STATEMENT OF EMPLOYEES
Statement of particulars of employees as required under Section 217(2A) of the Companies Act, 1956 (“the Act”) and Rulesframed there under forms part of this Report. However, in terms of the provisions of Section 219(1)(b)(iv) of the Act, this Reportand Accounts are being sent to all the shareholders excluding the Statement of particulars of employees under Section 217(2A)of the Act. Any shareholder interested in obtaining a copy of the statement may write to the Company Secretary at theRegistered Office of the Company.
ACKNOWLEDGEMENTS
Your Company continues to occupy a place of respect amongst the many publics it is associated with, most of all our valuablecustomers. The Directors commend the continued commitment and dedication of employees at all levels. The Directors alsowish to acknowledge with thanks all other stakeholders for their valuable sustained support and encouragement. It is thisunity of purpose that breeds success and your Directors look forward to receiving similar support and encouragement fromthe larger Ranbaxy family in the years ahead.
On behalf of the Board of Directors
Gurgaon HARPAL SINGH
March 29, 2008 CHAIRMAN

37
ANNEXURE A
MANAGEMENT DISCUSSION AND ANALYSIS REPORT
INDUSTRY STRUCTURE & DEVELOPMENTS
The Global Pharmaceutical market audited sales grew by approximately 6.1% (at constant exchange rates) to reachUS $ 663.5 Bn in 2007. North America, Europe and Japan continued to remain the key markets, accounting for 86% ofthe worldwide pharmaceutical sales in 2007. The world's largest market, the United States recorded prescription salesof US$ 286.5 Bn, a growth of 3.8%. This slower growth was due to fewer new product approvals, loss of exclusivity ofbranded medicines and the year on year impact of the Medicare Part D program. The emerging economies furtherconsolidated their position in the global landscape with growth in countries like India, Russia, Brazil and Turkey exceedingthat in the developed markets.
The North American pharmaceutical sales grew by approximately 4.2% to reach US $ 304.5 Bn, constituting 46% of theglobal sales in 2007. Europe clocked sales of US$ 206 Bn, a growth of 6.7% and contributed 31% to total globalpharmaceutical sales. Pharmaceutical sales in Japan, the world's second largest market stood at US $ 58.5 Bn, andrecorded a growth of 4.2%. Sales in Latin America, led by the key markets of Brazil and Mexico grew by 12% to reachUS $ 32 Bn while Asia, Africa and Australia grew by 13% to US$ 62 Bn.
The Top 10 leading products contributed approximately 10% to Global Pharmaceutical Sales in 2007 with combinedsales of US$ 64Bn. The top 3 selling products worldwide were Atorvastatin (Lipitor US $13.5 Bn) followed by Clopidogrel(Plavix US$ 7.3 Bn and Esomeprazole (Nexium US$ 7.2 Bn). The top three therapeutic categories in 2007 were Oncologics,Lipid regulators and Respiratory agents with combined sales of US$ 104 Bn. The Top 10 therapeutic segments contributed36% to Global Pharmaceutical Sales in 2007, with combined sales of US$ 242 Bn.
Generics
The generics market registered buoyant growth with the fundamental drivers of demand continuing to emanate fromincreasing burden of healthcare costs in developed countries and wider access to healthcare in developing economies.With over US$ 80 Bn of drugs going off patent by 2012 and higher penetration across developed and emerging markets,the generics market will continue to provide attractive growth opportunities in future. Generics represented more thanhalf of the volume of pharmaceutical products sold in 7 key markets globally, viz. USA, Canada, France, Spain, Italy,Germany and UK.
Consolidation in the industry intensified with companies increasingly realising the need to further enhance theircompetitive advantages and trying to attain the right balance amongst cost leadership, product portfolio, geographicreach and specialty products and technologies.
In order to optimise value at various points across the pharmaceutical value curve, Innovator Pharmaceutical and GenericCompanies are exploring ways to move from a competing business model to a collaborative one. With InnovatorCompanies facing issues in terms of R&D productivity, costs, product safety and patent expiries and Generic Companiesinvolved with their own set of challenges, there seems to be a clear focus on leveraging each others’ strengths to formsymbiotic relationships. With competitive advantages in terms of research and development, manufacturing andmarketing, Indian Companies today stand at the forefront to partner with Innovator Pharmaceutical Companies.
An emerging trend in the generic landscape is the focus on specialty therapeutic segments such as Bio-similars, Peptides,Limuses and others. With difficult entry barriers characterised by complex technologies and large resource requirementsfor development, manufacturing and marketing, these therapeutic areas are expected to witness lesser competitionand higher sustainable margins in future. Opportunities for growth in these segments are being witnessed both througha mix of organic and inorganic efforts as companies try to supplement product gaps in their portfolios and significantlyreduce their time to market.
An important segment is that of Bio-similars, a fast growing area wherein bio-products, which today account forapproximately 10% of the worldwide pharmaceutical market, are opening up to generic competition over the next fewyears. Bio-similar products are expected to lead the growth in the specialty therapeutic segments.
Ranbaxy Laboratories Limited Annual Report 2007 Report of the Directors

38
In a bid to ascend the value chain and to create their own Intellectual Property, some Indian Pharmaceutical Companieshave taken strategic step of de-merging their New Drug Discovery Research (NDDR) Unit’s business into separateentities. This is a long term value proposition to bring about a sharper and enhanced focus on drug discovery researchin the Indian industry.
The three largest markets for Ranbaxy today are USA, Europe and India. The prevailing market environment in thesegeographies is as discussed below -
United States : In 2007, the proportion of generic prescriptions dispensed to total prescriptions stood at a robust 65%(61% in 2006). Although volumes rose across a number of therapeutic areas, the emergence of generic forms of Lipidregulators, Anti-depressants and Calcium blockers resulted in significant growth for these classes of medications.Salesin 2007 were driven by blockbuster products such as Amlodopine, Zolpidem and Carvedilol going off patent. Genericscontinue to play an increasingly prominent role in the US healthcare market.
According to the baseline forecast of IMS Health, the US generics market is expected to deliver a CAGR in excess of 14%in value terms over the period from 2005 to 2010. Generics will have a greater prescription market share compared to2007 as the market realises the full impact of the US$ 12 Bn in branded products that were genericised in the course of2007. Further, an additional US$ 13 Bn worth of branded products are expected to be genericised in 2008.
Europe : The key markets in Western Europe witnessed a relatively stable year vis-à-vis the challenging conditionswitnessed in 2006. While the markets of UK, France and Germany performed better than last year, Romania, a keymarket in Central Europe was subject to certain proposed healthcare reforms consequent to it joining the EU fromJanuary 1, 2007. The other markets in Central, Eastern and Southern Europe, including the CIS belt continued to experiencebuoyant growth led by a higher per capita pharmaceutical expenditure and an increasing utilisation of generic drugs,driven by the government’s efforts to reduce healthcare spends.
India : The Indian Pharmaceutical market in 2007 was valued at Rs 310 Bn (US$ 7.6 Bn), recording a growth of 13%. TheTop 10 Companies registered a combined market share of 36% and grew at a pace similar to that of the market. Whilethe Chronic therapy segments continued their robust momentum, recording a growth of approximately 20% during theyear, the Acute therapy categories grew by 11%.
The overall market growth was a mix of higher volumes of existing products, new product introductions and price increaseswith all three witnessing a positive trend. Approximately 75% of the overall market growth was led by volume increasesin existing products, while the balance was attributed to new product introductions, price increases and other factors.
Semi-urban and rural markets are becoming an important driver for growth (+23% in 2007) in the Indian market. Withhigher per capita income and increasing access to modern medicine, this segment is expected to continue its stronggrowth momentum.
The emergence of an organised pharmaceutical retail segment and the fast growing area of medical insurance arelikely to be other important factors that would positively impact the sector in the coming years.
OUTLOOK ON OPPORTUNITIES
The Generic Industry is expected to witness buoyant growth with blockbuster patent expiries, increasing genericpenetration and healthcare cost pressures.
Ranbaxy, today is amongst the leading generic companies with a widespread presence across markets of North America,Europe and the Asia Pacific region. It has a balanced revenue mix with developed markets contributing 40% to totalrevenues, the emerging markets 54% and the balance being the Active Pharmaceutical Ingredients (API) business.With its brand building capabilities in the emerging markets, First-to-File (FTF) product pipeline in the US market andan increasing presence in the specialty products segment, the Company is well placed to capitalise on the genericsgrowth opportunity.
The Company's potential for revenue growth from generic products is closely related to its product pipeline. As ofDecember 31, 2007, the Company had 239 ANDAs filed with the FDA, of which 141 have been approved. The Companybelieves that its pending pipeline of 98 ANDAs is one of the largest in the generics industry representing an innovatormarket size of approximately US$ 54 Bn. Of these, based on the Company's own analysis of publicly available US FDAdata, it believes that it has a FTF on 18 of these ANDA applications, which relate to brand-name drugs having aggregatesales in the United States of around US $ 27 Bn.

39
The Company entered into settlements with innovator companies for 3 key FTF products .i.e. Sumatriptan and Valacyclovirwith GlaxoSmithKline (brand name Imitrex and Valtrex respectively) and Tamsulosin with Boehringer Ingelheim / AstellasPharma (brand name Flomax). These products have a combined innovator market size exceeding US $ 3.5 Bn and theCompany is expected to launch these on an exclusive basis in 2008, 2009 & 2010 respectively. The settlements providecertainty of revenue flows and enhance product visibility for the Company going forward.
Europe posted good performance in 2007 and is expected to continue to perform well. The Company's operations acrossEurope recorded strong growth led by improved performances in UK, France and Germany. Rest of Europe and Romania,the Company's largest market in Europe performed well despite the uncertainty due to the proposed healthcare reforms.
Outlook on the Indian pharma market continues to be good. It is expected that the growth in the market would be drivenby higher volume consumption led by economic growth providing increased affordability of pharmaceutical productscoupled with a rising awareness of modern medicine. Added to that, the emerging new market segments of rural andsemi-urban areas, the initiation of organised pharmaceutical retailing and the growing medical insurance area are allset to favorably impact the Indian pharmaceutical industry. With product patent regulations in force, the Indian markethas become an attractive option for research and drug delivery system based products. In-licensing would also providea lucrative option for companies with strong distribution reach and excellent brand recognition. Ranbaxy, the leadingpharmaceutical Company in India, is well entrenched across the metro and extra urban areas and has a strong distributionand brand building skill sets. With a robust product pipeline, a number of existing and potential in-licensing productarrangements and a strong drug delivery system based product presence, the Company is well placed to capture theopportunity in the market place.
OUTLOOK ON THREATS, RISKS AND CONCERNS
The global generics business remains challenging due to increased competition from companies in emerging marketsand government led healthcare reforms that lead to short term fluctuations. On the other hand, in developed economiesInnovator Pharmaceutical companies are continually evolving ways to delay entry of generic drugs. The generic segmentas such has inherent risks with regard to patent litigation, product liability, increasing regulations and compliancerelated issues.
The manufacturing of generic pharmaceuticals is heavily regulated by governmental authorities around the world,including the US FDA. Any material non-compliance could potentially have adverse affect on manufacturing operationsat the concerned facility, on approvals of drug products in the market and for grant of approvals of new products.
In regard to some of our manufacturing facilities, the US FDA has made certain observations, most of which have beenresponded to, while a few are in the process of being addressed. Specifically in regard to the facility at Poanta Sahib(Himachal Pradesh, India), we have fulfilled our commitments made to the US FDA and await their final clearancepending which, we could continue to face delays for new product approvals from this plant. We continue to cooperatefully with the concerned authorities.
SEGMENT-WISE PERFORMANCE
Ranbaxy recorded global sales of US $ 1,619 Mn, a 21% growth over last year. Dosage form sales constituted 94% ofglobal sales as against 91% in 2006. Overseas market constituted 78% of the total sales of the Company.
INTERNAL CONTROL SYSTEMS AND ADEQUACY
There are documented and well established operating procedures in the Company and its subsidiaries in India andoverseas.
The Internal Audit function at Ranbaxy, headed by a Vice President, reports to the CEO and to the Audit Committee. Thefunction comprises of a team of well qualified and experienced professionals who conduct regular audits covering theCompany's operations in India and overseas. The Finance function of the Company is also adequately staffed withprofessionally qualified and experienced personnel.
FINANCIAL PERFORMANCE
For the year, the Company recorded consolidated global sales of Rs. 66,927 Mn, 10% higher than prior year. Profitbefore interest, depreciation and amortization was Rs. 13,581 Mn, higher than prior year by 45%. Profit before tax atRs. 9,985 Mn, was up by 53%. Profit after tax was Rs. 7,866 Mn, 53% higher than last year. While at the operating level,
Ranbaxy Laboratories Limited Annual Report 2007 Report of the Directors

40
the Company recorded a strong performance, the foreign exchange gains on traslation arising out of significant rupeeappreciation witnessed in 2007 added to the profits for the year.
Consolidated sales in dollar terms stood at US $ 1619 Mn, an increase of 21 %. The Company's sales mix skewed furthertowards the more profitable emerging markets which grew 32% and now contribute 54% of global sales. Developedmarkets at 40% of global sales recorded a growth of 13%.
HUMAN RESOURCES
Human Resources are a valuable asset for Ranbaxy and the Company seeks to attract and retain the best talent available.Human Resource management incorporates a process driven approach that invests regularly in the training anddevelopment needs of employees through succession planning, job rotation, on the job training and extensive trainingworkshops and programs.
During the year, the Company held various employee engagement programs in order to bolster employee morale,inculcate a feeling of team work and camaraderie and create a mechanism to recognise individual and team contributionsto the organisation. Programs such as Appreciate Awards and Fun@ Work encompassed employees across locationsand departments and were well received by all.
The total number of employees of the Company and its subsidiaries as on December 31, 2007 stood at 11,843.
CAUTIONARY STATEMENT:
Statements in the "Management Discussion and Analysis" describing the Company's objectives, estimates, expectationsor projections may be "forward looking statements" within the meaning of applicable laws and regulations. Actualresults could differ materially from those expressed or implied. Important factors that could make a difference to theCompany's operations, include Government regulations, patent laws, tax regimes, economic developments within Indiaand countries in which the Company conducts business, litigation and other allied factors.
Note : Global Pharmaceutical sales, Country / Region-wise sales, product and therapeutic category data(Source: IMS Health)

41
Ranbaxy Laboratories Limited Annual Report 2007 Report of the Directors
ANNEXURE B
Information regarding the Employees' Stock Option Scheme(As on December 31, 2007)
S. No. Details Nos.
1. Total No. of Options in force at the beginning of the year 6,850,980
2. Options granted in the year 2007 1,331,575
3. No. of Options vested during the year (cumulative) 15,13,005
4. No. of Options exercised during the year 281,954
5. No. of shares arising as a result of exercise of options during the year 383,865
6. No. of Options lapsed and forfeited during the year 731,645
7. Variance in terms of options N A
8. Money realized by exercise of options during the year Rs. 89,372,903
9. Total No. of Options in force at the end of the year 7,168,956
Notes :
1. The Grant/ Exercise and number of Stock Options outstanding as on June 30, 2005, have been proportionately adjusted inview of the sub-division of equity shares of the Company from the face value of Rs. 10 each into 2 equity shares of Rs. 5 each.
2. Options granted upto October 3, 2002, are entitled for additional shares keeping in view of bonus shares in the ratio of3 for 5.
Pricing formula: Closing price of the Equity Shares of the Company prior to the date of meeting of the Compensation Committee(CC) in which stock options are granted on the stock exchange on which the shares of the Company are listed. The closing priceof the shares of the Company at the National Stock Exchange of India Limited on January 16, 2007 was Rs. 429.65 per share.Accordingly, exercise price of the options granted by the CC at the meeting held on January 17, 2007 was fixed at Rs. 430 perShare of Rs. 5 each.
(i) Options granted in the year 2007 to senior managerial personnel*:
Name Designation (Present) No. ofOptions granted
Mr. Atul Sobti Chief Operating Officer and Whole-time Director 20,000
Mr. Ramesh L Adige Whole-time Director Corporate Affairs &Global Corporate Communications 10,000
Mr. Dipak Chattaraj President-Corporate Development 8,000
Mr. Peter Burema President-Global Pharmaceutical Business 15,000
Mr. Sanjeev I Dani Senior Vice President & Regional Director-Asia & CIS 8,000
Dr. Pradip Kumar Bhatnagar Sr. Vice President-New Drug Discovery Research 5,000
Mr. Ramesh Parekh Senior Vice President-Global Pharma Manufacturing 5,000
Dr. Vijay Kumar Batra Senior Vice President-Generics/NDDS/Drug Development 5,000
Dr. Naresh Kumar Senior Vice President-API Research, Manufacturing & Business 5,000
Mr. Jay Deskmukh Senior Vice President-Intellectual Property 8,000
Mr. Omesh Sethi Vice President & Head-Global Finance 4,000
Mr. Amitabh Gupta Vice President-M&A and Business Analysis 4,000
Dr. Arun K. Purohit Vice President & Head- Global Therapy Management 3,000
Mr. David Briskman Vice President and Chief Information Officer 5,000
Dr. R.Gowrishankar Vice President-Medical affairs & Clinical Research 3,000
Mr. Maninder Singh Vice President-Global Treasury and Insurance 5,000
Mr. Govind K. Jaju Vice President-Global Material Sourcing & Supply Chain 4,000
Mr. S.K. Chawla Vice President-Global Internal Audit 5,000
Mr. S.C. Agrawal Vice President-Global Taxation 4,000
Mr. Bhagwat Yagnik Vice President & Head Global Human Resources 4,000
Dr. T.G. Chandrashekhar Vice President-Global Quality 5,625
Dr. Tausif Monif Vice President-Clinical Pharmacology and Pharmacokinetics 2,250
Mr. V.K. Arora Vice President-PDR 2,250
Mr. Debashish DasGupta Vice President & Head of Finance Global Pharmaceutical Business 3,000
Mr. K.Venkatachalam Vice President & Regional Director-North America 5,000
Ms. Abha Pant Vice President-Regulatory Affairs 3,000

42
Mr. Lalit Ahluwalia Vice President & Chief Financial Officer-(Region IV) 3,000
Mr. Stephen Kaplan Vice President-HR Global Pharmaceutical Business 3,000
Mr. James Meehan Vice President, Generic Sales and Marketing (Region IV) 5,000
Mr. Ranjan Chakravarti Vice President & Regional Director-Africa & LATAM 5,000
* Excludes the Senior Managerial personnel who ceased to be in employment with the Company.
(ii) Employees who have been granted 5% of more : Nilof the options granted during the year
(iii) Employees who have been granted options during : Nilany one year equal to or exceeding 1% of the issuedcapital of the Company at the time of grant
(iv) Diluted earnings per share (EPS) : Rs. 11.31
(v) (a) Method of calculation of employee : The Company has calculated the employee compensationcompensation cost cost using the intrinsic value of the stock options
(b) Difference between the employee compensation : Rs. 285.80 Mncost so computed at (a) above and the employeecompensation cost that shall have been recognizedif it had used the fair value of the options
(c) The impact of this difference on profits and on : Profit after tax : Rs. 6,177.20 MnEPS of the Company Less : additional
employee compensationcost based on fair value : Rs. 285.80 Mn (net of tax)
Adjusted PAT : Rs. 5,891.40 Mn
Adjusted EPS (diluted) : Rs. 10.59
(vi) Weighted-average exercise price andfair value of Stock Options granted :(Post split adjusted price)
Stock Options Weighted average Weighted average Closing market pricegranted on exercise price (in Rs.) Fair value (in Rs.) at NSE on the date of
grant (in Rs.)
12.01.2001 336.50 145.00 324.15
03.12.2001 297.50 188.50 369.48
01.04.2002 372.50 226.00 449.48
07.02.2003 283.50 132.50 317.45
22.01.2004 496.00 212.50 503.10
17.01.2005 538.50 215.68 534.33
17.01.2006 392.00 194.07 391.15
17.01.2007 430.00 232.57 429.65
(vii) Description of the method and : The Black Scholes option pricing model was developedsignificant assumptions used during for estimating fair value of traded options that have nothe year to estimate the fair value of vesting restrictions and are fully transferable. Sincethe options, including the following Option pricing models require use of substantiveweighted average information : assumptions, changes therein can materially affect
fair value of Options. The option pricing models do notnecessarily provide a reliable measure of fair value ofoptions.
The main assumptions used in the Black-Scholes option pricing model during the year were as follows :
Risk free interest rate : 7.97%
Expected life of options from the date(s) of grant : 6.5 years
Expected volatility : 44.95%
Dividend yield : 1.98%
Name Designation (Present) No. ofOptions granted

43
Ranbaxy Laboratories Limited Annual Report 2007 Report of the Directors
ANNEXURE C
Information pursuant to Companies (Disclosure of Particulars in Report of Board of Directors) Rules, 1988, forming partof the Report of the Directors
1. CONSERVATION OF ENERGY AND ITS IMPACT
Measures for Conservation of Energy Impact resulting intosaving of Rs. Million
– Rebate in power tariff by maintaining unity power factor through automatic and manual control 12.55– Re-engineering of cooling tower and chiller water pumps in Utilities on the basis of head and
flow requirements 2.69– Replacement of old chiller water and cooling pumps with energy efficient pumps 2.38– Replacement of old chilled water compressors with new efficient Screw Chillers 1.17– Improvement in efficiency of boilers by fuel addititives, resulting net gain of steam to
fuel ratio from 12.04 to 12.52 kg/ltrs. This has resulted fuel savings of 3.8 %. 1.15– Replacement of Old equipments:
1) CHW / CW pumps with energy efficient pumps 0.532) 55 kW, 300 M3 / Hrs pump with 30 kW, 180 M3/Hr capacity pumps 0.323) Submersible pumps of bore wells of 30 kw motor with 22 kw motor 0.20
– All AHUs, Chillers & Cooling tower fans were provided with variable frequency drives tocontrol speed as per requirements leading to lesser wattage on part loads 1.00
– Automation of plant lighting voltage by installing Automatic Voltage regulators 0.70– Reduction in compressed air system pressure at generation point by modifying
distribution header and plugging of leakage / wastage of distribution network 0.70– Power saving achieved by installing variable frequency drives on chilled water pumps 0.58– Replacement of old reciprocating type air compressor with new efficient screw air compressor 0.45– Reduction in fuel consumption by providing De-Super heater in CHB-6A machine to heat the
feed water of boiler 0.22– Water ring vacuum pumps were replaced with efficient Vane type oil ring pumps leading to a better
vacuum and lesser energy consumption 0.20– New distribution panel for street lights at Paonta Sahib was installed for 8 different zones so as
only critical lights are switched on. 0.17
2. RESEARCH & DEVELOPMENT
a) Specific areas in which R&D is carried out
– Develop technology for Active Pharmaceutical Ingredients (APIs), key drug intermediates and, conventional & value addedinnovative dosage forms - complying to international quality & regulatory norms
– Develop "Platform Technologies" and "Products" in the area of Novel Drug Delivery Systems– Discovery and Development of new drug molecules in select areas: Infectious Diseases, Metabolic Diseases, Inflammatory/
Respiratory Diseases and Oncology– Develop herbal drugs with rationale scientific backing, involving standardization of botanical Actives, followed by their
toxicity and clinical studies– GLP/cGCP complying Bioavailability / Bioequivalence, Toxicology and Clinical Studies (Phase - I, II & III)– Innovation in packaging for improved patient convenience & compliance– Up-gradation of existing technologies / products on ongoing basis
b) Benefits derived as result of R&D activities
– Technology to manufacture APIs and Dosage Forms– Oral Controlled Release Dosage Forms leading to better patient convenience and compliance– Generation of high quality data that comply with international regulatory requirements, for registration of APIs and generic
dosage forms in India and abroad leading to speedy approvals– Improved productivity / process efficiencies– Internationally competitive prices and product quality– Safe and environment friendly processes– Generation of Intellectual wealth for the Company in key potential markets– Grant of process patents for Active Pharmaceutical Ingredients (APIs) as well as dosage forms (both conventional & novel
drug delivery systems)– Product patents in the areas of drug discovery research– Self reliance and import substitution for conservation of Foreign Exchange– Foreign exchange earnings / savings– Speed to marketplace– Enhanced business through Licensing arrangements / strategic alliances / custom synthesis– Enhanced Global presence / visibility

44
c) Future plan of action
– Continue augmenting R&D capabilities & productivity through technological innovations, use of modern scientific andtechnological techniques, training and development, benchmarking and global networking
– Greater thrust on Novel Drug Delivery Systems
– Enhanced emphasis on Complex 'difficult-to-make' products including OCRS, P-IV FTFs, and specialized segments suchas Biosimilars, Oncology/Cytotoxics, Oral Contraceptives, Respiratory and Dermatology.
– Continue developing innovative, commercially viable process know-how for both APIs and dosage forms
– Continue emphasis on Custom Synthesis to draw a greater leverage on the built-in Chemical Research infrastructure &capabilities
– Demerger of 'New Drug Discovery Research Unit' as separate entity.
– Continue strengthening the Clinical Research infrastructure and capabilities complying international GLP/cGCP norms.
– Continue improvements in packaging for pharmaceuticals to ensure shelf-life/stability, quality and, better patientconvenience and compliance
– Enhance national and international research networking and strategic alliances
d) Expenditure on R&D Rs. Million
Year ended Year endedDecember 31, December 31,
2007 2006
Capital 465.74 974.86
Revenue 4,139.44 3,863.34
3. TECHNOLOGY, ABSORPTION, ADAPTATION AND INNOVATION
a) Efforts in brief, made towards technology absorption and innovation
– As per 2(a) above
b) Benefit derived as a result of the above efforts, e.g. product improvement, cost reduction, product development
– As per 2(b) above
Future course of action
a) To continue developing innovative and commercially viable process know-how for APIs and Dosage Forms(Conventionaland Noval Drug Delivery System)
b) Information in case of imported technology (imports during the last five years)
– Not applicable
4. FOREIGN EXCHANGE EARNINGS AND OUTGO
Overseas sales (excluding sales to Nepal) were Rs. 26,341.35 Mn for the financial year December 31, 2007
– 496 product dossiers were filed with various international regulatory authorities and regulatory approvals were received for430 product dossiers
– Drug Master Files (DMFs) for APU were filed with the regulatory authorities in several markets
– Continued to receive income by way of royalty, technical and management service fee and dividend from overseas subsidiaries/affiliates
Rs. Million
Year ended Year endedDecember 31, December 31,
2007 2006
Earnings 26,608.64 27,558.67
Outgo 11,188.13 11,010.31

45
FORM - A
Form for disclosure of particulars with respect to conservation of energy
Current Year Previous Year2007 2006
A. Electricity and Fuel Consumption
1. Electricity
(a) Purchased Units (KWH) 121,271,482 106,937,832
Total Amount (Rs. Million) 481.04 428.26
Rate/Unit (Rs.) Rs. 3.97 Rs. 4.00
(b) Own Generationi) Through Diesel Generator Unit (KWH) 10,144,913 10,421,072
Unit per Ltr. of Diesel Oil 3.54 3.53
Cost/Unit Rs. 8.29 Rs. 8.42
ii) Through Steam Turbine/Generator Not Applicable Not Applicable
2. Coal (Specify quality and where used) Not Applicable Not Applicable
3. Furnace Oil Qty. (K. Ltrs.) 16,780 14,903
Total Amount (Rs Million) 329.99 274.36
Average Rate (Rs. per Ltr.) Rs. 19.67 Rs. 18.41
4. Others/internal generation Not Applicable Not Applicable
B. Consumption per unit of production
Units Standards Current Previous(if any) Year Year
ElectricityActive Pharmaceutical Ingredients (kwh per kg) No specific 58.71 54.19Dosage Forms (kwh per standards - 92.76 83.94
1000 packs) consumptionper unitdepends onproduct mix
Furnace OilActive Pharmaceutical Ingredients (Ltrs per Kg) 8.40 8.03Dosage Forms (K.Ltrs per 0.01 0.01
1000 packs)Coal Not Applicable Not ApplicableOthers Not Applicable Not Applicable

46
TEN YEARS
AT AGLANCE
Rs. Million
1998 ** 1999 2000 2001 2002 2003 2004 2005 2006 2007
Results for the year
Sales 10,640.5 15,598.3 17,366.6 20,545.4 28,197.9 35,334.9 36,143.4 35,366.5 40,587.1 41,844.9
Index 1.0 1.1 1.2 1.4 2.0 2.5 2.5 2.5 2.9 2.9
Exports 4,414.1 7,323.7 8,019.6 10,290.8 18,502.9 24,674.6 24,562.4 23,371.1 27,175.7 26,411.2
Index 1.0 1.2 1.4 1.7 3.1 4.2 4.2 4.0 4.6 4.5
Gross Profit 1,552.1 2,562.5 3,177.1 3,924.1 7,304.8 10,061.4 7,211.7 3,178.8 6,081.7 9,865.6
Index 1.0 1.2 1.5 1.9 3.5 4.9 3.5 1.5 2.9 4.8
Profit before Tax 1,240.4 2,103.8 1,945.4 2,777.7 7,133.8 9,563.7 6,283.4 2,013.6 4,429.8 7,744.1
Index 1.0 1.3 1.2 1.7 4.3 5.8 3.8 1.2 2.7 4.7
Profit after Tax 1,170.0 1,968.8 1,824.4 2,519.6 6,235.8 7,947.8 5,284.7 2,237.0 3,805.4 6,177.2
Index 1.0 1.3 1.2 1.6 4.0 5.1 3.4 1.4 2.4 4.0
Equity Dividend 560.1 869.2 869.2 1,158.9 2,434.0 $ 3,156.3 3,162.6 3,166.7 3,168.9 3,171.5
Index 1.0 1.6 1.6 2.1 4.3 5.6 5.6 5.7 5.7 5.7
Equity Dividend (%) 50 75 75 100 150 170 170 170 170 170
Earning per share (Rs.) 13.46 *** 16.99 15.74 21.86 28.86 42.61 28.26 5.68 ^ 9.87 ^ 11.31 ^
Year-end Position
Gross Block+ 8,045.6 8,675.9 9,241.5 9,278.2 10,448.8 12,470.6 16,669.4 22,321.6 24,354.5 25,889.0
Index 1.0 1.1 1.1 1.2 1.3 1.5 2.1 2.8 3.0 3.2
Net Block 6,135.5 6,319.0 6,443.7 6,130.5 6,753.9 8,017.9 11,417.4 16,328.1 17,359.1 17,969.4
Index 1.0 1.0 1.1 1.0 1.1 1.3 1.9 2.7 2.8 2.9
Net Current Assets 8,320.5 8,157.5 8,257.7 7,454.5 9,564.4 13,302.9 9,466.8 11,281.0 12,630.0 12,588.2
Index 1.0 1.0 1.0 0.9 1.1 1.6 1.1 1.4 1.5 1.5
Net Worth 14,008.3 14,979.3 15,826.5 16,069.7 18,828.1 23,217.8 25,095.1 23,773.0 23,500.1 25,383.9
Index 1.0 1.1 1.1 1.1 1.3 1.7 1.8 1.7 1.7 1.8
Share Capital 1,158.9 *** 1,158.9 1,158.9 1,158.9 1,854.5 1,855.4 1,858.9 1,862.2 1,863.4 1,865.4
Reserve & Surplus 12,849.4 13,820.4 14,667.6 14,910.8 16,973.6 21,362.3 23,236.2 21,910.8 21,636.7 23,518.6
Book value per share (Rs.) 120.9 *** 129.25 136.56 138.66 101.52 $$ 125.13 135.00 63.84 ^ 63.05 ^ 68.04 ^
No. of Employees 5469 5347 5784 6424 6297 6797 7195 7174 8020 8141
Index : No. of times
+ Includes Capital Work-in-Progress* * 9 months Apr-Dec. Indexation based on annualised figures for 9 months ended 31.12.98* * * After 1:1 Bonus Issue and conversion of outstanding warrants.$ Includes Interim Dividend Rs 5 per share, prior to issue of bonus shares and Final Dividend of Rs 10 per share$$ Post issue of Bonus shares in the ratio of 3 for 5 in October, 2002.^ After Share split
Sales are stated net of excise duty recovered from 2002 onwardsEarning per share are stated on fully diluted basis from 2002 onwards

47
To the Members of Ranbaxy Laboratories Limited
1. We have audited the attached Balance Sheet ofRanbaxy Laboratories Limited, (the "Company") asat December 31, 2007 and also the Profit and Lossaccount and the Cash Flow Statement for the yearended on the date annexed thereto (hereinaftercollectively referred to as the ‘financial statements’).These financial statements are the responsibility ofthe Company's management. Our responsibility is toexpress an opinion on these financial statementsbased on our audit.
2. We conducted our audit in accordance with theauditing standards generally accepted in India. Thosestandards require that we plan and perform the auditto obtain reasonable assurance about whether thefinancial statements are free of materialmisstatement. An audit includes examining, on a testbasis, evidence supporting the amounts anddisclosures in the financial statements. An audit alsoincludes assessing the accounting principles usedand significant estimates made by management, aswell as evaluating the overall financial statementpresentation. We believe that our audit provides areasonable basis for our opinion.
3. As required by the Companies (Auditor's Report)Order, 2003 (the ‘Order’), as amended, issued by theCentral Government of India in terms of sub-section(4A) of Section 227 of The Companies Act, 1956 (the'Act'), we enclose in the Annexure, a statement onthe matters specified in paragraph 4 and 5 of theOrder.
4. Further to our comments in the Annexure referredto above, we report that :
a) We have obtained all the information andexplanation, which to the best of our knowledgeand belief were necessary for the purpose ofour audit;
b) In our opinion, proper books of account asrequired by law have been kept by the Companyso far as appears from our examination of thosebooks;
REPORTAUDITORS’
c) The financial statements dealt with by thisreport are in agreement with the books ofaccount;
d) On the basis of written representation receivedfrom the directors, as on December 31, 2007and taken on record by the Board of Directors,we report that none of the Directors isdisqualified as on December 31, 2007 frombeing appointed as a director in terms of clause(g) of sub-section (1) of Section 274 ot the Act;
e) In our opinion and to the best of our informationand according to the explanations given to us,the financial statements, dealt with by thisreport, comply with the accounting standardsreferred to in the Companies (AccountingStandard) Rules, 2006, issued by CentralGovernment in exercise of the power conferredunder sub-section (1)(a) of Section 642 of theAct, read together with section 211 (3C) of theAct, give the information required by the Act inthe manner so required and give a true and fairview in conformity with the accounting principlesgenerally accepted in India, in the case of :
1) the Balance Sheet, of the state of affairsof the Company as at December 31, 2007;
2) the Profit and Loss Account, of the profitfor the year ended on that date; and
3) the Cash Flow Statement, of the cash flowsfor the year ended on that date.
For Walker, Chandiok & Co
Chartered Accountants
Per Vinod Chandiok
Partner
Membership No. 10093
Place : GurgaonDated : March 28, 2008

48
ANNEXURE TO THE AUDITORS’ REPORT
Annexure to the Auditors' Report of even date to the members of Ranbaxy Laboratories Limited on the financial
statements for the year ended December 31, 2007
Based on the audit procedures performed for the purpose of reporting a true and fair view of the financial statements of theCompany and taking into consideration the information and explanations given to us and the books and other records examinedby us in the normal course of audit, we report that:
(i) (a) The Company has maintained proper records showing full particulars including quantitative details and situationof fixed assets.
(b) The Company has a regular programme of physical verification of its fixed assets by which fixed assets are verfiedin a phased manner over a period of three years. In our opinion, this periodicity of physical verfification is reasonablehaving regard to the size of the Company and the nature of its fixed assets. No material discrepancies were noticedon such verification.
(c) In our opinion, a substantial part of fixed assets have not been disposed off during the year.
(ii) (a) Inventory has been physically verified by the management during the year. In our opinion, the frequency of verificationis reasonable.
(b) The procedures of physical verification of inventory followed by the management are reasonable and adequate inrelation to the size of the Company and the nature of its business.
(c) The Company is maintaining proper records of inventory and no material discrepancies were noticed on physicalverification.
(iii) (a) The Company has not granted any loans, secured or unsecured to companies, firms or other parties covered inthe register maintained under section 301 of the Act. Accordingly, the provisions of clauses 4(iii) (b) to (d) of theOrder are not applicable.
(b) The Company has not taken any loans, secured or unsecured from companies, firms or other parties covered inthe register maintained under section 301 of the Act. Accordingly, the provisions of clauses 4(iii) (f) and 4(iii) (g) ofthe Order are not applicable.
(iv) In our opinion, there is an adequate internal control system commensurate with the size of the Company and the natureof its business, for the purchase of inventory and fixed assets and for the sale of goods and services. During the courseof our audit, no major weakness has been noticed in the internal control system in respect of these areas.
(v) (a) The Company has not entered into contracts or arrangements referred to in section 301 of the Act. Accordingly,the provisions of clause 4(v) of the Order are not applicable.
(vi) The Company has not accepted any deposits from the public within the meaning of Section58A and 58AA of the Act, andthe Companies (Acceptance of Deposits) Rules, 1975. Accordingly, the provisions of clause 4 (vi) of the Order are notapplicable.
(vii) In our opinion, the Company has an internal audit system commensurate with its size and nature of its business.
(viii) We have broadly reviewed the books of account maintained by the Company pursuant to the rules made by the CentralGovernment under clause 209 (1) (d) of the Act for the maintenance of cost records in respect of Company’s productsand are of the opinion that prima facie, the prescribed accounts and records have been made and maintained. However,we have not made a detailed examination of the records with a view to determine whether they are accurate or complete.
(ix) (a) The Company is regular in depositing the undisputed statutory dues including provident fund, investor educationand protection fund, employees' state insurance, income-tax, sales-tax, wealth-tax, service-tax, customs duty,excise duty, cess and other material statutory dues as applicable with the appropriate authorities. No undisputedamounts payable in respect thereof were outstanding at the year end for a period of more than six months fromthe date they became payable.
(b) There are no amounts in respect of sales-tax, income-tax, customs duty, wealth-tax, service-tax, excise duty andcess that have not been deposited with the appropriate authorities on account of any dispute, other than thosementioned below:
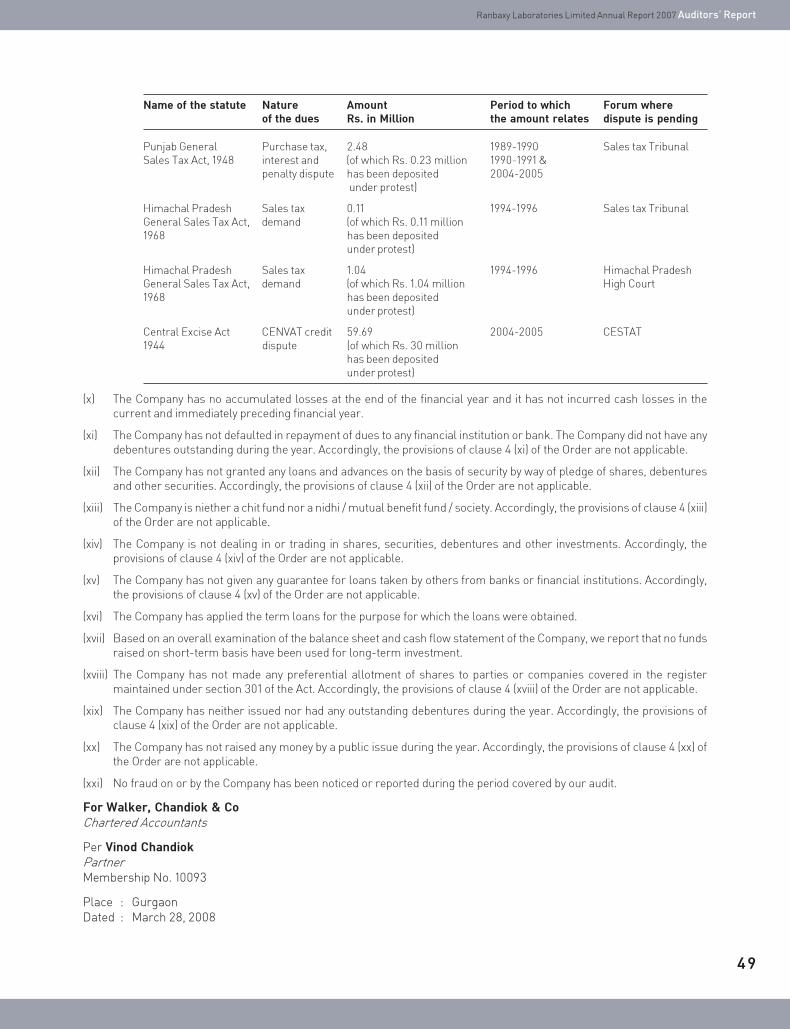
49
Name of the statute Nature Amount Period to which Forum whereof the dues Rs. in Million the amount relates dispute is pending
Punjab General Purchase tax, 2.48 1989-1990 Sales tax TribunalSales Tax Act, 1948 interest and (of which Rs. 0.23 million 1990-1991 &
penalty dispute has been deposited 2004-2005 under protest)
Himachal Pradesh Sales tax 0.11 1994-1996 Sales tax TribunalGeneral Sales Tax Act, demand (of which Rs. 0.11 million1968 has been deposited
under protest)
Himachal Pradesh Sales tax 1.04 1994-1996 Himachal PradeshGeneral Sales Tax Act, demand (of which Rs. 1.04 million High Court1968 has been deposited
under protest)
Central Excise Act CENVAT credit 59.69 2004-2005 CESTAT1944 dispute (of which Rs. 30 million
has been depositedunder protest)
(x) The Company has no accumulated losses at the end of the financial year and it has not incurred cash losses in thecurrent and immediately preceding financial year.
(xi) The Company has not defaulted in repayment of dues to any financial institution or bank. The Company did not have anydebentures outstanding during the year. Accordingly, the provisions of clause 4 (xi) of the Order are not applicable.
(xii) The Company has not granted any loans and advances on the basis of security by way of pledge of shares, debenturesand other securities. Accordingly, the provisions of clause 4 (xii) of the Order are not applicable.
(xiii) The Company is niether a chit fund nor a nidhi / mutual benefit fund / society. Accordingly, the provisions of clause 4 (xiii)of the Order are not applicable.
(xiv) The Company is not dealing in or trading in shares, securities, debentures and other investments. Accordingly, theprovisions of clause 4 (xiv) of the Order are not applicable.
(xv) The Company has not given any guarantee for loans taken by others from banks or financial institutions. Accordingly,the provisions of clause 4 (xv) of the Order are not applicable.
(xvi) The Company has applied the term loans for the purpose for which the loans were obtained.
(xvii) Based on an overall examination of the balance sheet and cash flow statement of the Company, we report that no fundsraised on short-term basis have been used for long-term investment.
(xviii) The Company has not made any preferential allotment of shares to parties or companies covered in the registermaintained under section 301 of the Act. Accordingly, the provisions of clause 4 (xviii) of the Order are not applicable.
(xix) The Company has neither issued nor had any outstanding debentures during the year. Accordingly, the provisions ofclause 4 (xix) of the Order are not applicable.
(xx) The Company has not raised any money by a public issue during the year. Accordingly, the provisions of clause 4 (xx) ofthe Order are not applicable.
(xxi) No fraud on or by the Company has been noticed or reported during the period covered by our audit.
For Walker, Chandiok & Co
Chartered Accountants
Per Vinod Chandiok
Partner
Membership No. 10093
Place : GurgaonDated : March 28, 2008
Ranbaxy Laboratories Limited Annual Report 2007 Auditors’ Report

50
On behalf of the Board of Directors
For WALKER, CHANDIOK & CO HARPAL SINGH MALVINDER MOHAN SINGH ATUL SOBTI
Chartered Accountants Chairman CEO & Managing Director Chief Operating Officer &Whole-time Director
Per VINOD CHANDIOK OMESH SETHI SUSHIL K. PATAWARI
Partner Vice President & SecretaryMembership No. 10093 Head-Global Finance
Place : GurgaonDated : March 28, 2008
FINANCIAL STATEMENTS OF
STANDALONE BALANCE SHEET
AS AT DECEMBER 31, 2007Rs. Million
Schedule 2007 2006
SOURCES OF FUNDS
SHAREHOLDERS' FUNDS
Share capital 1 1,865.35 1,863.43
Reserves and surplus 2 23,506.81 21,627.91
25,372.16 23,491.34
SHARE APPLICATION MONEY PENDING ALLOTMENT 11.76 8.79
LOAN FUNDS
Secured loans 3 3,650.68 2,242.90
Unsecured loans 4 31,379.60 29,543.10
35,030.28 31,786.00
DEFERRED TAX LIABILITY (NET) 5 2,518.92 1,502.38
62,933.12 56,788.51
APPLICATION OF FUNDS
FIXED ASSETS 6
Gross block 22,614.80 21,335.74
Less : Depreciation 7,919.59 6,995.43
Net block 14,695.21 14,340.31
Capital works-in-progress 3,274.20 3,018.79
INVESTMENTS 7 32,375.51 26,799.45
CURRENT ASSETS, LOANS AND ADVANCES
Inventories 8 9,760.71 9,549.12
Sundry debtors 9 8,829.07 10,137.45
Cash and bank balances 10 1,804.50 711.51
Other current assets 11 1,020.25 780.85
Loans and advances 12 6,886.29 3,911.01
28,300.82 25,089.94
Less:
CURRENT LIABILITIES AND PROVISIONS
Current liabilities 13 8,331.20 7,233.30
Provisions 14 7,381.42 5,226.68
15,712.62 12,459.98
NET CURRENT ASSETS 12,588.20 12,629.96
62,933.12 56,788.51
SIGNIFICANT ACCOUNTING POLICIES 25
NOTES TO THE FINANCIAL STATEMENTS 26
The schedules referred to above form an integral part of the financial statements
This is the balance sheet referred to in our report of even date.

51
Ranbaxy Laboratories Limited Annual Report 2007 Balance Sheet & Profit and Loss Account - Standalone
STANDALONE PROFIT AND LOSS ACCOUNT
FOR THE YEAR ENDED DECEMBER 31, 2007 Rs. MillionSchedule 2007 2006
INCOMEOperating income 15 43,908.35 40,140.95
Less : Excise duty 446.90 43,461.45 481.72 39,659.23
Other income 16 4,321.77 500.36
47,783.22 40,159.59
EXPENDITUREMaterials 17 17,813.13 16,323.82
Manufacturing 18 2,216.52 1,997.09
Personnel 19 4,216.14 3,310.85
Selling, general and administration 20 9,532.36 8,582.78
Research and development 21 4,139.44 3,863.35
37,917.59 34,077.89
PROFIT BEFORE INTEREST, DEPRECIATION,AMORTISATION AND IMPAIRMENT 9,865.63 6,081.70
Interest 934.26 584.44
Depreciation, amortisation and impairment 22 1,187.31 1,067.50
PROFIT BEFORE TAX 7,744.06 4,429.76
Provision for tax 23 1,566.86 624.33
PROFIT AFTER TAX 6,177.20 3,805.43
Tax - earlier years – 145.84
Balance as per last balance sheet 471.18 560.34
Transfer from foreign projects reserve 24.87 22.95
BALANCE AVAILABLE FOR APPROPRIATION 6,673.25 4,534.56
APPROPRIATIONSDividend
Interim 932.12 3,168.94
Final (proposed) 2,239.42 –
Tax on dividend 539.02 444.44
Transfer to General reserve 800.00 450.00
Surplus carried forward 2,162.69 471.18
6,673.25 4,534.56
EARNINGS PER SHARE ( Rs.) 24Basic 16.56 10.60
Diluted 11.31 9.87
SIGNIFICANT ACCOUNTING POLICIES 25
NOTES TO THE FINANCIAL STATEMENTS 26
The schedules referred to above form an integral part of the financial statements
This is the profit and loss account referred to in our report of even date.
On behalf of the Board of Directors
For WALKER, CHANDIOK & CO HARPAL SINGH MALVINDER MOHAN SINGH ATUL SOBTI
Chartered Accountants Chairman CEO & Managing Director Chief Operating Officer &Whole-time Director
Per VINOD CHANDIOK OMESH SETHI SUSHIL K. PATAWARI
Partner Vice President & SecretaryMembership No. 10093 Head-Global Finance
Place : GurgaonDated : March 28, 2008

52
On behalf of the Board of Directors
For WALKER, CHANDIOK & CO HARPAL SINGH MALVINDER MOHAN SINGH ATUL SOBTIChartered Accountants Chairman CEO & Managing Director Chief Operating Officer &
Whole-time Director
Per VINOD CHANDIOK OMESH SETHI SUSHIL K. PATAWARI
Partner Vice President & SecretaryMembership No. 10093 Head-Global Finance
Place : GurgaonDated : March 28, 2008
STANDALONE CASH FLOW STATEMENT
FOR THE YEAR ENDED DECEMBER 31, 2007 Rs. Million
2007 2006A. CASH FLOW FROM OPERATING ACTIVITIES
Net profit before taxes 7,744.06 4,429.76Adjustments for :
Depreciation, amortisation and impairment 1,187.31 1,067.50Assets written off 146.21 2.14Deferred employees compensation 15.71 26.35Unrealised foreign exchange (gain) (2,514.73) (270.74)Dividend income (9.89) (10.25)Profit on disposal of investments – (0.01)Profit on sale of assets (net) (572.57) (3.54)Provision for diminution in value of long term investments 239.00 –Interest expense 934.26 584.44Interest income (92.14) (201.05)Amounts written off 37.66 18.16Provision/ (reversal) for doubtful debts and advances (298.72) 44.74
(927.90) 1,257.74
Operating profit before working capital changes 6,816.16 5,687.50Adjustments for :
Inventories (211.59) (639.79)Sundry debtors / receivables 911.68 (2,283.67)Loans and advances (1,151.37) (451.01)Trade/other payables 1,354.26 122.66Other current assets 46.91 513.23
949.89 (2,738.58)
Net cash generated from operating activity 7,766.05 2,948.92
Direct taxes paid (net of refunds) (908.32) 205.94
Net cash from operating activities 6,857.73 3,154.86B. CASH FLOW FROM INVESTING ACTIVITIES
Purchase of fixed assets / capital works-in-progress (2,221.79) (2,158.19)Sale proceeds of assets 850.54 61.11Other investments (2,439.20) (202.00)Investment in Subsidiaries (3,375.86) (18,969.70)Sale proceeds of investments – 0.01Short term deposits / Secured loans 11.75 16.35Interest received 82.83 204.81Dividend received 9.89 10.25
Net cash used in investing activities (7,081.84) (21,037.36)C. CASH FLOW FROM FINANCING ACTIVITIES
Proceeds from issue of capital (including premium) 92.34 63.32Increase in bank borrowings 5,696.59 2,153.73Proceeds from FCCB – 19,553.60Increase in other borrowings 70.58 38.56Interest paid (896.05) (573.73)FCCB issue expenses adjusted against securities premium – (227.50)Dividend paid (3,169.35) (3,167.27)Tax on dividend (472.20) (444.20)
Net cash from financing activities 1,321.91 17,396.51
INCREASE / (DECREASE) IN CASH AND CASH EQUIVALENTS 1,097.80 (485.99)Cash and cash equivalents at the beginning 623.57 1,109.56
Cash and cash equivalents at the close 1,721.37 623.57
Notes :Cash and cash equivalents include :
Cash and cheques in hand and remittances in transit 344.23 80.48With banks in :
Current accounts [net of dividend accounts Rs. 82.42 Mn (previous year Rs. 87.06 Mn)] 267.14 103.09Deposit accounts [net of pledged Rs.0.71 Mn (previous year Rs 0.88 Mn)] 1,110.00 440.00
1,721.37 623.57This is the cash flow statement referred to in our report of even date

53
Ranbaxy Laboratories Limited Annual Report 2007 Cash Flow Statement & Schedules - Standalone
SCHEDULES FORMING PART OF THE STANDALONE FINANCIAL STATEMENTSFOR THE YEAR ENDED DECEMBER 31, 2007
Rs. MillionSCHEDULE 1 2007 2006
SHARE CAPITALAuthorised
598,000,000 (Previous year 598,000,000)Equity shares of Rs. 5 each 2,990.00 2,990.00
100,000 (Previous year 100,000 )Cumulative preference shares of Rs 100 each 10.00 10.00
3,000.00 3,000.00Issued, subscribed and paid up
373,070,829 (Previous year 372,686,964)Equity shares of Rs. 5 each fully paid 1,865.35 1,863.43
1,865.35 1,863.43SCHEDULE 2
RESERVES AND SURPLUSCapital reserve 5.41 5.41Amalgamation reserve 43.75 43.75Securities premium
As per last balance sheet 5,599.60 6,235.31Add : Received during the year * 101.79 64.69
5,701.39 6,300.00Less : Expenses on issuing of FCCB (Net of taxes) – 150.93Less : Premium payable on redemption of FCCB (Net of taxes) 690.89 549.47
5,010.50 5,599.60* Includes Rs. 14.35 million (previous year Rs. 8.59 million)
transferred from Employees Stock Options OutstandingForeign projects reserve
As per last balance sheet 62.72 85.67Less: Transfer to profit and loss account 24.87 22.95
37.85 62.72General reserve
As per last balance sheet 15,351.24 14,901.24Add : Transfer from profit and loss account 800.00 450.00
16,151.24 15,351.24Employees stock option
Employees stock options outstanding 104.94 127.96Less: Deferred employee compensation 9.57 33.95
95.37 94.01Surplus in profit and loss account 2,162.69 471.18Total 23,506.81 21,627.91
SCHEDULE 3SECURED LOANSLoans from banks 3,650.68 2,242.90
Secured against stocks, book debts and receivables,both present and future. 3,650.68 2,242.90
SCHEDULE 4UNSECURED LOANSShort term loans
Banks 8,547.48 7,611.62Long term loansZero coupon Foreign Currency Convertible Bonds (FCCB) 17,344.80 19,474.40
Banks 5,358.42 2,398.76Others 118.80 44.30
Deferred sales tax credit 10.10 14.0231,379.60 29,543.10
SCHEDULE 5DEFERRED TAX LIABILITY (NET)Deferred tax liability arising on account of :
Depreciation, amortisation and impairment 2,775.82 2,622.37FCCB loan revaluation 500.51 –Tax credit received 165.94 164.33
3,442.27 2,786.70Less: Deferred tax asset arising on account of :
Provision for:Doubtful debts and advances 213.88 199.63Leave encashment 67.64 54.66
FCCB redemption premium charged to securities premium account 638.69 278.79Tax losses carried forward – 747.79Others 3.14 3.45
923.35 1,284.322,518.92 1,502.38

54
SCHEDULES FORMING PART OF THE STANDALONE FINANCIAL STATEMENTS
FOR THE YEAR ENDED DECEMBER 31, 2007SCHEDULE 6
FIXED ASSETS Rs. Million
AccumulatedGross block Depreciation, Net Block
amortisation& impairment
Description 2006 Additions* Deletions 2007 2007 2007** 2006
TangiblesLand 421.89 18.93 39.20 401.62 – 401.62 421.89Buildings 3,055.43 234.47 296.93 2,992.97 483.21 2,509.76 2,541.20Plant and machinery 15,097.74 1,205.98 264.87 16,038.85 5,918.71 10,120.14 9,931.16Furniture and fixtures 788.62 120.34 39.04 869.92 238.66 631.26 580.57Vehicles 321.98 79.07 47.29 353.76 79.51 274.25 257.55
IntangiblesProduct development 283.30 49.71 – 333.01 30.42 302.59 283.30Patent, trade marks, designs and licences 654.86 104.65 – 759.51 646.80 112.71 47.61Software 500.92 153.24 – 654.16 341.91 312.25 226.06Non compete fee 211.00 – – 211.00 180.37 30.63 50.97
Total 21,335.74 1,966.39 687.33 22,614.80 7,919.59 14,695.21 14,340.31
Previous Year 17,993.15 3,467.83 125.24 21,335.74 6,995.43 14,340.31 11,999.68
* Additions to fixed assets during the year include Rs. 465.74 million (previous year Rs. 974.86 million) used for research and development.** The above includes the following assets held for disposal, which are being carried at the lower of their net book value and net realisable value : - Land Rs. 1.71 million, Building Rs. 24.24 million, Furniture and fixture Rs. 8.12 million, Plant and machinery Rs. 26.71 million and Vehicles Rs. 0.41 million.
SCHEDULE 7 Rs. MillionINVESTMENTS 2007 2006CURRENTTrust securities
Other than trade - unquoted41,089 US64 Bonds of Rs. 100 each (6.75% Tax Free) of the Unit Trust of India 4.11 4.11
4.11 4.11LONG TERMInvestments in shares of companies (fully paid)
Nature of Face NumbersTrade : investment value 2007 2006
QuotedZenotech Laboratories Limited Equity shares Rs. 10 7,489,536 2,000,000 1,078.33 200.00Krebs Biochemicals & Industries Limited Equity shares Rs. 10 1,050,000 – 89.25 –
1,167.58 200.00UnquotedShimal Research Laboratories Limited Equity shares Rs. 10 9,340,000 – 934.00 –Shivalik Solid Waste Management Ltd Equity shares Rs. 10 20,000 – 0.20 –Biotech Consortium India Ltd. Equity shares Rs. 10 50,000 50,000 0.50 0.50Nimbua Greenfield (Punjab) Limited Equity shares Rs. 10 250,000 250,000 2.50 2.50Jupiter Bioscience Limited Equity Warrants Rs. 10 3,177,500 – 93.42 @ –
1,030.62 3.00Other than trade :
QuotedFortis Healthcare Limited ## Equity shares Rs. 10 14,097,660 14,097,660 140.98 140.98The Great Eastern Shipping Company Ltd. Equity shares Rs. 10 500 500 0.03 0.03
141.01 141.01UnquotedReligare Insurance Holding Company Ltd. Equity shares Rs. 10 4,400,000 – 44.00 –
44.00 –Subsidiary companies
DomesticVidyut Investments Ltd. Equity shares Rs. 10 25,008,400 25,008,400 250.08 250.08Ranbaxy Drugs Ltd. Equity shares Rs. 10 3,100,020 3,100,020 31.00 31.00
10% NCRP Rs. 10 250 250 * *Ranbaxy Drugs and Chemicals Company Equity shares Rs. 10 3,100,000 3,100,000 17.25 17.25(A public company with unlimited liability)Solus Pharmaceuticals Ltd. Equity shares Rs. 10 7,000,700 3,000,700 230.01 30.01Rexcel Pharmaceuticals Ltd. Equity shares Rs. 10 5,000,000 1,000,000 210.00 10.00Gufic Pharma Ltd. Equity shares Rs. 100 4,900 4,900 535.22 535.22Ranbaxy Life Sciences Research Ltd. Equity shares Re. 1 500,000 – 0.50 –OverseasRanbaxy (Netherlands)BV., The Netherlands Shares EUR 100 3,939,716 3,939,716 25,294.52 # 21,919.16Ranbaxy (Hongkong) Ltd., Hongkong Equity shares HK $ 1 2,400,000 2,400,000 9.84 9.84Ranbaxy Pharmacie Generiques SAS, France Equity shares 9 800,000 800,000 3,400.02 3,400.02Ranbaxy (Guangzhou China) Ltd., China Capital contribution US $ 5,900,000 193.95 193.95Ranbaxy (Malaysia) Sdn. Bhd., Malaysia Ordinary shares RM 1 3,189,248 3,189,248 36.56 36.56Ranbaxy (Nigeria) Ltd.,Nigeria Ordinary shares Naira 1 13,070,648 13,070,648 7.40 7.40Ranbaxy Unichem Co. Ltd., Thailand Ordinary shares Bahts 100 206,670 206,670 21.20 21.20
30,237.55 26,461.69
32,624.87 26,809.81
Less: Provision for diminution in value of long term investments (249.36) (10.36)
32,375.51 26,799.45NOTES1. * Rounded off to Nil.2. NCRP denotes Non convertible redeemable preference shares.3. @ Paid 20% towards preferential allotment of 3,177,500 equity warrants.4. ## Previous year unquoted.5. # include Rs. 3,375.36 million paid as share application money pending allotment.

55
SCHEDULES FORMING PART OF THE STANDALONE FINANCIAL STATEMENTS
FOR THE YEAR ENDED DECEMBER 31, 2007
Ranbaxy Laboratories Limited Annual Report 2007 Schedules - Standalone
Rs. MillionSCHEDULE 8 2007 2006
INVENTORIESStores and spares 94.90 80.09Raw materials 3,679.82 3,835.11Packaging materials 369.74 424.24Finished goods
Own manufactured 3,029.95 3,098.49Others 395.77 359.98
Work-in-process 2,190.53 1,751.21
9,760.71 9,549.12SCHEDULE 9
SUNDRY DEBTORS(Considered good except where provided for)Debts outstanding for a period exceeding six monthsSecured 0.73 0.84Unsecured
Good 1,581.23 1,675.47Doubtful 222.70 156.26
1,804.66 1,832.57Other debts
Secured 208.74 231.13Unsecured 7,038.37 8,231.01
7,247.11 8,462.14
9,051.77 10,294.71Less : Doubtful and provided for 222.70 157.26
8,829.07 10,137.45
SCHEDULE 10CASH AND BANK BALANCESCash and cheques in hand 62.63 19.00Remittances in transit 281.60 61.48With scheduled banks in:
Current accounts 69.55 67.01Deposit accounts 1,110.71 440.88Unclaimed dividend accounts 82.42 87.06
With non-scheduled banks in:Current accounts 197.59 36.08
1,804.50 711.51
SCHEDULE 11OTHER CURRENT ASSETS(Unsecured, considered good except where provided for)
Export incentives accrued 660.85 463.23Exchange gain accrued on forward contracts 277.85 184.35Insurance claims 23.40 77.48Interest accrued but not due 14.13 4.82Others 62.10 80.89
1,038.33 810.77Less : Doubtful and provided for 18.08 29.92
1,020.25 780.85
SCHEDULE 12LOANS AND ADVANCES(Considered good except where provided for)
Secured 45.59 57.34Unsecured
Advances recoverable in cash or in kind or for value to be received 2,933.12 2,694.74Advance for purchase of shares of associate 1,274.82 –Due from subsidiary companies 33.02 394.68MAT credit receivable 1,179.00 381.50Prepaid income-tax 1,474.32 788.65
6,939.87 4,316.91Less : Doubtful and provided for 53.58 405.90
6,886.29 3,911.01

56
SCHEDULES FORMING PART OF THE STANDALONE FINANCIAL STATEMENTS
FOR THE YEAR ENDED DECEMBER 31, 2007Rs. Million
SCHEDULE 13 2007 2006CURRENT LIABILITIESAcceptances 0.55 7.18Interest accrued but not due on loans 51.13 12.92Sundry creditors 5,424.50 4,701.42Dues to micro and small enterprises 11.15 –Unclaimed dividend * 82.42 87.06Other liabilities 2,761.45 2,424.72
8,331.20 7,233.30* Not due for deposit to Investor education & protection fund
SCHEDULE 14PROVISIONSEmployee benefits 1,443.84 1,174.18Income-tax 1,438.52 673.25Premium payable on redemption of FCCB 1,879.05 828.26Final dividend (proposed) 2,239.42 –Interim dividend – 2,237.22Tax on dividend 380.59 313.77
7,381.42 5,226.68
SCHEDULE 15OPERATING INCOMESALES
Domestic 15,880.58 13,893.14Export 26,411.23 27,175.65
42,291.81 41,068.79Less : Trade discounts 1,578.94 1,348.28
40,712.87 39,720.51OTHERS
Royalty and technical know-how 127.15 338.26Export incentives 688.04 479.09Exchange Gain / (Loss) (Net) 2,043.39 (700.56)Sundries 336.90 303.65
3,195.48 420.4443,908.35 40,140.95
SCHEDULE 16OTHER INCOMEInterest 92.14 201.05Exchange gain (Net) on foreign currency borrowings 3,120.28 118.45Dividend 9.89 10.25Profit on sale of assets 675.07 31.03Profit on sale of long term investments – 0.01Unclaimed balances / excess provisions written back 354.63 47.55Miscellaneous 69.76 92.02
4,321.77 500.36
SCHEDULE 17MATERIALSRaw materials consumed 13,288.63 12,274.26Packaging materials consumed 1,844.76 1,703.97Finished goods purchased 3,086.31 2,792.58Increase in work in process and finished goods
Opening stockWork-in-process 1,751.21 1,732.17Finished goods
Own manufactured 3,098.49 2,704.77Others 359.98 325.75
5,209.68 4,762.69Less :Closing stock
Work-in-process 2,190.53 1,751.21Finished goods
Own manufactured 3,029.95 3,098.49Others 395.77 359.98
5,616.25 5,209.68Increase (406.57) (446.99)
17,813.13 16,323.82

57
SCHEDULES FORMING PART OF THE STANDALONE FINANCIAL STATEMENTS
FOR THE YEAR ENDED DECEMBER 31, 2007
Ranbaxy Laboratories Limited Annual Report 2007 Schedules - Standalone
Rs. Million2007 2006
SCHEDULE 18MANUFACTURINGStores and spares consumed 391.97 311.49Power and fuel 903.53 806.98Repairs and maintenance
Factory buildings 28.26 26.51Plant and machinery 72.18 67.32
Analytical charges 35.68 26.59Processing charges 718.13 701.31Excise duty 66.77 56.89
2,216.52 1,997.09
SCHEDULE 19PERSONNELSalaries,wages and bonus 3,686.44 2,876.10Contribution to provident and other funds 262.28 232.77Workmen and staff welfare 251.71 175.63Amortisation of deferred employees compensation 15.71 26.35
4,216.14 3,310.85
SCHEDULE 20SELLING, GENERAL AND ADMINISTRATIONRentals 158.46 151.32Rates and taxes 136.89 116.13Regulatory filing fee 77.85 153.90Printing and stationery 59.91 62.51Electricity and water 67.16 59.97Insurance 253.23 327.66Communication 152.50 141.05Legal and professional charges 1,545.01 1,318.90Travel and conveyance 799.05 665.45Running and maintenance of vehicles 68.76 59.77Repairs and maintenance 256.89 177.48Discounts 30.43 51.19Claims paid 477.25 826.54Freight, clearing and forwarding 1,435.61 1,438.73Advertising and sales promotion 1,636.61 1,487.10Market research expenses 757.46 572.70Conferences and meetings 79.51 81.20Commission 578.55 423.53Recruitment and training 81.43 71.94Assets written off 146.21 2.14Loss on sale of assets 98.28 10.23Amounts written off 37.66 17.90Provision for doubtful debts and advances 31.28 44.74Provision for diminution in value of long term investments 239.00 –Others 327.37 320.70
9,532.36 8,582.78

58
SCHEDULES FORMING PART OF THE STANDALONE FINANCIAL STATEMENTS
FOR THE YEAR ENDED DECEMBER 31, 2007
Rs. Million2007 2006
SCHEDULE 21
RESEARCH AND DEVELOPMENT EXPENDITURESalaries, wages and bonus 1,140.22 910.22Contribution to provident and other funds 63.13 51.84Workmen and staff welfare 51.55 56.38Raw materials consumed 1,080.05 1,078.87Consumables 508.31 427.95Power and fuel 179.86 159.41Clinical trials 362.67 510.05Rentals 61.53 61.85Printing and stationery 21.95 20.82Insurance 27.02 26.88Communication 33.80 38.11Legal and professional charges 34.60 74.59Travel and conveyance 86.42 70.22Running and maintenance of vehicles 19.87 15.11Analytical testing and processing charges 118.77 44.23Repairs and maintenance
Machinery 32.04 36.58Buildings 10.59 7.49Others 68.30 56.77
Recruitment and training 13.13 31.15Others 225.63 184.83
4,139.44 3,863.35
SCHEDULE 22
DEPRECIATION, AMORTISATION AND IMPAIRMENTDepreciationBuildings 82.77 75.16Plant and machinery 869.51 772.82Furniture and fixtures 46.30 44.59Vehicles 31.37 26.10
1,029.95 918.67AmortisationPatents, trade marks and designs 39.55 83.43Software 67.06 45.37Non-compete fee 20.33 20.03
126.94 148.83ImpairmentProduct development 30.42 –
1,187.31 1,067.50
SCHEDULE 23
PROVISION FOR TAXCurrent income-tax 863.12 351.47MAT credit entitlement (797.50) (331.50)Deferred tax 1,376.44 527.61Fringe benefit tax 124.80 76.75
1,566.86 624.33

59
SCHEDULES FORMING PART OF THE STANDALONE FINANCIAL STATEMENTS
FOR THE YEAR ENDED DECEMBER 31, 2007
Ranbaxy Laboratories Limited Annual Report 2007 Schedules - Standalone
Rs. MillionSCHEDULE 24 2007 2006
EARNINGS PER SHARENet profit attributable to equity shareholders
Profit after tax 6,177.20 3,805.43Tax-earlier years – 145.84
Net profit available for basic earnings per share 6,177.20 3,951.27
Net profit attributable to equity shareholdersNet profit available for basic earnings per share 6,177.20 3,951.27Less:Exchange gain on Foreign Currency Convertible
Bonds (Net of taxes) (1,647.03) (52.54)
Net profit available for dilutive earnings per share 4,530.17 3,898.73
No. of weighted average equity sharesBasic 372,906,747 372,595,730Effect of dilutive equity shares on account of :
– Employees stock options outstanding 682,473 746,412– Foreign Currency Convertible Bonds 27,119,165 21,546,734
Diluted 400,708,385 394,888,876
Nominal value of equity share (Rs.) 5.00 5.00EARNINGS PER SHARE (Rs.)Basic 16.56 10.60Diluted 11.31 9.87

60
SCHEDULES FORMING PART OF THE STANDALONE FINANCIAL STATEMENTS
FOR THE YEAR ENDED DECEMBER 31, 2007
SCHEDULE 25
SIGNIFICANT ACCOUNTING POLICIES
[a] Basis of preparation
The financial statements of Ranabxy Laboratories Limited (“the Company”) have been prepared to comply with the AccountingStandards referred to in the Companies (Accounting standards) Rule 2006 issued by the Central Government in exercise of thepower conferred under sub-section (I) (a) of section 642 and the relevant provisions of the Companies Act, 1956 (the 'Act'). Thefinancial statements have been prepared under the historical cost convention on accrual basis. The accounting policies havebeen consistently applied by the Company unless otherwise stated.
[b] Fixed assets
Fixed assets are stated at cost less accumulated depreciation and impairment losses. Cost comprises the purchase price andany attributable costs of bringing the asset to their working condition for their intended use.
Borrowing costs directly attributable to acquisition or construction of fixed assets, which necessarily take a substantial period oftime to get ready for their intended use are capitalised.
[c] IntangiblesPatents, Trademarks, Designs and licenses
Costs relating to patents, trademarks, designs and licenses, which are acquired, are capitalised and amortised on a straight-line basis over a period of five years.
Computer software
Software which is not an integral part of the related hardware, is classified as an intangible asset and is being amortised over aperiod of 6 years, being its estimated useful life.
Non-compete fee
Non compete fee is capitalised and amortised on a straight-line basis over the term of the non-compete agreement.
Product Development
Cost incurred for acquiring rights for product under development are recognised as intangible assets and amortised on a straight-line basis over a period of five years from the date of regulatory approval. Subsequent expenditures on development of suchproducts are also added to the cost of intangibles.
[d] Depreciation
Depreciation on fixed assets is provided on straight-line method at the rates and in the manner prescribed in Schedule XIV to the Act.
[e] Leases
Operating lease payments are recognised as an expense on a straight-line basis over the term of the lease.
[f] Investments
Investments that are readily realisable and intended to be held for not more than a year are classified as current investments. Allother investments are classified as long-term investments.
Current investments are carried at lower of cost and fair value determined on an individual investment basis. Long-terminvestments are carried at cost, however, provision for diminution in value, other than temporary, is made.
Profit/ loss on sale of investments is computed with reference to their average cost.
[g] Inventories
Inventories are valued as follows:
Raw materials, stores and spares and packaging materials
Lower of cost and net realisable value. However, materials and other items held for use in the production of finished goods arenot written down below cost if the products in which they will be used are expected to be sold at or above cost. Cost is determinedon a weighted average basis.
Finished goods
Lower of cost and net realisable value. Cost includes direct materials and labour and a proportion of manufacturing overheadsbased on normal operating capacity. Cost of finished goods includes excise duty.
Work-in-process
At cost upto estimated stage of completion. Cost includes direct materials and labour and a proportion of manufacturing overheadsbased on normal operating capacity.
Net realisable value is the estimated selling price in the ordinary course of business, less estimated costs of completion andestimated costs necessary to make the sale.

61
Where duty paid/ indigenous materials are consumed, in manufacture of products exported prior to duty-free import of materialsunder the Advance License Scheme, the estimated excess cost of such materials over that of duty free materials is carriedforward and charged to profit and loss account on consumption of such duty-free materials.
[h] Revenue recognition
Revenue is recognised to the extent that it can be reliably measured and is probable that the economic benefits will flow to theCompany.
Sale of Goods:
Revenue from sale of goods is recognised when the significant risks and rewards of ownership of the goods are transferred tothe customer and is stated net of trade discounts, excise duty, sales returns and sales tax.
Royalties, Technical Know-how and Licensing income:
Revenue is recognised on accrual basis in accordance with the terms of the relevant agreement.
Interest:
Revenue is recognised on a time proportion basis taking into account the amount outstanding and the applicable rate of interest.
Dividends:
Revenue is recognised when the right to receive is established.
[i] Research and development costs
Revenue expenditure incurred on research and development is charged to profit and loss account in the year it is incurred.
Capital expenditure is included in the respective heads under fixed assets and depreciation thereon is charged to depreciationaccount.
[j] Expenditure on regulatory approvals
Expenditure incurred for obtaining regulatory approvals and registration of products developed in-house is charged to profit andloss account.
[k] Employee stock option plan
The accounting value of stock options representing the excess of the market price on the date of grant over the exercise price ofthe shares granted under "Employees Stock Option Scheme" of the Company, is amortised as "Deferred employees compensation"on a straight-line basis over the vesting period in accordance with the SEBI (Employee Stock Option Scheme and EmployeeStock Purchase Scheme) Guidelines, 1999 and guidance note 18 "Share Based Payments" issued by Institute of CharteredAccountants of India.
[l] Foreign currency transactions
Investments in foreign entities are recorded at the exchange rate prevailing on the date of making the investment.
Transactions in foreign currencies are recorded at the rates prevailing on the date of the transaction. Monetary items denominatedin foreign currency are restated at the rate prevailing on the balance sheet date.
Exchange differences arising on the settlement of monetary items or on reporting company's monetary items at rates differentfrom those at which they were initially recorded during the year, or reported in the previous financial statements, are recognisedas income or expense in the year in which they arise.
The exchange differences arising on the forward contracts to hedge the foreign currency risk of an underlying asset or liabilityexisting on the date of the contract are recognised in the profit and loss account of the period in which the exchange rateschange, based on the difference between i) foreign currency amount of the forward contract translated at the exchange rates atthe reporting date, or the settlement date where the transaction is settled during the reporting period, and ii) the same foreigncurrency amount translated at the latter of the date of the inception of the contract and the last reporting date, as the case maybe. The premium or discount on all such contracts arising at the inception of each contract is amortised as expense or incomeover the life of the contract.
In case of forward exchange contracts which are entered into to hedge the foreign currency risk of firm commitments or highlyprobable forecast transactions, the premium or discount arising at the inception of the forward foreign currency contracts isamortised as an expense or income over the life of the contract.
Any profit or loss arising on cancellation or renewal of forward foreign exchange contracts is recognised as income or expensefor the year.
In respect of foreign currency option contracts which are entered into to hedge highly probable forecasted transactions the costof these contracts, if any, is expensed over the period of the contract. Any profit or loss arising on settlement or cancellation ofcurrency options is recognised as income or expense for the period in which settlement or cancellation takes place. The effectof these currency option contracts outstanding at the year-end, in the form of unrealised gains/losses, is not recognised.
SCHEDULES FORMING PART OF THE STANDALONE FINANCIAL STATEMENTS
FOR THE YEAR ENDED DECEMBER 31, 2007
SCHEDULE 25
SIGNIFICANT ACCOUNTING POLICIES (Contd.)
Ranbaxy Laboratories Limited Annual Report 2007 Schedules - Standalone

62
Representative offices
In translating the financial statements of representative offices, the monetary assets and liabilities are translated at the rateprevailing on the balance sheet date; non monetary assets and liabilities are translated at exchange rates prevailing at the dateof the transaction and income and expense items are converted at the respective monthly average rates.
[ m ] Employees benefits
Liabilities in respect of defined benefit plans other than provident fund schemes are determined based on actuarial valuationmade by an independent actuary as at the balance sheet date. The actuarial gains or losses are recognised immediately in theprofit and loss account. In respect of provident fund schemes, administered by the trusts, liability is recognised for any shortfallin the plan assets vis-à-vis the fund obligation.
Contribution towards the defined contribution plans are recognised in the profit and loss account on accrual basis.
[n] Taxes on income
Tax expenses comprises current tax, deferred tax and fringe benefit tax.
The provision for current income tax is the aggregate of the balance provision for tax for three months ended March 31, 2007 andthe estimated provision based on the taxable profit of remaining nine months up to December 31, 2007, the actual tax liability, forwhich, will be determined on the basis of the results for the period April 1, 2007 to March 31, 2008.
Deferred income tax reflects the impact of current year timing differences between taxable income/ losses and accounting incomefor the year and reversal of timing differences of earlier years. Deferred tax is measured based on the tax rates and the tax lawsenacted or substantively enacted at the balance sheet date. Deferred tax assets are recognised only to the extent that there isreasonable certainty that sufficient future taxable income will be available against which such deferred tax assets can be realised.In respect of carry forward losses and unabsorbed depreciation, deferred tax assets are recognised only to the extent there isvirtual certainty that sufficient future taxable income will be available against which such deferred tax assets can be realised.
Provision for Fringe Benefit Tax for the year has been determined in accordance with the provisions of section 115 WC of theIncome Tax Act, 1961.
[o] Export benefits/ incentives
Export entitlements under the Duty Entitlement Pass Book ("DEPB") Scheme are recognised in the profit and loss account whenthe right to receive credit as per the terms of the scheme is established in respect of the exports made.
Obligation / entitlements on account of Advance License Scheme for import of raw materials are accounted for on purchase ofraw materials and / or export sales.
[p] Contingent liabilities and provisions
The Company makes a provision when there is a present obligation as a result of a past event where the outflow of economicresources is probable and a reliable estimate of the amount of obligation can be made. A disclosure is made for possible orpresent obligations that may but probably will not require outflow of resources or where a reliable estimate cannot be made, asa contingent liability in the financial statements.
[q] Use of estimates
In preparing Company's financial statements in conformity with accounting principles generally accepted in India, managementis required to make estimates and assumptions that affect the reported amounts of assets and liabilities and the disclosure ofcontingent liabilities at the date of the financial statements and the reported amounts of revenues and expenses during thereporting period. Actual results could differ from those estimates. Any revisions to accounting estimates is recognisedprospectively in current and future periods.
[r] Earnings per share
Basic earnings per share is calculated by dividing the net profit or loss for the period attributable to equity shareholders by theweighted average number of equity shares outstanding during the period. The weighted average number of equity sharesoutstanding during the period are adjusted for events of bonus issue and share split.
For the purpose of calculating diluted earnings per share, the net profit or loss for the period attributable to equity shareholdersand the weighted average number of shares outstanding during the period are adjusted for the effects of all dilutive potentialequity shares.
[s] Impairment of assets
The Company on an annual basis tests the carrying amount of assets for impairment so as to determine :
a) the provision for impairment loss, if any, or
b) the reversal, if any, of impairment loss recognised in previous periods. Such impairment loss or reversal is recognised in theprofit and loss account for the year.
SCHEDULES FORMING PART OF THE STANDALONE FINANCIAL STATEMENTS
FOR THE YEAR ENDED DECEMBER 31, 2007
SCHEDULE 25
SIGNIFICANT ACCOUNTING POLICIES (Contd.)

63
SCHEDULES FORMING PART OF THE STANDALONE FINANCIAL STATEMENTS
FOR THE YEAR ENDED DECEMBER 31, 2007
Ranbaxy Laboratories Limited Annual Report 2007 Schedules - Standalone
SCHEDULE 26
NOTES TO THE FINANCIAL STATEMENTS
1. Share capital
a] Share capital includes :
[i] 293,698,988 (Previous year 293,698,988) Equity shares of Rs. 5 each allotted as fully paid bonus shares bycapitalisation out of securities premium and reserves.
[ii] 6,562,308 (Previous year 6,562,308) Equity shares of Rs. 5 each allotted as fully paid up pursuant to contractwithout payment being received in cash.
b] Outstanding stock options for equity shares of the Company under the "Employees' Stock Option Scheme" :
Date of grant Exercise price 2007 2006
Rs. Rs. Numbers Numbers
January 12, 2001* 336.50 (210.31) 72,887 (116,619) 101,397 (162,235)
December 3, 2001* 297.50 (185.94) 161,551 (258,482) 233,532 (373,651)
April 1, 2002* 372.50 (232.81) 291,027 (465,643) 383,180 (613,088)
February 7, 2003 283.50 – 833,919 – 997,739 –
January 22, 2004 496.00 – 1,547,602 – 1,735,742 –
January 17, 2005 538.50 – 2,034,100 – 2,288,440 –
January 17, 2006 392.00 – 982,120 – 1,110,950 –
January 17, 2007 430.00 – 1,245,750 – – –
7,168,956 (840,744) 6,850,980 (1,148,974)
* The figures in parenthesis represents adjusted exercise price in accordance with the Employees Stock Option Schemeof the company on account of issue of bonus shares in the ratio of 3:5 on October 11, 2002.
2. Fixed assets
a] Land includes :
(i) cost of leasehold land Rs. 226.19 million (Previous year Rs. 207.92 million).
(ii) freehold land, valued at Rs. 12.24 million (Previous year Rs. 12.24 million) purchased alongwith building etc.
(iii) cost of land Rs. 26.56 million (Previous year Rs. 27.06 million) pending registration in the name of the Company.
b] Buildings include Rs. 500 (Previous year Rs. 500) representing unquoted fully paid shares of Rs. 50 each in a co-operativehousing society.
c] Capital works-in progress includes:
(i) advances to vendors Rs. 50.38 million (Previous year Rs. 45.86 million).
(ii) pre-operative expenses Rs. 305.39 million (Previous year Rs. 217.60 million) as detailed below :
Rs. Million
Description 2007 2006
Opening balance 217.60 156.79
Add : Addition during the year
Salaries, wages and bonus 62.08 38.54
Contributions to provident and other funds 5.08 3.03
Workmen and staff welfare 1.64 1.45
Raw materials 7.65 2.03
Power and fuel 19.53 37.23
Insurance 1.70 2.48
Others 19.58 13.11
334.86 254.66
Less : Capitalised during the year 29.47 37.06
Balance 305.39 217.60
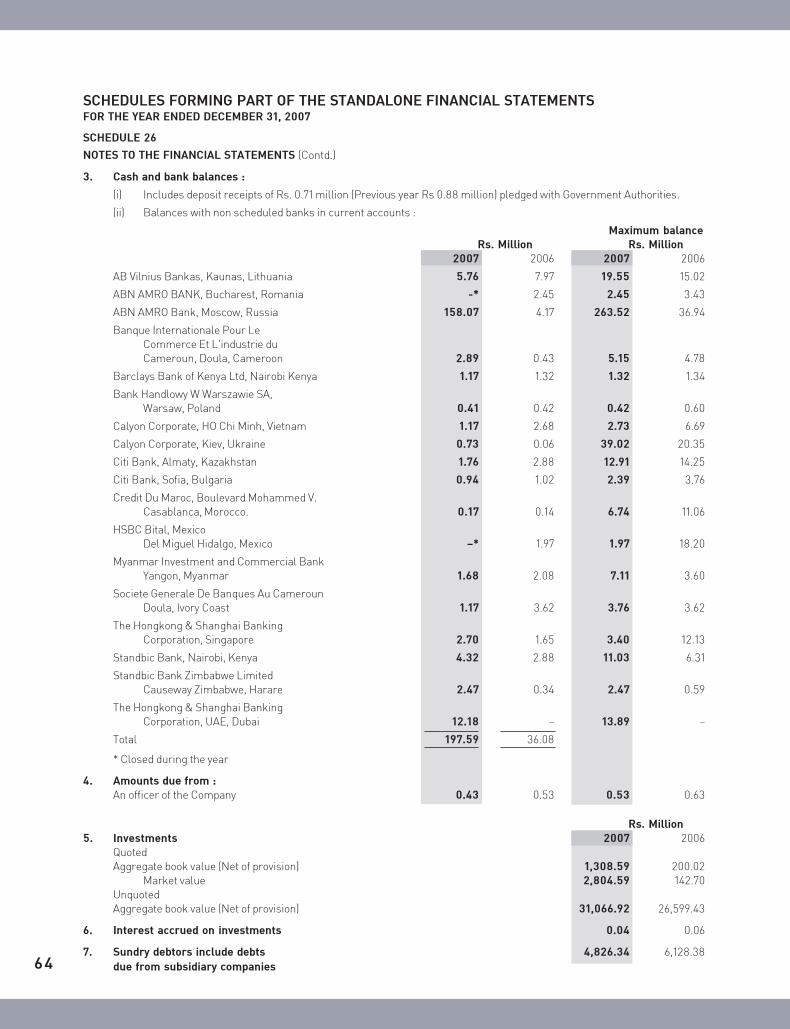
64
SCHEDULES FORMING PART OF THE STANDALONE FINANCIAL STATEMENTS
FOR THE YEAR ENDED DECEMBER 31, 2007
SCHEDULE 26
NOTES TO THE FINANCIAL STATEMENTS (Contd.)
3. Cash and bank balances :
(i) Includes deposit receipts of Rs. 0.71 million (Previous year Rs 0.88 million) pledged with Government Authorities.
(ii) Balances with non scheduled banks in current accounts :
Maximum balanceRs. Million Rs. Million
2007 2006 2007 2006
AB Vilnius Bankas, Kaunas, Lithuania 5.76 7.97 19.55 15.02
ABN AMRO BANK, Bucharest, Romania -* 2.45 2.45 3.43
ABN AMRO Bank, Moscow, Russia 158.07 4.17 263.52 36.94
Banque Internationale Pour LeCommerce Et L'industrie duCameroun, Doula, Cameroon 2.89 0.43 5.15 4.78
Barclays Bank of Kenya Ltd, Nairobi Kenya 1.17 1.32 1.32 1.34
Bank Handlowy W Warszawie SA,Warsaw, Poland 0.41 0.42 0.42 0.60
Calyon Corporate, HO Chi Minh, Vietnam 1.17 2.68 2.73 6.69
Calyon Corporate, Kiev, Ukraine 0.73 0.06 39.02 20.35
Citi Bank, Almaty, Kazakhstan 1.76 2.88 12.91 14.25
Citi Bank, Sofia, Bulgaria 0.94 1.02 2.39 3.76
Credit Du Maroc, Boulevard Mohammed V.Casablanca, Morocco. 0.17 0.14 6.74 11.06
HSBC Bital, MexicoDel Miguel Hidalgo, Mexico –* 1.97 1.97 18.20
Myanmar Investment and Commercial BankYangon, Myanmar 1.68 2.08 7.11 3.60
Societe Generale De Banques Au CamerounDoula, Ivory Coast 1.17 3.62 3.76 3.62
The Hongkong & Shanghai BankingCorporation, Singapore 2.70 1.65 3.40 12.13
Standbic Bank, Nairobi, Kenya 4.32 2.88 11.03 6.31
Standbic Bank Zimbabwe LimitedCauseway Zimbabwe, Harare 2.47 0.34 2.47 0.59
The Hongkong & Shanghai BankingCorporation, UAE, Dubai 12.18 – 13.89 –
Total 197.59 36.08
* Closed during the year
4. Amounts due from :An officer of the Company 0.43 0.53 0.53 0.63
Rs. Million5. Investments 2007 2006
QuotedAggregate book value (Net of provision) 1,308.59 200.02
Market value 2,804.59 142.70UnquotedAggregate book value (Net of provision) 31,066.92 26,599.43
6. Interest accrued on investments 0.04 0.06
7. Sundry debtors include debts 4,826.34 6,128.38due from subsidiary companies

65
SCHEDULES FORMING PART OF THE STANDALONE FINANCIAL STATEMENTS
FOR THE YEAR ENDED DECEMBER 31, 2007
SCHEDULE 26
NOTES TO THE FINANCIAL STATEMENTS (Contd.)
Ranbaxy Laboratories Limited Annual Report 2007 Schedules - Standalone
Rs. Million2007 2006
8. Loans and advances include :Secured loans to employees 45.59 57.34Unsecured loans/advances to subsidiary companies 33.02 394.68Advances recoverable in cash or in kind or for value tobe received include dues from :
Employees 107.00 83.36Suppliers 144.84 148.87Security deposits with government department 58.21 55.76
9. Loans due for repayment within one year 9,265.06 7,615.53
10. Sundry creditors include due to :a] Subsidiary companies 381.38 188.53b] Small scale industrial undertakings 197.76 141.08
Total outstanding dues of small scale industrial undertakings have been determined to the extent such parties have beenidentified on the basis of information available with the Company. The parties to whom the Company owes amounts greaterthan Rs. 100,000/- outstanding for more than 30 days as at the balance sheet date are:
Aegis Ampoules & Vials Ltd. Ammonia Supply Co. Arpit Plastics Pvt. Ltd. Aakas Plastics Pvt. Ltd.Best Laboratories Ltd. Bhasin Packwell Pvt. Ltd. ESPI Industries & Chemicals Glide Chem Pvt. Ltd.Kab Corporation K K Alufoil Maral Labs. Mayura OffsetMetakaps Engg. Co. NBZ Pharma Ltd. NEC Packaging Ltd. Nitin Lifesciences Ltd.Noble Printing Press NPP Printing -N-Packaging Orient Pack & Prints Pragti Pack India Pvt. Ltd.Pro Laboratories Pvt. Ltd. Promed Laboratories Pvt. Ltd. Rexcin Pharmaceuticals Pvt. Ltd. Shree PackersSidmak Laboratories (India) Pvt. Ltd. Sri Venkatesa Packaging Industry Themis Laboratories Pvt. Ltd. Treveni Polymers Pvt. Ltd.Update Prints Vectra Pharmaceuticals Pvt. Ltd. Viral Rondo Form Trays Industries Vyankatesh Packaging
11. The Company has identified Micro, Small and Medium Enterprises on the basis of information made available. As at December31, 2007 there are no dues to Micro, Small and Medium Enterprises that are reportable under the MSMED Act, 2006.
Rs. Million2007 2006
12. Interest income :
Interest on
Current investments - other than trade 0.28 0.28
Income-tax refunds 14.11 56.88
Loans and deposits:
Short term deposits 59.32 108.91
Long term deposits 10.50 10.50
Subsidiary companies 4.32 15.37
Employees loans 3.52 4.18
Others 0.09 4.93
92.14 201.05
13. Dividend from investments :
Long term
Other than trade 0.01 0.01
Subsidiary companies 9.88 10.24
9.89 10.25
14. Tax deducted at source on :
Interest received 15.99 24.29
Dividend received 0.48 0.42
15. Interest paid on fixed period loans 874.37 499.12

66
SCHEDULES FORMING PART OF THE STANDALONE FINANCIAL STATEMENTS
FOR THE YEAR ENDED DECEMBER 31, 2007
SCHEDULE 26
NOTES TO THE FINANCIAL STATEMENTS (Contd.)Rs. Million
2007 200616. Donation to political parties:
a] Shiromani Akali Dal 4.00 –
b] Punjab Pradesh Congress Committee 4.00 –
17. Premium on outstanding forward exchangecontracts to be recognised in the subsequent year 86.27 216.36
18. Payment to auditorsa] Statutory auditors
Audit feeStatutory 6.00 5.50Tax 2.68 2.08
Other mattersTaxation 0.09 0.01Certification 2.03 1.72Travel and out of pocket 1.57 0.27Service tax 1.48 1.24
13.85 10.82b] Cost auditors
Audit fee 0.47 0.45Certification 0.48 –Travel and out of pocket 0.07 0.01Service tax 0.12 0.06
1.14 0.52
19. Taxes earlier years includes:Current tax – (310.17)
Deferred tax – 164.33
– (145.84)
20. DividendFinal dividend (proposed) includes Rs. 0.99 million on 165,660 shares (previous year Rs.1.10 million on 183,714 shares) estimatedto be allotted under the Employees Stock Option Scheme.
21. Share-based compensationIn accordance with the guidance note - 18 "Employees share base payment" the following information relates to the stockoptions granted by the Company.
2007
Weighted- Weighted-average average
Range of exercise remainingStock options exercise prices price contractual life
(numbers) (Rs.) (Rs.) (years)
Outstanding, beginning of the year 6,850,980 283.50-538.50 446.35 7.35
Granted during the year 1,331,575 430.00 430.00 9.05
Forfeited during the year (437,184) 283.50-538.50 472.46 –
Exercised during the year (281,954) 283.50-538.50 317.05 –
Lapsed during the year (294,461) 283.50-538.50 459.64 –
Outstanding, end of the year 7,168,956 283.50-538.50 446.52 6.87
Exercisable at the end of the year 3,238,112 283.50-538.50 435.42 6.00

67
SCHEDULES FORMING PART OF THE STANDALONE FINANCIAL STATEMENTS
FOR THE YEAR ENDED DECEMBER 31, 2007
SCHEDULE 26
NOTES TO THE FINANCIAL STATEMENTS (Contd.)
Ranbaxy Laboratories Limited Annual Report 2007 Schedules - Standalone
2006
Weighted- Weighted-average average
Range of exercise remainingStock options exercise prices price contractual life
(numbers) (Rs.) (Rs.) (years)
Outstanding, beginning of the year 6,704,838 283.50 – 538.50 456.13 8.01
Granted during the year 1,221,300 392.00 392.00 9.05
Forfeited during the year (676,430) 283.50 – 538.50 472.42 –
Exercised during the year (181,883) 283.50 – 538.50 315.26 –
Lapsed during the year (216,845) 283.50 – 538.50 471.18 –
Outstanding, end of the year 6,850,980 283.50 – 538.50 446.35 7.35
Exercisable at the end of the year 2,282,437 283.50 – 538.50 417.60 6.52
The following table summarises information about stock options outstanding as at December 31, 2007:
Options outstanding Options exercisable
Range of Number of Weighted Weighted Number of Weightedexercise prices outstanding average average outstanding average
remaining exercise exercisecontractual life price price
Upto Rs 283.50 833,919 5.10 283.50 606,453 283.50
Rs 284.00-Rs 392 1,507,585 6.63 375.43 746,292 359.36
Rs 393.00-Rs 538.50 4,827,452 7.24 496.88 1,885,367 514.39
7,168,956 6.87 446.52 3,238,112 435.42
The following table summarises the assumptions used in calculating the fair value in the year ended December 31, 2007 and 2006:
2007 2006
Dividend yield 1.98 percent 2.17 percent
Expected life 6.5 years 6.5 years
Risk free interest rate 7.97 percent 7.55 percent
Volatility 44.95 percent 40.55 percent
22. Employee benefits
During the year, the Company has adopted Accounting Standard 15 (Revised 2005) 'Employees Benefits'. Since the Company wasalready using the Projected Unit Credit Method and other assumptions as per the market, hence no change has been adjusted tothe opening balance of reserves and surplus.
For the below mentioned defined benefits schemes :
a. Pension
b. Contribution to Gratuity Fund Trust
c. Provident Fund
d. Leave Encashment
Actuarial valuation of pension, leave encashment and gratuity have been done with the following assumptions.
Particulars Pension Leave Encashment Gratuity(Unfunded) (Unfunded) (Funded)
Discount rate 8% 8% 8%
Rate of increase in Compensation levels 5.5% 5.5% 5.5%
Rate of return of plan assets N.A. N.A. 8%
Expected Average remaining working lives of employees (years) 21.43 21.38 - 24.35 21.43 - 24.34

68
Rs. Million
Change in the present value of obligation : Pension Leave Provident GratuityEncashment Fund
(Unfunded) (Unfunded) (Funded) (Funded)
Present value of obligation as at January 1,2007 957.65 153.70 1,579.71 314.57
Interest Cost 76.61 12.30 143.19 24.42
Current Service Cost 158.86 31.61 Nil 29.90
Contribution
Employeer Nil Nil 88.29 Nil
Employee Nil Nil 184.87 Nil
Benefits paid (25.70) (48.38) (176.92) (27.46)
Actuarial (gain)/loss on obligations 38.07 37.55 Nil 37.45
Present value of obligation as at December 31,2007 1,205.49 186.78 1,819.14 378.88
Change in the Fair value of Plan Assets : Provident Fund Gratuity(Funded) (Funded)
Fair value of Plan Assets at January 1,2007 1,625.65 314.57
Actual Return on Plan Assets 141.70 24.35
Contributions 273.16 43.06
Benefits paid (176.92) (27.46)
Fair value of Plan Assets at December 31,2007 1,863.59 354.52
The fair value of the plan assets under the provident fund schemes has been determined at amounts based on their value at thetime of redemption, assuming a constant rate of return to maturity.
Reconciliation of present value of defined benefit obligation and the fair value of assets Gratuity(Funded)
Present value of funded obligation as at December 31, 2007 378.88
Fair value of Plan Assets as at the end of the period funded status 354.52
Present value of unfunded obligation as at December 31, 2007 24.36
Unfunded Net Liability recognised in Balance Sheet 24.36
Expenses recognised in the Profit and Loss Account Pension Leave Encashment Gratuity(Unfunded) (Unfunded) (Funded)
Current Service Cost 158.86 39.80 29.90
Interest Cost 76.61 12.30 24.42
Expected Return on Plan Assets – – (25.50)
Settlement Cost/Credit (9.57) (3.96) (1.75)
Net actuarial (gain)/loss recognised in the period 38.07 37.55 38.61
Total Expenses recognised in the Profit & Loss Account 263.97 85.69 65.68
Duirng the year the Company has recognised an expense of Rs.137.99 million towards Provident Fund schemes.
The major categories of plan assets as a percentage of total plan assets are as under:
Particulars Provident GratuityFund
Central Government secutiries 10% 15%
State Government securities 12% 10%
Bonds and securities of public sector / Financial Institutions 61% 56%
Deposit with Reserve Bank of India 17% 19%
SCHEDULES FORMING PART OF THE STANDALONE FINANCIAL STATEMENTS
FOR THE YEAR ENDED DECEMBER 31, 2007
SCHEDULE 26
NOTES TO THE FINANCIAL STATEMENTS (Contd.)

69
SCHEDULES FORMING PART OF THE STANDALONE FINANCIAL STATEMENTS
FOR THE YEAR ENDED DECEMBER 31, 2007
SCHEDULE 26
NOTES TO THE FINANCIAL STATEMENTS (Contd.)
Ranbaxy Laboratories Limited Annual Report 2007 Schedules - Standalone
23. Derivatives
The Company uses Forward Contracts, Options and Swaps to hedge its risks associated with fluctuations in Foreign currencies andInterest rates relating to foreign currency liabilities, certain firm commitments and some forecasted transactions related to foreigncurrency trade. The use of Forward Contracts, Options and Swaps is governed by Company’s overall strategy. The Company doesnot use forward Contracts, Options and Swaps for speculative purposes. The following are outstanding forward contracts, optionsand swaps as on December 31, 2007:
Rs. Million
20071] For hedging currency risks
Forward covers :
Receivables 13,062.37
Payables 567.81
Loans 6,399.80
Options & Swaps
Receivables 11,352.96
Loans 4205.26
2) During the year 2007 the Company has entered into floating to fixed interest rate swap to hedge its exposure on JPYLIBOR related to its external commercial borrowing aggregating to JPY 9.35 billion.
The year end foreign currency exposures that have not been hedged by a derivative instrument or otherwise are givenbelow :
Rs. Million
2007
Receivables 167.36
Payables 1,370.59
Loans (including FCCB) 25,790.44
Rs. Million
2007 200624. a] Directors' remuneration*
Salaries and allowances 149.50 77.76
Contribution to provident and other funds 8.92 5.76
Directors' fee 2.42 2.91
Commission 144.00 38.90
Perquisites 7.51 7.77
312.35 133.10
* Exclusive of provision for future liabilities in respect of gratuity, leave encashment (which are based on actuarial valuationdone on overall Company basis) and amortisation of deferred employees compensation on grant of stock options under"Employees Stock Option Scheme" of the Company.
Exclusive of pension paid/ payable to a non-executive director for the services rendered in earlier years as a whole timedirector/ employee Rs. 2.29 Million (Previous year Rs. 2.29 Million)
Excludes Rs.2.55 million (Previous year Nil) paid as gratuity to a director upon his separation by the gratuity trust set upby the Company.

70
SCHEDULES FORMING PART OF THE STANDALONE FINANCIAL STATEMENTS
FOR THE YEAR ENDED DECEMBER 31, 2007
SCHEDULE 26
NOTES TO THE FINANCIAL STATEMENTS (Contd.)
b] Determination of net profits in accordance with the provisions of section 349 of the Companies Act, 1956 andcommission payable to directors.
Rs. Million2007
Profit before tax as per profit and loss account 7,744.06
Less:Profit on sale of fixed assets 675.07
7,068.99
Add:
Directors' remuneration (including commission) 312.35
Other payments
Pension 2.29
Loss on sale of fixed assets 102.50
Assets written off 146.21
563.35
Net Profit 7,632.34
Commission to directors :
(As determined by the Board of Directors)
Whole-time 144.00
Others 10.45
154.45
Rs. Million2007 2006
25. Contingent liabilitiesClaims not acknowledged as debts * 1,460.46 1,145.80Indirect taxes* 234.22 216.45Bills purchased/discounted under letters of credit 1.76 –
* Includes Rs. 348.57 million (Previous year Rs.334.44 million) deposited under protest.
Interest on certain claims may be payable as and when the outcome of the related claimis determined and has not been included above.
26. Estimated amount of contracts remaining to be executed on capital account andinvestments not provided for, net of advances. 662.08 232.19
27. Leases
Operating LeaseThe Company has leased facilities under non-cancelable operating leases.The future lease payments in respect these leases as at December 31, 2007and December 31, 2006 are:
Minimum lease payments :
a. not later than one year 17.60 16.35
b. later than one year but not later than five years 80.77 77.26
c. later than five years 42.11 63.22
140.48 156.83

71
28. Related party disclosures
a ] Relationship :
i ) Subsidiary companies
DomesticRanbaxy Drugs and Chemicals Company Rexcel Pharmaceuticals Limited Ranbaxy Drugs Limited
(A public company with unlimited liability) Gufic Pharma Limited Vidyut Investments Limited
Solus Pharmaceuticals Limited Ranbaxy Life Sciences Research Limited # Solrex Pharmaceuticals Company #
(A Partnership firm)
OverseasRanbaxy (Netherlands) BV, The Netherlands Ranbaxy NANV, The Netherlands Ranbaxy Pharmaceuticals BV, The Netherlands*
Ranbaxy (Hong Kong) Limited, Hong Kong Ranbaxy (Poland) S. P. Zoo, Poland Ranbaxy Ireland Limited, Ireland
Ranbaxy Inc., USA Ranbaxy Nigeria Limited, Nigeria Ranbaxy (S.A.) Proprietary Limited, South Africa
Ranbaxy Egypt (L.L.C.), Egypt Ranbaxy Europe Limited, U.K. Ranbaxy Holdings (UK) Ltd., U.K
Ranbaxy (Guangzhou China) Limited, China Ranbaxy (UK) Limited, U.K Ranbaxy Do Brazil Ltda, Brazil
Ranbaxy Farmaceutica Ltda, Brazil Basics GmbH , Germany. Laboratorios Ranbaxy, S.L., Spain
Ranbaxy Signature, LLC. USA ZAO Ranbaxy, Russia Ranbaxy Vietnam Company Ltd., Vietnam
Ranbaxy Panama SA, Panama * Unichem Distributors Ltd., Thailand * Ranbaxy Pharmacie Generiques SAS, France
Ranbaxy PRP(Peru) SAC Office Pharmaceutique Industriel et Hospitalier SARL Ranbaxy Pharmaceuticals Canada Inc., Canada
Ranbaxy Australia Pty Ltd., Australia Unichem Pharmaceuticals Ltd., Thailand * Sonke Pharmaceuticals (Pty) Ltd., South Africa
Lapharma GmbH, Germany Ranbaxy Pharmaceuticals, Inc. USA Bounty Holdings Company Limited, Thailand *
Ranbaxy Unichem Company Ltd., Thailand Ranbaxy Laboratories Inc., USA Ranbaxy Mexico S.A.de C.V.
Ranbaxy USA, Inc. Ohm Laboratories, Inc, USA Ranbaxy Portugal - Com E Desenvolv De Prod
Ranbaxy Italia S.p.A Ranbaxy Hungary Gyogyszereszet Kft, Hungary Farmaceuticos Unipessoal Lda, Portual
Ranbaxy (Malaysia) Sdn. Bhd., Malaysia Mundogen Farma S.A., Spain $ Ranbaxy Beligium N.V., Belgium
Terapia S.A., Romania Terapia Distributie S.R.L., Romania Be-Tabs Pharmaceuticals (Proprietary) Ltd. #
Be-Tabs Investments (Proprietary) Ltd. # Ranbaxy Pharma AB, Sweden
# New entities in 2007
* Liquidated during the year
$ Merged with Laboratorios Ranbaxy, S.L.Spain effective October 1, 2007
ii) Joint ventureOverseasNihon Pharmaceuticals Industry Co. Ltd., Japan
iii) AssociateZenotech Laboratories Limited effective November 23, 2007Shimal Research Laboratories Limited effective February 5, 2007
iv) Key management Relatives* Entities over which significantpersonnel influence is exercised
Mr. Malvinder Mohan Singh Mrs. Nimmi Singh, mother Fortis Healthcare Ltd.(Including its subsidiaries)
SRL Ranbaxy Ltd.
International Hospitals Ltd.
Religare Securities Ltd.
Ran Air Services Ltd.
Religare Travels (India) Ltd.(Formerly known as Spectrum Travels (India) Ltd.
Escorts Heart Institute and Research Center Ltd.
Fortis Clinical Research Limited
Dr. Brian W. Tempest –
Mr. Ramesh L Adige –
Mr. Atul Sobti ** –
Mr. Ram S. Ramasundar ** –
* Relatives of key management personnel with whom the Company had transactions during the year.** For part of the year
SCHEDULES FORMING PART OF THE STANDALONE FINANCIAL STATEMENTS
FOR THE YEAR ENDED DECEMBER 31, 2007
SCHEDULE 26
NOTES TO THE FINANCIAL STATEMENTS (Contd.)
Ranbaxy Laboratories Limited Annual Report 2007 Schedules - Standalone

72
SCHEDULES FORMING PART OF THE STANDALONE FINANCIAL STATEMENTS
FOR THE YEAR ENDED DECEMBER 31, 2007
SCHEDULE 26
NOTES TO THE FINANCIAL STATEMENTS (Contd.)
b] The following transactions were carried out with related parties in the ordinary course of business.
i) Subsidiary companies, joint ventures and associates.
Rs. Million
2007 2006
Purchase of materials/finished goods 52.41 16.69
Sale of finished goods 15,889.43 15,774.68
Services rendered/other receipts 6.51 –
Market authorisation fee received 70.00 63.40
Sale of raw, packaging materials and stores & spares 9.26 –
Services availed and sharing of expenses 0.12 110.88
Market research expenses 744.67 559.84
Business support expenses – 301.65
Sale of assets 2.56 –
Analytical testing charges 42.37 1.57
Procurement cost of exhibit batches 129.93 127.86
Product quality claim 279.89 393.49
Clearing and forwarding charges 0.62 2.22
Loans/advances given 54.60 52.44
Interest received 4.32 15.37
Rent received 0.17 –
Investments made/pending allotment during the year 3,775.86 18,969.70
Royalty paid 0.24 0.24
Royalty and technical know-how fee received 51.65 90.40
Dividend received 9.89 10.24
Provision written back (net of provision for diminution in value of investments) 91.00 –
Balance at the end of the year :
Loans/advances given (net of provision) 33.02 44.68
Other receivables 4,846.37 6,128.38
Payables 388.68 188.53
ii) Key management personnel and their relatives
Remuneration to key management personnel 317.71 147.26
House rent allowance 2.40 2.40
Pension 2.03 2.03
Medical reimbursement 0.03 0.02
iii) Entities over which significant influence is exercised
Purchase of materials/finished goods – 1.19
Sale of finished goods 13.38 25.13
Other payments 261.08 159.14
Services rendered/Other receipts 9.46 3.11
Purchase of assets 2.95 –
Balance at the end of the year :
Receivables 3.96 10.95
Payables 12.14 7.80

73
SCHEDULES FORMING PART OF THE STANDALONE FINANCIAL STATEMENTS
FOR THE YEAR ENDED DECEMBER 31, 2007
SCHEDULE 26
NOTES TO THE FINANCIAL STATEMENTS (Contd.)
Ranbaxy Laboratories Limited Annual Report 2007 Schedules - Standalone
29. Events occurring after the balance sheet date :
De-merger of New Drugs Discovery Research Unit
The Board of Directors of the Company in their meeting held on February 19, 2008, approved the Scheme of Arrangement forde-merger of New Drug Discovery Research (NDDR) Unit of the Company into Ranbaxy Life Sciences Research Limited (“RLS”),a wholly owned subsidiary of the Company. The appointed date for the purpose of de-merger has been fixed as January 01,2008. Under the aforementioned scheme, all the shareholders of the Company on the record date, without any payment, will beentitled to receive one equity share of Re. 1 each of RLS, for every four equity shares of Rs. 5 each held in the Company.
As at December 31, 2007, the Company’s financial statements include net assets of Rs. 272.7 million and net expensesRs. 657.3 million of the NDDR unit.
Further Stake increase in Zenotech Laboratories Limited
The Company further increased its equity stake in Zenotech Laboratories Limited (Zenotech) by purchase of shares frompromoters of Zenotech and acquisition of shares through Open Offer made under SEBI (Substantial Acquisition of Shares andTakeovers) Regulations, 1997. The details are as follows:
Particulars Date of No. of Consider- % of equityacquisition Shares ration share capital
Rs. million of Zenotech
Share acquired from promoters 31.1.2008 7,878,906 1,260.62 22.94%of Zenotech
Shares acquired under Open Offer 4.2.2008 758,851 121.41 2.21%made under SEBI (Substantial Acquisitionof Shares and Takeovers) Regulations, 1997
Post acquisition of these shares, the shareholding of the Company in Zenotech became 46.95% of Zenotech’s capital base.
30. Additional information pursuant to paragraphs 3 & 4 of part II of schedule VI to the Companies Act,1956.
( As certified by the management and accepted by the auditors )
a] Particulars of installed capacities and actual production
2007 2006
Unit of Installed Actual Installed Actualmeasure capacity production capacity production
Dosage formsTablets Nos./Millions 9,424.00 6,413.29 6,518.00 5,236.71Capsules Nos./Millions 2,992.00 2,025.27 2,540.00 1,970.14Dry syrups/Powders Bottles /Millions 43.80 42.32 27.20 41.11Ampoules Nos./Millions 48.00 99.47 74.40 100.11Vials Nos./Millions 39.00 35.55 39.00 33.80Liquids Kilolitres – 1,372.73 – 1,266.27Drops Kilolitres – 46.56 – 40.60Active pharmaceuticals ingredients
and drugs intermediates Tonnes 2,001.25 1,547.02 2,014.23 1,517.58Ointments Tonnes * 317.80 * 327.48
* In different denominations than actual production
Notes :
1. Installed capacity being effective operational capacity has been calculated on a double shift basis for dosage forms facilitiesand on a three shift basis for active pharmaceuticals ingredients and drug intermediates.
2. Actual production includes production at loan licensee locations.

74
SCHEDULES FORMING PART OF THE STANDALONE FINANCIAL STATEMENTS
FOR THE YEAR ENDED DECEMBER 31, 2007
SCHEDULE 26
NOTES TO THE FINANCIAL STATEMENTS (Contd.)
b] Stocks and sales of finished goods
Sales Opening stock Closing stock
Unit of Quantity@ Rs. Million Quantity Rs. Million Quantity Rs. Millionmeasure
Dosage formsTablets Nos./Millions 7,901.19 20,154.39 741.94 1,030.98 669.87 820.53
6,421.75 18,619.60 549.44 784.89 741.94 1,030.98Capsules Nos./Millions 2,291.48 6,130.58 188.72 254.83 212.06 293.77
2,246.57 4,715.94 154.85 183.74 188.72 254.83Dry syrups/Powders Bottles/Millions 50.05 2,801.23 4.15 80.81 5.42 77.14
49.02 2,883.31 5.36 76.09 4.15 80.81Ampoules Nos./Millions 104.37 794.69 17.76 47.78 16.24 74.80
94.25 709.51 8.58 43.15 17.76 47.78Vials Nos./Millions 103.09 2,536.60 12.70 209.63 12.30 197.11
93.04 2,150.97 9.22 158.73 12.70 209.63Liquids Kilolitres 3259.35 851.53 495.16 77.41 587.53 92.71
3,055.80 750.80 384.98 69.74 495.16 77.41Drops Kilolitres 46.86 69.99 6.12 4.93 5.82 5.46
40.33 59.23 4.04 3.80 6.12 4.93Active pharmaceuticals
ingredients and drugsintermediates Tonnes 1,819.07 9,694.69 126.57 1,664.18 130.00 1,778.30
1,980.34 12,396.71 140.10 1,616.21 126.57 1,664.18Ointments Tonnes 983.84 1,331.50 139.27 67.24 128.10 74.31
882.23 1,121.93 99.95 52.41 139.27 67.24Others (Chemicals etc.) 866.83 20.68 11.59
377.22 41.76 20.68Inter unit transfers (4,966.06)
(4,546.43)
TOTAL 40,265.97 3,458.47 3,425.72
39,238.79 3,030.52 3,458.47
@ Inclusive of physician samples.
Figures in italics are for 2006.
2007 2006Unit of measure Quantity Rs. Million Quantity Rs. Million
c] Purchases of finished goods for resaleTablets Nos./Millions 1,415.83 832.77 1,377.54 792.53Capsules Nos./Millions 289.55 300.81 310.30 319.56Dry Syrups/Powders Bottles/Millions 9.00 65.67 6.69 41.78Ampoules Nos./Millions 3.38 24.29 3.32 12.41Vials Nos./Millions 67.14 501.89 62.72 403.33Liquids Kilolitres 1,978.99 201.01 1,899.71 197.09Drops Kilolitres – – 1.81 1.53Bulk drugs / chemicals Tonnes 275.48 804.07 449.23 789.17Ointments Tonnes 654.87 285.63 594.07 192.73Others 70.17 42.45
TOTAL 3,086.31 2,792.58
d] Consumption of raw materials @Erythromycin 'A'95 Metric tonnes 220.97 522.42 202.53 500.73Compactin Metric tonnes 20.12 284.03 13.38 317.19Pencillin G Potassium First Crystals Metric tonnes – – 59.95 31.086APA Metric tonnes 316.45 536.89 292.63 343.523 - CI - 7 - ACCA Metric tonnes 84.99 972.68 65.98 719.73D-Alpha Phenyl Glycine and its Salts Metric tonnes 190.04 106.98 221.13 130.17Others 11,945.68 11,310.71
TOTAL 14,368.68 13,353.13

75
SCHEDULES FORMING PART OF THE STANDALONE FINANCIAL STATEMENTS
FOR THE YEAR ENDED DECEMBER 31, 2007
SCHEDULE 26
NOTES TO THE FINANCIAL STATEMENTS (Contd.)
Ranbaxy Laboratories Limited Annual Report 2007 Schedules - Standalone
e] Consumption of raw materials, components and spares @
2007 2006
Raw Components, Raw Components,materials Spares & materials Spares &
Packaging Packagingmaterials * materials
Indigenous Rs. Million 6,949.10 2,308.58 5,985.05 2,038.90
As % of total 48.36% 84.10% 44.82% 83.44%
Imported Rs. Million 7,419.58 436.46 7,368.08 404.51
As % of total 51.64% 15.90% 55.18% 16.56%
* Inclusive of components and spares used for maintenance of plant and machinery
@ Inclusive of raw materials consumed for research and development
Rs. Million
2007 2006f] Imports on C. I. F. basis:
Raw materials 4,949.49 5,212.37
Components and spares 57.65 82.33
Capital goods 400.85 343.16
g] Expenditure in foreign currenciesInterest 547.36 289.11
Royalty paid 2.03 2.34
Legal and professional charges 1,352.20 1,420.59
Others 3,878.15 3,660.01
h] Dividend paid to non-resident shareholders(in foreign currency )
Interim
No. of shareholders 28 30
No. of shares held 47,206 47,326
Dividend remitted (Rs. Million) 0.12 0.12
Year to which it relates 2007 2006
2nd Interim
No. of shareholders 28 –
No. of shares held 47,206 –
Dividend remitted (Rs. Million) 0.28 –
Year to which it relates 2006 –
Final
No. of shareholders – 29
No. of shares held – 46,296
Dividend remitted (Rs. Million) – 0.28
Year to which it relates – 2005
i] Earnings in foreign exchange
F.O.B. value of exports 25,172.80 25,891.78
(excluding Nepal)Royalty/Technical consultancy fees 129.01 335.83
Dividends 9.89 10.24
Others (freight, insurance etc.) 1,296.94 1,320.82

76
On behalf of the Board of Directors
HARPAL SINGH MALVINDER MOHAN SINGH ATUL SOBTIChairman CEO & Managing Director Chief Operating Officer &
Whole-time Director
OMESH SETHI SUSHIL K. PATAWARIPlace : Gurgaon Vice President & SecretaryDated : March 28, 2008 Head-Global Finance
SCHEDULES FORMING PART OF THE STANDALONE FINANCIAL STATEMENTS
FOR THE YEAR ENDED DECEMBER 31, 2007
SCHEDULE 26
NOTES TO THE FINANCIAL STATEMENTS (Contd.)
31. Information pursuant to clause 32 of the listing agreements
with stock exchanges
Maximum balance
Rs. Million Rs. Million
2007 2006 2007 2006
Loans and advances in the nature of loans to :
Wholly-owned subsidiary companies with
no specified payment schedule
Vidyut Investments Limited – 350.08 350.08 361.08
Ran Air Services Limited # – – – 51.45
Ranbaxy Drugs Limited * 3.10 3.10 3.60 3.10
Rexcel Pharmaceuticals Limited * 8.00 – 38.60 –
Solus Pharmaceuticals Limited * 9.89 – 15.50 –
Ranbaxy Netherlands B.V.* The Netherlands 12.04 41.50 41.51 41.51
* Interest free.
# Ceased to be subsidiary during 2006.
32. Previous year figures
Previous year figures have been regrouped/recasted wherever considered necessary to make them comparable with those of thecurrent year.
Signatories to schedules 1 to 26

77
RANBAXY LABORATORIES LIMITED
BALANCE SHEET ABSTRACT AND COMPANY’S GENERAL BUSINESS PROFILE
I. REGISTRATION DETAILS :
Registration No. 0 0 3 7 4 7 State Code : 1 6
Balance Sheet Date : 3 1 1 2 2 0 0 7
Date Month Year
II. CAPITAL RAISED DURING THE YEAR (AMOUNT IN RS. THOUSANDS)
Public Issue : N I L Rights Issue : N I L
Employees Stock Options : 1 9 1 5 Private Placement : N I L
Bonus Issue : N I L
III. POSITION OF MOBILISATION AND DEPLOYMENT OF FUNDS (AMOUNT IN RS. THOUSANDS)
Total Liabilities : 7 8 6 4 5 7 3 6 Total Assets : 7 8 6 4 5 7 3 6
Source of Funds
Paid-up-Capital : 1 8 6 5 3 5 0 Reserves & Surplus : 2 3 5 0 6 8 0 6
1 1 7 6 0 *
Secured Loans : 3 6 5 0 6 8 0 Unsecured Loans : 3 1 3 7 9 6 0 0
Deferred tax liability : 2 5 1 8 9 2 0
Application of Funds
Net Fixed Assets : 1 7 9 6 9 4 0 9 Investments : 3 2 3 7 5 5 1 1
Net Current Assets : 1 2 5 8 8 2 0 4 Misc. Expenditure : N I L
Accumulated Losses : N I L
* Share application money pending allotment
IV. PERFORMANCE OF COMPANY (AMOUNT IN RS. THOUSANDS)
Turnover : 4 0 7 1 2 8 7 0 Total Expenditure : 4 0 0 3 9 1 6 5
Profit / Loss before Tax : 7 7 4 4 0 5 7 Profit / Loss after tax : 6 1 7 7 1 9 7
Earning Per Share in Rs. 1 7 Dividend Rate (%) : 1 7 0
V. GENERIC NAMES OF THREE PRINCIPAL PRODUCTS OF THE COMPANY
Item Code No. 2 9 4 1 9 0
Product Description C E F A C L O R
Item Code No. 2 9 4 2 0 0
Product Description C E P H A L E X I N
Item Code No. 2 9 4 1 1 0
Product Description A M O X Y C I L L I N
+ -+ -
On behalf of the Board of Directors
HARPAL SINGH MALVINDER MOHAN SINGH ATUL SOBTIChairman CEO & Managing Director Chief Operating Officer &
Whole-time Director
OMESH SETHI SUSHIL K. PATAWARIVice President & SecretaryHead-Global Finance
Place : GurgaonDated : March 28, 2008
Ranbaxy Laboratories Limited Annual Report 2007 Schedules & Balance Sheet Abstract

78
Statement Regarding Subsidiary Companies Pursuant to Section 212(3) and 212(5) of the Companies Act, 1956
Net aggregate amount of subsidiary Net aggregate amount Holdingcompany’s profits after deducting its of Subsidiary Company’s Company’slosses or vice-versa, so far as it profit after deducting its interest as at
Name of Subsidiary Financial Holding Company’s interest concerns members of Holding losses or vice-versa, December 31, 2007Company year to as at close of financial year of Company which are not dealt within dealt within the incorporating
which subsidiary company the Company’s account Company’s account changesaccounts since closerelates i) Shareholding ii) Extent of For the For the For the For the of financial
Holding current previous current previous year offinancial financial financial financial Subsidiaryyear years year years Company
%age Rs. Million Rs. Million Rs. Million Rs. Million
Domestic :
Solus Pharmaceuticals Ltd. 2007 7,000,700 Equity shares 100 $ 1.66 (Profit) 6.96 (Loss) Nil Nil No changeof Rs. 10 each
Rexcel Pharmaceuticals Ltd. 2007 5,000,000 Equity shares 100 $$ 1.14 (Loss) 32.02 (Profit) Nil Nil No changeof Rs. 10 each
Vidyut Investments Ltd. 2007 25,008,400 Equity shares 100 331.99 (Loss) 94.35 (Profit) Nil 78.45 No changeof Rs. 10 each
Ranbaxy Drugs and 2007 6,200,000 Equity shares 100 @ 2.40 (Profit) 3.54 (Profit) Nil Nil No changeChemical Company of Rs. 10 each(A public company withunlimited liability)
Ranbaxy Drugs Ltd. 2007 i) 3,100,020 Equity shares 100 0.01 (Loss) 0.39 (Loss) Nil Nil No changeof Rs. 10 each
ii) 250 10% Non-CumulativeRedeemable Preferenceshares of Rs. 10 each
Gufic Pharma Ltd. 2007 4900 Equity shares 98 0.34 (Profit) 1.50 (Profit) Nil Nil No changeof Rs. 100 each
Ranbaxy Life Sciences 2007 500,000 Equity shares 100 0.03 (Loss) Nil Nil Nil New entity in 2007Research Ltd. of Re.1 each
Overseas :
Ranbaxy (Guangzhou China) 2007 Investment Certificate of 83 @ 3.80 (Profit) # 216.29 (Loss) # Nil Nil No changeLtd., China US $ 6,225,000
Ranbaxy (Netharlands) B.V., 2007 3,939,716 shares of Eur 100 each 100 966.62 (Profit) # 1,851.48 (Profit) # Nil Nil No changeThe Netherlands
Ranbaxy Nigeria Ltd., 2007 33,956,284 Ordinary shres of 84.89 @ 47.29 (Profit) # 129.31 (Profit) # 2.11 13.91 No changeNigeria Naira 1 each
Ranbaxy (Hong Kong) Ltd. 2007 2,400,000 Equity shares of 100 18.45 (Profit) # 42.51 (Loss) # Nil Nil No change(Consolidated), HK $ 1 eachHong Kong
Ranbaxy (Malaysia) Sdn. Bhd. 2007 5,446,865 Ordinary shares of 68.09 @ 64.64 (Profit) # 215.84 (Profit) # 5.97 20.13 No changeMalaysia RM 1 each
Ranbaxy Unichem 2007 885,570 Ordinary shares of 88.56 @ 39.73 (Profit) # 56.35 (Profit) # 1.81 2.72 No changeCompany Limited, Baht 100 eachThailand
Ranbaxy Pharmacie 2007 827,600 Equity shares of 100 @ 3.45 (Profit) # 84.48 (Loss) # Nil Nil No changeGeneriques SAS Euro 9 each(Consolidated), France
$ Previous year 3,000,700 Equity shares of Rs 10 each
$$ Previous year 1,000,000 Equity shares of Rs 10 each
@ Inclusive of shares held through wholly owned subsidiaries.
# Exchnage rates conversion as on the year end.
Previous year figures have been regrouped/ recasted wherever considered necessary.
On behalf of the Board of Directors
HARPAL SINGH MALVINDER MOHAN SINGH ATUL SOBTIChairman CEO & Managing Director Chief Operating Officer &
Whole-time Director
OMESH SETHI SUSHIL K. PATAWARIVice President & SecretaryHead-Global Finance
Place : GurgaonDated : March 28, 2008

79
Auditors' report to the Board of Directors of Ranbaxy
Laboratories Limited
We have audited the attached consolidated balance sheet ofRanbaxy Laboratories Limited, (the “Company”) itssubsidiaries, joint venture and associates (as per list appearingin Note 24 on Schedule 26) (hereinafter collectively referredto as the ‘Group’), as at December 31, 2007 and also theconsolidated profit and loss account and the consolidated cashflow statement for the year ended on the date annexed thereto(hereinafter collectively referred to as the ‘consolidatedfinancial statements’). These consolidated financialstatements are the responsibility of the Group's managementand have been prepared by the management on the basis ofseparate financial statements of the entities of the Group. Ourresponsibility is to express an opinion on these consolidatedfinancial statements based on our audit.
We conducted our audit in accordance with the auditingstandards generally accepted in India. Those standards requirethat we plan and perform the audit to obtain reasonableassurance about whether the consolidated financialstatements are free of material misstatement. An auditincludes examining, on a test basis, evidence supporting theamounts and disclosures in the consolidated financialstatements. An audit also includes assessing the accountingprinciples used and significant estimates made bymanagement, as well as evaluating the overall financialstatement presentation. We believe that our audit provides areasonable basis for our opinion.
We did not audit the financial statements of some consolidatedentities, whose financial statements reflect total assets ofRs. 14,841.59 million as at December 31, 2007, total revenueof Rs. 26,465.18 million and cash flows amounting toRs. 287.06 million for the year then ended and associateswhose financial statements reflect the Group’s share of profitof Rs. 2.10 million for the year then ended as considered in theconsolidated financial statements. These financial statementsand other financial information have been audited by otherauditors whose reports have been furnished to us and ouropinion in respect thereof is based solely on the report of suchother auditors.
We report that the consolidated financial statements have beenprepared by Group's management in accordance with therequirements of Accounting Standard 21, ConsolidatedFinancial Statements, Accounting Standard 23, Accounting forInvestments in Associates in Consolidated FinancialStatements and Accounting Standard 27, Financial Reportingof Interests in Joint Venture, issued by the Institute of CharteredAccountants of India.
Based on our audit and consideration of reports of otherauditors on separate financial statements of the entities andto the best of our information and according to the explanationsgiven to us, we are of the opinion that the attached consolidatedfinancial statements give a true and fair view in conformitywith the accounting principles generally accepted in India; incase of :
(a) the consolidated balance sheet, of the state of affairs ofthe Group as at December 31, 2007;
(b) the consolidated profit and loss account, of the profitfor the year ended on that date; and
(c) the consolidated cash flow statement, of the cash flowsfor the year ended on that date.
For Walker, Chandiok & Co
Chartered Accountants
Per Vinod Chandiok
Partner
Membership No. 10093
Place : GurgaonDated : March 28, 2008
CONSOLIDATED FINANCIAL STATEMENTS –
INDIAN GAAP

80
On behalf of the Board of Directors
For WALKER, CHANDIOK & CO HARPAL SINGH MALVINDER MOHAN SINGH ATUL SOBTIChartered Accountants Chairman CEO & Managing Director Chief Operating Officer &
Whole-time Director
Per VINOD CHANDIOK OMESH SETHI SUSHIL K. PATAWARIPartner Vice President & SecretaryMembership No. 10093 Head-Global Finance
Place : GurgaonDated : March 28, 2008
CONSOLIDATED BALANCE SHEET
AS AT DECEMBER 31, 2007
Rs. MillionSchedule 2007 2006
SOURCES OF FUNDSSHAREHOLDERS' FUNDSShare capital 1 1,865.35 1,863.43Reserves and surplus 2 26,156.77 23,986.48
28,022.12 25,849.91
SHARE APPLICATION MONEY PENDING ALLOTMENT 11.76 8.79
MINORITY INTERESTS 570.54 334.43
LOAN FUNDSSecured loans 3 4,102.55 3,369.62Unsecured loans 4 37,313.17 36,186.57
41,415.72 39,556.19
DEFERRED TAX LIABILITY 5 2,728.07 1,636.03
72,748.21 67,385.35APPLICATION OF FUNDSFIXED ASSETS 6Gross block 55,690.25 51,173.89Less : Depreciation 13,645.14 12,220.55
Net block 42,045.11 38,953.34
Capital works-in-progress 3,573.89 3,580.98INVESTMENTS 7 2,403.17 362.35DEFERRED TAX ASSET 5 1,293.58 981.16CURRENT ASSETS, LOANS AND ADVANCESInventories 8 16,408.60 16,115.52Sundry debtors 9 14,930.60 15,716.33Cash and bank balances 10 4,378.93 2,951.16Other current assets 11 1,615.83 1,299.59Loans and advances 12 7,425.81 5,343.03
44,759.77 41,425.63
Less:CURRENT LIABILITIES AND PROVISIONSCurrent liabilities 13 13,624.23 12,449.40Provisions 14 7,703.08 5,468.71
21,327.31 17,918.11
NET CURRENT ASSETS 23,432.46 23,507.52
72,748.21 67,385.35
SIGNIFICANT ACCOUNTING POLICIES 25
NOTES TO THE CONSOLIDATED FINANCIAL STATEMENTS 26
The schedules referred to above form an integral part of the consolidated financial statements.This is the consolidated balance sheet referred to in our report of even date.

81
On behalf of the Board of Directors
For WALKER, CHANDIOK & CO HARPAL SINGH MALVINDER MOHAN SINGH ATUL SOBTIChartered Accountants Chairman CEO & Managing Director Chief Operating Officer &
Whole-time Director
Per VINOD CHANDIOK OMESH SETHI SUSHIL K. PATAWARIPartner Vice President & SecretaryMembership No. 10093 Head-Global Finance
Place : GurgaonDated : March 28, 2008
CONSOLIDATED PROFIT AND LOSS ACCOUNT
FOR THE YEAR ENDED DECEMBER 31, 2007
Ranbaxy Laboratories Limited Annual Report 2007 Consolidated Balance Sheet & Profit and Loss Account
Rs. MillionSchedule 2007 2006
INCOME
Operating income 15 70,269.36 61,797.33
Less : Excise duty 446.90 69,822.46 481.72 61,315.61
Other income 16 4,433.53 682.80
74,255.99 61,998.41
EXPENDITURE
Materials 17 27,216.78 23,733.09
Manufacturing 18 3,353.27 3,098.76
Personnel 19 8,918.39 7,955.29
Selling, general and administration 20 16,906.79 13,866.94
Research and development 21 4,280.12 3,954.79
60,675.35 52,608.87
PROFIT BEFORE INTEREST, DEPRECIATION,AMORTISATION AND IMPAIRMENT 13,580.64 9,389.54
Interest 1,411.88 1,036.32
Depreciation, amortisation and impairment 22 2,183.41 1,842.88
PROFIT BEFORE TAX 9,985.35 6,510.34
Provision for tax 23 2,118.86 1,356.74
PROFIT AFTER TAX 7,866.49 5,153.60
Add: Share in profit and loss of associates (Net) 2.10 –
Less : Minority interests 123.74 50.21
PROFIT AFTER TAX AND MINORITY INTERESTS 7,744.85 5,103.39
Tax - earlier years 1.01 148.06
Balance as per last balance sheet 2,464.96 1,253.94
Transfer from Foreign projects reserve 24.87 22.95
BALANCE AVAILABLE FOR APPROPRIATION 10,235.69 6,528.34
APPROPRIATIONS
Dividend
Interim 932.13 3,168.94
Final (proposed) 2,239.42 –
Tax on dividend 539.02 444.44
Transfer to General reserve 800.00 450.00
Surplus carried forward 5,725.12 2,464.96
10,235.69 6,528.34
EARNINGS PER SHARE (RS.) 24
Basic 20.77 14.09
Diluted 15.22 13.17
SIGNIFICANT ACCOUNTING POLICIES 25
NOTES TO THE CONSOLIDATED FINANCIAL STATEMENTS 26
The schedules referred to above form an integral part of the consolidated financial statements.This is the consolidated profit and loss account referred to in our report of even date.

82
On behalf of the Board of Directors
For WALKER, CHANDIOK & CO HARPAL SINGH MALVINDER MOHAN SINGH ATUL SOBTIChartered Accountants Chairman CEO & Managing Director Chief Operating Officer &
Whole-time Director
Per VINOD CHANDIOK OMESH SETHI SUSHIL K. PATAWARIPartner Vice President & SecretaryMembership No. 10093 Head-Global Finance
Place : GurgaonDated : March 28, 2008
CONSOLIDATED CASH FLOW STATEMENT
FOR THE YEAR ENDED DECEMBER 31, 2007 Rs. Million2007 2006
A. CASH FLOW FROM OPERATING ACTIVITIESNet profit before minority interests and share of profits in associates 9,985.35 6,510.34
Adjustments for :Depreciation, amortisation & impairment 2,183.41 1,842.88Assets written off 301.74 10.04Deferred employees compensation 15.71 26.35Unrealised exchange Gain (net) (2,465.70) (270.74)Dividend income (1.02) (1.01)Profit on disposal of investments – (12.89)Profit on sale of assets (net) (575.94) (41.12)Reversal in the value of current investments – (2.36)Interest expense 1,411.88 1,036.32Interest income (218.72) (211.22)Amounts written off 143.18 60.48Provision for doubtful debts and advances 62.06 142.50
856.60 2,579.23
Operating profit before working capital changes 10,841.95 9,089.57Adjustments for :
Inventories (293.08) (2,491.50)Sundry debtors / receivables 258.44 (4,667.75)Loans and advances (867.54) (537.58)Trade/other payables 1,373.94 471.61Other current assets 330.16 2,733.46
801.92 (4,491.76)
Net cash generated from operating activity 11,643.87 4,597.81
Direct taxes paid (net of refunds) (1,411.43) 694.56
Net cash from operating activity 10,232.44 5,292.37
B. CASH FLOW FROM INVESTING ACTIVITIESPurchase of fixed assets / capital works-in-progress (5,227.26) (4,358.14)Sale of assets 865.85 156.18Purchase of investments (226.87) (202.76)Sale proceeds of investments – 27.38Investment in associates (1,812.33) –Investment in subsidiary company (2,232.30) (15,784.01)Short term deposit / secured loans 11.71 16.35Interest received 211.91 213.08Dividend received 1.02 1.01
Net cash used in investing activities (8,408.27) (19,930.91)
C. CASH FLOW FROM FINANCING ACTIVITIESProceeds from issue of capital (including premium) 92.34 63.32Minority interest 236.11 168.52Proceeds from bank and other borrowings (net) 4,333.39 217.90Proceeds from FCCB – 19,553.60FCCB issue expenses – (227.50)Interest paid (1,411.88) (1,036.32)Dividend paid (3,169.35) (3,167.27)Tax on dividend (472.20) (444.20)
Net cash (used) in / from financing activities (391.59) 15,128.05
INCREASE IN CASH AND CASH EQUIVALENTS 1,432.58 489.51
Cash and cash equivalents at the beginning 2,863.22 2,373.71
Cash and cash equivalents at the end 4,295.80 2,863.22
Notes :Cash and cash equivalents include :
Cash and cheques in hand and remittances in transit 403.06 170.04With banks in :
Current accounts [Net of dividend accounts 1,822.06 1,122.68Rs. 82.42 Mn (Previous year Rs. 87.06 Mn)]
Deposit accounts [Net of pledged Rs.0.71 Mn (Previous year Rs 0.88 Mn)] 2,070.68 1,570.50
4,295.80 2,863.22

83
Ranbaxy Laboratories Limited Annual Report 2007 Consolidated Cash Flow Statement & Schedules
SCHEDULES FORMING PART OF THE CONSOLIDATED FINANCIAL STATEMENTSFOR THE YEAR ENDED DECEMBER 31, 2007
Rs. MillionSCHEDULE 1 2007 2006
SHARE CAPITALAuthorised598,000,000 (Previous year 598,000,000 ) Equity shares of Rs. 5 each 2,990.00 2,990.00100,000 (Previous year 100,000) Cumulative preference shares of Rs. 100 each 10.00 10.00
3,000.00 3,000.00Issued, subscribed and paid up373,070,829 (Previous year 372,686,964) Equity shares of Rs. 5 each fully paid 1,865.35 1,863.43
1,865.35 1,863.43SCHEDULE 2
RESERVES AND SURPLUSCapital reserve 70.90 66.58Amalgamation reserve 43.75 43.75Revaluation reserve
As per last balance sheet 189.51 105.07Add: Addition during the year – 86.64
189.51 191.71Less: Utilised during the year (2.20) (2.20)
187.31 189.51Securities premium
As per last balance sheet 5,599.60 6,235.31Add : Received during the year * 101.80 64.69
5,701.40 6,300.00Less : Expenses on issue of FCCB (Net of taxes) – (150.93)Less : Premium payable on redemption of FCCB (Net of taxes) (690.89) (549.47)
5,010.51 5,599.60Foreign projects reserve
As per last balance sheet 62.72 85.67Less: Transfer to profit and loss account (24.87) (22.95)
37.85 62.72Employee stock options outstanding
Employees stock options outstanding 104.94 127.96Less: Deferred employee compensation (9.57) (33.95)
95.37 94.01General reserve
As per last balance sheet 15,351.24 14,901.24Add : Transfer from profit and loss account 800.00 450.00
16,151.24 15,351.24Surplus carried forward 5,725.12
Goodwill written off on merger of subsidiary (242.49) 5,482.63 2,464.96Foreign currency translation reserve (922.79) 114.11
26,156.77 23,986.48* Includes Rs. 14.35 million (previous year Rs 8.59 million)transferred from Employees Stock Options Outstanding
SCHEDULE 3
SECURED LOANSLoan from banks 3,650.68 2,806.31Deferred payment credit 451.87 563.31
4,102.55 3,369.62
SCHEDULE 4
UNSECURED LOANSShort term loans
Banks 10,762.56 9,939.7410,762.56 9,939.74
Long term loansZero coupon Foreign Currency Convertible Bonds (FCCB) 17,344.80 19,474.40Banks 9,076.91 6,714.11Others 118.80 44.30Deferred sales tax credit 10.10 14.02
26,550.61 26,246.8337,313.17 36,186.57
SCHEDULE 5
DEFERRED TAX LIABILITY / ASSETDeferred tax liability arising on account of :
Depreciation 3,011.37 2,554.52FCCB loan revaluation 500.51 17.95Tax credit received 165.94 164.33
3,677.82 2,736.80Deferred tax asset arising on account of :
Provision for doubtful debts and advances 228.66 209.55Employee benefits 121.80 134.99Carried forward tax losses 860.07 1,062.24FCCB redemption premium charged to securities premium account 638.69 278.79Others 394.11 396.36
2,243.33 2,081.93Net liability 1,434.49 654.87
Aggregated of net deferred tax liabilities jurisdictions 2,728.07 1,636.03Aggregated of net deferred tax assets jurisdictions 1,293.58 981.16
1,434.49 654.87

84
SCHEDULES FORMING PART OF THE CONSOLIDATED FINANCIAL STATEMENTS
FOR THE YEAR ENDED DECEMBER 31, 2007
SCHEDULE 6
FIXED ASSETS Rs. Million
Gross block Accumulated Depreciation/ Net block*
Amortization & Impairment
Description 2006 Additions Deletions Translation 2007 2007 2007 2006
IntangiblesGoodwill 18,236.00 1,955.00 278.87 (96.13) 19,816.00 517.58 19,298.42 17,657.94Patent, trade marks,designs and licences 2,924.70 1,610.72 191.93 (156.91) 4,186.58 2,008.27 2,178.31 1,148.21Software 542.84 199.25 15.24 (3.82) 723.03 397.00 326.03 226.07Product development 283.30 49.71 – – 333.01 30.42 302.59 283.30Non compete fee 211.00 – – – 211.00 180.37 30.63 50.97TangiblesLand 992.04 161.01 56.34 (45.79) 1,050.92 – 1,050.92 992.04Buildings 5,742.17 597.67 326.79 (234.02) 5,779.03 886.70 4,892.33 4,847.51Plant and machinery 19,553.93 1,919.51 528.26 (364.11) 20,581.07 8,495.30 12,085.77 11,903.24Furniture and fixtures 1,231.10 505.27 51.32 (48.15) 1,636.90 638.88 998.02 789.88Vehicles 698.39 164.09 69.61 (28.70) 764.17 298.08 466.09 480.26Assets taken on lease
Building 674.02 – – (73.65) 600.37 189.77 410.60 526.95Plant and machinery 50.52 – 49.88 (0.64) – – – 32.33Furniture and fixtures 4.78 – 4.35 (0.43) – – – 0.44Vehicles 29.09 2.65 22.57 (1.00) 8.17 2.77 5.40 14.20
Total 51,173.88 7,164.88 1,595.16 (1,053.35) 55,690.25 13,645.14 42,045.11 38,953.34
Previous year 29,920.31 21,242.35 279.08 290.31 51,173.89 12,220.55 38,953.34
* The above includes the following assets held for disposal, which are being carried at the lower of their book value and net realisable value :- Land Rs. 193.72 million, Building Rs. 24.24 million, Furniture and fixture Rs. 8.12 million, Plant and machinery Rs. 27.11 million and Vehicles Rs. 0.41 million.
Rs. Million
SCHEDULE 7 2007 2006
INVESTMENTS
CURRENTTrust securitiesOther than trade - unquoted41,089 US64 Bonds of Rs. 100 each (6.75% Tax Free) 4.11 4.11
4.11 4.11
LONG TERMInvestments in shares of companies (fully paid)
Nature of Face Numbersinvestment value 2007 2006
Trade :QuotedKrebs Biochemicals & Industries Limited Equity shares Rs. 10 1,050,000 – 89.25 –Sawai Pharmaceutical Co.,Ltd # Equity shares 1,500 1,500 1.87 1.24UnquotedNimbua Greenfield (Punjab) Limited Equity shares Rs. 10 250,000 250,000 2.50 2.50Jupiter Bioscience Limited Equity Warrants Rs. 10 3,177,500 – 93.42 @ –Shivalik Solid Waste Management Ltd. Equity shares Rs. 10 20,000 – 0.20 –Biotech Consortium India Ltd. Equity shares Rs. 10 50,000 50,000 0.50 0.50Tomita Pharmaceutical Co.,Ltd # Equity shares 2,500 2,500 1.28 1.44Sidmak Laboratories (India) Limited Equity shares Rs. 10 167,330 167,330 10.54 10.54
199.56 16.22AssociatesQuotedZenotech Laboratories Limited Equity shares Rs. 10 7,489,536 2,000,000 1,077.62 * 200.00
1,077.62 200.00Other than trade :QuotedThe Great Eastern Shipping Company Ltd. Equity shares Rs. 10 500 500 0.03 0.03Fortis Healthcare Limited @@ Equity shares Rs. 10 14,097,660 14,097,660 140.98 140.98Autobacs Seven Co., Ltd # Equity shares 871 871 0.57 1.52UnquotedAssociatesShimal Research Laboratories Ltd. Equity shares Rs. 10 9,340,000 – 936.81 ** –OthersReligare Insurance Holding Company Ltd. Equity shares Rs. 10 4,400,000 – 44.00 –
1,122.39 142.53 2,403.68 362.86
Less: Provision for diminution in value of long term investments 0.51 0.51 2,403.17 362.35
# Held by Nihon Pharmaceuticals Industry Co. Ltd., Japan. @ Paid 20% towards preferential allotment of 3,177,500 equity warrants.@@ previous year unquoted. * Include goodwill Rs. 816.11 Million.** Include goodwill Rs. 681.67 Million.

85
Ranbaxy Laboratories Limited Annual Report 2007 Consolidated Schedules
SCHEDULES FORMING PART OF THE CONSOLIDATED FINANCIAL STATEMENTSFOR THE YEAR ENDED DECEMBER 31, 2007
Rs. MillionSCHEDULE 8 2007 2006
INVENTORIESStores and spares 181.44 185.03Raw materials 5,328.82 5,079.93Packaging materials 667.11 725.38Finished goods 7,485.66 7,915.91Work-in-process 2,745.57 2,209.27
16,408.60 16,115.52
SCHEDULE 9
SUNDRY DEBTORS(Considered good except where provided for)Secured 210.19 231.97Unsecured 15,164.49 15,837.94
15,374.68 16,069.91Less : Doubtful and provided for 444.08 353.58
14,930.60 15,716.33
SCHEDULE 10
CASH AND BANK BALANCESCash and cheques in hand 118.64 83.65Remittances in transit 284.42 86.39Balances with banks:
Current accounts 1,904.48 1,209.74Deposit accounts 2,071.39 1,571.38
4,378.93 2,951.16
SCHEDULE 11
OTHER CURRENT ASSETS(Unsecured, considered good except where provided for)Export incentives accrued 660.85 463.23Exchange gain accrued on forward contracts 277.85 184.35Insurance claims 23.73 78.58Interest accrued 14.33 7.52Others 659.28 598.87
1,636.04 1,332.55Less : Doubtful and provided for 20.21 32.96
1,615.83 1,299.59
SCHEDULE 12
LOANS AND ADVANCES(Considered good except where provided for)Secured 45.63 57.34Unsecured
Advances recoverable in cash or in kindor for value to be received 3,538.72 3,941.51
Advance for purchase of shares of associate 1,274.82 -Mat credit receivable 1,179.00 381.50Prepaid Income tax 1,785.08 1,375.81
7,823.25 5,756.16Less : Doubtful and provided for 397.44 413.13
7,425.81 5,343.03
SCHEDULE 13
CURRENT LIABILITIESAcceptances 59.07 73.38Sundry creditors 8,556.36 8,376.22Other liabilities 5,008.80 3,999.80
13,624.23 12,449.40
SCHEDULE 14
PROVISIONSEmployee benefits 1,541.48 1,276.75Income-tax 1,662.54 812.71Premium payable on redemption of FCCB 1,879.05 828.26Final dividend (proposed) 2,239.42 –Interim dividend – 2,237.22Tax on dividend 380.59 313.77
7,703.08 5,468.71

86
SCHEDULES FORMING PART OF THE CONSOLIDATED FINANCIAL STATEMENTS
FOR THE YEAR ENDED DECEMBER 31, 2007
Rs. MillionSCHEDULE 15 2007 2006
OPERATING INCOMESales and servicesSales 66,926.74 60,652.24Services – 12.73
66,926.74 60,664.97OthersExport incentives 688.10 479.14Royalty and technical know-how 148.00 350.62Exchange Gain / (Loss) (net) 2,012.69 (9.74)Sundries 493.83 312.34
3,342.62 1,132.36
70,269.36 61,797.33
SCHEDULE 16
OTHER INCOMEInterest 218.72 211.22Dividend 1.02 1.01Exchange Gain/ (Loss) (Net) on loans 3,071.25 118.45Profit on sale of assets 683.78 72.12Profit on sale of investments – 12.89Reversal of provision for diminution in the value of investments – 2.36Bad debts / advances recovered 0.27 0.07Unclaimed balances and excess provisions 229.08 91.05Miscellaneous 229.41 173.63
4,433.53 682.80
SCHEDULE 17
MATERIALSRaw materials consumed 16,339.32 15,229.11Packaging materials consumed 2,891.05 2,620.96Finished goods purchased 8,092.46 7,510.93Increase in work-in-process and finished goods
Opening stockWork-in-process 2,209.27 1,987.35Finished goods 7,915.91 6,509.92
10,125.18 8,497.27Less :Closing stock
Work-in-process 2,745.57 2,209.27Finished goods 7,485.66 7,915.91
10,231.23 10,125.18
Increase (106.05) (1,627.91)
Materials consumed 27,216.78 23,733.09
SCHEDULE 18
MANUFACTURINGPower and fuel 973.67 850.67Excise duty 66.77 56.89Stores and spares consumed 601.61 510.92Analytical charges 86.35 50.14Processing charges 1,169.26 1,071.71Royalty paid 220.08 389.07Repairs and maintenance
Factory buildings 36.14 33.91Plant and machinery 199.39 135.45
3,353.27 3,098.76

87
Ranbaxy Laboratories Limited Annual Report 2007 Consolidated Schedules
SCHEDULES FORMING PART OF THE CONSOLIDATED FINANCIAL STATEMENTS
FOR THE YEAR ENDED DECEMBER 31, 2007Rs. Million
SCHEDULE 19 2007 2006
PERSONNELSalaries,wages and bonus 7,675.77 6,812.55Contribution to provident and other funds 733.66 618.83Workmen and staff welfare 493.25 497.56Amortisation of deferred employees compensation 15.71 26.35
8,918.39 7,955.29
SCHEDULE 20
SELLING, GENERAL AND ADMINISTRATIONRentals 501.24 452.87Rates and taxes 340.06 272.71Regulatory filing fee 537.90 533.18Printing and stationery 124.09 105.80Insurance 442.13 540.28Communication 309.00 281.62Legal and professional charges 1,874.55 1,733.21Travel and conveyance 1,129.70 929.18Discounts 217.54 209.55Freight, clearing and forwarding 2,185.42 2,140.43Advertising and sales promotion 3,956.46 2,826.69Market research expenses 757.46 572.20Repairs and maintenance 389.48 274.46Running and maintenance of vehicles 261.36 197.61Recruitment and training 188.56 123.03Conferences and meetings 168.70 143.22Commission 1,222.45 1,008.07Amounts written off 143.18 60.48Assets written off 301.74 10.04Provision for doubtful debts and advances 62.06 142.50Loss on sale of assets 103.62 13.73Others 1,690.09 1,296.08
16,906.79 13,866.94
SCHEDULE 21
RESEARCH AND DEVELOPMENT EXPENDITURESalaries, wages and bonus 1,187.51 932.56Contribution to provident and other funds 77.32 58.93Workmen and staff welfare 53.41 57.10Materials and consumables 1,614.36 1,514.03Power and fuel 181.06 159.92Clinical trials & Bioequivalence studies 375.22 516.49Rentals 63.03 61.91Repair and maintenance 112.23 88.59Recruitment and training 14.48 31.84Printing and stationery 22.08 20.82Insurance 27.50 27.17Communication 34.90 38.54Analytical and processing charges 124.80 44.23Legal and professional charges 53.11 88.70Travel and conveyance 90.06 71.77Others 249.05 242.19
4,280.12 3,954.79

88
SCHEDULES FORMING PART OF THE CONSOLIDATED FINANCIAL STATEMENTS
FOR THE YEAR ENDED DECEMBER 31, 2007Rs. Million
SCHEDULE 22 2007 2006
DEPRECIATION, AMORTISATION AND IMPAIRMENTDepreciationBuildings 161.43 151.29Plant and machinery 1,252.54 1,068.94Furniture and fixtures 124.72 72.36Vehicles 118.15 59.87Assets taken on lease
Buildings 61.61 113.81Plant and machinery – 17.96Furniture and fixtures – 4.52Vehicles 5.32 7.86
1,723.77 1,496.61Less : Transfer from revaluation reserves (2.20) (2.20)
1,721.57 1,494.41Amortisation
Patent, trade marks, designs, licences and software 411.09 328.44Non compete fee 20.33 20.03
431.42 348.47Impairment
Product development 30.42 –
2,183.41 1,842.88
SCHEDULE 23
PROVISION FOR TAXCurrent income-tax 1,728.09 788.29Mat credit entitlement (797.50) (331.50)Deferred tax 1,063.36 822.03Fringe benefit tax 124.91 77.92
2,118.86 1,356.74
SCHEDULE 24
EARNINGS PER SHARENet profit attributable to equity shareholders
Profit after tax and minority interests 7,744.85 5,103.39Tax-earlier years 1.01 148.06
Net Profit available for basic earnings per share 7,745.86 5,251.45Exchange gain on Foreign Currency Convertible
Bonds (Net of taxes) (1,647.03) (52.54)
Net Profit available for dilutive earnings per share 6,098.83 5,198.91No. of weighted average equity shares
Basic 372,906,747 372,595,730Effect of dilutive equity shares on account of
– stock options outstanding 682,473 746,412– Foreign Currency Convertible Bonds 27,119,165 21,546,734
Diluted 400,708,385 394,888,876
Nominal value of equity share (Rs.) 5.00 5.00
EARNINGS PER SHARE (Rs.)Basic 20.77 14.09Diluted 15.22 13.17

89
SCHEDULES FORMING PART OF THE CONSOLIDATED FINANCIAL STATEMENTS
FOR THE YEAR ENDED DECEMBER 31, 2007
SCHEDULE 25
SIGNIFICANT ACCOUNTING POLICIES
1. Nature of operations
Ranbaxy Laboratories Limited ("Parent Company"), a public limited company, together with its subsidiaries, joint ventureand associates (hereinafter collectively referred to as the "Group") operates as an integrated international pharmaceuticalorganisation with businesses encompassing the entire value chain in the marketing, production and distribution of dosageforms and active pharmaceutical ingredients. The Group is also engaged in the business of consumer healthcare products.
The Group presently has manufacturing facilities in eleven countries, namely India, the United States of America, Brazil,China, Ireland, Japan, Malaysia, Nigeria, Romania, South Africa and Vietnam. The Group's major markets include theUnited States of America, India, Europe, Russia/CIS, and South Africa. The United States of America is the largest marketand major products are Simvastatin, CoAmoxyclav, Amoxycillin, Ciprofloxacin, Isotretinon and Cephalexin. The researchand development activities of the Group are principally carried out at its facilities in Gurgaon, near New Delhi, India.
The Parent Company's shares are listed for trading on the National Stock Exchange and the Bombay Stock Exchange inIndia and its Global Depository Receipts (covering equity shares of Parent Company) are listed on the Luxembourg StockExchange and Foreign Currency Convertible Bonds are listed on Singapore Stock Exchange.
2. Basis of presentation
The financial statements have been prepared to comply with the Accounting Standards referred to in the Companies(Accounting Standards) Rule 2006 issued by the Central Government in exercise of the power conferred under sub-section ( I ) (a) of section 642 and the relevant provisions of the Companies Act, 1956 (the 'Act'). The financial statementshave been prepared under the historical cost convention on accrual basis. The accounting policies have been consistentlyapplied by the Group unless otherwise stated.
3. Use of estimates
In preparing Group's financial statements in conformity with accounting principles generally accepted in India, managementis required to make estimates and assumptions that affect the reported amounts of assets and liabilities and the disclosureof contingent liabilities on the date of the financial statements and the reported amounts of revenues and expensesduring the reporting period. Actual results could differ from those estimates. Any revision to accounting estimates isrecognised in the period the same is determined.
4. Principles of consolidation
The consolidated financial statements include the financial statements of the Parent Company, its subsidiaries, jointventure and share of profits in associate.
The consolidated financial statements have been combined on a line-by-line basis by adding the book values of like itemsof assets, liabilities, income and expenses after eliminating intra-group balances/transactions and unrealised profits infull. The amounts shown in respect of reserves comprise the amount of the relevant reserves as per the balance sheet ofthe Parent Company and its share in the post-acquisition increase/ decrease in the reserves of the consolidated entities.
Proportionate share of interest in joint ventures has been accounted for by the proportionate consolidation method inaccordance with Accounting Standard - 27 - "Financial Reporting of Interests in Joint Ventures".
An investment in an associate has been accounted for by the equity method of consolidation from the date on which it fallswithin the definition of associate in accordance with Accounting Standard - 23 - "Accounting for Investments in Associatesin Consolidated Financial Statements".
The excess/deficit of cost to the Parent Company of its investment over its portion of net worth in the consolidated entitiesat the respective dates on which the investment in such entities was made is recognised in the financial statements asgoodwill/capital reserve. The Parent Company's portion of net worth in such entities is determined on the basis of bookvalues of assets and liabilities as per the financial statements of the entities as on the date of investment and if notavailable, the financial statements for the immediately preceding period adjusted for the effects of significant changes.
Entities acquired during the year have been consolidated from the respective dates of their acquisition.
The consolidated financial statements are presented, to the extent possible, in the same format as that adopted by theParent Company for its separate financial statements.
Ranbaxy Laboratories Limited Annual Report 2007 Consolidated Schedules

90
SCHEDULES FORMING PART OF THE CONSOLIDATED FINANCIAL STATEMENTS
FOR THE YEAR ENDED DECEMBER 31, 2007
SCHEDULE 25
SIGNIFICANT ACCOUNTING POLICIES (Contd.)
5. Intangibles
Patents, Trademarks, Designs and licences
Cost relating to patents, trademarks, designs and licences, which are acquired, are capitalised and amortised on a straight-line basis over the estimated useful life which is generally upto a period of 10 years except in cases where based onavailable evidence the economic benefit is reasonably expected to accrue beyond 10 years.
Computer software
Software which is not an integral part of the related hardware, is classified as an intangible asset and is amortised over aperiod of 6 years, being its estimated useful life.
Non-compete
Non-compete compensation is capitalised and amortised on a straight-line basis over the term of the non-competeagreement.
Goodwill
Goodwill reflects the excess of cost of acquisition over the book value of net assets acquired on the date of the acquisition.Goodwill is tested for impairment on an annual basis.
Product Development
Cost incurred for acquiring rights for products under development are recognised as intangible assets and amortised ona straight-line basis over a period of five years from the date of regulatory approval. Subsequent expenditures ondevelopment of such products are also added to the cost of intangibles.
6. Fixed assets
Fixed assets are stated at cost less accumulated depreciation and impairment losses. Cost comprises the purchaseprice and any attributable cost of bringing the asset to their working condition for their intended use.
Borrowing costs directly attributable to acquisition or construction of fixed assets which necessarily take a substantialperiod of time to get ready for their intended use are capitalised.
7. Depreciation
Depreciation on fixed assets is provided on straight-line method over useful life estimated by the management or on thebasis of depreciation rates prescribed under respective local laws.
8. Investments
Investments that are readily realisable and intended to be held for not more than one year are classified as currentinvestments. All other investments are classified as long-term investments.
Current investments are carried at lower of cost and fair value determined on an individual investment basis. Long-terminvestments, other than investments in associates, are carried at cost, however, provision for diminution in value, otherthan temporary, is made.
Profit/ loss on sale of investments is computed with reference to their average cost.
9. Inventories
Inventories are valued as follows:
Raw materials, stores and spares and packaging materials
Lower of cost and net realisable value. However, materials and other items held for use in the production of finishedgoods are not written down below cost if the products in which they will be used are expected to be sold at or above cost.Cost is determined on a weighted average basis.

91
Finished goods
Lower of cost and net realisable value. Cost includes direct materials and labour and a proportion of manufacturingoverheads based on normal operating capacity. Cost of finished goods includes excise duty, wherever applicable.
Work-in-process
At cost upto estimated stage of completion. Cost includes direct materials and labour and a proportion of manufacturingoverheads based on normal operating capacity.
Net realisable value is the estimated selling price in the ordinary course of business, less estimated costs of completionand estimated costs necessary to make the sale.
Where duty paid imported materials / indigenous materials are consumed, in manufacture of products for export,prior to receipt of duty-free materials under the Advance License Scheme, the estimated excess cost of suchmaterials over that of duty free materials is carried forward and charged to revenue on consumption of such duty-freematerials.
10. Expenditure on regulatory approvals
Expenditure incurred for obtaining regulatory approvals and registration of products developed in-house is charged toprofit and loss account.
11. Employees stock option plan
The accounting value of stock options representing the excess of the market price on the date of grant over the exerciseprice of the shares granted under "Employees Stock Option Scheme" of the Company, is amortised as "Deferred employeescompensation" on straight-line basis over the vesting period in accordance with the SEBI (Employee Stock Option Schemeand Employee Stock Purchase Scheme) Guidelines, 1999 and guidance note 18 "Share Based Payments" issued by Instituteof Chartered Accountants of India.
12. Revenue recognition
Revenue is recognised to the extent that it can be reliably measured and is probable that the economic benefits will flowto the Company.
Sale of Goods
Revenue from sale of goods is recognised when the significant risks and rewards of ownership of the goods are transferredto the customer and is stated net of trade discounts, excise duty, sales returns and other levies.
Royalties, Technical Know-how and Licensing income
Revenue is recognised on accrual basis in accordance with the terms of the relevant agreement.
Interest
Revenue is recognised on a time proportion basis taking into account the amount outstanding and the applicable rate ofinterest.
Dividends
Revenue is recognised when the right to receive is established.
Chargebacks
In the United States, large customers are the major wholesalers who resell products to third party customers like managedcare organisations, drug store chains and pharmacies. A significant part of the gross revenues from such wholesalersare subject to various forms of rebates and allowances (referred to as "Chargebacks"), which are recorded as reductionsfrom the gross revenues. The computation of the estimate for expected chargebacks is complex and involves significantjudgment based on historical experience and estimated wholesaler inventory levels, as well as expected sell-throughlevels by the wholesalers to indirect customers. The primary factors considered in developing and evaluating provisionfor chargbacks include the average historical chargeback credits and an estimate of the inventory held by such wholesalers,based on internal analysis of wholesaler's historical purchases and contract sales.
SCHEDULES FORMING PART OF THE CONSOLIDATED FINANCIAL STATEMENTS
FOR THE YEAR ENDED DECEMBER 31, 2007
SCHEDULE 25
SIGNIFICANT ACCOUNTING POLICIES (Contd.)
Ranbaxy Laboratories Limited Annual Report 2007 Consolidated Schedules

92
SCHEDULES FORMING PART OF THE CONSOLIDATED FINANCIAL STATEMENTS
FOR THE YEAR ENDED DECEMBER 31, 2007
SCHEDULE 25
SIGNIFICANT ACCOUNTING POLICIES (Contd.)
13. Export benefits / incentive
Export entitlements in respect of the exports made under the Duty Entitlement Pass Book ("DEPB") Scheme are recognisedin the profit and loss account when the right to receive credit as per the terms of the scheme is established.
Obligations / entitlements under the Advance Licence Scheme for import of raw materials are accounted for on purchaseof raw materials / export sales.
14. Research and development
Revenue expenditure incurred on research and development is charged to profit and loss account in the year it is incurred.
Capital expenditure is included in the respective heads under fixed assets and depreciation thereon is charged todepreciation account.
15. Foreign exchange transactions
Indian Rupee is the reporting currency for the Group. However, the local currencies of non-integral overseas subsidiariesand joint venture are different from the reporting currency of the Group. The translation of local currencies into IndianRupee is performed for assets and liabilities (excluding share capital, opening reserves and surplus), using the exchangerate as at the balance sheet date, for revenues, costs and expenses using weighted average exchange rate during thereporting period. Share capital, opening reserves and surplus are carried at historical cost. Resultant currency translationexchange gain/loss is carried as foreign currency translation reserve under reserves and surplus. Investments in foreignentities are recorded at the exchange rate prevailing on the date of making the investment.
Income and expenditure items of integral foreign operations are translated at the monthly average exchange rate of theirrespective foreign currencies. Monetary items at the balance sheet date are translated using the rates prevailing on thebalance sheet date. Non- monetary assets are recorded at the rates prevailing on the date of the transaction.
Transactions in foreign currencies are recorded by the reporting entities in their local currency at the rates prevailing onthe date of the transaction. Monetary items denominated in foreign currency are restated at the rates prevailing on thebalance sheet date.
Exchange differences arising on the settlement of monetary items or on reporting company's monetary items at ratesdifferent from those at which they were initially recorded during the year, or reported in the previous financial statements,are recognised as income or expense in the year in which they arise.
The exchange differences arising on the forward contracts to hedge the foreign currency risk of an underlying asset orliability existing on the date of the contract are recognised in the profit and loss account of the period in which the exchangerates change, based on the difference between i) foreign currency amount of the forward contract translated at theexchange rates at the reporting date, or the settlement date where the transaction is settled during the reporting period,and ii) the same foreign currency amount translated at the latter of the date of the inception of the contract and the lastreporting date, as the case may be. The premium or discount on all such contracts arising at the inception of eachcontract is amortised as expense or income over the life of the contract.
In case of forward exchange contracts which are entered into to hedge the foreign currency risk of firm commitments orhighly probable forecast transactions, the premium or discount arising at the inception of the forward foreign currencycontracts is amortised as an expense or income over the life of the contract.
Any profit or loss arising on cancellation or renewal of forward foreign exchange contracts is recognised as income orexpense for the year.
In respect of foreign currency option contracts which are entered into to hedge highly probable forecasted transactionsthe cost of these contracts, if any, is expensed over the period of the contract. Any profit or loss arising on settlement orcancellation of currency options is recognised as income or expense for the period in which settlement or cancellationtakes place. The effect of these currency option contracts outstanding at the year-end, in the form of unrealised gains/losses, is not recognised.

93
16. Employee benefits
Liabilities in respect of defined benefit plans other than provident fund schemes are determined based on actuarial valuationmade by an independent actuary as at the balance sheet date. The actuarial gains or losses are recognised immediatelyin the profit and loss account. In respect of provident fund schemes, administered by trust, liability is recognised for anyshortfall in the plan assets vis-à-vis fund obligation.
Contribution towards the defined contribution plans are recognised in the profit and loss account on accrual basis.
17. Earnings per share
Basic earnings per share are calculated by dividing the net profit or loss for the period attributable to equity shareholdersby the weighted average number of equity shares outstanding during the period. The weighted average numbers of equityshares outstanding during the period are adjusted for events of bonus issue and share split.
For the purpose of calculating diluted earnings per share, the net profit or loss for the period attributable to equityshareholders and the weighted average number of shares outstanding during the period are adjusted for the effects of alldilutive potential equity shares.
18. Taxes on income
Provision for tax for the year comprises estimated current income-tax determined to be payable in respect of taxableincome and deferred tax being the tax effect of temporary timing differences representing the difference between taxableand accounting income that originate in one period and are capable of reversal in one or more subsequent periods and iscalculated in accordance with the relevant domestic tax laws. Deferred tax is measured based on the tax rates and the taxlaws enacted or substantively enacted as at the balance sheet date. Deferred tax assets are recognised only to the extentthat there is reasonable certainty that sufficient future taxable income will be available against which such deferred taxassets can be realised. In respect of carry forward losses and unabsorbed depreciation, deferred tax assets are recognisedonly to the extent there is virtual certainty that sufficient future taxable income will be available against which such deferredtax assets can be realised.
19. Contingent liabilities and provisions
The Group creates a provision when there is a present obligation as a result of a past event where the out flow of economicresources is probable and a reliable estimate of the amount of obligation can be made. A disclosure is made for possibleor present obligations that may, but probably will not, require out flow of resources or where a reliable estimate of apresent obligation cannot be made, as a contingent liability in the financial statements.
20. Impairment of assets
The Group on an annual basis tests the carrying amount of assets for impairment so as to determine a) the provision forimpairment loss, if any, or b) the reversal, if any, of impairment loss recognised in previous periods. Such impairment lossor reversal is recognised in the profit and loss account for the year.
21. Lease accounting
i) Assets acquired on lease where the Group has substantially all the risks and rewards of ownership are classified asfinance leases. Such assets are capitalised at the inception of the lease at the lower of fair value or the present valueof minimum lease payments and a liability is created for an equivalent amount. Each lease rental paid is allocatedbetween the liability and the interest cost, so as to obtain a constant periodic rate of interest on the outstandingliability for each period. The resultant interest cost is charged to profit and loss account on accrual basis.
ii) Operating lease payments are recognised as an expense on a straight-line basis over the term of the lease.
SCHEDULES FORMING PART OF THE CONSOLIDATED FINANCIAL STATEMENTS
FOR THE YEAR ENDED DECEMBER 31, 2007
SCHEDULE 25
SIGNIFICANT ACCOUNTING POLICIES (Contd.)
Ranbaxy Laboratories Limited Annual Report 2007 Consolidated Schedules

94
SCHEDULES FORMING PART OF THE CONSOLIDATED FINANCIAL STATEMENTS
FOR THE YEAR ENDED DECEMBER 31, 2007
SCHEDULE 26
NOTES TO THE CONSOLIDATED FINANCIAL STATEMENTS
1. Share capital
a] Share capital includes:
[i] 293,698,988 (Previous year 293,698,988 ) Equity shares of Rs. 5 each allotted as fully paid bonus shares bycapitalisation out of securities premium and reserves.
[ii] 6,562,308 (Previous year 6,562,308) Equity shares of Rs. 5 each allotted as fully paid up pursuant to contract withoutpayment being received in cash.
b] Outstanding stock options for equity shares of the parent company under the "Employees Stock Option Scheme":
Date of grant Exercise price 2007 2006Rs. Numbers Numbers
January 12, 2001* 336.50 (210.31) 72,887 (116,619) 101,397 (162,235)December 3, 2001* 297.50 (185.94) 161,551 (258,482) 233,532 (373,651)April 1, 2002* 372.50 (232.81) 291,027 (465,643) 383,180 (613,088)February 7,2003 283.50 – 833,919 – 997,739 –January 22,2004 496.00 – 1,547,602 – 1,735,742 –January 17, 2005 538.50 – 2,034,100 – 2,288,440 –January 17, 2006 392.00 – 982,120 – 1,110,950 –January 17, 2007 430.00 – 1,245,750 – – –
7,168,956 (840,744) 6,850,980 (1,148,974)
* The figures in parenthesis represents adjusted exercise price in accordance with the Employees Stock Option Schemeof the company on account of issue of bonus shares in the ratio of 3:5 on October 11, 2002.
2. Secured loans:
Loans under different categories are secured against certain assets, property, equipment and other immovable property,inventories and receivable of the Parent Company or concerned subsidiary.
Rs. Million2007 2006
3. Loans repayable within one year 12,397.08 13,991.24
4. Fixed assets
Land includes:
a] cost of leasehold land Rs. 231.56 million (Previous year Rs. 213.43 million).b] cost of freehold land Rs. 52.36 million (Previous year Rs. 66.03 million) pending
registration in the name of the Parent Company and the concerned subsidiaries.
5. Investments – Net of provision
QuotedAssociates:
Aggregate book value 1,077.62 200.00Market value 1,177.73 142.60
Others:Aggregate book value 232.69 2.78Market value 1,629.30 2.86
UnquotedAssociates:
Aggregate book value 936.81 –Others:
Aggregate book value 156.05 159.57
6. Premium on outstanding forward exchangecontracts to be recognised in the subsequent year 86.27 216.36
7. Cash and bank balances: Includes deposit receipts pledged with the Government Authorities 0.71 0.88

95
SCHEDULES FORMING PART OF THE CONSOLIDATED FINANCIAL STATEMENTS
FOR THE YEAR ENDED DECEMBER 31, 2007
SCHEDULE 26
NOTES TO THE CONSOLIDATED FINANCIAL STATEMENTS (Contd.)
Ranbaxy Laboratories Limited Annual Report 2007 Consolidated Schedules
8. Share-based compensation
In accordance with the guidance note - 18 "Share based payments" the following information relates to the stock options granted bythe Parent Company.
2007
Weighted-Weighted- average
Range of average remainingStock options exercise prices exercise price contractual life
(numbers) (Rs.) (Rs.) (years)
Outstanding, beginning of the year 6,850,980 283.50-538.50 446.35 7.35
Granted during the year 1,331,575 430.00 430.00 9.05
Forfeited during the year (437,184) 283.50-538.50 472.46 –
Exercised during the year (281,954) 283.50-538.50 317.05 –
Lapsed during the year (294,461) 283.50-538.50 459.64 –
Outstanding, end of the year 7,168,956 283.50-538.50 446.52 6.87
Exercisable at the end of the year 3,238,112 283.50-538.50 435.42 6.00
2006
Weighted-Weighted- average
Range of average remainingStock options exercise prices exercise price contractual life
(numbers) (Rs.) (Rs.) (years)
Outstanding, beginning of the year 6,704,838 283.50 - 538.50 456.13 8.01
Granted during the year 1,221,300 392.00 392.00 9.05
Forfeited during the year (676,430) 283.50 - 538.50 472.42 –
Exercised during the year (181,883) 283.50 - 538.50 315.26 –
Lapsed during the year (216,845) 283.50 - 538.50 471.18 –
Outstanding, end of the year 6,850,980 283.50 - 538.50 446.35 7.35
Exercisable at the end of the year 2,282,437 283.50 - 538.50 417.60 6.52
The following table summarises information about stock options outstanding as at December 31, 2007:
Options outstanding Options exercisable
Range of exercise prices Numbers Weighted- Weighted- Numbers Weighted-average average average
remaining exercise exercisecontractual life price price
Upto Rs 283.50 833,919 5.10 283.50 606,453 283.50
Rs 284.00 - Rs 392.00 1,507,585 6.63 375.43 746,292 359.36
Rs 393.00 - Rs 538.50 4,827,452 7.24 496.88 1,885,367 514.39
7,168,956 6.87 446.52 3,238,112 435.42
The following table summarises the assumptions used in calculating the fair value in the year ended December 31, 2007 and 2006:
2007 2006
Dividend yield 1.98 percent 2.17 percent
Expected life 6.5 years 6.5 years
Risk free interest rate 7.97 percent 7.55 percent
Volatility 44.95 percent 40.55 percent

96
SCHEDULES FORMING PART OF THE CONSOLIDATED FINANCIAL STATEMENTS
FOR THE YEAR ENDED DECEMBER 31, 2007
SCHEDULE 26
NOTES TO THE CONSOLIDATED FINANCIAL STATEMENTS (Contd.)
9. Employee benefits
During the year, the Group has adopted Accounting Standard 15 (Revised 2005) 'Employees Benefits'. Since the Group was alreadyusing the Projected Unit Credit Method and other assumptions as per the market, hence no change has been adjusted to theopening balance of reserves and surplus.
For the below mentioned defined benefits schemes :
a. Pension
b. Contribution to Gratuity Fund Trust
c. Provident Fund
d. Leave Encashment
Actuarial valuation of pension, leave encashment and gratuity have been done with the following assumptions.
Particulars Pension Leave Encashment Gratuity(Unfunded) (Unfunded) (Funded)
Discount rate 8% 8% 8%
Rate of increase in Compensation levels 5.5% 5.5% 5.5%
Rate of return of plan assets N.A. N.A. 8%
Expected Average remaining working lives of employees (years) 21.43 21.38 - 24.35 21.43 - 24.34
Rs. MillionChange in the present value of obligation : Pension Leave Provident Gratuity Gratuity
Encashment Fund(Unfunded) (Unfunded) (Funded) (Funded) (Unfunded)
Present value of obligation as at January 1,2007 957.65 153.70 1,579.71 314.57 –
Interest Cost 76.61 12.30 143.19 24.42 –
Current Service Cost 158.86 31.61 – 29.90 4.12
Contribution
Employer – – 88.29 – –
Employee – – 184.87 – –
Benefits paid (25.70) (48.38) (176.92) (27.46) –
Actuarial (gain)/loss on obligations 38.07 37.55 – 37.45 –
Present value of obligation as at December 31,2007 1,205.49 186.78 1,819.14 378.88 4.12
Change in the Fair value of Plan Assets : Provident Fund Gratuity(Funded) (Funded)
Fair value of Plan Assets at January 1,2007 1,625.65 314.57
Actual Return on Plan Assets 141.70 24.35
Contributions 273.16 43.06
Benefits paid (176.92) (27.46)
Fair value of Plan Assets at December 31,2007 1,863.59 354.52
The fair value of the plan assets under the provident fund schemes has been determined at amounts based on their value at thetime of redemption, assuming a constant rate of return to maturity.
Reconciliation of present value of defined benefit obligation and the fair value of assets Gratuity(Funded)
Present value of funded obligation as at December 31, 2007 378.88
Fair value of Plan Assets as at the end of the period funded status 354.52
Present value of unfunded obligation as at December 31, 2007 24.36
Unfunded Net Liability recognised in Balance Sheet 24.36

97
SCHEDULES FORMING PART OF THE CONSOLIDATED FINANCIAL STATEMENTS
FOR THE YEAR ENDED DECEMBER 31, 2007
SCHEDULE 26
NOTES TO THE CONSOLIDATED FINANCIAL STATEMENTS (Contd.)
Ranbaxy Laboratories Limited Annual Report 2007 Consolidated Schedules
Expenses recognised in the Profit and Loss Account Pension Leave Encashment Gratuity(Unfunded) (Unfunded) (Funded and
unfunded)
Current Service Cost 158.86 39.80 34.02
Interest Cost 76.61 12.30 24.42
Expected Return on Plan Assets – – (25.50)
Settlement Cost/Credit (9.57) (3.96) (1.75)
Net actuarial (gain)/loss recognised in the period 38.07 37.55 38.61
Total Expenses recognised in the Profit & Loss Account 263.97 85.69 69.80
Duirng the year the Group has recognised an expense of Rs.137.99 million towards Provident Fund schemes.
The major categories of plan assets as a percentage of total plan assets are as under:
Particulars Provident Fund Gratuity
Central Government secutiries 10% 15%
State Government securities 12% 10%
Bonds and securities of public sector / Financial Institutions 61% 56%
Deposit with Reserve Bank of India 17% 19%
Rs. Million2007 2006
10. Remuneration to Directors of Parent Company*
Salaries and allowances 149.50 77.76
Contribution to provident and other funds 8.92 5.76
Directors' fee 2.42 2.91
Commission 144.00 38.90
Perquisites 7.51 7.77
312.35 133.10
* Exclusive of provision for future liabilities in respect of gratuity, leave encashment (which are based on actuarial valuationdone on overall Company basis) and amortisation of deferred employees compensation on grant of stock options under"Employees Stock Option Scheme" of the Parent Company.
Exclusive of pension paid/ payable to a non-executive director for the services rendered in earlier years as a whole timedirector/employee Rs. 2.29 million (Previous year Rs. 2.29 million).
Excludes Rs. 2.55 million (previous year nil) paid as gratuity to a director upon his separation by the gratuity trust set up bythe Company.
Rs. Million2007 2006
11. Contingent liabilities and provisions
Claims not acknowledged as debts* 1,463.46 1,172.69
Indirect taxes* 234.22 216.45
Guarantees to banks on behalf of others – 71.68
Bills purchased/discounted under letters of credit 1.76 –
*Rs. 348.57 million (Previous year 334.44 million) deposited under protest.
Interest on certain claims may be payable as and when the outcome of the relatedclaim is determined and has not been included above.
12. Estimated amount of contracts remaining to be executed oncapital account and investments, net of advances. 761.75 491.44
13. Tax earlier years includes:Current-tax (1.01) (312.39)Deferred tax expense – 164.33

98
SCHEDULES FORMING PART OF THE CONSOLIDATED FINANCIAL STATEMENTS
FOR THE YEAR ENDED DECEMBER 31, 2007
SCHEDULE 26
NOTES TO THE CONSOLIDATED FINANCIAL STATEMENTS (Contd.)
14. Derivatives
The Group uses Forward Contracts, Options and Swaps to hedge its risks associated with fluctuations in foreign currencies andInterest rates relating to foreign currency liabilities, certain firm commitments and some forecasted transactions related to foreigncurrency trade. The use of Forward Contracts, Options and Swaps is governed by Group's overall strategy. The Groupdoes not use Forward Contracts, Options and Swaps for speculative purpose. The following are outstanding ForwardContracts, Options and Swaps as on December 31, 2007:
Rs. Million
For Hedging currency risks 2007Forward covers:
Receivables 13,062.37Payables 654.02Loans 6,399.80
Options & SwapsReceivables 11,352.96Loans 4,205.26
During the year 2007 the Group has entered into floating to fixed interest rate swap to hedge its exposure on JPY LIBOR relatedto its external commercial borrowing aggregating to JPY 9.35 billion.
15. Leases
Finance lease :
a] The Group has acquired assets under finance lease comprising mainly of buildings and vehicles. The minimum leaserentals and the present value of minimum lease payments as at December 31, 2007 and 2006 are as under:
Rs. Million
2007 2006
a) Minimum lease payments outstanding 525.34 667.55
b) Present value of minimum lease payments 451.87 561.93
c) Amounts due
Minimum lease Present value of minimumpayments lease payments
Rs. Million Rs. Million
2007 2006 2007 2006
i) not later than one year 67.08 77.24 48.23 57.91ii) later than one year but 278.17 307.82 231.31 250.86
not later than five yearsiii) later than five years 180.09 282.49 172.33 253.17
Operating lease :
b) The Group has leased various commercial premises and other facilities under non-cancellable operating lease. Thefuture lease payments in respect of these are as follows:
Minimum lease payments: Rs. Milliona. not later than one year 105.58b. later than one year but not later than five years 170.19c. later than five years 58.71
Total 334.48
c] The Lease expense recognised during the year amounted to Rs. 501.24 million (Previous year Rs. 452.52 million)
16. Related party disclosures
a] Joint Venture :
M/s. Nihon Pharmaceuticals Industry Co. Ltd. Japan

99
SCHEDULES FORMING PART OF THE CONSOLIDATED FINANCIAL STATEMENTS
FOR THE YEAR ENDED DECEMBER 31, 2007
SCHEDULE 26
NOTES TO THE CONSOLIDATED FINANCIAL STATEMENTS (Contd.)
Ranbaxy Laboratories Limited Annual Report 2007 Consolidated Schedules
b ] Relationship:
Key management Relatives* Entities over which significantpersonnel influence is exercised
Mr. Malvinder Mohan Singh Mrs. Nimmi Singh, mother Fortis Healthcare Ltd.(Including its subsidiaries)SRL Ranbaxy Ltd.International Hospitals Ltd.Religare Securities LimitedRan Air Services LimitedReligare Travels (India) Ltd.(Formerly Spectrum Travels (India) Ltd.)Escorts Heart Institute and Research Center Ltd.Fortis Clinical Research Ltd.
Dr. Brian W TempestMr. Ramesh L AdigeMr. Atul Sobti **Mr. Ram S. Ramasundar **
* Relatives of key management personnel with whom the Company had transactions during the year.** For part of the year
c] Associates:
M/s. Zenotech Laboratories Limited, IndiaM/s. Shimal Research Laboratories Limited, India
The following transactions were carried out with related parties in the ordinary course of business.
Rs. Million(i) Joint Venture: 2007 2006
Sale of finished goods 107.56 165.86Product quality claims 3.32 –Balance at the end of the year: Receivables 20.02 24.64
(ii) Relationship:
a) Key management personnel and their relatives
Remuneration to key management personnel 317.71 147.26House rent allowance 2.40 2.40Pension 2.03 2.03Medical reimbursement 0.03 0.02
b) Entities over which significant influence is exercised
Purchase of materials/finished goods – 1.19Sale of finished goods 13.38 25.13Service availed 261.08 159.14Services rendered/other receipts 9.46 3.11Purchase of assets 2.95 –Balance at the end of the year:
Receivables 3.96 10.95Payables 12.14 7.80
(iii) Associates:
Project cost of exhibit batches 17.65 –Balance outstanding at the end of the year : Payables 7.30 –
17. Segment information
Business segments
For management purposes, the Group reviews the performance on the basis of business units identified as Pharmaceuticalsand Other businesses, which are reportable segments.
Pharmaceuticals segment comprise of manufacture and trading of Formulations, Active Pharmaceuticals Ingredients (API)and Intermediate, Generics, Drug discovery and Consumer Health Care products.

100
SCHEDULES FORMING PART OF THE CONSOLIDATED FINANCIAL STATEMENTS
FOR THE YEAR ENDED DECEMBER 31, 2007
SCHEDULE 26
NOTES TO THE CONSOLIDATED FINANCIAL STATEMENTS (Contd.)
Other businesses comprise of chartering of aircrafts (discontinued during the previous year) and rendering of financial services.
Geographic Segments
The Group's business is organised into four key geographic segments. Revenues are attributable to individual geographic segmentsbased upon the location of the customers.
Other Information
All segment revenues, expenses, assets and liabilities are directly attributable to the segments and disclosed accordingly.
Segment revenues, expenses and results include transfers between business segments. Inter-segment transfers are accounted forat selling price to the transferring segment. Such transfers are eliminated on consolidation.
The accounting policies consistently used in the preparation of the financial statements are also applied to revenues and expenditureof individual segments.
Segment information disclosures as required under accounting standard on "Segment Reporting" issued by Institute of CharteredAccountants of India.
a] Primary segment information
Rs. Million
Pharmaceuticals Others Segment Total Elimination Total
2007 2006 2007 2006 2007 2006 2007 2006 2007 2006REVENUE
External revenue 69,822.46 61,302.88 – 12.73 69,822.46 61,315.61 – – 69,822.46 61,315.61
Inter segment revenue – – – – – – – – – –
Total revenue 69,822.46 61,302.88 – 12.73 69,822.46 61,315.61 – – 69,822.46 61,315.61
RESULTS
Total segment results 7,297.20 6,842.41 (333.50) 21.45 6,963.70 6,863.86 – – 6,963.70 6,863.86
Interest expense (1,411.88) (1,036.32)
Interest income 218.72 211.22
Exceptional items – –
Income from sale of undertaking – –
Unallocated corporateincome (net of expense) 4,214.81 471.58
Income taxes (2,118.86) (1,356.74)
Profit after tax 7,866.49 5,153.60
OTHER INFORMATION
Segment assets 85,729.01 79,460.75 15.65 765.22 85,744.66 80,225.96 – – 85,744.66 80,225.96
Unallocated assets 8,330.86 5,077.51
Total assets 94,075.53 85,303.48
Segment liabilities 17,890.57 14,950.37 3.21 411.81 17,893.27 15,362.18 – – 17,893.78 15,362.18
Unallocated liabilities 48,147.86 44,082.58
Total liabilities 66,041.63 59,444.76
Capital Expenditure 7,157.79 19,727.83 – 0.01 7,157.79 19,727.84 – – 7,157.79 19,727.84
Depreciation, amortisation& Impairment 2,183.40 1,841.90 0.01 0.98 2,183.41 1,842.88 – – 2,183.41 1,842.88
Non cash expenses otherthan depreciaton/amortisation & impairment 255.68 226.74 354.92 0.01 610.60 226.75 – – 610.60 226.75
b] Secondary segment information - Geographical
Rs. Million
India Europe North America Asia Pacific
2007 2006 2007 2006 2007 2006 2007 2006
Segment revenue 16,658.86 12,412.62 16,865.84 14,327.80 17,507.99 18,753.29 4,764.19 4,608.02
Segment assets 37,047.08 29,096.89 36,568.71 32,494.04 12,410.89 14,265.88 2,457.82 2,584.99
Capital expenditure 2,617.31 2,158.30 875.89 16,544.31 1,419.42 318.49 122.03 94.39
18. Major Acquisitions
a] Be-Tabs, South Africa
On December 1, 2006, the Group had announced the acquisition of Be-Tabs Pharmaceuticals (Proprietary) Ltd. andBe-Tabs Investment (Proprietary) Ltd. ("Be-Tabs"), in South Africa. During May 2007, the Group acquired 100% stakeand subsequently sold off 25% stake thereby resulting in 75% stake in Be-Tabs Pharmaceuticals (Proprietary) Ltd. and

101
SCHEDULES FORMING PART OF THE CONSOLIDATED FINANCIAL STATEMENTS
FOR THE YEAR ENDED DECEMBER 31, 2007
SCHEDULE 26
NOTES TO THE CONSOLIDATED FINANCIAL STATEMENTS (Contd.)
Be-Tabs Investment (Proprietary) Ltd. These aforementioned acquisitions were made through Ranbaxy (Netherlands) B.V.,The Netherlands, for a total cash consideration of Rs. 2,218.97 million. At the date of the acquisition, the Group recorded thecost of the acquisition as Rs. 2,232.30 million, consisting of cash paid and the direct acquisition costs.
The Group has accounted for this acquisition under the purchase method. Accordingly, the financial results for the postacquisition period have been included in the consolidated financial statements of the Group.
The purchase cost of Rs. 2,232.30 million has been allocated as follows: Rs. Million
Goodwill 1,791.24Property, plant and equipment, net 139.29Other current assets 485.42Total assets acquired 2,415.95Less: Liabilities 183.65Purchase cost 2,232.30
b] Additional stake in Zenotech Laboratories Limited, India:
On November 23, 2007, the parent Company acquired an additional stake in Zenotech Laboratories Limited throughpreferential allotment, representing 16 percent of equity share capital for Rs 878.33 million. Post this acquisition thetotal holding stands at 21.84% of its paid up capital, at a total cost of Rs. 1,078.33 million.
The Group has accounted this as an investment in associate as per AS-23 "Accounting for Investments in associates inConsolidated Financial Statements".
On December 31, 2007, investment value in Zenotech Laboratories Limited includes goodwill of Rs 816.11 millionrepresenting excess of purchase price paid over share in net assets on acquisition date.
c] Stake in Shimal Research Laboratories Limited
During the year ended December 31, 2007, the Parent Company acquired 24.91% of the equity shares of Shimal ReasearchLaboratories Limited for Rs. 934 million.
The Group has accounted this as an investment in associate as per AS-23 "Accounting for Investments in ConsolidatedFinancial Statements".
On December 31, 2007, investment value in Shimal Research Laboratories Limited includes goodwill of Rs 681.67 millionrepresenting excess of purchase price paid over share in net assets on acquisition date.
19. Merger of Mundogen Farma S.A. with Laboratorios Ranbaxy S.L.
Mundogen Farma S.A., subsidiary of Laboratorios Ranbaxy S.L. merged with Laboratorios Ranbaxy S.L. with effect from October1,2007. This merger has been accounted for on the basis of pooling of interest method in accordance with Accounting Standard14, "Accounting for Amalgamations".
20. During the year, Ranbaxy Pharmaceuticals, Inc (RPI). a wholly owned subsidiary of the Group acquired the product rights of 13dermatological products from Bristol Myers Squibb in USA for a total consideration of Rs. 1,065.88 million (US $ 26.25 Million).Based on the report of a professional valuation company engaged by RPI as well as considering the market potential for theseproducts, the useful economic life of these brands have been estimated at 15 years.
21. Food and Drug Administration (FDA) proceedings
Federal Officials, led by the FDA, conducted a search on February 14, 2007, at the US subsidiary's New Jersey premises, andsubpoenas for various categories of documents were issued. The Group is cooperating with the officials in connection with theinvestigation. This includes production of documents in response to queries. The investigation continues and the outcome andrelated impact remain uncertain; therefore, no amounts related to potential losses or potential impacts of an unfavourableoutcome of the investigation have been recorded in the financial statements.
22. Serious Fraud Office (SFO) case
In April, 2006, SFO, UK instituted criminal proceeding against several defendants including Ranbaxy (UK) Limited ("RUKL") forconspiracy to defraud the Secretary of State for Health and others by fixing and maintaining price etc. of medicinal productsduring April 1, 1998 to September 30, 2000.
In March, 2008, an Appellate Court in UK held that price fixing by itself could not be termed as conspiracy to defraud.
No date has been set for the trial to commence. If found guilty, RUKL could be subjected to fine. The Management does notdeem it necessary to make any provision in this regard.
23. Scottish & Northern Ireland Proceedings - civil claims
"In 2005, the Scottish and Northern Irish Health Authorities initiated proceedings by filing civil claims against a number ofpharmaceutical companies, including RUKL on the alleged grounds relating to anti-competitive conduct. RUKL filed defenceto both the proceedings in 2006.
Ranbaxy Laboratories Limited Annual Report 2007 Consolidated Schedules

102
SCHEDULES FORMING PART OF THE CONSOLIDATED FINANCIAL STATEMENTS
FOR THE YEAR ENDED DECEMBER 31, 2007
SCHEDULE 26
NOTES TO THE CONSOLIDATED FINANCIAL STATEMENTS (Contd.)
The Authorities in the year 2007 proposed for a settlement offer of £1.5 million in order to settle the cases. RUKL is defendingthe cases and does not deem it necessary to make any provision in this regard."
24. Consolidated financial statements comprise the financial statements of the Parent Company and its subsidiaries, joint venturesand associate listed below:
Subsidiary Country of Effective groupincorporation shareholding (%)
Ranbaxy Drugs and Chemicals Company India 100.00%Ranbaxy Drugs Limited India 100.00%Rexcel Pharmaceuticals Limited India 100.00%Solus Pharmaceuticals Limited India 100.00%Vidyut Investments Limited India 100.00%Ranbaxy Life Sciences Research Ltd.* India 100.00%Solrex Pharmaceuticals Company # India 100.00%Ranbaxy N.A.N.V. Antilles, The Netherlands 100.00%Ranbaxy Australia Pty. Ltd. Australia 100.00%Ranbaxy Belgium N.V. Belgium 100.00%Ranbaxy Do Brazil Ltda Brazil 100.00%Ranbaxy Pharmaceuticals Canada Inc. Canada 100.00%Ranbaxy Egypt (L.L.C.) Egypt 100.00%Ranbaxy Pharmacie Generiques SAS France 100.00%Office Pharmaceutique Industriel
Et Hospitalier SARL ("OPIH SARL ") France 100.00%Basics GmbH Germany 100.00%Lapharma GmbH Germany 100.00%Ranbaxy (Hong Kong) Limited Hong Kong 100.00%Ranbaxy Hungary Gyogyszereszet Kft Hungary 100.00%Ranbaxy Ireland Ltd. Ireland 100.00%Ranbaxy Italia S.p.A Italy 100.00%Ranbaxy Mexico S.A. de C.V. Mexico 100.00%Ranbaxy Panama, S.A.** Panama 100.00%Ranbaxy-PRP (Peru) S.A.C. Peru 100.00%Ranbaxy Poland S.P. Z.o.o. Poland 100.00%Ranbaxy Portugal - Com E Desenvolv De Prod
Farmaceuticos Unipessoal Lda Portugal 100.00%ZAO Ranbaxy Russia 100.00%Ranbaxy (S.A.) (Proprietary) Ltd. South Africa 100.00%Laboratorios Ranbaxy, S.L. Spain 100.00%Mundogen Farma S.A.*** Spain 100.00%Ranbaxy Pharma AB Sweden 100.00%Ranbaxy Pharmaceuticals BV** The Netherlands 100.00%Ranbaxy (Netherlands) B.V. ("RNBV") The Netherlands 100.00%Ranbaxy Holdings (U.K.) Ltd. United Kingdom 100.00%Ranbaxy (U.K.) Ltd. United Kingdom 100.00%Ranbaxy Europe Ltd. United Kingdom 100.00%Ranbaxy Inc. United States of America 100.00%Ranbaxy Pharmaceuticals, Inc. United States of America 100.00%Ranbaxy USA, Inc. United States of America 100.00%Ohm Laboratories, Inc. United States of America 100.00%Ranbaxy Laboratories, Inc. United States of America 100.00%Ranbaxy Vietnam Company Ltd. Vietnam 100.00%Unichem Distributors Ltd.** Thailand 99.96%Unichem Pharmaceuticals Ltd.** Thailand 98.50%Gufic Pharma Limited India 98.00%S.C. Terapia SA Romania 96.70%Terapia Distributie S.R.L. Romania 96.70%Ranbaxy Farmaceutica Ltda Brazil 95.30%Bounty Holdings Co. Ltd.** Thailand 89.08%Ranbaxy Unichem Company Ltd. Thailand 88.56%
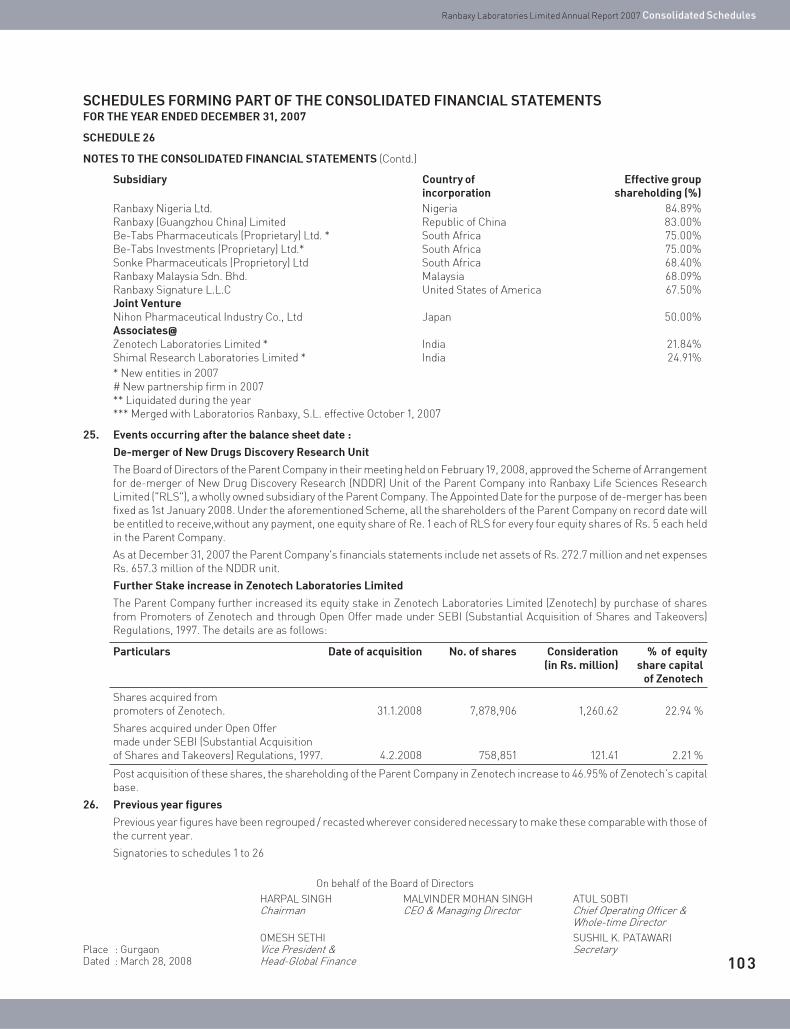
103
Ranbaxy Nigeria Ltd. Nigeria 84.89%Ranbaxy (Guangzhou China) Limited Republic of China 83.00%Be-Tabs Pharmaceuticals (Proprietary) Ltd. * South Africa 75.00%Be-Tabs Investments (Proprietary) Ltd.* South Africa 75.00%Sonke Pharmaceuticals (Proprietory) Ltd South Africa 68.40%Ranbaxy Malaysia Sdn. Bhd. Malaysia 68.09%Ranbaxy Signature L.L.C United States of America 67.50%Joint VentureNihon Pharmaceutical Industry Co., Ltd Japan 50.00%Associates@Zenotech Laboratories Limited * India 21.84%Shimal Research Laboratories Limited * India 24.91%
* New entities in 2007# New partnership firm in 2007** Liquidated during the year*** Merged with Laboratorios Ranbaxy, S.L. effective October 1, 2007
25. Events occurring after the balance sheet date :
De-merger of New Drugs Discovery Research Unit
The Board of Directors of the Parent Company in their meeting held on February 19, 2008, approved the Scheme of Arrangementfor de-merger of New Drug Discovery Research (NDDR) Unit of the Parent Company into Ranbaxy Life Sciences ResearchLimited ("RLS"), a wholly owned subsidiary of the Parent Company. The Appointed Date for the purpose of de-merger has beenfixed as 1st January 2008. Under the aforementioned Scheme, all the shareholders of the Parent Company on record date willbe entitled to receive,without any payment, one equity share of Re. 1 each of RLS for every four equity shares of Rs. 5 each heldin the Parent Company.
As at December 31, 2007 the Parent Company's financials statements include net assets of Rs. 272.7 million and net expensesRs. 657.3 million of the NDDR unit.
Further Stake increase in Zenotech Laboratories Limited
The Parent Company further increased its equity stake in Zenotech Laboratories Limited (Zenotech) by purchase of sharesfrom Promoters of Zenotech and through Open Offer made under SEBI (Substantial Acquisition of Shares and Takeovers)Regulations, 1997. The details are as follows:
Particulars Date of acquisition No. of shares Consideration % of equity(in Rs. million) share capital
of Zenotech
Shares acquired frompromoters of Zenotech. 31.1.2008 7,878,906 1,260.62 22.94 %
Shares acquired under Open Offermade under SEBI (Substantial Acquisitionof Shares and Takeovers) Regulations, 1997. 4.2.2008 758,851 121.41 2.21 %
Post acquisition of these shares, the shareholding of the Parent Company in Zenotech increase to 46.95% of Zenotech’s capitalbase.
26. Previous year figures
Previous year figures have been regrouped / recasted wherever considered necessary to make these comparable with those ofthe current year.
Signatories to schedules 1 to 26
Ranbaxy Laboratories Limited Annual Report 2007 Consolidated Schedules
SCHEDULES FORMING PART OF THE CONSOLIDATED FINANCIAL STATEMENTS
FOR THE YEAR ENDED DECEMBER 31, 2007
SCHEDULE 26
NOTES TO THE CONSOLIDATED FINANCIAL STATEMENTS (Contd.)
Subsidiary Country of Effective groupincorporation shareholding (%)
On behalf of the Board of Directors
HARPAL SINGH MALVINDER MOHAN SINGH ATUL SOBTIChairman CEO & Managing Director Chief Operating Officer &
Whole-time Director
OMESH SETHI SUSHIL K. PATAWARIPlace : Gurgaon Vice President & SecretaryDated : March 28, 2008 Head-Global Finance

104
FOR THE YEAR ENDED DECEMBER 31, 2007
FINANCIAL DETAILS OF THE
SUBSIDIARY COMPANIES
Rs. in MillionName of the Closing Capital Reserves Total Total Investments Turnover Profit Provision Profit ProposedSubsidiary exchange rate assets liabilities (except in before for after dividend
against Indian case of tax tax taxRupee as on investment in
December subsidiaries)*31, 2007
Solus Pharmaceuticals Ltd. 1.0000 70.01 154.70 234.90 10.19 205.05 – 0.33 (1.33) 1.66 –
Rexcel Pharmaceuticals Ltd. 1.0000 50.00 190.88 283.00 42.12 205.05 – (0.06) 1.08 (1.14) –
Vidyut Investments Ltd. 1.0000 250.08 (237.64) 15.65 3.21 – 5.84 (333.44) (1.45) (333.91) –
Ranbaxy Drugs andChemicals Company(A public company withunlimited liability) 1.0000 62.00 5.94 69.85 1.91 67.30 – 3.13 0.73 2.40 –
Ranbaxy Drugs Ltd. 1.0000 31.00 (0.40) 33.71 3.11 31.00 – (0.01) – (0.01) –
Gufic Pharma Ltd. 1.0000 0.50 1.88 2.54 0.16 – 0.24 0.39 0.04 0.35 –
Ranbaxy Life SciencesResearch Limited 1.0000 0.50 (0.03) 0.48 0.01 – – (0.03) – (0.03) –
Ranbaxy(Guangzhou China) Ltd.,China 5.3971 352.16 (264.33) 358.06 270.23 – 555.69 4.57 – 4.57 –
Ranbaxy (Netherlands) B.V.(Consolidated),The Netherlands 39.4200 19,710.12 6,919.82 42,969.21 16,339.27 418.44 36,272.26 1,801.66 582.64 1,051.04 # –
Ranbaxy Nigeria Ltd.,Nigeria 0.3332 13.33 216.79 517.36 287.24 – 826.03 78.14 22.43 55.71 6.66
Ranbaxy (Hong Kong) Ltd.,(Consolidated)Hongkong 39.4200 12.25 (24.13) 43.68 55.56 – 180.27 18.45 – 18.45 –
Ranbaxy MalaysiaSdn. Bhd.,Malaysia 11.9112 95.29 415.16 1,018.28 507.53 – 974.45 126.38 31.45 94.93 –
Ranbaxy UnichemCompany Ltd.,Thailand 1.1690 116.90 108.50 284.35 58.95 – 448.74 64.47 19.60 44.87 –
Ranbaxy PharmacieGeneriques SAS,(Consolidated),France 57.5217 428.42 23.58 2,339.98 1,887.98 – 3,038.87 (53.50) (56.95) 3.45 –
# After adjustment of Rs. 167.98 million towards Minority interest.
*Detail of Investments
Name of the subsidiary Particulars Nature of Face value Numbers Amountinvestments (Rs. Million)
Solus Pharmaceuticals Ltd. Solrex Pharmaceuticals Company Capital contribution 205.05(A partnership firm)
Rexcel Pharmaceuticals Ltd. Solrex Pharmaceuticals Company Capital contribution 205.05(A partnership firm)
Ranbaxy Drugs and Sidmak Laboratories (India) Limited Equity shares Rs. 10 167,330 34.30Chemicals Company Rexcel Pharmaceuticals Ltd. Optionally Convertible Rs. 1000 33,000 33.00(A public company with Debenturesunlimited liability)
Ranbaxy Drugs Ltd. Ranbaxy Drugs and Chemicals Company Equity shares Rs. 10 3,100,000 31.00(A public company with unlimited liability)
Ranbaxy (Netherlands) B.V. Nihon Pharmaceticals Equity shares Yen 500 160,000 305.38(Consolidated), The Netherlands Industry Co. Ltd., Japan
Ranbaxy (Guangzhou China) Limited, China Capital contribution 15.12
Ranbaxy Pharmacie Generiques, SAS, France Equity shares 9 27,600 97.94
Note:
In terms of approval granted by the Central Government under Section 212(8) of the Companies Act, 1956, a copy of the Balance Sheet, Profit and LossAccount, Report of the Board of Directors and the Report of the Auditors of the subsidiary companies have not been attached with Annual Report of theCompany. The Company will make available these document and the related details upon request by any investor of the Company and of its subsidiary.These documents will also be available for inspection by any investor at the Head Office of the Company at 12th Floor, Devika Tower, 6, Nehru Place,New Delhi-110019, and that of the subsidiary companies concerned.

105
REPORT OF INDEPENDENT CERTIFIED PUBLIC ACCOUNTANTS
Board of Directors and Stockholders
Ranbaxy Laboratories Limited (the “Company”) and Subsidiaries (“the Group”)
We have audited the accompanying consolidated balance sheets of Ranbaxy Laboratories Limited and subsidiaries
as of December 31, 2007 and 2006, and the related consolidated statements of income, stockholders' equity and
comprehensive income and cash flows for the years then ended. These financial statements are the responsibility
of the Group's management. Our responsibility is to express an opinion on these financial statements based on our
audits. We did not audit the financial statements as of December 31, 2006 of Terapia S.A., a wholly owned Subsidiary
of the Company, which statements reflect total assets, revenues and net income consituting 7.23 percent, 4.46
percent and 11.82 percent respectively, of the related consolidated totals as of December 31, 2006. Those statements
were audited by other auditors whose report has been furnished to us, and our opinion, insofar as it relates to the
amounts included for Terapia S.A. is based solely upon the report of the other auditors.
We conducted our audits in accordance with auditing standards generally accepted in the United States of America
as established by the Auditing Standards Board of the American Institute of Certified Public Accountants. These
standards require that we plan and perform the audit to obtain reasonable assurance about whether the financial
statements are free of material misstatement. An audit includes consideration of internal controls over financial
reporting as a basis for designing audit procedures that are appropriate in the circumstances, but not for the
purpose of expressing an opinion on the effectiveness of the Company's internal control over financial reporting.
Accordingly, we express no such opinion. An audit also includes examining, on a test basis, evidence supporting
the amounts and disclosures in the financial statement, assessing the accounting principles used and significant
estimates made by management, as well as evaluating the overall financial statement presentation. We believe
that our audits provide a reasonable basis for our opinion.
In our opinion, based on our audit and the report of other auditors, the consolidated financial statements referred
to above present fairly, in all material respects, the consolidated financial position of Ranbaxy Laboratories Limited
and its subsidiaries as of December 31, 2007 and 2006, and the consolidated results of their operations and cash
flows for the years then ended, in conformity with accounting principles generally accepted in the United State of
America.
As discussed in Note Q to the financial statements, in 2007, the Company has adopted Financial Accounting
Standards Board Interpretation No. 48, Accounting for Uncertainty in Income Taxes-an interpretation of FASB
Statement No. 109.
GRANT THORNTON
New Delhi, India
March 28, 2008
CONSOLIDATED FINANCIAL STATEMENTS –
US GAAP

106
RANBAXY LABORATORIES LIMITED AND SUBSIDIARIES
CONSOLIDATED BALANCE SHEETS(All amounts in Rupees Million, unless otherwise stated)
As at December 31,
2007 2006
ASSETS
Current assets
Cash and cash equivalents 4,122.30 2,762.81
Restricted cash 86.20 108.18
Accounts receivable, net of allowances 14,759.91 15,599.43
Inventories 16,284.88 15,992.42
Deferred income taxes 700.72 1,091.14
Income taxes recoverable 1,792.07 1,757.31
Other current assets, net of allowances 6,959.65 3,619.99
Total Current Assets 44,705.73 40,931.28
Property, plant and equipment, net 19,619.57 19,538.60
Deferred income taxes 1,034.30 1,792.04
Investment securities 2,648.31 600.24
Goodwill, net 11,855.29 10,262.79
Intangible assets, net 8,249.75 8,012.42
Other assets 1,491.86 1,042.63
Total Assets 89,604.81 82,180.00
LIABILITIES AND STOCKHOLDERS’ EQUITY
Current liabilities
Borrowings from banks and financial institutions 14,384.88 13,600.74
Current portion of long term debt 3,820.86 3,490.11
Trade accounts payable 8,512.11 7,889.38
Income taxes payable 1,653.65 830.59
Deferred income 128.54 57.83
Accrued expenses 2,251.36 2,159.19
Other current liabilities 2,225.52 1,285.30
Total Current Liabilities 32,976.92 29,313.14
Long-term debt, excluding current portion 23,093.40 22,432.96
Deferred income taxes 2,163.59 1,697.08
Deferred income 48.79 101.65
Other liabilities 3,289.08 1,848.35
Total Liabilities 61,571.78 55,393.18
Minority interest 564.56 334.28
Commitments and contingencies (See Note K and U)
Stockholders' equity
Common stock, Rs. 5.00 par value,(598,000,000 equity shares authorised, 1,865.35 1,863.43
100,000 cumulative preference shares authorised,373,070,829 and 372,686,964 equity shares issued andoutstanding as at December 31, 2007 and 2006 respectively)
Additional paid in capital 7,059.99 6,735.13
Retained earnings 19,703.71 17,486.04
Accumulated other comprehensive (loss)/income (1,160.58) 367.94
Total stockholders' equity 27,468.47 26,452.54
Total Liabilities and Stockholders' equity 89,604.81 82,180.00
The accompanying notes are an integral part of these consolidated financial statements

107
Ranbaxy Laboratories Limited Annual Report 2007 Consolidated Balance Sheet & Consolidated Statements of Income – US GAAP
RANBAXY LABORATORIES LIMITED AND SUBSIDIARIES
CONSOLIDATED STATEMENTS OF INCOME(All amounts in Rupees Million, unless otherwise stated)
Year ended December 31,
2007 2006
Revenues
Product sales 66,621.23 60,275.75
Service income 514.16 406.47
Other operating revenue 3,782.12 1,302.83
70,917.51 61,985.05
Cost of revenues (excluding depreciation, amortisation and impairment) 33,706.73 29,465.74
Gross profit 37,210.78 32,519.31
Operating expenses
Selling, general and administrative expenses 22,908.21 19,651.83
Research and development expenses 4,281.96 3,982.42
Depreciation, amortisation and impairment 3,840.47 2,894.31
Total operating expenses 31,030.64 26,528.56
Operating income 6,180.14 5,990.75
Share of profit and loss of affiliates (net) 42.74 50.30
Interest expense (2,516.61) (1,789.20)
Interest income 220.54 207.05
Other income 4,269.06 548.58
Income before income taxes and minority interest 8,195.87 5,007.48
Income taxes 2,225.57 889.58
Income before minority interest 5,970.30 4,117.90
Minority interest (111.08) (57.31)
Net income 5,859.22 4,060.59
Earnings per equity share
Basic 15.71 10.90
Diluted 12.17 10.88
Weighted average number of equity shares used in computing earnings perequity share
Basic 372,906,747 372,595,730
Diluted 400,254,324 373,342,142
The accompanying notes are an integral part of these consolidated financial statements.

108
RANBAXY LABORATORIES LIMITED AND SUBSIDIARIES
CONSOLIDATED STATEMENTS OF STOCKHOLDERS' EQUITY AND COMPREHENSIVE INCOME (All amounts in Rupees Million, unless otherwise stated)
Common stock
No. of Amount Additional Deferred Retained Compre- Accu- Totalshares paid in stock- earnings hensive mulated stock-
capital based income other holders'compen- compre equity
sation hensiveincome /
(loss)
Balance as at January 1, 2006 372,442,190 1,862.21 6,388.29 (73.93) 17,036.85 – 208.50 25,421.92
Receipt on exercise of stock options 244,774 1.22 56.08 – – – – 57.30
Receipt of share application moneypending allotment – – 6.01 – – – – 6.01
Amortisation of deferred stock basedcompensation – – 358.68 – – – – 358.68
Reclassification from Deferred Stockbased compensation to additionalpaid in capital – – (73.93) 73.93 – – – –
Cash dividend paid – – – – (3,611.40) – – (3,611.40)
Comprehensive income
Net income – – – – 4,060.59 4,060.59 – 4,060.59
Unrealised holding gain onmarketable equity securities – – – – – (55.05) (55.05) (55.05)
Deferred tax on unrealised holdinggain on marketable equity securities – – – – – 19.32 19.32 19.32
Translation adjustment – – – – – 195.17 195.17 195.17
Total comprehensive income – – – – – 4,220.03 – –
Balance as at December 31, 2006 372,686,964 1,863.43 6,735.13 – 17,486.04 – 367.94 26,452.54
Receipt on exercise of stock options 383,865 1.92 87.45 – – – – 89.37
Receipt of share application moneypending allotment – – 2.97 – – – – 2.97
Amortisation of deferred stockbased compensation – – 234.44 – – – – 234.44
Cash dividend paid – – – – (3,641.55) – – (3,641.55)
Comprehensive income
Net income – – – – 5,859.22 5,859.22 – 5,859.22
Unrealised holding gain onmarketable equity securities – – – – – 1,454.00 1,454.00 1,454.00
Deferred tax on unrealised holdinggain on marketable equity securities – – – – – (335.79) (335.79) (335.79)
Translation adjustment – – – – – (2,646.73) (2,646.73) (2,646.73)
Total comprehensive income – – – – – 4,330.70 – –
Balance as at December 31, 2007 373,070,829 1,865.35 7,059.99 – 19,703.71 – (1,160.58) 27,468.47
The accompanying notes are an integral part of these consolidated financial statements.

109
Ranbaxy Laboratories Limited Annual Report 2007 Consolidated Statements of Stockholders Equity and Comprehensive Income & Cash Flows – US GAAP
RANBAXY LABORATORIES LIMITED AND SUBSIDIARIES
CONSOLIDATED STATEMENTS OF CASH FLOWS(All amounts in Rupees Million, unless otherwise stated)
Year ended December 31,
2007 2006
Cash flows from operating activitiesNet income 5,859.22 4,060.59Adjustments to reconcile net income to net cash andcash equivalents provided by operating activities
Depreciation, amortisation and impairment 3,840.47 2,894.31Deferred income tax expense 1,192.35 764.42Allowance for doubtful assets and amounts written off 205.23 192.07Gain on disposal of property, plant and equipment (427.00) (100.53)Loss on sale of investments – 5.57Share of profit and loss of affiliates (net) (42.74) (50.30)Amortisation of deferred stock based compensation 234.44 358.68Minority interest 111.08 57.31Unrealised gain on forward foreign exchange contracts and options (979.81) (817.71)
Changes in operating assets and liabilitiesAccounts receivable 407.37 (2,623.75)Inventories (636.60) (1,750.46)Other current assets (3,533.66) (760.58)Other non-current assets (443.66) (376.93)Accounts payable 1,064.24 1,160.95Accrued expenses and other current liabilities 2,025.49 (702.06)Other non-current liabilities 1,757.17 989.14
Net cash provided by operating activities 10,633.59 3,300.72
Cash flows from investing activitiesPurchase of property, plant and equipment (2,996.91) (2,778.24)Cash paid for acquisition of minority interest in subsidiary (103.32) (181.23)Acquisition of stake in associates (1,812.33) –Proceeds from sale of property, plant and equipment 897.20 119.65Acquisition of subsidiary* (2,490.75) (14,438.73)Purchase of intangible assets (1,762.43) (690.76)Purchase of investment securities (226.87) (202.00)Proceed from sale of investments – 33.30Amount invested in restricted cash balances – (17.25)Maturity of restricted cash balances 20.76 –
Net cash used in investing activities (8,474.65) (18,155.26)
Cash flows from financing activitiesProceeds from borrowings from banks and financial institutions, net 2,173.70 856.26Proceeds from issue of foreign currency convertible bonds – 19,553.60Principal payment on long term debt – (1,396.61)Principal payments on capital lease obligations (72.55) (165.63)Proceeds from issuance of term loans 610.18 –Payment of dividend, including tax on dividend of
Rs 472.20 million and Rs 444.14 million, respectively (3,641.55) (3,611.40)Receipt from employees on exercise of stock options 92.34 63.31Payment of dividend to minority stockholders in subsidiaries (7.00) (7.62)
Net cash provided by/(utilised in) financing activities (844.88) 15,291.91
Effect of exchange rate changes on cash and cash equivalents 45.43 39.11Net increase in cash and cash equivalents during the year 1,314.06 437.37Cash and cash equivalents at the beginning of the year 2,762.81 2,286.33Cash and cash equivalents at the end of the year 4,122.30 2,762.81
Supplemental disclosuresCash paid during the year for interest 1,578.35 1,008.91Cash paid during the year for income taxes 1,517.08 845.82Assets under capital leases capitalised during the year – 86.26
*Acquisition of subsidiaryAssets and liabilities of the subsidiaries upon acquisition
Working capital 334.96 893.09Long-lived assets other than goodwill 899.54 7,893.97Goodwill arising on acquisition 1,242.79 5,651.67
Cost of investment in shares 2,477.29 14,311.42Direct cost 13.46 127.31
Cash paid 2,490.75 14,438.73
The accompanying notes are an integral part of these consolidated financial statements.

110
RANBAXY LABORATORIES LIMITED AND SUBSIDIARIES
NOTES TO CONSOLIDATED FINANCIAL STATEMENTSDecember 31, 2007 and 2006(All amounts in Rupees Million, unless otherwise stated)
NOTE A - SUMMARY OF SIGNIFICANT ACCOUNTING POLICIES
A summary of the significant accounting policies applied in the preparation of the accompanying consolidated financial statementsfollows:
1. Organisation and Nature of operations
Ranbaxy Laboratories Limited ("RLL" or the "Company"), a public limited company, was incorporated in India on June 16, 1961.RLL alongwith its subsidiaries and associates (hereinafter collectively referred to as "the Group") operates as an integratedinternational pharmaceutical organisation with businesses encompassing the entire value chain in the production, marketingand distribution of dosage forms and active pharmaceutical ingredients.
The Group presently has manufacturing facilities in eleven countries, namely Brazil, China, India, Ireland, Japan, Malaysia,Nigeria, Romania, South Africa, the United States of America and Vietnam. The Group's major markets include the United Statesof America (being the largest), India, Europe, Russia / CIS, Brazil and South Africa. The major products include, inter alia,Simvastatin, CoAmoxyclav, Amoxycillin, Ciprofloxacin, Isotretinon and Cephalexin. The research and development activities ofthe Group are principally carried out at its facilities in Gurgaon, near New Delhi, India.
The Company's shares are listed for trading on the Bombay Stock Exchange and the National Stock Exchange (NSE) in India andits Global Depository Receipts (representing equity shares of the Company) are listed on the Luxembourg Stock Exchange.Further Company’s Foreign Currency Convertible Bonds are listed on the Singapore Stock Exchange.
2. Principles of consolidation
The consolidated financial statements include the financial statements of RLL and all its subsidiaries, which are more than 50percent owned and controlled.
In case of investments where the Group exercises significant influence over the operating and financing policies of the investee,such investments are accounted for using the equity method of accounting. The Group's equity in the income or loss of theseaffiliates is included in the consolidated statement of income.
All inter-company transactions and balances, between the entities included in the consolidated financial statements, have beeneliminated.
Details of the entities, which presently form part of the Group and are consolidated alongwith RLL are as follows:
Name of entity Country of incorporation Shareholding
Ranbaxy Drugs and Chemicals Company India 100.00%Ranbaxy Drugs Limited India 100.00%Rexcel Pharmaceuticals Limited India 100.00%Solus Pharmaceuticals Limited India 100.00%Solrex Pharmaceuticals Company # India 100.00%Vidyut Investments Limited India 100.00%Ranbaxy Life Sciences Research Ltd. # India 100.00%Ranbaxy N.A.N.V. Antilles, The Netherlands 100.00%Ranbaxy Australia Pty Ltd. Australia 100.00%Ranbaxy Belgium N.V. Belgium 100.00%Ranbaxy Do Brasil Ltda Brazil 100.00%Ranbaxy Pharmaceutical Canada Inc Canada 100.00%Ranbaxy Egypt (L.L.C.) Egypt 100.00%Rexcel Egypt (L.L.C.) Egypt 100.00%Ranbaxy Pharmacie Generiques SAS France 100.00%Office Pharmaceutique Industriel Et Hospitalier SARL France 100.00%Basics GmbH Germany 100.00%Lapharma GmbH Germany 100.00%Ranbaxy (Hong Kong) Limited Hong Kong 100.00%Ranbaxy Hungary Gyogyszereszeti Kft Hungary 100.00%Ranbaxy Ireland Ltd. Ireland 100.00%Ranbaxy Italia S.p.A Italy 100.00%Ranbaxy Mexico, S.A. de C.V. Mexico 100.00%Ranbaxy Panama S.A.* Panama 100.00%Ranbaxy PRP (Peru) S.A.C. Peru 100.00%Ranbaxy Poland Sp Zoo Poland 100.00%Ranbaxy Portugal -Com E Desenvolv De Prod
Farmaceuticos Unipessoal Lda Portugal 100.00%ZAO Ranbaxy Russia 100.00%Ranbaxy (S.A.) (Proprietary) Ltd. South Africa 100.00%Laboratorios Ranbaxy S.L. Spain 100.00%Mundogen Farma S.A. @ Spain 100.00%

111
RANBAXY LABORATORIES LIMITED AND SUBSIDIARIES
NOTES TO CONSOLIDATED FINANCIAL STATEMENTSDecember 31, 2007 and 2006(All amounts in Rupees Million, unless otherwise stated)
Ranbaxy Laboratories Limited Annual Report 2007 Notes to Consolidated Financial Statements – US GAAP
Ranbaxy Pharma AB Sweden 100.00%Ranbaxy Pharmaceuticals B.V.* The Netherlands 100.00%Ranbaxy (Netherlands) B.V. ("RNBV") The Netherlands 100.00%Ranbaxy (U.K.) Ltd. United Kingdom 100.00%Ranbaxy Holdings (U.K.) Ltd. United Kingdom 100.00%Ranbaxy Europe Ltd. United Kingdom 100.00%Ranbaxy, Inc. United States of America 100.00%Ranbaxy Pharmaceuticals, Inc. United States of America 100.00%Ranbaxy USA, Inc. United States of America 100.00%Ohm Laboratories, Inc. United States of America 100.00%Ranbaxy Laboratories, Inc. United States of America 100.00%Ranbaxy Vietnam Company Ltd. Vietnam 100.00%Unichem Distributors Ltd.* Thailand 99.96%Unichem Pharmaceuticals Ltd.* Thailand 98.50%Gufic Pharma Limited India 98.00%Terapia S.A. Romania 96.70%Terapia Distributie S.R.L. Romania 96.70%Ranbaxy Farmaceutica Ltda. Brazil 95.30%Bounty Holdings Company Ltd.* Thailand 89.08%Ranbaxy Unichem Company Ltd. Thailand 88.56%Ranbaxy Nigeria Ltd. Nigeria 84.89%Ranbaxy (Guangzhou China) Limited Republic of China 83.00%Be-Tabs Pharmaceuticals (Proprietary) Ltd # South Africa 75.00%Be-Tabs Investments (Proprietary) Ltd # South Africa 75.00%Sonke Pharmaceuticals (Proprietary) Ltd South Africa 68.40%Ranbaxy Malaysia Sdn. Bhd. Malaysia 68.09%Ranbaxy Signature LLC United States of America 67.50%
#new entities in 2007*entities liquidated during the year@entity merged with Laboratorios Ranbaxy, S.L. during the year
The Group does not consider liquidation of the entities as per the table given above to have a material impact on the financial statements.
In addition to above, the Group holds 50% equity stake in Nihon Pharmaceutical Industry Co. Ltd, Japan, a 21.84% equity stakein Zenotech Laboratories Limited, India and a 24.91% equity stake in Shimal Research Laboratories Limited, India. Suchinvestments in these affiliates are accounted for using the equity method.
3. Basis of presentation
The accompanying consolidated financial statements have been prepared on the accrual basis of accounting in conformity withaccounting principles generally accepted in the United States of America ("US GAAP"), to reflect the financial position, results ofoperations and cash flows of the Group.
4. Use of estimates
In preparing the Group's financial statements in conformity with US GAAP, the Group's management (“Management”} is requiredto make estimates and assumptions that affect the reported amounts of assets and liabilities and the disclosure of contingentassets and liabilities at the date of the financial statements and the reported amounts of revenues and expenses; actual resultscould differ from those estimates. Any revision to accounting estimates is recognised in the period the same is determined.Management's estimates represent, inter alia, particularly sensitive estimates for charge-backs, rebates, discounts and returns,future obligations under employee benefit plans, inventory reserve, provision for doubtful debts, the useful life of tangible andintangible assets and the realisation of deferred tax assets.
5. Exchange rate translation
The functional currency of the Company, including its consolidated domestic and foreign subsidiaries, has been determined inaccordance with the primary economic environment in which the respective entities operate. The functional currency for Ranbaxy(Netherlands) B.V. (RNBV), Ranbaxy Hong Kong Ltd. and Ranbaxy Holding (U.K.) Ltd. is the US Dollar.
In respect of entities for which the functional currency is other than the Indian Rupee, the reporting currency of RLL, the assetsand liabilities are translated into Indian Rupees at the appropriate year-end exchange rates. For the aforementioned entitiesincome and expenses are translated using the monthly average exchange rates for the year. The resulting translation adjustmentsare reported as a component of "Accumulated other comprehensive income".
Name of entity Country of incorporation Shareholding
NOTE A (continued)

112
RANBAXY LABORATORIES LIMITED AND SUBSIDIARIES
NOTES TO CONSOLIDATED FINANCIAL STATEMENTSDecember 31, 2007 and 2006(All amounts in Rupees Million, unless otherwise stated)
Transactions in foreign currency are translated into the functional currency of the respective Group's entity at the rates prevailingon the date of the transaction. Monetary assets and liabilities in foreign currency are translated into the functional currency ofthe respective Group's entity at the rate of exchange prevailing at the balance sheet date. All operating foreign exchange gainsand losses are recorded under "other operating revenue" in the accompanying consolidated financial statements. Such foreigncurrency exchange (gain)/ loss included in the consolidated statements for the years ended December 31, 2007 and December31, 2006 amounted to Rs. (2,961.08) million and Rs. (564.76) million, respectively.
The foreign exchange gain on borrowings amounting to Rs. (3,213.58) million and Rs (117.30) million for the years ended December31, 2007 and December 31, 2006 respectively, and is included in "Other income".
6. Cash and cash equivalents (see Note C)
Cash and cash equivalents include all highly liquid investments with an original maturity of three months or less.
7. Restricted Cash
Restricted cash includes deposits that have been pledged with banks and will mature within one year.
8. Inventories (see Note E)
Inventories consist of raw materials, work-in-process, stores and spares, finished goods and packaging materials, and arestated at the lower of cost or market value. Cost is determined using the weighted average and first-in-first-out methods for rawmaterials, packaging materials, stores and spares, work-in-process and finished goods and includes the purchase price andattributable direct costs, less trade discounts. The cost of work-in-process and finished goods comprises of direct labor, materialcosts and appropriate share of production overheads.
Allowance for potentially obsolete or slow moving inventory is made on the basis of Management's analysis of inventory levels,expiration dates and prevailing market conditions as a part of cost of revenue.
9. Property, plant and equipment (see Note F)
Property, plant and equipment, including assets acquired under capital lease agreements are stated at historical cost lessaccumulated depreciation. Depreciation is calculated on a straight-line method over the estimated useful life of the respectiveassets. Assets under capital leases and leasehold improvements are amortised over the lower of their estimated useful lives orthe term of the lease.
Advances paid for the acquisition of property, plant and equipment outstanding at the balance sheet date and the cost of property,plant and equipment not put to use before such date are disclosed as 'Capital work-in-progress'. The interest cost incurred forfunding a qualifying asset during its construction period is capitalised based on the actual investment in the asset and theaverage cost of funds (such amounts were not material during the years ended December 31, 2007 and December 31, 2006). Thecapitalised interest is included in the cost of the relevant asset and is depreciated over the estimated useful life of the asset.
The Group has determined the estimated useful lives of assets for depreciation purposes as follows:
Buildings 30-50 yearsPlant and machinery 5-15 yearsFurniture and fixtures 5-10 yearsOffice equipment 3-10 yearsVehicles 5 years
Expenditure for maintenance and repairs are expensed as incurred and amounted to Rs. 625.01 million and Rs. 443.82 millionfor the years ended December 31, 2007 and December 31, 2006, respectively. When assets are retired or otherwise disposed,the cost of the asset and related accumulated depreciation are eliminated. Any gain or loss on disposal is recognised in thesatement of income.
10. Goodwill (see Note H)
Goodwill reflects the excess of the cost of acquisition over the fair value of net assets acquired in a business acquisition. Pursuantto Statement of Financial Accounting Standards (SFAS) No. 142 "Goodwill and Other Intangible Assets", the Group does notamortise goodwill, and instead tests goodwill for impairment annually.
11. Intangible assets (see Note I)
Intangible assets primarily include acquired license agreements, non compete, brands, trademarks, technical know-how, productdossiers and other intangibles identified on acquisition and are amortised over the expected useful life or the contractual life,whichever is shorter.
12. Revenue Recognition
Product sales
Revenue from sales of active pharmaceutical ingredients and formulation products is recognised when title and risk of loss ofproducts are transferred to the customer, on shipment of products for Free-on-Board ("FOB") shipping point sales and upondelivery to the customers for FOB destination point sales and when the following criteria are met:
NOTE A (continued)

113
RANBAXY LABORATORIES LIMITED AND SUBSIDIARIES
NOTES TO CONSOLIDATED FINANCIAL STATEMENTSDecember 31, 2007 and 2006(All amounts in Rupees Million, unless otherwise stated)
Ranbaxy Laboratories Limited Annual Report 2007 Notes to Consolidated Financial Statements – US GAAP
• Persuasive evidence of an arrangement exists;
• The price to the buyer is fixed and determinable; and
• Collectibility of the sales consideration is reasonably assured.
Provisions for sales discounts, medicaid and other rebates, damaged product returns and exchanges for expired products arerecognised as a reduction of sales revenues. These revenue reductions are established based on best estimates at the time ofsale based on historical experience, adjusted to reflect known changes in the factors that impact such reserves. These reductionsare reflected either as a direct reduction to accounts receivable or through an allowance.
In the United States, some of the large customers are major wholesalers who resell the products to third party customers likemanaged care organisations, drug store chains and pharmacies. A significant part of gross revenues from such wholesalers aresubject to various forms of rebates and allowances (known as "chargebacks"), which are recorded as reductions from grossrevenues. The computation of the estimate for expected chargebacks is complex and involves significant judgment based onhistorical experience and estimated wholesaler inventory levels, as well as expected sell-through levels by the wholesalers toindirect customers. The primary factors considered in developing and evaluating provision for chargeback includes the averagehistorical chargeback credits and an estimate of the inventory held by the wholesalers, based on internal analysis of wholesaler'shistorical purchases and contract sales.
Actual experience associated with any of these items may be different to the Group's estimates and the Group regularly reviewsthe factors that influence its estimates and, if necessary, makes adjustments when it believes that actual product returns,credits, rebates, chargebacks and other allowances may differ from established provisions.
At December 31, 2007 and December 31, 2006, the Group had reserves for chargebacks of Rs. 2,244.37 million and Rs. 2,910.39million, respectively.
Service income
License fees
The Group receives payments under various development, manufacturing, supply and distribution agreements. Under the termsof these agreements, certain amounts may be received by the Group prior to the commercial launch of a product and fulfillmentof the Group's obligations under such agreements. These amounts are recorded as deferred revenue and are amortised in thestatement of income from the date of commercial launch through the term of the related agreement. These arrangements aregenerally for a period of 3 to 5 years.
Non-refundable upfront payments received are deferred and recognised in the consolidated statements of income on a straight-line basis over the estimated development period. Other milestone payments received are recognised in accordance with theterms prescribed in the license agreement and where the Group has no future obligations or continuing involvement pursuantto such milestone payment.
Royalty
Royalty income is based on sales made by third parties and is recognised on an accrual basis, in accordance with the terms ofthe respective agreements.
Other revenues
Other revenues include claim settlements and export incentives. Revenues from claim settlements are recognised in accordancewith the terms of related agreements in the period in which the claim is established. Export incentives are recognised on anaccrual basis when the right to receive the incentives is established in accordance with the applicable laws.
13. Investment securities (see Note G)
Investment securities comprise primarily of available-for-sale equity securities, non- marketable equity securities and equityaffiliates securities.
Available-for-sale securities are recorded at fair value based on quoted market prices, resultant unrealised gains and losses,net of income taxes are reported as a part of Accumulated other comprehensive income till realised. Decline in the fair value ofany available-for-sale security below cost that is determined to be other than temporary is charged to the statements of income.Realised gains and losses from the sale of available-for-sale securities are determined on the average cost method and areincluded in the statement of income.
Non-marketable equity securities are accounted for by the cost method and are stated at cost, less provision for any declineother than a temporary decline in value.
Investments in equity affiliates are accounted for by equity method of accounting.
Interest and dividend income is recognised when earned.
14. Shipping and handling costs
Shipping and handling expenses of Rs. 1,493.80 million and Rs. 1,519.96 million for the years ended December 31, 2007 andDecember 31, 2006, respectively, incurred to transport products to customers, have been classified under selling, general andadministrative expenses.
NOTE A (continued)

114
RANBAXY LABORATORIES LIMITED AND SUBSIDIARIES
NOTES TO CONSOLIDATED FINANCIAL STATEMENTSDecember 31, 2007 and 2006(All amounts in Rupees Million, unless otherwise stated)
15. Advertising costs
Costs associated with advertising are expensed as incurred. Such costs amounted to Rs. 2,287.97 million and Rs 2,426.81 millionfor the years ended December 31, 2007 and December 31, 2006, respectively.
16. Income taxes (see Note Q)
The provision for current income tax expense is estimated by the respective entities in accordance with the relevant domestic taxlaws. The Group accounts for deferred income taxes under the liability method, in accordance with SFAS No. 109 "Accounting forIncome Taxes". Deferred income tax assets and liabilities are recognised for the future tax consequences attributable to differencesbetween carrying amounts of existing assets and liabilities in the financial statements and their respective tax basis. Deferredincome tax assets and liabilities are measured using enacted tax rates for the respective tax jurisdictions as on the date of thefinancial statements. The effect on deferred income tax assets and liabilities of a change in tax rates is recognised in the statementof income in the period of change. Based on management's judgment, the measurement of deferred income tax assets is reduced,if necessary, by a valuation allowance for any tax benefits where it is more likely than not that some portion or all of such benefitswill not be realised.
17. Research and development costs
Research and development costs are expensed as incurred, and amounted to Rs 4,281.96 million and Rs 3,982.42 million for theyears ended December 31, 2007 and December 31, 2006, respectively. Costs incurred for equipment and facilities acquired orconstructed for research and development activities and having alternative future uses, are capitalised as property, plant andequipment when acquired or constructed.
18. Impairment of long-lived assets
The Group follows the guidance of SFAS No. 144, "Accounting for the Impairment or Disposal of Long-Lived Assets". The Groupreviews long-lived assets and certain identifiable intangibles held and used, for possible impairment whenever events or changesin circumstances indicate that the carrying amount of an asset may not be recoverable. Under SFAS 144, an impairment loss isrecognised when estimated undiscounted future cash flows expected to result from the use of the assets and its eventualdisposition are less than the carrying value. Impairment if any, is assessed using discounted cash flows. Such losses amountedto Rs 20.07 million for the year ended December 31, 2007. There were no such losses in the year ended December 31, 2006.
19. Leases
Operating leases - lessee accounting (see Note U)
Lease rental expenses on operating leases are charged to expense over the lease term as they become payable. Certain operatinglease agreements provide for scheduled rent increases over the lease term. Rental expense for these leases is recognised on astraight-line basis over the lease term.
Capital lease- lessee accounting
Leases that transfer substantially all of the risks and rewards of ownership in an asset to the Group are capitalised and classifiedas capital leases. An asset under a capital lease is stated at an amount equal to the lower of its fair value or the present value ofthe minimum lease payments at inception of the lease, less accumulated depreciation. Finance charges on capital leases areexpensed over the term of the lease to give a constant periodic rate of interest charge in proportion to the capital balancesoutstanding. The rental obligations, net of interest charges, are reflected in borrowings.
20. Other comprehensive income
SFAS No. 130, "Reporting Comprehensive Income", establishes rules for the reporting of comprehensive income and itscomponents. Comprehensive income is defined as all changes in equity from non-owner sources. For the Group, comprehensiveincome consists of net earnings, changes in the cumulative foreign currency translation adjustments and unrealised gains andlosses on available-for-sale securities. The Group reports comprehensive income in the consolidated statement of stockholders'equity.
21. Earnings per share (see Note N)
In accordance with SFAS No. 128, "Earnings per share", basic earnings per share is computed using the weighted averagenumber of common shares outstanding during the period. Diluted earnings per share is computed using the weighted averagenumber of common and dilutive equivalent common shares outstanding during the period.
22. Stock-based compensation (see Note O)
The Group accounts for share based payments in accordance with SFAS 123(R), "Accounting for Stock-Based Compensation",which requires cost relating to such payments to be accounted for based on the fair value of the options granted. The Group usesthe Black-Scholes option-pricing model to estimate the fair value of the options granted.
23. Derivative financial instruments
The Group enters into forward foreign exchange and option contracts where the counterparty is generally a bank. The Grouppurchases forward foreign exchange contracts and option contracts to mitigate the risk of changes in foreign exchange rates on
NOTE A (continued)

115
RANBAXY LABORATORIES LIMITED AND SUBSIDIARIES
NOTES TO CONSOLIDATED FINANCIAL STATEMENTSDecember 31, 2007 and 2006(All amounts in Rupees Million, unless otherwise stated)
Ranbaxy Laboratories Limited Annual Report 2007 Notes to Consolidated Financial Statements – US GAAP
accounts receivable and trade and loans payable. These contracts do not qualify for hedge accounting under SFAS No. 133,"Accounting for Derivative Instruments and Hedging Activities" as amended. Any derivative that is either not designated as ahedge, or is so designated but is ineffective per SFAS No. 133, is marked to market and recognised in statement of incomeimmediately.
The Group recognised a mark-to-market gain under "foreign exchange (gain) / loss" and/or "other income" in the incomestatement on non-designated hedges of Rs. 979.81 million and Rs. 817.71 million for the years ended December 31, 2007 andDecember 31, 2006, respectively.
24. Dividend
Dividends paid on common stock is recorded as a reduction of equity when approved by the stockholders.
25. Reclassification
Certain previous year figures have been reclassified to conform to the current year presentation.
26. Recent Accounting Pronouncements
In February 2007, the Financial Accounting Standards Board ("FASB") issued SFAS No. 159, The Fair Value Option for FinancialAssets and Financial Liabilities, providing the Group with an option to report selected financial assets and liabilities at fair value.If the fair value option is elected, changes in fair value would be recorded in earnings at each subsequent reporting date. SFAS159 is effective for the Group's 2008 fiscal year. The Group is currently evaluating the impact the adoption of this statement on itsConsolidated Financial Statements.
In December 2007, the FASB issued SFAS No. 141(R), Business Combinations. ("SFAS 141(R)" replaced SFAS No. 141, BusinessCombinations, originally issued in June 2001). SFAS 141R will change the manner in which business acquisitions are accountedfor and will impact financial statements both on the acquisition date and in subsequent periods. Key changes include: acquiredin-process research and development will no longer be expensed on acquisition, but capitalised and amortised over its usefullife; fair value will be based on market participant assumptions; acquisition costs will generally be expensed as incurred; andrestructuring costs will generally be expensed in periods after the acquisition date. SFAS 141(R) requires prospective applicationfor business combinations consummated in years beginning on or after December 15, 2008. This statement does not allow forearly adoption. The Group is currently evaluating the potential impact of adopting this Statement on its Consolidated FinancialStatements.
In December 2007, the FASB issued SFAS 160 ("SFAS 160"), Noncontrolling Interests in Consolidated Financial Statements, anamendment of Accounting Research Bulletin No.51(ARB 51), Consolidated Financial Statements. SFAS 160 provides guidancefor the accounting, reporting and disclosure of noncontrolling interests, also referred to as minority interest. A minority interestrepresents the portion of equity (net assets) in a subsidiary not attributable, directly or indirectly, to a parent. This amendment ofARB No. 51 requires noncontrolling interest in subsidiaries initially to be measured at fair value and then to be classified as aseparate component of equity. This statement is effective for years and interim periods within those years beginning on or afterDecember 15, 2008. This statement does not allow for early adoption, however, application of SFAS 160 disclosure and presentationrequirements is retroactive. The Group is currently evaluating the potential impact of adopting this Statement on its ConsolidatedFinancial Statements.
In June 2007, the FASB ratified the consensus reached by the Emerging Issues Task Force on Issue No. 07-3 (EITF 07-3), Accountingfor Nonrefundable Advance Payments for Goods or Services to be used in future research and development activities. Pursuantto EITF 07-3, nonrefundable advance payments for goods or services that will be used or rendered for future research anddevelopment activities should be deferred. Such amounts should be recognised as an expense as the related goods are deliveredor services are performed, or when the goods or services are no longer expected to be received. This issue is effective for accountingperiods beginning January 1, 2008, and is to be applied prospectively for contracts entered into on or after the effective date. TheGroup does not expect that the adoption of EITF 07-3 will have a significant impact on its Consolidated Financial Statements.
In December 2007, the Emerging Issues Task Force (EITF) issued EITF Issue No. 07-1, Accounting for Collaborative Arrangements.EITF 07-1 provides guidance concerning: determining whether an arrangement constitutes a collaborative arrangement withinthe scope of the Issue; how costs incurred and revenue generated on sales to third parties should be reported in the incomestatement; how an entity should characterise payments on the income statement; and what participants should disclose in thenotes to the financial statements about a collaborative arrangement. The provisions of EITF 07-1 will be adopted in fiscal 2009.The Group is currently evaluating the potential impact of adopting this Statement on its Consolidated Financial Statements.
NOTE B - SIGNIFICANT BUSINESS COMBINATIONS
The Company accounts for business combinations under the guidelines of SFAS No. 141, "Business combinations", which requiresthat the purchase method of accounting be used for all business combinations consummated after June 30, 2001. SFAS No. 141also specifies that intangible assets acquired in a business combination that meet the specified criteria and be recognised andreported separately from goodwill.
Acquisition of Be-Tabs, South Africa
On December 1, 2006, the Group had announced the acquisition of Be-Tabs Pharmaceuticals (Proprietary) Ltd. and Be-Tabs
NOTE A (continued)

116
RANBAXY LABORATORIES LIMITED AND SUBSIDIARIES
NOTES TO CONSOLIDATED FINANCIAL STATEMENTSDecember 31, 2007 and 2006(All amounts in Rupees Million, unless otherwise stated)
Investment (Proprietary) Ltd. ("Be-Tabs"), in South Africa. These transactions were consummated in May 2007, whereby, theGroup first acquired 100% stake and simultaneously sold a 25% stake. The Group recorded the cost of the acquisition asRs. 2,232.30 million, consisting of cash paid and the associated transaction costs.
The Group has accounted for this acquisition under the purchase method. Accordingly, the financial results for the post acquisitionperiod have been included in the consolidated financial statements of the Group.
The purchase cost of Rs. 2,232.30 million has been allocated as follows:
Goodwill 1,119.89Amounts assigned to Intangible assets
Customer relationship* 243.29Brands* 421.36Non compete** 6.61
Property, plant and equipment, net 139.32Other current assets 485.52
Total assets acquired 2,415.99Less: Liabilities assumed 183.69
Purchase cost 2,232.30
* Expected life 15 years** Expected life 3 years
Acquisition of additional stake in Zenotech Laboratories Limited
In November 2007, the Group acquired an additional stake in Zenotech Laboratories Limited ("Zenotech") through a preferentialallotment, representing 16 percent of the expanded equity share capital base of Zenotech, for Rs. 878.33 million, resulting in atotal holding of 21.84 percent, at a total cost of acquisition of Rs. 1078.33 million. The Group has accounted for this acquisitionusing the equity method.The purchase price allocation based on preliminary estimates is as follows:Net tangible assets 306.76
Goodwill 481.77Amounts assigned to Intangible assets
Customer relationships 1.51Non-compete 53.94In process R&D* 207.92Brands 26.43
Purchase cost 1,078.33
*fully charged off on acquisition
The Group is in the process of making a final purchase price allocation which may result in changes in the carrying value ofthese net assets. The exercise is expected to be completed in the year 2008.
Acquisition of stake in Shimal Research Laboratories Limited
During February 2007, the Company acquired 24.91% of the equity shares of Shimal Reasearch Laboratories Limited for a totalconsideration of Rs. 934 million. This acquisition has been accounted for using the equity method and goodwill amounting toRs. 598.25 million and intangibles (Supplier relationships) amounting to Rs. 83.42 million have been recorded as excess of thepurchase price paid over the aggregate of the proportionate fair value of the net assets acquired.
NOTE C - CASH AND CASH EQUIVALENTS
At December 31, 2007 and December 31, 2006, cash and cash equivalents consisted of the following:
2007 2006Cash and cheques in hand 118.25 83.65Remittances in transit 284.42 86.39Balances with banks and financial institutions
Time deposits 2,071.41 1,496.60Foreign currency bank balances 197.59 36.08Other balances 1,450.63 1,060.09
4,122.30 2,762.81
NOTE B (continued)
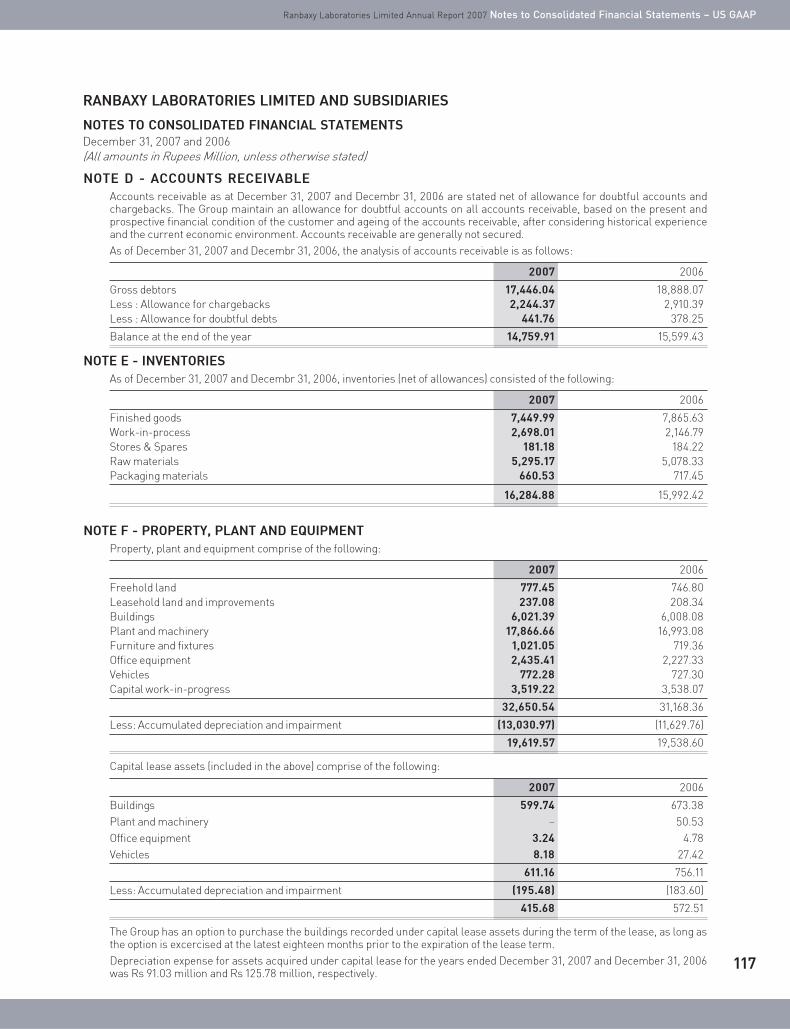
117
RANBAXY LABORATORIES LIMITED AND SUBSIDIARIES
NOTES TO CONSOLIDATED FINANCIAL STATEMENTSDecember 31, 2007 and 2006(All amounts in Rupees Million, unless otherwise stated)
Ranbaxy Laboratories Limited Annual Report 2007 Notes to Consolidated Financial Statements – US GAAP
NOTE D - ACCOUNTS RECEIVABLE
Accounts receivable as at December 31, 2007 and Decembr 31, 2006 are stated net of allowance for doubtful accounts andchargebacks. The Group maintain an allowance for doubtful accounts on all accounts receivable, based on the present andprospective financial condition of the customer and ageing of the accounts receivable, after considering historical experienceand the current economic environment. Accounts receivable are generally not secured.
As of December 31, 2007 and Decembr 31, 2006, the analysis of accounts receivable is as follows:
2007 2006
Gross debtors 17,446.04 18,888.07Less : Allowance for chargebacks 2,244.37 2,910.39Less : Allowance for doubtful debts 441.76 378.25
Balance at the end of the year 14,759.91 15,599.43
NOTE E - INVENTORIES
As of December 31, 2007 and Decembr 31, 2006, inventories (net of allowances) consisted of the following:
2007 2006
Finished goods 7,449.99 7,865.63Work-in-process 2,698.01 2,146.79Stores & Spares 181.18 184.22Raw materials 5,295.17 5,078.33Packaging materials 660.53 717.45
16,284.88 15,992.42
NOTE F - PROPERTY, PLANT AND EQUIPMENT
Property, plant and equipment comprise of the following:
2007 2006
Freehold land 777.45 746.80Leasehold land and improvements 237.08 208.34Buildings 6,021.39 6,008.08Plant and machinery 17,866.66 16,993.08Furniture and fixtures 1,021.05 719.36Office equipment 2,435.41 2,227.33Vehicles 772.28 727.30Capital work-in-progress 3,519.22 3,538.07
32,650.54 31,168.36
Less: Accumulated depreciation and impairment (13,030.97) (11,629.76)
19,619.57 19,538.60
Capital lease assets (included in the above) comprise of the following:
2007 2006
Buildings 599.74 673.38
Plant and machinery – 50.53
Office equipment 3.24 4.78
Vehicles 8.18 27.42
611.16 756.11
Less: Accumulated depreciation and impairment (195.48) (183.60)
415.68 572.51
The Group has an option to purchase the buildings recorded under capital lease assets during the term of the lease, as long asthe option is excercised at the latest eighteen months prior to the expiration of the lease term.
Depreciation expense for assets acquired under capital lease for the years ended December 31, 2007 and December 31, 2006was Rs 91.03 million and Rs 125.78 million, respectively.

118
RANBAXY LABORATORIES LIMITED AND SUBSIDIARIES
NOTES TO CONSOLIDATED FINANCIAL STATEMENTSDecember 31, 2007 and 2006(All amounts in Rupees Million, unless otherwise stated)
NOTE F (continued)
The minimum lease rentals and the present value of minimum lease payments as at December 31, 2007 and December 31, 2006 areas follows:
2007 2006
a) Minimum lease payments outstanding 525.34 667.55
b) Present value of minimum lease payments 451.86 561.44
c) Amounts due Minimum lease payments Present value of minimumlease payments
2007 2006 2007 2006
i) not later than one year 67.08 77.24 48.24 56.05
ii) later than one year but not laterthan five years 278.17 307.82 231.31 252.22
iii) later than five years 180.09 282.49 172.31 253.17
NOTE G - INVESTMENT SECURITIES
Investment securities comprise of the following:
As at December 31, 2007 As at December 31, 2006
Gross GrossCarrying unrealised Carrying unrealised
value gain/(losses) Fair value value gain/(losses) Fair value
Equity securities 230.26 1,396.60 1,626.86 200.03 (57.40) 142.63
Non-marketableequity securities 151.16 (0.51) 150.65 154.51 (0.51) 154.00
Equity affiliate 866.69 – 866.69 299.50 – 299.50
Readily marketabledebt securities 4.11 – 4.11 4.11 – 4.11
1,252.22 1,396.09 2,648.31 658.15 (57.91) 600.24
NOTE H - GOODWILL
The Group accounts for goodwill and other intangible assets under provisions of Statement of Financial Accounting StandardsNo. 142, "Goodwill and Other Intangible Assets" ("SFAS No. 142"). Accordingly, the Group does not amortise goodwill but insteadtests goodwill for impairment at least annually. During the years ended December 31, 2007 and December 31, 2006, the Group(through its estimate) concluded that no impairment of goodwill is required.
The following table represents the changes in goodwill during the years ended December 31, 2007 and December 31, 2006:
2007 2006
Balances at the beginning of the period 10,571.58 4,685.42
Translation adjustment (793.28) (195.69)
Acquired during the period 2,363.57 6,081.85
12,141.87 10,571.58
Less: Accumulated amortisation (net of translation adjustment) (286.58) (308.79)
Balance at the end of the year 11,855.29 10,262.79

119
RANBAXY LABORATORIES LIMITED AND SUBSIDIARIES
NOTES TO CONSOLIDATED FINANCIAL STATEMENTSDecember 31, 2007 and 2006(All amounts in Rupees Million, unless otherwise stated)
Ranbaxy Laboratories Limited Annual Report 2007 Notes to Consolidated Financial Statements – US GAAP
NOTE I - INTANGIBLE ASSETS
Acquired and amortised intangible assets comprise:
Expected useful life 2007 2006
Brands and trademarks Upto 15 years 2,114.72 1,522.31
Licenses Upto 15 years 2,744.30 2,208.47
Non-compete Upto 10 years 271.31 211.00
Technical know-how Upto 15 years 1,010.51 264.00
Customer/supplier relationships Upto 15 years 5,691.19 6,036.12
Software Upto 6 years 763.89 572.90
12,595.92 10,814.80
Less: Accumulated amortisation and impairement (4,346.17) (2,802.38)
8,249.75 8,012.42
On May 23, 2007, the Group acquired the right to 13 dermatological products from a third party. The purchase price ofRs. 1,065.88 million ($ 26.25 million) has been allocated as Rs. 245.97 million ($6.06 million) for trademarks, Rs. 696.92 million($17.16 million) for technical know-how and Rs. 122.99 million ($3.03 million) towards supplier relationships. All three componentsare being amortised over a period of 15 years from the date of acquisition.
The aggregate amortisation charge for the years ended December 31, 2007 and December 31, 2006 was Rs. 1,734.25 million andRs. 992.20 million, respectively.
The estimated amortisation charge for the above intangibles over the next five years is given below:
Year ending December 31,
2008 1,671.962009 1,492.412010 1,410.022011 1,244.90
2012 974.55
NOTE J - OTHER ASSETS
Other assets comprise of the following:
2007 2006
Prepaid expenses 306.94 392.79
Advance for purchase of shares of associates 1,274.82 –
Loans and advances, net of allowances 469.97 442.44
Balances with statutory authorities 1,465.02 1,483.16
Export incentives accrued 660.85 463.23
Deposits, net of allowances 497.64 571.73
Minimum Alternate tax credit 1,179.00 381.50
Others, net of allowances 2,597.27 927.77
8,451.51 4,662.62Other current assets 6,959.65 3,619.99
Other non current assets 1,491.86 1,042.63

120
RANBAXY LABORATORIES LIMITED AND SUBSIDIARIES
NOTES TO CONSOLIDATED FINANCIAL STATEMENTSDecember 31, 2007 and 2006(All amounts in Rupees Million, unless otherwise stated)
NOTE K - BORROWINGS FROM BANKS AND FINANCIAL INSTITUTIONS
The Company and certain other companies in the Group (“the Group companies”) have availed overdrafts, short-term and long termloans from banks and financial institutions. The Company, together with its Group companies, has an aggregate borrowingcapability of approximately Rs 32,000 million primarily to finance working capital requirements. The interest rates for theseborrowings are usually based on the London Inter-bank Offer Rate ("LIBOR") or the Euro Inter-bank Offer Rate or countryspecific benchmark rates for other local currency borrowings. Accordingly, interest rates ranged from 0.70 percent to 17.0percent, with the majority averaging approximately 4.5 percent. Details of the borrowings from banks and/ or financial institutionsare given below:
SHORT TERM LOANS & OVERDRAFTS:
2007 2006
Overdraft facilities 4,872.11 2,996.64
Short term loans 9,512.77 10,604.10
Total 14,384.88 13,600.74
The details of secured/ unsecured/ supported short term borrowings are as under:
2007 2006
Secured through:
Corporate guarantee issued by RNBV and Letter of comfort from RLL 554.08 429.59
Letter of comfort/ Letter of awareness from RLL 1,632.64 1,866.03
Secured by Charge over assets 3,650.68 2,808.31
Unsecured:
Loan from banks 8,547.48 8,496.81
Total 14,384.88 13,600.74
The secured borrowings carry a charge over stock, book debts and receivables both present and future and some of the borrowingmay contain financial and negative covenants. Some of the borrowings are supported by Guarantee and/ or Letter of Comfort.
LONG-TERM DEBT:
Long-term debt comprise of the following:
2007 2006
Unsecured term loans from banks 8,988.70 5,828.91
Other unsecured loans 128.90 58.32
Zero Coupon Foreign Currency Convertible Bonds (FCCB) 17,344.80 19,474.40
Capital lease obligations 451.86 561.44
26,914.26 25,923.07
Current portion of long term debt 3,820.86 3,490.11
Non current portion of long term debt 23,093.40 22,432.96
The aggregate of Corporate guarantees issued by RNBV in respect of the overdraft facilities, short term and long term loansfrom banks and/ or Financial Institution is Rs. 5,847.56 million. The terms of the guarantees are in accordance with the tenureof the facilities and loans. The guarantees can be invoked only in the event of default in repayment by the borrowing entity.
The maturity profile of long-term debt outstanding is given below:
Year ending Unsecured loans Unsecured loans FCCB Capital lease TotalDecember 31, from banks from others obligation
2008 3,763.21 9.41 – 48.24 3,820.86
2009 191.75 13.85 – 52.97 258.57
2010 383.48 14.15 – 55.06 452.69
2011 1,575.67 11.88 17,344.80 59.44 18,991.79
2012 2,089.09 11.88 – 63.84 2,164.81
Thereafter 985.50 67.73 – 172.31 1,225.54

121
RANBAXY LABORATORIES LIMITED AND SUBSIDIARIES
NOTES TO CONSOLIDATED FINANCIAL STATEMENTSDecember 31, 2007 and 2006(All amounts in Rupees Million, unless otherwise stated)
Ranbaxy Laboratories Limited Annual Report 2007 Notes to Consolidated Financial Statements – US GAAP
NOTE L - OTHER LIABILITIES
Other liabilities comprise of the following:
2007 2006
Interest accrued 137.57 26.68
Interest accrued on FCCB 1,704.24 751.20
Acceptances 0.55 7.18
Unclaimed dividends 82.42 97.71
Statutory dues 735.88 547.01
Employees benefits 1,501.90 1,267.35
Other liabilities 1,352.04 436.52
5,514.60 3,133.65
Other current liabilities 2,225.52 1,285.30
Other non current liabilities 3,289.08 1,848.35
NOTE M - STOCKHOLDERS' EQUITY
a) Common Stock
The Company presently has issued only one class of common stock. For all matters submitted to vote in the stockholders'meeting, every holder of common stock, as reflected in the records of the Company on the date of the stockholders' meeting hasone vote in respect of each share held.
b) Dividends
During the years ended December 31, 2007 and December 31, 2006, the Company distributed dividends of Rs. 3,169.35 millionand Rs. 3,167.26 million (including corporate dividend tax), at the rate of 170 percent of common stock in each year respectively.
During the year Ranbaxy Malaysia Sdn. Bhd., Ranbaxy Unichem Company Ltd. and Ranbaxy Nigeria Ltd. distributed dividends tostockholders, other than RNBV and RLL, of Rs 4.92 million (2006 - Rs 4.74 million) at the rate of 16 percent (2006 - 15 percent)of common stock, and Rs 1.08 million (2006 - Rs 1.03 million) at the rate of 7.50 percent (2006 - 7.50 percent) and Rs 0.99 million(2006 - Rs 1.07 million) at the rate of 50 percent (2006 - 50 percent) of common stock, respectively.
NOTE N - EARNINGS PER COMMON SHARE
A reconciliation of net income and number of shares of the basic and diluted earnings per share computation from continuingoperations is as follows:
2007 2006
Net Income 5,859.22 4,060.59
Exchange gain on FCCB (net of tax) (1,647.03) –
FCCB issue costs (net of tax) 29.99 –
Interest(net of exchange gain) on FCCB (net of tax) 629.10 –
Adjusted net income 4,871.28 4,060.59
Number of shares
Weighted average number of common shares outstanding 372,906,747 372,595,730
Effect of dilutive securities
– Employee stock options 228,412 746,412
– FCCB 27,119,165 –*
Diluted weighted average number of shares outstanding 400,254,324 373,342,142
*In the year 2006, the option under Foreign Currency Convertible Bonds was antidilutive.

122
RANBAXY LABORATORIES LIMITED AND SUBSIDIARIES
NOTES TO CONSOLIDATED FINANCIAL STATEMENTSDecember 31, 2007 and 2006(All amounts in Rupees Million, unless otherwise stated)
NOTE O - EMPLOYEE STOCK INCENTIVE SCHEMES
Share-Based Compensation
The Company's Employee Stock Option Schemes ("ESOSs") provide for the grant of stock options to eligible Managementemployees and Directors of the Company and subsidiaries. The ESOSs are administered by the Compensation Committee of theBoard of Directors of the Company (“Committee”). Options are granted on the basis of performance and the grade of the employee.Presently there are three ESOSs ("ESOS I", "ESOS II" and "ESOS 2005"). Options can be distributed at the discretion of theCommittee to select employees depending upon (i) Criticality of the position held, (ii) Potential of the Manager and (iii) Significantcontribution made during the year.
The ESOSs limits the maximum grant of options to an employee at 25,000 for ESOS I and 40,000 for ESOS II and ESOS 2005 inany given year. ESOS I and II provide that the grant price of options is to be determined at the average of the daily closing price ofthe Company's equity shares on the NSE during a period of 26 weeks preceding the date of the grant. ESOS 2005 provides thatthe grant price of options will be the latest available closing price on the stock exchange on which the shares of the Company arelisted, prior to the date of the meeting of the Committee in which the options are granted. If the shares are listed on more thanone stock exchange, then the stock exchange where there is highest trading volume on the said date shall be considered. Theoptions vest evenly over a period of five years from the date of grant. Options lapse if they are not exercised prior to the expirydate, which is ten years from the date of the grant.
As the number of shares that an individual employee is entitled to receive and the price of the option is known on the grant date,the grants made pursuant to the ESOSs are considered fixed grants.
Stock option activity under the ESOS Schemes is as follows:
Year ended December 31, 2007
Weighted- Weighted-average average
Range of exercise remainingStock options exercise prices price contractual life
(numbers) (Rs.) (Rs.) (years)
Outstanding, beginning of the year 6,850,980 283.50-538.50 446.35 7.35
Granted during the year 1,331,575 430.00 430.00 9.05
Forfeited during the year (437,184) 283.50-538.50 472.46 –
Exercised during the year (281,954) 283.50-538.50 317.05 –
Lapsed during the year (294,461) 283.50-538.50 459.64 –
Outstanding, end of the year 7,168,956 283.50-538.50 446.52 6.87
Exercisable at the end of the year 3,238,112 283.50-538.50 435.42 6.00
Year ended December 31, 2006
Weighted- Weighted-average average
Range of exercise remainingStock options exercise prices price contractual life
(numbers) (Rs.) (Rs.) (years)
Outstanding, beginning of the year 6,704,838 283.50 - 538.50 456.13 8.01
Granted during the year 1,221,300 392.00 392.00 9.05
Forfeited during the year (676,430) 283.50 - 538.50 472.42 –
Exercised during the year (181,883) 283.50 - 538.50 315.26 –
Lapsed during the year (216,845) 283.50 - 538.50 471.18 –
Outstanding, end of the year 6,850,980 283.50 - 538.50 446.35 7.35
Exercisable at the end of the year 2,282,437 283.50 - 538.50 417.60 6.52

123
RANBAXY LABORATORIES LIMITED AND SUBSIDIARIES
NOTES TO CONSOLIDATED FINANCIAL STATEMENTSDecember 31, 2007 and 2006(All amounts in Rupees Million, unless otherwise stated)
Ranbaxy Laboratories Limited Annual Report 2007 Notes to Consolidated Financial Statements – US GAAP
The following table summarises information about stock options outstanding at December 31, 2007 :
Options outstanding Options exercisable
Range of exercise prices Stock options Weighted- Weighted-Stock options Weighted-(numbers) average average (numbers) average
remaining exercise exercisecontractual price price
life (year) Rs. Rs.
Upto Rs 283.50 833,919 5.10 283.50 606,453 283.50
Rs 284.00-Rs 392 1,507,585 6.63 375.43 746,292 359.36
Rs 393.00-Rs 538.50 4,827,452 7.24 496.88 1,885,367 514.39
7,168,956 6.87 446.52 3,238,112 435.42
The weighted average fair value of the options granted during 2007 and 2006 were Rs. 232.57 and Rs. 194.07 respectively.
During 2007, there were 281,954 options exercised with a total intrinsic value of Rs. 89.39 million. During 2006, there were 181,883options exercised with a total intrinsic value of Rs. 57.34 million.
The total fair value of options vested during 2007 and 2006 was Rs. 980.57 million and Rs. 933.09 million, respectively.
The following is a summary of the changes in non-vested shares for the year ended December 31, 2007:
Shares Weighted-average Weighted-averageexercise price fair value
Non-vested options at January 1, 2007 4,509,289 462.65 663.92
Granted during the year 1,331,575 430.00 662.57
Vested during the year (1,513,005) 448.82 648.10
Forfeited during the year (437,184) 459.64 668.05
Non-vested options at December 31, 2007 3,890,675 457.19 669.15
Pursuant to the issue of bonus shares on October 11, 2002, the employees to whom options were granted until October 4, 2002 areentitled for additional shares on exercise of options in the ratio of 3:5.
The fair value of instruments issued under the share-based compensation plans is calculated using a Black-Scholes model. Thefollowing table summarises the assumptions used in calculating the fair value for the year ended December 31, 2007 and 2006:
2007 2006
Dividend yield 1.98 percent 2.17 percent
Expected life 6.5 years 6.5 years
Risk free interest rate 7.97 percent 7.55 percent
Volatility 44.95 percent 40.55 percent
The expected forfeiture rate, computed by the external valuer, is taken as 11.38%. The Black-Scholes option-pricing model wasdeveloped for estimating fair value of traded options that have no vesting restrictions and are fully transferable. Since optionspricing models require use of subjective assumptions, changes therein can materially affect fair value of the options. The optionspricing models do not necessarily provide a reliable measure of fair value of the options.
The Group recognised an expense towards share based compensation amounting to Rs. 234.44 million and Rs. 358.68 millionfor the years ended December 31, 2007 and December 31, 2006 respectively. The future charge amounting to Rs 505.64 millionshall be recorded over the remaining weighted-average period of 2.6 years, assuming no changes to the underlying assumptions.
The shareholders Committee from time to time have approved for issuance of shares under the Employees Stock OptionsScheme(s) as per details given below:
Date of approval No. of shares
June 30, 2005 4,000,000June 25, 2003 4,000,000June 29, 2000 2,500,000
Notes:– The stock options outstanding as on June 30, 2005 are to be proportionately adjusted in view of the sub-division of equity
shares of the Company from the face value of Rs.10 each into 2 equity shares of Rs. 5/- each.– Options granted upto October 3, 2002 are entitled for additional shares keeping in view the subsequent bonus issue of shares
in the ratio of 3:5 on October 11, 2002.
NOTE O (continued)
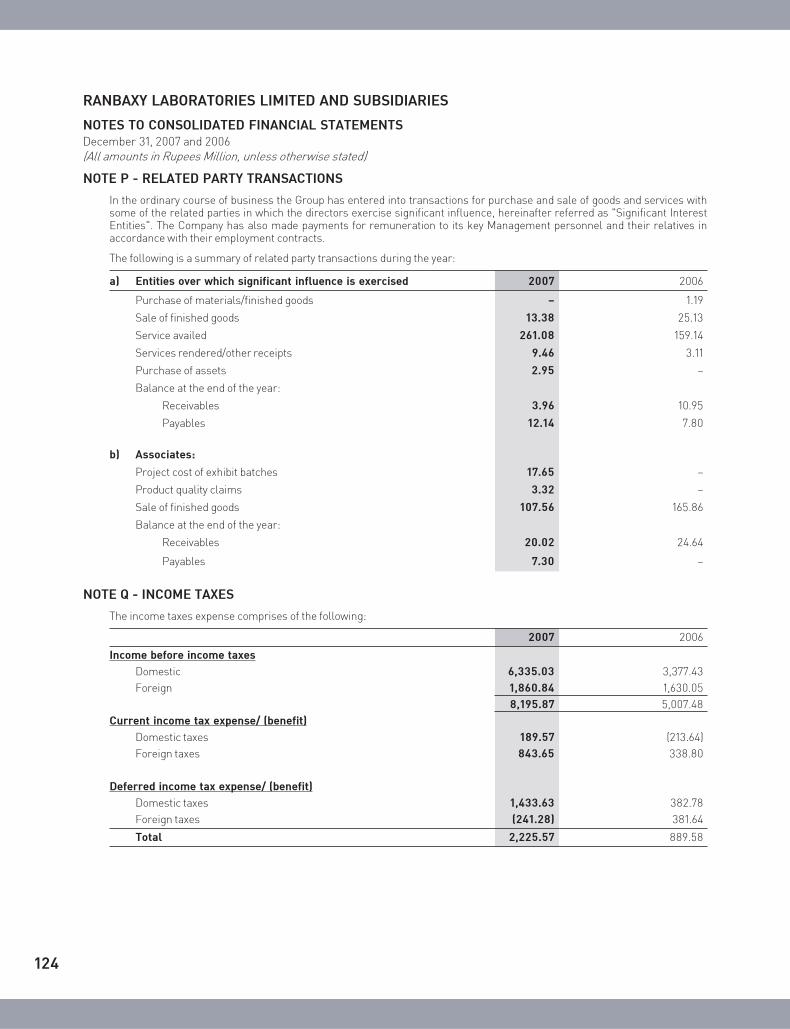
124
RANBAXY LABORATORIES LIMITED AND SUBSIDIARIES
NOTES TO CONSOLIDATED FINANCIAL STATEMENTSDecember 31, 2007 and 2006(All amounts in Rupees Million, unless otherwise stated)
NOTE P - RELATED PARTY TRANSACTIONS
In the ordinary course of business the Group has entered into transactions for purchase and sale of goods and services withsome of the related parties in which the directors exercise significant influence, hereinafter referred as "Significant InterestEntities". The Company has also made payments for remuneration to its key Management personnel and their relatives inaccordance with their employment contracts.
The following is a summary of related party transactions during the year:
a) Entities over which significant influence is exercised 2007 2006
Purchase of materials/finished goods – 1.19
Sale of finished goods 13.38 25.13
Service availed 261.08 159.14
Services rendered/other receipts 9.46 3.11
Purchase of assets 2.95 –
Balance at the end of the year:
Receivables 3.96 10.95
Payables 12.14 7.80
b) Associates:
Project cost of exhibit batches 17.65 –
Product quality claims 3.32 –
Sale of finished goods 107.56 165.86
Balance at the end of the year:
Receivables 20.02 24.64
Payables 7.30 –
NOTE Q - INCOME TAXES
The income taxes expense comprises of the following:
2007 2006
Income before income taxes
Domestic 6,335.03 3,377.43
Foreign 1,860.84 1,630.05
8,195.87 5,007.48
Current income tax expense/ (benefit)
Domestic taxes 189.57 (213.64)
Foreign taxes 843.65 338.80
Deferred income tax expense/ (benefit)
Domestic taxes 1,433.63 382.78
Foreign taxes (241.28) 381.64
Total 2,225.57 889.58

125
RANBAXY LABORATORIES LIMITED AND SUBSIDIARIES
NOTES TO CONSOLIDATED FINANCIAL STATEMENTSDecember 31, 2007 and 2006(All amounts in Rupees Million, unless otherwise stated)
Ranbaxy Laboratories Limited Annual Report 2007 Notes to Consolidated Financial Statements – US GAAP
NOTE Q (continued)
The reported income tax expense differed from amounts computed by applying the enacted tax rates to income before income taxesas a result of the following:
2007 2006
Income before income taxes and minority interest 8,195.87 5,007.48
Enacted tax rate for India 33.99% 33.66%
Computed expected tax expense 2,785.78 1,685.52
Effect of :
Valuation allowance (32.63) 141.36
Expenses not deductible for tax purposes 243.92 163.57
Differences between Indian and foreign tax rates (154.58) (60.51)
Income exempt from income taxes (29.77) (56.94)
Incremental deduction allowed for research and development expenses (729.98) (884.54)
Tax rate change 19.74 0.14
Earlier year tax (1.02) (154.20)
Others 124.11 55.18
Income tax expense 2,225.57 889.58
The tax effect of significant temporary differences that resulted in deferred income tax assets and liabilities and their description aregiven below. The classification of the deferred tax assets and liabilities is determined based on the transaction from which the timingdifference arises. Non-current deferred tax assets and liabilities are shown separately due to the tax jurisdiction in which the timingdifference arises.
2007 2006
Current deferred income tax assets, net
Allowance for accounts receivable 232.20 119.51
Inventory related 774.15 761.06
Other current assets (225.03) 332.87
Current liabilities (66.61) (114.32)
Accounts payable (13.99) (7.98)
Total current deferred income tax asset 700.72 1,091.14
Non-current deferred income tax assets
Intangibles 68.46 194.74
Net operating losses carried forward 941.10 1,495.90
Other non-current liabilities 105.46 318.04
Other non-current assets 75.83 60.18
Investments – 19.49
Less: Valuation allowance in respect of net operating losses carried forward (156.55) (296.31)
Total non-current deferred income tax asset 1,034.30 1,792.04
Non-current deferred income tax liabilities
Investments (225.43) –
Property, plant and equipment (1,938.16) (1,697.08)
(2,163.59) (1,697.08)
Net non-current deferred income tax asset/(liability) (1,129.29) 94.96

126
RANBAXY LABORATORIES LIMITED AND SUBSIDIARIES
NOTES TO CONSOLIDATED FINANCIAL STATEMENTSDecember 31, 2007 and 2006(All amounts in Rupees Million, unless otherwise stated)
NOTE Q (continued)
The enacted tax rate in India is 33.99 percent but the effective tax rate for the Group is 27.15 percent. The reduction in the effective taxrate is mainly on account of incremental deductions available under Indian tax laws for research and developmentactivities.
In assessing the realisability of deferred income tax assets, Management considers whether it is more likely than not that someportion or all of the deferred income tax assets will be realised.
The ultimate realisation of deferred income tax assets is dependent upon the generation of future taxable income during the periodsin which the temporary differences become deductible. The amount of the deferred income tax assets considered realisable, however,could be reduced in the future if estimates of future taxable income during such future periods are reduced.
A valuation allowance has been established against the deferred income tax assets on account of the tax effects of the operatinglosses carried forward of certain subsidiaries. As at December 31, 2007 and December 31, 2006, the value of net operatinglosses considered realisable and correspondingly the minimum level of future taxable income required to realise these losseswere Rs. 1,838.83 million and Rs. 2,633.10 million, respectively.
Deferred income taxes on undistributed earnings of the Group's overseas operations have not been recognised as such earningsare considered to be indefinitely reinvested and it is not practicable to calculate the deferred taxes associated with these earnings.The aggregate undistributed earnings considered to be indefinitely reinvested are approximately Rs. 8,523.45 million andRs. 8,757.19 million as of December 31, 2007 and December 31, 2006, respectively.
The Group adopted the provisions of FASB Interpretation No. 48 ("FIN 48"), Accounting for Uncertainty in Income Taxes," onJanuary 1, 2007. FIN 48 clarifies the accounting for uncertainty in income taxes in an enterprise's financial statements inaccordance with FAS 109, "Accounting for Taxes." A reconciliation of the beginning and ending amounts of total unrecognisedtax benefits is as follows:
2007
Balance as at January 1, 2007 136.61
Increase related to prior year tax position 18.79
Decrease related to prior year tax position –
Increase related to current year tax position 13.54
Settlements during the year (37.33)
Lapse of statute of limitations –
Balance as at December 31, 2007 131.61
Included in the unrecognised tax benefits as of December 31, 2007, Rs. 39.02 million relates to net unrecognised tax positionsthat, if recognised, would affect the effective tax rate, none of which is expected to change during the next twelve months December31, 2007. In addition, the Group recognises interest and penalties related to unrecognised tax benefits in interest expense andselling and general administrative expenses respectively. As of January 1, 2007 (the date of adoption of FIN 48) and as of December31, 2007 Group had an accrual of Rs. 2.62 million and Rs. 24.30 million respectively for payment of such interest and penalties.
The Group's two major tax jurisdictions are India and the United State of America (USA), though the Group also files tax returnsin other foreign jurisdictions. In India, the assessment is not yet completed for the tax year 2004-05 and onwards. In the U.S,during 2007, the Internal Revenue Services ("IRS") completed examination of the income tax return's for the 2003 and 2004financial years. Further, in respect of USA, the financial years 2005 and 2006 are currently under examination by the IRS. Theexamination is still at the initial stage and is expected to be completed in the near future.
NOTE R - EMPLOYEE BENEFIT PLANS
a) Gratuity
In accordance with applicable Indian laws, the Company and its Indian subsidiaries provide for gratuity, a defined benefit retirementplan covering eligible employees ("the Gratuity Plan"). This Plan provides for a lump sum payment to vested employees onretirement, death, incapacitation or termination of employment of amounts that are based on last drawn salary and tenure ofemployment. Liabilities with regard to the Gratuity Plan are determined by actuarial valuation and contributed to the GratuityFund Trust ("the Trust"). Trustees administer contributions made to the Trust and invest in specific designated securities asmandated by law, which generally comprise Central and State government bonds and debt instruments of government-ownedcorporations.

127
RANBAXY LABORATORIES LIMITED AND SUBSIDIARIES
NOTES TO CONSOLIDATED FINANCIAL STATEMENTSDecember 31, 2007 and 2006(All amounts in Rupees Million, unless otherwise stated)
Ranbaxy Laboratories Limited Annual Report 2007 Notes to Consolidated Financial Statements – US GAAP
The following table sets out the funded status of the Gratuity Plan and the amounts recognised in the Group's consolidated financialstatements:
2007 2006
Change in the benefit obligations
Projected Benefit Obligations ("PBO") at the beginning of the year 305.17 263.31
Service cost 32.58 26.89
Interest cost 24.41 23.20
Actuarial loss 37.46 15.97
Benefits paid (27.46) (24.20)
PBO at the end of the year 372.16 305.17
Change in plan assets
Fair value of plan assets at the beginning of the year 305.17 267.15
Actual return on plan assets 24.36 19.96
Employer contributions 76.81 51.67
Benefits paid (27.46) (24.20)
Benefits payable (6.72) (9.41)
Fair value of plan assets at the end of the year 372.16 305.17
Net gratuity cost for the years ended December 31, 2007 andDecember 31, 2006 included the following components:
Service cost 32.58 26.89
Interest cost 24.41 23.20
Actuarial loss 37.46 15.97
Net gratuity cost 94.45 66.06
The actuarial assumptions used in accounting for theGratuity Plan were as follows:
Discount rate 8.0% 8.0%
Rate of increase in compensation levels 5.50% 5.50%
Rate of return on plan assets 8.0% 8.0%
The expected long-term return on plan assets is based on the expectation of the average long-term rate of return expected toprevail over the next 15 - 20 years on classes of investments prescribed as per the statutory pattern of investment.
The asset allocations in the Gratuity Plan as at December 31, 2007 and December 31, 2006 are fully in the category of debtinstuments.
The expected contribution to the Gratuity Plan during the year ending December 31, 2008 is Rs. 70.00 million. The followingbenefit payments, based on future services of employees, as appropriate, are expected to be paid:
Year ending December 31,
2008 36.002009 38.002010 41.502011 45.002012 50.50Thereafter 335.00
In respect of certain other employees of the Indian subsidiaries, the gratuity benefit is provided based on actuarial valuation ason the date of the balance sheet and annual contribution is provided accordingly. The settlement obligation remains with thesubsidiaries. Expenses incurred in respect of these employees for the year ended December 31, 2007 approximated Rs.0.64million.
NOTE R (continued)

128
RANBAXY LABORATORIES LIMITED AND SUBSIDIARIES
NOTES TO CONSOLIDATED FINANCIAL STATEMENTSDecember 31, 2007 and 2006(All amounts in Rupees Million, unless otherwise stated)
NOTE R (continued)
b) Superannuation benefit
Apart from being covered under the Gratuity Plan described earlier, certain employees of the Company participate in a superannuationbenefit; a defined contribution plan administered by Life Insurance Corporation ("LIC"). The Company makes contributions based ona specified percentage of salary of each covered employee. The Company does not have any further obligation to the superannuationplan beyond making such contributions. Upon retirement or separation (only after completion of 5 years of service) an employeebecomes entitled for superannuation benefit, as determined by LIC, which is paid directly to the concerned employee. The Companycontributed Rs 59.29 million and Rs. 61.56 million to the superannuation plan during the years ended December 31, 2007 andDecember 31, 2006 respectively.
In addition to the aforementioned one of the Group entities in India also participate in a similar superannuation benefit; a defined contributionplan. The contribution made by the entity towards the plan was Rs. 0.18 million during the year ended December 31, 2007.
c) Pension plan
The Company also has a retirement pension plan ("A defined benefit Pension Plan") which is linked to superannuation benefitsdescribed above. This Pension Plan is applicable for certain management employees who retire after completion of 10 years ofservice or are separated after completion of 20 years of service. The benefits under this plan are based on last drawn salary andtenure of employment. Such pension amount is reduced by the amount payable by LIC under the superannuation plan and ispayable as additional pension. The liability for such additional pension is determined and provided on the basis of actuarialvaluation.
The following table sets out the status of the pension plan and the amounts recognised in the Group's consolidated financial statements:
2007 2006
Change in the benefit obligations
Projected Benefit Obligations ("PBO") at the beginning of the year 957.65 845.23
Service cost 158.86 55.31
Interest cost 76.61 76.61
Actuarial loss 38.07 1.34
Benefits paid (25.70) (20.84)
PBO at the end of the year 1,205.49 957.65
Net pension cost for the years ended December 31, 2007 andDecember 31, 2006 included the following components:
Service cost 158.86 55.31
Interest cost 76.61 76.61
Actuarial loss 38.07 1.34
Net pension cost 273.54 133.26
The actuarial assumptions used in accounting for thePension Plan were as follows:
Discount rate 8.0% 8.0%
Rate of increase in compensation levels 5.5% 5.5%
The following benefit payments, which reflect expected future service, as appropriate, are expected to be paid:
Year ending December 31,
2008 28.00
2009 30.00
2010 33.50
2011 39.00
2012 45.00
Thereafter 350.00
RLL has contributed Rs 263.97 million and Rs 126.74 million to the pension scheme during the years ended December 31, 2007and December 31, 2006, respectively.

129
RANBAXY LABORATORIES LIMITED AND SUBSIDIARIES
NOTES TO CONSOLIDATED FINANCIAL STATEMENTSDecember 31, 2007 and 2006(All amounts in Rupees Million, unless otherwise stated)
Ranbaxy Laboratories Limited Annual Report 2007 Notes to Consolidated Financial Statements – US GAAP
d) Deferred compensation plan
Ranbaxy Inc., one of the overseas subsidiaries, maintains a nonqualified, deferred compensation plan for certain executive employees.Each participating employee may elect to defer upto 100 percent of their compensation. The employees' contributions to the plan areinvested in certain funds based on each employee's investment election and the fair market value of those funds are recorded as along-term asset with a corresponding liability recorded representing future benefits payable to the employees.
e) Vacation pay plan
RLL and its Indian subsidiaries permit encashment of leave accumulated by their employees on retirement, separation and during thecourse of service (the "Vacation Pay Plan" - a defined benefit plan). The liability for encashment of such leave is determined andprovided on the basis of actuarial valuation performed by an independent actuary at the balance sheet date.
The following table sets out the status of the Vacation Pay Plan of RLL and the corresponding amounts recognised in the Group'sconsolidated financial statements:
2007 2006
Change in the benefit obligations
Projected Benefit Obligations ("PBO") at the beginning of the year 159.82 138.07
Service cost 27.20 22.61Interest cost 12.30 11.05
Actuarial loss 37.55 23.66Benefits paid (54.49) (35.57)
PBO at the end of the year 182.38 159.82
Net vacation pay cost for the years ended December 31, 2007 andDecember 31, 2006 included the following components:
Service cost 27.20 22.61
Interest cost 12.30 11.05
Actuarial loss 37.55 23.66
Net vacation pay cost 77.05 57.32
The actuarial assumptions used in accounting for theVacation pay plan were as follows:
Discount rate 8.0% 8.0%
Rate of increase in compensation levels 5.5% 5.5%
RLL and its Indian subsidiaries provided Rs 86.12 million and Rs 94.33 million towards the liability for leave encashment for theyears ended December 31, 2007 and December 31, 2006 respectively.
f) Other benefit plans
1. RLL and certain Group Companies also have other defined contribution plans, which are largely governed by local statutorylaws of the respective countries and cover the eligible employees of the subsidiary. These plans are funded generally byboth employer and employee by way of monthly contributions, primarily based on a specified percentage of the employees'salary. The total contribution to these schemes during the years ended December 31, 2007 and December 31, 2006, wereRs. 300.26 million and Rs. 212.32 million, respectively.
2. Further Ranbaxy Inc., one of the overseas subsidiaries, participates in a savings plan under Section 401(k) of the InternalRevenue Code ("Code") covering substantially all eligible employees. The plan allows for employees to defer up to 15% oftheir annual earnings (within limitations, as adjusted by Section 415(b)(1)(A) of the Code) on a pre-tax basis through voluntarycontributions to the plan.
The plan provides that Ranbaxy Inc., can make optional contributions in an amount up to the maximum allowable bySection 404 of the Code. Employees achieve a 25 percent vested status after one year of service and a fully vested statusafter three years of service. During the years ended December 31, 2007 and December 31, 2006, the contributions to theplan were Rs 33.72 million and Rs 30.56 million, respectively.
3. Terapia, S.A. (Terapia) provides post retirement benefit plan under which employees receive an amount equal to a grossaverage salary on retirement, in compliance with the provisions of the collective labour agreement.
Both Terapia and its employees have the obligation to contribute to the National Retirement Fund. Terapia has no obligationof paying future benefits other than to the National Retirement Fund. The obligation amounting to Rs 144.67 million andRs. 103.49 million has been provided in the books for the year ended December 31, 2007 and December 31, 2006 respectively.
NOTE R (continued)

130
RANBAXY LABORATORIES LIMITED AND SUBSIDIARIES
NOTES TO CONSOLIDATED FINANCIAL STATEMENTSDecember 31, 2007 and 2006(All amounts in Rupees Million, unless otherwise stated)
4. During the year Basics GmbH(Basics), one of the overseas subsidiary has introduced, a contribution to pension relief fundeffective November 1, 2007 based on specified percentage of salary. Basics does not have any further obligation to thepension relief fund beyond making such contribution. The benefit of this fund will be given to those employees who havecompleted 5 years of service. If the employee leaves the service before completing 5 years of service the contribution madewill be refunded to Basics. The employee will get the contribution made by Basics in one instalment upon reaching theretirement age. A contribution amounting to Rs. 4.82 million has been provided in the books for the year December31, 2007.
NOTE S - SEGMENT REPORTING
SFAS No. 131 "Disclosures about Segments of an Enterprise and Related Information", sets out the standards for the way thatbusiness enterprises report information about operating segments and related disclosures about products and services,geographical areas and major customers.
The Chief Operating Decision Maker evaluates the Group's performance and allocates resources based on review of financialinformation on the following main disaggregated components of the Group's business:
a) Pharmaceuticals: global sales, detailed by regions and countries and global operating income data. The Group'spharmaceutical business operates in four main regions: India, North America, Europe and Rest of the world.
b) Research and development: expenses incurred on research and development, and
c) Administration: corporate expenses.
The Group's reportable segments are strategic businesses aggregated by the nature of their products, customers, productiontechnologies and marketing methods. Accordingly, the Group provides information regarding its Pharmaceuticals segment(dosage forms, active pharmaceutical ingredient and drug intermediates), trading in pharmaceutical products, drug discoveryresearch and novel drug delivery systems research, which is collectively referred to as the "Pharmaceuticals" business.
The Company is also engaged in operations relating to financial services, referred to as "Others" businesses. The Group haddivested the business of charter of aircraft during the year 2006.
Revenue and expenditure in relation to segments is categorised based on items that are individually identifiable to that segment.
Information by business segments for the year ended December 31, 2007:
Particulars Pharmaceuticals Others Total
Revenues 70,917.51 – 70,917.51
Less: Inter-segment revenue – – –
Net revenues 70,917.51 – 70,917.51
Operating expenses
Cost of revenues 33,706.73 – 33,706.73
Selling, general and administrative expenses 22,553.19 355.02 22,908.21
Depreciation and amortisation 3,840.45 0.02 3,840.47
Research and development 4,281.96 – 4,281.96
64,382.33 355.04 64,737.37
Less: Inter-segment expenses – – –
Net operating expenses 64,382.83 355.04 64,737.37
Net income before unallocated items 6,535.18 (355.04) 6,180.14Reconciliation to net income
Financial expenses, net – – (2,296.07)
Other income, net – – 4,269.06
Income tax expense – – (2,225.57)
Share of profit and loss of affiliates (net) – – 42.74
Minority interest – – (111.08)
Net income as per consolidated statement of Income – – 5,859.22
NOTE R (continued)

131
RANBAXY LABORATORIES LIMITED AND SUBSIDIARIES
NOTES TO CONSOLIDATED FINANCIAL STATEMENTSDecember 31, 2007 and 2006(All amounts in Rupees Million, unless otherwise stated)
Ranbaxy Laboratories Limited Annual Report 2007 Notes to Consolidated Financial Statements – US GAAP
Information relating to assets Pharmaceuticals Others Total
Total assets 81,258.31 15.64 81,273.95
Less: Inter-segment assets
Accounts receivable, net of allowances – – –
Other current assets, net of allowances – – –
– – –
Net assets employed 81,258.31 15.64 81,273.95
Unallocated corporate assets 8,330.86
Total assets 89,604.81
Information by business segments for the year ended December 31, 2006
Particulars Pharmaceuticals Others Total
Revenues 61,972.18 12.87 61,985.05
Less: Inter-segment revenue – – –
Net revenues 61,972.18 12.87 61,985.05
Operating expenses
Cost of revenues 29,465.74 – 29,465.74
Selling, general and administrative expenses 19,641.68 10.15 19,651.83
Depreciation and amortisation 2,892.56 1.75 2,894.31
Research and development 3,982.42 – 3,982.42
55,982.40 11.90 55,994.30
Less: Inter-segment expenses – – –
Net operating expenses 55,982.40 11.90 55,994.30
Net income before unallocated items 5,989.78 0.97 5,990.75Reconciliation to net income
Financial expenses, net – – (1,582.15)
Other income, net – – 548.58
Income tax expense – – (889.58)
Share of profit and loss of affiliates (net) – – 50.30
Minority interest – – (57.31)
Net income as per consolidated statement of Income – – 4.060.59
Information relating to assets Pharmaceuticals Others Total
Total assets 76,400.25 702.24 77,102.49
Less: Inter-segment assets
Accounts receivable, net of allowances – – –
Other current assets, net of allowances – – –
– – –
Net assets employed 76,400.25 702.24 77,102.49
Unallocated corporate assets 5,077.51
Total assets 82,180.00
NOTE S (continued)

132
RANBAXY LABORATORIES LIMITED AND SUBSIDIARIES
NOTES TO CONSOLIDATED FINANCIAL STATEMENTSDecember 31, 2007 and 2006(All amounts in Rupees Million, unless otherwise stated)
NOTE T - FINANCIAL INSTRUMENTS AND CONCENTRATIONS
Financial instruments that potentially subject the Group to concentrations of credit risk consist principally of cash equivalents,accounts receivables, other receivables, investment securities and deposits. By their nature, all such financial instrumentsinvolve risk including the credit risk of non-performance by counter parties. The Group's cash equivalents and time deposits areinvested with the banks. The Group monitors the credit worthiness of its customers to which it grants credit terms in the normalcourse of the business.
The carrying amounts of cash and cash equivalents, accounts receivables, other receivables, accrued liabilities, and accountspayable approximate fair value, because of the short-term maturities of these financial instruments. The carrying amounts ofcapital lease obligations, long-term debt and time deposits approximate their fair values as these carry interest rates whichreflect market rate for borrowings, with similar terms and maturities, currently available to the Group. The fair value of the longterm deposits cannot be estimated as the maturity of these deposits is presently not known.
RLL and Ranbaxy Inc., accounted for approximately 38 percent and 24 percent respectively (40 percent and 28 percent respectivelyin 2006) of the Group's consolidated revenues in the year 2007. At December 31, 2007 and December 31, 2006, three customersof RPI accounted for approximately 16 percent and 20 percent respectively of the Group's gross accounts receivable.
The Company enters into certain forward foreign exchange contracts and options where the counter party is generally a bank.The Company does not consider the risk of non-performance by the counterparty to be significant. The currency-hedged itemsare mainly denominated in United States Dollar and Japanese Yen. The aggregate contracted principal of the Company's derivativefinancial instruments outstanding as at December 31, 2007 and December 31, 2006, are Rs. 35,674.41 million and Rs. 28,045.89million respectively. Additionally, during year 2007 the Company has entered into floating to fixed interest rate swap to hedge itsexposure on JPY LIBOR related to its external commercial borrowings aggregating to JPY 9.35 billion (2006 - Nil).
NOTE U - COMMITMENTS AND CONTINGENCIES
RLL and the Group companies lease office premises and residential facilities under both cancelable and non cancelable operatingleases. Rent expense for the years ended December 31, 2007 and December 31, 2006 was Rs. 520.18 million and Rs. 462.28million, respectively.
The minimum rental commitments under non cancelable operating leases are approximately as follows:
Year ending December 31,
2008 105.62
2009 52.49
2010 44.10
2011 39.39
2012 34.31
Thereafter 58.73
Other Contingencies
RLL and some Group companies are involved in certain claims, tax assessments and litigations arising in the ordinary course ofbusiness, primarily related to alleged patent infringement for products that the Group currently manufactures, sells or distributesor intends to manufacture, sell or distribute. In certain claims and litigations, the Group companies are named as a co-defendant,along with others, including RLL. Further, certain of the Group's products have a higher regulatory risk profile, and accordinglythe Group has increased its product liability coverage. The Group evaluates the requirements for establishing provisions forsuch claims, assessments and litigation in accordance with SFAS No. 5 - Accounting for Contingencies. Management believesthat these matters, taken individually or in the aggregate, will not have material adverse impact on the Group's financial positionor results of operations.
A summary of the contingencies existing at December 31, 2007 and December 31, 2006 is as follows:
2007 2006
Claims against the Company not acknowledged as debts* 1,463.46 1,172.69
Guarantees to banks on behalf of others – 71.68
Bills purchased/discounted under letter of credit 1.76 –
Indirect taxes 234.22 216.45
1,699.44 1,460.82
* Includes Rs 348.75 million (2006 - Rs 334.44 million) deposited under an appeal.
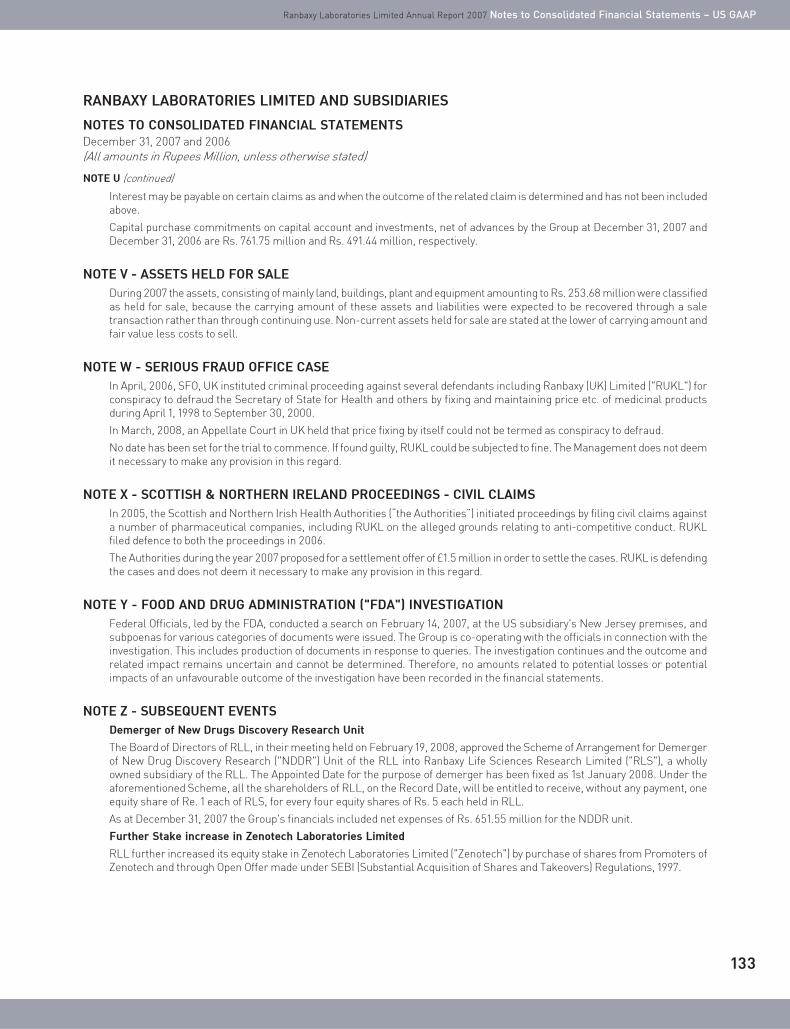
133
RANBAXY LABORATORIES LIMITED AND SUBSIDIARIES
NOTES TO CONSOLIDATED FINANCIAL STATEMENTSDecember 31, 2007 and 2006(All amounts in Rupees Million, unless otherwise stated)
Ranbaxy Laboratories Limited Annual Report 2007 Notes to Consolidated Financial Statements – US GAAP
Interest may be payable on certain claims as and when the outcome of the related claim is determined and has not been includedabove.
Capital purchase commitments on capital account and investments, net of advances by the Group at December 31, 2007 andDecember 31, 2006 are Rs. 761.75 million and Rs. 491.44 million, respectively.
NOTE V - ASSETS HELD FOR SALE
During 2007 the assets, consisting of mainly land, buildings, plant and equipment amounting to Rs. 253.68 million were classifiedas held for sale, because the carrying amount of these assets and liabilities were expected to be recovered through a saletransaction rather than through continuing use. Non-current assets held for sale are stated at the lower of carrying amount andfair value less costs to sell.
NOTE W - SERIOUS FRAUD OFFICE CASE
In April, 2006, SFO, UK instituted criminal proceeding against several defendants including Ranbaxy (UK) Limited ("RUKL") forconspiracy to defraud the Secretary of State for Health and others by fixing and maintaining price etc. of medicinal productsduring April 1, 1998 to September 30, 2000.
In March, 2008, an Appellate Court in UK held that price fixing by itself could not be termed as conspiracy to defraud.
No date has been set for the trial to commence. If found guilty, RUKL could be subjected to fine. The Management does not deemit necessary to make any provision in this regard.
NOTE X - SCOTTISH & NORTHERN IRELAND PROCEEDINGS - CIVIL CLAIMS
In 2005, the Scottish and Northern Irish Health Authorities (“the Authorities”) initiated proceedings by filing civil claims againsta number of pharmaceutical companies, including RUKL on the alleged grounds relating to anti-competitive conduct. RUKLfiled defence to both the proceedings in 2006.
The Authorities during the year 2007 proposed for a settlement offer of £1.5 million in order to settle the cases. RUKL is defendingthe cases and does not deem it necessary to make any provision in this regard.
NOTE Y - FOOD AND DRUG ADMINISTRATION ("FDA") INVESTIGATION
Federal Officials, led by the FDA, conducted a search on February 14, 2007, at the US subsidiary's New Jersey premises, andsubpoenas for various categories of documents were issued. The Group is co-operating with the officials in connection with theinvestigation. This includes production of documents in response to queries. The investigation continues and the outcome andrelated impact remains uncertain and cannot be determined. Therefore, no amounts related to potential losses or potentialimpacts of an unfavourable outcome of the investigation have been recorded in the financial statements.
NOTE Z - SUBSEQUENT EVENTS
Demerger of New Drugs Discovery Research Unit
The Board of Directors of RLL, in their meeting held on February 19, 2008, approved the Scheme of Arrangement for Demergerof New Drug Discovery Research ("NDDR") Unit of the RLL into Ranbaxy Life Sciences Research Limited ("RLS"), a whollyowned subsidiary of the RLL. The Appointed Date for the purpose of demerger has been fixed as 1st January 2008. Under theaforementioned Scheme, all the shareholders of RLL, on the Record Date, will be entitled to receive, without any payment, oneequity share of Re. 1 each of RLS, for every four equity shares of Rs. 5 each held in RLL.
As at December 31, 2007 the Group's financials included net expenses of Rs. 651.55 million for the NDDR unit.
Further Stake increase in Zenotech Laboratories Limited
RLL further increased its equity stake in Zenotech Laboratories Limited ("Zenotech") by purchase of shares from Promoters ofZenotech and through Open Offer made under SEBI (Substantial Acquisition of Shares and Takeovers) Regulations, 1997.
NOTE U (continued)

134
RANBAXY LABORATORIES LIMITED AND SUBSIDIARIES
NOTES TO CONSOLIDATED FINANCIAL STATEMENTSDecember 31, 2007 and 2006(All amounts in Rupees Million, unless otherwise stated)
The details are as follows:
Particulars Date of No. of Consideration % of equityacquisition shares (Rs. million) share capital
of Zenotech
Shares acquired from promoters of Zenotech. January 31, 2008 7,878,906 1,260.62 22.94 %
Shares acquired under Open Offer made under February 4, 2008 758,851 121.41 2.21 %SEBI (Substantial Acquisition of Shares andTakeovers) Regulations, 1997.
Post acquisition of these shares, the shareholding of the Parent Company in Zenotech became 46.95% of Zenotech’s capitalbase.
NOTE Z (continued)

135
RANBAXY LABORATORIES LIMITED AND SUBSIDIARIES
RECONILIATION BETWEEN THE FINANCIAL STATEMENTS UNDER INDIAN GAAP AND U.S. GAAP
A reconciliation of net income as per Indian GAAP ("IGAAP") and U.S. GAAP is set out below:
Rs. Million
2007 2006
Net income after minority interest as per U.S. GAAP 5,859 4,061
Add:
Additional depreciation, amortisation and impairment 1,657 1,051
Costs incurred for acquiring product under development including subsequent expenditures 24 51
Issue costs of foreign currency convertible bonds 45 36
Interest(net of exchange gain) on foreign currency convertible bonds payable at the
time of redemption 953 751
Costs of employee stock incentive scheme i.e. fair value vs. intrinsic value 219 332
Translation gain on integral operation taken to income statement in IGAAP – 455
Others 129 –
Less:
Translation loss on integral operation taken to income statement in IGAAP 262 –
Forward foreign exchange contracts & currency options at fair value at year end 750 1,092
Taxes(deferred tax and tax earlier years) 129 420
Others – 122
Net income after minority interest as per Indian GAAP 7,745 5,103

Notes

Emerging markets, niche and specialty
segments, First-to-File (FTF) products in the US,
the NDDR de-merger...indeed, there's a lot new
on Ranbaxy's horizon this year. And while change
is already underway, this is just the beginning,
with several new initiatives lined up for the
immediate future.
As your Company pushes the frontiers of
possibility, both horizontally and vertically,
growth through scientific breakthroughs and
strategic initiatives is just around the corner.
The clear aspiration is to achieve global sales of
US $ 5 Bn by 2012 and position Ranbaxy among
the top 5 global generic companies.
Focused on Today... Poised for Tomorrow...
It is indeed a pleasant surprise when you discover something valuable and priceless in
something as ordinary as an Oyster. But at Ranbaxy, we have always sensed it was
there. The 'Pearl of Success' veiled beyond sight in markets yet untapped and in those
wonderfully elusive niche areas, untouched.
It took dogged pursuit, and an uncanny sense for business to unravel the marvel and
prize it open, discovering along the way, the joys of first mover advantage.
With a determined eye squarely on the future, we are ready for today and are well poised
to bathe in the pearly glow of success, beyond tomorrow.

Annual Report 2007
Focused on today... Poised for tomorrow...
Ed
ited
& P
ub
lish
ed b
y G
lob
al C
orp
ora
te C
om
mu
nic
atio
ns
at R
anb
axy;
Co
nce
pt
& D
esig
n b
y U
nit
ed A
dve
rtis
ing
; Ph
oto
gra
ph
y b
y A
dit
ya A
rya;
Pri
nte
d b
y T
ho
mso
n P
ress
Focused on today... Poised for tomorrow...
Annual Report 2007
Plot No. 90, Sector 32, Gurgaon – 122 001, Haryana (India) Tel.: +91-124-4135000. Fax : +91-124-4135001
www.ranbaxy.com