focused on growth ))) - segasammy.co.jp file33 ((( profile ))) there are many ways to have fun, and...
TRANSCRIPT

((( FOCUSED ON GROWTH )))
Printed in Japan
23-2, Higashi-Ikebukuro, 2-chome, Toshima-ku, Tokyo, 170-8436, Japan
TEL 03-5950-3785 FAX 03-5950-3772
URL: http//www.sammy.co.jp/
SAMMY
ANNUAL REPORT2000
PACHISLOT
PACHINKO
AMUSEMENT
NEWBUSIN
ESS DEVELOPMENT
33
((( PROFILE )))
There are many ways to have fun, and one can never be sure where the journey will end.
Blazing new trails in entertainment means daring to go beyond the conventional, and
having the spirit and power to innovate. Sammy takes the idea of “enterprising spirit” to heart.
While expanding the domains of pachislot, pachinko and amusement, we will accept the
challenges of creating new business in the entertainment field, and through it, unique value.
Sammy—a company with the will to change and meet the needs of its times.
((( CORPORATE DATA )))
CONTENTS
REVIEW OF OPERATIONS ........................... 1
PACHISLOT .................................... 2
PACHINKO ..................................... 4
AMUSEMENT .................................... 6
NEW BUSINESS DEVELOPMENT ..................... 8
TO OUR SHAREHOLDERS ........................... 10
FINANCIAL HIGHLIGHTS .......................... 14
MANAGEMENT DISCUSSION AND ANALYSIS ............ 15
CONSOLIDATED FINANCIAL STATEMENTS AND NOTES ... 18
CORPORATE DATA................................ 33
Caution with Regard to Forward-
Looking Statements
Statements in this annual report with
respect to Sammy’s plans, strategies,
beliefs and estimates that are not historical
facts are forward-looking statements. They
constitute management’s assumptions
based on information currently available
and involve risks and uncertainties.
There are a number of factors that could
cause actual results to differ materially
from such statements.
Head Office:
23-2, Higashi-Ikebukuro 2-chome,
Toshima-ku, Tokyo 170-8436, Japan
Established:
November 1, 1975
Capital:
¥4,841,658,600
(As of March 31, 2000, non-consolidated)
Employees:
452
(As of March 31, 2000, non-consolidated)
Common Stock:
Authorized: 30,000,000 shares
Issued: 12,643,450 shares
(As of March 31, 2000)
Number of Shareholders:
9,390
(As of March 31, 2000)
Transfer Agent of Common Shares
Handling Office:
The Toyo Trust and Banking Co., Ltd.
Corporate Agency Department
10-11, Higashisuna 7-chome, Koto-ku,
Tokyo 137-8081, Japan
Phone: 03-5683-5111
Principal Business:
• Development, manufacture and
sales of pachinko machines,
pachislot machines, arrange ball
machines, and peripheral
equipment
• Development, manufacture and
sales of home video game software
• Development, manufacture, sales
and export of amusement arcade
equipment
• Operation of amusement arcades
Network:
Factory and Distribution Center:
Sayama
Branches:
Sapporo, Sendai, Tokyo, Nagoya,
Osaka, Hiroshima, Fukuoka
Sales Offices:
Aomori, Koriyama, Tsukuba,
Takasaki, Shizuoka, Kyoto, Kobe,
Takamatsu, Miyazaki
Subsidiaries:
Sammy USA Corporation
MAXBET Co., Ltd.
Sammy Amusement Service Co., Ltd.
Spike Co., Ltd.
Underground Liberation Force Inc.
Vaill Co., Ltd.
Quat Technology Inc.
RODEO Co., Ltd.
Dimps Corp.
Management:
President & CEO:
Hajime Satomi
Senior Managing Director:
Toru Katamoto
Managing Directors:
Keishi Nakayama
Kiyofumi Sakino
Standing Corporate Auditors:
Mamoru Makaya
Ryoichi Arai
Corporate Auditor:
Etsuo Sakai
Senior Executive Officers:
Norihiko Harada
Kenkichi Yoshida
Executive Officers:
Yasunori Kawamura
Katsunori Muraki
Koji Tanizawa
Yoshitaka Kawamura
Yasuhiro Katayama
Masakazu Yoshino
(As of June 27, 2000)
For further information, please contact:
Investor Relations
Sammy Corporation
23-2, Higashi-Ikebukuro 2-chome,
Toshima-ku, Tokyo 170-8436, Japan
Phone: 03-5950-3785
Facsimile: 03-5950-3772
e-mail: [email protected]
Or via the Internet at:
http://www.sammy.co.jp

1REVIEW OF OPERATIONS 1
PACHISLOT
PACHINKO
AMUSEMENT
NEWBUSIN
ESS DEVELOPMENT

2To bolster the pachislot machine business, we formed analliance to produce these units with the Japanese subsidiary ofAristocrat Leisure Industries Pty Ltd.
NET SALES
Sammy’s superlative product development has led to manysuccesses through predicting market needs.
The number of pachislot machines installed in pachinko parlors rose13%, coming to 1,140,000.
(BILLIONS OF YEN)
03/96
11.6
03/97
9.5
03/98
15.9
03/99
27.4
03/00
23.0
PACHISLOT
2

3
Pachislot
Continued growth in the pachislot market
The ranks of pachislot fans continue to grow, thanks to
the rush to introduce a new genre of pachislot machines
with attractive game features. As a result, total shipments
in 1999 rose to over 970,000 units and the number of
pachislot machines installed in pachinko parlors increased
to 1.14 million as of the end of 1999.
Sammy shipped 73,000 units in the fiscal year ended March
2000. While sales fell 16.0% to ¥23,010 million, our
pachislot market share in terms of annual unit
sales topped 7.5%.
Development of new gaming
concept machines
In new concept products, Gegege no
Kitaro, the first pachislot machine in-
tegrating an LCD, was launched in
January 2000. It has proved enor-
mously successful, with sales topping
20,000 units, at a value of ¥6,366 million,
in just three months. This success reconfirmed
our prowess in new product development for the
pachislot sector, and demonstrated why the industry has come
to view Sammy as a byword for innovative new products.
With the rush to create new concept machines, the pachislot
market is growing. This has attracted other manufacturers and
the competition is heating up. To assure that we prevail and
expand market share, we will bolster our already strong brand
image, drawing on our superior development capabilities and
successful use of popular characters to attract pachislot fans.
Partnerships and acquisitions
In another move, in March 2000, we entered into a partnership in
pachislot machine manufacturing with Aristocrat Japan Co., Ltd.*,
the Japanese subsidiary of Australia-based Aristocrat Leisure Indus-
tries Pty Ltd, the world’s second largest slot machine manufacturer.
In 2000, we will set up a joint venture with Aristocrat Japan to
market pachislot machines. Furthermore, in July 2000, we acquired
Barcrest Co., Ltd., a pachislot machine manufacturer, and converted
it into a wholly-owned subsidiary. The company was renamed
RODEO Co., Ltd. This will allow us to add the RODEO
brand pachislot machines to our product line-up.
The possession of two brands will help us
increase the frequency of new model
launches and expand our market share.
National marketing network
Previously, Sammy‘s main route to mar-
keting pachislot machines was through a
national network of 300 sales agents. In the
fiscal year ended March 2000, we set up nine
local sales offices under our seven-branch net-
work. These seven branches and nine local sales offices
will allow us to increase the share of direct sales and improve the
operating income ratio. By finely integrating direct marketing and
the sales agent channel, we will be in a position to target more cus-
tomer sectors and increase our market share.
Our two-pronged approach—developing new models to achieve
higher levels of customer satisfaction and strengthening market-
ing power—is designed to assure further growth and to establish
the pachislot business as a stable source of earnings.
*Now called Aristocrat Technologies Co., Ltd.
PACHISLOT
3
PACHISLOT
PACHINKO
AMUSEMENT
NEWBUSIN
ESS DEVELOPMENT
4
NET SALES44
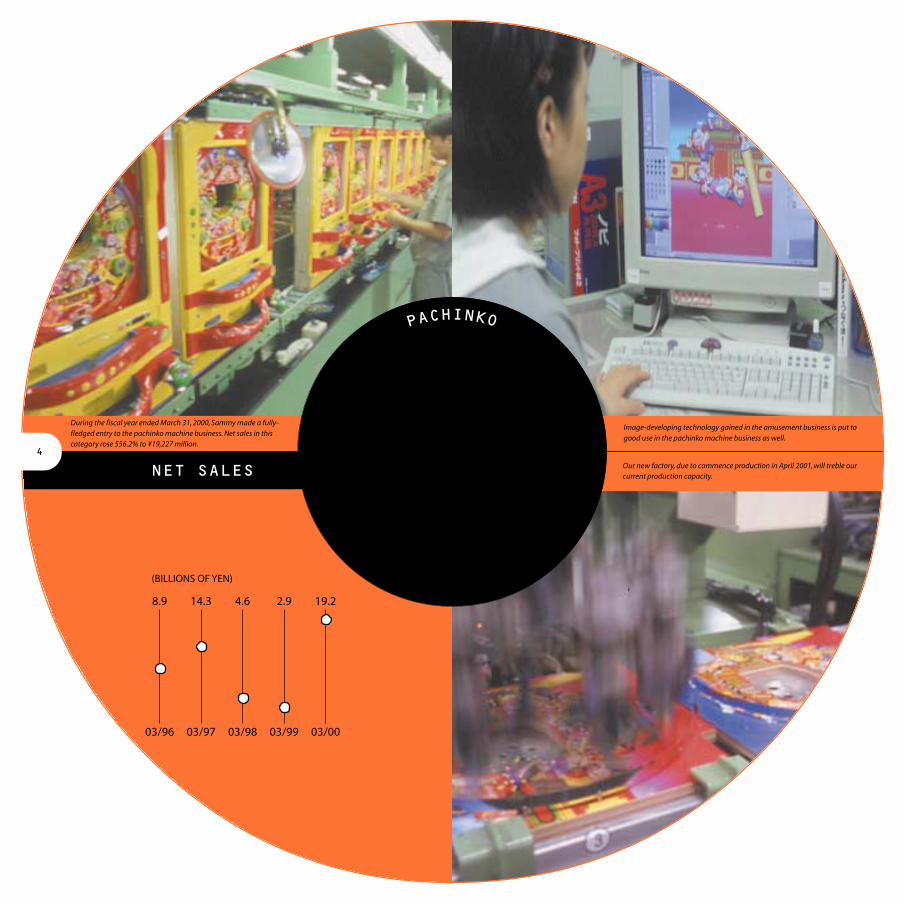
Our new factory, due to commence production in April 2001, will treble ourcurrent production capacity.
During the fiscal year ended March 31, 2000, Sammy made a fully-fledged entry to the pachinko machine business. Net sales in thiscategory rose 556.2% to ¥19,227 million.
Image-developing technology gained in the amusement business is put togood use in the pachinko machine business as well.
(BILLIONS OF YEN)
03/96
8.9
03/97
14.3
03/98
4.6
03/99
2.9
03/00
19.2
PACHINKO
5
Pachinko
Recovery in the pachinko market
In recent years, the restraints on the gambling aspect of
pachinko have driven away fans. However, in January 1999,
regulations were considerably relaxed on “payout limiters.”
The year under review was the first in which this change
really made its effects felt. Approval for pachinko machines
with attractive gaming aspects became easier to attain, which
put the brakes on the decline in the number of pachinko fans.
Recovery in this market is already underway.
Fully-fledged entry into the pachinko
market
Pachinko machine sales in the fiscal year
ended March 2000 rose an impressive
556.2% to ¥19,227 million. Since the
company’s full market entry, the con-
tribution of the pachinko business to
total sales increased from 8.0% in the
previous fiscal year to 40.2% in the fiscal
year ended March 2000. Pachinko machines
have thus become a second main product line
after pachislot. The CR Oribe Kinjiro model launched in
March 1999 won a large following, attracted by the widely
popular character it used. Shipments in the fiscal year ended
March 2000 topped 23,000 units, valued at ¥4,296 million. We
launched another successful model CR Otoko Wa Tsuraiyo S
in September 1999. The hero of this immensely popular film
series (48 episodes over a 30 year period) provides the motif.
Cumulative sales topped 32,000 units, valued at ¥5,614 mil-
lion. In February 2000, we launched the CR SD Gundam S
model . This model offers superior game features. Sales in
just the two months following the launch topped 39,000 units,
valued at ¥6,698 million.
Sammy’s share of the pachinko market rose to a record 3.6% in
the year ended March 2000. We expect our share of this impor-
tant market to rise steadily as we strengthen R&D and launch
products better tuned to the preferences of our fans.
The pachinko business is the key to drive medium-
term growth
To speed up pachinko machine development, Sammy has
been reinforcing the development team and ex-
panding fundamental research.
At the same time, we plan to expand our pro-
duction capacity to ensure timely supply
capabilities. A new factory equipped with
advanced warehouse functions is due to
commence production in April 2001,
catering to the flood of orders that follow
new model launches. This new facility will
possess three times the capacity of our current
factory, with a daily production capacity of 3,000
pachinko machines and 1,000 pachislot machines.
Sammy’s strength in marketing lies in our ability to approach
the 17,000 pachinko and pachislot halls nationwide with detailed
product presentations of both pachislot and pachinko machine
lines. We are tapping into this network to build closer relations
with hall operators throughout Japan, thus creating a spring-
board for the next stage of growth.
Pachinko is a massive market, with 3.7 million units in operation.
Our medium-term corporate goal is to carve out a significant
position in this popular entertainment market.
PACHINKO
5
PACHINKO
AMUSEMENT
NEWBUSIN
ESS DEVELOPMENT
6
NET SALES
6
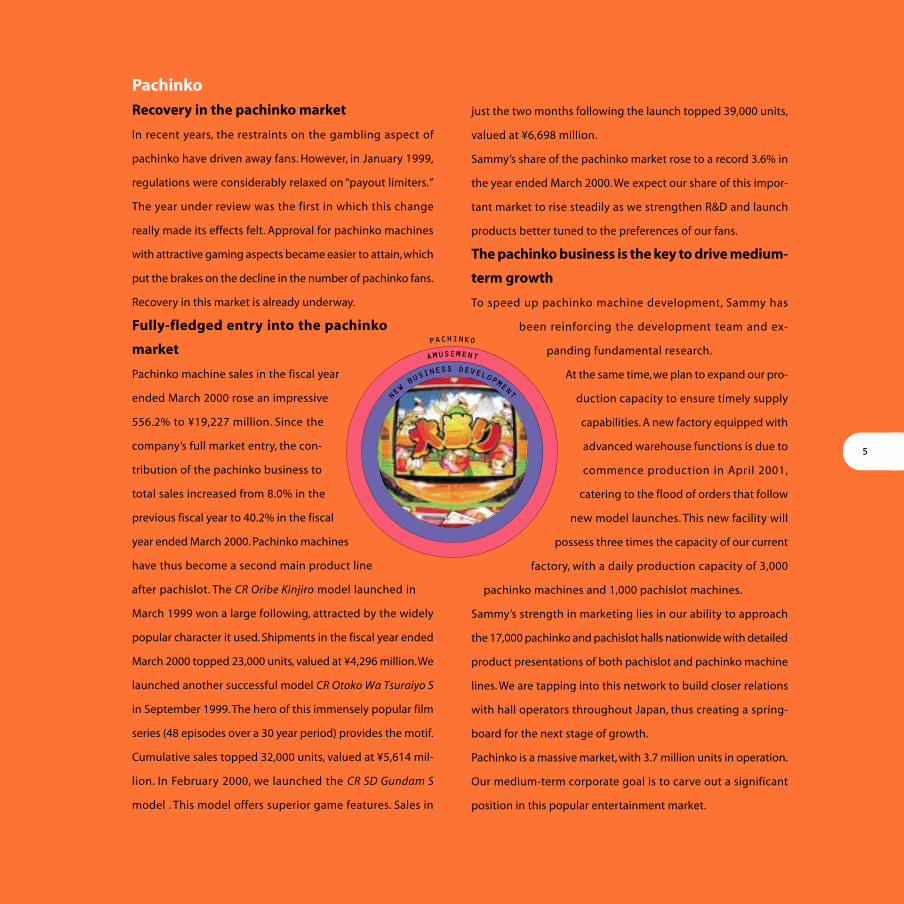
In home video game software, business expansion is supported by ourspecialized subsidiaries.
Our excellence in medal game machine development is demonstratedby favorable reviews from customers.
Our two directly operated amusement arcades make important contributionsto market research activities.
(BILLIONS OF YEN)
03/96
2.7
03/97
4.2
03/98
4.0
03/99
6.4
03/00
5.5
AMUSEMENT
7
Amusement
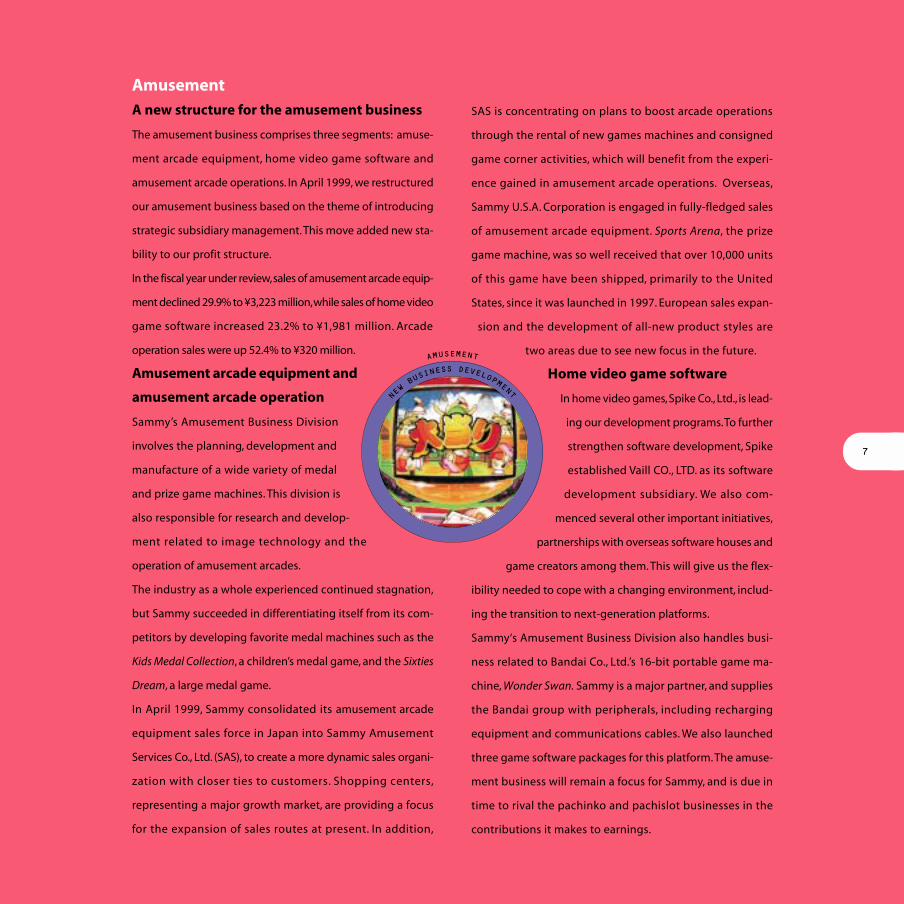
A new structure for the amusement business
The amusement business comprises three segments: amuse-
ment arcade equipment, home video game software and
amusement arcade operations. In April 1999, we restructured
our amusement business based on the theme of introducing
strategic subsidiary management. This move added new sta-
bility to our profit structure.
In the fiscal year under review, sales of amusement arcade equip-
ment declined 29.9% to ¥3,223 million, while sales of home video
game software increased 23.2% to ¥1,981 million. Arcade
operation sales were up 52.4% to ¥320 million.
Amusement arcade equipment and
amusement arcade operation
Sammy’s Amusement Business Division
involves the planning, development and
manufacture of a wide variety of medal
and prize game machines. This division is
also responsible for research and develop-
ment related to image technology and the
operation of amusement arcades.
The industry as a whole experienced continued stagnation,
but Sammy succeeded in differentiating itself from its com-
petitors by developing favorite medal machines such as the
Kids Medal Collection, a children’s medal game, and the Sixties
Dream, a large medal game.
In April 1999, Sammy consolidated its amusement arcade
equipment sales force in Japan into Sammy Amusement
Services Co., Ltd. (SAS), to create a more dynamic sales organi-
zation with closer ties to customers. Shopping centers,
representing a major growth market, are providing a focus
for the expansion of sales routes at present. In addition,
SAS is concentrating on plans to boost arcade operations
through the rental of new games machines and consigned
game corner activities, which will benefit from the experi-
ence gained in amusement arcade operations. Overseas,
Sammy U.S.A. Corporation is engaged in fully-fledged sales
of amusement arcade equipment. Sports Arena, the prize
game machine, was so well received that over 10,000 units
of this game have been shipped, primarily to the United
States, since it was launched in 1997. European sales expan-
sion and the development of all-new product styles are
two areas due to see new focus in the future.
Home video game software
In home video games, Spike Co., Ltd., is lead-
ing our development programs. To further
strengthen software development, Spike
established Vaill CO., LTD. as its software
development subsidiary. We also com-
menced several other important initiatives,
partnerships with overseas software houses and
game creators among them. This will give us the flex-
ibility needed to cope with a changing environment, includ-
ing the transition to next-generation platforms.
Sammy‘s Amusement Business Division also handles busi-
ness related to Bandai Co., Ltd.’s 16-bit portable game ma-
chine, Wonder Swan. Sammy is a major partner, and supplies
the Bandai group with peripherals, including recharging
equipment and communications cables. We also launched
three game software packages for this platform. The amuse-
ment business will remain a focus for Sammy, and is due in
time to rival the pachinko and pachislot businesses in the
contributions it makes to earnings.
AMUSEMENT
7
AMUSEMENT
NEWBUSIN
ESS DEVELOPMENT

8
NET SALES
8Creativity and foresight are the main ingredients in the high-quality entertainmentwe offer. Making a contribution to fulfilling lives is one of our fundamentalmanagement principles.
In October 1999, we entered the music content business with theestablishment of Underground Liberation Force Inc.
In this photo, only the pink butterfly is real. The green butterfly is an illusion createdwith “Volumatrix,” optical 3D technology developed by OPD Corp.
(BILLIONS OF YEN)
03/00
0.05
03/01(Predicted)
0.80
03/02(Predicted)
1.60
We started up new businesses
in the field of entertainment in
2000. Plans call for these
businesses to eventually rank
alongside core areas such as
pachinko, pachislot and
amusement businesses.
NEWBU
SINES
S DEVELOPMENT
9
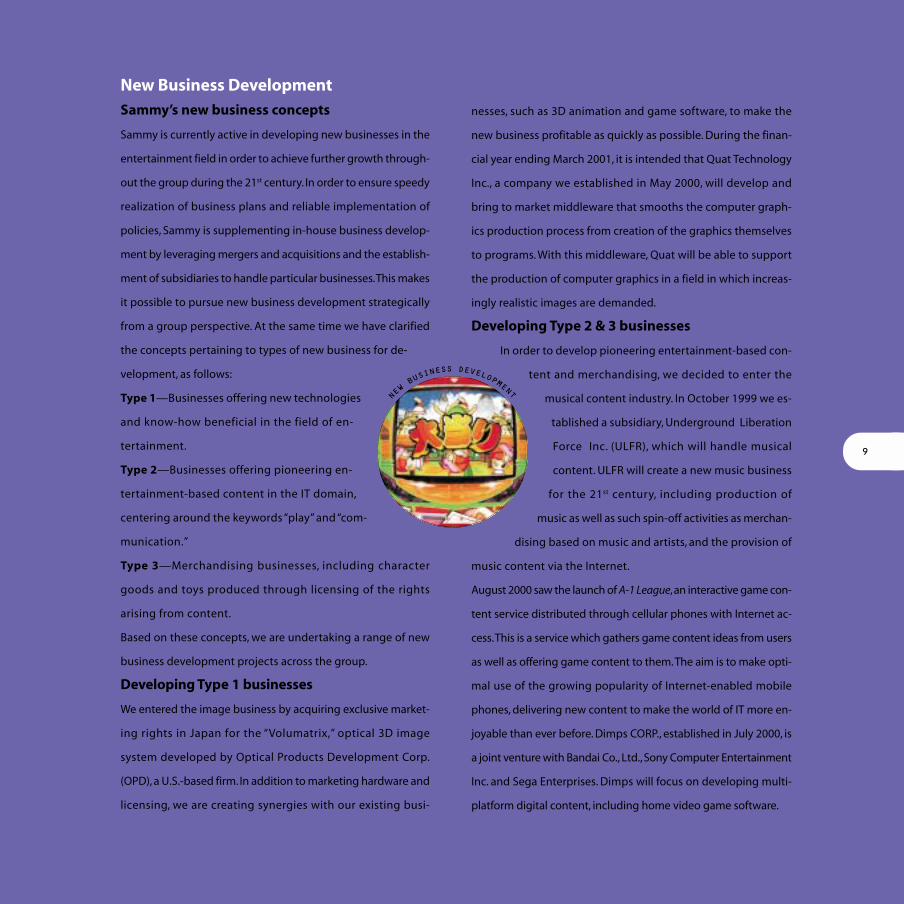
New Business Development
Sammy’s new business concepts
Sammy is currently active in developing new businesses in the
entertainment field in order to achieve further growth through-
out the group during the 21st century. In order to ensure speedy
realization of business plans and reliable implementation of
policies, Sammy is supplementing in-house business develop-
ment by leveraging mergers and acquisitions and the establish-
ment of subsidiaries to handle particular businesses. This makes
it possible to pursue new business development strategically
from a group perspective. At the same time we have clarified
the concepts pertaining to types of new business for de-
velopment, as follows:
Type 1—Businesses offering new technologies
and know-how beneficial in the field of en-
tertainment.
Type 2—Businesses offering pioneering en-
tertainment-based content in the IT domain,
centering around the keywords “play” and “com-
munication.”
Type 3—Merchandising businesses, including character
goods and toys produced through licensing of the rights
arising from content.
Based on these concepts, we are undertaking a range of new
business development projects across the group.
Developing Type 1 businesses
We entered the image business by acquiring exclusive market-
ing rights in Japan for the “Volumatrix,” optical 3D image
system developed by Optical Products Development Corp.
(OPD), a U.S.-based firm. In addition to marketing hardware and
licensing, we are creating synergies with our existing busi-
nesses, such as 3D animation and game software, to make the
new business profitable as quickly as possible. During the finan-
cial year ending March 2001, it is intended that Quat Technology
Inc., a company we established in May 2000, will develop and
bring to market middleware that smooths the computer graph-
ics production process from creation of the graphics themselves
to programs. With this middleware, Quat will be able to support
the production of computer graphics in a field in which increas-
ingly realistic images are demanded.
Developing Type 2 & 3 businesses
In order to develop pioneering entertainment-based con-
tent and merchandising, we decided to enter the
musical content industry. In October 1999 we es-
tablished a subsidiary, Underground Liberation
Force Inc. (ULFR), which will handle musical
content. ULFR will create a new music business
for the 21st century, including production of
music as well as such spin-off activities as merchan-
dising based on music and artists, and the provision of
music content via the Internet.
August 2000 saw the launch of A-1 League, an interactive game con-
tent service distributed through cellular phones with Internet ac-
cess. This is a service which gathers game content ideas from users
as well as offering game content to them. The aim is to make opti-
mal use of the growing popularity of Internet-enabled mobile
phones, delivering new content to make the world of IT more en-
joyable than ever before. Dimps CORP., established in July 2000, is
a joint venture with Bandai Co., Ltd., Sony Computer Entertainment
Inc. and Sega Enterprises. Dimps will focus on developing multi-
platform digital content, including home video game software.
NEWBUSIN
ESS DEVELOPMENT
9
NEWBUSIN
ESS DEVELOPMENT

1010
((( TO OUR SHAREHOLDERS )))
Hajime Satomi
President & CEO
The Sammy Group successfully implemented its plan
for the fiscal year ended March 2000. Significant in-
creases in both sales and earnings resulted.
Sammy’s development-centered structure, excel-
lence in new product development and ability to
adapt existing technology to new applications will
continue to be key strengths in the years
to come. These strengths will provide
the basis for our efforts to imple-
ment speedier management. In
so doing, we will raise our corpo-
rate value.
Here at the Sammy Group, we in-
tend to push forward with creating a
corporate organization which will support
further expansion. This will tie into achieving consoli-
dated net sales of ¥125,000 million in the fiscal year
ending March 2003, the final year of our medium-
term management plan, and creating a presence for
Sammy as a comprehensive entertainment company.

11
The business environment for pachinko,
pachislot and amusement
With the implementation of deregulation in January 1999,
the pachinko machine industry benefited from the approval
of new types of pachinko machine. Unit sales have increased
as a result, and the market is staging a recovery. With the
approval of a variety of game machines designed to draw
in fans and an increase in the number of machines installed
in parlors, the pachislot industry is steadily growing. In the
amusement business, growth in the amuse-
ment arcade equipment segment has run
out of steam at present. However, with
the release of new games consoles,
prospects are good in home video
game software.
Business results for fiscal year
ended March 31, 2000
I am pleased to report that the Sammy
group achieved all the business targets we set
for ourselves and ended the fiscal year with significant
gains in sales and earnings. In the fiscal year ended March 31,
2000, consolidated net sales rose by 30.1% to ¥47,805 mil-
lion. Operating income climbed by 15.5% to ¥6,128 million.
Net income rose by 98.9% to ¥2,498 million.
During the year, Sammy group made major inroads into the
pachinko market. Sales of our pachinko machines rose sharply,
as their superior game features and use of well-known char-
acters proved popular. As a result, our market share rose to a
record 3.6%. In pachislot, our core business, we managed to
raise our market share to 7.5%, thanks to new product develop-
ment. This included the launch of the first LCD-equipped
models in the industry.
In the amusement business, sales of amusement arcade
equipment declined in a still sluggish market. However,
sales of home video game software rose, thanks to several
hit titles.
The unique characteristics and manage-
ment strategies of the Sammy
group
Our strengths lie in:
R&D: More than 40% of our employees
are engaged in research and develop-
ment, a ratio expected to reach about
50% in the near future.
New product development: We have
an excellent track record in new product
development, under the concept of “New
Products Always from Sammy.” Sammy’s R&D organi-
zation is geared to come up with new gaming concepts
not seen in competitor products, and thus respond to the
needs of our fans.
Application technologies: By tapping the know-how cul-
tivated in our three principal business divisions, pachinko,
pachislot and amusement, Sammy optimizes the synergies
between them and promotes technology sharing in areas
related to new business development.
11
12
We are focusing on raising corporate value through time-
focused management. Our medium-term management plan
envisions consolidated sales of ¥125,000 million in the fiscal
year ending March 2003, an achievement that will establish
our presence as “The Entertainment Company.” In achieving
these goals, we will focus on building an organization which
assures the continued growth of the Sammy group as a whole.
We will be aggressive in seeking M&A opportunities, establish-
ing subsidiaries, and in partnering with other firms in
order to strengthen existing businesses and quickly commer-
cialize new business opportunities.
The strategies of each of our business divisions are as follows:
Pachislot
Multi-brand strategy: In July 2000, we converted Barcrest
Co., Ltd., a pachislot machine manufacturer, into a wholly-
owned subsidiary and changed its corporate name to RODEO
Co., Ltd. This will allow us to market two brands of pachislot
machines, Sammy and RODEO.
Launch new concept products ahead of the competition:
In this area, we plan to increase the number of development
teams. Simultaneously, we will develop models offering new
gaming concepts and entertainment elements, making our
pachislot machines even more fun.
Partnerships and joint ventures: In pachislot production,
we are partnering with Aristocrat Japan Co., Ltd.*, a subsid-
iary of Aristocrat Leisure Industries Pty Ltd, the world’s sec-
ond largest manufacturer of slot machines. We are also going
to build a joint venture marketing firm with Aristocrat Japan,
which will result in continued growth for both companies.
*Now called Aristocrat Technologies Co., Ltd.
Pachinko
Increase new model launches: We will bolster our R&D or-
ganization in order to increase launches of new models ap-
proved by the authorities.
Reinforce sales and marketing: We plan to build a national
network marketing pachislot and pachinko in order to raise
the proportion of direct sales and increase market share. Plans
call for raising our share (in unit terms) of the pachislot mar-
ket to 20% and of the pachinko market to 10% by the fiscal
year ended March 2003.
Increase production capacity: Construction of a new pro-
duction facility, with three times the production capacity of
our current factory, slated to come on stream in April 2001,
has commenced. The state-of-the-art factory will offer a
mass-production system, enhance production efficiency
and raise the recycled parts ratio. The combination of these
factors will cut total production costs. Strict quality control
standards have been introduced in preparation for obtain-
ing ISO9002 certification.
Amusement
Home video game software: Recently, we have gained the
subsidiaries Vaill CO., LTD. and Dimps CORP. These new com-
panies and existing subsidiaries have given us the infrastruc-
ture necessary for game development and for specializing in
specific fields of home video game software. We also market
popular foreign software. These initiatives are helping us
stand out from the competition.
Amusement arcade equipment: Here we will continue to
focus on medal games for children and large medal games
12

13
Hajime Satomi
President & CEO
machines. In marketing, we will concentrate on the shopping
center channel. We are also going global in amusement ar-
cade equipment, stepping up sales in Europe and Southeast
Asia. In the U.S. market we are expanding sales of prize games
featuring popular characters.
Strategy for new businesses
To realize further expansion in the entertainment field, we
plan to enter three new businesses: images, music and
game content. We have already diversified into the 3D
image systems and music content businesses. During the
fiscal year ending March 2001, we will commence the de-
velopment and provision of “middleware” for use in com-
puter graphics production. Another new move will be the
transmission of game content to Internet-enabled mobile
phones. We expect these new and next-generation busi-
ness lines to quickly turn profitable, given their synergy
with our existing businesses.
Environmentally friendly management
As a manufacturing company, Sammy is committed to de-
veloping environmentally friendly production and market-
ing systems. We feel that devising a recycling system is
particularly important, since amusement machines have
very short lives. Consequently, we are developing efficient
production systems based on interchangeable parts, as part
of our initiative to promote recycling. Environmental pro-
tection will continue to be an important consideration in
our management decisions.
Message to shareholders
The primary goal of management is to raise corporate
value in order to maximize shareholder value. We have also
implemented several initiatives to assure that we continue
to grow rapidly as “The Entertainment Company.” We have
strengthened the powers of the board of directors and in-
troduced a system of executive officers in order to speed
up decision-making and strengthen the system of moni-
toring business operations. We went public on December
16, 1999, registering our shares on the JASDAQ Stock Mar-
ket. As a public company, we shall strive to share profit with
our shareholders, while at the same time making every ef-
fort possible to contribute to society at large. We will also
strengthen investor relations by assuring enhanced disclo-
sure in line with operational principles that are fair, free
and global.
I look forward to your cooperation as we forge ahead.
June 2000
13
14
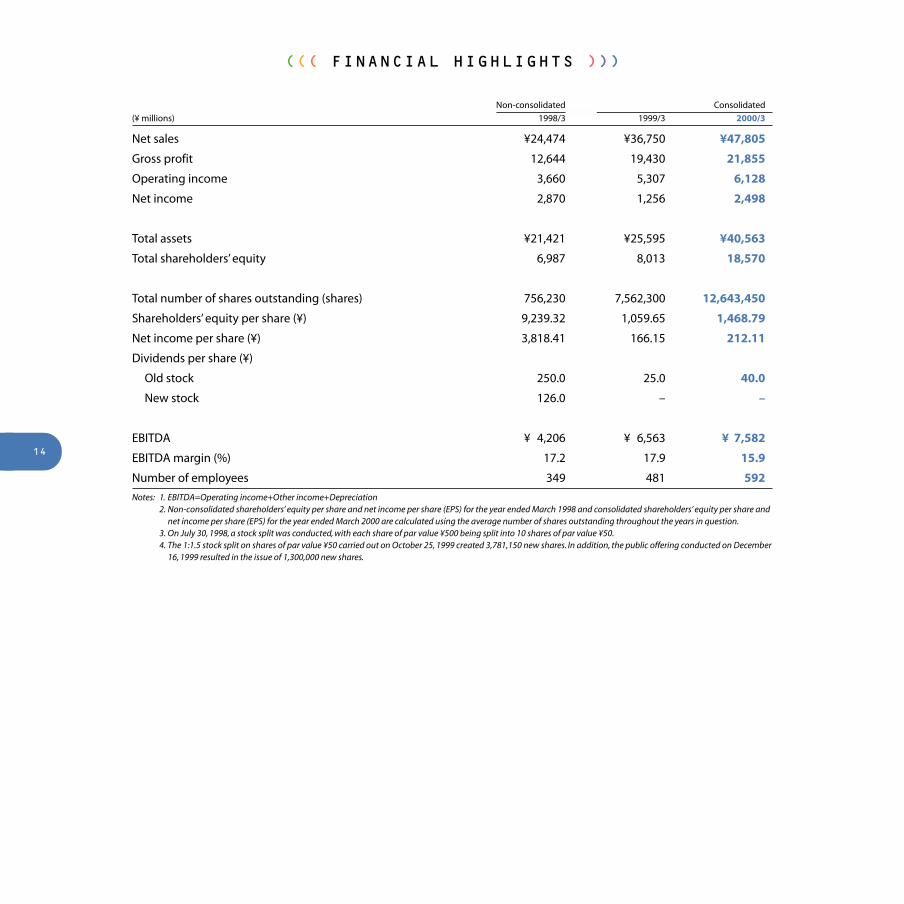
((( FINANCIAL HIGHLIGHTS )))
Non-consolidated Consolidated
(¥ millions) 1998/3 1999/3 2000/3
Net sales ¥24,474 ¥36,750 ¥47,805
Gross profit 12,644 19,430 21,855
Operating income 3,660 5,307 6,128
Net income 2,870 1,256 2,498
Total assets ¥21,421 ¥25,595 ¥40,563
Total shareholders’ equity 6,987 8,013 18,570
Total number of shares outstanding (shares) 756,230 7,562,300 12,643,450
Shareholders’ equity per share (¥) 9,239.32 1,059.65 1,468.79
Net income per share (¥) 3,818.41 166.15 212.11
Dividends per share (¥)
Old stock 250.0 25.0 40.0
New stock 126.0 – –
EBITDA ¥ 4,206 ¥ 6,563 ¥ 7,582
EBITDA margin (%) 17.2 17.9 15.9
Number of employees 349 481 592
Notes: 1. EBITDA=Operating income+Other income+Depreciation2. Non-consolidated shareholders’ equity per share and net income per share (EPS) for the year ended March 1998 and consolidated shareholders’ equity per share and
net income per share (EPS) for the year ended March 2000 are calculated using the average number of shares outstanding throughout the years in question.3. On July 30, 1998, a stock split was conducted, with each share of par value ¥500 being split into 10 shares of par value ¥50.4. The 1:1.5 stock split on shares of par value ¥50 carried out on October 25, 1999 created 3,781,150 new shares. In addition, the public offering conducted on December
16, 1999 resulted in the issue of 1,300,000 new shares.
14
15
Operating Environment
In the fiscal year ended March 2000, despite weak personal
consumption, the Japanese economy put the worst behind
it and headed toward a gradual recovery, thanks to the
government’s economic pump priming measures and re-
form of the nation’s financial system. However, the economy
did fall short of entering a phase of autonomous recovery
underpinned by private sector demand.
Despite the severe economic environment, the last fiscal
term proved to be the year when the pachinko industry
started to reap the full benefits of the deregulatory mea-
sures introduced at the beginning of 1999. Pachinko par-
lors increased installations of pachinko machines designed
for their game aspect, markedly pushing up shipments. At
the same time, the pachislot industry enjoyed its second
favorable year in a row, led by the introduction of pachislot
machines that offered more game features. In the amuse-
ment sector, the sticker vending machine boom faded, and
while music and dance simulation game machines were
big hits the sector continued to be sluggish. In the home
video game software market, the performance of most
products was lackluster, and hits were limited to the latest
episodes of a few popular series. However, the release of
“PlayStation 2” by Sony Computer Entertainment Inc. and
the announcement of a next-generation platform by
Nintendo Co., Ltd. has brightened the outlook for the
amusement sector.
((( MANAGEMENT DISCUSSION AND ANALYSIS )))
Consolidated sales
Consolidated sales in the fiscal year ended March 2000 in-
creased by 30.1% to ¥47,805 million. Although sales in the
pachislot business fell by 16.0% to ¥23,010 million, sales in
the pachinko business were up 556.2% to ¥19,227 million.
Thus total Pachislot & Pachinko business sales rose 39.2%
from the previous fiscal year to ¥42,237 million. Sales in the
amusement arcade equipment business declined 29.9% to
¥3,223 million reflecting a sluggish business environment.
Sales in the home video game software business, an area in
which business expansion was based around subsidiary Spike
Co., Ltd., rose 23.2% to ¥1,981 million. Amusement arcade
operation accounted for most of the revenue in the “Others”
segment, in which sales were up 73.3% to ¥364 million.
Cost of sales
Cost of sales increased by 49.8% to ¥25,950 million, push-
ing up the cost of sales ratio by 7.2% to 54.3%. Sharply higher
sales of pachinko machines, which have a higher cost of sales
ratio than pachislot machines, was the primary factor in
driving up the cost of sales ratio.
Selling, general and administrative expenses
Selling, general and administrative expenses rose by 11.4%
from the previous fiscal year to ¥15,727 million. However, the
selling, general and administrative expenses to net sales
ratio dropped 5.5% to 32.9% due to the large rise in the latter.

16
Consolidated net income
Consolidated net income increased by 98.8% to ¥2,498 mil-
lion. The company issued 1.3 million new shares for the pub-
lic offering in December 1999, which took net income per
share to ¥212.11.
Financial Position
Total assets as of March 31, 2000 were ¥40,563 million, an in-
crease of 58.5% as compared with the end of the previous
fiscal year. Cash and cash equivalents increased by ¥5,315 mil-
lion, due in part to the capital increase achieved in the
December 1999 public offering. Trade receivables—Notes and
Accounts—increased by ¥7,731 million reflecting a series of
hit models of pachinko and pachislot machines introduced
around the end of the fiscal year. Thus total current assets
rose by 70.2% to ¥31,528 million. Fixed assets increased by
42.0% to ¥4,464 million as we acquired land for the construc-
tion of a new factory. Investments and other assets increased
16.4% to ¥4,571 million. The increase is due mainly to account-
ing for ¥807 million in deferred tax assets following the in-
troduction of the deferred tax accounting method.
Liabilities rose by 24.9% from the previous fiscal year to
¥21,924 million. The primary contributory factors were
a ¥2,359 million increase in Trade Payables—Notes and
Accounts—reflecting increased procurement to cope with
rising sales. Interest-bearing debt declined by 19.7% from
the previous fiscal year to ¥5,438 million. Shareholders’
equity at the end of the fiscal year was ¥18,570 million,
131.7% more than the previous year. The chief factor in this
rise was an issue of shares at market price.
Cash flows
Although part of net income before income taxes was offset
by expenditures for acquisition of fixed assets, cash and cash
equivalents on a consolidated basis totaled ¥9,142 million at
the end of term, 138.9% more than the year before. This was
due to the recording of income before income taxes and
minority interests to the sum of ¥5,925 million.
Sources and uses of cash in the consolidated fiscal year
under review are as follows.
• Cash flow from operating activities
Cash flow from operating activities decreased by 55.0% to
¥2,533 million. The principal sources of cash from operating
activities were ¥1,040 million in depreciation, a ¥1,134 mil-
lion decline in inventory, and a ¥2,093 million increase in
accounts payable, in addition to ¥5,925 million in income
before income taxes and minority interests.
• Cash flow from investment activities
Cash used in investment activities rose by 0.1% to ¥2,927
million. This included ¥2,288 million for the purchase of land
for a new factory and ¥272 million resulting from increased
investments.

17
• Cash flow from financing activities
Net cash provided by financing activities totaled ¥5,765 mil-
lion, compared to net cash used in financing activities of ¥761
million in the previous year. The principal sources and uses of
cash included ¥7,371 million proceeds from new stock issue,
a ¥863 million decrease in short-term loans and a ¥493 mil-
lion decline in long-term debt.
Capital expenditures
Capital expenditures in the fiscal year under review totaled
¥2,198 million mainly for the purchase of land for the new
factory. We expect capital expenditures during the year end-
ing March 2001 to come to approximately ¥5,000 million. This
figure will be accounted for largely by the construction and
equipping of this factory.
The Y2K Issue
Management addressed the Y2K problem as a major man-
agement issue for the group as a whole and took appropri-
ate measures to assure that all our systems were Y2K compli-
ant. As a result, the transition to 2000 was smooth and glitch-
free. We shall continue to view crisis control as a major man-
agement issue and continue to actively address any poten-
tial problems.

18
Thousands ofMillions of yen U.S. dollars (Note 1)
ASSETS 2000 1999 2000
Current assets:
Cash and cash equivalents . . . . . . . . . . . . . . . . . . . . . . . . . . . . . . . . . . . . . . . . . . . . . . . . . ¥ 9,142 ¥ 3,827 $ 86,245
Time deposits . . . . . . . . . . . . . . . . . . . . . . . . . . . . . . . . . . . . . . . . . . . . . . . . . . . . . . . . . . . . . . 201 238 1,896
Marketable securities (Note 8) . . . . . . . . . . . . . . . . . . . . . . . . . . . . . . . . . . . . . . . . . . . . . . 26 41 245
Trade receivables:
Notes . . . . . . . . . . . . . . . . . . . . . . . . . . . . . . . . . . . . . . . . . . . . . . . . . . . . . . . . . . . . . . . . . . . 7,284 1,405 68,717
Accounts . . . . . . . . . . . . . . . . . . . . . . . . . . . . . . . . . . . . . . . . . . . . . . . . . . . . . . . . . . . . . . . . 6,559 4,707 61,877
Allowance for doubtful accounts . . . . . . . . . . . . . . . . . . . . . . . . . . . . . . . . . . . . . . . . . (282) (115) (2,660)
Inventories (Note 3) . . . . . . . . . . . . . . . . . . . . . . . . . . . . . . . . . . . . . . . . . . . . . . . . . . . . . . . . 6,040 7,193 56,981
Deferred income taxes — current (Note 7) . . . . . . . . . . . . . . . . . . . . . . . . . . . . . . . . . . 514 29 4,849
Other current assets . . . . . . . . . . . . . . . . . . . . . . . . . . . . . . . . . . . . . . . . . . . . . . . . . . . . . . . 2,044 1,200 19,284
Total current assets . . . . . . . . . . . . . . . . . . . . . . . . . . . . . . . . . . . . . . . . . . . . . . . . . . . . 31,528 18,525 297,434
Property and equipment (Note 4):
Land . . . . . . . . . . . . . . . . . . . . . . . . . . . . . . . . . . . . . . . . . . . . . . . . . . . . . . . . . . . . . . . . . . . . . . . 2,459 783 23,198
Buildings . . . . . . . . . . . . . . . . . . . . . . . . . . . . . . . . . . . . . . . . . . . . . . . . . . . . . . . . . . . . . . . . . . 1,389 1,322 13,104
Machinery and equipment . . . . . . . . . . . . . . . . . . . . . . . . . . . . . . . . . . . . . . . . . . . . . . . . . 375 360 3,538
Rental equipment for amusement arcades . . . . . . . . . . . . . . . . . . . . . . . . . . . . . . . . . 801 1,074 7,556
Others . . . . . . . . . . . . . . . . . . . . . . . . . . . . . . . . . . . . . . . . . . . . . . . . . . . . . . . . . . . . . . . . . . . . . 2,113 1,938 19,934
7,137 5,477 67,330
Accumulated depreciation . . . . . . . . . . . . . . . . . . . . . . . . . . . . . . . . . . . . . . . . . . . . . . . . . (2,673) (2,334) (25,217)
4,464 3,143 42,113
Investments and other assets:
Investment securities (Note 8) . . . . . . . . . . . . . . . . . . . . . . . . . . . . . . . . . . . . . . . . . . . . . . 330 290 3,113
Other investments . . . . . . . . . . . . . . . . . . . . . . . . . . . . . . . . . . . . . . . . . . . . . . . . . . . . . . . . . 1,433 1,185 13,519
Software . . . . . . . . . . . . . . . . . . . . . . . . . . . . . . . . . . . . . . . . . . . . . . . . . . . . . . . . . . . . . . . . . . . 706 730 6,661
Lease deposits . . . . . . . . . . . . . . . . . . . . . . . . . . . . . . . . . . . . . . . . . . . . . . . . . . . . . . . . . . . . . 1,113 992 10,500
Deferred income taxes — non-current (Note 7) . . . . . . . . . . . . . . . . . . . . . . . . . . . . . 807 — 7,613
Others . . . . . . . . . . . . . . . . . . . . . . . . . . . . . . . . . . . . . . . . . . . . . . . . . . . . . . . . . . . . . . . . . . . . . 242 895 2,283
Allowance for doubtful accounts . . . . . . . . . . . . . . . . . . . . . . . . . . . . . . . . . . . . . . . . . . . (60) (165) (566)
4,571 3,927 43,123
¥40,563 ¥25,595 $382,670
See accompanying notes.
((( CONSOLIDATED BALANCE SHEETS )))SAMMY CORPORATION and its subsidiaries
March 31, 2000 and 1999

19
Thousands ofMillions of yen U.S. dollars (Note 1)
LIABILITIES AND SHAREHOLDERS’ EQUITY 2000 1999 2000
Current liabilities:
Short-term bank loans (Note 4) . . . . . . . . . . . . . . . . . . . . . . . . . . . . . . . . . . . . . . . . . . . . . ¥ 5,438 ¥ 6,481 $ 51,302
Trade payables:
Notes . . . . . . . . . . . . . . . . . . . . . . . . . . . . . . . . . . . . . . . . . . . . . . . . . . . . . . . . . . . . . . . . . . . . 5,773 2,575 54,462
Accounts . . . . . . . . . . . . . . . . . . . . . . . . . . . . . . . . . . . . . . . . . . . . . . . . . . . . . . . . . . . . . . . . 2,259 3,098 21,311
Others . . . . . . . . . . . . . . . . . . . . . . . . . . . . . . . . . . . . . . . . . . . . . . . . . . . . . . . . . . . . . . . . . . . 2,608 1,497 24,604
Income taxes payable (Note 7) . . . . . . . . . . . . . . . . . . . . . . . . . . . . . . . . . . . . . . . . . . . . . 3,279 980 30,934
Accrued expenses . . . . . . . . . . . . . . . . . . . . . . . . . . . . . . . . . . . . . . . . . . . . . . . . . . . . . . . . . . 411 367 3,877
Accrued employees’ bonuses . . . . . . . . . . . . . . . . . . . . . . . . . . . . . . . . . . . . . . . . . . . . . . . 416 274 3,925
Other current liabilities . . . . . . . . . . . . . . . . . . . . . . . . . . . . . . . . . . . . . . . . . . . . . . . . . . . . . 117 356 1,104
Total current liabilities . . . . . . . . . . . . . . . . . . . . . . . . . . . . . . . . . . . . . . . . . . . . . . . . ¥20,301 ¥15,628 $191,519
Long-term debt . . . . . . . . . . . . . . . . . . . . . . . . . . . . . . . . . . . . . . . . . . . . . . . . . . . . . . . . . . . . . . — 288 —
Retirement benefits . . . . . . . . . . . . . . . . . . . . . . . . . . . . . . . . . . . . . . . . . . . . . . . . . . . . . . . . . . 565 491 5,330
Deferred income taxes — non-current (Note 7) . . . . . . . . . . . . . . . . . . . . . . . . . . . . . . . — 8 —
Other non-current liabilities . . . . . . . . . . . . . . . . . . . . . . . . . . . . . . . . . . . . . . . . . . . . . . . . . . 1,058 1,104 9,981
Translation adjustment . . . . . . . . . . . . . . . . . . . . . . . . . . . . . . . . . . . . . . . . . . . . . . . . . . . . . . . — 39 —
Minority interests in consolidated subsidiaries . . . . . . . . . . . . . . . . . . . . . . . . . . . . . . . . 69 24 651
Commitments and contingent liabilities (Notes 5 and 9)
Shareholders’ equity (Note 6):
Common stock, par value ¥50;
Authorized — 30,000,000 shares
Issued — 12,643,450 shares in 2000
and 7,562,300 shares in 1999 . . . . . . . . . . . . . . . . . . . . . . . . . . . . . . . . . . . . . . 4,842 2,079 45,679
Additional paid-in capital . . . . . . . . . . . . . . . . . . . . . . . . . . . . . . . . . . . . . . . . . . . . . . . . . . 5,837 1,229 55,066
Retained earnings . . . . . . . . . . . . . . . . . . . . . . . . . . . . . . . . . . . . . . . . . . . . . . . . . . . . . . . . . . 7,892 4,705 74,453
18,571 8,013 175,198
Treasury stock, at cost . . . . . . . . . . . . . . . . . . . . . . . . . . . . . . . . . . . . . . . . . . . . . . . . . . . . . . (1) — (9)
Total shareholders’ equity . . . . . . . . . . . . . . . . . . . . . . . . . . . . . . . . . . . . . . . . . . . . . 18,570 8,013 175,189
¥40,563 ¥25,595 $382,670
20
Thousands ofMillions of yen U.S. dollars (Note 1)
2000 1999 2000
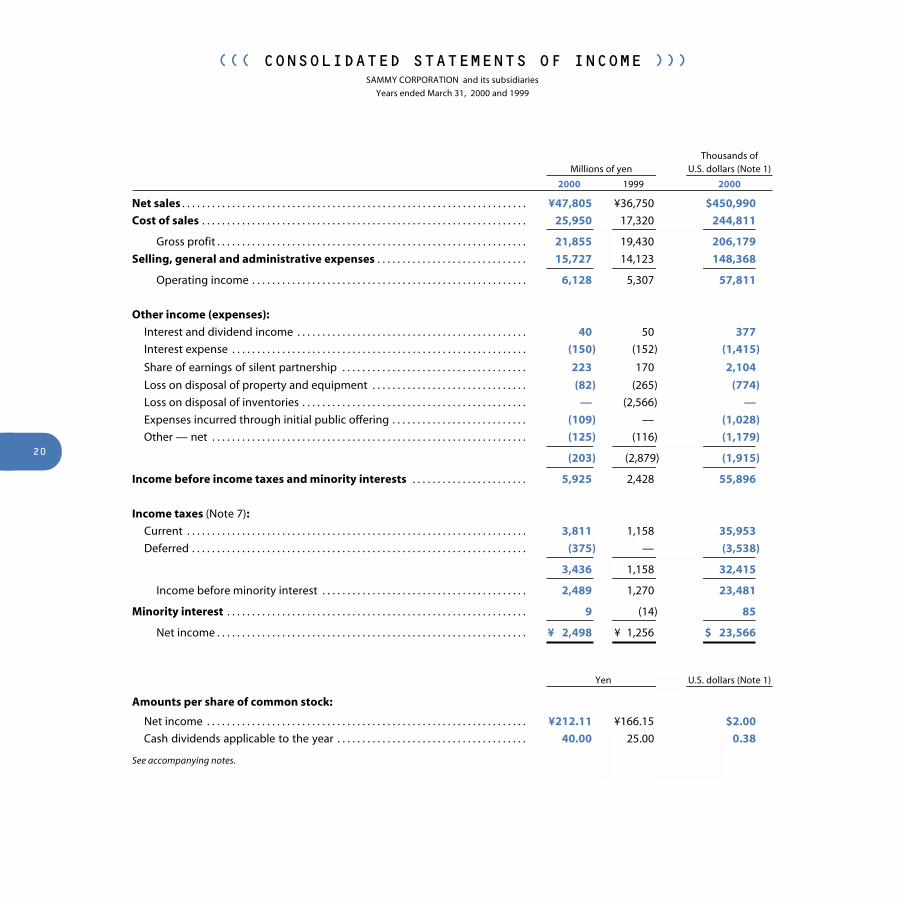
Net sales . . . . . . . . . . . . . . . . . . . . . . . . . . . . . . . . . . . . . . . . . . . . . . . . . . . . . . . . . . . . . . . . . . . . . ¥47,805 ¥36,750 $450,990
Cost of sales . . . . . . . . . . . . . . . . . . . . . . . . . . . . . . . . . . . . . . . . . . . . . . . . . . . . . . . . . . . . . . . . . 25,950 17,320 244,811
Gross profit . . . . . . . . . . . . . . . . . . . . . . . . . . . . . . . . . . . . . . . . . . . . . . . . . . . . . . . . . . . . . . 21,855 19,430 206,179
Selling, general and administrative expenses . . . . . . . . . . . . . . . . . . . . . . . . . . . . . . 15,727 14,123 148,368
Operating income . . . . . . . . . . . . . . . . . . . . . . . . . . . . . . . . . . . . . . . . . . . . . . . . . . . . . . . 6,128 5,307 57,811
Other income (expenses):
Interest and dividend income . . . . . . . . . . . . . . . . . . . . . . . . . . . . . . . . . . . . . . . . . . . . . . 40 50 377
Interest expense . . . . . . . . . . . . . . . . . . . . . . . . . . . . . . . . . . . . . . . . . . . . . . . . . . . . . . . . . . . (150) (152) (1,415)
Share of earnings of silent partnership . . . . . . . . . . . . . . . . . . . . . . . . . . . . . . . . . . . . . 223 170 2,104
Loss on disposal of property and equipment . . . . . . . . . . . . . . . . . . . . . . . . . . . . . . . (82) (265) (774)
Loss on disposal of inventories . . . . . . . . . . . . . . . . . . . . . . . . . . . . . . . . . . . . . . . . . . . . . — (2,566) —
Expenses incurred through initial public offering . . . . . . . . . . . . . . . . . . . . . . . . . . . (109) — (1,028)
Other — net . . . . . . . . . . . . . . . . . . . . . . . . . . . . . . . . . . . . . . . . . . . . . . . . . . . . . . . . . . . . . . . (125) (116) (1,179)
(203) (2,879) (1,915)
Income before income taxes and minority interests . . . . . . . . . . . . . . . . . . . . . . . 5,925 2,428 55,896
Income taxes (Note 7):
Current . . . . . . . . . . . . . . . . . . . . . . . . . . . . . . . . . . . . . . . . . . . . . . . . . . . . . . . . . . . . . . . . . . . . 3,811 1,158 35,953
Deferred . . . . . . . . . . . . . . . . . . . . . . . . . . . . . . . . . . . . . . . . . . . . . . . . . . . . . . . . . . . . . . . . . . . (375) — (3,538)
3,436 1,158 32,415
Income before minority interest . . . . . . . . . . . . . . . . . . . . . . . . . . . . . . . . . . . . . . . . . 2,489 1,270 23,481
Minority interest . . . . . . . . . . . . . . . . . . . . . . . . . . . . . . . . . . . . . . . . . . . . . . . . . . . . . . . . . . . . 9 (14) 85
Net income . . . . . . . . . . . . . . . . . . . . . . . . . . . . . . . . . . . . . . . . . . . . . . . . . . . . . . . . . . . . . . ¥ 2,498 ¥ 1,256 $ 23,566
Yen U.S. dollars (Note 1)
Amounts per share of common stock:
Net income . . . . . . . . . . . . . . . . . . . . . . . . . . . . . . . . . . . . . . . . . . . . . . . . . . . . . . . . . . . . . . . . ¥212.11 ¥166.15 $2.00
Cash dividends applicable to the year . . . . . . . . . . . . . . . . . . . . . . . . . . . . . . . . . . . . . . 40.00 25.00 0.38
See accompanying notes.
((( CONSOLIDATED STATEMENTS OF INCOME )))SAMMY CORPORATION and its subsidiaries
Years ended March 31, 2000 and 1999

21
Millions of yen
Number Additional of shares Common paid-in Retained
issued stock capital earnings
Balance at April 1, 1998 . . . . . . . . . . . . . . . . . . . . . . . . . . . . . . . . . . . . . . . . . . . . . . . . . . . . 756,230 ¥ 2,079 ¥ 1,229 ¥ 3,692
Net income . . . . . . . . . . . . . . . . . . . . . . . . . . . . . . . . . . . . . . . . . . . . . . . . . . . . . . . . . . . . . . . — — — 1,256
Cash dividends paid . . . . . . . . . . . . . . . . . . . . . . . . . . . . . . . . . . . . . . . . . . . . . . . . . . . . . . — — — (188)
Bonuses to directors and corporate auditors . . . . . . . . . . . . . . . . . . . . . . . . . . . . . . . — — — (55)
10 for 1 stock split, July 30, 1998 . . . . . . . . . . . . . . . . . . . . . . . . . . . . . . . . . . . . . . . . . . . 6,806,070 — — —
Balance at March 31, 1999 . . . . . . . . . . . . . . . . . . . . . . . . . . . . . . . . . . . . . . . . . . . . . . . . . 7,562,300 2,079 1,229 4,705
Cumulative effect of adopting deferred income tax accounting . . . . . . . . . . . . — — — 928
Net income . . . . . . . . . . . . . . . . . . . . . . . . . . . . . . . . . . . . . . . . . . . . . . . . . . . . . . . . . . . . . . . — — — 2,498
Cash dividends paid . . . . . . . . . . . . . . . . . . . . . . . . . . . . . . . . . . . . . . . . . . . . . . . . . . . . . . — — — (189)
Bonuses to directors and corporate auditors . . . . . . . . . . . . . . . . . . . . . . . . . . . . . . . — — — (50)
1.5 for 1 stock split, October 25, 1999 . . . . . . . . . . . . . . . . . . . . . . . . . . . . . . . . . . . . . . 3,781,150 — — —
New shares issued in an initial public offering on December 16, 1999 . . . . . . 1,300,000 2,763 4,608 —
Balance at March 31, 2000 . . . . . . . . . . . . . . . . . . . . . . . . . . . . . . . . . . . . . . . . . . . . . . . . . 12,643,450 ¥4,842 ¥5,837 ¥7,892
Thousands of U.S. dollars (Note 1)
AdditionalCommon paid-in Retained
stock capital earnings
Balance at March 31, 1999 . . . . . . . . . . . . . . . . . . . . . . . . . . . . . . . . . . . . . . . . . . . . . . . . . . . . . . . . . . . . . . $19,613 $11,594 $44,387
Cumulative effect of adopting deferred income tax accounting . . . . . . . . . . . . . . . . . . . . . . . . . — — 8,755
Net income . . . . . . . . . . . . . . . . . . . . . . . . . . . . . . . . . . . . . . . . . . . . . . . . . . . . . . . . . . . . . . . . . . . . . . . . . . . . — — 23,566
Cash dividends paid . . . . . . . . . . . . . . . . . . . . . . . . . . . . . . . . . . . . . . . . . . . . . . . . . . . . . . . . . . . . . . . . . . . — — (1,783)
Bonuses to directors and corporate auditors . . . . . . . . . . . . . . . . . . . . . . . . . . . . . . . . . . . . . . . . . . . . — — (472)
New shares issued in an initial public offering on December 16, 1999 . . . . . . . . . . . . . . . . . . . 26,066 43,472 —
Balance at March 31, 2000 . . . . . . . . . . . . . . . . . . . . . . . . . . . . . . . . . . . . . . . . . . . . . . . . . . . . . . . . . . . . . . $45,679 $55,066 $74,453
See accompanying notes.
((( CONSOLIDATED STATEMENTS OF SHAREHOLDERS’ EQUITY )))SAMMY CORPORATION and its subsidiaries
Years ended March 31, 2000 and 1999

22
Thousands ofMillions of yen U.S. dollars (Note 1)
2000 1999 2000
Cash flows from operating activities:Income before income taxes and minority interests . . . . . . . . . . . . . . . . . . . . . . . . . . . . . . . . . . . . ¥5,925 ¥2,428 $55,896Adjustments to reconcile income before income taxes and minority
interests to net cash provided by operating activities:Depreciation and amortization . . . . . . . . . . . . . . . . . . . . . . . . . . . . . . . . . . . . . . . . . . . . . . . . . . . . 1,040 990 9,811Loss on write-off of goodwill . . . . . . . . . . . . . . . . . . . . . . . . . . . . . . . . . . . . . . . . . . . . . . . . . . . . . . . 568 — 5,358Loss on disposal of property plant and equipment etc. . . . . . . . . . . . . . . . . . . . . . . . . . . . . . 101 265 953Devaluation of marketable and investment securities . . . . . . . . . . . . . . . . . . . . . . . . . . . . . . — 39 —Loss on disposal of inventories . . . . . . . . . . . . . . . . . . . . . . . . . . . . . . . . . . . . . . . . . . . . . . . . . . . . . — 2,566 —Share of earnings of silent partnership . . . . . . . . . . . . . . . . . . . . . . . . . . . . . . . . . . . . . . . . . . . . . (223) (170) (2,104)Others . . . . . . . . . . . . . . . . . . . . . . . . . . . . . . . . . . . . . . . . . . . . . . . . . . . . . . . . . . . . . . . . . . . . . . . . . . . . . 318 571 3,000
Net changes in assets and liabilities:Decrease (Increase) in notes and accounts receivable . . . . . . . . . . . . . . . . . . . . . . . . . . . . . . (7,891) 165 (74,443)Decrease (Increase) in inventories . . . . . . . . . . . . . . . . . . . . . . . . . . . . . . . . . . . . . . . . . . . . . . . . . 1,134 (331) 10,698Increase (Decrease) in notes and accounts payable . . . . . . . . . . . . . . . . . . . . . . . . . . . . . . . . 2,093 (396) 19,745Increase in other assets . . . . . . . . . . . . . . . . . . . . . . . . . . . . . . . . . . . . . . . . . . . . . . . . . . . . . . . . . . . . (257) (90) (2,424)Increase in other liabilities . . . . . . . . . . . . . . . . . . . . . . . . . . . . . . . . . . . . . . . . . . . . . . . . . . . . . . . . . 1,336 420 12,604
Sub-total . . . . . . . . . . . . . . . . . . . . . . . . . . . . . . . . . . . . . . . . . . . . . . . . . . . . . . . . . . . . . . . . . . . . . . . . 4,144 6,457 39,094Interest and dividends received . . . . . . . . . . . . . . . . . . . . . . . . . . . . . . . . . . . . . . . . . . . . . . . . . . . . . 39 54 368Payment of interest . . . . . . . . . . . . . . . . . . . . . . . . . . . . . . . . . . . . . . . . . . . . . . . . . . . . . . . . . . . . . . . . . . (141) (150) (1,330)Payment of income taxes . . . . . . . . . . . . . . . . . . . . . . . . . . . . . . . . . . . . . . . . . . . . . . . . . . . . . . . . . . . . (1,509) (730) (14,236)
Net cash provided by operating activities . . . . . . . . . . . . . . . . . . . . . . . . . . . . . . . . . . . . . . . . 2,533 5,631 23,896
Cash flows from investing activities:Payment for purchase of property, plant and equipment . . . . . . . . . . . . . . . . . . . . . . . . . . . (2,288) (2,025) (21,585)Proceeds from sales of property, plant and equipment . . . . . . . . . . . . . . . . . . . . . . . . . . . . . 12 43 113Payment for purchase of intangible assets . . . . . . . . . . . . . . . . . . . . . . . . . . . . . . . . . . . . . . . . . (204) (673) (1,924)Proceeds from sales of marketable securities . . . . . . . . . . . . . . . . . . . . . . . . . . . . . . . . . . . . . . . 14 — 132Payment for purchase of investment securities — net . . . . . . . . . . . . . . . . . . . . . . . . . . . . . . (32) (68) (302)Increase (Decrease) in cash and cash equivalents due to acquisition of
consolidated subsidiaries . . . . . . . . . . . . . . . . . . . . . . . . . . . . . . . . . . . . . . . . . . . . . . . . . . . . . . . . (2) 67 (19)Decrease (Increase) in loans receivable — net . . . . . . . . . . . . . . . . . . . . . . . . . . . . . . . . . . . . . . (192) 25 (1,811)Decrease in time deposit — net . . . . . . . . . . . . . . . . . . . . . . . . . . . . . . . . . . . . . . . . . . . . . . . . . . . 37 54 349Increase in other investments — net . . . . . . . . . . . . . . . . . . . . . . . . . . . . . . . . . . . . . . . . . . . . . . . (272) (348) (2,566)
Net cash used in investing activities . . . . . . . . . . . . . . . . . . . . . . . . . . . . . . . . . . . . . . . . . . . . . . (2,927) (2,925) (27,613)
Cash flows from financing activities:Proceeds from issuance of long-term debt . . . . . . . . . . . . . . . . . . . . . . . . . . . . . . . . . . . . . . . . . — 450 —Payment of long-term debt . . . . . . . . . . . . . . . . . . . . . . . . . . . . . . . . . . . . . . . . . . . . . . . . . . . . . . . . (493) (187) (4,651)Decrease in short-term bank loans . . . . . . . . . . . . . . . . . . . . . . . . . . . . . . . . . . . . . . . . . . . . . . . . . (863) (768) (8,142)Proceeds from sale of common stock . . . . . . . . . . . . . . . . . . . . . . . . . . . . . . . . . . . . . . . . . . . . . . 7,371 — 69,538Cash dividends paid . . . . . . . . . . . . . . . . . . . . . . . . . . . . . . . . . . . . . . . . . . . . . . . . . . . . . . . . . . . . . . . (189) (188) (1,783)Other . . . . . . . . . . . . . . . . . . . . . . . . . . . . . . . . . . . . . . . . . . . . . . . . . . . . . . . . . . . . . . . . . . . . . . . . . . . . . . (61) (68) (575)
Net cash provided by (used in) financing activities . . . . . . . . . . . . . . . . . . . . . . . . . . . . . . . 5,765 (761) 54,387Effect of exchange rate changes on cash and cash equivalents . . . . . . . . . . . . . . . . . . . . . . . . (56) (66) (529)
Net increase in cash and cash equivalents . . . . . . . . . . . . . . . . . . . . . . . . . . . . . . . . . . . . . . . . . . . . . . 5,315 1,879 50,141Cash and cash equivalents at beginning of year . . . . . . . . . . . . . . . . . . . . . . . . . . . . . . . . . . . . . . . 3,827 1,948 36,104
Cash and cash equivalents at end of year . . . . . . . . . . . . . . . . . . . . . . . . . . . . . . . . . . . . . . . . . . . . . . ¥9,142 ¥3,827 $86,245
See accompanying notes.
((( CONSOLIDATED STATEMENTS OF CASH FLOWS )))SAMMY CORPORATION and its subsidiaries
Years ended March 31, 2000 and 1999
23
((( NOTES TO CONSOLIDATED FINANCIAL STATEMENTS )))SAMMY CORPORATION and its subsidiaries
March 31, 2000 and 1999
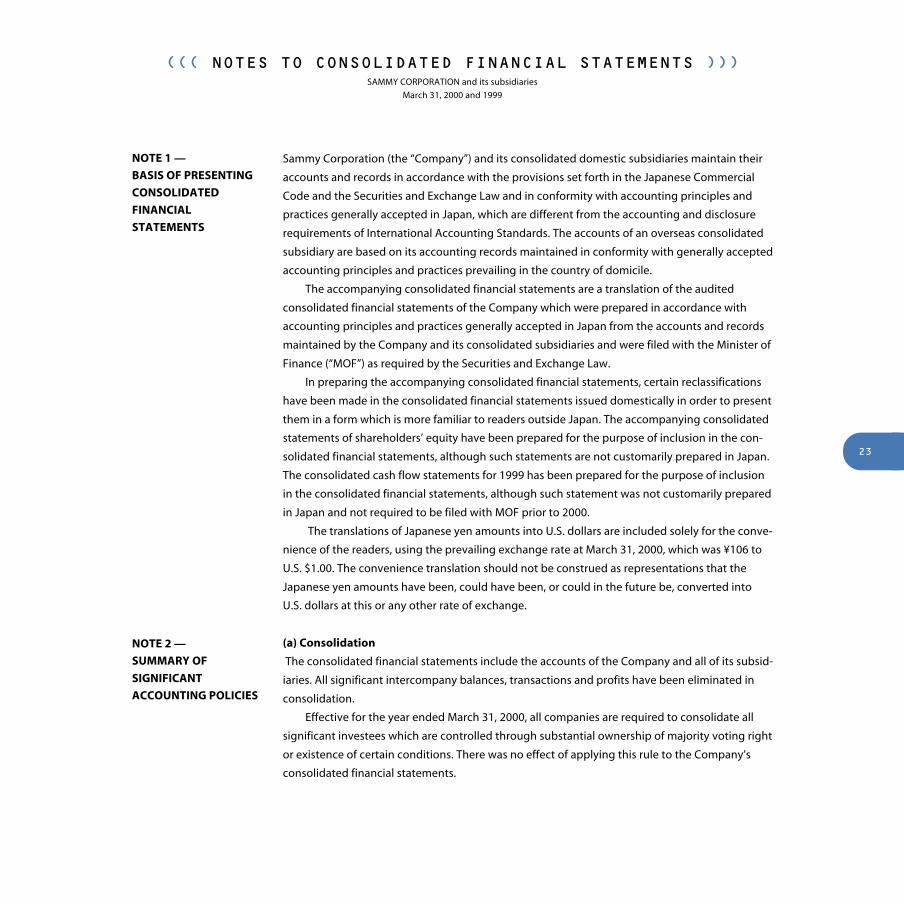
NOTE 1 —
BASIS OF PRESENTING
CONSOLIDATED
FINANCIAL
STATEMENTS
Sammy Corporation (the “Company”) and its consolidated domestic subsidiaries maintain their
accounts and records in accordance with the provisions set forth in the Japanese Commercial
Code and the Securities and Exchange Law and in conformity with accounting principles and
practices generally accepted in Japan, which are different from the accounting and disclosure
requirements of International Accounting Standards. The accounts of an overseas consolidated
subsidiary are based on its accounting records maintained in conformity with generally accepted
accounting principles and practices prevailing in the country of domicile.
The accompanying consolidated financial statements are a translation of the audited
consolidated financial statements of the Company which were prepared in accordance with
accounting principles and practices generally accepted in Japan from the accounts and records
maintained by the Company and its consolidated subsidiaries and were filed with the Minister of
Finance (“MOF”) as required by the Securities and Exchange Law.
In preparing the accompanying consolidated financial statements, certain reclassifications
have been made in the consolidated financial statements issued domestically in order to present
them in a form which is more familiar to readers outside Japan. The accompanying consolidated
statements of shareholders’ equity have been prepared for the purpose of inclusion in the con-
solidated financial statements, although such statements are not customarily prepared in Japan.
The consolidated cash flow statements for 1999 has been prepared for the purpose of inclusion
in the consolidated financial statements, although such statement was not customarily prepared
in Japan and not required to be filed with MOF prior to 2000.
The translations of Japanese yen amounts into U.S. dollars are included solely for the conve-
nience of the readers, using the prevailing exchange rate at March 31, 2000, which was ¥106 to
U.S. $1.00. The convenience translation should not be construed as representations that the
Japanese yen amounts have been, could have been, or could in the future be, converted into
U.S. dollars at this or any other rate of exchange.
(a) Consolidation
The consolidated financial statements include the accounts of the Company and all of its subsid-
iaries. All significant intercompany balances, transactions and profits have been eliminated in
consolidation.
Effective for the year ended March 31, 2000, all companies are required to consolidate all
significant investees which are controlled through substantial ownership of majority voting right
or existence of certain conditions. There was no effect of applying this rule to the Company’s
consolidated financial statements.
NOTE 2 —
SUMMARY OF
SIGNIFICANT
ACCOUNTING POLICIES
24
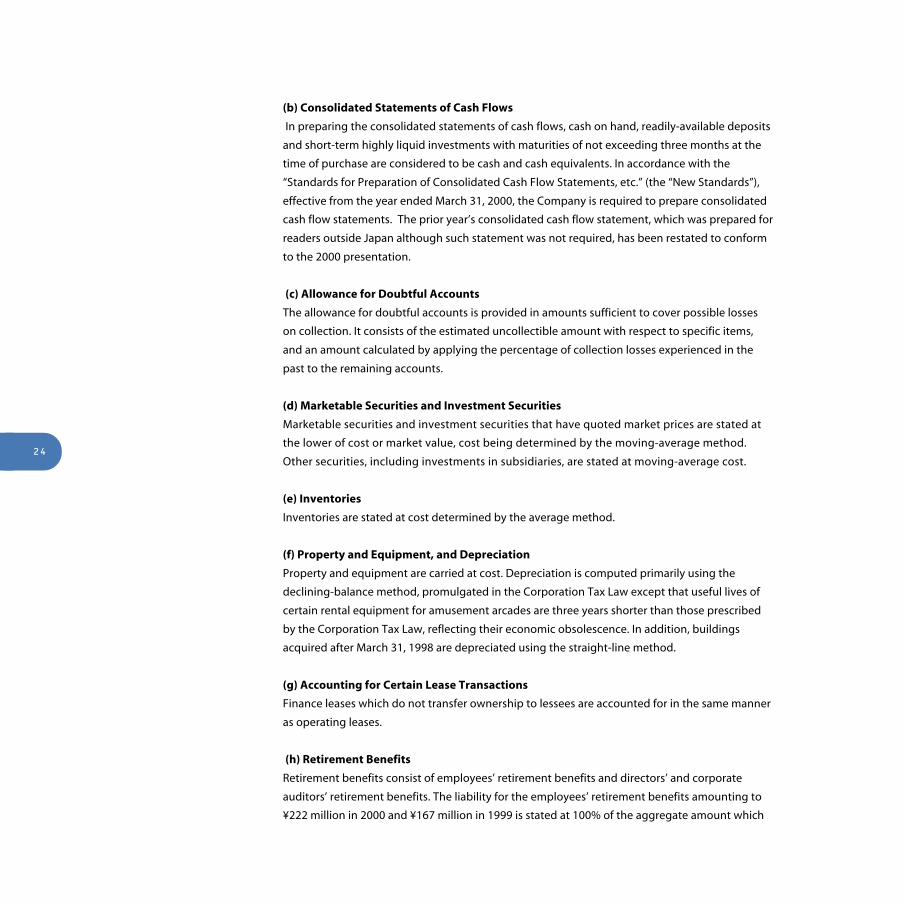
(b) Consolidated Statements of Cash Flows
In preparing the consolidated statements of cash flows, cash on hand, readily-available deposits
and short-term highly liquid investments with maturities of not exceeding three months at the
time of purchase are considered to be cash and cash equivalents. In accordance with the
“Standards for Preparation of Consolidated Cash Flow Statements, etc.” (the “New Standards”),
effective from the year ended March 31, 2000, the Company is required to prepare consolidated
cash flow statements. The prior year’s consolidated cash flow statement, which was prepared for
readers outside Japan although such statement was not required, has been restated to conform
to the 2000 presentation.
(c) Allowance for Doubtful Accounts
The allowance for doubtful accounts is provided in amounts sufficient to cover possible losses
on collection. It consists of the estimated uncollectible amount with respect to specific items,
and an amount calculated by applying the percentage of collection losses experienced in the
past to the remaining accounts.
(d) Marketable Securities and Investment Securities
Marketable securities and investment securities that have quoted market prices are stated at
the lower of cost or market value, cost being determined by the moving-average method.
Other securities, including investments in subsidiaries, are stated at moving-average cost.
(e) Inventories
Inventories are stated at cost determined by the average method.
(f) Property and Equipment, and Depreciation
Property and equipment are carried at cost. Depreciation is computed primarily using the
declining-balance method, promulgated in the Corporation Tax Law except that useful lives of
certain rental equipment for amusement arcades are three years shorter than those prescribed
by the Corporation Tax Law, reflecting their economic obsolescence. In addition, buildings
acquired after March 31, 1998 are depreciated using the straight-line method.
(g) Accounting for Certain Lease Transactions
Finance leases which do not transfer ownership to lessees are accounted for in the same manner
as operating leases.
(h) Retirement Benefits
Retirement benefits consist of employees’ retirement benefits and directors’ and corporate
auditors’ retirement benefits. The liability for the employees’ retirement benefits amounting to
¥222 million in 2000 and ¥167 million in 1999 is stated at 100% of the aggregate amount which

25
would be required in accordance with the Company’s regulation for employees’ retirement
benefit if the employees voluntarily severed their employment as of the balance sheet date.
The liability for the directors’ and corporate auditors’ retirement benefits amounting to ¥343
million in 2000 and ¥324 million in 1999 is provided based on an accrual basis in accordance
with the Company’s regulation. The liability for the directors’ and corporate auditors’ retirement
benefits is regarded as the reserve regulated by the Article 287-2 of the Commercial Code.
(i) Income Taxes
The Company provided income taxes at the amounts currently payable for the year ended March
31, 1999. Effective April 1, 1999, the Company adopted the new accounting standard, which
recognizes tax effects of temporary differences between the financial statement carrying amounts
and the tax basis of assets and liabilities. Under the new accounting standard, the provision for
income taxes is computed based on the pretax income included in the consolidated statement
of income. The asset and liability approach is used to recognize deferred tax assets and liabilities
for the expected future tax consequences of temporary differences.
The amount of deferred income taxes attributable to the net tax effects of the temporary
differences at April 1, 1999 is reflected as an adjustment of ¥928 million ($8,755 thousand) to the
retained earnings brought forward from the previous year. Prior years’ financial statements have
not been restated.
The effect for the year ended March 31, 2000 was to increase net income by ¥370 million
($3,491 thousand) and retained earnings by ¥928 million ($8,755 thousand).
The Company’s subsidiary in the USA has adopted tax effect accounting since its inception.
Deferred tax current asset and deferred tax non-current liability on the Company’s consolidated
balance sheets include those of the subsidiary amounting to ¥23 million and ¥6 million at March
31, 2000 and ¥29 million and ¥8 million at March 31, 1999, respectively.
(j) Software Development Costs
In accordance with the Implementation Guidelines on Accounting for Research and Development
and Software Development costs issued by JICPA on March 31, 1999, effective in the year ended
March 31, 2000, the Company charges to income as incurred its product development costs for
Pachislot, Pachinko, and home video game softwares. Prior to April 1,1999, such costs were capi-
talized as work in process and expensed as part of cost of sales.
The Company’s product development costs include elements that are closely related to the
enhancement of picture and sound quality. These elements are an integral part of the software
program development and not readily separable from one another. Based on the analysis of the
nature and components of the development costs, however, the Company has determined that
the majority of its product development costs are attributed to the requirements for advanced
and complex computer programming for new products. As such, unless the costs that are
clearly determinable as the “contents” related, the Company treats all of such product develop-
26
ment costs as the software development costs defined in the new accounting pronouncement.
With respect to the software development costs that were incurred prior to April 1, 1999,
the Company will continue to capitalize such cost as work in process and amortize such cost
over 3 years or less after completion based on the expected sales quantity.
Due to the change in the accounting for software development costs, selling, general and
administrative expenses increased, compared with the previous accounting policy, by ¥770
million, and operating income and net income before taxes decreased by ¥770 million.
The accounting treatment for software development costs for the Company’s internal use
remains the same as the prior year. The capitalized cost is amortized evenly over the useful life
of 5 years.
(k) Per Share Data
Net income per share is computed based upon the weighted average number of shares of
common stock outstanding during each year. Accordingly, net income per share for the year
ended March 31, 2000 was based on the average number of shares of common stock outstand-
ing during the period. The effects of stock split made on October 25, 1999 and July 30, 1998 on
the number of outstanding shares have been retroactively reflected assuming they were made
as of the beginning of the respective years.
Cash dividends per share represent actual amounts applicable to each year.
(l) Reclassification
Certain reclassifications have been made in the 1999 consolidated financial statements to
conform to the 2000 presentation.
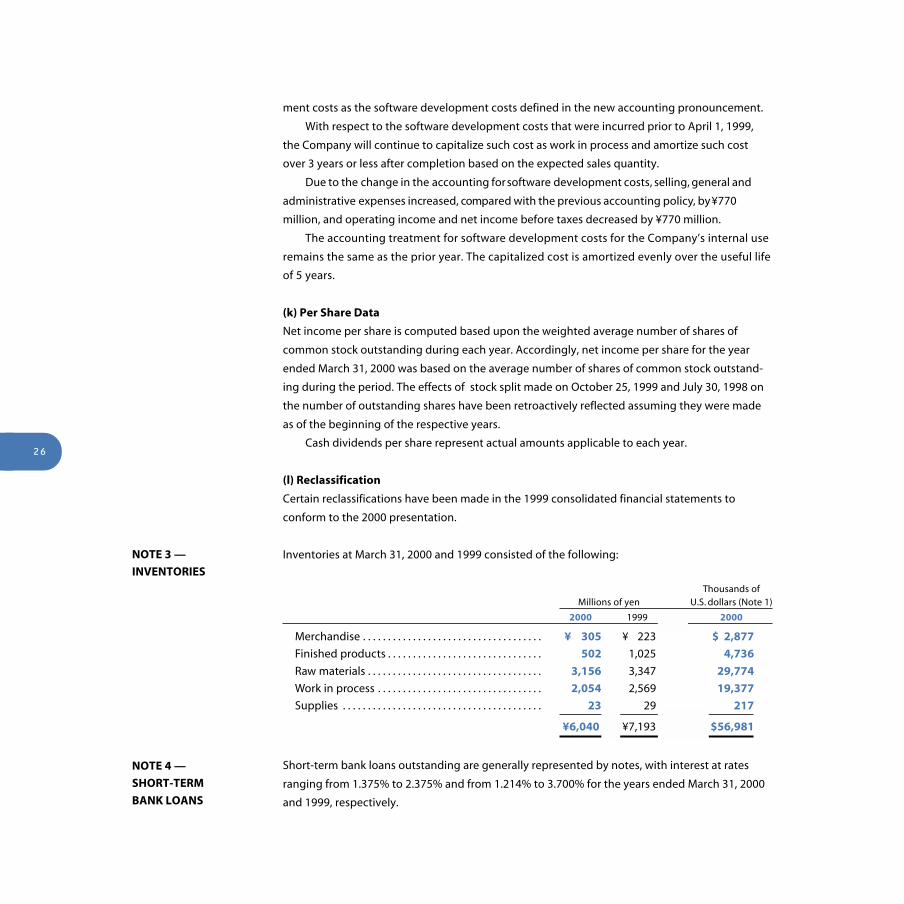
Inventories at March 31, 2000 and 1999 consisted of the following:
Thousands ofMillions of yen U.S. dollars (Note 1)
2000 1999 2000
Merchandise . . . . . . . . . . . . . . . . . . . . . . . . . . . . . . . . . . . . ¥ 305 ¥ 223 $ 2,877
Finished products . . . . . . . . . . . . . . . . . . . . . . . . . . . . . . . 502 1,025 4,736
Raw materials . . . . . . . . . . . . . . . . . . . . . . . . . . . . . . . . . . . 3,156 3,347 29,774
Work in process . . . . . . . . . . . . . . . . . . . . . . . . . . . . . . . . . 2,054 2,569 19,377
Supplies . . . . . . . . . . . . . . . . . . . . . . . . . . . . . . . . . . . . . . . . 23 29 217
¥6,040 ¥7,193 $56,981
Short-term bank loans outstanding are generally represented by notes, with interest at rates
ranging from 1.375% to 2.375% and from 1.214% to 3.700% for the years ended March 31, 2000
and 1999, respectively.
NOTE 3 —
INVENTORIES
NOTE 4 —
SHORT-TERM
BANK LOANS

27
The maximum amount that the Company can distribute as dividends is calculated based on the
unconsolidated financial statements of the Company and in accordance with the Commercial
Code of Japan.
Under the Commercial Code of Japan (the “Code”), at least 50% of the issue price of new
shares, with a minimum of the par value thereof, is required to be designated as common stock.
The portion which is to be designated as common stock is determined by resolution of the Board
of Directors. Proceeds in excess of the amounts designated as common stock are credited to
additional paid-in capital.
The Code provides that certain amount of retained earnings equal to at least 10% of cash
dividends and bonuses to directors and corporate auditors paid for each period is to be appro-
priated as a legal reserve until the reserve equals 25% of common stock issued. This reserve
amounted to ¥72 million ($679 thousand) as of March 31, 2000, and is not available for dividends,
but may be used to eliminate a deficit by resolution of shareholders’ meeting or may be
transferred to common stock by resolution of the Board of Directors. Legal reserve is included
in retained earnings.
Income taxes in the accompanying consolidated statements of income comprise corporation,
enterprise and inhabitants taxes. The aggregated normal effective tax rates were approximately
42% for 2000 and 47% for 1999.
The following table summarizes the significant differences between the statutory tax rate
and the Company’s effective tax rate for financial statement purposes for the year ended
March 31, 2000:
Statutory tax rate . . . . . . . . . . . . . . . . . . . . . . . . . . . . . . . . . . . . . . . . . . . . . . . . . . . . . . . . . . . 42.0%
Permanent differences such as entertainment expense . . . . . . . . . . . . . . . . . . 1.8
Tax on undistributed earnings of family corporation . . . . . . . . . . . . . . . . . . . . . 5.1
Amortization of goodwill on consolidation . . . . . . . . . . . . . . . . . . . . . . . . . . . . . . 4.0
Per capita inhabitant tax . . . . . . . . . . . . . . . . . . . . . . . . . . . . . . . . . . . . . . . . . . . . . . . . 0.8
Other . . . . . . . . . . . . . . . . . . . . . . . . . . . . . . . . . . . . . . . . . . . . . . . . . . . . . . . . . . . . . . . . . . . 4.2
Effective tax rate . . . . . . . . . . . . . . . . . . . . . . . . . . . . . . . . . . . . . . . . . . . . . . . . . . . . . . . . . . . . 57.9%
NOTE 7 —
INCOME TAXES
The Company was contingently liable for guarantees of debt of employees in the amount of ¥1
million ($9 thousand) and as endorses of notes discounted with banks amounting to ¥1,359
million ($12,821 thousand) at March 31, 2000.
NOTE 5 —
CONTINGENT
LIABILITIES
NOTE 6 —
SHAREHOLDERS’
EQUITY

28
Thousands ofMillions U.S. dollars of yen (Note 1)
Deferred tax assets:
Expensed tangible assets to be capitalized for tax purpose . . . . . . . . . ¥ 474 $ 4,472
Retirement benefits . . . . . . . . . . . . . . . . . . . . . . . . . . . . . . . . . . . . . . . . . . . . . . . 207 1,953
Excess bonuses accrued . . . . . . . . . . . . . . . . . . . . . . . . . . . . . . . . . . . . . . . . . . . 97 915
Excess depreciation expense disallowed for tax purpose . . . . . . . . . . . 100 943
Accrued enterprise taxes . . . . . . . . . . . . . . . . . . . . . . . . . . . . . . . . . . . . . . . . . . 267 2,519
Tax loss carryforward on a subsidiary . . . . . . . . . . . . . . . . . . . . . . . . . . . . . . 914 8,623
Other . . . . . . . . . . . . . . . . . . . . . . . . . . . . . . . . . . . . . . . . . . . . . . . . . . . . . . . . . . . . . . 190 1,792
Sub-total . . . . . . . . . . . . . . . . . . . . . . . . . . . . . . . . . . . . . . . . . . . . . . . . . . . . . . . . 2,249 21,217
Deferred tax liability:
Valuation allowance . . . . . . . . . . . . . . . . . . . . . . . . . . . . . . . . . . . . . . . . . . . . . . . 928 8,755
Net deferred tax assets . . . . . . . . . . . . . . . . . . . . . . . . . . . . . . . . . . . . . . . . . . . . . . . ¥1,321 $12,462
Significant components of the Company’s deferred tax assets and liability as of March 31,
2000 are as follows:
Book value, market value and net unrealized gains of quoted securities at March 31, 2000 and
1999 were as follows:Millions of yen
2000 1999
Book Market Unrealized Book Market Unrealizedvalue value gains value value gains
Current assets:
Shares . . . . . . . . . . . . . . . . . . . ¥ 26 ¥ 39 ¥ 13 ¥29 ¥29 ¥—
Non-current assets:
Shares . . . . . . . . . . . . . . . . . . . 147 515 368 64 64 —
¥173 ¥554 ¥381 ¥93 ¥93 ¥—
Thousands of U.S. dollars (Note 1)2000
Book Market Unrealizedvalue value gains
Current assets:
Shares . . . . . . . . . . . . . . . . . . . $ 245 $ 368 $ 123
Non-current assets:
Shares . . . . . . . . . . . . . . . . . . . 1,387 4,858 3,471
$1,632 $5,226 $3,594
NOTE 8 —
MARKET VALUE
INFORMATION

29
Millions of yen
Acquisition Accumulated Net bookcost depreciation value
At March 31, 2000:
Machinery and equipment . . . . . . . . . . . . . . . . . . . . . . . . . . . . . . ¥102 ¥53 ¥49
At March 31, 1999:
Machinery and equipment . . . . . . . . . . . . . . . . . . . . . . . . . . . . . . ¥ 62 ¥ 56 ¥ 6
Thousands of U.S. dollars (Note 1)
Acquisition Accumulated Net bookcost depreciation value
At March 31, 2000:
Machinery and equipment . . . . . . . . . . . . . . . . . . . . . . . . . . . . . . $962 $500 $462
A summary of assumed amounts of acquisition cost, accumulated depreciation and net book
value at March 31, 2000 and 1999 with respect to the finance leases accounted for in the same
manner as operating leases were as follows:
NOTE 9 —
INFORMATION FOR
CERTAIN LEASES
Thousands ofMillions of yen U.S. dollars (Note 1)
2000 1999 2000
Due within one year . . . . . . . . . . . . . . . . . . . . . . . . . . . . . . . . . . . . . ¥19 ¥4 $179
Due after one year . . . . . . . . . . . . . . . . . . . . . . . . . . . . . . . . . . . . . . . 30 2 283
¥49 ¥6 $462
Future lease payments under the finance leases which are accounted for in the same
manner as operating leases as of March 31, 2000 and 1999 were as follows:
Lease payments under finance leases which are accounted for in the same manner as oper-
ating leases, for the years ended March 31, 2000 and 1999 were ¥17 million ($160 thousand) and
¥9 million, respectively.
On May 17, 2000 the Board of Directors resolved to submit the following appropriations of
retained earnings at March 31, 2000 to the general shareholders meeting to be held on June 26,
2000 for their approval.
NOTE 10 —
SUBSEQUENT EVENT
Thousands ofMillions of yen U.S. dollars (Note 1)
Transfer to legal reserve . . . . . . . . . . . . . . . . . . . . . . . . . . . . . . . . . . . . . . . . ¥ 59 $ 557
Cash dividends (¥40.0 per share) . . . . . . . . . . . . . . . . . . . . . . . . . . . . . . . 506 4,774
Directors’ and corporate auditors’ bonuses . . . . . . . . . . . . . . . . . . . . . ¥ 80 $ 755
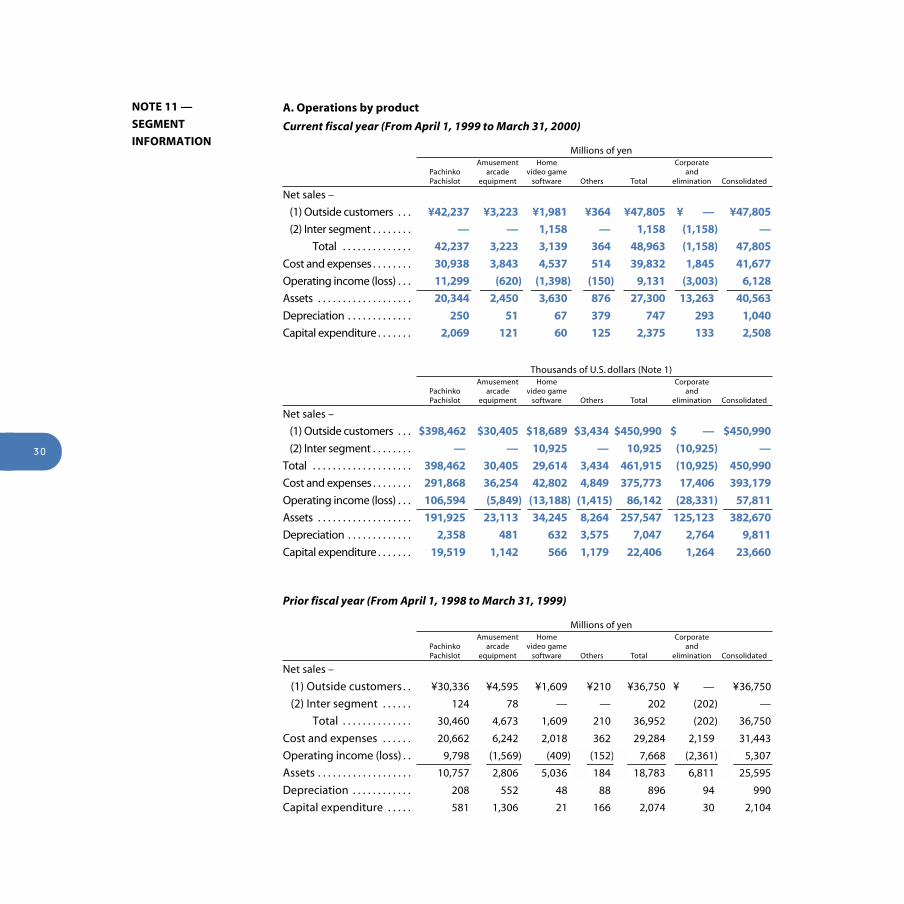
30
A. Operations by product
Current fiscal year (From April 1, 1999 to March 31, 2000)
Millions of yenAmusement Home Corporate
Pachinko arcade video game andPachislot equipment software Others Total elimination Consolidated
Net sales –
(1) Outside customers . . . ¥42,237 ¥3,223 ¥1,981 ¥364 ¥47,805 ¥ — ¥47,805
(2) Inter segment . . . . . . . . — — 1,158 — 1,158 (1,158) —
Total . . . . . . . . . . . . . . 42,237 3,223 3,139 364 48,963 (1,158) 47,805
Cost and expenses . . . . . . . . 30,938 3,843 4,537 514 39,832 1,845 41,677
Operating income (loss) . . . 11,299 (620) (1,398) (150) 9,131 (3,003) 6,128
Assets . . . . . . . . . . . . . . . . . . . 20,344 2,450 3,630 876 27,300 13,263 40,563
Depreciation . . . . . . . . . . . . . 250 51 67 379 747 293 1,040
Capital expenditure . . . . . . . 2,069 121 60 125 2,375 133 2,508
Thousands of U.S. dollars (Note 1)Amusement Home Corporate
Pachinko arcade video game andPachislot equipment software Others Total elimination Consolidated
Net sales –
(1) Outside customers . . . $398,462 $30,405 $18,689 $3,434 $450,990 $ — $450,990
(2) Inter segment . . . . . . . . — — 10,925 — 10,925 (10,925) —
Total . . . . . . . . . . . . . . . . . . . . 398,462 30,405 29,614 3,434 461,915 (10,925) 450,990
Cost and expenses . . . . . . . . 291,868 36,254 42,802 4,849 375,773 17,406 393,179
Operating income (loss) . . . 106,594 (5,849) (13,188) (1,415) 86,142 (28,331) 57,811
Assets . . . . . . . . . . . . . . . . . . . 191,925 23,113 34,245 8,264 257,547 125,123 382,670
Depreciation . . . . . . . . . . . . . 2,358 481 632 3,575 7,047 2,764 9,811
Capital expenditure . . . . . . . 19,519 1,142 566 1,179 22,406 1,264 23,660
NOTE 11 —
SEGMENT
INFORMATION
Prior fiscal year (From April 1, 1998 to March 31, 1999)
Millions of yenAmusement Home Corporate
Pachinko arcade video game andPachislot equipment software Others Total elimination Consolidated
Net sales –
(1) Outside customers . . ¥30,336 ¥4,595 ¥1,609 ¥210 ¥36,750 ¥ — ¥36,750
(2) Inter segment . . . . . . 124 78 — — 202 (202) —
Total . . . . . . . . . . . . . . 30,460 4,673 1,609 210 36,952 (202) 36,750
Cost and expenses . . . . . . 20,662 6,242 2,018 362 29,284 2,159 31,443
Operating income (loss) . . 9,798 (1,569) (409) (152) 7,668 (2,361) 5,307
Assets . . . . . . . . . . . . . . . . . . . 10,757 2,806 5,036 184 18,783 6,811 25,595
Depreciation . . . . . . . . . . . . 208 552 48 88 896 94 990
Capital expenditure . . . . . 581 1,306 21 166 2,074 30 2,104

31
(Note)
1. The Company has 4 segments based on its internal control structure, and nature of products
and market.
2. Main products and line of business by segment
(1) Pachinko and pachislot . . . . . . . . . . . . . . . . . Manufacture and sale of pachinko and pachislot
machines
(2) Amusement arcade equipment . . . . . . . . . Manufacture, sale and leasing of game machines used
in amusement arcades
(3) Home video game software . . . . . . . . . . . . . Production and sale of home video game software
(4) Others . . . . . . . . . . . . . . . . . . . . . . . . . . . . . . . . . . Mainly operation of amusement arcades
3. General corporate expenses of ¥2,361 million ($21,500 thousand), which mainly consist of expenses
incurred by the parent company’s administrative department are included in “Corporate and
eliminations.”
4. Corporate assets of ¥6,811 million ($125,123 thousand), which mainly consist of cash and cash
equivalent, marketable securities, investment securities and corporate properties, are included in
“Corporate and eliminations.”
B. Geographical segment information
Geographical segment information was not presented as the sales and assets of consolidated
domestic subsidiaries for the years ended March 31, 2000 and 1999 exceed 90% of consolidated
net sales and assets.
C. Overseas sales
The overseas sales of the Company and its consolidated subsidiaries for the years ended March
31, 2000 and 1999 were less than 10% of consolidated net sales.

32
REPORT OF INDEPENDENT PUBLIC ACCOUNTANTS
The Board of Directors
SAMMY CORPORATION
We have audited the accompanying consolidated balance sheets of SAMMY CORPORATION (a Japanese corporation) and sub-
sidiaries as of March 31, 2000 and 1999, and the related consolidated statements of income, shareholders’ equity and cash
flows for the years then ended, all expressed in Japanese yen. Our audits were made in accordance with auditing standards
generally accepted in Japan and, accordingly, included such tests of the accounting records and such other auditing proce-
dures as we considered necessary in the circumstances.
In our opinion, the consolidated financial statements referred to above present fairly the consolidated financial position of
SAMMY CORPORATION and subsidiaries as of March 31, 2000 and 1999, and the consolidated results of their operations and
their cash flows for the years then ended in conformity with accounting principles generally accepted in Japan applied on a
basis consistent during the periods, except as noted in the following paragraph.
As explained in Note 2, in the year ended March 31, 2000, SAMMY CORPORATION and subsidiaries prospectively adopted
new Japanese accounting standards for consolidation, income taxes and research and development cost.
Also, in our opinion, the U.S. dollar amounts in the accompanying consolidated financial statements and notes thereto
have been translated from Japanese yen on the basis set forth in Note 1.
Tokyo, Japan
June 27, 2000
Statement on Accounting Principles and Auditing Standards
This statement is to remind users that accounting principles and auditing standards and their application in practice may
vary among nations and therefore could affect, possibly materially, the reported financial position and results of operations.
The accompanying financial statements are prepared based on accounting principles generally accepted in Japan, and the
auditing standards and their application in practice are those generally accepted in Japan. Accordingly, the accompanying
financial statements and the auditors’ report presented above are for users familiar with Japanese accounting principles,
auditing standards and their application in practice.

33
((( PROFILE )))
There are many ways to have fun, and one can never be sure where the journey will end.
Blazing new trails in entertainment means daring to go beyond the conventional, and
having the spirit and power to innovate. Sammy takes the idea of “enterprising spirit” to heart.
While expanding the domains of pachislot, pachinko and amusement, we will accept the
challenges of creating new business in the entertainment field, and through it, unique value.
Sammy—a company with the will to change and meet the needs of its times.
((( CORPORATE DATA )))
CONTENTS
REVIEW OF OPERATIONS ........................... 1
PACHISLOT .................................... 2
PACHINKO ..................................... 4
AMUSEMENT .................................... 6
NEW BUSINESS DEVELOPMENT ..................... 8
TO OUR SHAREHOLDERS ........................... 10
FINANCIAL HIGHLIGHTS .......................... 14
MANAGEMENT DISCUSSION AND ANALYSIS ............ 15
CONSOLIDATED FINANCIAL STATEMENTS AND NOTES ... 18
CORPORATE DATA................................ 33
Caution with Regard to Forward-
Looking Statements
Statements in this annual report with
respect to Sammy’s plans, strategies,
beliefs and estimates that are not historical
facts are forward-looking statements. They
constitute management’s assumptions
based on information currently available
and involve risks and uncertainties.
There are a number of factors that could
cause actual results to differ materially
from such statements.
Head Office:
23-2, Higashi-Ikebukuro 2-chome,
Toshima-ku, Tokyo 170-8436, Japan
Established:
November 1, 1975
Capital:
¥4,841,658,600
(As of March 31, 2000, non-consolidated)
Employees:
452
(As of March 31, 2000, non-consolidated)
Common Stock:
Authorized: 30,000,000 shares
Issued: 12,643,450 shares
(As of March 31, 2000)
Number of Shareholders:
9,390
(As of March 31, 2000)
Transfer Agent of Common Shares
Handling Office:
The Toyo Trust and Banking Co., Ltd.
Corporate Agency Department
10-11, Higashisuna 7-chome, Koto-ku,
Tokyo 137-8081, Japan
Phone: 03-5683-5111
Principal Business:
• Development, manufacture and
sales of pachinko machines,
pachislot machines, arrange ball
machines, and peripheral
equipment
• Development, manufacture and
sales of home video game software
• Development, manufacture, sales
and export of amusement arcade
equipment
• Operation of amusement arcades
Network:
Factory and Distribution Center:
Sayama
Branches:
Sapporo, Sendai, Tokyo, Nagoya,
Osaka, Hiroshima, Fukuoka
Sales Offices:
Aomori, Koriyama, Tsukuba,
Takasaki, Shizuoka, Kyoto, Kobe,
Takamatsu, Miyazaki
Subsidiaries:
Sammy USA Corporation
MAXBET Co., Ltd.
Sammy Amusement Service Co., Ltd.
Spike Co., Ltd.
Underground Liberation Force Inc.
Vaill Co., Ltd.
Quat Technology Inc.
RODEO Co., Ltd.
Dimps Corp.
Management:
President & CEO:
Hajime Satomi
Senior Managing Director:
Toru Katamoto
Managing Directors:
Keishi Nakayama
Kiyofumi Sakino
Standing Corporate Auditors:
Mamoru Makaya
Ryoichi Arai
Corporate Auditor:
Etsuo Sakai
Senior Executive Officers:
Norihiko Harada
Kenkichi Yoshida
Executive Officers:
Yasunori Kawamura
Katsunori Muraki
Koji Tanizawa
Yoshitaka Kawamura
Yasuhiro Katayama
Masakazu Yoshino
(As of June 27, 2000)
For further information, please contact:
Investor Relations
Sammy Corporation
23-2, Higashi-Ikebukuro 2-chome,
Toshima-ku, Tokyo 170-8436, Japan
Phone: 03-5950-3785
Facsimile: 03-5950-3772
e-mail: [email protected]
Or via the Internet at:
http://www.sammy.co.jp
((( FOCUSED ON GROWTH )))
Printed in Japan
23-2, Higashi-Ikebukuro, 2-chome, Toshima-ku, Tokyo, 170-8436, Japan
TEL 03-5950-3785 FAX 03-5950-3772
URL: http//www.sammy.co.jp/
SAMMY
ANNUAL REPORT2000
PACHISLOT
PACHINKO
AMUSEMENT
NEWBUSIN
ESS DEVELOPMENT