fnding edges and lnes nimages(a ma sachusetts … · r ad-a130 824 fnding edges and lnes nimages(a...
TRANSCRIPT

r AD-A130 824 FNDING EDGES AND LNES NIMAGES(A MA SACHUSETTS INST 2O TECH CAMBRIDGE AR C IF AIN INTEL GENCE LAB
CANNY JUN 83 Al-TR-720 NO0 14-80 C-0505UNCLASSIFIED F/G 20/6
mmhmmmmhmuiIIIIIIIIEIIIIEEIIIIIIIIIIIIuIIIIIIIIIIIIIlfllfll|fIIEEEEIIEI-

I
-j. = 13
fl~fl==== 36 * 2
1.2 ' 11111.40 11 .
MICROCOPY RESOLUTION TEST CHART
NATI NAL BLIA ALI 01 IAN AR[>l 196A A

~I.-Edges anLie
John Fracis.any
MIT Artifica toIiIC eotr
L3ai"two_
i _WON*"

UNCLASSI FlED, SECURITY CLASSIFICATION OF THIS PAGE ("osen Data Entered)
READ INSTRUCTIONSREPORT DOCUMENTATION PAGE BEFORE COMPLETING FORMI. REPORT NUMBER 2. GOVT ACCESSION NO. 3. RECIPIENT'S CATALOG NUMBER
AI-TR-720
4. TITLE (and Subtitle) S. TYPE OF REPORT & PERIOD COVERED
Technical Report
Finding Edges and Lines in Images G. PERFORMING ORG. REPORT NUMBER
7. AUTHOR(s) S. CONTRACT OR GRANT NUMBER(S)
John Francis Canny N00014-80-C-0505
9 PERFORMING ORGANIZATION NAME AND ADDRESS 10. PROGRAM ELEMENT. PROJECT. TASK
Artificial Intelligence Laboratory AREA&WORKUNITNUMBERS
545 Technology SquareCambridge, Massachusetts 02139
t 1 CONTROLLING OFFICE NAME AND ADDRESS 12. REPORT DATE
Advanced Research Projects Agency June 19831400 Wilson Blvd IS. NUMBER OF PAGES
Arlington, Virginia 22209 14674 MONITORING AGENCY NAME & ADDRESS(If different from Controlling Office) IS. SECURITY CLASS. (of this report)
Office of Naval Research UNCLASSIFIEDInformation Systems IIArlington, Virginia 22217 1s. DECLASSIFICATION' DOWNGRADING
IS. DISTRIBUTION STATEMENT (of this Report)
Distribution of this document is unlimited.
17. DISTRIBUTION STATEMENT (of the abstract entered in Block 20. if different from Report)
IS. SUPPLEMENTARY NOTES
None
19. KEY WORDS (Conlinue on reverse side If necessary id Identify by block number)
Edge Detection Image UnderstandingMachine VisionFeature ExtractionImage Processing
20. ABSTRACT (Continue on rssreo side If secesry and Identify by block number)
;.The problem of detecting intensity changes in images is canonical in vision.Edge detection operators are typically designed to optimally estimate firstor second derivative over some (usually small) support. Other criteria suchas output signal to noise ratio or bandwidth have also been argued for. Thisthesis is an attempt to formulate a set of edge detection criteria that cap-ture as directly as possible the desirable properties of an edge operator.Variational techniques are used to find a solution over the space of all->(over)
DD I JAN 7 1473 EDT1ON OF 1 NOV13 IOSOLETE UNCLASSIFIEDS'% 0J n2-1114-66(i
SECURITY CLASSIFICATION OF THIS PAGE (When 0.et Entered)

linear shift invariant operators. The first criterion is that the detector have low probability
of error i.e. failing to mark edges or falsely marking non-edges. The second is that the
marked points should be as close as possible to the centre of the true edge. The thirdcriterion is that there should be low probability of more than one response to a single edge.The technique is used to find optimal operators for step edges and for extended impulseprofiles (ridges or valleys in two dimensions). The extension of the one dimensionaloperators to two dimensions is thendiscussed. The result is a set of operators of varyingwidth, length and orientation. The problem of combining these outputs into a singledescription is discussed, and a set of heuristics for the integration are given.
I
I S. ..

V
I!
This report describes research done in the Artificial Intelligence Laboratory ofthe Massachusetts Institute of Technology. Support for the laboratory's artificialintelligence research is provided in part by the Advanced Research ProjectsAgency of the Department of Defense under Office of Naval Research contractN00014-80-C-0505 and in part by the System Development Foundation.
0Ne
/ON
I eml ll :. .

FINDING EDGES AND LINES IN IMAGES
by
John Francis Canny
Massachusetts Institute of Technology
June 1983
I
Revised version of a thesis submitted to the Department of Electrical Engineeringand Computer Science on May 12, 1983 in partial fulfillment of the requirementsfor the Degree of Master of Science.
.. .- - - - ' .,- -
p
Abstract
The problem of detecting intensity changes in images is canonical in vision.Edge detection operators are typically designed to optimally estimate first or secondderivative over some (usually small) support. Other criteria such as output signalto noise ratio or bandwidth have also been argued for. This thesis is an attempt toformulate a set of edge detection criteria that capture as directly as possible thedesirable properties of an edge operator. Variational techniques are used to find asolution over the space of all linear shift invariant operators. The first criterion isthat the detector have low probability of error i.e. failing to mark edges or falselymarking non-edges. The second is that the marked points should be as close aspossible to the centre of the true edge. The third criterion is that there should below probability of more than one response to a single edge. The technique is usedto find optimal operators for step edges and for extended impulse profiles (ridgesor valleys in two dimensions). The extension of the one dimensional operatorsto two dimensions is then discussed. The result is a set of operators of varyingwidth, length and orientation. The problem of combining these outputs into a singledescription is discussed, and a set of heuristics for the integration are given.
Thesis Supervisor: Dr. J. Michael Brady
Title: Senior Research Scientist
2
AL_

Acknowledgemerts
First of all I must thank my supervisor, Mike Brady, whose enthusiasm for thiswork was almost infinite, and who compensated for my reluctance to consult theliterature. Mike also contributed valuable feedback as the major user of the system.
Thanks to the readers Eric Grimson and Rod Brooks, and especially to BertholdHorn for his extensive comments on the thesis proposal.
I would also like to thank all of the "vision" people, especially Tommy Poggio,Alan Yuille and Ellen Hildreth for discussions at various times.
I thank the Macsyma Consortium for the complexity of equations I was ableto produce, and for the speed with which I was able to try new ideas.
My thanks to Patrick Winston and to the System Development Foundationfor their current support, and to ITT for providing the Fellowship support whichenabled me to be here.
II
3
deft

Table of Contents
Abstract.......................................................... 2
Acknowledgements.................................................. 3
Table of Contents .................................................. 4
1. Introduction..................................................... 5
2. One-Dimensional Formulation for Step Edges .......................... 122.1 An Uncertainty Principle..................................... 142.2 The Optimal Operator for Steps............................... 192.3 Eliminating Multiple Responses ................................ 232.4 Finding an Operator by Stochastic Optimization................. 34
3. Two or More Dimensions ......................................... 433.A The Need for Multiple Widths ................................ 453.2 The Need for Directional Operators............................ 483.3 Noise Estimation ........................................... 513.4 Thresholding with Hysteresis ............................ i...... 53
3.5j Sensitivity to Smooth Gradients............................... 584. Finding Lines and Other Features.................................. 60
4.1 General form for the Criteria ................................. 614.2 In Two Dimensions ......................................... 66
5. Implementation Details........................................... 705.1 Effects of Discretization...................................... 715.2 Gaussian Convolutions................ ...................... 725.3 Non-maximum Suppression................................... 815.4 Mapping Functions ......................................... 83
6. Experiments.................................................... 866.1 Step Edges in Noise ......................................... 876.2 Operator Integration ........................................ 906.3 The Line Finder........................................... 1156.4 Psychophysics............................................. 118
7. Related Work.................................................. 1217.1 Surface Fitting............................................ 1227.2 Derivative Estimation ...................................... 1267.3 Frequency Domain Methods ............ ...................... 130
8. Conclusions and Suggestions for Further Work .................. 135
Appendix I ...................................................... 140
References ...................................................... 142
4

1! 1. lntrodtecion
Edge detection forms the first stage in a very large number of vision modules,
and any edge detector should be formulated in i he appropriate context. However,
the requirements of many modules are similar and it seems as though it should be
possible to design one edge detector that performs well in several contexts. The
crucial first step in the design of such a detector should be the specification of a
set of performance criteria that capture these requirements. The specification of
these criteria and the derivation of optimal operators from them forms the subject
of this report.
The operation of the edge detector is best illustrated by the example in figure
(1.1), which was produced by the detector described in this report. The detector
accepts discrete digitized images and produces an "edge map" as its output. The
edge map includes explicit information about the position and strength of edges,
their orientation, and the "scale" at which the change took place. Although they
are not made explicit, it is also possible to compute the uncertainty in position or
strength of an edge from the quantites in the edge map. The example in figure (1.1)
includes position information only.
A digitized image contains a great deal of redundancy. There is redundancy in
the information theoretic sense (it is possible to compress the sampled data into fewer
bits without changing the reconstructed image significanty). Even after efficient
encoding, much of the what remains is not useful to later vision modules. These
modules typically require structural information, i.e. details of surface orientation
and the material of which the visible surfaces comprise. Where the surfaces are
smooth and of uniform reflectance, shape from shading (Horn 1975) may be applied
to obtain surface orientation. In many other modules such as shape from motion
(Ullman 1979 and Hildreth 1983), shape from contour (Stevens 1980), shape from
texture (Witkin 1980), and Stereo (Marr and Poggio 1979, Grimson 1981) structural
properties of underlying surfaces are inferred from edge contours. In particular,
step changes in intensity are important because they typically correspond to sharp
changes in orientation or material, or to object boundaries. Edge detection is a
5

I!
Figure 1.1. Positional information provided by the edge detector applied to ani
image of some mechanical parta
C4
64A-r

io. ,'1 rii Ions hA I ih preserve ni(st of the structural
, , ~IaVC ihosen the first or second derivative as the
1. .0 t't) edges, and have formed optimal estimates
, , , -. xarples of first derivative operators are the
*e,. \ letd (I170), while Modestino and Fries (1977)
' '.% imiensional Laplacian over a large support.
S g. ;'~..,,d , t I.aplacian of a broad Gaussian since it
',A -t. Alid bandwidth. There are problems with the
A ., ,r, apt f derivative estimation seems to have
!I,-. b mtade specific in chapter 7.
o.... ,f formulations in which the image surface is
. n. I. ,ions and the edge parameters are estimated
...tt,, I'Aamples of this technique include the work of
Of '11- -d Ilaralick (1982). These methods allow more
,irt irw 'N ., i as position and orientation, but since the
C ,MA' !,Mt oniplete, the properties apply only to a projection, :1.49# s.ifam or to the subspace spanned by the basis functions.
, " , r, fnct s are a major factor in operator performance, especially
r , ' ,, cahze edges.
this report we begin with a traditional model of a step edge in white Gaussian
'O..M, and try to formulate precisely the criteria for effective edge detection. We
atssure, that detection is performed by convolving the noisy edge with a spatial
fuict ion f (r) (which we are trying to find) and by marking edges at the maxima in
the output of this convolution. We then specify three performance criteria on the
output of this operator.
(i) Good detection. There should be a low probablity of failing to mark real edge
points, and low probability of falsely marking non-edge points. Since both
these probabilities are monotonically decreasing functions of the output signal
to noise ratio, this criterion corresponds to maximizing signal to noise ratio.
7

(ii) Good localization. The points marked as edges by the operator should be as
close as possible to the centre of the true edge.
(iii) Only one response to a single edge. This is implicitly captured in (i) since
when two nearby operators respond to the same edge, one of them must be
considered a false edge. However, the mathematical form of the first criterion
did not capture the multiple response requirement and it had to be made
explicit.
The first result of the analysis for step edges is that (i) and (ii) are conflicting
and that there is a trade-off or uncertainty principle between them. Broad operators
have good signal to noise ratio but poor localization and vice-versa. A simple
choice of the mathematical form for the localization criterion gives a product of
a localization term and signal to noise ratio that is constant. Spatial scaling of
the function f(x) will change the individual values of signal to noise ratio and
localization but not their product. Given the analytic form of a detection function,
we can theoretically obtain arbitrarily good signal to noise ratio or localization from
it by scaling, but not simultaneously. From the analysis we can concl,de that there
is a single best shape for the function f which maximizes the product and that if we
scale it to achieve some value of one of the criteria, it will simultaneously provide
the maximum value for the other. To handle a wide variety of images, an edge
detector needs to use several different widths of operator, and to combine them in
a coherent way. By forming the criteria for edge detection as a set of functionals
of the unknown operator f, we can use variational techniques to find the function
that maximizes the criteria.
The second result is that the criteria (i) and (ii) by themselves are inadequate
to produce a useful edge detector. It seems that we can obtain maximal signal to
noise ratio and arbitrarily good localization by using a difference of boxes operator.
The difference of boxes (see figure 2.2) was suggested by Rosenfeld and Thurston
(1971) and was used by Herskovits and Binford (1970). If we look closely at the
response of such an operator to a noisy step edge we find that there is an output
maximum close to the centre of the edge, but that there may be many others
nearby. We have not achieved good localization because there is no way of telling
8

p
which of the maxima is close:,t to the true edge. The addition of ('rit.rion (iii)
gives an operator that has very low probability of giving more than one maximum
in response to a single edge, and it also leads to a finite limit for the product of
localization and signal to noise ratio.
The third result is an analytic form for the operator. It is the sum of four
complex exponentials and can be approximated by the first derivative of a Gaussian.
A numerical finite dimensional approximation to this function was first found using a
stochastic hill-climbing technique. This was done because it was much easier to write
the multiple response criterion in deterministic form for a numerical ,)timization
than as a functional of f. Specifically, the numerical optimizer provides candidate
outputs for evaluation, and it is a simple matter to count the number of maxima
in one of the outputs. To express this constraint analytically we need to find the
expectation value of the number of maxima in the response to an edge, and to
express tHis as a functional on f, which is much more difficult. The first derivative
of a Gaussian has been suggested before (Macleod 1970). It is also worth noting
that in one dimension the maxima in the output of this first derivative operator
correspond to zero-crossings in the output of a second derivative operator.
Several further results relate to the extension of the operator to two (or more)
dimensions. They can be summarized roughly by saying that the detector should
be directional, and if the image permits, the more directional the better. The issue
of non-directional (Laplacian) versus directional edge operators has been the topic
of debate for some time, compare for example Marr (1976) with Marr and Hildreth
(1980). To summarize the argument presented here, a directional operator can be
shown to have better localization than the Laplacian, signal to noise ratio is better,
the computational effort required to compute the directional components is slight
if efficient algorithms are used, and finally the problem of combining operators
of several orientations is difficult but not intractable. It is, for example, much
more difficult to combine the outputs of operators of different sizes, since their
supports differ markedly. For a given operator width, both signal to noise ratio and
localization improve as the length of the operator (parallel to the edge) increases,
provided of course that the edge does not deviate from a straight line. When
9'

the image does contain long approximately straight coitours, highly directional
operators are the best choice. This means several operators will be necessary to
cover all possible edge orientations, and also that less directional operators will also
be needed to deal with edges that are locally not straight.
The problem of combining the different operator widths and orientations is
approached in an analogous manner to the operator derivation. We begin with
the same set of criteria and try to choose the operator that gives good signal to
noise ratio and best localization. We set a minimum acceptable error rate and
then choose the smallest operator with greater signal to noise than the threshold
determined by the error rate. In this way the global error rate is fixed while thE
localization of a particular edge will depend on the local image signal to noise ratio.
The problem of choosing the best operator from a set of directional operators is
simpler, since only one or two will respond to an edge of a particular orientation.
The problem of choosing between a long directional operator and a less directional
one is theoretically simple but difficult in practice. Highly directional operators are
clearly preferable, but they cannot be used for locally curved edges. It is necessary
to associate a goodness of fit measure with each operator that indicates how well
the image fits the model of a linearly extended step. When the edge is good enough
the directional operator output is used and the output of less directional neighbours
is suppressed.
While the detection of step edges is the primary goal of the report, chapter 4
gives a general form for the optimality criteria. Using this general form, it is possible
to design optimal operators for arbitrary features. A numerical optimization is
used to find the impulse response of the operator given an input waveform to be
detected. The technique is illustrated by the derivation of operators for ridge, roof
and step edges. Of these the ridge and step detectors have been tested on real
images. The particular problems of extending the one-dimensional ridge operator
to two dimensions, and the problem of integrating the step and ridge detector
outputs are discussed.
Following the analysis we outline some simple experiments which seem to
indicate that the human visual system is performing similar selections (at some
10

COI 1putat iona level), or at least that the corrp utation that it. does perform has
a similar set of goals. We find that adding noise to an image has the effect of
producing a blurring of the image detail, which is consistent with there being several
operator sizes. More interestingly, the addition of noise may enable perception of
changes at a large scale which, even though they were present in the original image,
were difficult to perceive because of the presence of sharp edges. Our ability to
perceive small fluctuations in edges that are approximately straight is also reduced
by the addition of noise, but the impression of a straight edge is not.
As a guide to the reader, chapters 2 and 3 form the core of the analysis for
step edges. They also contain most of the signal theory, and the general reader
may wish to skim over them. The first section of chapter 3 should be read however,
as it includes the translation of the theoretical operator into a practical algorithm.
Chapter 4 is easier going and contains a more general form for the optimality
criteria. It gives examples of the solution of the variational problem for roof and
ridge edges. Chapter 5 is titled "details of implementation" and it may be tempting
to avoid it as being too low-level. However it contains several efficient algorithms
for Gaussian convolution, and may have applications outside the scope of the
present work. Finally, chapters 6 and 7 give weight to the analysis by showing the
performance of the operator on real images and by comparing it both experimentally
and theoretically with some other edge detectors.
11

2. (e-Dinwisional Formulation ror Step Edges
The basic design problem is illustrated in figure (2.1). We are trying to detect
a step edge which is bathed in Gaussian noise, figure (2.1a). We convolve with some
spatial function (2.1b) and mark edges at maxima in the result of this convolution
(2.1c). The objective is to find the spatial function (call it f) which gives the "best"
output, where best is defined by a precise set of criteria on step edge detection.
Some preliminaries on notation ; when we speak of an edge detection "operator"
we mean a mapping from a one or two dimensional intensity function (the image
or a linear slice through it) to an intensity function of the same dimension. If the
operator is linear and shift invariant, then it can be represented by a convolution of
the intensity function with the 'impulse response" (one dimension) or "point-spread
function" (two dimensions) of the operator, which is the result of applying the
operator to a unit impulse at the origin. Shift invariance is clearly a desirable
property of an edge operator. To begin with we will consider only linear shift
invariant operators and later we will apply decision procedures to their outputs,
which will lead to shift invariant non-linear operators. The operator that describes
the mapping from an image to the final representation of edge contours is called
the "edge detector".
The key to the design of an effective edge operator is the accurate evaluation of
its performance. If we can write down the evaluation function in closed mathematicalform, we can apply standard tools such as the calculus of variations to find theoperator that maximizes it. As with many optimization problems, the key to
obtaining a useful answer is to ask the right questions. The edge detection problem
is no exception, as should become apparent in the course of the derivation. Several
passes at the evaluation function had to be made before one was found that closed
all the "loopholes" and excluded operators that were impractical for "obvious"
reasons. This is not to say that the problem became one of finding a question to
fit a proposed solution, but rather that the question was always the same, it was
just very difficult to express in a closed form that was simple enough to yield
a variational problem that could be solved. By way of contrast, it was relatively
easy to obtain a similar solution using a Monte Carlo optimization, because the
12

a
b
C
Figure 2.1. (a) The step edge model, (b) The detection function to be derived,(c) The result of the convolution of this function with the edge.
evaluation could be done directly on the output of a candidate operator. The real
problem then, was the translation of the intuitive performance goals to functionais
that depended directly on the form of the operator. This section describes the main
stages in the trauslation proceps.
13
13

2.1. An Uncertainty Principle
We consider first the one dimensional edge detection problem. The goal is to
detect and mark step changes in a signal that contains additive white noise. We
assume that the signal is flat on both sides of the discontinuity, and that there are
no other edges close enough to affect the output of the operator (see figure 2.1).
We need to somehow combine the two goals of accurate detection and localization
into a single evaluation functional. The detection criterion is simple to express
in terms of the signal to noise ratio in the operator output, i.e. the ratio of the
output in response to the step input to the output in response to the noise only.
The localization criterion is more difficult, but a reasonable choice is the inverse of
the distance between the true edge and the edge marked by the detector. For the
distance measure we will use the standard deviation in the position of the maximum
of the operator output. By using local maxima we are making what seems to bean arbitrary choice in the mapping from linear operator output to detector output.
But the mapping must involve some local predicate, and since we are designing a
linear operator that will respond strongly to step edges, the maxima in its response
are a logical choice.
Let the amplitude of the step be A, and let the noise be n(x). Then the input
signal I(x) can be represented as
(x)= Au +(x)+n(x) (2.1)
where u_ (x) is the unit step function defined as
0, for x < 0
-1, for z>O
Let the impulse response of the operator we are seeking be represented by
the function f(x). Then the output O(xo) of the application of the operator to the
input I(x) is given by the convolution integral,
O(zO) JI(x)f(xo dz (2.2)
14

I
We can use the linearity of convolution to split this integral into contributions due
to the step and to noise only. The output due to the step only is (at the centre of
the step, i.e. at x0 = 0)
I-a of (x)Au-t(-x) dx = A f(x) dx (2.3)
While the mean squared response to the noise component only will be
E[f +0f (x)n(-x) dx]
where E[y is the expectation value of y. If the noise is white the above
simplifies to
2 +00
E[f+0 f 2 (x)n 2(-2x) dx] = n o__ f2 (z) dx
where n2 E[n2 (x)] for all x, i.e. n2 is the variance of the input noise. We define
the output signal-to-noise ratio as the quotient of the response to the step only and
the square root of the mean squared noise response.
S.N.R. ="Af (x) dx
no Vf - f2(x) dx
From this expression we can define a measure E of the signal to noise
performance of the operator which is independent of the input signal
S.N.R. = A and E - f° °° f(x) dx (2.5)no f-f2( x)dx
This then is the first part of our dual criterion, and finding the impulse response
f which maximizes it corresponds to finding the best operator for detection only.
For the localization criterion we proceed as follows. Recall that we chose to
mark edges at maxima in the output of the operator. For an ideal step we would
15

expect a single maximum at the centre of the edge. Since the signal J(x) contains
noise we would expect this maximum to be displaced from the true position of the
edge (at the origin in this case). To obtain a performance measure which improves
as the localizing ability of the operator improves, we use the reciprocal of the
standard deviation of the distance of the actual maximum from the centre of the
true edge. This is not an arbitrary choice, as it gives a composite performance
criterion which is scale independent, as we shall see.
A maximum in the output O(xo) of the operator corresponds to a zero-crossing
in the spatial derivative of this output. We wish to find the position x0 where
) = dxo f M f(x)I(xo - x) dx = 0
Which by the differentiation theorem for convolution can be simplified to
J'0 f'(x)I(xo - x) dx = 0
To find x0 we again split the derivative of the output O'(xo) into components
due to the step and due to noise only (call these O', and O" respectively).
O+0() =f f'(z)Au 1(xo - x) dx J 3 Af'(x) dx = Af(xo) (2.6)
The response of the derivative filter to the noise only (at any output point)
will be a Gaussian random variable with mean zero and variance equal to the
mean-squared output amplitude
EIO nx)] _. O 1i2 f' 2 (x) dx (2.7)
We now add the constraint that the function f should be antisymmetric.
An arbitrary function can always be split into symmetric and antisymmetric
components, but it should be clear that the symmetric component adds nothing to
16

tile detection or localizing ability of the operator but will contribute to tile noise
components that affect both. The Taylor expansion of O'(xo) about the origin gives
O'(xo) = Af(xo) %, xoAf'(O) (2.8)
For a zero-crossing in the output 0' we require
O'(Xo) = o' (X0) + O.(Xo) = 0 (2.9)
i.e. o',(xo)- -o' (xa) and E[O 2 (xo)I -- E[O(xo). Substituting for the two
outputs from (2.7) and (2.8) we obtain
E2i f J+002 n2f'2(x) dXE[x'j Az 2 (0 ) 6 02 (2.10)
where 6xo is an approximation to the standard deviation of the distance of the
actual maximum from the true edge. The localization is defined as the reciprocal
of 6X0
Localization = Anlo f -J. f'2 (x) dx
Again we define a performance measure A which is a property of the operator only
Localization = A A - If'(o)Ino +1ff 2 (X)dZ(.1
Having obtained both our desired criteria, we now have the problem of
combining them in a meaningful way. It turns out that if we use the product of the
two criteria we obtain a measure which is both amplitude and scale independent.
This measure is a property of the shape of the impulse response f only, and will be
the same for all functions f, obtained from f by spatial scaling. In fact the choice
of the combination will not affect the form of the solution since the variational
17

Iequations depend only on the individual terms in the criteria. The product of the
two criteria is
-2J(f)A(f) = f f (x) dx If'(o)i (2.12)
To illustrate the invariance of this criterion under changes of scale, we consider
the performance of an operator whose impulse response is fw where fw(x) = f( t.
The performance of the scaled operator is
f+f(2d ) If"(O)if+Ef(fdiiw/iAf0012xwx (2.13)
3 where the bracketed terms correspond in order to the detection and localization
criteria. We see from this form that the signal to noise performance of the operator
varies as Vw-w, while the localization varies as the reciprocal of vrw. An operator with
a broad impulse response will have good signal to noise ratio but poor localization
and vice versa. With this form of the composite criterion though, the product of
detection and localization terms is the same for all f,.
This result suggests that there is a class of operators that have optimal
performance and that they are related by spatial scaling. In fact this result is
independent of the choice of combination of the criteria. To see this we assume
that there is a function f which gives the best localization A for a particular E.
That is, we find f such that
E(f) = c1 and A(f) is maximized (2.14)
Now suppose we seek a second function f. which gives the best possible
localization while its signal to noise ratio is fixed to a different value. i.e.
(f0) = c2 while A(f,,) is maximized (2.15)
18

If we dne f,, as before, f,(x) = f( and further if we set
2 21/ W- C2/¢ 1
Then the constraint on f, in (2.15) translates to constraint on f which is
identical with (2.14). So to solve (2.15) we find f such that
1
E(f) = cl and - A(f) is maximized
Which has the same solution as (2.14). So if we find a single such function f,
we can obtain maximal localization for any fixed signal to noise ratio by scaling
f. Thus our choice of the composite criterion was not arbitrary but highlighted a
natural constraint or "uncertainty principle" for detection of step edges in noise.
We can obtain arbitrarily good localization or detection by scaling but not both
simultaneously.
We will find (eventually) that the above analysis is valid but that the criterion
as given is still underspecified. While it does lead to a plausible class of solutions,
performance will be poor because we have so far ignored an important aspect of
the detection process. Namely the detector should not produce multiple outputs in
response to a single edge. In the next section we find the solutions to the above
optimization problem, and highlight their weakness with regard to multiple edge
responses.
2.2. The Optimal Operator for Steps
The optimal edge detection operator has now been defined implicitly by
equation (2.12). All that remains is to find a function which maximizes this large
expression. We must make some simplifications before a solution can be found using
the calculus of variations. We cannot directly find a function which maximizes the
quotient of integrals in equation (2.12) since each depends on f(x). Instead we set
all but one of the integrals to undetermined constant values in an analogous manner
to the method of Lagrange multipliers. We then find the extreme value of the
19

remaining integral (since it will correspond to the naximumi iII the t'otal expression)
as a function of the undetermined constants. The values of the constants are then
chosen so as to maximize the value of the remainder of the expression, which is now
a function only of the three constants. Given these constants, we can completely
uniquely specify the function f(x) which gives the global maximum of the criterion.
The second simplification involves the limits of the integrals. The two integrals
in the denominator of (2.12) have limits at plus and minus infinity, while the integral
in the numerator has one limit at zero and the other at minus infinity. Since the
function f should be antisymmetric, we can use the latter limit for all integrals.
The denominator integrals will have half the value over this subrange that they
would have had over the full range. Also, this enables the value of f'(0) to be set as
a boundary condition, rather than expressed as an integral of f". The lower limit
of all the integrals at minus infinity should be set to some finite negative value, say
-W since we will be dealing with an operator of finite extent. These simplifications
allow us to exploit the isoperimetric constraint condition (see Courant and Htilbert
1953). This allows us to combine a set of constraint integrals that share the same
limits as the integral being extremized into a single variational equation.
So the problem of finding the maximum of equation (2.12) reduces to that
of finding the minimum of the integral in the denominator of the S.N.R. term,
subject to the constraint that the other integrals remain constant. By the principle
of reciprocity, we could have chosen to extremize any of the integrals while keeping
the others constant, but the solution should be the same. We seek some function f
chosen from a space of admissible functions that minimizes the integral
f 2(x) dZ (2.16)
subject to
f (x) 0 c,
20

LWfP (x) dx =C2
f(O) = C3 (2.17)
The space of admissible functions in this case will be the space of all continuous
functions that satisfy certain boundary conditions, namely that f(O) = 0 and
f(-W) 0 0. These boundary conditions are necessary to ensure that the integrals
evaluated over finite limits accurately represent the infinite convolution integrals.
That is, if the nth derivative of f appears in some integral, the function must be
continuous in its (n-1)st derivative over the range (-oo, +ao). This implies that the
values of f and its first (n-i) derivatives must be zero at the limits of integration,
since they must be zero outside this range.
The functional to be minimized is of the form f' F(x, f, f') and we have a
series of constraints that can be written in the form f' G,(z, f, f') = c. . Since
the constraints are isoperimetric, i.e. they share the same limits of integration as
the integral being minimized, we can form form a composite functional kp(x, f, f')
as a linear combination of the functionals that appear in the expression to be
minimized and in the constraints (Courant and Hilbert 1953). Finding a solution for
this unconstrained problem is equivalent to finding the solution to the constrained
problem. The composite functional is
'I(x, f,f') = F(x, f,f') + XiG(x,f,f') ± X 2G 2(x, f, f) ±
Substituting,
4p(x, f, f') = f 2 _Xf,2 + X2f (2.18)
It may be seen from the form of this equation that the choice of which integral
is extreinized and which are constraints is arbitrary, the solution will be the same.
21
Ll

9
This is an example of what is known as reciprocity in variatioiutl problems. The
choice of an integral from the denominator is simply convenient since the standard
form of the Euler equations applies to minimization problems. The Euler equation
that corresponds to this functional is
d - *f = 0dx
Where %Pf denotes the partial derivative of %P with respect to f. This gives
2f(x) - 2XIf"(x) + X2 = 0 (2.19)
The general solution of this differential equation is
f(X) 2- + aleox + a 2e - "1 (2.20)
Where a = X1 and the constants al and a 2 are determined by the boundary
conditions f(O) = 0 and f(-W) = 0. When these constraints are added the
function f ca, be written in the form
.(X) X2 cosh c(x+ (2.212 cosh a ThfAx) = - - cosh al (2.21)
From this we can obtain expressions for the signal-to-noise ratio and localization as
a function of the parameters X, and X2. To simplify the expressions we will assume
a width W of 2 and make use of the scaling properties from equation (2.13). This
gives
2a cosh a - 2 sinh a (2.22)
F 2 Cosh 2a - 3a sinh 2a + 4a2
A = sinha (2.23)a sinh 2a - 2c2
22

Both these expressions are functions only of a, and we can investigate the behaviour
of f as a tends to its limiting values 0 and +0o. As a tends to zero we find that
function f tends to a parabola whose equation is
f(X) = -X2Ck 2 (1 _ x 2 ) (2.24)
The corresponding values of signal-to-noise ratio and localization are
e3 (2.25)
When the value of a approaches infinity, we find that the function approaches
a constant over the range (-2,0) (recalling that W = 2), and that the signal-to-noise
ratio tends to 1. This is a very small increase over the corresponding value as atended to zero. However, the localization term, -, increases without bound. From
this result it would seem that a difference of boxes function (the antisymmetric
extension of the derived function over the range [-2,2]) gives the best possible
signal-to-noise ratio with arbitrarily good localization. This function is in fact th-
optimal Wiener filter for the step edge.
This operator has been used quite extensively becaus. ,f -s simpi.,:ty and
because it is easy to compute, as in the work of Rosenfeld and Thurston (1971), and
in conjunction with lateral inhibition in Herskovits and Binford (1970). However it
has a very high bandwidth and tends to exhibit many maxima in its response to
noisy step edges, which is a serious problem when the imaging system adds noise
or when the image itself contains textured regions. These extra edges should be
considered erroneous according to the first of our criteria. However, the analytic
form of this criterion was derived from the response at a single point (the centre
of the edge) and did not consider the interaction of the responses at several nearby
points. We need to make this explicit by adding a further constraint to the solution.
2.3. Eliminating Multiple Responses
If we examine the output of a difference of boxes edge detector we find that the
response to a noisy step is a roughly triangular peak with numerous sharp maxima
23

in the vicinity of the edge (see figure 2.2). 'I'iese inaxiina are so close together that
it is not possible to select one as the response to the step while identifying the
others as noise. We need to add to our criteria the requirement that the function
f will not have "too many" responses to a single step edge in the vicinity of the
step. We need to limit the number of peaks in the response so that there will be
a low probability of declaring more than one edge. Ideally, we would like to make
the distance between peaks in the noise response approximate the width of the
response of the operator to a single step. This width will be about the same as the
operator width W.
In order to express this as a functional constraint on f, we need to obtain
an expression for the distance between adjacent noise peaks. We first note that
the mean distance between adjacent maxima in the output is twice the distance
between adjacent zero-crossings in the derivative of the operator output. Then we
make use of a result due to Rice (1944, 1945) that the average distance between
zero-crossings of the response of a function 9 to Gaussian noise is
S ) (2.26)
Where R(r) is the autocorrelation function of q. In our case we are looking for the
mean zero-crossing spacing for the function f'. Now since
R(O) + 9 2(x)dz and R"(O) = /+ gf2(x)dz
The mean distance between zero-crossings of f will be
X = (f+-0: X (2.27)
The distance between adjacent maxima in the noise response of f, denoted
x,.,, will be twice x,. We set this distance to be some fraction k of the operator
width.
24

9l
II
Figure 2.2. Responses or difference of boxes and first derivative of Gaussianoperators to a noisy step edge
Xmax -- 2 xzc - kW
This new constraint adds only one term to the composite functional * since
the itegral of f 2 already appears in TF from the localization criterion. While in
th'e original functional this integral appeared in the denominator of a quantity to
be maximized, (i.e. the localization criterion) it now appears in the numerator of
25

the meani distance between maxima, which is a constraint on the solution. It is DOW
no longer clear what the sign of its Lagrange multiplier should be. This leads to
several possible solutions for f as we shall see. The new functional is given by
'l'(z, f, f', f") f X X1f' 2 -X1f2 + X3 f (2.28)
The Euler equation corresponding to a functional of second order is
d d2- ,,+ --2'%Y = 0
When the above it is substituted into the Euler equation we get
I
2f(x) - 2X×f"(x) + 2X 2 f"'(X) + X3 = 0 (2.29)
The solution of this differential equation is the sum of a constant and a set
of four exponentials of the form eZ where -y derives from the solution of the
corresponding homogeneous differential equation. Now
2 - 2X-f 2 + 2X2-y_ - 0
-± i j -- (2.30)7 2X2 k 2X2 , 1
This equation may have roots that are purely imaginary, purely real or complex
depending on the values of ), and X2. From the composite functional %P we can
infer that X2 is positive (since f"2 is to be minimized) but it is not clear what
the sign or magnitude of X, should be. The Euler equation supplies a necessary
condition for the existence of a minimum, but it is not a sufficient condition. By
formulating such a condition we can resolve the ambiguity in the value of X1. To
do this we must consider the second variation of the functional. Let
26

Jjf$ = (x, f, f',f") dx
Then by Taylor's theorem,
Jjf + fg] = Jff] + jJlIf,g) + I 2J2jf + p9, 9)2
where p is some number between 0 and E, and g is chosen from the space of
admissible functions, and where
J1 [f,gJ = L. *I9 + l'jfg' + 'Pf"l dx
j2[IIgl = /f + Pf'f'9'2 + %p","9"F (2.31)
+ 2 1 f pgg' + 24'f p,g'g" + 2 'k'jjgg" dx
Note that J1 is nothing more than the integral of g times the Euler equation
for f (transformed using integration by parts) and will be zero if f satisfies the
Euler equation. We can now define the second variation 62J as
b 2 j- J2 [f,gj12
The necessary condition for a minimum is 62J > 0. We can substitute for the
second partial derivatives of 'P from (2.29) and we get
L0 92 + 1 + X2 x dx > 0 (2.32)
which we transform using integration by parts to
J g2 - X1ggz + X2g z dx > 0
which can be written as
27

2> 2
The integral is guaranteed to be positive if the expression being integrated is
positive for all x, so if
X2 > 1-
4
then the integral will be positive for all x and for arbitrary g, and the extremum
will certainly be minimum. If we refer back to (2.28) we find that this condition
is precisely that which gives complex roots for y, so we have both guaranteed
the existence of a minimum and resolved a possible ambiguity in the form of the
solution. We can now proceed with the derivation and assume four complex roots
of the form y =- ±a ± iw With a, w real, such that
a 2 _ w2 and 4a 2w 2 - - 04 2 (2.33)
2X2 42
The general solution may now be written
f(x) = alea sin wx + a 2ea, coswX + a 3 e- *' sin wX -- a4 e - +coswx + c (2.34)
This function is subject to the boundary conditions
f(0) = 0 f(-W) = 0 f'(0) = s f'(-W) = 0
Where s is an unknown constant equal to the slope of the function f at
the origin. These four boundary conditions enable us to solve for the quantities
al through a4 in terms of the unknown constants a, w, c and s. The boundary
conditions may be rewritten
a2 + a4 + c = 0
28

ale sinw + a2 e* cosw + ae - ' sinw + a4e- a cosw + c 0
alw + a2c + a3w - a4a S
ale(a sin w + w cosw) + a2e0 (a cosw - w sinw)
+a 3 e- a(-a sin + w cosw) + a4e-a(-a cosw - w sin w) =(3 0
These equations are linear in the four unknowns a,, a2, a3, a4 and when solved
they yield
a, c/a(a - a) sin 2w - aw cos 2w + (-2w2 sinh a + 2a 2 e- *) sin
+2aw sinh a cos w + we-2a (C + a) - o'w)/4(W 2 sinh 2 a _a 2 Sin2 W)
a2 = c(a(o - a) cos 2w + -- w sin 2w - 2aw cosh a sin w - 2w2 -,.h a cos w
2we- sinh a + o( - a))/4 sinh
a3 = c(-a(a + a) sin 2w + aw cos 2w + (2w 2 sinh a + 2a 2ea) sin w
+2aw sinh a cos w + we 2 a cr- a) - aw)14 (W2 sinh 2 Cf C2 sin 2 W
a4 = c(-(a + a) cos 2w - aiw sin 2w + 2aw cosh a sinw + 2w2 sinh a cos w
-2W2 e' Sinlh a + af a + or))/4(w2 sinh 2 a, _ a2 sin 2 W(2.36)
where a is the slope s at the origin divided by the constant c. On inspection of
these expressions we can see that a3 can be obtained from al by replacing a by
-a, and similarly for a4 from a2.
29

The function f is now parametrized in terms of the constants ct, w, a and c.
We have still to find the values of these parameters which maximize the quotient
of integrals that forms our composite criterion. To do this we first express each
of the integrals in terms of the constants. Since these integrals are very long
and uninteresting, they are not given here but for the sake of completeness they
are included in Appendix I. We have reduced the problem of optimizing over
an infinite-dimensional space of functions to a non-linear optimization in three
variables a, w and c (as expected, the combined criterion does not depeid on c).
Unfortunately the resulting criterion, which must still satisfy the multiple response
constraint, is probably too complex to be solved analytically, and numerical methods
must be used to provide the final solution.
In fact there is really no best function f for a given W because the shape of f
will depend on the multiple response constraint, i.e. it will depend on how far apart
we force the adjacent responses. Figure (2.3) shows the operators that result from
particular choices of this distance. Recall that there was no single best function for
arbitrary w, but a class of functions which were obtained by scaling a prototype
function by w. We will want to force the responses further apart as the signal to
noise ratio in the image is lowered, and it is not clear what the value of signal
to noise ratio will be for a single operator. However, this design is based on the
use of multiple widths of operator arid on a decision procedure which selects the
smallest operator that has an output signal to noise ratio above a given threshold.
This means that all operators will spend most of their time operating close to
their output E thresholds. We should therefore try to choose a spacing which gives
acceptable multiple response behaviour under these conditions.
A rough estimate for the probability of a spurious maximum in the
neighbourhood of the true maximum can be formed as follows. Recall that maxima
in an operator output correspond to zero-crossings in the derivative of this output.
If we look at the first derivative of the response to an ideal step we find that
it is approximately linear near the centre of the step. There will be only one
zero-crossing if the slope of this response is greater than the slope of the response
to noise only. This latter slope is just the second derivative of the response to noise
30

only, and is a Gaussian random variable with standard deviation
as =
while the slope of the zero-crossing at the centre of the edge is Af'(0). The
probability pmthat the former slope exceeds the latter is given in terms of the
normal distribution function 40
PM - O I (Af(O))\as
We can choose a value for this probability as an acceptable error rate and this
will determine the ratio of f(O) to as. Rearranging we obtain.
AIf'(O)I = (-(1 - P) (2.37)
no Vf 'f" 2 (x) dx
And we can see the explicit dependence of this constraint on the image signal
to noise ratio. We can eliminate this dependence by relating the probability of a
multiple response pm to the probability of falsely marking an edge pf where we
define
P=
and we have finally that
lf'(O)j - k f2 f(x) dx (2.38)
\/ ~ xO() dx f-f2(x) dx
where k is a constant determined by the values or the two probabilities. If we choose
to set pm equal to pf th,.ii the value of k is one. Unfortunately, the largest value of
k that could be obtained using the constrained numerical optimization was about
.58. This corresponds to an inter-maximum spacing of 1.2 (in units of W). This is
31

the final form of linear operator that we will use. It is illustrated in the last of the
series of graphs in figure (2.3). Its performance is given by the product of E and A
and it has the value
F^ = 1.12 (2.39)
Inspection of the shape of this operator in figure (2.3) suggests that it may be
possible to approximate it using a first derivative of a Gaussian G' where
The reason for doing this is that there are very efficient ways to compute the
two dimensional extension of the filter if it can be represented as some derivative
of a Gaussian. This will be discussed in detail in chapter 5. We now compare the
performance of a first derivative of a Gaussian filter with the optimal operator. The
impulse response of the filter is now given by
f(x) --- exp (2.40)
and tae terms in the performance criteria have the values
1If'(o)I = 1
J0f(x)dz = 1
f+ f 2(x) dx =
40y3
32

1.3 11G
0. 91*768"
IA IO
33

f112 (x) dx = 85 (2.41)
The overall performance index for this operator is
EA = _ ; 0.92 (2.40)
While the k value for this filter is, from (2.38)
k F4- _ 0.51
S1-5
The performance of this operator is worse than the optimal operator by about
20%, and its multiple response measure k, is worse by about 10%. It would probably
be difficult to detect a difference of this magnitude by looking at the performance
of the two operators on real images, and because the first derivative of Gaussian
operator can be computed with much less effort in two dimensions (but see section
5.2), it has been used exclusively in experiments. The impulse responses of the two
operators can be compared in figure (2.4).
2.4. Finding an Operator by Stochastic Optimization
The previous section contained the derivation of a "closed form" for an optimal
edge detector for step edges. Even in the derivation of this closed form for the
operator, a numerical optimization was necessary to obtain the coefficients that
appear in its analytic form. We saw that this method required the solution of
very complex simultaneous systems of non-linear equations. It is likely that if the
technique were applied to other problems it would seldom be possible to find closed
form solutions for the operators. However, this does not mean that a useful operator
cannot be derived using these techniques. There are two alternative approaches,
both of which were used in the derivation of the step edge operator, and which can
be applied when the expressions become too complex to be solved.
(i) The first of these was used in the previous section and involves the use of
numerical methods for the determination of some finite number of parameter
34

a
b
4V
Figure 2.4. (a) The optimal step edge operator, (b) The first derivative of aGaussian
values once the solution has been reduced to a parametric form. In fact
even infinite dimensional objects, e.g. the impulse response of a filter, can be
approximated by a finite dimensional discrete filter if appropriate constraints
on the bandwidth (of the infinite filter) are met. All that is required is a
deterministic criterion which can be applied to the parametric form of the
operator and which measures the "goodness" of the operator with respect to
that criterion.
(ii) The second method is necessary when it is not even possible to write down
a closed form for the criterion of optimality. This problem arises when the
image model contains some random component (e.g. Gaussian noise) and it
is then necessary to form criteria that reflect some meaningful statistics on
35

the behaviour of operator on an ensemble of images. Gaussian independent
random processes are particularly easy to analyse, but even with Gaussian
statistics, the closed form criteria for step edges led to very complex solutions.
However, in the further work section of this thesis we will propose a method for
transforming problems that involve certain stationary processes into equivalent
probelms involving only Gaussian independent processes.
In fact in the work leading up to this report, the second method was used successfully
before a closed form solution using the first method was obtained. This is almost
certainly the rule rather than the exception. While at best the stochastic method
leads to an approximate solution, and may not be feasible if the parameter space
is poorly conditioned, it is still felt that it is a useful technique and may guide the
search for an analytic solution.
The stochastic method begins, as did the analytic method, with a model
of the image. Again we consider a step edge with superimposed white Gaussian
noise. We seek a filter f which maximizes some criterion but in this case we
cannot characterize the filter by its (infinite) impulse respore. Instead we consider
a discrete filter i.e. we represent the filter by its impulse response sampled at
positions 0, r, 2r etc. Provided that the bandwidth of the corresponding continuous
impulse response filter is less than the Nyquist frequency, -1, the contlnuous filter
is completely described by its discrete approximation. It turns out that for the step
edge operators, which have small bandwidth, only about 12 samples are necessary.
This was not known before the optimization was done and 32 samples were used
for the discrete filter.
The optimization algorithm is essentially a hill-climbing search over the space
of possible filters. It proceeds by continuously iterating through the following steps
(i) Create a (discrete) noisy edge by adding Gaussian random numbers to the
sampled values of a step edge.
(ii) Convolve the filter with this edge, and evaluate the response.
(iii) Perturb the filter coefficients (sampled values) by a small amount
36
... . i ii I I I I " -- .. .. 4

(iv) Convolve this new filter with the edge, and evaluate the new response.
(v) Change the filter based on the effects of the perturbation in (iii).
Note that this procedure is not guaranteed to lead to a solution even in the
case where the analytic solution space is convex. It differs from deterministic
hill-climbing procedures in that the "hills" (the contours of constant evaluation
in parameter space) are not fixed but vary from iteration to iteration. There is a
random component in any particular evaluation caused by the presence of noise in
the modelled image. We can only say that the limit of the mean of a number of
such evaluations will be the contours that would be obtained from the deterministic
criteria. In fact the magnitude of the changes caused by image variations greatly
overshadowed the magnitude of the changes due to the perturbations in the filter
coefficients. It was therefore important to apply the perturbed and original filters
to the same image.
To see when this method should converge, we assume that there exists a
deterministic evaluation function F over the parameter space, and such that we
can locally estimate the evaluation of an n-tuple of parameters 7 as
El= F()+ r
where r is a random variable from some unknown distribution which models
the effects of the image noise. If we now perturb the filter coefficients by some small
60, we obtain the new evaluation
E 2 = f(P + 6P) + r
assuming that the value of r is constant (the image has not changed) over some
small neighbourhood of P. If we subtract E, from E 2 and divide by f673 we obtain
E2 - El F( + 6) - F() (2.43)
37

Now
lim F( -+ 6P) - F(3) - VF(P) -
where U is a unit vector in the direction of 6P. By using n normal perturbations
6P, with n corresponding unit vectors di and forming the sum
(E 2 -i) Z(VF(P). )ii = VF(P) (2.44)
we have formed an estimate of the gradient of the evaluation function at the
point P in parameter space. Another way of forming an estimate of V P is to use
perturbations which are randomly distributed. By randomly distributed we mean
that each component of 6P is an independent random variable with zero meanand variance a12 Then the expectation value of the perturbation weighted by the
change in evaluation is
E((E2 - E,)SPI = VF(P)a, (2.45)
So we can also achieve an estimate of the gradient of F by making random
perturbations in the filter coefficients and weighting those perturbations by the
change in evaluation. This method provides a more uniform coverage of the
neighbourhood around a single parameter space point than does a particular choice
of orthonormal perturbations. The implementation uses random perturbations and
a short term averaging filter to obtain an estimate of the gradient of F over several
iterations. The filter used has a single pole (i.e. its response to an impulse is an
exponentially decaying sequence), and can be described by the difference equation
(E2j - Ej)6, (2.46)
where 0, is the estimate of the gradient of f at the jth iteration, and the subscripted
quantities E2,, F'j, and 6P, are the values of these quantities at the jth iteration. Pl
is a time constant between 0 and 1, and it determines the "inertia" of the system.
38

The algorithm performs a simple hill-climbing by taking the estimate of the
gradient at each iteration and adding a multiple of it to the current value of P.
However we have (necessarily) added a time constant in the estimator for VF so
that we can obtain a continuously updating estimate while simultaneously climbing
using the existing estimate. We now have a system with both "inertia" from the
average over the previous iterations and a "viscosity" caused by the fact that this
average decays with time (assuming /3 is less than 1). Therefore it is possible for
it to overshoot a minimum, or even to oscillate several times before settling at the
minimum. It was necessary to set the time constant empirically in order to obtain
accurate estimates of gradient without excessive overshoot. The behaviour of the
system is roughly analogous to a ball rolling along a contoured surface under the
influence of gravity, with perfectly viscous drag.
The major reason for resorting to stochastic methods for the optimization was
that the evaluation criterion is a function of a particular response, rather than an
estimate of the behaviour of the filter on a large set of inputs. But the abstract
criteria should be the same. The heuristic criterion should evaluate both the error
rate and the localizing abilW - of the operator. The criterion actually used is
E, 5011- az- dma (2.47)
where nmaz is the number of local maxima that occur in a fixed neighbourhood
of the edge, and dmaz is the distance of the strongest maximum from the centre of
the true edge. Note that the two terms in the expression are "penalty" measures,
hence the two negations.
Figure (2.5) shows the algorithm converging to a solution after the filter has
been initialized to a difference of boxes. In figure (2.6) the initial filter coefficients are
random and independent. It is worth comparing figure (2.5) with figure (2.3), which
showed the best analytic form of the operator for various inter-maximum distances.
It seems that the stochastic method moves through parameter space in such a way
that it passes through several of these analytic optimal forms before reaching a
global extremnum. 'Fhe two methods produce similar solutions even though their
39

criteria are slightly different. This is strong evidence that the form of the optimal
detector is robust with respect to the actual choice of criteria, so long as the criteria
depend on both error rate and localizing ability. We will see further evidence of
this in the work of Shanmugarn et al (1979) in a later chapter.
40
40

4f RPT-HPLF-FBN-32. 5740642'
after 200 iteration~s, perform~ance index is 393
af RPr-HALF-FIX-32 5742642-
after 3300 iteration~s, performance index. is 312
0 RPT-HALF-FIX-32. 5740642
;; After 14120I teratiors, performance index is 204
at
#'RPT-HPLF-FIX-32. 5740642>
A1fter 43500 iterationms, performiance index. is 136
0 APT-HRLF-FIX-32'. 31366670,
After 120,200 terations, per-formiance index is 119
Figure 2.5. Convergence of the stochastic optimization procedure afteriiitialization to a difference of boxes
41

GI
Figure 2.6. Convergence of the stochastic optimization procedure afterinitialization to random values 4
; :] _ /,A , A , Ai A 42

3. Two or More Dimensions
In one dimension we can characterise the step edge in space with one position
coordinate. In two dimensions an edge also has an orientation. In this chapter we
will use the term "edge direction" to mean the direction of the tangent to the
contour that the edge defines in two dimensions. Suppose we wish to detect edges
of a particular orientation. We create a two-dimensional mask for this orientation
by convolving a linear edge detection function aligned normal to the edge direction
with a projection function parallel to the edge direction. A substantial saving in
computational effort is possible if the projection function is a Gaussian with the
same u as the (first derivative of the) Gaussian used as the detection function.
It is possible to create such masks by convolving the image with a symmetric
two-dimensional Gaussian and then differentiating normal to the edge direction. In
fact we do not have to differentiate normal to every possible edge direction because
the slope of R smooth surface in any direction can be determined exactly from its
slope in two directions. The simplest form of the detector uses this method.
After the image has been convolved with a symmetric Gaussian, the edge
direction is estimated from the gradient of the smoothed image intensity surface.
The gradient magnitude is then non-maximum suppressed in that direction. The
directional non-maximum suppression is equivalent to the application of the
following non-linear differential predicate
a2
-G*I = 08nD2
where n = JV! 41, which has the same zero-crossings as
VS.V(VS.VS) = 0 (3.1)
where S = G * I and where I is the image and G is a symmetric Gaussian. This is
readily varified by using the substitution
43

aS =nVS
an Inl
The form of non-linear second derivative operator used in (3.1) turns out to
be the same as that proposed by Havens and Strikwerda (1983), Torre and Poggio
(1983), and Yuille (1983). It also appears in Prewitt (1970) ii the context of edge
enhancement.
This operator actually locates either maxima or minima, by locating the
zero-crossings in the second derivative in the edge direction. In principle this
operator could be used to implement an edge detector in an arbitrary number of
dimensions, by first convolving the image with a symmetric n-dimensional Gaussian.
The convolution with an n-dimensional Gaussian is highly efficient because the
Gaussian is decomposable into n linear filters.
There are other more pressing reasons for using a smooth projection runctI
such as a Gaussian. When we apply a linear operator to a two dimensional image,
we form at every point in the output a weighted sum of some of the input values. Vor
the edge detector described here, this sum will be a difference between local averag,,s
of the different sides of the edge. This output, before non-maximum suppression,
represents a kind of moving average of the image. Ideally we would like to use
an infinite projection functioa, but real edges are of limited extent. It is therefore
necessary to window the projection function (see Hamming 1983). If the window
function is abruptly truncated, e.g. if it is rectangular, the filtered image will not be
smooth because of the very high bandwidth of this window. This result is analogous
to the Gibbs phenomenon in Fourier theory. When non-maximum suppression is
applied these variations will tend to produce edge contours that "wander" or that
in severe cases are not even continuous.
The solution is to use a smooth window function. In signal processing, typical
windows used are the Hamming and Hanning windows. The Gaussian is a reasonable
approximation to both of these, and it certainly has very low bandwidth for a
given spatial width (The Gaussian is the unique function with minimal product
of bandwidth and frequency). The effect of the window function becomes very
44

marked for large operator sizes and it is probably the biggest single reason why
operators with large support were not practical until the work of Marr and
Hildreth on the Laplacian of Gaussian. The perceptive reader will probably see
the similarity between these smoothness constraints in the projection function to
preserve continuity of contours in the edge direction, and the smoothness of the
detection function implied by the addition of the multiple response constraint.
It is worthwhile here to compare the performance of this kind of directional
second derivative operator with the Laplacian. First we note that the two-
dimensional Laplacian can be decomposed into components of second derivative in
two arbitrary orthogonal directions. If we choose to take one of the derivatives in
the direction of principal gradient, we find that the operator output will contain
one contribution that is essentially the same as the operator described above, and
also a contribution that is aligned along the edge direction. This second component
contributes nothing to localization or detection, (the surface is roughly constant in
this direction) but increases the output noise. This will be verified analytically in
chapter 7.
A version of the detector which used the Gaussian convolution followed by
directional non-maximum suppression has been implemented and performed very
well. Examples of its output will be given in chapter 6. While the complete
detector includes multiple operator widths, orientations and aspect ratios, they are
a superset of the operators used in the simple detector. In typical images, most of
the edges are marked by the operators of the smallest width, and most of these by
non-elongated operators. However, as we shall see in the following sections, there
are cases when larger or more directional operators should be used, and that they
offer considerably better performance when they are applicable. The key to making
such a complicated detector produce a coherent output is in the design of effective
decision procedures for choosing between operator outputs at each point in the
image.
3.1. The Need for Multiple Widths
Having determined the optimal shape for the operator,we now face the problem
45

of choosing the width of the operator so as to give the best detection/localization
trade-off in a particular application. In general the signal to noise ratio will be
different for each edge within an image, and so it will be necessary to incorporate
several widths of operator in the scheme. The decision as to which operator to
use must be made dynamically by the algorithm and this requires a local estimate
of the noise energy in the region surrounding the candidate edge. Once the noise
energy is known, the signal to noise ratios of each of the operators will be known. If
we then use a model of the probability distribution of the noise, we can effectively
calculate the probability of a candidate edge being a false edge (for a given edge,
this probability will be different for different operator widths).
Since the a-priori penalty associated with a falsely detected edge is independent
of the edge strength, it is appropriate to threshold the detector outputs on probability
of error rather than on magnitude of response. Once the probability threshold is
set, the minimum acceptable signal to noise ratio is determined. However, there
may be several operators with signal to noise ratios above the threshold, and in this
case the smallest operator should be chosen, since it gives the best localization. We
can afford to be conservative in the setting of the threshold since edges missed by
the smallest operators may be picked up by the larger ones. Effectively the trade-off
between error rate and localization remains, since choosing a high signal to noise
ratio threshold leads to a lower error rate, but will tend to give poorer localization
since fewer edges will be recorded from the smaller operators.
In summary then, the first heuristic for choosing between operator outputs
is that small operator widths should be used whenever they have sufficient E.
This is similar to the selection criterion proposed by Marr and Hildreth (1980)
for choosing between different Laplacian of Gaussian channels. In their case the
argument was based on the observation that the smaller channels have higher
resolution, i.e. there is less possibilty of interference from neighbouring edges. That
argument is also very relevant in the present context, as to date there has been no
consideration of the possibility of more than one edge in a given operator support.
Interestingly, Rosenfeld and Thurston (1971) proposed exactly the opposite criterion
in the choice of operator for edge detection in texture. The argument given was
46

that the larger operators give better averaging and therefore (presumably) better
signal to noise ratio.
Taking this hueristic as a starting point, we need to form a local decision
procedure that will enable us to decide whether to mark one or more edges when
several operators in a neighbourhood are responding. If the operator with the
smallest width responds to an edge and if it has a signal to noise ratio above the
threshold, we should immediately mark an edge at that point. We now face the
problem that there will almost certainly be edges marked by the larger operators,
but that these edges will probably not be exactly coincident with the first edge. A
possible answer to this would be to suppress the outputs of all nearby operators.
This has the undesirable effect of preventing the large channels from responding to
"fuzzy" edges that are superimposed on the sharp edge.
Instead we use a "feature synthesis" approach. We begin by marking all
the edges from the smallest operators. Frorm these edges, we synth, size the large
operator outputs than would have been produced if these were the only edges in the
image. We then compare the actual operator outputs to the synthetic outputs. We
mark additional edges only if the large operator has significantly greater response
that what we would predict from the synthetic output. The simplest way to produce
the synthetic outputs is to take the edges marked by a small operator in a particular
direction, and convolve with a Gaussian normal to the edge direction for this
operator. The a of this Gaussian should be the same as the a of the large channel
detection filter.
This procedure can be applied repeatedly to first mark the edges from the
second smallest scale that were not marked by at the first, and then to find the
edges from the third scale that were not marked by either of the first two etc.
Thus we build up a cumulative edge map by adding those edges at each scale that
were not. marked by smaller scales. It turns out that in many cases the majority
of edges will be picked up by the smallest channel, and the later channels mark
mostly shadow and shading edges, or edges between textured regions.
47.1ilfflo.

3.2. The Need for Directional Operators
So far we have assumed that the projection function is a Gaussian with the
same a as the Gaussian used for the detection function. In fact both the detection
and localization of the operator improve as the length of the projection function
increases. We now prove this for the operator signal to noise ratio. The proof for
localization is similar. We will consider a step edge in the x direction which passes
through the origin. This edge can be represented by the equation
l(x,y) = Au-i(y)
where u - is the unit step function, and A is the amplitude of the edge as before.
Sujppose that, there is additive Gaussian noise of mean squared value ng0 per unit
area. If we convolve this signal with a filter whose impulse response is f(x, y), then
the response to the edge (at the origin) is
J J /+,f(X,y) dxdy
The root mean squared response to the noise only is
noo +-j + 0J f 2(x, y) dx dy)i
The signal to noise ratio is the quotient of these two integrals, and will be
denoted by E. We have already seen what happens if we scale the function normal
to the edge (equation 2.13). We now do the same to the projection function by
replacing f(x,y) by f(x, Y). The integrals become
f (,Y) d dy f(Z, ,) I d dy
no°(+00J+OD f2(x, Y) dx dy) - nao(!-+ 0f +00 f2(X, yI) I dx dy,)'
48

And the ratio of the two is now /IE. The localization A also improves as
Vl. It is clearly desirable that we use as large a projection function as possible.
There are obviously practical limitations on this, in particular all edges in an image
are of limited extent, and few are perfectly linear. However, most edges continue
for some distance, in fact much further than the 3 or 4 pixel supports of most
edge operators. Even curved edges can be approximated by linear segments at a
small enough scale. Considering the advantages, it is obviously preferable to use
the directional operators whenever they are applicable. The only proviso is that
the detection scheme must ensure that they are used only when the image fits a
linear edge model.
The present algorithm tests for applicability of each directional mask by
forming a goodness of fit estimate. It does this at the same time as the mask itself
is computed. An efficient way of forming long directional masks is to sample the
output of non-elongated masks with the same direction. This output is sampled at
regular intervals in a line parallel to the edge direction. If the samples are close
together (less than 2c apart), the resulting mask is essentially flat over most of its
range in the edge direction and falls smoothly off to zero at its ends. Two cross
sections of such a mask are shown in figure (3.1). In this diagram (as in the present
implementation) there are five samples over the operator support.
Simultaneously with the computation of the mask, it is possible to establish
goodness of fit by a simple squared-error measure. Since the quantity being estimated
to produce the mask is the average of some number of values, the sq,iared error is
just the variance of these values. We then eliminate those operator outputs whose
variance is greater than some fraction of the squared output. Where no directional
operator has sufficient goodness of fit at a point, the algorithm will test the outputs
of less directional operators. This simple goodness of fit measure is sufficient to
eliminate the problems that traditionally plague directional operators, such as false
responses to highly curved edges and extension of edges beyond corners, see lildreth
(1980).
This particular form of projection function, that is a function with constant
value over some range which decays to zero at each end with two roughly half-
49

?a
5b" tkO ART -MV -M.60400 --*M" It 81.0
C
Figure 3.1. Directional step edge mask (a) Cross section parallel to the edgedirection, (b) Cross section normal to edge direction (c) Two-dimensional impulseresponses of several masks.
Gaussians, is very similar to a commonly used extension of the Hanning window.
This latter function is flat for some distance and decays to zero at each end with
two half-cosine bells (Blingham, Godfrey and Tukey 1967). We can therefore expect
it to have good properties as a moving average estimator, which as we saw at He
start of the chapter, is an important role fulfilled by the projection function.
All that remains to be done in the design of directional operators is the
specib . tion of the number of directions, or equivalently the angle between two
50

adjacent directions. To determine the latter, we need to determine the angular
selectivity of a directional operator as a function of the angle 0 between the edge
direction and the preferred direction of the operator. Assume that we form the
operator by taking an odd number 2N + I of samples. Let the number of a sample
be n where n is in the range -N ... +N. Recall that the directional operator
is formed by convolving with a symmetric Gaussian, differentiating normal to the
preferred edge direction of the operator, and then sampling along the preferred
direction. The differentiated surface will be a ridge which makes an angle 0 to the
preferred edge direction. Its height will vary as cosO, and the distance of the nth
samph, from the centre of the ridge will be nd sin 0 where d is the distance between
samples. The normalized output will be
Cos 0__ N (nd sino20,os (0) exp - -- -- i
1O-2N 1 n=-N 2G 2
If there are m operator directions, then the angle between the preferred
directions of two adjacent operators will be 180/m. The worst case angle between
an edge and the nearest, preferred operator direction is therefore 90/m. In the
current implementation the value of d/u is about 1.4 and there are 6 operator
directions. The worst case for 0 is 15 degrees, and for this case the operator output
will fall to about 85% of its maximum value.
3.3. Noise Estimation
To estimate noise from an operator output, we need to be able to separate its
response to noise from the response due to step edges. Since the performance of
the system will be critically dependent on the accuracy of this estimate, it should
also be formulated as an optimization. Wiener filtering is a method for optimally
estimating one component of a two-component signal, and can be used to advantage
in this application. It requires knowledge of the autocorrelation functions of the
two components and of the combined signal. Once the noise component has been
optimally separated, it. is squared and locally averaged. In fact Ne can further
improve the separation in the smoothing phase, since when we use the noise estimate
we will be comparinig it. to the response of the edge 'tection operator at a local
51

maximum. We know that there is an edge near the centre of the detection operator,
and that this edge will be producing a known response in the noise separation filter
(the noise separation will not be perfect). We can use the positional correspondence
of the two responses to make the local averaging filter orthogonal to the output
due to a step edge at its centre. Ideally it should give zero output at the centre of
an edge when there is no noise present.
Let gl(x) be signal we are trying to detect (in this case the noise output),
and g2(z) be some disturbance (the edge response), then denote the autocorrelation
function of gi as R 1 1(r) and that of g2 as R 22 (r), and their cross-correlation as
R 12 (r), where the correlation of two real functions is defined as follows
Rij (r) = J-0gx)g(x +r) dx
We assume in this case that the signal and disturbance are uncorrelated, so
R1 2 (r) = 0. The optimal filter is K(z) where K is defined as follows (Wiener 1949)
R 11 (r) = f_0 (Rll(r - x) + R 22 (r - x))K(x) dx
Since the autocorrelation of the output of a filter in response to white noise is
equal to the autocorrelation of its impulse response, we have
Rii(x) = k3 2 )exp(- 2 )
If g is the response of the operator derived in (2.38) to a step edge then we
will have g2(x) = k exp( - )
R22(X) =k 2 exp( X2
In the case where the amplitude of the edge ic large compared to the noise,
R22 - R1 1 is approximately a Gaussian and R11 is the second derivative of a
Gaussian of the same a. Then the optimal form of K is the second derivative of a
delta function.
52

'[he filter K above is convolved with the output of the edge detection operator
and the result is squared. The next step is the local averaging of the squared noise
values. The averaging filter is basically a broad Gaussian, but its accuracy can be
improved in this application by orthogonalizing it to the step edge response. Let
the averaging filter be expressed as AI(x) - A2 (X) where
Ai(x) = a1 exp( 2-- )
A 2 (x) a2 eXP( 7)
and the o in the expression for A 2 is the same as for the detection filter.
(Actually, the optimal shape for A 2 is the square of the second derivative of a
Gaussian, but the use of this function makes the scheme very sensitive to small
variations in the position of the detection filter maximum). The constants a, anda2 are chosen so that the net response to the squared filtered step response is zero,
i.e.
f+(A( -x) + A2(-))(- - ) 2exp(- X2dz = 0
Having formed an estimate of the local noise energy at every point, we can
now deal with the problem of setting operator thresholds to achieve minimal error
rate. This is the subject of the next section.
3.4. Thresholding with Hysteresis
Virtually all edge detection schemes to date use some form of thresholding.
If the thresholds are not fixed a priori but are determined in some manner by
the algorithm, the detector is said to employ adaptive thresholding. The solitary
exception is the Marr llildreth scheme, where edges are marked at any zero-crossing
in the output of a Laplacian of Gaussian filter. This is not a practical proposition
because there is a very high density of zero-crossings in the response to pure noise
even if the noise has vanishing energy. Most practical implementations of this
scheme use thresholding based on the slope of the zero-crossing.
53

The present algorithm sets tharesholds based on local estimates of image noise
and therefore falls into the class of adaptive thresholding algorithms. It has the
additional complexity that it makes use of two thresholds to deal with the problem
of streaking. Streaking is the breaking up of an edge contour caused by the operator
output fluctuating above and below the threshold along the length of the contour.
Suppose we have a single threshold set at Ath, and that there is an edge in the
image such that an operator responds to it with mean output amplitude of Ath.
There will be some fluctuation of the output amplitude due to noise, even if the
noise is very slight. We expect the contour to be above threshold only about half
the time. This leads to a broken edge contour. While this is a pathological case,
streaking is a very common problem with thresholded edge detectors. It is very
difficult to set such a threshold so that there is small probability of marking noise
edges while retaining high sensitivity. An example of the effect of threholding with
hysteresis is given in figure (3.2).
One possible solution to this problem, used by Pentland (1982) with Marr-
Hildreth zero-crossings, is to average the amplitude of a contour over part of its
length. If the average is above the threshold, the entire segment is marked. If the
average is below threshold, no part of the contour appears in the output. The
contour is segmented by breaking it at maxima in curvature. This segementation ;.s
necessary in the case of zero-crossings since the zero-crossings always form closed
contours, which obviously do not always correspond to contours in the image.
In the current algorithm, no attempt is made to pre-segment contours. Instead
the thresholding is done with hysteresis. If any part of a contour is above a high
threshold, that point is immediately output, as is the entire connected segment of
the contour which contains the point and which lies above a low threshold. The
probability of streaking is greatly reduced because for a contour to be broken it
must now fluctuate above the high threshold and below the low threshold. Also
the probability of false edges is reduced because the high threshold can be raised
without risking streaking. The ratio of the high to low threshold is usually in the
range two or three to one.
54

I -kot
v
* D 0 0 0 .0
Figure 3.2a. Image thresholded at Th,

:0
.0
Figure 3.2b. Image thresholded at 2 Th,
56

-k
14
•@,.., (j .- o.
Figure 3.2c. Image thresholded using both the thresholds in figures 3.2a and3.2b
57

3.5. Sensitivity to Smooth Gradients
It has been pointed out in Binford-Horn (1973) that images frequently contain
slow gradients, and that edge detectors which are sensitive to these gradients are
prone to mark multiple edges in regions where the gradient is high. The edge operator
derived in the last chapter will be sensitive to image gradients and we should now
ask if it is possible to eliminate this sensitivity without prejudicing performance.
One possibility would be to use an operator which is a linear combination of
two different widths of the optimal operator, such that the resulting operator is
insensitive to gradients. Suppose the function f is given by
X exp -- exp(-z'f~x W -o (2r o 3 "2A
01 2 o 2
Then we find that
J0 x f(x) dx = v -- /7 = 0
So this function will certainly be insensitive to gradients, and its performance
will be given by equation (2.12). The signal to noise ratio and localization are now
A = ~ ~ ~ + 4(Cr2 +I 8or2) + 4 3- )24Vge~2a,' 2 1 2 O2 - 3 32
2 + 2 4 + oo + 31 4 +27r ) -
Viio-la2r2--i2 + c2(3o' + 6ala 2 -+r 3oala +q 3a'o"2 1 6a 2 2 1a) 24 ~a
Asymptotically as a2 tends to infinity, the above expressions tend to thelimiting values
S 2ufand A 4
580-rao

Which gives the same overall performance as a simple first derivative of
Gaussian as given by equation (2.40). In practice a value of G2 of around 3a, is used
to reduce the computational expense and to prevent the operator becoming too
sensitive to nearby edges because of its large support. The overall performance EA
is reduced by about 30% in this case. Note also that as O"2 approaclics al we obtain
a third derivative of a Gaussian, which is similar to the operator sometimes used
to estimate the strengths of Marr-Hildreth zero-crossings. But the performance is
reduced in this case, as will be shown in chapter 7.
The fact that f is insensitive to gradients implies that f may be expressed as
the derivative of a function g which has zero mean value, and which is symmetric
because f is antisymmetric. A symmetric function g with zero mean value may be
thought of as a lateral inhibition operator as described by Binford (1981). Lateral
inhibition was proposed as a mechanism for reducing sensitivity to gradients. But
the form of the lateral inhibition operator was not determined analytically when
in fact it has a direct effect on the performance.
59

4. Finding Lines and Other Features
Chapters two and three described in some detail the derivation of an optimal
operator for step edges in Gaussian noise. The derivation of the analytic form of
this operator was rather tedious and in the end, we arrived at a parametric form
and had to resort to numerical methods to find the best values for the parameters.
The alternative method of finding an operator was by a brute force stochastic
optimization which did not even use an analytic expression for the criteria of
optimality. The latter method was simpler to implement, but took much longer to
arrive at a solution. It is in theory more general, because to find an operator for a
different input waveform, only its edge model has to be be changed. This has not
been tried, and the time expenditure necessary to modify the stochastic optimizer
and arrive at a solution did not seem justified.
It would be very useful if there were a more general method which gave a fast
solution and was simple to adapt to new waveforms. There are several reasons for
considering optimal detectors for other features. Firstly, it has been pointed out
(Herskovits and Binford 1970, Marr 1976) that step edges are not the only kind of
intensity change that occur and are important. In particular they mention "roof"
and "bar" profiles as being common in real images. Each of these poses a new
problem in finding an optimal detector.
Even if we are considering step edge profiles, a strong case can be made for
the use of non-white Gaussian noise models. We can remove the spectral flatness
constraint and still use the same design technique as long as the noise can be
modelled as the output of some filter in response to white Gaussian noise. In fact
if we know the autocorrelation of the random process, it is possible to derive a
causal filter (linear predictor) which has the same autocorrelation. By applying the
inverse of this filter to the noisy waveform to be detected, we obtain a different
waveform, but it is now bathed in white Gaussian noise. We can apply the same
design techniques to this new waveform, and the optimal detector for the original
waveform is the convolution of the detector for the filtered waveform and the inverse
noise filter. So we have mapped the problem of finding step edges in non-white
Gaussian noise to that. of finding other edge profiles in white noise.
60

4.1. General Forin for the Criteria
When we derived the analytic criteria for step edges in chapter 2, there were
only two places where the form of the input waveform actually affected the criteria.
By inserting a general feature in place of the step edge we can readily obtain a
general criterion. Recall that the definition of the signal to noise ratio E was the
quotient of the responses of the operator to the input waveform and to noise only.
The response to noise for an operator with impulse response f(x) will be given by
equation (2.4), and is
[o1+00! f2(x) dx]
The response of this operator at the "centre" of an arbitrary waveform F(x) is
similar to equation (2.3) and is just
00i F(-x)f (x) dx
So the signal to noise ratio for f and any feature F is (assuming no 1)
£ f1 F(-x)f(x) dx (4.1)f ±f- 12(x) dx
The method for determining the localization of the operator is also similar to
that used in chapter 2, and we will not describe it fully here. Recall that localization
was defined as the reciprocal of the standard deviation in the position of the marked
edge relative to the true edge. To find maxima in the operator response we actually
locate zero-crossings in the derivative of its response. Localization was defined as
the quotient of the slope of the zero-crossing and the root mean squared noise in
the differentiated response. The latter is given by equation (2.7) and has the value
no f ..... i(z) dx]-
61

The slope of the differentiated operator reponse is
d' J_ F(xo - x)f (x) dx f = (x.~)dd0xo XOo 0 0
And so the localization A becomes (assuming no -- 1)
A = F(-x)f"(x) dx (4.2)+00~t f12(X) dX
The final form of the composite criterion can now be written as the product of (4.1)
and (4.2) thus
f+ F(-x)f(x) dx f o F(-x)f"(x) dx (43)Vr+ Vdf O/s -f,2,()df/+~ f2(x) dx f '(x) d.T
Thus finding an arbitrary feature detector requires the maximization of this
functional, subject possibly to some subsidiary constraints such as the multiple
response constraint (2.25). This is difficult in general, even if the feature F is
particularly simple, like a step edge. However the form of the functional (4.3) is
simple enough that given a candidate feature detector we can readily evaluate its
performance analytically. If the operator impulse response f and the feature F
are both represented as sampled sequences, evaluation of (4.3) requires only the
calculation of four inner products between sequences.
This suggests that numerical optimization can be done directly on the sampled
operator impulse response. This method can be expected to be much faster than
the stochastic optimization since the evaluation of performance is exact, and the
gradient at each point in function space can be accurately estimated. At the same
time it is very general in that optimization for any waveform only requires a sampled
version of the waveform.
The output will not be an analytic form for the operator, but an implementation
of a detector for the feature of interest will require discrete point-spread functions
anyway. It is also possible to add additional subsidiary constraints by using a pcnalty
62

method (see Luenberger 1973). In this method the constrained optimization is
reduced to one (or possibly several) unconstrained optimizat ion. For each constraint
we define a penalty function which has a non-zero value when one of the constraints
is violated. We then find the maximum of
E(f)A(f) - p,P(f)
Where P is a function which has a positive value only when a constraint is
violated. The larger the value of pi the greater the likelihood that the constraints
will be satisfied, but at the same time there is a better chance that the method will
become ill-conditioned. A sequence of values of pi may need to be used, with the
final value from each optimization used as tl.e starting value for the next. The pi
are increased at each iteration so that the value of P(f) will be reduced, until the
constraints are "almost" satisfied.
An example of the method applied to the problem of detecting "ridge" profiles
is shown in figure (4.1). The function F for a ridge is defined to be a flat plateau
of width w, with step transitions to zero at the ends. The auxiliary constraints are
(i) The multiple response constraint. This constraint is taken directly from equation
(2.25), since it does not depend on the form of the feature.
(ii) The operator should have zero DC component. That is it should have zero
output to constant input.
Since the optimal operatbr for r~dges is also symmetric, it will have zero
response to a constant gradient. This means that it can be represented as the second
derivative of a function of finite extent, which in turn suggests that there may be
economical ways of computing operators for several orientations in two dimensions.
The figure shows two different operators derived for the same feature. The two
operators differ in the size of their possible support. The second is constrained to
lie within a region twice the width of the ridge, while the second has a support
three times the ridge width. The performance of the second operator is very slightly
worse than the first. However the fact that it requires a smaller support means that
63

Figure 4.1. A ridge profile and the optimal operator for it
it is likely to be less susceptible to interference from adjacent featu:es. This aspect
of performance depends strongly on the width of the support, but performance in
other respects does not. We therefore choose the operator support to be three times
the ridge width, since at this width there will be no interference if the distance
between ridges equals the ridge width, i.e. if the ridges and valleys have the same
width.
Since the width of the operator is determined directly by the w0id'of the
ridge, there is a suggestion that several widths of operators should be used. This has
not been done in the present implementation however. With this ridge model a wide
ridge can be considered to be two closely spaced edges, and the implementation
already includes detectors for these The only reason for using a ridge detector is
that there are ridges in images that are too small to be dealt with effectively by the
64
Law

wOO
-ine
Figure 4.2. A roof profile and an optimal operator for roofs
narrowest edge operator. These occur frequently because there are many features
(e.g. scratches and cracks or printed matter) which result in discrete contours only
a few pixels wide.
A similar procedure was used to find an optimal operator for roof edges. These
features typically occur at the concave junctions of two planar faces of an object.
The results are shown in figure (4.2). Again there are two subsidiary constraints,
one for multiple responses and one for zero response to constant input. Note that
the difference between the two operators is essentially their "resemblance" to their
respective inputs. We would expect this from the theory of Wiener filtering. The
optimal Wiener filter for a signal in white Gaussian noise is just the time-reversed
signal. Wiener filtering considers only signal to noise ratio however, and the
localization and multiple response criteria impose effective smoothness constraints
65

on the operator.
A roof edge detector has not been incorporated into the current edge detector
because it was found that ideal roof edges were relatively rare. In any case the ridge
detector is an approximation to the ideal roof detector, and is adequate to cope
with them. The situation may be different in the case of an edge detector designed
explicitly to deal with images of polyhedra, like the Binford-1lorn line-finder (1971).
Here several width of roof operator may be desirable to deal with different signal
to noise ratios in the image.
The method described above has been used to find optimal operators for both
ridge and roof profiles and in addition it successfully finds the optimal step edge
operator derived in chapter 2. It should be possible to use it to find operators for
arbitrary features, and for optimal step operators to deal with non-white noise. For
example, the problem of detecting step edges in "blue" noise (uncorrelated noise
that has been passed through a perfect differentiator) reduces to the problem of
detecting roof edges in white noise. So the optimal detector for step edges in this
case is the derivative of an optimal roof operator. Note that it is not the same roof
operator which we derived here because the latter includes the zero DC response
constraint, which does not translate to something useful for the step operator.
4.2. In Two Dimensions
We now face the problem of extending the one-dimensional ridge operator
to two dimensions. As in the case with step edges, the extension is an operator
composed of a detection function normal to the ridge direction and a projection
function parallel to it. As before we non-maximum suppress the output of the
convolution of the image with this mask normal to the edge direction. The maximal
points can then be thresholded (with hysteresis) and the marked ridge contours can
be combined with the edge map.
In the case of ridges however it is much harder to obtain an accurate estimate
of the ridge direction. There is no simple measure like the gradient direction which
aligns with the normal. While it is true that the larger principal curvature will be
normal to the ridge direction, this is a much less reliable quantity to measure from
66

even a smoothed image. Remember that the ridge detector will be operating below
the resolution of the smallest step edge operator, so the degree of smoothing will
be slight. This suggests that it will be necessary to use several oriented masks at
each point and to choose the one which best fits the ridge locally. This has been
found to be an inadequate solution because it performs so poorly when the ridge is
highly curved, as is generally the case for printed text. While the highly directional
masks have advantages for long straight ridges, they are not adequate as general
ridge detectors.
In practice a measure similar to the curvature must be used. The direction of
principal curvature cannot be used directly, and not merely because it is a noisy
measure. The peak of a ridge should be approximately flat in the ridge direction
but highly curved normal to this direction. But there are points on the sides of
the ridge that are approximately planar. Here the direction of greatest curvature
will be arbitrary. It is quite possible that it will happen to be parallel to the ridge
direction and that there may be a slight maximum in this direction, and hence a
ridge point will be marked.
To prevent these erroneous points from being marked it is necessary to modify
the ridge direction estimate so that it takes into account the slope of the ridge
normal to the direction of greatest curvature. This slope will be approximately zero
if the point is at the top of the ridge, but for points on the side of the ridge where
the greatest curvature may lie parallel to the ridge direction, the slope normal to
this direction (which is the slope of the ridge face at that point) is large. So instead
of non-maximum suppressing in the direction of maximum curvature, we use the
direction n which maximizes
where n - is the normal to n, and a is some positive constant.
So in regions of low c'-irvature, the above measure chooses a direction in which
the slope is large, which is the correct behaviour for points on the sides of a ridge.
This method has been used and seems to behave quite well even on difficult ridge
67

data e.g. finely printed text, An example of its performance on some text images
is given in chapter 6.
A second problem with using non-maximum suppression with the ridge operator
is that its response to an ideal ridge has two side lobes of opposite sign to its main
peak. These will lead to negative ridges or valleys being marked on either side of a
true ridge, and vice-versa. In fact there will also be maxima in the ridge detector
output on either side of a step edge, and clearly these points should not be marked
as ridges. We are starting to run into the problem of integrating descriptions of
different features, which is much more difficult than the integration of data about
the same kind of feature from different operators. Typical features in an image will
lead to responses from several different kind of feature detector, and some decision
must be made as to which feature best represents the image.
The question of feature integration was addressed in some detail by Marr
(1976) who stressed the importance of producing a single coherent representation
of intensity changes called the "Primal Sketch". This incorporated descriptions of
several kinds of feature including edges and wide and thin bars. the development
of effective algorithms for the combination of arbitrary features was not carried
very far by Marr, who rather applied a selection criterion to the feature detector
outputs at each point. In practice the responses of two feature detectors may not
be exactly coincident in space, and it is not clear how the selection criterion is
to be modified. In cases like these surface fitting is a useful technique as in the
"topographic primal sketch" of Haralick (1983). Here each possible interpretation
has associated with it an error measure that mirrors the difference between the true
image and the modelled surface. The best feature to describe each image point is
the one with lowest error.
The problem of integrating the ridge description with the edge detector output
has not been satisfactorily solved to the present time. A generalization of the
fcature synthesis approach described in section 3.1 has been implemented and gives
acceptable results on some images, but is not robust enough to be used generally.
In the case of comibination of operator outputs, preference was always given to the
smaller operators, and the feature synthesis always proceeded in one direction. For
68

merging feature descriptions, where there is no a priori reason to prefer one feature
to another, it should be symmetric.
For example, suppose a ridge detector and a step edge detector both respond
to a feature that is roughly a step edge. From the edge points maiked by the
edge detector, we synthesize the ridge detector output that would have occurred
had the image actually contained a step edge. Then the ridge detector output is
compared with the synthetic output and if it is not significantly greater, no ridge
point will be marked. Similarly from the ridge detector output, we reconstruct the
edge detector output that would have occurred if the ridge detector accurately
described the image. The edge detector output will (in this example) be much
stronger than the synthesized output and so an edge point will be marked. This
method has the advantage that it is possible to mark the occurrence of more than
one type of feature at a point in an image. It has been found that such points do
occur in images (Ilerskovits and Binford 1970) in particular roof edges are often
superimposed on step changes and "edge effects" which are similar to ridges also
often accompany step changes.
It is necessary to consider ridges and valleys as different features as the detector
may output both kinds of interpretation near a single feature in the image. Some
form of integration technique such as feature synthesis or goodness of fit testing
must be used. This has not been done in the present implementation, which only
integrates one of these features with the step edge map. This is one area where a
lot of work still remains to be done, and several feature integration techniques need
to be tried.
69

5. Implemetation Details
The ultimate test of any edge detector is its performance in some application
on real images. The translation of a derived operator into a program is non-trivial.
While the running version of the program is actually very small, it is still the result
of much refinement. The refinements are as much a part of the design of the edge
detector as is the theoretical analysis presented in the first four chapters. It is
not the intent of this chapter to describe any such program. It will describe in an
abstract way several algorithms for implementing some of the processing required
by the edge detector. The author feels that this is necessary for several reasons
(i) Since the edge detector involves a considerable amount of computation, especially
convolution, it is important that efficient algorithms be used if it is to run in
a reasonable amount of time.I(ii) Because images may contain very fine detail it is important that local operations
involve the minimum number of pixels, but provide the best accuracy from
them. This applies in particular to operations such as the calculation of
directional derivatives and non-maximum suppression.
(iii) Edge detectors are not vision programs. The implementor should bear in mind
that the detector is only the first stage in a much larger system, and should
give consideration to the choice of representation of its output.
This chapter will not describe in detail all the aspects of the present edge
detection scheme, in fact some of the algorithms presented do not even form part
of the scheme, but may be used in future implementions. Instead it will focus
on two or three of the more critical aspects of the implementation, in particular
on efficient methods for convolution with Gaussians, and on the details of the
non-maximum suppression scheme. It will close with details of a control abstraction
for the programming of local parallel operations which are used extensively by the
scheme.
70

5.1. Efferts of Discretization
All of the analysis to date has assumed that the image was a continuous
differentiable surface and that the edge operators were likewise continuous functions.
Since most implementations of the detector on digital computers will employ
discrete filters applied to sampled image data, it is necessary to find accurate
discrete approximations to the continuous filters. It is also important to consider
the effect, of the smoothing filter (if any) which was applied to the image before it
was sampled. Smoothing filters are necessary to prevent aliasing of high frequency
components in the sampled signal. Suppose an image is smoothed, sampled and
convolved with a discrete filter. By the associativity of convolution, this is equivalent
to convolving the image with a filter that is the result of the convolution of the
smoothing filter and the discrete filter. If the image can be smoothed with a
Gaussian smoothing function, no convolution is necessary at that scale.
The simplest way to approximate a continuous filter with a discrete filter is to
sample the former. If this method is to succeed, we must ensure that the sampling
does not introduce aliasing. Consider a continuous first derivative of Gaussian filter
of the form
f(x) = -- exp( Z)
Suppose that the image is sampled at intervals of r, (the filter must also be
sampled at this rate for discrete convolution) then the Nyquist frequency is 1. The
effective bandwidth of the filter should be less than half this frequency to prevent
aliasing. The Fourier transform of this filter is
F(w) = vriiwexp( - W2 2
The cutoff frequency is I, and substituting we find that the amplitude at cutoff is
,2- i - exp( r2
71

'rhis function never reaches zero amplitude for large w, but it does approach
zero very rapidly. We can set the effective cutoff frequency at the point where this
function falls to 0.01 of its maximum value. This limits the smallest value of a that
we can use for a given sampling rate. The minimum value of a is approximately r.
This is in fact the smallest operator size used in the present implementation.
A second problem arises when we try to approximate infinite Gaussians with
finite impulse response filters. Once again we can exploit the fact that the Guassian
decays to zero very rapidly in the spatial domain. In the current implementation,
the Gaussian is truncated at about 0.001 of its peak value. This constrains the
ratio of the number of samples in the (discrete) impulse response to the width a of
the filter. This ratio is typically 8, e.g. to approximate a filter with a a of 2.0 it is
necessary to use at least 16 samples.
Finally, it should be mentioned that it is sometimes possible to dispense with
the convolution step entirely. If the desired value of a is much less than r, discrete
convolution is not practical. However, an equivalent convolution may be performed
with a continuous filter (the smoothing filter) before the image is sampled. Since
in theory the smoothing step is necessary anyway, no extra computational effort is
required. We find in fact that the smoothing function is determining the performance
of the subsequent edge detector, and the use of Gaussian smoothing should give
near optimal step edge detection.
5.2. Gaussian Convolutions
It is perhaps surprising to see an entire section devoted to what seems
a very straightforward and specific computation. However, there are several
interesting properties of the two-dimensional Gaussian that suggest fast algorithms
for convolution. In particular, the central limit theorem implies that repeated
convolution with any finite filter tends in the limit to a Gaussian convolution. We
begin with a review of discrete convolution.
5.2.1. Discrete Two-Dimensional Convolution
The output of the convolution of a discrete image I(n, m) with a two-dimensional
filter f(i, j) is given by the double summation
72

L M
O(n,m)= I(n-i,m-j)(i,j)
assuming that the filter f has the same size M in both dimensions. This method
requires M 2 multiplications and slightly fewer additions for each output point
computed. It is a general r ethod and will work with any two-dimensional finite
impulse response filter.
5.2.2. Convolution using One-Dimensional Decomposition
We now consider a more specialized form of convolution which is applicable to
a limited subclass of two-dimensional filters. The subclass is the class of separable
two-dimensional filters. This class is characterized by the decomposition of their
impulse responses into independent linear filters
If (i, j) --- fMi, 0) * My0, j)
where the * denotes convolution, and the filters f and fV have only M non-zero
components. By using the associativity of convolution, we break the convolution of
an image with the two-dimensional filter into two convolutions with linear filters
I * f = I * [f" * fy,] =[I *f.]*fV
This method requires only 2M multiplications and about the same number of
additions per point. For large operator sizes (values of M of 64 are common) this
method is substantially faster than the naive method, but is limited to separable
filters. The number of useful members of this class is actually quite small, and
the Gaussian is in fact the only two-dimensional symmetric function which can
be decomposed in this way. Other useful separable functions include the first
directional derivatives of the Gaussian in the z and y directions.
5.2.3. Recursive Filterring
So far we have been approximating the infinite Gaussian function with finite
impulse response filters. It seems that the approximation could be more accurate
73

if we were to use infinite impulse response (recursive) filters instead. We can again
make use of the separability of the two-dimensional Gaussian, and can therefore
reduce the filter design problem to that of designing a one-dimensional filter
which approximates a Gaussian. The infinite impulse response (IIR) filter can be
characterized by the equation
z Py(n) =1 aix(n - i) + 1 bjy(n - j) (5.2)
i=O 1
where x(n) and y(n) are the input and output respectively at the n th point. This
filter is roughly equivalent to a continuous filter having P poles and Z zeros. The
positions of the poles are determined by the coefficients b, while the zeros are
determined by the ai.
The immediate drawback of using such a filter to approximate a Gaussian is
that the filter is infinite "in one direction only", and that the Gaussian has an
impulse response that extends to infinity in both directions. The solutioi to this
problem is illustrated in figure (5.1). We employ two recursive filters moving in
opposite directions, each of which has an impulse response which is approximately
a half-Gaussian. We then sum the two responses (and subtract a component at
the centre point which is doubled) and are left with a first approximation to the
symmetric Gaussian. We can if we wish repeat this process on the filtered image
and (by the central limit theorem) we will obtain a very close approximation to the
Gaussian, as shown in the last frame of figure (5.1).
The half-Gaussian is approximated by a damped exponential cosine, which
requires two poles and two zeros in the recursive filter. The b coefficients are derived
by considering four discrete output values near a zero-crossing of the response. We
choose the values to be
exp(ar) sin(-wr) 0 exp(-ar) sin(wr) exp(-2ar) sin(2wr)
Application of equation (5.2) to the first three and last three values gives two
equations each of which involves only one of the bi,and the solution is
74

IN
U GA . e . . . . . .s . . . e . .a . . . . . ... . .. .. .e .W .W .W J. . . . .
Fiur 5.1. (a an (h Reusv .afG usa f.tr moin fro lef to right ....... .......an fro rih to lef repcie. (c .u o. thse (d Reul of tw applicatio...ns ... ... ... ...of re usv fite an (e Tru .Gaus.ian . ..........................
b . . . . . . . . . . . . . . . . . . . . . . .
.. . . .. . .. . . ..7. ..5

bl = 2 exp(ar) cos(wr) b2 - exp(2ar)
where a and w are the decay constant and angular frequency respectively, of the
damped exponential cosine response. Typical values for a and w are
1w = 0.8a (5.3)
where a is the standard deviation of the equivalent Gaussian. The ai determine
the gain of the filter and its first derivative at the origin. For unit gain and best
approximation to the slope of a Gaussian we use
a0 = 1.0 al = exp(-2) -- bi (5.4)
The interesting feature of this method is that its complexity is independent
of o. In fact for a single pass approximation, it requires only 12 multiplications
and additions per point (3 each for filtering in four directions). It also requires an
extremely small number of array references, and the number may be reduced even
further by saving previous x and y values in registers (only three are needed). It is
possible to implement the algorithm using only 4 references per point. In practice,
it is usually better to make two passes over the image, so the above figures should
be doubled.
This particular method is of course even more specialized than the previous
methods, and is only useful for Gaussians and certain other infinite functions.
However it has the lowest complexity of any algorithm discussed, and is very
economical with regard to memory references. It has the additional advantage that
the filter size can be varied by simply changing the value of some parameters,
without affecting execution of the algorithm. It would seem to be the first choice
for any future implementations.
76
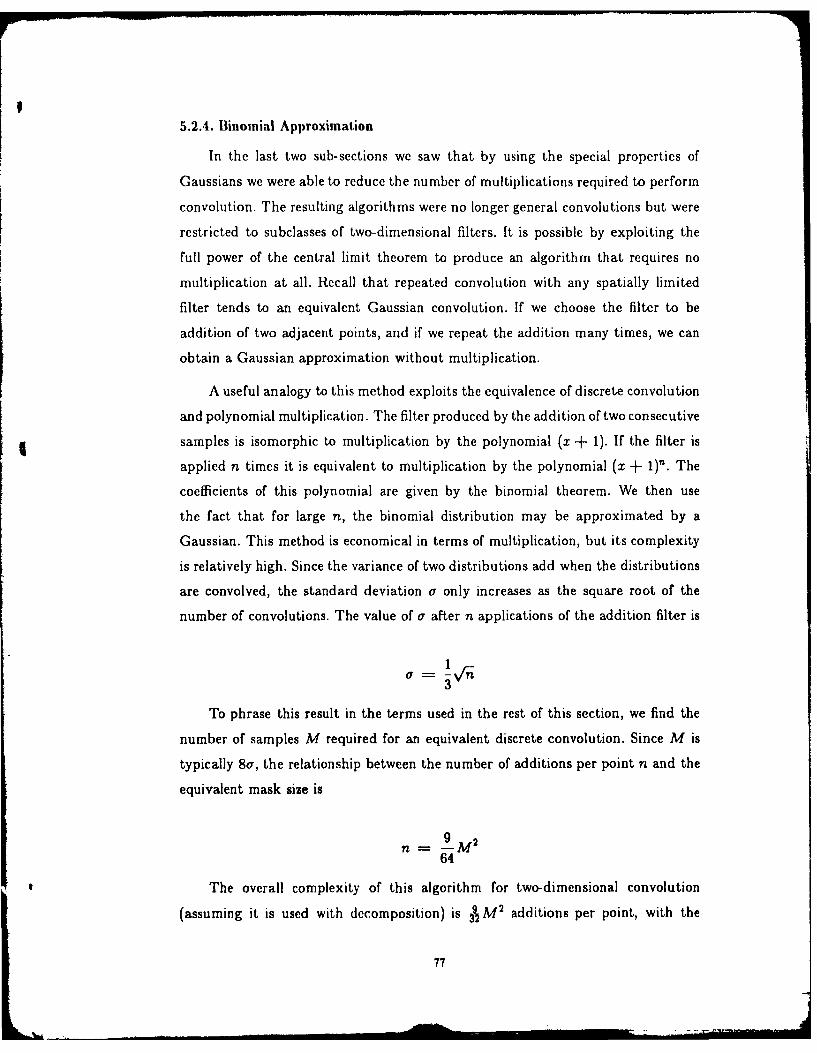
5.2.4. Binomial Approximation
In the last two sub-sections we saw that by using the special properties of
Gaussians we were able to reduce the number of multiplications required to perform
convolution. The resulting algorithms were no longer general convolutions but were
restricted to subclasses of two-dimensional filters. It is possible by exploiting the
full power of the central limit theorem to produce an algorithm that requires no
multiplication at all. Recall that repeated convolution with any spatially limited
filter tends to an equivalent Gaussian convolution. If we choose the filter to be
addition of two adjacent points, and if we repeat the addition many times, we can
obtain a Gaussian approximation without multiplication.
A useful analogy to this method exploits the equivalence of discrete convolution
and polynomial multiplication. The filter produced by the addition of two consecutive
samples is isomorphic to multiplication by the polynomial (x + 1). If the filter is
applied n times it is equivalent to multiplication by the polynomial (x + 1)". The
coefficients of this polynomial are given by the binomial theorem. We then use
the fact that for large n, the binomial distribution may be approximated by a
Gaussian. This method is economical in terms of multiplication, but its complexity
is relatively high. Since the variance of two distributions add when the distributions
are convolved, the standard deviation a only increases as the square root of the
number of convolutions. The value of a after n applications of the addition filter is
1
3
To phrase this result in the terms used in the rest of this section, we find the
number of samples M required for an equivalent discrete convolution. Since M is
typically 8a, the relationship between the number of additions per point n and the
equivalent mask size is
n 9M2
64
The overall complexity of this algorithm for two-dimensional convolution
(assuming it is used with decomposition) is A M 2 additions per point, with the
77

I
number of memory references being roughly the same. This may sound like a very
small number, but the exponent is high. The smalles" value of M that is ever likely
to be used is 8, and so the minimum number of additions using this method is
18. However, both the number of additions and the number of memory references
grows with M 2 even though we are exploiting separability. Since the time required
for floating point addition is often not much lower than the time for a multiply,
this method rapidly becomes unattractive as M increases.
5.2.5. Fast Convolution
In recent years, very fast algorithms have been developed for integer or
polynomial multiplication (Schonhage and Strassen 1971). Asymptotically these
algorithms are O(n) in the length of the integers being multiplied. In the case
of convolution, we typically use a filter that is much shorter than the length of
the input, and we should therefore expect the asymptotic time for convolution
to be independent of the filter length. Attempting to achieve anywhere near the
asymptotic complexity however, would introduce prohibitively high constants.
But all is not lost. By using the simplest form of fast multiply, we can gain
a very useful speedup with relatively low overhead. Consider two sequences of
numbers which are to be convolved. We assume w.l.o.g. that the length of the
sequences is 2n, and we break each sequence into two subsequences of length n.
Let the two sequences be x and y, and denote the subsequences as xl, z 2 and yj
and Y2. Then
z = xl 1. +X2 and Y = Yl,. +Y2
where In denotes left-shifting of the sequence by n. We then use the distributivity
of convolution over addition, and we have
X*Y = (XI%+X 2 ) *(YI.+Y 2 ) == X*Y12 X1 *Y 2 +X 2 *YI)In+X 2 *Y 2
78

Froin which it would seem that comnputation of a 2n length convolution requires
4 convolutions of length n, implying an order of growth of n2 . But the above
expression can also be written as
X * Y z= X1 I2. +[(Xl - X 2) * (y 2 - y1 ) + X *yl + X2 *y2)) In +x2 *y2
Which requires only 3 convolutions of length n, plus some extra addition
and subtraction. We can recursively apply this technique to compute these shorter
convolutions, and we arrive at an algorithm with lower order of growth than n2.
This leads to recurrence relationships for the number of multiplies and additions
to perform a convolution of length n
Cm i] = 3C. {n
C0Jfl) = 3C 4n]+4n-4
where C, is the number of multiplications and Ca the number of additions for
an n-point convolution. When these recurrences are expanded and simplified we
obtain for the multip!ication and addition complexity
Cm[n] = 3 L , 3 1-g2 (n) = nM.12 ,n 1.6
C.[n] = 6 .3 L -- 8.2L + 2 ; 6n 1. 6 for large n (5.5)
where L is the smallest integer greater than or equal to 1og 2(n). To translate
these results into the context of convolution of a long sequence (say length n1 )
with a much shorter one (length n2), we assume n = n2. We will require ,
such convolutions, and each one will require about n2 6 multiplies. The resultant
complexity is !n 1. = 0162 , so we find that the complexity is linear in the
79

length of the longer sequence but only varies as the square root (roughly) of the
shorter sequence. For two-dimensional convolution, similar results hold, and the
multiplication complexity is M1 2 multiplies per point while the addition complexity
is about six times this.
Thus we have the remarkable result that this method has almost the
same complexity as convolution with one-dimensional decomposition, but uses
a completely general two-dimensional mask. The algorithm has been implemented
and early tests indicate that it starts to exhibit its reduced complexity over naive
convolution at about n = 16. At n = 1024, the speedup is five to six fold. It can
be implemented in 6n space, and the number of memory references is about the
same as the number of additions.
The low value of the complexity constants make this method faster than
convolution employing fast Fourier transforms for values of n less than about 16000
(caution: this number is very hardware-dependent). It is also somewhat easier to
encode than the FFT, since. it has a natural recursive definition. It is quite likely
that it is the fastest way to do general convolution for n in the range 16 to 16000.
The method makes it possible to use two-dimensional masks that have exactly the
form of the optimal edge detection operator, rather than Gaussian approximations.
While the fast convolution algorithm has not yet been incorporated into the edge
detector, it is certainly worthy of further experiment.
5.2.6. Sub-Summary
Hopefully this section has highlighted the fact that there are frequently manifold
interesting implementations of seemingly mundane operations, e.g. convolution. But
it has another purpose. When trying to solve a vision problem the first consideration
should be motivational, i.e. what should this algorithm compute. The second is
feasibility, e.g. what can be computed from an image. Only after these two have
been treated should there be any constraints imposed by tractability, i.e. what
can be ccnputed in reasonable time. The choice of algorithm should not be
prejudiced by considerations of efficiency until much consideration has been given
to implementation, and only if it seems likely that no efficient algorithms exist
for the computation. This theme is characteristic of the work of Marr (1976) who
80 I

argued strongly for a breakdown of image processing problems using the above
considerations.
5.3. Non-Maximum Suppression
The optimal edge operator was derived under the assumption that edges
would be marked at maxima in its output. For two-dimensional images, finding
these directional maxima is straightforward but there has been quite a bit of
experimentation with various non-maximum suppression schemes. The operation
should be as local as possible i.e. it should rely on pixels that are close to the
i, -tr ..ial edge point, but it should also be robust and accurate.
The non-maximum suppression scheme described here may be used in either
of two ways. In the first instance the edge direction is estimated from the gradient
of a Gaussian-smoothed image surface by simply differentiating in the x and
y directions. The gradient magnitude is then non-maximum suppressed in thegradient direction. This is just a possible implementation of equation (3.1). In the
second case, the algorithm is used for non-maximum suppression of the outputs
of directional masks. Here the gradient direction is fixed and is a property of the
operator. We again non-maximum suppress the gradient magnitude, which in this
case is the magnitude of the response of that operator.
In either case the algorithm is the same. It uses a nine-pixel neighbourhood as
shown in figure (5.2). The normal to the edge direction (either the gradient or the
prefered operator direction) is shown as an arrow, and it has components (ut, up).
We wish to non-maximum suppress the gradient magnitude in this direction, but
we have only discrete values of the gradient at points P,. We require three points
for non-maximum suppression, one of which will be Pz, and the other two should
be estimates of the gradient magnitude at points displaced from Px,, by the vector
U.
Now for any u we consider the two points in the 8-pixel neighbourhood of P,,y
which lie closest to the line through P,y in direction u. The gradient magnitude
at these two points together with the gradient at the point P,,, define a plane
which cuts the gradient magnitude surface at these points. We use this plane to
81

PX-1, Y " PX, y.l P .+, Y+1
o o-- - 01 U X
UjY
0 0!PX-" Y P" P
0 0 0Px- 1, ,- I P, - P , - -
Edge Direction
Figure 5.2. Support of the non-maximum suppression operator
locally approximate the surface, Lnd to estimate the value at a point on the line.
For example, in figure (5.2) we estimate the value of a point in between Prv+l and
P+,y+l that lies on the line. The value of the interpolated gradient is
UU IpU 1G, = ' G(x + 1,y + 1) + G(z, y + 1)up u
Similarly the interpolated gradient at a point on the opposite side of P, is
82

UY - Uz
G2 : G(x- 1, y- 1) -+ - - G(z,y- 1)UY UY
We mark the point P,, as a maximum if G(z,y) > G1 and G(x,y) > G2.
The interpolation is similar for other gradient directions, and it will always involve
one diagonal and one non-diagonal point. In practice, we can avoid the divisions
by multiplying through by uy.
This scheme involves five multiplications per point, but this is not excessive,
and it performs much better than a simpler scheme which compares the point P1,
with two of its neighbours. It also performs better than a scheme which used an
averaged value for the gradient along the edge, rather than just the value at Px,y.
5.4. Mapping Functions
We close this chapter with a brief discussion of a general approach to programstructure for image processing algorithms. The development of a low-level vision
program requires many repetitive operations on each point of the image. There
will be some set of dependencies between the results of these computations, which
implies that there is a natural (partial) ordering of computations, and that some
intermediate results must be computed and saved somewhere. Aside from any
hardware (or object code) considerations, there are two basic ways of implementing
a software interface for this kind of processing.
The first and most obvious way is to provide a set of primitive array operations,
such as addition or convolution, which take arrays as arguments and store results
into arrays. Programs written using these primitives look like normal sequential
assembly code, unless there is some complex function (built from the primitives)
which must move over the array in a non-standard way. In this case the arguments
describing the way the function is to be moved must be repeated in each call to a
primitive. This leads to cumbersome and non-orthogonal code.
The second approach is to provide a mapping function which takes a local
image processing function as an argument and moves it over some number of arrays,
with the motion specified by other arguments. The two operations of mapping
and local computation are now handled by separate functions. This method is
83

reminiscent of the MAP- functions in Lisp, (Moon, Stallman and Weinreb 1983)
and is similar in philosophy to the concept of iterators in C1LU (Liskov et al. 1979).
It has a number of advantages at the user level. The first is that the local function
can be N ritten in the source language e.g. Lisp (even if the mapping function
turns it into something quite different) and tested on a sample set of arguments,
without having to generate test images. The source code is more compact and
less error-prone, and subjectively more readable. If parallel processing hardware is
available, the source code would compile into something like the code using the
first method. There would be no significant differences in the execution efficiencies
of the two methods.
For a serial machine though, there are concrete advantages in directly
implementing something like the second method. Since the local function is
evaluated completely at one point before moving to the next, there is only one
storage location required for each intermediate result. This contrasts with the
former method which needs a block of storage for each intermediate result. The
intermediate values may be held in high-speed storage (registers or cache) which
greatly reduces the number of memory accesses required to apply the function to
a full image. There is also a very considerable speedup possible when the local
function uses conditional branching, such that the time to process an image point
depends strongly on the data values at that point. For (most) parallel machines
the time to apply the function to n points will be the worst case time for a
one-point application. Conditional branching must be accomplished by setting a
non-execution flag for the length of the code to be skipped. No advantage can be
taken of sparsL data, or computional shortcuts such as recursive filtering.
It is the author's experience that the latter style makes code development much
easier (this was a serious consideration in the implementation of the algorithm,
much of which is written in Lisp machine microcode). This is true to the extent
that some of the more complicated functions, such as the sparse directional masks,
could probably not have been implemented using the first approach because of the
sheer amount of code. The edge detector has been implemented partially using the
first approach, and fully using a mapping function (which is itself microcoded). The
84

mapping function maps over any number of arrays, with arbitrary increments for
each array, and can store results into several output arrays if the function being
mapped returns multiple values. The difference in execution times between the two
methods is small, but the second method uses much less array storage, and has a
much shorter source.
I8
85

6. Experimers
It has been stressed that edge detection is only the first stage in a vision system
and that the performance of the detector can only be gauged in its context. It has
also been argued that the requirements of many of the later modules are similar
to the extent that it should be possible to design a detector that will work well in
several contexts. Starting from this assumption we proceeded to design a detector
based on a precise set of performance criteria which seemed to be common to these
later modules. We saw in chapters 2 and 4 that it was difficult to capture exactly the"intuitive" criteria that we originally defined. It is virtually impossible to capture
all of the desirable properties of edge detection in a finite set of criteria and in
the final analysis the only valid criterion is the performance of the detector on real
data. This chapter is concerned with evaluating performance at the experimental
level, and will include comparisons with some other edge detection algorithms. The
evaluation is in three stages:
(i) Validation of the analytic performance criteria. The operator has been designed
to optimally detect step edges in Gaussian noise. It should perform well on
synthetic images of steps.
(ii) Subjective evaluation of performance on real images. The ir-ention here is
to verify the operation of various parts of the algorithm, in particular the
integration of different operator widths and orientations. It is not possible
to validate these by inspection of the detector output, but defects in their
operation can often be isolated in this way. That is, we cannot tell by looking
at the output whether the detector is working perfectly, but we can often tell
where it is failing.
(iii) Evaluation of detector performance in some context. Since an edge detector
is the first stage in many vision programs, it is appropriate to compare edge
detectors by comparing Lhe performance of the program which uses the two
detectors. If the original assumption that many vision modules have similar
iequirements is valid, a detector designed using these criteria should perform
well with all modules.
86

Finally we will present some simple demonstrations of properties of the human
visual system which are consistent with the edge detector presented here. While
this does not prove that the human visual system performs the same computations,
it does suggest that the two systems share a common set of goals. It reinforces the
choice of performance criteria and gives evidence that an edge detector designed
using these criteria can perform well on a great variety of images.
6.1. Step Edges in Noise
In chapter 7 we will demonstrate that a directional second derivative edge
operator gives better localization than the Laplacian when applied to a Gaussian
smoothed image. We have also claimed (chapter 2) that a difference of boxes operator
gives unacceptable multiple response performance to a noisy step edge. We should
test those results experimentally now. In figure (6.1) We have a two-dimensional step
edge with additive white Gaussian noise. The successive frames show the responses
of difference of boxes, Laplacian of Gaussian and directional first derivative of
Gaussian operators. The signal to noise ratio of the image, defined as the ratio of
the amplitude of the step to the standard deviation of the noise at each pixel, is
about 0.2, and the image is 256 by 256. The Gaussians for the Laplacian and first
derivative operators both have a a of 8.0 pixels, while the box masks have a length
of 32 pixels in x and y.
Processing of the output of the difference of boxes operator after the convolution
step is identical with the directional first derivative operator, that is, it is
non-maximum suppressed and thresholded with hysteresis. For the Laplacian of
Gaussian, the sequence is slightly different. Edges are initially marked at the
zero-crossings in the convolution output, then the gradients of the convolution
output are computed and the gradient magnitude is thresholded with hysteresis.
For each operator there are-two thresholds that are set empirically to give the
best subjective output. Figure (6.1) gives a guide to the localizing and multiple
response performance of each of the operators. As we would expect, the directional
first derivative operator gives subjectively better localization than the Laplacian,
and the difference of boxes produces several contours in response to the single edge.
87

a
II
Figure 6.1. (a) Two dimecnsional step edge with adIditive white Gaussian noise,and outputs of (b) Laplacian of Gaussian, (c) differenice of boxes and (d) firstderivative of Gaussian operators.
88

II
lid
Figure 6.2. Effect of changing operator thresholds. In the first row, thethresholds are increased by 50% , and in the second row they are reduced by 50%.The order of operator outputs is (from left to right), (i) Laplacian of Gaussian, (ii)difference of boxes and (iii) first derivative of Gaussian.
89

To gain some idca of tle detection performance (i.e. signal to noise ratio) of
the operators, we can see how their outputs vary as we change the thresholds from
the optimum values. The first row of figure (6.2) shows the result of increasing
all thresholds by 50%, and in the second row the thresholds are reduced from
from the optimum levels by 50%. From these we can infer that the difference of
boxes operator has the best signal to noise ratio, since for all threshold levels, it
marks edges only in the vicinity of the step. Of course signal to noise ratio is only
one component of detection performance, and lack of multiple responses is the
other. In this respect the difference of boxes performs very poorly, and worse as
the thresholds are lowered. The Laplacian of Gaussian exhibits poJr signal to noise
ratio compared to the other two, and it is not possible to set the thresholds so that
the full length of the edge contour is marked without introducing contours due to
noise.
It may be argued that the problems with Laplacian of Gaussian or differenceof boxes operators can be circumvented by applying "pruning" heuristics to their
outputs. For example, it may be argued that it is possible t.o eliminate erroneous
maxima in the difference of boxes output that are "near" the edge, or to use the
outputs of different Laplacian of Gaussian channels to reinforce the evidence of
an edge. This argument misses the point. The optimal operator derived here, or
the first derivative of Gaussian approximation to it, gives the best performance for
a single linear operator when followed by non-maximum suppraion. In order to
improve the performance of the other operators, non-local predicates have to be
applied which in a sense make the filtering step redundant.
6.2. Operator Integration
We have argued that in order to handle a variety of images, an edge detector
should incorporate operators of different widths. We have also argued for highly
directional masks when they are applicable. All of these operators respond to the
same type of feature, a step edge, and where several of them respond to the same
edge, the detector must mark a single edge only. The problems with the integration
of different operator outputs are very great. In fact, many of the arguments against
directional operators have been pragmatic, that, it is difficult to combine oriented
90

operators and produce i coherent output. 'he probhlcis witll coi'ilini Hg o)erator
outputs of different widths are even worse, because maxima in the out puts of two
operators responding to a single edge may be displaced from each other. Chapter
3 described feature synthesis as a niethod for combining several feature detector
outputs. This method is used in the implementation of the edge detector, and we
now explore how well it performs on some test images.
6.2.1. Integration of Differcnt Mask Widths
The reader can readily gain an appreciation of the variety of detail that occurs
at different scales in an image by reference to figure (6.4). This figure shows the
edges marked by two operators on an image of a perforated cleaning cloth. The
mask widths are a = 1.0 and a = 5.0 respectively. The edges at the two scales are
virtually independent. In contrast, figure (6.7) shows the edges marked by operators
with a = 1.0 and o = 2.0 on an image of some mechanical parts. In this image,almost all of the detail is picked up by the smaller operator, and it only fails on
some of the shadow boundaries. These two figures capture the essence of the feature
integration problem. Ideally every feature in the image should be marked, but only
once.
Our basic width selection criterion, that is using the smallest operator that has
sufficient signal to noise ratio, should do the right thing on the parts image. The
edges at the smaller scale will first be marked, then the larger operator output will
be synthesizedi froi theim, anid fin ally any ed ge, jTi the large o)erator output that
are not consistent with the synthesized output will be added. The result is shown
in tile figure (6.8a). The on ly difference between this and the figure (6.7a) is the
add itioi of some shadow edges, and tle extension of some shading edges. Similarly
the figure (6.5a) shows the combined output from the edges in figure (6.3). Since
the long shading lines in the image are not seen by the smaller operators, the large
operatot features that. correspond to them are not syWhesized. When they appear
in the actual large opvr,!,')r out put they are marked iin the detector outl)ut.
'The, re is some freedoim wit h the feat iire synlthesis apl)roach as to the "inhibition"
effect of the synuth( sized opperator outputs. R ecall lhat, the actual operator output
had to be silgnificanlltv ,reatcr t han the synthes ized output for an edge to be
91

Figure 6.3. (a) Cleaning cloth image
92

AD-AI30 824 FNDING EDGES AND LINES IN IMAGES(U) MASSACHUSETTS INS JV21OF TECH CAMBRIDGE ARTIFCIAL INTELLIENCE LABiJFCANNY JUN 83 Al-TR-20 NODS 4 ND C OSAN
UNCLASSF/ 2/6NL
EmommmhhhhmuIhEEEmhhhhhhILI

u- 1 2 .
I -
IL8
MICROCOPY RESOLUTION TEST CHART
NAUIONAk IA RAU ()F lANIFAHVU lNb A
,,-I .~, ,*. e, . . " S

a 0 ~ 0 :CO~Q~
~, C C ~ 0 '6 00oC o * C~
00 ~ C 0 0 0
~OO% '4~ *0C%o 0
0 OZ ~ q ~ c ~
*cz 9
op0Z 0000~ 00 C 0 aC0
Z~CC 0 C o0 0
0C ~~~ 0 CZ .o0 o o C ~ ~ ~ 0 ~ ~
.~.%-. .-. 0 .. ~0 000
bo C C C~ ~ C 0
~ ~0 ~ C C
Fiur 6.4C . (a Cdge frmceaigclt0 maewthoeatrwdt0.
(b ege fomopraorwih == 50eCr oC
9000~~ C0
0 C 0 C 0 CCC9~*CC93C

a,!
74 1-7: Fc~r~~t'urQ2&L~ti~;- ~
C ~4 zO't~rt
WO tsP(2
[it 4 , 4fC £-r-v
b ~ - N177
AkZIP
' 7f Iij
iji it ±:~t~.) h6
Fiue6..() obne desfo clenin clot imageP 0 usti gfatrryntesis&(b sue piion of th tw sesrede
'N ~ I~ 5994

Figure 6.6. (a) P~arts image

IL
I ZN
,c,
,0
it Ct C
teo.. ,, .,ooS
~~. Al W P '
1 .C -"'j~. .
Figure 6.7a. Edges from parts image with operator width a = 1.0
96

.01
C)C
Figure 6.7b. Edges from parts image with operator width oa 2.0
97

HW08
AiSS
Vol
4 J
Figure 6.8a. Combined edges for parts image using feature synthesis
II I
-

o
K~c
Figure 6.8b. Superposition of the edges for parts image

marked. In the present implenentation the vector difference between the actual
and synthesized gradient is first taken and if the magnitude of this difference is
greater than the magnitude of the synthesized gradient, a new edge is marked. By
introducing a scale factor into the comparison, the likelihood of a new edge being
marked can be varied. This factor must be determined empirically. The above two
images place conflicting requirements on the factor. If it is too large, the fuzzy
edges in the cloth texture are missed. If it is small, there is duplication of edge
points in the parts image, and consequent smearing of the edge contours. A single
value was found which gave the results shown in the two figures. This value has
given good results on all the images tried, and does not require "tuning" for a
particular image. For comparison, below each of the combined edge maps in figures
(6.5) and (6.8) is the superposition of the edges from which the maps were formed.
Two final notes. In order for feature synthesis to be effective on the cloth
texture image, the edges at the smaller scale should be produced by an operator
which is insensitive to slow gradients as described in section (3.5). Otherwise the
synthesized large operator output will contain a slowly varying component that will
prevent new edges from being marked, even though the small operator did not mark
the slow edges. This component is due to the slow gradient "leaking through" the
large number of closely spaced edges from the smaller operator. In general feature
synthesis is most effective when the two features are independent.
Also the combined output exhibits streaking of the long contours. This is
because a single scale factor is presently being used for comparison of real and
synthesized outputs. This factor may be viewed as a kind of threshold, and therefore
improved performance should be possible by using two values, i.e. by thresholding
with hysteresis. This has yet to be tried at the time of writing.
6.2.2. Integration of Directional Masks
Recall from section (3.2) that highly elongated directional operators are
preferred whenever they have sufficient goodness of fit to the image. The goodness
of fit measure is simply the standard deviation of the gradient values at, several
points along the length of the directional mask. A directional operator can only
mark an edge if the sum of these values exceeds sorie fixed multiple of their
100

standard deviation. This prevents a directional operator from responding to curved
edges or from extending edge contours beyond corners.
It also makes operator integration much easier. For one thing there will seldom
be more than two directional operators responding to an edge of a particular
orientation. Also the edges points produced by directional operators will not be
displaced significantly from the edges produced by less directional operators if both
have the same width. This is because the only way an edge point can be displaced
is if the edge is significantly curved, but this will immediately prevent a directional
operator from responding to it. Feature synthesis is not necessary for directional
operator integration, and a simple non-maximum scheme suffices.
The non-maximum suppression scheme was described in section (5.3). The
only peculiarity of non-maximum suppression for directional operators is that
the direction of non-maximum suppression is fixed a priori for each mask. It is
normal to the long axis of the mask. Once all edges have been marked by the
directional operators, the simple gradient magnitude is computed. A composite
gradient is formed as the maximum of the simple gradient and the magnitude of
the directional gradient. This composite gradient is then non-maximum suppressed
in the gradient direction. The effect of forming a composite gradient is to prevent
simple (non-directional) edges from being marked adjacent to directional ones. An
example of the performance of this scheme is given in figure (6.10). The first frame
of (6.10) shows the edges marked using simple gradient non-maximum suppression.
The second frame shows the addition of directional operators at the same scale.
Several additional elongated edges are visible in the second frame. There is no
evidence of straightening of curved edges or extension of edges beyond corners.
The edge detector has been used quite extensively by the author in practical
systems. The first of these is a contour tracker which locates an edge contour in
an image from a television camera, and plans a trajectory for a robot manipulator
which follows the contour. The second system forms polygonal approximations to
the bounding contours of objects in an oveilicad image of a robot's workspace. An
example of this system is given in figure (6.11). These are then used to plan paths
through the workspace which avoid the obstacles. It has also been used by others
101

F'igure 6.9. Dalck irnartc, approximately 700 by 500 pixels
102

95-b
Figure 6.10a. Edges from Dalek image at a - 2.0
103
.. . .. . . . II I I IIC .. . . .. ,

f0
."igure G.'Ob. Dirtctiona, edges from Dalek image at c = 2.C, wilh ,ertorsin six directions
104

in the context of shape description (Brady and Asada 1983). It has been used as
a front end for an implementation of the Marr Poggio stereo algorithm (Grimson
1981) but a quantitative comparison with Laplacian of Gaussian zero-crossings in
this application has not yet been done. We close this section with examples of the
edge detector output on (as promised) a variety of images. These appear in figures
(6.12) through (6.15). The images are all roughly 700 by 500 pixels and the time
to process each one was about 10 minutes on an MIT Lisp machine with no special
hardware.
I
105

Figure 6.11. (a) Image of some paper shapes, (b) edges from operator width or=1.0, (c) bounding polygonal approximation to the edges
106

Vigre6.1~.Qkuasilnodo image
107

Figure 6.12b. Edges from Quasimodo image using operator width a = 1.0,where edge strength is represented by increasing brightness.
108

Figure 6.13a. Kent image
109

r - -
X r
IS,:
Figure 6.13b. Edges from Kent image using operator width a -- 1.0
110
16
IL.I~~~ ~ u I I I I z | I ! I% \ I II |.

I,9
I -6, .- . -
Figure 6.1I1a. Westminster image
11

UU
jr..4~
AO
01 0
P5~i~
C:>( q' ' Cr
____________ J ~ o I,*- o~(ji ~d
Figure 6.1lb. Ldges frorin Westminstecr knage, operator width a 1.0
112

Figure 6.15a. Marine image
113

/:i- ,.,___o_ ____ _
,. !.. '... __ ___ __
'> - n _ _ __i'_ .
11
A-1 4:
/4) rl lrr j
,I .E,__9]
Figure 6.15b. Edges from operator width a = 1.0
114

6.3. The Line Finder
An optimal operator for ridges was derived in chapter 4. It was pointed out
that the extension of this operator to two dimensions was more diflicult than the
edge detector because of the lack of a natural property (such as the gradient) which
could be used to determine the ridge orientation. The ridge detector must rely on
a much more noisy quantity (which is approximately the direction of maximum
curvature) to perform non-maximum suppression. Printed text is a difficult test
case for a ridge detector because of the variation in orientation and width, and the
presence of junctions. The ridge detector output on some printed text is given in
figure (6.16). It uses a second derivative of a Gaussian to approximate the optimal
operator derived in section (4.1). For reference, the edge detector output on the
same image is given in figure (6.17). The ridge detector output is subjectively more
legible, but in many places sections of contour are missing.IIn principle it should bc possible to incorporate the ridge detector output in
the step edge detector using feature synthesis (or some other feature integration
approach). This has not been done to the present time and remains a challenge to
low level vision schemes.
115

ab
Poptin app 411101 was*. Ur4
b Sornc pic~'okis forroulIgLoo.s lI)Ac. chosen Lho Rr,,L or sjccorlC iYLL
ppropriLt: qulanO.,Ly Lo char~c~iLcri cp cdgcs, zoc Ila-it fricd olii
017-s diriY'ti'?C ovcr SDii1iC 6&u .0 ;)-t I.-xrrmpks of riraL dcevlyoOc op~rr.Aw
purLori Lof RoberLs (IDG5) and P'isoct (100D), whIv)c lio~lcsLirlo inod Pr
>rmred ern op~i cstimriLc or iho Lwo-cirnciOnoiil I opli~ucn o !cr '% I'li./
WTr vnd Iildrcth (1980) stigr.caicd Lho ~p~.~ of ' broad3 Ca'usii
piwil-ce kbc Lrsdc-uG in 1oc.M'2zkiiri u~ Uzardv~id~b T)hcI'c is A ccoi
lasn of for-rnuI.lUors lio wh~di Uic rrniagr 50r13CC IS approximac by a s
o~fcl~oas Q.r'cl (bc cdgc parircLcrs, niC c-LirflLCd Fromr .hr mrodclIcd inmat
x.ii.opkes of Ihis 1ccljjJicoc uecludc (tic work of fNcwiRI (1070), 11--IiL (k
(~aIk(1032) TIhcsc; ail:LIhds ailow roorc dirccl. cstimr'lzcs of ccirc prop.
sposiL~on arid oriclwW1n, buv siricc Lht, basis fajnchiori &rc usuially r~oI
bc proptrL)Cs 3rppiy on-1y LO0 0 PFO)CCU0I)f O !kCUa 6th%%g Slid~ .~ uracc
Figure 6.16. (a) Text image, (b) ne.-afve ridge detector output using a 0.7
116

- to tvvadg= A to lw AsA &' % ad WqtW~' T&., jg' D iiM-f4
pFigeo .7.Otu o1 "h edg detecor on the teimage, ago wg1.0
117

6.A. Psychophysics
We have made a case for a particular set of criteria on effective edge detector
and we have claimed that these criteria are common to a variety of applications.
In theory any edge detector which is used in these applications should use similar
criteria, and an algorithm which is consistent with these criteria. The human visual
system provides structural information about the visual field to later processes, and
human beings are adept at stereoscopic depth perception. It is reasonable to argue
that it should perform edge detection at an early stage.
It is also reasonable (from the arguments given in chapter 3) to suggest that
it should use a variety of operator widths and orientations. It should therefore give
preference to small operators whenever they have sufficient signal to noise ratio.
To test this hypothesis we need somehow to produce an image which has different
detail at two scales, and then add noise to see if the percept changes. Such an
image is the coarsely sampled picture of Abraham Lincoln used by Harmon and
Julesz (1973). The effect. of the coarse sampling is to introduce irrelevant detail at
small scales. The detail makes the image difficult to perceive unless blurred.
The same effect should be observed if we add noise to the image, because
the signal to noise ratio of the small operators will become intolerable before the
larger ones. Therefore the smaller channels should be ignored at high noise levels,
while the larger channels will still contain coherent information. A coarsely sampled
image of a well-known stereo-type (not Lincoln) is shown in figure (6.18). The
successive frames have not been blurred but contain increasing amounts of additive
white Gaussian noise. The later frames are easier to perceive as a human face. We
therefore have the remarkable situation that adding incoherent noise to such an
image makes it more perceptible.
A second result of the analysis in chapter 3 is that highly directional operators
have better signal to no:se ratio than less directional operators. The highly directional
operators will :-.ot be as Scnsitive to rapid changes in the orientation of an edge
contour, and will tend to make a rapidly changing contour appear straigter. Figure(6.19) contains an series of parallel lines which are locally curved but globally
straight along their length. The lines are closely spaced so that larger channel
118

J
JOY
Pigure 6.18. Image of a human face with varying amounts of additive whiteGaussian noise.
widlths (which would also tend to give a subjective straightening of the contour)
will have poor signal to noise ratio. When noise is added to this image, there is an
apparent straightening of the lines.
Trhis would indicate a scheme which, in contrast with the present detector,
gives preference to less directional operators when they have sufficient signal
to noise ratio. Hlowever the apparent inconsistency can be resolved if we use a
mnor(' sophisticated applicability test for the directional operators. In the present
algorithrri, directional operators would niot be applicable in either of the framnes in
119
LAM-

lFigure 6.19. Image of approximately parallel lines with sinusoidal variation indirection and additive Gaussian noise
figure (6.19) because of tile poor approximation of the contours to straight line
The simple standard deviation applicability measure is poor if the edge contour is
not straight or breaks at a corner. It is also poor if the image is noisy, but in this
case a directional operator is no less applicable. If image noise is taken into account
in the applicability metric, we would expect the addition of noise to enhance the
applicability of directional operators, consistent with (6.19).
120

7. Related Work
Now that we have examined in some detail the design of an edge detector
usong variational techniques, we can contrast it with other schemes with respect
to both its design goals and the methods used to attain those goals. In order to
consider any appreciable fraction of the great variety of edge detection schemes that
have been proposed it is necessary to form a categorization of these schemes. Most
schemes in fact do not lie wholly within one of these categories, but retain aspects
of several. We will examine several detectors based on their apparent commitment
to the following goals
(i) A decision as to the presence of an edge and an estimate of its location from a
best-fitting surface that approximates the real image surface.
(ii) To optimally estimate some derivative, usually first or second, at each point in
the image and mark edges at local features in these derivative outputs, e.g.
zero-crossings in second derivative or maxima in first derivative.
(iii) Frequency domain techniques, which attempt to enhance edges by filtering.
Here the filters are designed using frequency domain techniques to optimally
discriminate step edges from the background, by assuming some frequency
distribution for the background.
All comparisons will be theoretical and generally quantitative, since for early
vision level of performance of an algorithm can be crucial. For a more extensive
survey the reader is referred to Davis (1975). For experimental comparisons the
reader should see Fram and Deutsch (1975), which compares several operators
applied to step edges in noise, and includes a comparison with human performance
on the same synthetic images. Abdou and Pratt (1979) compare local differential
and template matching operators based on a figure of merit which is very similar
to the performance criterion used in the present detector. This figure of merit was
introduced by Pratt (1978, p495) and is given by
F= 1 -A 1- rax(11 , IA) I + ad2(i)
121

p where I and IA are the number of ideal and actual edge points, d(i) is the distance
of the ith pixel from the true edge, and a is a scaling constant which determines
the trade-off between detection and localization.
7.1. Surface Fitting
There are a number of edge detectors that are based on some kind of image
surface modelling. These methods usually involve an initial parametrization of the
image surface in terms of some set of basis functions followed by the estimation
of the amplitude and position of the best-fitting step edge from the parameters.
One of the earliest examples of this method was the Prewitt operator (1970), which
used a quadratic set of basis functions. Another early example is the detector of
Hueckel (1971). Hueckel's method uses basis functions with circular support, and
tries to fit a single step edge to each circular area. The basis functions are chosen
so as to give an approximate Fourier Transform of the circular region. However,
as with most surface fitting schemes, the basis set is not complete (there are only
8 basis functions over a support of 52 pixels) and an edge is actually fitted to a
smoothed version of the original surface. An argument is presented to the effect
that the choice of a low-frequency subset of the complete space of basis functions
does not prejudice the ability of the operator to detect and localize edges, but proof
of this is not given. Instead it is argued that the high-frequency components should
be ignored because they will contain much of the image noise.
Another example of this approach is the work of Haralick. In Haralick's 1980
article, he proposes a fitting of the image by small planar surfaces or "facets".
Edges are marked at points which belong to two such facets when the parameters of
the two surfaces are inconsistent. The test for consistency is based on the goodness
of fit of each surface within its neighbourhood and uses a x-squared statistic. Again
the initial surface fitting invqlves a set of parameters which do not completely
represent the image surface. In this case there are 3 parameters.over a square
support of somewhere between 4 and 25 pixels. The three parameters are in fact
estimates of the x and y slope and the average value over the support.
In subsequent work on edge detection using a more general surface fitting
122

technique, Ilaralick (1982) has used higher order polynomial basis functions with
larger operator supports. The later scheme locates edges at zero-crossings in the
second derivative of the modelled image surface in the image gradient direction. It
uses cubic polynomials (in x and y) as the basis functions over a square support of
(typically) 121 pixels. Interestingly, this choice of basis functions yields an operator
which can be shown to be quite similar to the operator described in this report.
However, if higher order or lower order polynomials are used, performance will be
worse. We now demonstrate this similarity.
The polynomials used are the discrete Chebychev polynomials, denoted P(r),
and for simplicity we will consider a one-dimensional problem. The objective of
surface fitting is to find the coefficients a, such that the sum
Q(r) = aiP(r) (7.8)
gives the best square-error fit to the actual sampled image surface I(r). That is we
seek to minimize the value of
C= Z ( -(r) - 1 aiPr) (7.9)
We do this by setting to zero the partial derivatives of e2 with respect to eachof the aj.
of the aj. Z ( (r) - a Pd~r))P j(r) = 0
This leads to the solution of a system of linear equations in the a3 , but in the
case where the polynomials are orthogonal the system is diagonal and the solution
is simply
Ra = E P,(r)I(r) (7.10)
where
123

R
r=-R
The method then estimates the first and second partial derivatives of this
modelled surface. For example the first derivative is
d Qr d Pi(ro)
dr j=O dr
Substituting equation (7.10) into (7.11) we obtain
d R() d-Q ) = O - =- Pj(r)I(r)-P(O) (7.12)£dr j=O P, r=-R d
The important thing to note about this equation is that it is linear in the
sampled image intensity, and that therefore the operation of surface fitting followed
by derivative estimation can be represented as a single convolution. We find the
equivalent filter for this convolution from (7.12). Since this expression has the form
of a discrete convolution over r, by removing the summation over r and the input
term I(r), we obtain the impulse response of the equivalent filter
f(r) E -Pj(r)-Pj(ro) (7.13)o P) dr
The derivation of the expression for the second directional derivative is similar.
The next step in the surface fitting approach is to mark edges at zero-crossings
in the second directional derivative. These will correspond to maxima in the first
derivative given above. This puts us in the position of being able to directly compare
the surface fitting approach to the variational approach described in this report.
Both methods are effectively marking edges at the maxima in the output of the
convolution of the image with some linear operator. We can use the optimality
criteria that we defined for step edges to (analytically) evaluate the performance of
the surface fitting operator.
124

The form of the equivalent filter depends directly on the choice of basis
functions P. The equivalent filter for the Chebychev basis polynomials up to
degree three is shown in figure (7.1). It turns out that the choice of cubic basis
polynomials gives the best approximation to the optimal operator derived in this
report. The perceptive reader may note that the surface fitting and gradient
estimation procedure is equivalent to convolving with a function that is the best
approximation to a derivative function (within the constraints imposed by the basis
functions) i.e. the filter has an impulse response that is the first derivative of a
delta function. Reference to (7.13) shows that as the order of the basis functions
becomes large, the filter f(r) tends to a simple local gradient estimator, similar to
the 3-pixel Prewitt operator. The equivalent filter for n = 7 is shown in the second
frame of figure (7.1).
Thus the 3-order Chebychev polynomials give the best performance with this
approach, while higher order polynomials lead to operators that are approximations
to local derivative operators. This answers one of the questions raised by Haralick
in his article as to what order of polynomial functions is best. The answer to the
other question raised, viz. what form of basis functions to use, can also be answered,
since his criteria of performance are essentially the same as ours. Note that these
criteria were used to experimentally evaluate the performance of the surface fitting
operator, but did not appear explicity in the design. The optimal surface fitting
operator for step edges would use a single basis function which is the first derivative
of Gaussian derived here. Fitting and gradient estimation using t is single basis
function is equivalent to convolution with the same function.
So we see that the ultimate performance of the surface fitting approach is
determined entirely by tile choice of basis functions. However, no analysis was done
in Ilaralick (1980) or in Hueekel (1970) as to the optimality of their respective
sets of functions. Other advocates of the surface fitting approach have made more
detailed analysis of the basis functions. For example Hummel (1978) suggested the
use of Karhunen-Loeve principal components for the basis functions.
125

a
b
Figure 7. 1. Equivalent filters for cubic basis functions (a) and for basis functionsto degree 7 (b)
7.2. Derivative Estimation
Since an ideal step edge is a rapid transition from one intensity value to another,
it seems that a reasonable way to detect edges is to estimate some derivative of the
image intensity surface. Firstderivative detectors have been proposed by Roberts
(1965), Prewitt (1970), Rosenfeld and Thurston (1971), Macleod (1970) and a
variety of others. There has also been some interest in operators that estimate
the second derivative of the image intensity. The operator of Modestino and Fries
(1977) estimates a Gaussian smoothed Laplacian using a computationally efficient
126

recursive filtering algorithm. llerskovits and Binford (1970) used a form of lateral
inhibition to reduce the sensitivity of their operator to slow gradients, and then
followed with first and second derivative estimation to locate the edges. Recently
there has been interest in operators which locate zero-crossings in the second
directional derivative in the gradient direction, viz. Havens and Strikwerda (1983),
Torre and Poggio (1983), Yuille (1983) and Haralick (1982).
We should note that the operator derived in chapters 2 and 3 has very strong
similarities to two of the above operators. In particular, we have been using the first
derivative of a Gaussian to approximate the optimal operator derived in chapter 2.
The simplest two-dimensional extension of this used a Gaussian projection function,
which results in a two-dimensional operator which is very similar to Macleod's.
It also bears a strong resemblance to the Marr-Hildreth operator, at least in one
dimension, as we shall see in a moment.IIt has been argued in this report that the optimal edge detection function
should be asymmetric (see section 2.1), and it may therefore be viewed as a first
derivative operator. However, it was not designed to optimally estimate gradient,
but to detect step edges. This distinction is subtle, but it should be stressed at this
point. The argument for derivative estimation is that the image gradient attains a
maximum at the centre of a step edge, and that therefore edges may be detected
by finding maxima in gradient. lowever, it does not follow that gradient is the
best measure to use to detect and localize edges. Marr and Hildreth (1980) suggest
the use of the slope of the output of the Laplacian of Gaussian operator. Again the
observation is that this quantity is proportional to the edge strength.
We should really be trying to estimate the "edgeness" of a potential edge.
However such a measure can only be defined implicitly by a variational equation,
such as equation (2.12). The tendency has been to use a posteriori measures, such
as gradient or zero-crossings of some derivative, as evidence of edges. The fact
that high gradients occur near edges do not mean that all points of high gradient
correspond to edges.
Since in one dimension the zero-crossing of second derivative operator (Marr
and Hildreth) is essentially the same (ignoring the thresholding question for the
127

moment) as a maximum of first derivative operator, and both employ Gaus~ian
pre-convolution, we would expect similar performance from the two operators.
In two dimensions the extensions are different and performance is noticeably
different. We now show that the two dimensional Laplacian of Gaussian gives
poorer localization than the directional operator described in chapter 3. Let the
two-dimensional Laplacian of Gaussian be described by the equation
LX~y 2 ( 2 -2) exp( X2 + 2 )(7.14)Now by the method of chapter 3, the standard deviation of the position of
the zero-crossing is the quotient of the slope of the zero-crossing at the edge centre
and the root mean squared noise in the operator output. Let the input be a step
of amplitude A in the y direction, i.e. the equation of the input S(x, y) is
S(x,y) = Au-_(x)
Then the slope of the zero-crossing is
d _ f ' AL(x, y) dy dx (7.15)
and the root mean squared output noise is
float! I: L 2(X, y) dy dzl (7.16)
Dividing (7.15) by (7.16) and substituting from (7.14) we find that the
localization AL of the Laplacian of Gaussian is just
AL = 1
',Ve compare this against the localization of a directional operator aligned with
the edge. Let the point spread function of this operator be described by the cquation
128

S 2 (7.17)
Again we find the quotient of (7.15) and (7.16) and substitute from (7.17) and we
obtain for the localization of this operator
AD = V/ 1.63
So on average we would expect the positional error of the Laplacian of Gaussian
to be about 60% greater than that of a directional operator of the same a.
It has been suggested that the strength of a zero-crossing may be estimated
from the slope of the zero-crossing (normal to the edge direction). We should also
compare the signal to noise ratio of this measure with signal to noise ratio of the
first directional derivative. The slope of the zero-crossing of a Laplacian of Gaussian
is again given by equation (7.15), while the noise in this value can be found from
the integral
Y))d 2 dydxj (7.18)
This gives the Laplacian of Gaussian a signal to noise ratio EL, formed from
the quotient of equations (7.15) and (7.18), of
EL 3a
Finally we compare this value with the signal to noise ratio of the two-
dimensional directional derivative operator
D(z,y) = exp (- 2 )
which turns out to have a E value of
129

E, = 2a
This comparison shows that the directional first derivative operator betters the
Laplacian of Gaussian (with slope estimation) by a factor of slightly greater than
2 with respect to signal to noise ratio, and by a factor of about 1.6 with respect to
localization. In terms of the composite criterion EA we find that
EDAD = 4ELAL
The above result shows that the slope of a zero-crossing is a very poor estimator
for edge strength. While there are other possible choices for the edge amplitude
estimator, we also find that the Laplacian of Gaussian still suffers in localization
by comparison with a directional operator. The intuitive reason for this is that the
two-dimensional Laplacian may be decomposed into the sum of second derivatives
in (any) two orthogonal directions. If one of these is chosen to be normal to the edge
direction, it is clear that this contribution is exactly that of a directional operator.
But the second component, which will be parallel to the edge direction, contributes
nothing to localization but will increase the amount of noise.
7.3. Frequency Domain Methods
In this (rather small) category, we find one particular example of an approach
which used criteria very similar to ours, using a frequency domain derivation. We
might expect this formulation to lead to an operator very similar to ours. In fact
it did not, but this was due to a rather unfortunate restriction placed on the
possible solution. When the restriction is removed, we again obtain a function
which approximates a first derivative of a Gaussian.
The method is that of Shanmugam et a (1979), who pronosed the use of a
two-dimensional linear operator that approximates the Laplac.an of a C 'ussian.
Their criteria of optimality were that the function maximize the proportion of total
output energy confined to a fixed interval when it is convolved with a step edge.
Also the function must be strictly band-limited. These two criteria approximately
130

p
capture those of the present design. Maximizing the proportion of total output
energy in the interval will limit the range over which the maximum in the response
to a step edge can occur. Band-limiting greatly improves output signal to noise
ratio, since the spectrum of Gaussian noise is flat while the spectrum of a step edge
varies as the inverse of frequency, i.e. most of the energy in the edge is concentrated
at low frequencies.
Unfortunately, there are two steps in the method of Shanmugam et al which
the present author finds hard to justify. The first is that they made no attempt
to mark edge points, but instead thresholded filtered values were output. In fact
their filter gives two peaks in its response to an ideal step, but these are on either
side of the centre of the step, and the response at the centre is actually zero. This
was rectified to some extent in the work of Marr and Hildreth (1980) who used the
zero-crossings of the same filter, since these features occur at the centre of step
edges.
A second problem is that they assumed a priori that the operator they were
looking for would be trivially extensible to two dimensions by rotating it about
an axis of symmetry. This immediately restricted them to symmetric operators,
even in one dimension where the design was done. As we have seen in chapter 3,
this restriction is unnecessary, and actually degrades performance. In fact if the
restriction is removed, the same analysis leads to an operator that approximates
the first derivative of a Gaussian, as used in the current design. We repeat their
design without the assumption of symmetry now.
Once again we perform an optimization to find the function that extremizes
one criterion while another is kept contant. In this case the bandwidth of the
response Q1 will be fixed while the fraction of total output energy in an interval
[-1/2, +1/21 is maximized. i.e. if the output response is g(x) and the fraction of
the energy in thd interval is a," we maximizer+1/2 2J- 1/2 Ig(x) 2 d(.1)
0io ig(X)i 2 dx
We can make use of the fact that there exists a set of functions Vki(x) the
131

prolate spheroidal wave functions, that are band-limited, orthogonal over the
interval [-1/2, +1/21 and orthonormal over (-o, +oo). i.e.
f 1 ()v,(X) d x i,j 0,1,2,... (7.2)
+1/2o, i j
/2 i () p() dx t i, -- 0,1,2,... (7.3)
withXi < 1 for alli, andX 0 > XI > X2 > ...
The prolate spheroidal wave functions are complete in the space of band-limited
functions, and hence the output from any band-limited filter can be represented as
Sg(X) == E a.v¢ (c, X) (7.4)n=O
Where the constant c is a function of the bandwidth and the size of the interval
QlI
2
When the expansion for g(x) is substituted into (7.1) using the results of (7.2)
and (7.3), the value of a becomes
_E-0 la,12x(7)ni=o I,
The Xi are all positive and Xo > X, > X2 > ... , so a is bounded by
o< . o0o,, - Xo < 1E=o Ian 2 0
The dpper bound is attained when an = 0 for n > 0, so the opfimr! o'"put r
g(z) = aoo(e, x) (7.6)
132

Since this is the desired step response of the filter, we can obtain the impulse
response f(x) by differentiation.
f (x) = ao d )o(c, X) (7.7)
An approximation to the functions - z(c,x) due to Slepian (1965) can be used to
find a closed form expression for f(x).
0.(c,X) = 22- (n!)-I Hnc x)exp(c-)
where H(x) is a Hermite polynomial of degree n. This approximation is useful for
X < c - 1/ 4 and n < c. So po(c, x) may be approximated by a Gaussian for small
x, and the optimal spatial function f(x) will be the first derivative of a Gaussian
as before
f(x) = (kx)exp --- X )
In their original article, when Shanmugam et al (1979) assumed that the
function f(x) should be symmetric, they were restricted to the odd prolate spheroidal
functions ignoring 0(c, x) which in fact gives the best performance. The X,(c) may
be used as performance indices since they measure the fraction of the total energy in
the specified region for the corresponding ibi. The values of X0 may be significantly
higher than those of X1 for small values of c. The small values of c imply that the
product of spatial and frequency extent are minimal. For example at c = 0.5 the
value of X0 is about. 0.3 while the value of X1 is 0.0086 (see Slepian 1960).
The intent of this chapter has been to put the present edge detector in
context with several other well-known schemes. We have seen that there are strong
similarities in analytic form with several of these schemes, in particular with the
detectors of Marr and llildreth, Macleod, Haralick and Shanmugam et al. There
are also important differences, for example we have not yet considered the use of
multiple operators or of highly directional masks. Rosenfeld (1971) used several
133

sizes of difference of boxes, and formed a composite edge map by giving preference
to the largest operator which did not have a significantly lower response than the
next smaller operator. Marr (1976) argued both for highly directional operators
and for multiple scales, but reneged on the first requirement in later articles (1980)
mostly because of the apparent difficulty in implementating them. The present
design produces an edge map which is very similar in principle to the 1976 version
of the primal sketch, which was motivated purely by computational considerations.
134

8. Conclusions and Suggestions for Further Work
We began this report with a precise definition of a set of goals for edge detection
and proceeded to derive an operator which best achieved these goals. The goals
were carefully chosen with minimal assumptions about the form of an optimal edge
operator. The constraints imposed were that we would mark edges at the maxima
in the output of a linear shift-invariant operator. By expressing the criteria as
functionals on the impulse response of the edge detection operator, we were able
to optimize over a large solution space, without imposing constraint on the form of
the solution.
Using this technique with an initial model of a step edge in white Gaussian
noise, in chapter 2 we found that there was a fundamental limit to the simultaneous
detection and localization of step edges. This led to a natural uncertainty relationship
between the localizing and detecting abilities of the edge detector. This relationship
in turn led to a powerful constraint on the solution, i.e. that there is a class of
optimal operators all of which can be obtained from a single operator by spatial
scaling. By varying the width of this operator it is possible to vary the trade-off
in signal to noise ratio versus localization, at the same time ensuring that for any
value of one of the quantities, the other will be maximized.
It was then found that the goals as originally specified were not well defined,
or rather that the analytic criteria did not articulate all that we expected of the
edge detector. By adding an explicit criterion related to multiple responses, we were
able to obtain an operator that met all of our intuitive design goals. The multiple
response constraint did add considerable complexity to the form of the solution and
in fact it was not possible to realize a solution in fully closed form. However, the
analysis was able to constrain the solution to a finite (low) dimensional parameter
space over which a numerical solution could be obtained. The impulse response of
the operator is a sum of damped exponential cosines, and it can be approximated
by the first derivative of a Gaussian.
We then extended the above operator to two dimensions and in doing so we
followed the framework that was established for the one-dimensional formulation
135
.i

in chapter 2. The basic criteria of detection and localization were the motivating
concerns in the extension to two dimensions. It was found that multiple operator
widths were necessary to deal with different signal to noise ratios in an image
because of the trade-off described above. We also found that directional operators
have clear advantages over non-directional operators, and that the more directional
an operator is, the better its potential performance. The traditional problems
associated with highly directional operators were dealt with by using a goodness
of fit measure to decide whether each directional operator could be used. We then
faced the considerable problem of combining all these feature descriptions into a
coherent whole. Once again we used the same set of design goals to guide the
heuristics for choosing the appropriate operator. Feature synthesis was presented
as a means of combining the outputs of operators whose responses to the same
feature axe not necessarily spatially coincident.
The first selection heuristic was to give preference to operators of minimum
width provided they had sufficient signal to noise ratio. This gives maximum
resolution and localization for a given global signal to noise ratio. The combination
of different operator widths was difficult because of the lack of spatial coincidence
of different operator outputs. It was necessary to use feature synthesis (examples
were given in chapter 6) for the operator integration.
The second heuristic was to favour highly directional operators whenever they
have sufficient quality of fit to the image. The integration of different operator
orientations was relatively simple and required only a slightly more complicated
form of non-maximum suppression. Examples of this technique were given in
chapter 6. It is unclear which goodness of fit measure should be used, and although
an algorithm was presented which performs adequately, there was no demonstration
of its optimality. In fact there is some evidence (section 6.4) that the human visual
system, which in other respects demonstrates similarities to the detector described
here, uses a different (or more complicated) decision procedure.
To make the convolution of images with the optimal operator more efficient, a
first derivative of a Gaussian approximation was used. This allowed us to use any
of the efficient algorithms presented in section 3.2 to speed things up. It was found
13

that there exists an approximately "linear" time (in the width of a square mask)
algorithm for doing convolutions with arbitrary masks, and so eflicient convolution
is possible even without the approximation. E xperiments are now being performed
to determine the practicality of implementing this scheme in hardware.
In chapter 4 we were able to generalize the method used for step edges in
white Gaussian noise to arbitrary features and to non-white but stationary random
noise. In addition to a general form for the criteria, a fast numerical method for
the solution was described. This technique was then used to find optimal operators
for ridge and roof features. The ridge detector was extended to two dimensions,
and this was found to be much more difficult than for the edge operator because of
the lack of reliable information about the ridge direction. An example of the ridge
detector output appears in section (6.3), and was compared to the edge detector on
the same image.IFinally in chapters 6 and 7 some comparisons were made between the edge
detector derived here, the Marr-Hildreth (1980) operator and the difference of boxes
operator. There were both analytic and experimental comparisons. It was also
compared to two other edge operators, those of Haralick (1982) and of Shanmugam
et al. (1979), and was found to be similar to all of these in one dimension. Chapter 6
also included several examples of the edge detector output on some natural scenes.
Finally we saw in section 6.5 some perceptual effects which seem to indicate that
the human visual system uses a similar feature combination scheme.
There are several directions in which the work in this report could be continued.
The most obvious is probably the area of integration of feature descriptions. The
algorithm as described in this report includes a feature synthesis method to combine
output of several operators of differing width. It could potentially be used to
combine the outputs of detectors for different features, such as the ridge detector
described in chapter 4. It may be possible to form criteria on the performance of a
feature integration scheme. Two possible criteria are
(i) The integration scheme should not miss features. If a single feature is marked
by one of the detectors, it should be marked in the integrator output. Also,
if two feature detectors are responding at the same point in a way that is
137

not consistent with there being only a single feature in the image, then tile
integrator should mark both features on the output.
(ii) The integration scheme should produce an output with minimal redundancy.
An obvious scheme which performs well according to criterion (i would be to
simply mark everything seen by any feature detector. In this case no integration
of feature information is occurring, e.g. it is unnecessary to mark a ridge as
two parallel closely spaced edges if it has already been identified for what it
is. The feature integrator may be viewed as a filter on the outputs of all the
feature detectors which removes redundant information.
Both of the above criteria require a scheme which is non-local, that is it must
take into account the outputs of nearby feature detectors, not just those at a single
point. Feature synthesis is a non-local scheme as is the surface fitting approach
used in the Topographic Primal Sketch of Haralick (1983). It would be worth
comparing the two schemes according to the above criteria. The difficulty with
using an optimization scheme to find an optimal feature integrator is that a much
more complicated image model would be necessary. At the very least it would need
to include all those features for which the individual detectors were designed, and
presumably all possible combinations of those features.
Another possible extension of the edge detector would be to 3 or more
dimensions. We have already seen in chapter 3 that there is a simple extension of
the optimal operator to n dimensions. This operator locates n - 1 surfaces (the
n-dimensional extension of edge contours) where discontinuities in intensity occur.
Using highly directional operators is more difficult in this domain because of the
large number of directions needed to uniformly cover an n-sphere. Non-maximum
suppression is also more complicated for the same reason.
In particular it is possible to consider the detection of moving edges as a three
dimensional edge detection problem, where the third dimension is the time axis.
Edges in this three dimensional space correspond to edges in the two-dimensional
image or to points of rapidly changing irradiance. The direction of the edge in
the three-space can be used to determine the velocity or the two-dimensional edge.
There is a constraint that the time-space edge filter must be causal, that is it must
138

Udepend ortly on past and present intensity values. Using a filker that is broad in the
time domain will introduce a delay into the velocity estimate. Thus the d,'ign of
the time domain filter is a separate optimization problem which requires additional
constraints of causality and minimal time delay.
One final generalization of the techniques described in this report would be
to relax the restriction of linearity on the operator. Shift invariance is clearly a
desirable property of an edge detection operator, but it is not clear that the optimal
operator must be linear. In fact the composite operator derived in this report is
non-linear because it involves a non-local predicate (from the feature synthesis
scheme) applied to several operator outputs. Ideally this constraint should be either
relaxed or it should be proven that linear operators can perform as well as non-linear
operators. The restriction to linear operators here was necessary because of the
sheer complexity of parametrizing a non-linear shift invariant operator in a form
which would allow variational methods to be applied. It remains to be seen whether
this restriction penalizes performance, and whether an unconstrained non-linear
operator can do any better.
139

Appendix i. I)efinite Integrals used i,6 the Derivations
These integrals were referred to in chapter 2 but were not included there
because of their excessive length. There are 3 integrals required to evaluate (2.12),
and an additional integral is neccesary for (2.24). Of these 4 integrals, 3 can be
written in the same parametric form, because they all involve the integral of the
square of a function of the form
g(z) = cle" sin wx + c2e * cos wz + c3e- *' sin wx + c 4e-"a cos wx
We now define
Ii(CI,C 2,C3,C4) = g(x) dx and 12(Cl,c2,C3,C4) 9 ~ 2 (x) dx
And we find that all of the integrals in the performance criteria can be written
in terms of I and 12 thus
,f(x)dx = II(al,a 2 ,a 3,a)+c
f+1 f 2(x)dx = I2(al,a 2,a3, a4) + 4c11(al,a2,a3, a4)- 2C
f,2(x) dx = I2(,al - wa2, ca2 + wal, -a 3 - wa4, -fa + wa3)
J+I f 2 ( ) dz = 12(fla i - "ya2, f3a2 + Yal, Pa3 + a4, l a4 - a3)
where
140

3 - _ a 2 and /--2aw
The closed form for the definite integral II in terms of a, w, and cl through
c4 and for a unit interval (W =- 1) is
I(CIC 2 ,C3 ,C4 ) - I (cle(a sin w - w cos ) + wc
+c2e 0 (w sin w + a cos w) - ac2
+C3e-(a sin w + W COSw) - WC3
+c 4e-a(w sin w - a cosw) + aC4)
Similarly the closed form for 12 over the unit interval is
2(CIC 2 ,C3 , C4 ) - 1 (c2e2a(-aw2 sin 2w - a 2w cos 2w + w 3 + a 2w) - c w3
2aw3 + 2wa 3 1
+ce 2 (CW2 sin 2w + a 2 w cos 2&w + w 3 + a 2w)-C2(W -- 2a 2 W)
+C2e 2 a (-aw sin 2w + a 2w cos 2w - w3 -2 w) + c 2w 3
+c2e - 2a(aw2 sin 2w - a 2 w cos 2w - w 3 - a 2w)
+c 2(W3 + 2a 2W)+2cIC 2e 2 a(a 2 sin 2w - aw 2 cos 2wj) + 2ciC2aw 2
+2cIc3(a( 3 + aw 2 )(2w - sin 2w)
-4(cIc4 + c2c3)(a 3 + aw 2 ) sin 2 w
+2c 2c4(a 3 + aw 2)(2w + sin 2w)
+2csc 4 e- 2 (a 2 W sin 2w - aw 2 cos 2w) + 2c 3 c4 aW2)
141

9. References
Abdou I. E. and Pratt W. K. "Quantitative Design and Evaluation of Enhancement/Thresholding
Edge Detectors," IEEE Proc. 67, No. 6 (1979), 753-763.
Binford T. 0. "Inferring Surfaces from Images," Artificial Intelligence 17 (1981),
205-244.
Bingham C., Godfrey M.D., Tukey J.W. "Modern Techniques of Power Spectrum
Estimation," IEEE Trans. A.E. AU-15, No 2 (1967), 56-66.
Brady J. M. and Asada 11. "Smoothed Local Symmetries and their Implementation,"
To appear (1983).
Courant R. and Hilbert D. Methods of Mathematical Physics, vol. 1 , Wiley
Interscience, New York, 1953.
Davis L. S. "A Survey of Edge Detection Techniques," Computer Graphics and
Image Processing 4 (1975), 248-270.
Fram J. R. and Deutsch E. S. "On the Quantitative Evaluation of Edge Detection
Schemes and Their Comparison with Human Performance," IEEE Trans.
Computers C-24, No. 6 (1975), 616-628.
Grimson W. E. L. From Images to Surfaces , MIT Press, Cambridge, Ma., 1981.
Hamming R. W. Digital Filters, Prentice Hall, New Jersey, 1983.
Haralick R. M. "Edge and Region analysis for Digital Image Data," Computer
Graphics and Image Processing 12 (1980), 60-73.
Haralick R. M. "Zero-crossing of Second Directional Derivative Edge Operator,"
S.P.I.E. Proceedings on Robot Vision, Arlington Virginia, 1982.
Haralick R. M., Watson L. T. and Laffey T. L. "The Topographic Primal Sketch,"
Robotics Research To appear (1983).
Havens W. S. and Strikwerda J. C. "An Improved Operator for Edge Detection,"
To appear (1983).
142

llerskovits A. and Binford T. "'On Boundary Detection," M.I.T. Artificial Intelligence
Laboratory, Cambridge Mass., Al Memo 183, 1970.
lildreth E. C. "Implementation of a Theory of Edge Detection," M.I.T. Artificial
Intelligence Laboratory, Cambridge Mass., AI-TR-579, 1980.
llildreth E. C. "The Measurement of Visual Motion," Ph.D. Thesis, Dept. of
Electrical Engineering and Computer Science, MIT, Cambridge, Ma., 1983.
Horn B. K. P. "The Binford-florn Line-Finder," M.I.T. Artificial Intelligence
Laboratory, Cambridge Mass., Al Memo 285, 1971.
Horn B. K. P. "Obtaining Shape from Shading Information," The Psychology of
Computer Vision P.H. Winston, ed., McGraw Hill, New York, pp 115-155,
1975.
Hueckel M. H. "An Operator Which Locates Edges in Digitized Pictures," JACM
18, No. 1 (1971), 113-125.
Hummel R. A. "Edge Detection Using Basis Functions," Computer Graphics and
Image Processing 9 (1979), 40-55.
Jacobus C. J. and Chien R. T. "Two New Edge Detectors," IEEE Trans. P.A.M.I.
PAMI-3, No. 5 (1981), 581-592.
Liskov B., Atkinson R., Bloom T., Moss E., Schaffert C., Scheifler B., and Snyder
A. "CLU Reference Manual," MIT Laboratory for Computer Science, TR-225,
1979.
Luenberger D. G. Introduction to Linear and Non-Linear Programming
Addison-Wesley, Reading, Ma., 1973.
Macleod 1. D. G. "On Finding Structure in Pictures," Picture Language Machines
S. Kaneff ed. Academic Press, New York, pp 231, 1970.
Marr D. C. "Early Processing of Visual Information," Phil. Trans. R. Soc. Lond.
B 275 (1976), 483-524.
Marr D. C. and Hildreth E. "Theory of Edge Detection," Proc. R. Soc. Lond. B
207 (1980), 187-217.
143
-~ -. ~ - -mm

Marr D. C. and Poggio T. "A Theory of Human Stereo Vision," Proc. R?. Soc.
Lond. B 204 (1979), 301-328.
Modestino J. W. and Fries R. W. "Edge Detection in Noisy Images Using Recursive
Digital Filtering," Computer Graphics and Image Processing 6 (1977),
409-433.
Moon D., Stallman R. M., Weinreb D. "Lisp Machine Manual," MIT Cambridge,
Ma., 1983.
Pentland A. P. "Local Shape from Shading," Ph.D. Thesis, Dept. of Psychology,
MIT, Cambridge, Ma., 1982.
Pratt W. K. Digital Image Processing , Wiley Interscience, New York, 1978.
Prewitt J. M. S. "Object Enhancement and Extraction," Picture Processing and
Psychopictorics B. Lipkin & A. Rosenfeld Eds, Academic Press, New York,
pp, 75-149, 1970.
Rice S. 0. "Mathematical Analysis of Random Noise," Bell Sys. Tech. J. 24
(1945), 46-156.
Roberts L. G. "Machine Perception of 3-Dimensional Solids," Optical and
Electro-Optical Information Processing 3. Tippett, D. Berkowitz, L. Clapp,
C. Koester, A. Vanderbcrgh Eds, M.I.T. Press, Cambridge, pp 159-197, 1965.
Rosenfeld A. and Thurston M. "Edge and Curve Detection for Visual Scene
Analysis," IEEE Trans. Computers C-20, No. 5 (1971), 562-569.
Selionhage A., and Strassen V. "Schnelle Multiplikation grosser Zahlen," Computing
7 (1971), 281-292.
Shanniugam K. .S., Dickey F,. M. & Green J. A. "An Optimal Frequency Domain
Filter for Edge Detection in Digital Pictures," IEEET Trans. P.A.M.I. PAXMI-1,
No. 1 (1979), 37-49.
Slepian D. "Some Asymnptotic Expansions for Prolate Spheroidal Wave Functions,"
J. Math. Phys. MIT 44 (1965), 99.
144

Stevens K. A. "Surface Perception from Local Analysis of Texture and Contour,"
M.I.T. Artificial Intelligence Laboratory, Cambridge Mass., AI-TI-512, 1980.
Torre V. and Poggio T. "A Directional Second Derivative Zero-crossing Operator,"
To appear, 1983.
Ullman S. The Interpretation of Visual Motion , MIT Press, Cambridge, Ma.,
1979.
Wiener N. Extrapolation, Interpolation and Smoothing of Stationary Time
Series , MIT Press, Cambridge, Mass., 1949.
Witkin A. P. "Shape from Contour," M.I.T. Artificial Intelligence Laboratory,
Cambridge Mass., AI-TR-589, 1980.
Yuille A. "Zero-Crossings on Lines of Curvature," M.I.T. Artificial Intelligence
Laboratory, Cambridge Mass., To appear, 1983.
145

DATE-
FILMED