fluorescence detection in liquid chromatography a new ... · fluorescence detection in liquid...
TRANSCRIPT

Fluorescence detection inliquid chromatography
A new approach tolower limits of detection andeasy spectral analysis

2

3
A primer
A new approach tolower limits of detectionand easy spectral analysis
Applications offluorescence detectionin liquid chromatography
Rainer Schuster andHelmut Schulenberg-Schell

4
Copyright © 2000 Agilent TechnologiesAll rights reserved. Reproduction, adaption,or translation without proir written permissionis prohibited, except as allowed under thecopyright laws.
Printed in Germany 01/00
Publication number5968-9346E

5
Acknowledgment The authors would like to thank our Agilent Technologiescolleagues Thomas Dörr, Angelika Gratzfeld-Huesgen andLudwig Huber for fruitful discussions and review of themanuscript. Udo Huber and Angelika Gratzfeld-Huesgencontributed to the applications.

6
Preface High performance liquid chromatography (HPLC) is themethod of choice for separation and quantitation of polarand nonvolatile compounds. Retention time is the main toolfor identification of analytes. The complexity of real worldanalytical problems requires the confirmation of peakidentity through additional qualitative information. This canbe provided from several detector types: diode array, massspectrometric or fluorescence detectors.
In 1982 HP’s chemical analysis group (now part of AgilentTechnologies) introduced the first commercially availablediode array detector (DAD) for HPLC. This detector addeda third dimension–wavelength–to the chromatogram inaddition to retention time and signal intensity. The diodearray detector records UV/Visible absorption spectra inmilliseconds while compounds are eluting from a column.A single chromatographic run provides quantitative resultsfrom the signal intensity and qualitative spectral informationfor peak confirmation. The improvements in detectordesign and the lower price have made it a sensitive andcost-effective tool that is about to replace single wavelengthUV-detectors, even those performing routine analyses.
Since the mid 1990s, mass spectrometric detectors for liquidchromatography (LC-MSD) have been available to provideanalysts with both molecular weight and structural informa-tion for peak confirmation. The ruggedness and easy use ofthe instrumentation make this technique available for thechromatographer. From research and development, thetechnique will make its way into the cost-sensitive routineQA/QC laboratories.
The fluorescence detector (FLD) is one of the most sensitivedetectors in liquid chromatography. Both excitation andemission fluorescence spectra help to characterize indi-vidual compounds. While excitation spectra are identicalto UV/Visible absorption spectra, emission spectra can giveadditional information. Until recently, however, FLDs havebeen built to provide single-wavelength information.

7
Fluorescence spectra had to be acquired under stop-flowconditions and data analysis was time-consuming andcumbersome compared to data analysis of UV/Visiblespectra.
A completely new approach to fluorescence detector designhas overcome these drawbacks and even improved thesensitivity. The Agilent 1100 Series fluorescence detectoracquires spectra online simultaneously with the detectorsignal. During method development, one or two chromato-graphic runs can be sufficient to optimize wavelengthsettings for a series of analytes. This replaces tedious stop-flow experiments for each individual compound. Fluores-cence spectral data are analyzed with the same easy-to-usesoftware tools as diode array spectra. In addition, up to fourwavelengths can be recorded simultaneously to replacetimetable-based wavelength switching. This ensuresmaximum sensitivity and selectivity without sacrificing thereliability of the analytical method in routine analysis ofreal-world samples.
This primer introduces the new fluorescence detectortechnology and describes new strategies for rapid methoddevelopment. A selection of applications demonstrates thewealth of information available with this new approach tofluorescence detection.
8
Tabl
e of
con
tent
Chapter 1Fluorescence detector technology ..................................................................................... 9How the fluorescence detector works .......................................................................................... 11Data handling ................................................................................................................................... 12How to measure limits of detection .............................................................................................. 14
Chapter 2Strategies for rapid method development ....................................................................... 15Step 1: Check the HPLC system for impurities ............................................................................ 17Step 2: Optimize limits of detection and selectivity ................................................................... 18
Procedure I – Take a fluorescence scan .................................................................................... 19Procedure II – Take two HPLC runs with FLD ......................................................................... 21Procedure III – Make a single run with the Agilent 1100 Series DAD/FLD combination ... 23
Step 3: Set up routine methods ...................................................................................................... 25Multi wavelength detection ........................................................................................................ 25Fluorescence spectral libraries for peak confirmation ........................................................... 26
Chapter 3The applications ................................................................................................................... 29Environmental:
Polynuclear aromatic hydrocarbons ......................................................................................... 30Carbamates ................................................................................................................................... 33Glyphosate .................................................................................................................................... 37
Food:Mycotoxins ................................................................................................................................... 40Aflatoxins B1/B2 and G1/G2 ....................................................................................................... 40Ochratoxin A ................................................................................................................................ 42Vitamins B2 and B6 ...................................................................................................................... 43
Pharmaceutical:Quinidine....................................................................................................................................... 46Warfarin ......................................................................................................................................... 48Amino acids .................................................................................................................................. 50
References........................................................................................................................................ 52
Index ................................................................................................................................................. 53

9
Chapter 1
Fluorescencedetectortechnology

10
Fluo
resc
ence
det
ecto
r tec
hnol
ogy
Fluorescence detectors offer high selectivity combinedwith superior limits of detection (LOD) compared to UVdetectors. Only about 10 percent of organic moleculeshave fluorophore structures, which enable the moleculesto absorb light over a range of wavelengths. This takeselectrons in the molecule to an excitation level as with anyother molecule containing a chromophore. The fluorescentmolecule has the ability to emit the absorbed energy atlonger wavelengths (ref. 1).If the fluorescent light intensities are recorded while theexcitation wavelength is changed and the emission wave-length is fixed, an excitation spectrum can be obtained.Or the excitation wavelength may be fixed and the emissionwavelength changed. This procedure provides an emissionspectrum of the analyte. Compounds without this nativefluorescence may be derivatized to attach a fluorescentmarker molecule in a pre- or post-column reaction (ref. 2).
Fluorescence detectors offer limits of detection down to theppt level. The signal intensities are very low compared to UVabsorption and they are measured ideally versus a very lowbackground noise level. This is inherently more sensitivethan comparing two relatively large signals from a blank anda sample as done in UV absorption spectroscopy. However,the sensitivity of fluorescence detection is dependent onboth the fluorophore properties and the detector design andsettings. The response of a fluorophor is characterized bymolar absorptivity and quantum yield at the applied experi-mental conditions. The sensitivity of the fluorescencedetector depends on several factors: source intensity,efficiency of the optical system, bandwidth and so forth.

11
How the fluorescencedetector works
Figure 1Optical design of the Agilent 1100 Seriesfluorescence detector
Fluo
resc
ence
det
ecto
r tec
hnol
ogy
Xenonflash lamp
Excitationmonochromator
Emissionmonochromator
Sample
Photo-multiplier
Lens
Mirror
Photodiode
Lens
Previous fluorescence detectors were equipped with motor-driven gratings for programmable excitation and emissionwavelengths. The detector layout enabled positioning for asingle wavelength at a time and required stop-flow condi-tions for acquisition of spectra. Thus, acquiring fluores-cence spectra was time-consuming and optimizing excita-tion and emission wavelengths was not possible withoutdisturbing chromatographic separations.
The new optical design of the Agilent 1100 Series fluores-cence detector is illustrated in figure 1. A Xenon flash lampis used to offer the highest light intensities for excitation inthe UV range. The flash lamp ignites only for microsecondsto provide light energy. Each flash causes fluorescence inthe flow cell and generates an individual data point for thechromatogram. Since the lamp is not powered on duringmost of the detector operating time, it offers a lifetime ofseveral thousand hours. No warmup time is needed to get astable baseline. A holographic grating is used as a mono-chromator to disperse the polychromatic light of the Xenonlamp. The desired wavelength is then focused on the flowcell for optimum excitation. To minimize stray light fromthe excitation side of the detector, the optics are configuredsuch that the emitted light is recorded at a 90 degree angleto the incident light beam. Another holographic grating isused as the emission monochromator. Both monochroma-tors have optimized light throughput in the visible range.A photomultiplier tube is the optimum choice to measurethe low light intensity of the emitted fluorescence light.Since flash lamps have inherent fluctuations with respect toflash-to-flash intensity, a reference system based on aphotodiode measures the intensity of the excitation andtriggers a compensation of the detector signal.
Since the vast majority of emission maxima are above280 nm, a cut-off filter (not shown) prevents stray lightbelow this wavelength to enter the light path to the emis-sion monochromator. The fixed cut-off filter and bandwidth(20 nm) avoid the hardware checks and documentation

12
Data handling
Fluo
resc
ence
det
ecto
r tec
hnol
ogy
work that is involved with an instrument that has exchange-able filters and slits.
The excitation and emission monochromators can switchbetween signal and spectral mode. In signal mode they aremoved to specific positions that encode for the desiredwavelengths, as with a traditional detector. This mode offersthe lowest limits of detection since all data points aregenerated at a single excitation and emission wavelength.
The spectral mode is used to obtain multi-signal or spectralinformation. The ignition of the flash lamp is synchronizedwith the rotation of the gratings, either the excitation oremission monochromator. The motor technology for thegratings is a long-life design as commonly used in high-speed PC disk drive hardware. Whenever the grating hasreached the correct position during a revolution, the Xenonlamp is ignited to send a flash. The flash duration is belowtwo microseconds while the revolution of the grating takesless than 14 milliseconds. Because of the rotating mono-chromators, the loss in sensitivity in the spectral mode ismuch lower compared to conventional dual-wavelengthdetection with UV detectors.
In addition to its use as a detector for liquid chromatogra-phy, the Agilent 1100 Series FLD offers capabilities for off-line measurements in a refillable cuvette to obtain excita-tion and emission spectra in a single task for a pure com-pound. The result of this fluorescence scan can be viewed ina three-dimensional plot showing excitation wavelength,emission wavelength and fluorescence intensity on the axis.
The sequence of data handling is shown schematically infigure 2. The example describes the collection of excitationspectra and a signal with Ex 250 nm/Em 350 nm. Alternatingflashes are used either for chromatographic signals or tocontribute to spectra acquisition. About every 14 millisec-

13
Figure 2Schematic representation of data flowin spectral modeOne signal at Ex 250 nm/Em 350 nm isrecorded and excitation spectra are takenstarting at Ex 230 nm.
Spectrum
Chromatogram
Wavelength
Time
Flash# Time Ex Em Intensity [msec] [nm] [nm]
1* 0 250 350 5 2 14 230 350 4 3 28 250 350 8
4 42 240 350 15 5 56 250 350 15
6 70 250 350 30 7 84 250 350 30 8 98 260 350 25
*flash duration = 1 microsecond
Fluo
resc
ence
det
ecto
r tec
hnol
ogy
With chromatographic data in three dimensions (emissionor excitation wavelengths, retention time and intensity),the analysis can be displayed either in a three-dimensionalplot or in a two-dimensional “isofluorescence” plot. Differ-ent colors signify different fluorescence intensities.
Spectra can be evaluated against spectra from customizedspectral libraries to determine compound identity or tocontrol peak purity within a peak. While the quality offluorescence spectra has proven to be useful for severalapplications, it has to be emphasized that UV/Vis spectraobtained with a diode array detector are of superior quality,especially for trace analysis.
onds, a data point is obtained. The spectrum starts at230 nm. Just as with a DAD system, the fluorescence spectraand signals can be watched online and both types of dataare stored on the PC hard disk. Additional signals can beextracted from the spectral data set during post-run dataanalysis. Spectral data points are corrected automaticallyfor intensity changes over time based on the signal data.

14
Fluo
resc
ence
det
ecto
r tec
hnol
ogy
Figure 3Raman signal-to-noise (S/N)measurementSignal and ASTM noise at 397 nm (water),excitation at 350 nm, PMT=12, responsetime 8 s
How to measure limitsof detection
Fluorescence spectrophotometers can be qualified by thesignal-to-noise ratio (S/N) for the Raman band for water oras a limit of detection (LOD) for a specific fluorescentcompound.(ref.3)
The Raman band is a result of Raman light scattering andnot due to fluorescence. It simulates the phenomenon offluorescence as it involves an initial light signal at a specificwavelength that causes a signal to occur at a longer wave-length. The specification based on Raman stray light is givenas the ratio of signal to noise with the excitation wavelengthat 350 nm and emission at 397 nm. The short-term noise ismeasured at 397 nm (figure 3) according to the proceduresdescribed in ASTM method 1657/94. For both values, thedark value at 450 nm (where no stray light appears) is takenas a reference point for the scale. Raman values greater than400 are typical for fluorescence detectors in HPLC.
If anthracene is used to measure detector specifications,limits of detection as low as 10 femtogram anthracene arepossible.
LU
38
36
34
32
30
28
26
24
0 2.5 5 7.5 10 12.5 [min]2017.515
Signal and ASTM noise at 350/397 nm
Dark value at 350/450 nm
Raman S/N =Signal (397 nm) – dark value (450 nm)
ASTM noise (397 nm) – dark value (450 nm)
15
Chapter 2
Strategies forrapid methoddevelopment

16
Met
hod
deve
lopm
ent
Fluorescence detectors are used in liquid chromatographywhen superior limits of detection and selectivity are re-quired. Thorough method development, including spectraacquisition, is fundamental to achieve good results. Thischapter describes three different steps that can be takenwith the Agilent 1100 Series fluorescence detector. Table 1gives an overview of how to benefit from the operationmodes during these steps.
Table 1Steps for thorough method development
Step 1: Step 2: Step 3:Check system Optimize limits of Set up routine
detection and methodsselectivity
Fluorescence Find impurities Determinescan (for example, in simultaneously the
solvents and excitation and emissionreagents) spectra of a pure
compound
Signal mode Perform wavelength Use for lowestswitching limits of detection
Spectral mode/ Determine Ex/Em Collect onlinemulti-wave- spectra for all spectra, performlength separated compounds library search,detection in a single run determine peak
purityActivate up to four Replacewavelengths wavelengthsimultaneously switching

17
Step 1:Check the HPLC systemfor impurities
A critical issue in trace level fluorescence detection is tohave an HPLC system free of fluorescent contamination.Most contaminants derive from impure solvents. Taking afluorescence scan is a convenient way to check the qualityof the solvent in a few minutes. This can be done, forexample, by filling the FLD cuvette directly with thesolvent for an offline measurement even before the start ofa chromatographic run. The result can be displayed as anisofluorescence plot or a three-dimensional plot. Differentcolors reflect different intensities.
Figure 4 shows a sample of slightly impure water which wasplanned for use as mobile phase. The area where fluores-cence of the contaminated water sample can be seen isbetween the stray light areas: the first- and second-orderRaleigh stray light and Raman stray light. Since “excitation”and “emission” wavelength are the same for Raleigh straylight, the area of first-order Raleigh stray light is visible inthe left upper area of the diagram. The Raman bands ofwater are seen below the first-order Raleigh stray light.Since the cut-off filter cuts off light below 280 nm, thesecond-order Raleigh stray light starts above 560 nm.
Stray light acts in the same way as impurities in that itsimulates background noise. In both cases, a higher noiselevel and therefore a higher limit of detection are obtained.This indicates that high sensitivity measurements should bedone away from wavelength settings that have a high straylight background.
Figure 4Isofluorescence plot of a mobile phaseA pure water sample was put into theflow cell. Spectra were recorded at 5 nmstep sizes.
Impurity 1. order Raman 2. order
450 nm
220 nm
Emission
Exci
tatio
n
600 nm
Met
hod
deve
lopm
ent

18
Met
hod
deve
lopm
ent
Wavelength [nm]250 300 350 400 450 500 550
Norm.
0
5
10
15
20
25
30
35
40
Excitation Emission
600
Figure 5Excitation and emission spectra ofquinidineExcitation spectrum with emission at440 nm, emission spectrum with excitationat 250 nm of 1 µg/ml quinidine.Detector settings: step size 5 nm, PMT 12,Response time 4 s.
Step 2:Optimize limits ofdetection andselectivity
To achieve optimum limits of detection and selectivity,analysts must find out about the fluorescent properties ofthe compounds of interest. Excitation and emission wave-lengths can be selected for optimum limits of detection andbest selectivity. In general, fluorescence spectra obtainedwith different instruments may show significant differencesdepending on the hardware and software used. (ref. 4)
The traditional approach is to extract an appropriateexcitation wavelength from the UV spectrum that is similarto the fluorescence excitation spectrum (see figure 5) andto record the emission spectrum. Then with an optimumemission wavelength determined, the excitation spectrumis acquired.
These tasks have to be repeated for each compound usingeither a fluorescence spectrophotometer or stop-flowconditions in HPLC. Usually each compound requires aseparate run. As a result, a set of excitation and emissionspectrum is obtained (figure 5) for each compound. Sincethis is a tedious procedure, it is applicable only when thereis a limited number of compounds of interest.

19
Met
hod
deve
lopm
ent
The Agilent 1100 Series HPLC offers three differentways to obtain complete information on a compound’sfluorescence:
Procedure I - Take a fluorescence scan offline for a singlecompound as described above for the mobile phase. This isdone preferably with a manual FLD cuvette when purecompounds are available.
Procedure II - Use two HPLC runs with the Agilent 1100Series FLD to separate the compound mix under knownconditions and acquire emission and excitation spectraseparately.
Procedure III - Use an Agilent 1100 Series FLD/DADcombination and acquire UV/Visible spectra (equivalent toexcitation spectra) with the DAD and emission spectra withthe FLD—both in a single run.
Procedure I – Take a fluorescence scanBecause fluorescence spectra traditionally have not beeneasily available with previous HPLC fluorescence detectors,standard fluorescence spectrophotometers have been usedin the past to acquire spectral information for unknowncompounds. Unfortunately this approach limits optimiza-tion, as there are differences expected in optical designbetween an HPLC detector and a dedicated fluorescencespectrophotometer, or even between detectors. Thesedifferences can lead to variations for the optimum excita-tion and emission wavelengths.
The Agilent 1100 Series fluorescence detector offers afluorescence scan that delivers all spectral informationpreviously obtained with a standard fluorescence spectro-

20
Met
hod
deve
lopm
ent
Figure 6Characterization of a pure compoundfrom a fluorescence scanAll excitation and emission spectra ofQuinidine (1 µg/ml) are shown in onegraphic. Fluorescence intensity is plottedvs. excitation and emission wavelengths.Figure 5 gives detector settings.
straylight1. order 350 nm Ex 315 nm Ex 250 nm Ex
Ex-axis Em-axis
photometer, independent of the HPLC fluorescence detec-tor. Figure 6 shows the complete information for quinidineas obtained with the Agilent 1100 Series FLD and a manualcuvette in a single offline measurement. The optima forexcitation and emission wavelengths can be extracted ascoordinates of the maxima in the three dimensional plot.One of the three maxima in the center of the plot can bechosen to define the excitation wavelength. The selectiondepends on the additional compounds that are going to beanalyzed in the chromatographic run and the backgroundnoise that may be different upon excitation at 250 nm,315 nm or 350 nm. The maximum of emission is observedat 440 nm.
440 Em

21
Procedure II – Take two HPLC runs with theFLDThe conditions for the separation of organic compoundssuch as polyaromatic nuclear hydrocarbons (PNAs) are welldescribed in various standard methods, including commonlyused EPA and DIN methods. Achieving the best detectionlevels requires checking for the optimum excitation andemission wavelengths for all compounds. Yet taking fluores-cence scans individually makes this a tedious process. Abetter approach is to acquire spectra online for all com-pounds during a run. This speeds up method developmenttremendously. Two runs are sufficient for optimization.
During the first run, one wavelength is chosen in the lowUV range for the excitation wavelength and a spectral rangefor the emission wavelength. Most fluorophores show strongabsorption at these wavelengths. Excitation is sufficient forcollecting emission spectra.
Figure 7 contains all emission spectra obtained in a singlerun from a mix of 15 PNAs. This set of spectra is used to setup a timetable for optimum emission wavelengths for allcompounds.
The individual compound spectra in the isofluorescenceplot show that at least three emission wavelengths areneeded to detect all 15 PNAs properly:
0 min: 350 nm for naphthalene to phenanthrene8.2 min: 420 nm for anthracene to benzo(g,h,I)perylene19.0 min: 500 nm for indeno(1,2,3-cd)pyrene
In the second run, three setpoints for emission wavelengthsare entered into the time-program and excitation spectraare recorded, as shown in figure 8. The area of high intensity(red) is caused by stray light when emission spectra overlapwith the excitation wavelength. This can be avoided byfitting the spectral range automatically. Excitation at260 nm is most appropriate for all PNAs.
Met
hod
deve
lopm
ent

22
Met
hod
deve
lopm
ent
Conditions for figure 7 and 8Column Vydac, 2.1 × 200 nm,
PNA, 5 µmMobile phase A = water; B = acetonitrileGradient 3 min, 60 %B;
14 min, 90 %B;22 min, 100 %B
Flow rate 0.4 ml/minColumntemperature 18 °CInjectionvolume 5 µlFLD settings PMT 12,
response time 4 s,step size 5 nm
Figure 8Optimization of the time-program for theexcitation wavelength
Figure 7Optimization of the time-program for theemission wavelengthThis shows the isofluorescence plot ofemission spectra for 15 PNAs (5 µg/ml)with a fixed excitation wavelength (260 nm).
LU
102030405060
220 nm
400 nm
350 nm 420 nm 500 nm Emissionswitching
1
2
34
5
67
8
910
11
12
13
14
1 Naphthalene2 Acenaphthene3 Fluorene4 Phenanthrene5 Anthracene6 Fluoranthene7 Pyrene
8 Benz(a)anthracene9 Chrysene10 Benzo(b)fluoranthene11 Benzo(k)fluoranthene12 Benz(a)pyrene13 Benzo(g,h,i)perylene14 Indeno(1,2,3-cd)pyrene
Excitationspectra
0 2.5 7.5 10 12.5 15 17.5 20 22.5Time [min]
5
LU
102030405060
300 nm
600 nm
1
2
34
5
67
8
910
11
12
13
14
1 Naphthalene2 Acenaphthene3 Fluorene4 Phenanthrene5 Anthracene6 Fluoranthene7 Pyrene
8 Benz(a)anthracene9 Chrysene10 Benzo(b)fluoranthene11 Benzo(k)fluoranthene12 Benz(a)pyrene13 Benzo(g,h,i)perylene14 Indeno(1,2,3-cd)pyrene
Em-spectra
fixed Ex
0 2.5 5 7.5 10 12.5 15 17.5 20 22.5Time [min]

23
Table 2Timetable for the analysis of 15 poly-nuclear aromatic hydrocarbonsThis timetable gives the conditions foroptimum detection based on the resultsof two chromatographic runs.
Time Excitation Emission[min] wavelength wavelength
[nm] [nm]
0 260 3508.2 260 420
19.0 260 500
Met
hod
deve
lopm
ent
The obtained data are combined to setup the time-table forfor best limit of detection and selectivity. The optimizedswitching events for this example are summarized intable 2.
Procedure III – Make a single run with theAgilent 1100 Series DAD/FLD combinationFor most organic compounds, UV-spectra from diode arraydetectors are nearly identical to fluorescence excitationspectra. Spectral differences are caused by specific detectorcharacteristics such as spectral resolution or light sources.
In practice, combining a diode array detector with a fluores-cence detector in series gives the full data set needed toachieve the optimum fluorescence excitation and emissionwavelengths for a series of compounds in a single run. Withthe UV/Visible/excitation spectra available from the diodearray detector, the fluorescence detector is set to acquireemission spectra with a fixed excitation wavelength in thelow UV range.
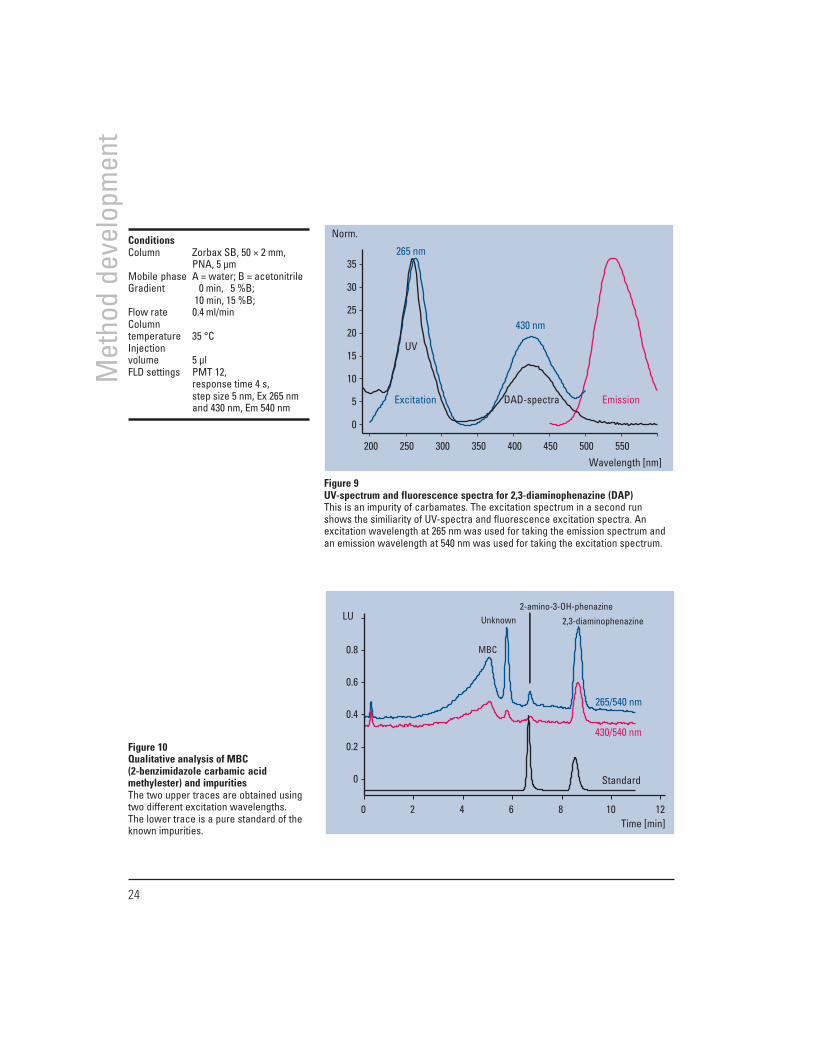
The example is taken from the quality control of carbam-ates. Samples are analyzed for the impurities 2,3-diamino-phenazine (DAP) and 2-amino-3-hydroxyphenazine (AHP).Reference samples of DAP and AHP were analyzed withdiode array and fluorescence detection. Figure 9 shows thespectra obtained from both detectors for DAP. The excita-tion spectrum of DAP is very similar to the UV absorptionspectrum from the diode array detector. Figure 10 showsthe successful application of the method to a carbamatesample and a pure mixture of DAP and AHP for reference.The column was overloaded with the non-fluorescentcarbamate (2-benzimidazole carbamic acid methylester/MBC) to see the known impurities, AHP and DAP.
24
Met
hod
deve
lopm
ent
Wavelength [nm]200 250 300 350 400 450 500 550
0
5
10
15
20
25
30
35
Excitation Emission
430 nm
265 nm
DAD-spectra
UV
Norm.
Time [min]0 2 4 6 8 10 12
LU
0
0.2
0.4
0.6
0.8
430/540 nm
Standard
Unknown2-amino-3-OH-phenazine
2,3-diaminophenazine
MBC
265/540 nm
Figure 9UV-spectrum and fluorescence spectra for 2,3-diaminophenazine (DAP)This is an impurity of carbamates. The excitation spectrum in a second runshows the similiarity of UV-spectra and fluorescence excitation spectra. Anexcitation wavelength at 265 nm was used for taking the emission spectrum andan emission wavelength at 540 nm was used for taking the excitation spectrum.
ConditionsColumn Zorbax SB, 50 × 2 mm,
PNA, 5 µmMobile phase A = water; B = acetonitrileGradient 0 min, 5 %B;
10 min, 15 %B;Flow rate 0.4 ml/minColumntemperature 35 °CInjectionvolume 5 µlFLD settings PMT 12,
response time 4 s,step size 5 nm, Ex 265 nmand 430 nm, Em 540 nm
Figure 10Qualitative analysis of MBC(2-benzimidazole carbamic acidmethylester) and impuritiesThe two upper traces are obtained usingtwo different excitation wavelengths.The lower trace is a pure standard of theknown impurities.

25
Met
hod
deve
lopm
ent
Step 3:Set up routine methods
In routine analysis, sample matrices can have a significantinfluence on retention times. For reliable results, samplepreparation must be thorough to avoid interferences orHPLC methods must be rugged enough. With difficultmatrices, simultaneous multi-wavelength detection offersmore reliability than timetable-controlled wavelengthswitching. The Agilent 1100 Series FLD can, in addition,acquire fluorescence spectra while it records the detectorsignals for quantitative analysis. Therefore qualitative dataare available for peak confirmation and purity checks inroutine analysis.
Multi wavelength detectionTime-programmed wavelength switching traditionally isused to achieve low limits of detection and high selectivityin routine quantitative analysis. Such switching is difficultif compounds elute closely and require a change in excita-tion or emission wavelength. Peaks can be distorted andquantitation made impossible if wavelength switchingoccurs during the elution of a compound. Very often thishappens with complex matrices, influencing the retentionof compounds.
In spectral mode, the Agilent 1100 Series FLD can acquireup to four different signals simultaneously. All of them canbe used for quantitative analysis. Apart from complexmatrices, this is advantageous when watching for impuritiesat additional wavelengths. It is also advantageous forreaching low limits of detection or increasing selectivitythrough optimum wavelength settings at any time. Thenumber of data points acquired per signal is reduced andthus limits of detection may be higher, depending on thedetector settings compared to the signal mode.
PNA analysis, for example, can be performed with simulta-neous multi wavelength detection instead of wavelength-switching. With four different wavelengths for emission, all15 PNAs can be monitored (figure 11).

26
ConditionsColumn Vydac, 2.1 × 250 mm,
PNA, 5 µmMobile phase A = water; B = acetonitrileGradient 3 min, 60 %B;
14.5 min, 90 %B;22.5 min, 95 %B
Flow rate 0.4 ml/minColumntemperature 22 °CInjectionvolume 2 µlFLD settings PMT 12,
response time 4 s
1 excitation WL at 260 nm4 emission WL at 350, 420,
440 and 500 nm
Ex=260, Em=350
Ex=260, Em=420
Ex=260, Em=440
Ex=260, Em=500
Ex=275, Em=350, TTReference chromatogram with switching events
0 5 10 15 20 25
LU
0
20
40
60
80
100
120
140
160
180
Time [min]
12
3
5
6
78
9
10
11
12
13 14
154
1 Naphthalene2 Acenaphthene3 Fluorene4 Phenanthrene5 Anthracene6 Fluoranthene7 Pyrene
8 Benz(a)anthracene9 Chrysene10 Benzo(b)fluoranthene11 Benzo(k)fluoranthene12 Benz(a)pyrene13 Dibenzo(a,h)anthracene14 Benzo(g,h,i)perylene15 Indeno(1,2,3-cd)pyrene
Figure 11Simultaneous multi wavelengthdetection for PNA-analysisThe upper trace was received withtraditional wavelength switching.
Fluorescence spectral libraries for peakconfirmationPreviously, only diode array detectors and mass spectromet-ric detectors could deliver spectral information on-line toconfirm peak identity as assigned by retention time.Now, fluorescence detectors provide an additional tool forautomated peak confirmation and purity control. Noadditional run is necessary after the quantitative analysis.
During method development, fluorescence excitation andemission spectra are collected from reference standards andentered into a library–at the choice of the method devel-oper. All spectral data from unknown samples can then becompared automatically with library data. Table 3 illustrates
Met
hod
deve
lopm
ent
��Ex/Em = 260/420 nm��Ex/Em = 270/440 nm��Ex/Em = 260/420 nm��Ex/Em = 290/430 nm��Ex/Em = 250/550 nm
� � � � �
27
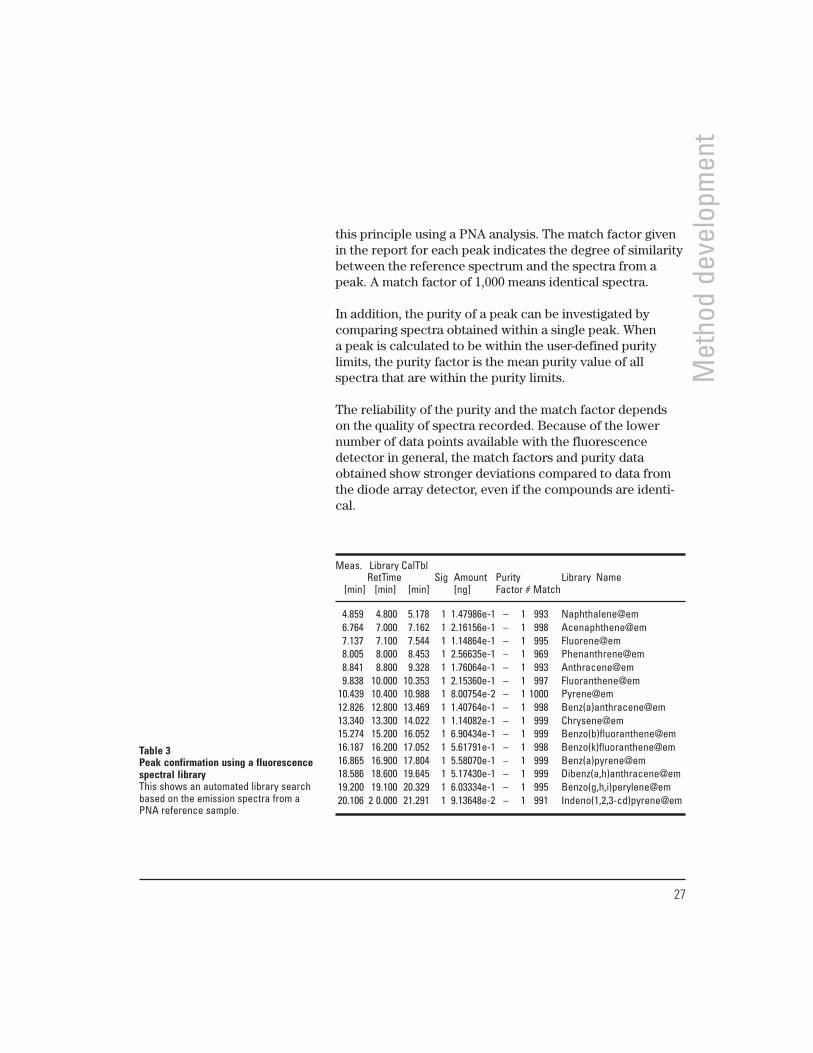
this principle using a PNA analysis. The match factor givenin the report for each peak indicates the degree of similaritybetween the reference spectrum and the spectra from apeak. A match factor of 1,000 means identical spectra.
In addition, the purity of a peak can be investigated bycomparing spectra obtained within a single peak. Whena peak is calculated to be within the user-defined puritylimits, the purity factor is the mean purity value of allspectra that are within the purity limits.
The reliability of the purity and the match factor dependson the quality of spectra recorded. Because of the lowernumber of data points available with the fluorescencedetector in general, the match factors and purity dataobtained show stronger deviations compared to data fromthe diode array detector, even if the compounds are identi-cal.
Table 3Peak confirmation using a fluorescencespectral libraryThis shows an automated library searchbased on the emission spectra from aPNA reference sample.
Meas. Library CalTbl RetTime Sig Amount Purity Library Name [min] [min] [min] [ng] Factor # Match
4.859 4.800 5.178 1 1.47986e-1 – 1 993 Naphthalene@em 6.764 7.000 7.162 1 2.16156e-1 – 1 998 Acenaphthene@em 7.137 7.100 7.544 1 1.14864e-1 – 1 995 Fluorene@em 8.005 8.000 8.453 1 2.56635e-1 – 1 969 Phenanthrene@em 8.841 8.800 9.328 1 1.76064e-1 – 1 993 Anthracene@em 9.838 10.000 10.353 1 2.15360e-1 – 1 997 Fluoranthene@em 10.439 10.400 10.988 1 8.00754e-2 – 1 1000 Pyrene@em 12.826 12.800 13.469 1 1.40764e-1 – 1 998 Benz(a)anthracene@em 13.340 13.300 14.022 1 1.14082e-1 – 1 999 Chrysene@em 15.274 15.200 16.052 1 6.90434e-1 – 1 999 Benzo(b)fluoranthene@em 16.187 16.200 17.052 1 5.61791e-1 – 1 998 Benzo(k)fluoranthene@em 16.865 16.900 17.804 1 5.58070e-1 – 1 999 Benz(a)pyrene@em 18.586 18.600 19.645 1 5.17430e-1 – 1 999 Dibenz(a,h)anthracene@em 19.200 19.100 20.329 1 6.03334e-1 – 1 995 Benzo(g,h,i)perylene@em 20.106 2 0.000 21.291 1 9.13648e-2 – 1 991 Indeno(1,2,3-cd)pyrene@em
Met
hod
deve
lopm
ent

28
Met
hod
deve
lopm
ent

29
Chapter 3
The applicationsEnvironmental• Polynuclear aromatic hydrocarbons• Carbamates• Glyphosate
Food• Aflatoxins B1/B2 and G1/G2• Ochratoxine A• Vitamins B2 and B6
Pharmaceutical• Quinidine• Warfarin• Amino acids

30
Envi
ronm
enta
l app
licat
ions
Polynuclear aromatic hydrocarbons (PNA) are formedduring pyrolysis or incomplete combustion in industrial orprivate heaters, automobile exhaust fumes and tobaccosmoke. These compounds are in many oil products such asdiesel fuel, gasoline and bitumen. PNAs have become aubiquitous class of compounds found in all environmentalmatrices, including air, soil and water.
Many PNAs have been found to be carcinogenic or mu-tagenic. Because their structures differ, some are morecarcinogenic than others. Benzo(e)pyrene, for example, is aweak carcinogen, while isomeric benzo(a)pyrene is a strongcarcinogen. For this reason, maximum concentration limitshave been set for each individual PNA in air, soil andespecially in water samples.
Most environmental regulations in the U.S., many countriesin Asia, and eastern Europe require PNA analysis accordingto U.S. Environmental Protection Agency (EPA) methods.These include analysis of 16 individual PNAs. In westernEurope, most official methods describe the analysis of thesame set of compounds as the EPA methods—except theEuropean methods do not include acenaphthylene, a com-pound which does not show any fluorescence. A rapidmethod for analyzing only six PNAs using a fast isocraticHPLC method is described in the German standard methodDIN 38 407 F8.
Experiments and resultsWith the rapid HPLC method, a PNA analysis is achieved inless then 10 min on a 25 cm microbore column (shown infigure 12). The lowest limits of detection for five of the sixcompounds is found at Ex 360 nm/Em 429 nm. For the lastcompound, the optimum is found at Ex 360/Em 490 nm andthe compromise (Ex 360/Em 465 nm) gives medium limits
Polynuclear aromatichydrocarbons

31
ConditionsIsocratic methodColumn Vydac, 2.1 × 250 nm,
PNA, 5 µmMobile phase Water/acetonitrile = 10/90Flow rate 0.4 ml/minColumntemperature 18 °CInjectionvolume 75 µlFLD settings PMT 12,
response time 4 s,step size 5 nm,Ex 360 nm, Em 465 nm
LU 1
24
5
31 Fluoranthene2 Benzo(k)fluoranthene3 Benzo(b)fluoranthene4 Benz(a)pyrene5 Benzo(ghi)perylene6 Indeno(1,2,3-cd)pyrene
2 4 6 8 10 12 14 16 18
2
4
6
8
10
Position-mode75ul ( 2ppb) = 150 pg
LOD - 26ppt
LOD - 7.6ppt
LOD - 3.3ppt
LOD - 4.9ppt
6
Time [min]
of detection for all. The detection limit for five of thePNAs is down to 100 fg and 1 pg absolute for indeno(1,2,3-cd)pyrene (Ex 360 nm/Em 490 nm), the last eluting com-pound. Increasing the injection volume achieves evenbetter detection limits—down to low ppt levels.
Figure 12Determination of PNAs according to DIN 38407 F8 down to a low ppt-levelA 2 ppb reference standard was analyzed at Ex 360 nm/Em 465 nm, with aninjection volume of 75 µl. The limits of detection (LOD) are given at the S/N ratio=2.
Most PNA standards contain the antioxidant trichlorophenol,which coelutes with chrysene. The antioxidant is so farobserved only in the DAD analysis because of the UVabsorption spectrum. With simultaneous multi wavelengthdetection, both chrysene at Ex 260/Em 420 nm andtrichlorophenol at Ex 260/Em 310 nm can be quantitatedselectively, as shown in figure 13. This is useful informationwhen checking the stability of PNA standards.
Envi
ronm
enta
l app
licat
ions

32
Envi
ronm
enta
l app
licat
ions
ConditionsGradient methodColumn Vydac, 2.1 × 250 nm,
PNA, 5 µmMobile phase A = water, B = acetonitrileGradient 3 min, 50 % B,
14 min, 90 % B,22 min, 100 % B,
Flow rate 0.4 ml/minColumntemperature 18 °CInjectionvolume 5 µlFLD settings PMT 12,
response time 4 s,step size 5 nm, Ex=260 nm,Em=310 and 420 nm
Figure 13Control of antioxidants in PNA reference standards with the Agilent 1100 Seriesfluorescence detectorWith multi wavelength detection, the antioxidant trichlorophenol and thePNAs could be analyzed in a single run, each at a specific wavelength.
Time [min]
LU
14 16 18 20 22
5
10
15
20
25
30Chrysene Ex=260, Em=420Trichlorophenol Ex=260, Em=310
Conclusions• Fluorescence detection is the most sensitive HPLC
detector for PNA analysis. Detection limits are in thelow ppt range.
• Simultaneous multi wavelength detection can replacetime-programmed wavelength switching.
• Spectral mode fluorescence detection makes PNAmethods more reliable, as it can provide information onadditives and impurities not seen in single-wavelengthdetection.

33
Carbamates Pesticides are regarded as essential to protect the qualityof food during production, storage and distribution. Thepersistence of these chemicals requires monitoring of allmajor pesticides in crops as well as the environment.Carbamates are mainly used as insecticides on fruits andvegetables.
According to EPA method 531.1, carbamates like theherbicide glyphosate need a postcolumn derivatization step.To meet the specified limits of detection, a fluorophor isattached to compounds separated on a dedicated column.Ortho-Phthalaldehyde is the reagent used most frequently.
Experiments and resultsCarbamates are separated on dedicated columns. Afterhydrolysis of the compounds in the effluent, the derivedmethylamines react with an o-Phthalaldehyde/Thiofluor™solution to the corresponding isoindole.
Figure 14Excitation (Ex=450 nm) and emission spectra (Em=330 nm) of the OPA-derivativeof a carbamate
ConditionsColumn Pickering Carbamate
column, 150 × 4.6 nm,Mobile phase A = water, B = methanolGradient 0 min, 15 % B,
29 min, 100 % B,Flow rate 1.0 ml/minColumntemperature 42 °CInjectionvolume 1 µlFLD settings PMT 12,
response time 4 s,step size 5 nm,
Post-column conditions in thePickering system:OPA reagent for derivatization, reactor forhydrolysis at 100 °C, 23 sec dwell time,Derivatization: Ambient, 100 µl, 4 s dwelltime Wavelength [nm]
Norm.
250 300 350 400 450 500
0
0.5
1.0
1.5
2.0
2.5
3.0 330 nm
450 nm
Excitation EmissionEn
viro
nmen
tal a
pplic
atio
ns

34
Envi
ronm
enta
l app
licat
ions
From the collected fluorescence spectra the lowest limit ofdetection is achievable when the detector is adjusted toEx 230 nm/Em 450 nm or Ex 330 nm/Em 450 nm (figure 14).The individual carbamate residues do not shift the excita-tion and emission maxima significantly. The latter choiceis slightly different from the literature where Ex 330 nm/Em 465 nm is proposed. (ref. 5) Figure 15 compares the twowavelength settings found with the Agilent 1100 Series FLD.Watching the ratio of the two signals (Ex 230 nm/Em 450 nmand Ex 330 nm/Em 450 nm) allows control of peak purity.
In a post-column reaction, the reagent is constantly flowingthrough the detector. To measure selectively the fluores-cence of the derivatized carbamates, it is important tocharacterize the fluorescent properties of the reagent,impurities and the derivatized compounds completely.
The fluorescence of the OPA-reagent in the mobile phasewater/methanol is visible in a three-dimensional plot from afluorescence scan (shown in figure 16). Excitation at 330 nmand emission at 450 nm are the best choices to achieve the
Figure 15Analysis of carbamates at two differentexcitation wavelengths, 230 and 330 nm
ConditionsSee figure 14.
12
4
53
1 Aldicarb sulfonate2 Aldicarb sulfoxide3 Oxamyl4 Methomyl5 3-OH-Carbofuran6 Aldicarb
6
78
910
7 Propoxur8 Carbofuran9 1-Naphthol10 Carbaryl11 Methiocarb12 BDMC
0 5 10 15 20 25 30 35 40
5
10
15
20
25
30
35
40
230/450 nm
330/450 nm
2.5 ng
LU
Time [min]
1211
45

35
ConditionsSee figure 14.
Figure 16Characterization of the mobile phase,including OPA reagent for carbamatesThe wavelength pair (Ex 330 nm/Em 450 nm)for quantitation of carbamates is separa-ted from the reagent’s fluorescence.Chromatographic conditions wereestablished and the fluorescence scanwas taken under stop-flow conditions.
Food samples are complex matrices that need some samplepreparation steps. In contrast, water can be clean enough tobe injected directly. With high injection volumes, detectionlimits down to 100 ppt (S/N > 2) can be achieved (figure 17).
Figure 17Analysis of carbamate standard (250 ppt)in waterWith an injection volume of 800 to 900 µl, adetection limit of 100 ppt can be achieved(S/N > 2).
Envi
ronm
enta
l app
licat
ions
lowest limits of detection when monitoring selectivelyderivatized compounds independent of the background fromthe reagent.
LU
Time [min]10 15 20 25 30 35
14
15
16
17
18
19
330/450 nm
900 µl
800 µl
12
45
3
1 Aldicarb sulfonate2 Oxamyl3 Methomyl4 3-OH-Carbofuran5 Aldicarb
6 7 8 9
10
6 Propoxur7 Carbofuran8 1-Naphthol9 Carbaryl10 Methiocarb
390
330
220280 450 480

36
Envi
ronm
enta
l app
licat
ions
Conclusions• Optimized wavelength settings allow superior limits
of detection. Changes in chromatographic conditions maychange optimum wavelengths.
• Simultaneous multi wavelength detection enableschromatographers to control peak purity by watchingthe ratio of the two signals.
• Information on reagent properties and possible fluores-cent impurities ensures reliable quantitative results.

37
Glyphosate
Envi
ronm
enta
l app
licat
ions
One of the most often used non-selective and post-emer-gence herbicides today is glyphosate (commonly foundunder the retail names of Roundup® and Basta®). Becauseof an increasing number of plants that are geneticallyengineered to resist glyphosate, the quantities applied mayincrease. Monitoring of glyphosate in soil, food and water istherefore becoming mandatory.
The method of choice for analyzing glyphosate and its meta-bolite aminomethyl phosphonic acid (AMPA) is postcolumnderivatization based on a two-step mechanism—oxidationwith hypochlorit and reaction with o-phthalaldehyde. (ref.6)Several standard methods are currently being optimized,including DIN 38 407 F22 in Germany.
Experiments and resultsSimilar to the carbamate analysis, the optimum wavelengthsfor derivatizing glyphosate and AMPA are 230 nm excitationand 450 nm emission, as shown in figure 18.
Because of the very high fluorescence background from thehypochlorit solution and OPA, the excitation wavelength340 nm results in a signal-to noise ratio two times higherthan the excitation wavelength 230 nm (see figure 19),although Ex 230 nm gives a much higher intensity.The limit of detection can be lowered to 5 pg (S/N>2).Depending on the injection volume, this is equivalent to0.5 µg/l (500 ppt) or even lower (see figure 20).

38
Envi
ronm
enta
l app
licat
ions
Conditions for figures 18, 19 and 20Column Pickering Glyphosate
column, 150 × 4.6 nm,Mobile phase A, 5 mM KH2PO4, pH 2.0,
B, 100 % 5 mM potassiumhydroxide
Gradient 0–15 min, 100 % A,15–17 min, 100 % B,17–25 min, 100 % A,
Flow rate 0.4 ml/minColumntemperature 55 °CFLD settings PMT 12,
response time 4 s,step size 5 nm,
Post-column conditions in thePickering system:0.3 ml/min Pickering’s hypochloritereagent for oxidation, 0.3 ml/min ofPickering’s OPA reagent for derivatization,reactor for oxidation at 36 °C, 500 µl,43 s dwell timeDerivatization: Ambient, 100 µl,4 s dwell time
Wavelength [nm]
Norm.
200 250 300 350 400 450
0
25
50
75
100
125
150
175
200
Excitation Emission340 nm
450 nm230 nm
Time [min]
Norm.
0 2.5 5 7.5 10 12.5 15 17.5
200
400
600
800
1000
230/450 nm
340/450 nm
Figure 18Fluorescence spectra of a glyphosate derivative10 ng/ml glyphosate dissolved in water).
Figure 19Analysis of glyphosate and AMPA atdifferent wavelengthsExcitation at 340 nm offers a lower noisecompared to Ex 230 nm.

39
Envi
ronm
enta
l app
licat
ions
Time [min]
LUGlyphosate
AMPA
0 2.5 5 7.5 10 12.5 15 17.5 20
43.5
43.6
43.7
43.8
43.9
44.0
44.1
44.2
340/450 nmFigure 20Trace level analysis of glyphosate andAMPAInjection of 500 ppt glyphosate andAMPA with a10-µl injection volume(5 pg absolute)
Conclusions• Excitation of glyphosate can be achieved in the UV
or visible range.
• Excitation at the 340 nm offers better selectivity becauseexcitation at 230 nm gives high background noise andresults in higher limits of detection.
• Glyphosate and AMPA can be detected down to theppt level.

40
Food
app
licat
ions
Aflatoxins and ochratoxin A belong to a large family ofcompounds produced by funghi. These mycotoxins arehighly toxic compounds to protect themselves against otherorganisms. All kinds of plant tissue can be growth media forfunghi, and therefore all types of food can be contaminatedwith mycotoxins. Storage conditions define the extent offungal growth.
Aflatoxins are known to cause degradation of fruits andvegetables. Ochratoxine is the prominent mycotoxin foundin cereals, flour and figs. Because of the carcinogenic,teratogenic and mutagenic character of mycotoxins, foodsamples require careful control down to trace levels.A suitable clean-up procedure and optimized fluorescenceor mass spectrometric detection are fundamental in achiev-ing the required limits of detection in the low parts perbillion (ppb) range.
Experiments and resultsTwo FLD runs produce optimum excitation and emissionwavelengths, as described in chapter 2. The fluorescencespectra shown in figure 21 illustrate the result. Both theB- and G-type aflatoxins show similar spectra. The optimumexcitation wavelength for both is 365 nm. The optimumemission wavelengths are different, 455 nm for the G-typeand 445 nm for the B-type. These wavelengths deviate fromthe literature (ref. 7), which may be due to differences inexperimental conditions such as the pH, the eluent compo-sition or the instrumentation used.
With the optimized conditions listed below, the limit ofdetection is down in the low nanogram range, as shown infigure 22. This means that a sample of only a few grams canbe sufficient to detect at the low ppb level.
Mycotoxins
Aflatoxins B1/B2 andG1/G2

41
Food
app
licat
ions
Figure 21Fluorescence spectra for aflatoxins G2and B2Reference standards were dissolved inmethanol (step size 5 nm).
Time [min]
LU
0 2 4 6 8 10 12 14 16 18
2
4
6
8
10
12
365/445 nm
365/460 nm
0.3 ng G2
1 ng G1
0.3 ng B2
1 ng B1
ConditionsColumn Hypersil ODS 100*2.1 mm,
3 µmMobile phase H2O/MeOH/CH3CN =
63/26/11Flow rate 0.3 ml/minColumntemperature 25 °CInjectionvolume 5 µlFLD settings PMT 12,
response time 4 s,step size 5 nm,
Figure 22Analysis of aflatoxins at two differentwavelengths
Wavelength [nm]
Norm.
200 250 300 350 400 450 500
0
2
4
6
8
Excitation Emission
365 nmAflatoxin B29 445 nm
Norm. 365 nmAflatoxin G2 455 nm
200 250 300 350 400 450 500
-1
0
1
2
3
4
5
Excitation Emission
Time [min]

42
Food
app
licat
ions
Ochratoxin A is found in degrading plant materials as aproduct of aspergillus or penicillium funghi. Through thefood chain, this compound may become enriched in animaltissue and act as a cancerogenic. It can also be a substancethat is directly toxic.
Experiments and resultsThe chromatogram in figure 23 shows a 125 pg of ochra-toxine A at two different excitation wavelengths, 230 nmand 333 nm, with lower limits of detection at 230 nm butbetter selectivity over the matrix background at 333 nm.
Ochratoxin A
ConditionsColumn Zorbax SB C18, 150 × 2 mm,
3.5 µmMobile phase Water/acetonitrile = 50/50Flow rate 0.4 ml/minColumntemperature 40 °CInjectionvolume 5 µlFLD settings PMT 12,
response time 4 s,step size 5 nm
Figure 23Simultaneous multi wavelength detectionfor ochratoxine analysis125 pg ochrotoxine was injected. Themost appropriate wavelength can bechosen for quantitation depending onmatrix conditions. Conclusions
• Optimization of wavelength settings is mandatory if anychange in experimental setup or chromatographicconditions occurs.
• The ability to detect simultaneously at multiple wave-lengths helps to obtain the best limits of detection andselectivity for the different species of aflatoxins.
• Ochratoxine A may be excited in the UV or visible rangedepending on the need for a higher signal or a more stablebaseline.
Time [min]
LU
0 2 4 6 8 10 12 140.5
0.6
0.7
0.8
0.9
1.0
1.1
1.2
333/460 nm
230/460 nm
Ochratoxin A

43
Food
app
licat
ions
Vitamins B2 and B6 Vitamins are essential to avoid human and animal malnutri-tion. Improper storage may rapidly damage the naturalvitamin content of food products or supplemental pharma-ceutical formulations.
Vitamins are classified as either water-soluble or fat-solublecompounds. Each is analyzed by different methods. Amongthe water-soluble vitamins, only B2 (riboflavin and phospho-rylated riboflavins) and B6 (pyridoxamine, pyridoxal and,pyridoxine) show fluorescence. All compounds are sepa-rated in a single run. With previous fluorescence detectorsthey were detected using time-programmed wavelengthswitching. (ref.8)
Experiments and resultsThe optimal wavelengths for B6 vitamins are Ex 270/Em400 nm and for vitamin B2 Ex 270/Em 530nm, as shown infigure 24. The detection limit for B2 is down to 20 pg; thedetection limit for B6 is 200 pg (S/N > 2).
Figure 24Excitation and emission spectra ofvitamins B2 and B6Spectra were extracted from two FLD runsfor excitation and emission spectra(1 µg/ml dissolved in water, step size 5 nm).
Norm.
Wavelength [nm]200 250 300 350 400 450 500 550
05
101520253035
Excitation Emission
450 nm 530 nm
362 nm
262 nm
Norm.
Wavelength [nm]200 250 300 350 400 450 500 550
05
101520253035
Excitation Emission
400 nm280 nm

44
Food
app
licat
ions
ConditionsColumn Zorbax SB 50 × 2.0 mm,
5 µmMobile phase A = 0.005 mM KH2PO4,
pH 2.5 - H2SO4,B = acetonitrile
Gradient 0–25 % B in 10 minFlow rate 0.5 ml/minColumntemperature 35 °CInjectionvolume 5 µlFLD settings Response time 4 s
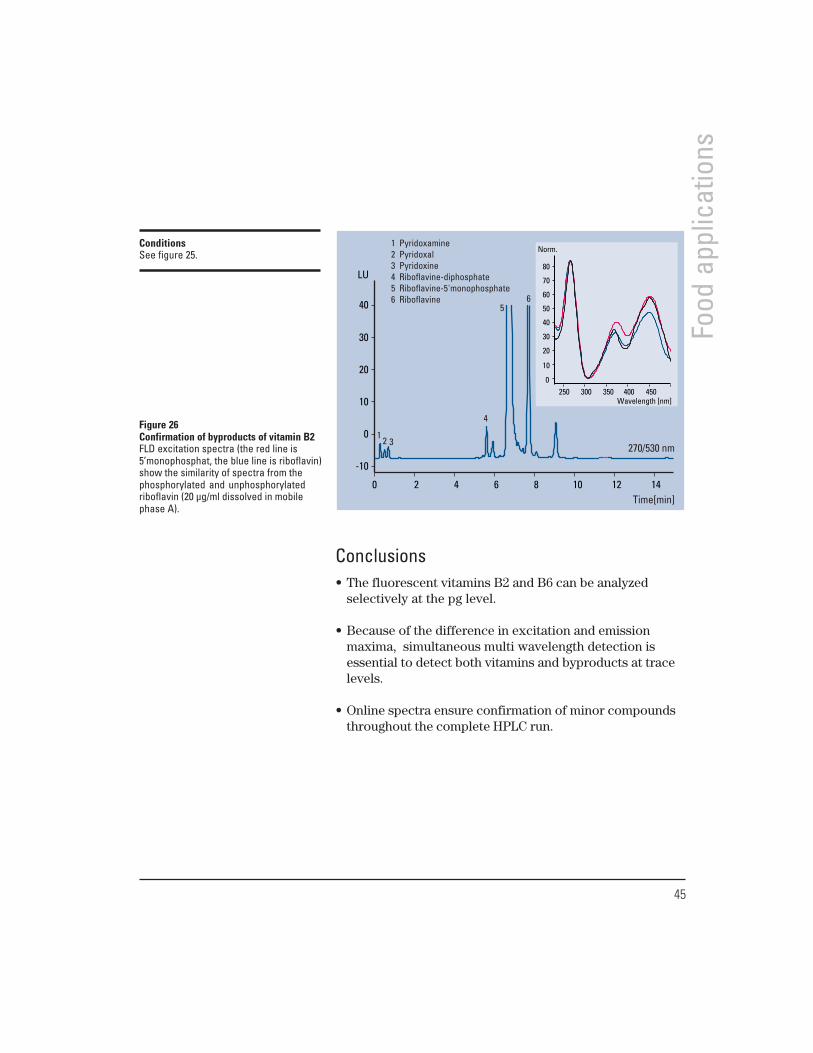
During metabolism as well as during sample preparationfrom complex matrices, vitamins are subject to varioustransformations. The goal is therefore to monitor precursorsand modified species as well as the main compounds in asingle run. Figure 25 demonstrates this for vitamins B2 andB6. The small impurities close to Riboflavine (seen in figure26) can be identified through excitation spectra as belongingto the vitamin B2 complex. Reference standards help toidentify them as monophosphates and diphosphates.
Time [min]0 2 4 6 8
LU
0
20
40
60
80
270/530 nm
270/400 nm
10
Riboflavine Pryridoxamine
Pryridoxal
Pryridoxine
Figure 25Analysis of vitamins B2 and B6Multi wavelength detection is used todetect both vitamins selectively andsensitive.
45
Food
app
licat
ions
Time[min]0 2 4 6 8 10 12 14
LU
-10
0
10
20
30
40
270/530 nm
Wavelength [nm]250 300 350 400 450
Norm.
0
10
20
30
40
50
60
70
80
1 Pyridoxamine2 Pyridoxal3 Pyridoxine4 Riboflavine-diphosphate5 Riboflavine-5'monophosphate6 Riboflavine
1 2 3
4
56
ConditionsSee figure 25.
Figure 26Confirmation of byproducts of vitamin B2FLD excitation spectra (the red line is5’monophosphat, the blue line is riboflavin)show the similarity of spectra from thephosphorylated and unphosphorylatedriboflavin (20 µg/ml dissolved in mobilephase A).
Conclusions• The fluorescent vitamins B2 and B6 can be analyzed
selectively at the pg level.
• Because of the difference in excitation and emissionmaxima, simultaneous multi wavelength detection isessential to detect both vitamins and byproducts at tracelevels.
• Online spectra ensure confirmation of minor compoundsthroughout the complete HPLC run.

46
Phar
mac
eutic
al a
pplic
atio
ns
Quinidine occurs as two stereoisomers and has been used inanti-malaria and antiarrhythmic drugs since the beginning ofthe twentieth century. Before that, American Indians usedplant material containing quinidine for its antipyretic activity.
This compound has a complex chemical structure containinga fluorophor and groups (tert. amine) that can be protonated(illustrated in figure 27). An HPLC separation with wellshaped peaks requires a buffered eluent as described in theliterature. (ref. 9) With a new generation of more stablecolumn materials (such as Zorbax Stablebond®), this com-pound has to be analyzed under acidic conditions. As muchas retention times change with the type of stationary phase,a different pH of the mobile phase changes UV absorptionand fluorescence behavior.
Experiments and resultsAs pH decreases, quinidine shows a bathochrome shift:The emission wavelength changes from 380 nm to 450 nmas the pH shifts from pH 7 to pH 2.5 (shown in figure 28).This is important in maintaining optimum limits of detection.If slight changes in pH occur, these can contribute tonon-reproducible separation and quantitation results.Recording spectra can help to view these changes. Conse-quently, spectral data can be used in routine work to checkseparation conditions—a prerequisite for reproducingquantitative results.
Quinidine
Figure 27Chemical structure of quinidineThe arrows indicate the functionalgroups that can be protonated.
N
N
HHO
CH3O

47
Phar
mac
eutic
al a
pplic
atio
ns
Conditions
Method 1 – pH 7Column Purosphere® 125 × 4 mm,
5 µmMobile phase H2O pH 7 (H2SO4)/
acetonitrileFlow rate 0.6 ml/minColumntemperature 40 °CInjectionvolume 1 µlFLD settings PMT 12,
response time 4 s,step size 5 nm
Method 2 – pH 2.5Column BDS 100 × 2.1 mm,
3 µmMobile phase H2O pH 2.5 (H2SO4)/
acetonitrileFlow rate 0.3 ml/minColumntemperature 40 °CInjectionvolume 1 µlFLD settings PMT 12,
response time 4 s,step size 5 nm
Norm.
Wavelength [nm]350 400 450 500 550 600
0
5
10
15
20
25
30
Emission
pH 2.5pH 7
450 nm380 nm35
Emission
Figure 28Influence of pH on emission spectra for quinidine
Conclusions• Fluorescence spectra are an excellent indicator of
pH changes in the eluent.
• Quantitation of acidic or basic type substances requiresstrict control of pH not only to control retention timesbut for reliable quantitation as well.

48
Phar
mac
eutic
al a
pplic
atio
ns
Warfarin Warfarin is an anticoagulant drug that is used in post-surgerytreatment. The chemical structure derives from coumarineand has phenolic character.
In the literature, warfarin is analyzed mainly at neutral condi-tions (phosphate buffer pH 7.5) with fluorescence measuredat Ex 290 nm/Em 390 nm or Ex 310 nm/Em 370 nm. (ref.10)
Experiments and resultsWarfarin can be analyzed on a Zorbax Stablebond® columnat pH 2.5. Under these conditions, excitation and emissionmaxima shifted to 272 nm and 355 nm, respectively (shownin figure 29).
The resulting comparison between the analysis based onliterature and actual optimized fluorescence wavelengthsis shown in figure 30. Actual optimized fluorescence wave-lengths show about three times better limits of detection.Compared to UV detection, the Agilent 1100 Series FLD hasa limit of detection about 20 times lower.
Wavelength [nm]200 250 300 350 400 450 500
Norm.
0
0.25
0.50
0.75
1.00
1.25
1.50
1.75
Excitation Emission
272 nm 355 nmConditionsColumn Zorbax SB C18, 50 × 2.1 mm,
3 µmMobile phase 0.005 M KH2PO4,
pH 3/acetonitrileGradient 20 % B to 80 % B in 10 minWash 80 % B to 20 % B in 2 minColumntemperature 25 °CInjectionvolume 1 µlFLD settings PMT 12,
response time 4 s,step size 5 nm
Figure 29Fluorescence spectra for warfarin underacidic conditions (pH=3)10 µg/ml dissolved in phosphate buffer.

49
Phar
mac
eutic
al a
pplic
atio
ns
Time [min]
LU
0 1 2 3 4 5 6 7 8 90.5
1.0
1.5
2.0
2.5
3.0
3.5
272/355 nm
290/390 nm
accord. Lit.
10 ng Warfarin
Figure 30Analysis of warfarinResponse under literature conditions(ref. 10) and actual optimized fluorescencewavelengths.
ConditionsSee figure 29.
Conclusions• New types of columns that produce different retention
behavior require a rework of chromatographic conditions.This may induce significant shifts in fluorescence spectra,which in turn can influence the limits of detection withthe fluorescence detector.
• In routine analysis, fluorescence spectra can be takenautomatically and reviewed to check for accidentalchanges in chromatographic conditions.

50
Amino acids are essential components for biologicalsystems and have been found already during early stages oflife on earth. For human nutrition a set of essential aminoacids is needed that cannot be formed in the body but mustbe taken up from the daily food. As building blocks of theproteins they form the vast majority of all enzymes inbiochemical transformations. A wide range of decease anddrug research is targeted on protein biochemistry to under-stand the role of amino acids, peptides and proteins.
After acidic or enzymatic hydrolysis amino acid composi-tion can be determined using reversed phase columns whichwill give typically a better resolution than ion chromatogra-phy. For sensitive detection amino acids are derivatizedin a two-step pre-column derivatization. A post-columnderivatisation is suitable for higher selectivity as requiredfor complex biological samples. Fluorescence detection isused for concentrations below 100 pmol/µl. UV-detectionis a choice for higher concentrations up to the nanogramrange. A standard HPLC system can be used for this straight-forward and cost-effective approach to amino acid analysis.
Experimental and resultsPre-column derivatisation of primary amino acids isachieved with ortho-phthalaldehyde (OPA) and 9-fluorenyl-methylchloroformate (FMOC) is used for secondary aminoacids. Seventeen different amino acids that are all found inprotein hydrolysates were analyzed as shown in figure 31.A wavelength switching program is used to detect Proline.
The limits of detection for the amino acids are listed intable 4 based on a signal-to-noise > 2. This is close to 100times more sensitive than UV-detection at 338nm. Retentiontime precision is typically below 0.2 % and peak areaprecision is typically below 5 %.
Phar
mac
eutic
al a
pplic
atio
ns
Amino Acids
Compound LOD for FLD FLDFLD
(pmol) (fmol)
Asp 19 0.139 0.924Glu 18 0.155 0.576Ser 21 0.156 1.015His 29 0.155 1.778Gly 21 0.118 1.124Thr 21 0.113 0.739Ala 20 0.120 0.767Arg 17 0.094 0.905Tyr 19 0.062 1.614Cys-SS-Cys not measuredVal 17 0.058 0.919Met 16 0.045 1.236Phe 17 0.048 1.079Ile 16 0.050 0.759Leu 18 0.040 0.952Lys 57 0.060 5.107Pro 22 0.044 4.379
Table 4LOD’s for fluorescenceand UV detection

51
Phar
mac
eutic
al a
pplic
atio
ns
Conclusion• Reversed phase chromatography combined with pre-
column derivatization is an ideal tool for automated cost-effective amino acid analysis on a standard HPLC setup.
• With the use of OPA and FMOC and fluorescencedetection it is possible to push the limits of detectionsignifantly below 100 femtomoles for most amino acids.
• This technique is worked out to offer precise results forprotein hydrolysates in a routine laboratory.
Time [min]0 2 4 6 8 10 12 14 16 18
LU
0
25
50
75
100
125
175
Asp
Glu
Ser
His
Gly Th
r Ala
Arg
Try
Cys
-SS
-Cys
Val
Met
Phe
IleLe
uLy
s
Pro
150
10 pmol standardConditionsColumn 200 × 2.1 mm AA column
and guard columnMobile phase A = 20 mMol NaAc + 0.018%
TEA adjusted to pH 7.2 with1-2 % acetic acid, B = 20 %of 100 mMol NaAc adjustedto pH 7.2 with 1-2 % aceticacid + 40 % ACN and 40 %MeOH
Flow rate 0.45 ml/minGradient start with: 100 %A, at 17 min
60 %B, at 18 min, 100 %B,at 18.1 min flow 0.45, at18.5 min flow 0.8, at 23.9 minflow 0.8, at 24 min 100%Band flow 0.45, at 25 min 0%B
Oven temp. 40 ºCPost time 5 minInjector program1 Draw 5.0 µl from vial 10—borate buffer2 Draw 1.0 µl from vial 11—OPA reagent3 Draw 0.0 µl from vial 12—water4 Draw 1.0 µl from sample5 Draw 0.0 µl from vial 12—water6 Mix 8 µl in air, max speed, six times7 Draw 1.0 µl from vial 14—FMOC8 Draw 0.0 µl from vial 12—water9 Mix 9 µl in air, max speed, 3 times10 InjectFLD settings Excitation 340 nm
Emission 450 nmPTM gain 12
at 14.5 minExcitation =266 nmEmission = 305 nmPTM Gain 11
Figure 31Analysis of 10 pmol/µl amino acids with fluorescence detection

52
Refe
renc
es
1. Lakowicz, J.R., “Principles of Fluorescence Spectros-copy”, Plenum Press, New York, 1983.
2. Schuster, R., “A comparison of pre- and post-columnderivatization for the analysis of glyphosate”,Agilent Technologies Application Note 5091-3621E, 1991.
3. Froehlich, P., Internat’l Laboratory, No. 10, 42-44,1989.
4. Brownrigg, J.T. and Sullivan, M. J., Spectroscopy, Vol.1,No.2, 1989.
5. Pickering Laboratories, Product brochure, Publ. No.B-CA 4, 1992.
6. Pickering Laboratories, Application Note, Publ. No.B-CA 5, 1993.
7. Official Methods of Analysis, Food Compositions;Additives, Natural Contaminants, 15th edition: AOAC:
Arlington, VA, Vol. 2.; AOAC Official method 980.20,aflatoxins in cotton seed products, 1990.
8. Mc Calley, D.V., J. Chrom., 357, 221, 1986.
9. Chu, Y-Q. and Wainer, I.W., Pharm. Res. 5, 680, 1988.
10. Gratzfeld-Huesgen, A. and Schuster, R., “HPLC for FoodAnalysis”, Agilent Technologies Application Primer,5968-9345E, 2000.
11. Gratzfeld-Huesgen, A., “Sensitive and Reliable AminoAcids Analysis in Protein Hydrolysates using the Agilent1100 Series HPLC”, Agilent Technologies Technical Note
5968-5658E, 1999.

53
Inde
x
Aaflatoxins, 40–41
B1/B2, 40–41G1/G2 40–41
amino acids, 50AMPA, 37–39antioxidant, 31anthracene, 14, 22, 26applications, 29ASTM, 142-amino-3-hydroxyphenazine (AHP),23,24
Bbandwidth, 10–112-benzimidazole carbamic acidmethylester (MBC), 23, 24
Ccarbamates, 33–36cut-off filter, 11, 17cuvette, 12, 17, 19, 20chromophore, 10
Ddata handling, 12–13data analysis, 13derivatization, 33detector
diode array, 6, 13, 23, 26, 31mass spectrometric, 6, 26, 40
2,3-diamino-phenazine (DAP), 23, 24DIN method, 30, 37
EEPA methods, 30, 33emission
monochromator, 11–12spectra, 6, 10–14, 16–27, 33, 43, 46, 47wavelength, 10–14, 16–25, 40
excitationmonochromator, 11–12spectra, 6, 10–14, 16–26, 33, 43wavelength, 10–14, 16–25, 40,
Ffluorescence spectra, 13, 19, 25, 34, 38,40, 41, 48, 49fluorescence scan, 12, 17, 21, 34fluorophore, 21, 33, 46
Ggerman standard method DIN, 30, 37glyphosate, 37–39grating, 11–12
Iimpurities, 17, 23, 25isofluorescence plot, 13, 17, 22
Llamp, 11
Xenon, 11–12light sources, 23limit of detection (LOD), 12, 16–18, 23, 25,30, 31, 33, 34, 35, 36, 37, 39, 40, 42, 43, 46, 48,
Mmass spectrometric, 6, 26, 40match factor, 27method development, 16–272-benzimidazole carbamic acidmethylester (MBC), 23, 24mobile phase, 17, 34, 35, 46monochromator, 11–12multi wavelength detection, 16, 25, 31–32,36, 42, 44–45,mycotoxins, 40
Oo-phthalaldehyde (OPA), 33–35ochratoxin A, 42
Ppeak, 25–27
purity, 13, 27, 34identity, 26
pesticides, 33photo-multiplier, 11photodiode, 11Pickering, 38polynuclear aromatic hydrocarbons(PNA), 21, 25, 30–32precolumn derivatization,postcolumn derivatization, 33, 37purity factor, 27pyridoxal, 43, 44pyridoxamine, 43, 44pyridoxine, 43, 44
Qqualitative analysis, 24quantitative analysis, 25–26quinidine, 18, 19, 46–47
RRaman, 14,17Raleigh, 17riboflavine, 43–44
Sselectivity, 7, 18, 23, 25specifications, 14spectral libraries, 13spectral mode, 6–7, 32spectral range, 21stray light, 11–12
Raman, 11, 17Raleigh, 17
Tthree-dimensional plot, 12, 13, 17, 21, 34trichlorophenol, 31, 32
UUV/Visible absorption spectra, 6
Vvitamins, 43–45
B2/B6, 43–45
Wwarfarin, 48wavelength, 12
XXenon flash lamp, 11–12
ZZorbax, 46, 48

Copyright © 2000 Agilent Technologies
The information in this publication issubject to change without notice.
All Rights Reserved. Reproduction,adaptation or translation without priorwritten permission is prohibited, exceptas allowed under the copyright laws.
Printed in Germany 01/00Publication Number 5968-9346E
www.agilent.com/chem