fluidized bed membrane reactors for ultra pure h2 ... · molecules article fluidized bed membrane...
TRANSCRIPT
Fluidized bed membrane reactors for ultra pure H2production - A step forward towards commercializationHelmi Siasi Farimani, A.; Fernandez, E.; Melendez Rey, J.; Tanaka, D.A.P.; Gallucci, F.; vanSint Annaland, M.Published in:Molecules
DOI:10.3390/molecules21030376
Published: 01/03/2016
Document VersionPublisher’s PDF, also known as Version of Record (includes final page, issue and volume numbers)
Please check the document version of this publication:
• A submitted manuscript is the author's version of the article upon submission and before peer-review. There can be important differencesbetween the submitted version and the official published version of record. People interested in the research are advised to contact theauthor for the final version of the publication, or visit the DOI to the publisher's website.• The final author version and the galley proof are versions of the publication after peer review.• The final published version features the final layout of the paper including the volume, issue and page numbers.
Link to publication
Citation for published version (APA):Helmi Siasi Farimani, A., Fernandez Gesalaga, E., Melendez, J., Tanaka, D. A. P., Gallucci, F., & van SintAnnaland, M. (2016). Fluidized bed membrane reactors for ultra pure H2 production - A step forward towardscommercialization. Molecules, 21(3), [376]. DOI: 10.3390/molecules21030376
General rightsCopyright and moral rights for the publications made accessible in the public portal are retained by the authors and/or other copyright ownersand it is a condition of accessing publications that users recognise and abide by the legal requirements associated with these rights.
• Users may download and print one copy of any publication from the public portal for the purpose of private study or research. • You may not further distribute the material or use it for any profit-making activity or commercial gain • You may freely distribute the URL identifying the publication in the public portal ?
Take down policyIf you believe that this document breaches copyright please contact us providing details, and we will remove access to the work immediatelyand investigate your claim.
Download date: 20. Jun. 2018
molecules
Article
Fluidized Bed Membrane Reactors for Ultra Pure H2Production—A Step forwardtowards CommercializationArash Helmi 1, Ekain Fernandez 1,2, Jon Melendez 2,3, David Alfredo Pacheco Tanaka 2,Fausto Gallucci 1,* and Martin van Sint Annaland 1
1 Chemical Process Intensification, Department of Chemical Engineering and Chemistry, EindhovenUniversity of Technology, P. O. Box 513, 5612 AZ Eindhoven, The Netherlands; [email protected] (A.H.);[email protected] (E.F.); [email protected] (M.v.S.A.)
2 Energy and Environment Division, TECNALIA, Mikeletegi Pasealekua 2, 20009 San Sebastián-Donostia,Spain; [email protected] (J.M.); [email protected] (D.A.P.T.)
3 Chemical Engineering and Environmental Department, University of the Basque Country UPV/EHU,C/Alameda Urquijo s/n, 48013 Bilbao, Spain
* Correspondence: [email protected]; Tel.: +31-402-473-675
Academic Editor: Raffaele MolinariReceived: 3 February 2016; Accepted: 9 March 2016; Published: 19 March 2016
Abstract: In this research the performance of a fluidized bed membrane reactor for high temperaturewater gas shift and its long term stability was investigated to provide a proof-of-concept of the newsystem at lab scale. A demonstration unit with a capacity of 1 Nm3/h of ultra-pure H2 was designed,built and operated over 900 h of continuous work. Firstly, the performance of the membranes wereinvestigated at different inlet gas compositions and at different temperatures and H2 partial pressuredifferences. The membranes showed very high H2 fluxes (3.89 ˆ 10´6 mol¨m´2¨Pa´1¨ s´1 at 400 ˝Cand 1 atm pressure difference) with a H2/N2 ideal perm-selectivity (up to 21,000 when integratingfive membranes in the module) beyond the DOE 2015 targets. Monitoring the performance of themembranes and the reactor confirmed a very stable performance of the unit for continuous hightemperature water gas shift under bubbling fluidization conditions. Several experiments were carriedout at different temperatures, pressures and various inlet compositions to determine the optimumoperating window for the reactor. The obtained results showed high hydrogen recovery factors,and very low CO concentrations at the permeate side (in average <10 ppm), so that the producedhydrogen can be directly fed to a low temperature PEM fuel cell.
Keywords: fluidized bed membrane reactor; water gas shift; ultra-pure H2; PEM fuel cell
1. Introduction
With the still increasing consumption of fossil fuels and the associated rising energy costs,renewable energy sources are becoming more and more important. Different renewable energysources are already in use like solar, wind, hydro, etc., but this is not enough to completely replacefossil fuels in the short term. Hydrogen as an energy carrier is widely considered to play an importantrole in the near future. High purity hydrogen can be used in fuel cells as a substitute for conventionalinternal combustion engines and gas turbines because of, for example, higher power density andcleaner exhausts [1].
Hydrogen is nowadays mostly used in oil refineries or to produce methanol and ammonia, whilethe demand for hydrogen is rising. Hydrogen can be produced from different feedstocks, fossil basedsuch as natural gas or coal and non-fossil based such as biomass [2]. The conventional large scalehydrogen production process consists of mainly two steps, the processing of the feedstock (for example
Molecules 2016, 21, 376; doi:10.3390/molecules21030376 www.mdpi.com/journal/molecules
Molecules 2016, 21, 376 2 of 18
reforming or gasification) and the water gas shift (WGS) reaction to upgrade CO to H2. The basicreactions for hydrogen production from natural gas (primarily methane) are as follows:
Endothermic reforming of methane
CH4 ` H2O Ø 3H2 ` CO ∆H˝
298 “ `205.9 kJ{mol (1)
Exothermic water gas shift reaction
CO` H2O Ø H2 ` CO2 ∆H˝
298 “ ´41 kJ{mol (2)
The WGS reaction is a very important step in this conversion as it converts carbon monoxide withsteam to hydrogen and carbon dioxide. By using a two-stage WGS system with two different catalysts,CO can be almost fully converted reducing its content to values as low as 0.5%.
Indeed, the WGS reaction is an exothermic equilibrium-limited reaction, where the CO conversionand H2 production are favored at lower temperatures as can be deduced from the temperaturedependency of the equilibrium constant (Kp) [3]:
Kp “ expˆ
4577.8T
´ 4.33˙
(3)
The WGS reaction is however controlled by kinetics at low temperatures, which implies thata highly active and stable catalyst is required. The WGS reaction is traditionally carried out in atwo-stage reactor. This allows a smaller adiabatic temperature rise and a better steam managementmaking the process more economical. The first stage is a high temperature (300–450 ˝C) converterfor fast CO conversion while minimizing the catalyst bed volume. The next stages are at lowertemperatures (190–250 ˝C) to achieve a higher conversion, which is limited by the reaction equilibrium,i.e., temperature and feed composition. Afterward, the produced hydrogen needs to be purified(Pressure swing adsorption (PSA) or Preferential Oxidation (PROX) are the most often used).
The WGS system could be improved by integrating the reaction and separation of hydrogen stepsin a single stage [4]. The combination of membrane separation and WGS in membrane reactors havebecome very interesting, since the membrane separation makes it possible to continuously removehydrogen which allows conversions beyond the equilibrium conversion of conventional systems thusachieving complete CO conversion in a single high-temperature unit [2,5].
Different types of membrane reactors have been proposed in the literature such as packedbed membrane reactors and fluidized bed membrane reactors. The simplest membrane reactorconfiguration for WGS is a packed bed membrane reactor where one or more membranes areaccommodated in a packed catalytic bed. While this configuration has been proven at lab scale bydifferent authors, still some limitations hamper the application of such configuration when applyinghighly permeable membranes [4]. In particular, for exothermic reactions, hot spot formation insidethe bed (due to the relatively poor heat dispersion in packed bed reactors) can cause damage to themembranes resulting in a decrease in the perm-selectivity and catalyst performance. Additionally,mass transfer limitations from the catalyst bed to the surface of the membrane may prevail when usinghighly permeable membranes, with the consequent increase in the required membrane area for a givenhydrogen recovery [5–7].
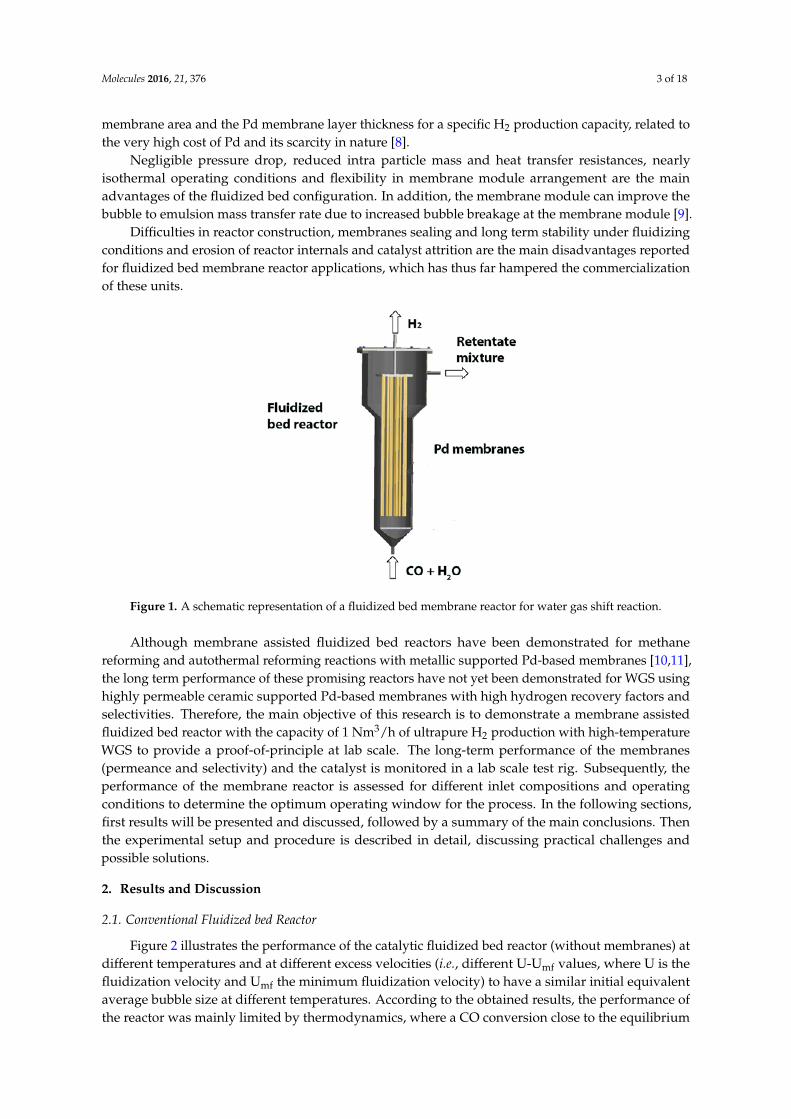
To overcome the limitations of packed bed membrane reactors, membrane assisted fluidizedbeds have been proposed in the literature and are being used mostly for methane reforming reactions.In Figure 1, a schematic overview of a fluidized bed membrane reactor for WGS is shown. At thebottom, the reactants are fed to the reactor where the reaction takes place. Palladium (Pd) basedmembrane tubes are immersed inside the catalyst bed to extract the hydrogen from the reaction zone.To have a successful industrial implementation of such a unit, it is crucial to minimize the required
Molecules 2016, 21, 376 3 of 18
membrane area and the Pd membrane layer thickness for a specific H2 production capacity, related tothe very high cost of Pd and its scarcity in nature [8].
Negligible pressure drop, reduced intra particle mass and heat transfer resistances, nearlyisothermal operating conditions and flexibility in membrane module arrangement are the mainadvantages of the fluidized bed configuration. In addition, the membrane module can improve thebubble to emulsion mass transfer rate due to increased bubble breakage at the membrane module [9].
Difficulties in reactor construction, membranes sealing and long term stability under fluidizingconditions and erosion of reactor internals and catalyst attrition are the main disadvantages reportedfor fluidized bed membrane reactor applications, which has thus far hampered the commercializationof these units.
Molecules 2016, 21, 376 3 of 17
industrial implementation of such a unit, it is crucial to minimize the required membrane area and the Pd membrane layer thickness for a specific H2 production capacity, related to the very high cost of Pd and its scarcity in nature [8].
Negligible pressure drop, reduced intra particle mass and heat transfer resistances, nearly isothermal operating conditions and flexibility in membrane module arrangement are the main advantages of the fluidized bed configuration. In addition, the membrane module can improve the bubble to emulsion mass transfer rate due to increased bubble breakage at the membrane module [9].
Difficulties in reactor construction, membranes sealing and long term stability under fluidizing conditions and erosion of reactor internals and catalyst attrition are the main disadvantages reported for fluidized bed membrane reactor applications, which has thus far hampered the commercialization of these units.
Figure 1. A schematic representation of a fluidized bed membrane reactor for water gas shift reaction.
Although membrane assisted fluidized bed reactors have been demonstrated for methane reforming and autothermal reforming reactions with metallic supported Pd-based membranes [10,11], the long term performance of these promising reactors have not yet been demonstrated for WGS using highly permeable ceramic supported Pd-based membranes with high hydrogen recovery factors and selectivities. Therefore, the main objective of this research is to demonstrate a membrane assisted fluidized bed reactor with the capacity of 1 Nm3/h of ultrapure H2 production with high-temperature WGS to provide a proof-of-principle at lab scale. The long-term performance of the membranes (permeance and selectivity) and the catalyst is monitored in a lab scale test rig. Subsequently, the performance of the membrane reactor is assessed for different inlet compositions and operating conditions to determine the optimum operating window for the process. In the following sections, first results will be presented and discussed, followed by a summary of the main conclusions. Then the experimental setup and procedure is described in detail, discussing practical challenges and possible solutions.
2. Results and Discussion
2.1. Conventional Fluidized bed Reactor
Figure 2 illustrates the performance of the catalytic fluidized bed reactor (without membranes) at different temperatures and at different excess velocities (i.e., different U-Umf values, where U is the fluidization velocity and Umf the minimum fluidization velocity) to have a similar initial equivalent
Figure 1. A schematic representation of a fluidized bed membrane reactor for water gas shift reaction.
Although membrane assisted fluidized bed reactors have been demonstrated for methanereforming and autothermal reforming reactions with metallic supported Pd-based membranes [10,11],the long term performance of these promising reactors have not yet been demonstrated for WGS usinghighly permeable ceramic supported Pd-based membranes with high hydrogen recovery factors andselectivities. Therefore, the main objective of this research is to demonstrate a membrane assistedfluidized bed reactor with the capacity of 1 Nm3/h of ultrapure H2 production with high-temperatureWGS to provide a proof-of-principle at lab scale. The long-term performance of the membranes(permeance and selectivity) and the catalyst is monitored in a lab scale test rig. Subsequently, theperformance of the membrane reactor is assessed for different inlet compositions and operatingconditions to determine the optimum operating window for the process. In the following sections,first results will be presented and discussed, followed by a summary of the main conclusions. Thenthe experimental setup and procedure is described in detail, discussing practical challenges andpossible solutions.
2. Results and Discussion
2.1. Conventional Fluidized bed Reactor
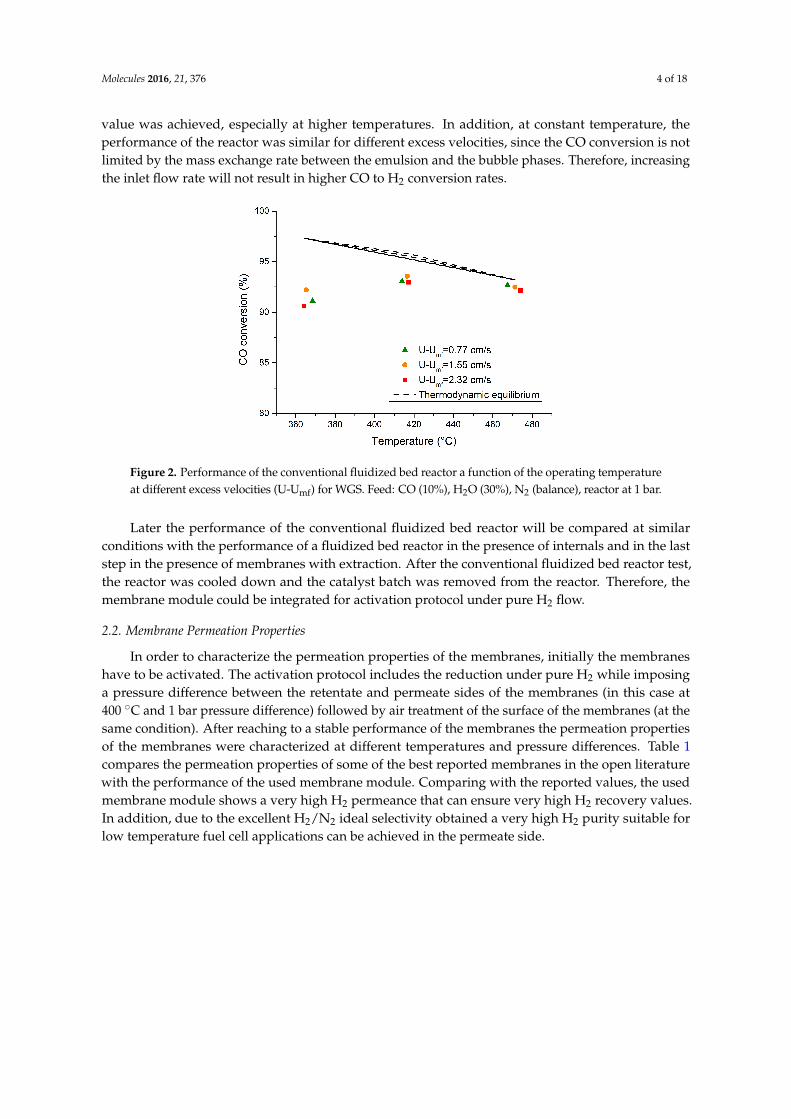
Figure 2 illustrates the performance of the catalytic fluidized bed reactor (without membranes) atdifferent temperatures and at different excess velocities (i.e., different U-Umf values, where U is thefluidization velocity and Umf the minimum fluidization velocity) to have a similar initial equivalentaverage bubble size at different temperatures. According to the obtained results, the performance ofthe reactor was mainly limited by thermodynamics, where a CO conversion close to the equilibrium
Molecules 2016, 21, 376 4 of 18
value was achieved, especially at higher temperatures. In addition, at constant temperature, theperformance of the reactor was similar for different excess velocities, since the CO conversion is notlimited by the mass exchange rate between the emulsion and the bubble phases. Therefore, increasingthe inlet flow rate will not result in higher CO to H2 conversion rates.
Molecules 2016, 21, 376 4 of 17
average bubble size at different temperatures. According to the obtained results, the performance of the reactor was mainly limited by thermodynamics, where a CO conversion close to the equilibrium value was achieved, especially at higher temperatures. In addition, at constant temperature, the performance of the reactor was similar for different excess velocities, since the CO conversion is not limited by the mass exchange rate between the emulsion and the bubble phases. Therefore, increasing the inlet flow rate will not result in higher CO to H2 conversion rates.
Figure 2. Performance of the conventional fluidized bed reactor a function of the operating temperature at different excess velocities (U-Umf) for WGS. Feed: CO (10%), H2O (30%), N2 (balance), reactor at 1 bar.
Later the performance of the conventional fluidized bed reactor will be compared at similar conditions with the performance of a fluidized bed reactor in the presence of internals and in the last step in the presence of membranes with extraction. After the conventional fluidized bed reactor test, the reactor was cooled down and the catalyst batch was removed from the reactor. Therefore, the membrane module could be integrated for activation protocol under pure H2 flow.
2.2. Membrane Permeation Properties
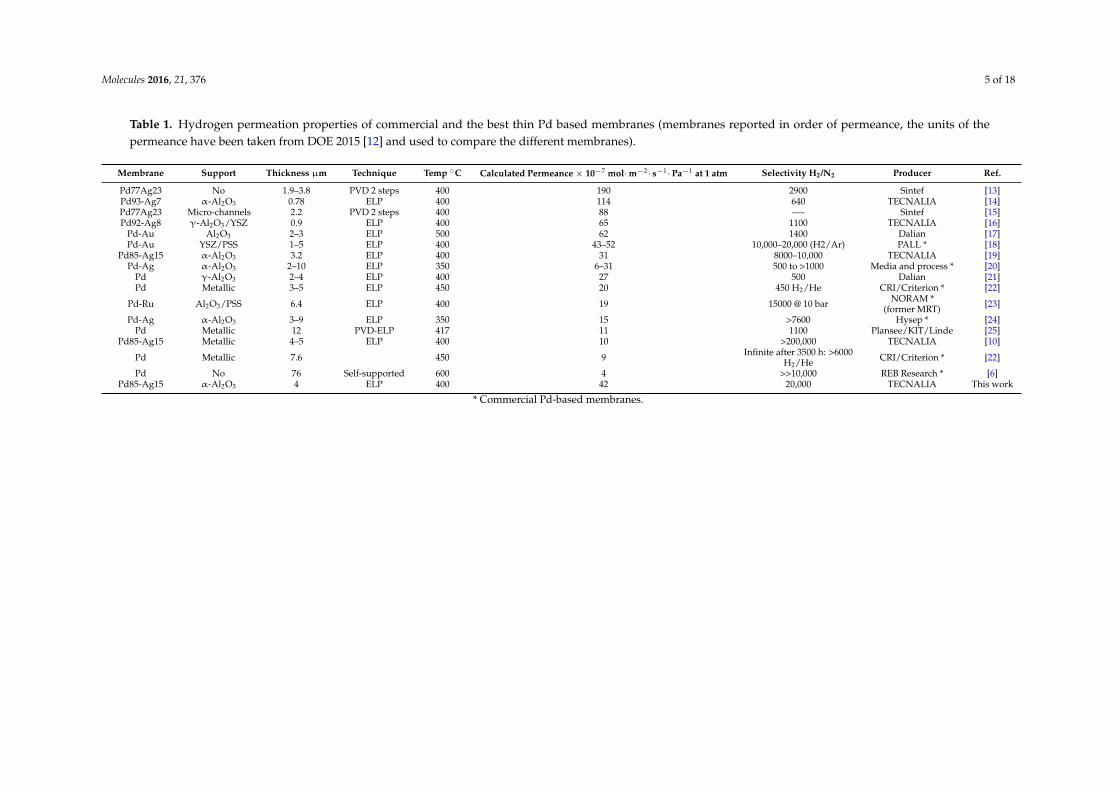
In order to characterize the permeation properties of the membranes, initially the membranes have to be activated. The activation protocol includes the reduction under pure H2 while imposing a pressure difference between the retentate and permeate sides of the membranes (in this case at 400 °C and 1 bar pressure difference) followed by air treatment of the surface of the membranes (at the same condition). After reaching to a stable performance of the membranes the permeation properties of the membranes were characterized at different temperatures and pressure differences. Table 1 compares the permeation properties of some of the best reported membranes in the open literature with the performance of the used membrane module. Comparing with the reported values, the used membrane module shows a very high H2 permeance that can ensure very high H2 recovery values. In addition, due to the excellent H2/N2 ideal selectivity obtained a very high H2 purity suitable for low temperature fuel cell applications can be achieved in the permeate side.
Figure 2. Performance of the conventional fluidized bed reactor a function of the operating temperatureat different excess velocities (U-Umf) for WGS. Feed: CO (10%), H2O (30%), N2 (balance), reactor at 1 bar.
Later the performance of the conventional fluidized bed reactor will be compared at similarconditions with the performance of a fluidized bed reactor in the presence of internals and in the laststep in the presence of membranes with extraction. After the conventional fluidized bed reactor test,the reactor was cooled down and the catalyst batch was removed from the reactor. Therefore, themembrane module could be integrated for activation protocol under pure H2 flow.
2.2. Membrane Permeation Properties
In order to characterize the permeation properties of the membranes, initially the membraneshave to be activated. The activation protocol includes the reduction under pure H2 while imposinga pressure difference between the retentate and permeate sides of the membranes (in this case at400 ˝C and 1 bar pressure difference) followed by air treatment of the surface of the membranes (at thesame condition). After reaching to a stable performance of the membranes the permeation propertiesof the membranes were characterized at different temperatures and pressure differences. Table 1compares the permeation properties of some of the best reported membranes in the open literaturewith the performance of the used membrane module. Comparing with the reported values, the usedmembrane module shows a very high H2 permeance that can ensure very high H2 recovery values.In addition, due to the excellent H2/N2 ideal selectivity obtained a very high H2 purity suitable forlow temperature fuel cell applications can be achieved in the permeate side.
Molecules 2016, 21, 376 5 of 18
Table 1. Hydrogen permeation properties of commercial and the best thin Pd based membranes (membranes reported in order of permeance, the units of thepermeance have been taken from DOE 2015 [12] and used to compare the different membranes).
Membrane Support Thickness µm Technique Temp ˝C Calculated Permeance ˆ 10´7 mol¨ m´2¨ s´1¨ Pa´1 at 1 atm Selectivity H2/N2 Producer Ref.
Pd77Ag23 No 1.9–3.8 PVD 2 steps 400 190 2900 Sintef [13]Pd93-Ag7 α-Al2O3 0.78 ELP 400 114 640 TECNALIA [14]Pd77Ag23 Micro-channels 2.2 PVD 2 steps 400 88 —- Sintef [15]Pd92-Ag8 γ-Al2O3/YSZ 0.9 ELP 400 65 1100 TECNALIA [16]
Pd-Au Al2O3 2–3 ELP 500 62 1400 Dalian [17]Pd-Au YSZ/PSS 1–5 ELP 400 43–52 10,000–20,000 (H2/Ar) PALL * [18]
Pd85-Ag15 α-Al2O3 3.2 ELP 400 31 8000–10,000 TECNALIA [19]Pd-Ag α-Al2O3 2–10 ELP 350 6–31 500 to >1000 Media and process * [20]
Pd γ-Al2O3 2–4 ELP 400 27 500 Dalian [21]Pd Metallic 3–5 ELP 450 20 450 H2/He CRI/Criterion * [22]
Pd-Ru Al2O3/PSS 6.4 ELP 400 19 15000 @ 10 bar NORAM *(former MRT) [23]
Pd-Ag α-Al2O3 3–9 ELP 350 15 >7600 Hysep * [24]Pd Metallic 12 PVD-ELP 417 11 1100 Plansee/KIT/Linde [25]
Pd85-Ag15 Metallic 4–5 ELP 400 10 >200,000 TECNALIA [10]
Pd Metallic 7.6 450 9 Infinite after 3500 h: >6000H2/He CRI/Criterion * [22]
Pd No 76 Self-supported 600 4 >>10,000 REB Research * [6]Pd85-Ag15 α-Al2O3 4 ELP 400 42 20,000 TECNALIA This work
* Commercial Pd-based membranes.
Molecules 2016, 21, 376 6 of 18
To have a fair prediction of the membranes performance at WGS conditions, it is essential toinvestigate the behavior of the membranes in the presence of WGS related gases. More specifically,the poisoning effect of CO and the inhibitory effect of H2O should be quantified. In addition, theexternal mass transfer limitations for H2 molecules to reach the membrane surface have to be takeninto account. Therefore, a series of experiments were designed to independently investigate the effectsof external mass transfer limitations, CO poisoning and H2O inhibition on the permeation propertiesof the membrane module for different gas compositions at different temperatures.
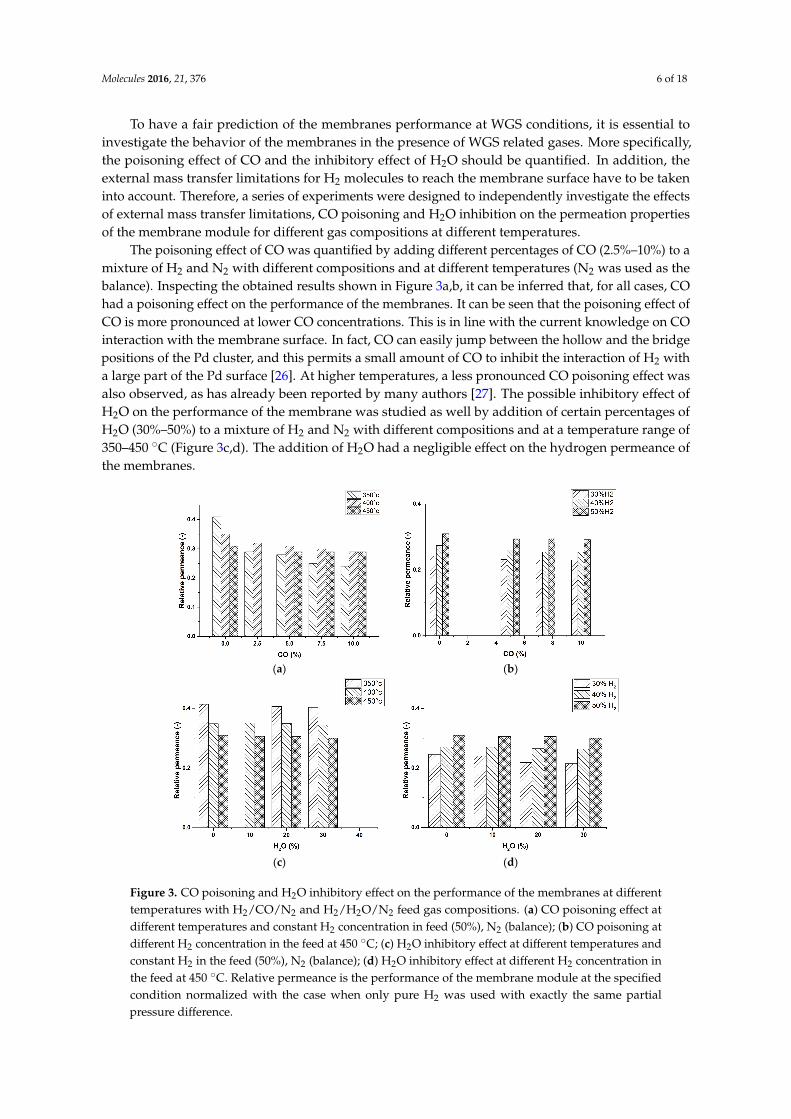
The poisoning effect of CO was quantified by adding different percentages of CO (2.5%–10%) to amixture of H2 and N2 with different compositions and at different temperatures (N2 was used as thebalance). Inspecting the obtained results shown in Figure 3a,b, it can be inferred that, for all cases, COhad a poisoning effect on the performance of the membranes. It can be seen that the poisoning effect ofCO is more pronounced at lower CO concentrations. This is in line with the current knowledge on COinteraction with the membrane surface. In fact, CO can easily jump between the hollow and the bridgepositions of the Pd cluster, and this permits a small amount of CO to inhibit the interaction of H2 witha large part of the Pd surface [26]. At higher temperatures, a less pronounced CO poisoning effect wasalso observed, as has already been reported by many authors [27]. The possible inhibitory effect ofH2O on the performance of the membrane was studied as well by addition of certain percentages ofH2O (30%–50%) to a mixture of H2 and N2 with different compositions and at a temperature range of350–450 ˝C (Figure 3c,d). The addition of H2O had a negligible effect on the hydrogen permeance ofthe membranes.
Molecules 2016, 21, 376 6 of 17
To have a fair prediction of the membranes performance at WGS conditions, it is essential to investigate the behavior of the membranes in the presence of WGS related gases. More specifically, the poisoning effect of CO and the inhibitory effect of H2O should be quantified. In addition, the external mass transfer limitations for H2 molecules to reach the membrane surface have to be taken into account. Therefore, a series of experiments were designed to independently investigate the effects of external mass transfer limitations, CO poisoning and H2O inhibition on the permeation properties of the membrane module for different gas compositions at different temperatures.
The poisoning effect of CO was quantified by adding different percentages of CO (2.5%–10%) to a mixture of H2 and N2 with different compositions and at different temperatures (N2 was used as the balance). Inspecting the obtained results shown in Figure 3a,b, it can be inferred that, for all cases, CO had a poisoning effect on the performance of the membranes. It can be seen that the poisoning effect of CO is more pronounced at lower CO concentrations. This is in line with the current knowledge on CO interaction with the membrane surface. In fact, CO can easily jump between the hollow and the bridge positions of the Pd cluster, and this permits a small amount of CO to inhibit the interaction of H2 with a large part of the Pd surface [26]. At higher temperatures, a less pronounced CO poisoning effect was also observed, as has already been reported by many authors [27]. The possible inhibitory effect of H2O on the performance of the membrane was studied as well by addition of certain percentages of H2O (30%–50%) to a mixture of H2 and N2 with different compositions and at a temperature range of 350–450 °C (Figure 3c,d). The addition of H2O had a negligible effect on the hydrogen permeance of the membranes.
(a) (b)
(c) (d)
Figure 3. CO poisoning and H2O inhibitory effect on the performance of the membranes at different temperatures with H2/CO/N2 and H2/H2O/N2 feed gas compositions. (a) CO poisoning effect at different temperatures and constant H2 concentration in feed (50%), N2 (balance); (b) CO poisoning at different H2 concentration in the feed at 450 °C; (c) H2O inhibitory effect at different temperatures and constant H2 in the feed (50%), N2 (balance); (d) H2O inhibitory effect at different H2 concentration in the feed at 450 °C. Relative permeance is the performance of the membrane module at the specified condition normalized with the case when only pure H2 was used with exactly the same partial pressure difference.
Figure 3. CO poisoning and H2O inhibitory effect on the performance of the membranes at differenttemperatures with H2/CO/N2 and H2/H2O/N2 feed gas compositions. (a) CO poisoning effect atdifferent temperatures and constant H2 concentration in feed (50%), N2 (balance); (b) CO poisoning atdifferent H2 concentration in the feed at 450 ˝C; (c) H2O inhibitory effect at different temperatures andconstant H2 in the feed (50%), N2 (balance); (d) H2O inhibitory effect at different H2 concentration inthe feed at 450 ˝C. Relative permeance is the performance of the membrane module at the specifiedcondition normalized with the case when only pure H2 was used with exactly the same partialpressure difference.
Molecules 2016, 21, 376 7 of 18
According to the obtained results (Figure 3a–d), the external mass transfer for H2 molecules toreach the membranes surface is affecting the H2 permeation flux and this effect is more pronouncedfor higher temperatures and lower H2 concentrations inside the reactor. This is due to the fact that athigher temperatures the membrane has a higher permeance increasing the concentration gradient fromthe gas bulk to the surface of the membranes (larger extent of concentration polarization). This can beimproved by employment of fluidizing particles inside the reactor. Due to a much better mixing ofthe gas mixture due to solids circulation patterns, the external mass transfer resistance will be largelydecreased [19]. Although when immersing very high flux membranes, a dynamic zone with a locallyhigher solids holdup could be formed (densified zones) in the vicinity of the membranes, which mayimpose a mass transfer resistance for H2 to reach the membrane surface. To mitigate this effect, use oflarger particles or operation in the turbulent fluidization regime could to be considered [28].
2.3. Long Term Membrane Performance
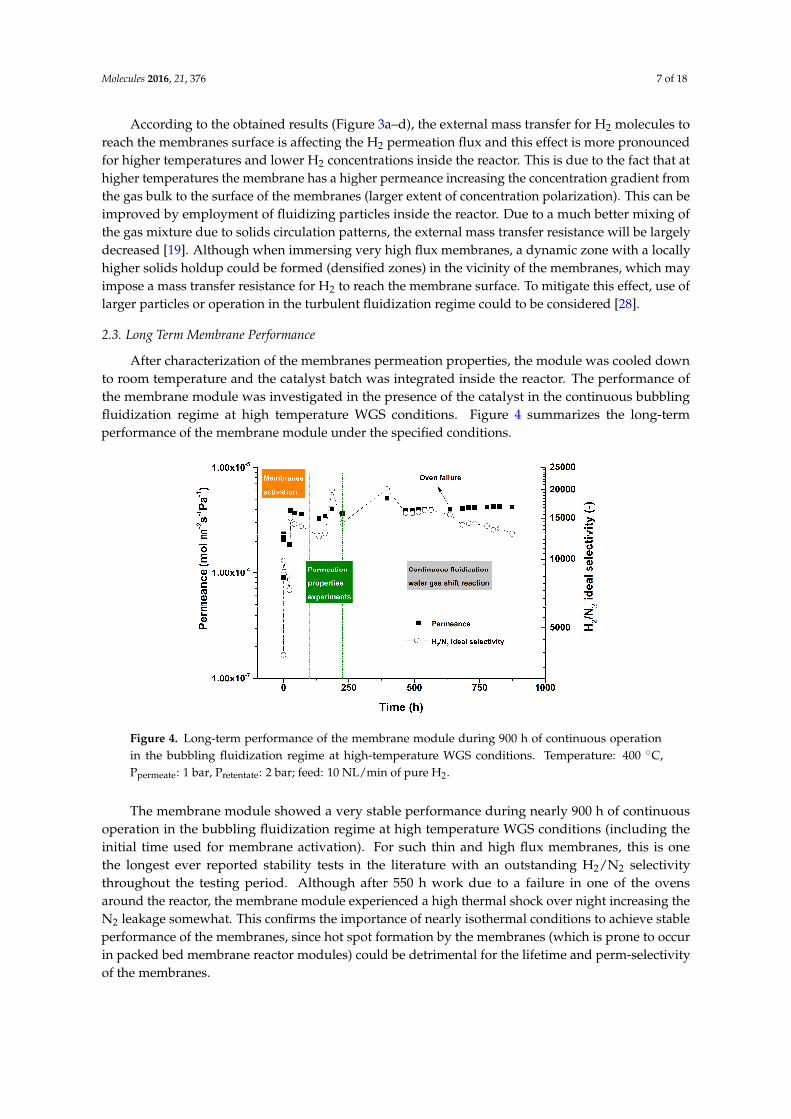
After characterization of the membranes permeation properties, the module was cooled downto room temperature and the catalyst batch was integrated inside the reactor. The performance ofthe membrane module was investigated in the presence of the catalyst in the continuous bubblingfluidization regime at high temperature WGS conditions. Figure 4 summarizes the long-termperformance of the membrane module under the specified conditions.
Molecules 2016, 21, 376 7 of 17
According to the obtained results (Figure 3a–d), the external mass transfer for H2 molecules to reach the membranes surface is affecting the H2 permeation flux and this effect is more pronounced for higher temperatures and lower H2 concentrations inside the reactor. This is due to the fact that at higher temperatures the membrane has a higher permeance increasing the concentration gradient from the gas bulk to the surface of the membranes (larger extent of concentration polarization). This can be improved by employment of fluidizing particles inside the reactor. Due to a much better mixing of the gas mixture due to solids circulation patterns, the external mass transfer resistance will be largely decreased [19]. Although when immersing very high flux membranes, a dynamic zone with a locally higher solids holdup could be formed (densified zones) in the vicinity of the membranes, which may impose a mass transfer resistance for H2 to reach the membrane surface. To mitigate this effect, use of larger particles or operation in the turbulent fluidization regime could to be considered [28].
2.3. Long Term Membrane Performance
After characterization of the membranes permeation properties, the module was cooled down to room temperature and the catalyst batch was integrated inside the reactor. The performance of the membrane module was investigated in the presence of the catalyst in the continuous bubbling fluidization regime at high temperature WGS conditions. Figure 4 summarizes the long-term performance of the membrane module under the specified conditions.
Figure 4. Long-term performance of the membrane module during 900 h of continuous operation in the bubbling fluidization regime at high-temperature WGS conditions. Temperature: 400 °C, Ppermeate: 1 bar, Pretentate: 2 bar; feed: 10 NL/min of pure H2.
The membrane module showed a very stable performance during nearly 900 h of continuous operation in the bubbling fluidization regime at high temperature WGS conditions (including the initial time used for membrane activation). For such thin and high flux membranes, this is one the longest ever reported stability tests in the literature with an outstanding H2/N2 selectivity throughout the testing period. Although after 550 h work due to a failure in one of the ovens around the reactor, the membrane module experienced a high thermal shock over night increasing the N2 leakage somewhat. This confirms the importance of nearly isothermal conditions to achieve stable performance of the membranes, since hot spot formation by the membranes (which is prone to occur in packed bed membrane reactor modules) could be detrimental for the lifetime and perm-selectivity of the membranes.
2.4. Fluidized Bed Membrane Reactor Performance
For all sets of experiments a standard operating procedure was followed to maintain consistency and comparability between the results. First of all, the reactor was set at a desired temperature to be stabilized. Three temperature sensors at the top, middle and bottom of the catalytic bed along the membrane module were placed to continuously monitor the ovens and reactor temperatures to be at
Figure 4. Long-term performance of the membrane module during 900 h of continuous operationin the bubbling fluidization regime at high-temperature WGS conditions. Temperature: 400 ˝C,Ppermeate: 1 bar, Pretentate: 2 bar; feed: 10 NL/min of pure H2.
The membrane module showed a very stable performance during nearly 900 h of continuousoperation in the bubbling fluidization regime at high temperature WGS conditions (including theinitial time used for membrane activation). For such thin and high flux membranes, this is onethe longest ever reported stability tests in the literature with an outstanding H2/N2 selectivitythroughout the testing period. Although after 550 h work due to a failure in one of the ovensaround the reactor, the membrane module experienced a high thermal shock over night increasing theN2 leakage somewhat. This confirms the importance of nearly isothermal conditions to achieve stableperformance of the membranes, since hot spot formation by the membranes (which is prone to occurin packed bed membrane reactor modules) could be detrimental for the lifetime and perm-selectivityof the membranes.
Molecules 2016, 21, 376 8 of 18
2.4. Fluidized Bed Membrane Reactor Performance
For all sets of experiments a standard operating procedure was followed to maintain consistencyand comparability between the results. First of all, the reactor was set at a desired temperature to bestabilized. Three temperature sensors at the top, middle and bottom of the catalytic bed along themembrane module were placed to continuously monitor the ovens and reactor temperatures to be atthe specified set points. Before starting with each experiment, the inlet gas mixture was bypassed tothe analyzer to measure the inlet dry gas composition. After inlet gas stabilization in the bypass mode,the feed gas was redirected to the reactor while the membranes were blocked in the permeate side toavoid H2 permeation through the membranes as is the case in the conventional fluidized bed reactor(in this case with internals). In the next step, the membranes were opened from the top part and avacuum pump was used to generate the trans-membrane pressure difference to investigate the effectof H2 permeation on the performance of the reactor. Table 2 illustrates the operating window in whichthe experiments were performed. In the following section, results from the experiments are plottedand discussed in terms of the main reactor performance characteristics, viz. CO conversion and H2
recovery factor, defined in Table 3. In addition, for all sets of the experiments the carbon balance waschecked to ensure that carbon deposition was always below 2%.
Table 2. Overview of the operating window for the experiments.
Parameter Unit Value
Pressure Range bar 1–3Temperature Range ˝C 350–450
U/Umf - 1.5–5Steam/Carbon (S/C) - 1.5–3
Table 3. Parameters that were used to quantify the reactor performance.
CO Conversionφco,in ´φco,out
φco,in
H2 Recovery FactorφH2,permeated
φH2,in `φH2,produced
ϕ: Molar flow.
2.5. Long Term Performance of the Membrane Reactor
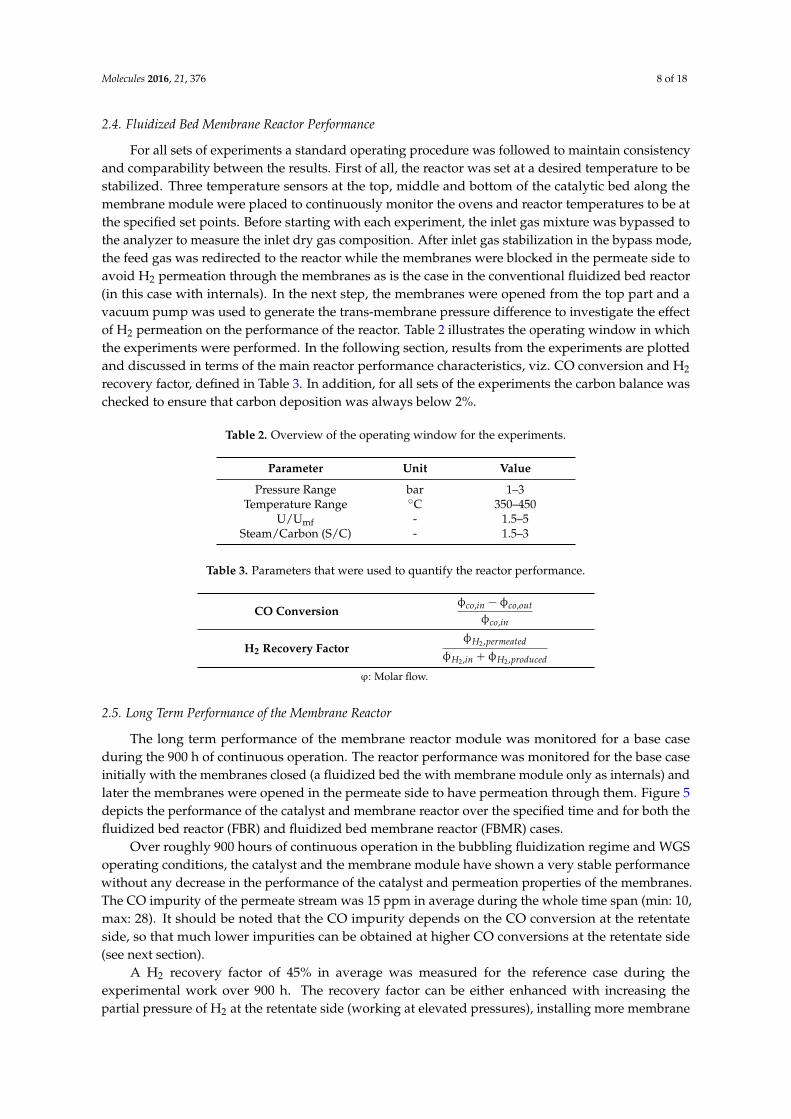
The long term performance of the membrane reactor module was monitored for a base caseduring the 900 h of continuous operation. The reactor performance was monitored for the base caseinitially with the membranes closed (a fluidized bed the with membrane module only as internals) andlater the membranes were opened in the permeate side to have permeation through them. Figure 5depicts the performance of the catalyst and membrane reactor over the specified time and for both thefluidized bed reactor (FBR) and fluidized bed membrane reactor (FBMR) cases.
Over roughly 900 hours of continuous operation in the bubbling fluidization regime and WGSoperating conditions, the catalyst and the membrane module have shown a very stable performancewithout any decrease in the performance of the catalyst and permeation properties of the membranes.The CO impurity of the permeate stream was 15 ppm in average during the whole time span (min: 10,max: 28). It should be noted that the CO impurity depends on the CO conversion at the retentateside, so that much lower impurities can be obtained at higher CO conversions at the retentate side(see next section).
A H2 recovery factor of 45% in average was measured for the reference case during theexperimental work over 900 h. The recovery factor can be either enhanced with increasing thepartial pressure of H2 at the retentate side (working at elevated pressures), installing more membrane
Molecules 2016, 21, 376 9 of 18
area or increasing the operating temperature of the module which will be explained in the next part ofresult and discussion.
Molecules 2016, 21, 376 8 of 17
the specified set points. Before starting with each experiment, the inlet gas mixture was bypassed to the analyzer to measure the inlet dry gas composition. After inlet gas stabilization in the bypass mode, the feed gas was redirected to the reactor while the membranes were blocked in the permeate side to avoid H2 permeation through the membranes as is the case in the conventional fluidized bed reactor (in this case with internals). In the next step, the membranes were opened from the top part and a vacuum pump was used to generate the trans-membrane pressure difference to investigate the effect of H2 permeation on the performance of the reactor. Table 2 illustrates the operating window in which the experiments were performed. In the following section, results from the experiments are plotted and discussed in terms of the main reactor performance characteristics, viz. CO conversion and H2 recovery factor, defined in Table 3. In addition, for all sets of the experiments the carbon balance was checked to ensure that carbon deposition was always below 2%.
Table 2. Overview of the operating window for the experiments.
Parameter Unit ValuePressure Range bar 1–3
Temperature Range °C 350–450U/Umf - 1.5–5
Steam/Carbon (S/C) - 1.5–3
Table 3. Parameters that were used to quantify the reactor performance.
CO Conversion , ,,
H2 Recovery Factor ϕ ,ϕ , ϕ ,
φ: Molar flow.
2.5. Long Term Performance of the Membrane Reactor
The long term performance of the membrane reactor module was monitored for a base case during the 900 h of continuous operation. The reactor performance was monitored for the base case initially with the membranes closed (a fluidized bed the with membrane module only as internals) and later the membranes were opened in the permeate side to have permeation through them. Figure 5 depicts the performance of the catalyst and membrane reactor over the specified time and for both the fluidized bed reactor (FBR) and fluidized bed membrane reactor (FBMR) cases.
Figure 5. The long term performance of the a fluidized bed membrane reactor (FBMR) module in comparison with a fluidized bed reactor (FBR) module over 900 h of continues work. Temperature: 400 °C, CO (10%), H2O (30%), N2 balance, U/Umf: 2.1, Pperm: 30 mbar, P:1 bar.
Figure 5. The long term performance of the a fluidized bed membrane reactor (FBMR) module incomparison with a fluidized bed reactor (FBR) module over 900 h of continues work. Temperature:400 ˝C, CO (10%), H2O (30%), N2 balance, U/Umf: 2.1, Pperm: 30 mbar, P:1 bar.
2.6. Fluidized Bed Reactor vs. Fluidized Bed Membrane Reactor
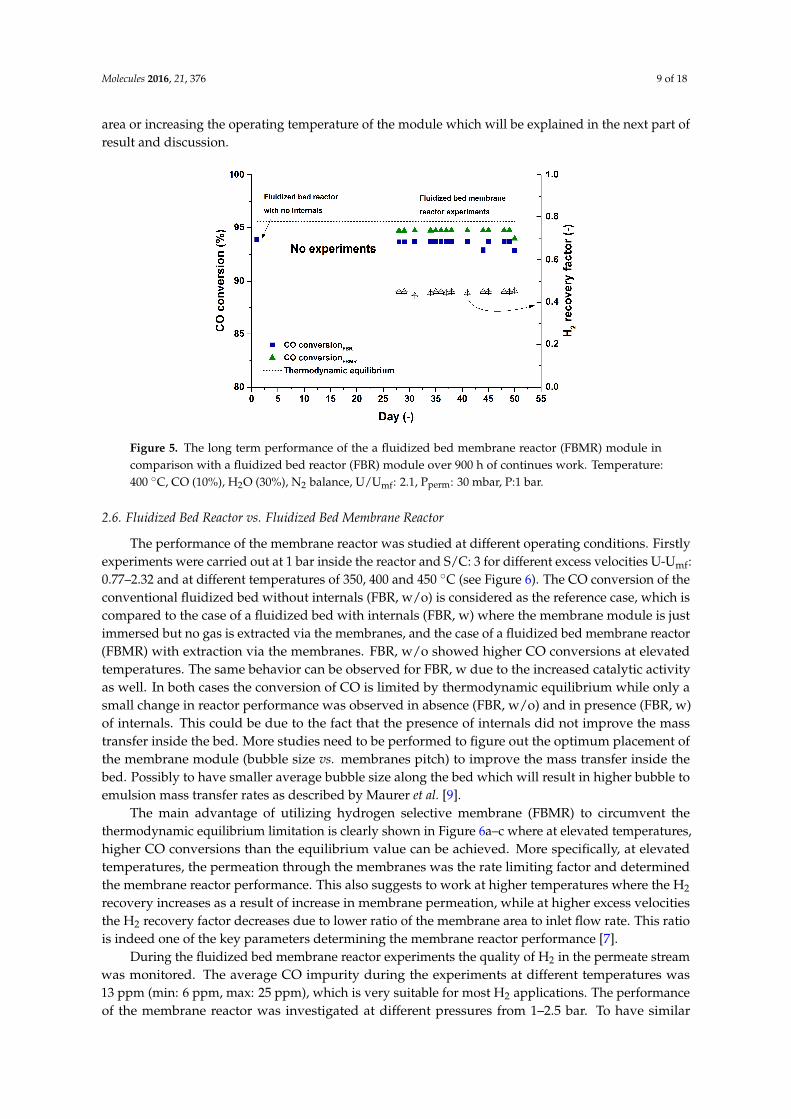
The performance of the membrane reactor was studied at different operating conditions. Firstlyexperiments were carried out at 1 bar inside the reactor and S/C: 3 for different excess velocities U-Umf:0.77–2.32 and at different temperatures of 350, 400 and 450 ˝C (see Figure 6). The CO conversion of theconventional fluidized bed without internals (FBR, w/o) is considered as the reference case, which iscompared to the case of a fluidized bed with internals (FBR, w) where the membrane module is justimmersed but no gas is extracted via the membranes, and the case of a fluidized bed membrane reactor(FBMR) with extraction via the membranes. FBR, w/o showed higher CO conversions at elevatedtemperatures. The same behavior can be observed for FBR, w due to the increased catalytic activityas well. In both cases the conversion of CO is limited by thermodynamic equilibrium while only asmall change in reactor performance was observed in absence (FBR, w/o) and in presence (FBR, w)of internals. This could be due to the fact that the presence of internals did not improve the masstransfer inside the bed. More studies need to be performed to figure out the optimum placement ofthe membrane module (bubble size vs. membranes pitch) to improve the mass transfer inside thebed. Possibly to have smaller average bubble size along the bed which will result in higher bubble toemulsion mass transfer rates as described by Maurer et al. [9].
The main advantage of utilizing hydrogen selective membrane (FBMR) to circumvent thethermodynamic equilibrium limitation is clearly shown in Figure 6a–c where at elevated temperatures,higher CO conversions than the equilibrium value can be achieved. More specifically, at elevatedtemperatures, the permeation through the membranes was the rate limiting factor and determinedthe membrane reactor performance. This also suggests to work at higher temperatures where the H2
recovery increases as a result of increase in membrane permeation, while at higher excess velocitiesthe H2 recovery factor decreases due to lower ratio of the membrane area to inlet flow rate. This ratiois indeed one of the key parameters determining the membrane reactor performance [7].
During the fluidized bed membrane reactor experiments the quality of H2 in the permeate streamwas monitored. The average CO impurity during the experiments at different temperatures was13 ppm (min: 6 ppm, max: 25 ppm), which is very suitable for most H2 applications. The performanceof the membrane reactor was investigated at different pressures from 1–2.5 bar. To have similar
Molecules 2016, 21, 376 10 of 18
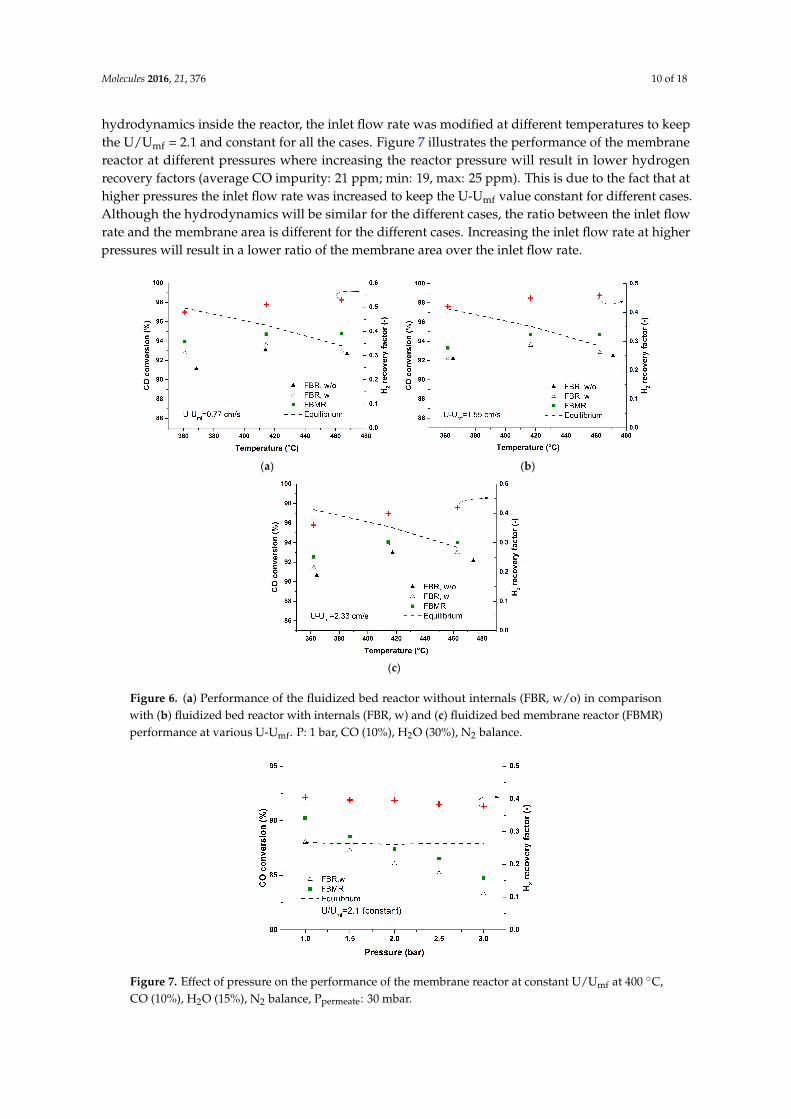
hydrodynamics inside the reactor, the inlet flow rate was modified at different temperatures to keepthe U/Umf = 2.1 and constant for all the cases. Figure 7 illustrates the performance of the membranereactor at different pressures where increasing the reactor pressure will result in lower hydrogenrecovery factors (average CO impurity: 21 ppm; min: 19, max: 25 ppm). This is due to the fact that athigher pressures the inlet flow rate was increased to keep the U-Umf value constant for different cases.Although the hydrodynamics will be similar for the different cases, the ratio between the inlet flowrate and the membrane area is different for the different cases. Increasing the inlet flow rate at higherpressures will result in a lower ratio of the membrane area over the inlet flow rate.
Molecules 2016, 21, 376 9 of 17
Over roughly 900 hours of continuous operation in the bubbling fluidization regime and WGS operating conditions, the catalyst and the membrane module have shown a very stable performance without any decrease in the performance of the catalyst and permeation properties of the membranes. The CO impurity of the permeate stream was 15 ppm in average during the whole time span (min: 10, max: 28). It should be noted that the CO impurity depends on the CO conversion at the retentate side, so that much lower impurities can be obtained at higher CO conversions at the retentate side (see next section).
A H2 recovery factor of 45% in average was measured for the reference case during the experimental work over 900 h. The recovery factor can be either enhanced with increasing the partial pressure of H2 at the retentate side (working at elevated pressures), installing more membrane area or increasing the operating temperature of the module which will be explained in the next part of result and discussion.
2.6. Fluidized Bed Reactor vs. Fluidized Bed Membrane Reactor
The performance of the membrane reactor was studied at different operating conditions. Firstly experiments were carried out at 1 bar inside the reactor and S/C: 3 for different excess velocities U-Umf: 0.77–2.32 and at different temperatures of 350, 400 and 450 °C (see Figure 6). The CO conversion of the conventional fluidized bed without internals (FBR, w/o) is considered as the reference case, which is compared to the case of a fluidized bed with internals (FBR, w) where the membrane module is just immersed but no gas is extracted via the membranes, and the case of a fluidized bed membrane reactor (FBMR) with extraction via the membranes. FBR, w/o showed higher CO conversions at elevated temperatures. The same behavior can be observed for FBR, w due to the increased catalytic activity as well. In both cases the conversion of CO is limited by thermodynamic equilibrium while only a small change in reactor performance was observed in absence (FBR, w/o) and in presence (FBR, w) of internals. This could be due to the fact that the presence of internals did not improve the mass transfer inside the bed. More studies need to be performed to figure out the optimum placement of the membrane module (bubble size vs. membranes pitch) to improve the mass transfer inside the bed. Possibly to have smaller average bubble size along the bed which will result in higher bubble to emulsion mass transfer rates as described by Maurer et al. [9].
The main advantage of utilizing hydrogen selective membrane (FBMR) to circumvent the thermodynamic equilibrium limitation is clearly shown in Figure 6a–c where at elevated temperatures, higher CO conversions than the equilibrium value can be achieved. More specifically, at elevated temperatures, the permeation through the membranes was the rate limiting factor and determined the membrane reactor performance. This also suggests to work at higher temperatures where the H2 recovery increases as a result of increase in membrane permeation, while at higher excess velocities the H2 recovery factor decreases due to lower ratio of the membrane area to inlet flow rate. This ratio is indeed one of the key parameters determining the membrane reactor performance [7].
(a) (b) Molecules 2016, 21, 376 10 of 17
(c)
Figure 6. (a) Performance of the fluidized bed reactor without internals (FBR, w/o) in comparison with (b) fluidized bed reactor with internals (FBR, w) and (c) fluidized bed membrane reactor (FBMR) performance at various U-Umf. P: 1 bar, CO (10%), H2O (30%), N2 balance.
During the fluidized bed membrane reactor experiments the quality of H2 in the permeate stream was monitored. The average CO impurity during the experiments at different temperatures was 13 ppm (min: 6 ppm, max: 25 ppm), which is very suitable for most H2 applications. The performance of the membrane reactor was investigated at different pressures from 1–2.5 bar. To have similar hydrodynamics inside the reactor, the inlet flow rate was modified at different temperatures to keep the U/Umf = 2.1 and constant for all the cases. Figure 7 illustrates the performance of the membrane reactor at different pressures where increasing the reactor pressure will result in lower hydrogen recovery factors (average CO impurity: 21 ppm; min: 19, max: 25 ppm). This is due to the fact that at higher pressures the inlet flow rate was increased to keep the U-Umf value constant for different cases. Although the hydrodynamics will be similar for the different cases, the ratio between the inlet flow rate and the membrane area is different for the different cases. Increasing the inlet flow rate at higher pressures will result in a lower ratio of the membrane area over the inlet flow rate.
Figure 7. Effect of pressure on the performance of the membrane reactor at constant U/Umf at 400 °C, CO (10%), H2O (15%), N2 balance, Ppermeate: 30 mbar.
To show this more clearly, a new test with constant inlet flow rate was carried out for different operating pressures. Figure 8 clearly shows higher CO conversions at higher membrane reactor pressures when keeping the inlet flow rate constant. In this case at higher pressures the hydrogen recovery will be higher as well (average CO impurity: 7 ppm, min: 3 ppm, max: 9 ppm). Although increasing the pressure above 2 bar inside the reactor did not affect the performance of the membrane reactor much. This is due to the fact that at higher pressures (with constant inlet flow rate) the U/Umf ratio will be lower. Therefore, at higher pressures the mixing will be worse and this will induce the
Figure 6. (a) Performance of the fluidized bed reactor without internals (FBR, w/o) in comparisonwith (b) fluidized bed reactor with internals (FBR, w) and (c) fluidized bed membrane reactor (FBMR)performance at various U-Umf. P: 1 bar, CO (10%), H2O (30%), N2 balance.
Molecules 2016, 21, 376 10 of 17
(c)
Figure 6. (a) Performance of the fluidized bed reactor without internals (FBR, w/o) in comparison with (b) fluidized bed reactor with internals (FBR, w) and (c) fluidized bed membrane reactor (FBMR) performance at various U-Umf. P: 1 bar, CO (10%), H2O (30%), N2 balance.
During the fluidized bed membrane reactor experiments the quality of H2 in the permeate stream was monitored. The average CO impurity during the experiments at different temperatures was 13 ppm (min: 6 ppm, max: 25 ppm), which is very suitable for most H2 applications. The performance of the membrane reactor was investigated at different pressures from 1–2.5 bar. To have similar hydrodynamics inside the reactor, the inlet flow rate was modified at different temperatures to keep the U/Umf = 2.1 and constant for all the cases. Figure 7 illustrates the performance of the membrane reactor at different pressures where increasing the reactor pressure will result in lower hydrogen recovery factors (average CO impurity: 21 ppm; min: 19, max: 25 ppm). This is due to the fact that at higher pressures the inlet flow rate was increased to keep the U-Umf value constant for different cases. Although the hydrodynamics will be similar for the different cases, the ratio between the inlet flow rate and the membrane area is different for the different cases. Increasing the inlet flow rate at higher pressures will result in a lower ratio of the membrane area over the inlet flow rate.
Figure 7. Effect of pressure on the performance of the membrane reactor at constant U/Umf at 400 °C, CO (10%), H2O (15%), N2 balance, Ppermeate: 30 mbar.
To show this more clearly, a new test with constant inlet flow rate was carried out for different operating pressures. Figure 8 clearly shows higher CO conversions at higher membrane reactor pressures when keeping the inlet flow rate constant. In this case at higher pressures the hydrogen recovery will be higher as well (average CO impurity: 7 ppm, min: 3 ppm, max: 9 ppm). Although increasing the pressure above 2 bar inside the reactor did not affect the performance of the membrane reactor much. This is due to the fact that at higher pressures (with constant inlet flow rate) the U/Umf ratio will be lower. Therefore, at higher pressures the mixing will be worse and this will induce the
Figure 7. Effect of pressure on the performance of the membrane reactor at constant U/Umf at 400 ˝C,CO (10%), H2O (15%), N2 balance, Ppermeate: 30 mbar.
Molecules 2016, 21, 376 11 of 18
To show this more clearly, a new test with constant inlet flow rate was carried out for differentoperating pressures. Figure 8 clearly shows higher CO conversions at higher membrane reactorpressures when keeping the inlet flow rate constant. In this case at higher pressures the hydrogenrecovery will be higher as well (average CO impurity: 7 ppm, min: 3 ppm, max: 9 ppm). Althoughincreasing the pressure above 2 bar inside the reactor did not affect the performance of the membranereactor much. This is due to the fact that at higher pressures (with constant inlet flow rate) the U/Umfratio will be lower. Therefore, at higher pressures the mixing will be worse and this will induce themass transfer limitation inside the catalytic bed. Although CO conversions above the equilibrium canbe achieved for higher inlet flow rates, due to limitations in the CO mass flow controller, experimentsfor higher inlet flow rates were not feasible with the specified inlet gas composition. Therefore,experiments were continued with a semi-industrial WGS inlet gas composition.
Molecules 2016, 21, 376 11 of 17
mass transfer limitation inside the catalytic bed. Although CO conversions above the equilibrium can be achieved for higher inlet flow rates, due to limitations in the CO mass flow controller, experiments for higher inlet flow rates were not feasible with the specified inlet gas composition. Therefore, experiments were continued with a semi-industrial WGS inlet gas composition.
Figure 8. Membrane reactor performance at different pressures up to 2.5 bar and at 400 °C, CO (5%), H2O (15%), CH4 (0%), H2 (18%), N2 balance, U/Umf:1.71–6, Ppermeate: 30 mbar.
2.7. Reactor Performance for Industrial Inlet Composition
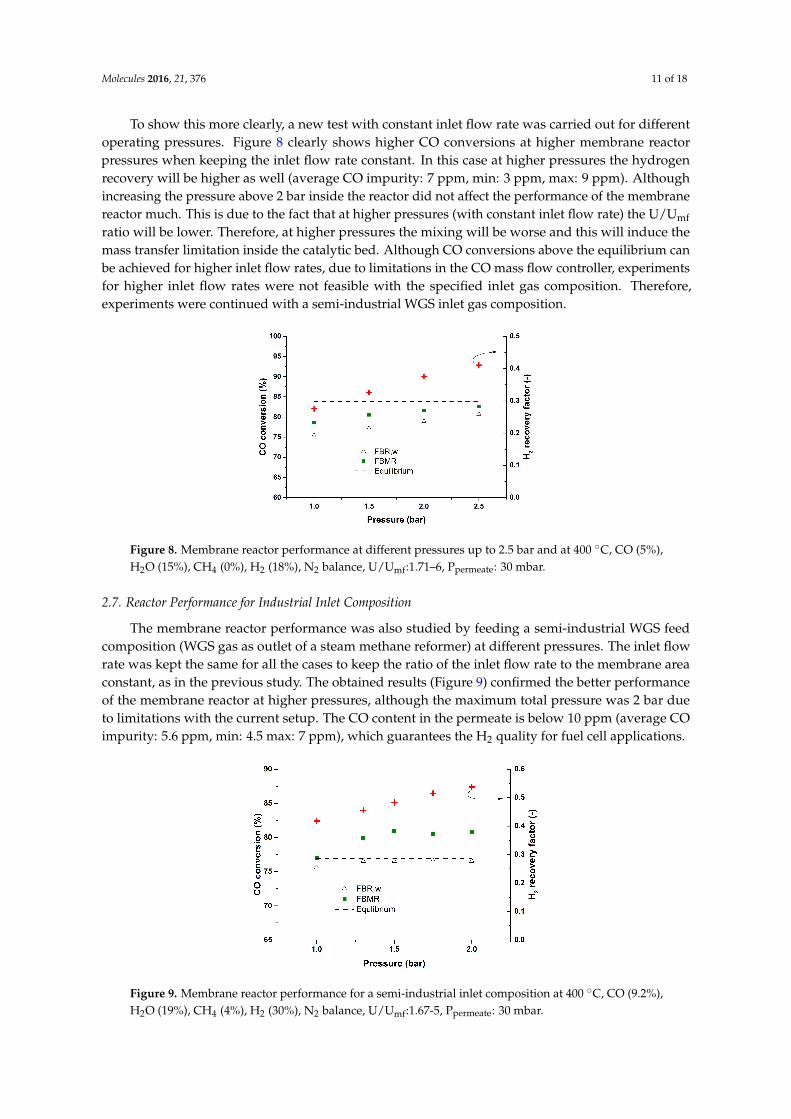
The membrane reactor performance was also studied by feeding a semi-industrial WGS feed composition (WGS gas as outlet of a steam methane reformer) at different pressures. The inlet flow rate was kept the same for all the cases to keep the ratio of the inlet flow rate to the membrane area constant, as in the previous study. The obtained results (Figure 9) confirmed the better performance of the membrane reactor at higher pressures, although the maximum total pressure was 2 bar due to limitations with the current setup. The CO content in the permeate is below 10 ppm (average CO impurity: 5.6 ppm, min: 4.5 max: 7 ppm), which guarantees the H2 quality for fuel cell applications.
Figure 9. Membrane reactor performance for a semi-industrial inlet composition at 400 °C, CO (9.2%), H2O (19%), CH4 (4%), H2 (30%), N2 balance, U/Umf:1.67-5, Ppermeate: 30 mbar
A similar experiment was carried out at 450 °C to assess whether the performance of the membrane reactor can be improved at higher temperatures. Although an increase in the temperature results in better performance of the membrane reactor in terms of CO conversion and H2 recovery factor, a high degree of methanation occurs at higher reactor temperatures. Apparently, the catalyst used in this study is active for methanation only at temperatures around and above 450 °C. Therefore, for the inlet composition similar to industrial WGS reactors it is recommended to operate at around 400 °C to minimize methanation.
Figure 8. Membrane reactor performance at different pressures up to 2.5 bar and at 400 ˝C, CO (5%),H2O (15%), CH4 (0%), H2 (18%), N2 balance, U/Umf:1.71–6, Ppermeate: 30 mbar.
2.7. Reactor Performance for Industrial Inlet Composition
The membrane reactor performance was also studied by feeding a semi-industrial WGS feedcomposition (WGS gas as outlet of a steam methane reformer) at different pressures. The inlet flowrate was kept the same for all the cases to keep the ratio of the inlet flow rate to the membrane areaconstant, as in the previous study. The obtained results (Figure 9) confirmed the better performanceof the membrane reactor at higher pressures, although the maximum total pressure was 2 bar dueto limitations with the current setup. The CO content in the permeate is below 10 ppm (average COimpurity: 5.6 ppm, min: 4.5 max: 7 ppm), which guarantees the H2 quality for fuel cell applications.
Molecules 2016, 21, 376 11 of 17
mass transfer limitation inside the catalytic bed. Although CO conversions above the equilibrium can be achieved for higher inlet flow rates, due to limitations in the CO mass flow controller, experiments for higher inlet flow rates were not feasible with the specified inlet gas composition. Therefore, experiments were continued with a semi-industrial WGS inlet gas composition.
Figure 8. Membrane reactor performance at different pressures up to 2.5 bar and at 400 °C, CO (5%), H2O (15%), CH4 (0%), H2 (18%), N2 balance, U/Umf:1.71–6, Ppermeate: 30 mbar.
2.7. Reactor Performance for Industrial Inlet Composition
The membrane reactor performance was also studied by feeding a semi-industrial WGS feed composition (WGS gas as outlet of a steam methane reformer) at different pressures. The inlet flow rate was kept the same for all the cases to keep the ratio of the inlet flow rate to the membrane area constant, as in the previous study. The obtained results (Figure 9) confirmed the better performance of the membrane reactor at higher pressures, although the maximum total pressure was 2 bar due to limitations with the current setup. The CO content in the permeate is below 10 ppm (average CO impurity: 5.6 ppm, min: 4.5 max: 7 ppm), which guarantees the H2 quality for fuel cell applications.
Figure 9. Membrane reactor performance for a semi-industrial inlet composition at 400 °C, CO (9.2%), H2O (19%), CH4 (4%), H2 (30%), N2 balance, U/Umf:1.67-5, Ppermeate: 30 mbar
A similar experiment was carried out at 450 °C to assess whether the performance of the membrane reactor can be improved at higher temperatures. Although an increase in the temperature results in better performance of the membrane reactor in terms of CO conversion and H2 recovery factor, a high degree of methanation occurs at higher reactor temperatures. Apparently, the catalyst used in this study is active for methanation only at temperatures around and above 450 °C. Therefore, for the inlet composition similar to industrial WGS reactors it is recommended to operate at around 400 °C to minimize methanation.
Figure 9. Membrane reactor performance for a semi-industrial inlet composition at 400 ˝C, CO (9.2%),H2O (19%), CH4 (4%), H2 (30%), N2 balance, U/Umf:1.67-5, Ppermeate: 30 mbar.
Molecules 2016, 21, 376 12 of 18
A similar experiment was carried out at 450 ˝C to assess whether the performance of themembrane reactor can be improved at higher temperatures. Although an increase in the temperatureresults in better performance of the membrane reactor in terms of CO conversion and H2 recoveryfactor, a high degree of methanation occurs at higher reactor temperatures. Apparently, the catalystused in this study is active for methanation only at temperatures around and above 450 ˝C. Therefore,for the inlet composition similar to industrial WGS reactors it is recommended to operate at around400 ˝C to minimize methanation.
2.8. Post-Mortem Analysis
2.8.1. Membranes
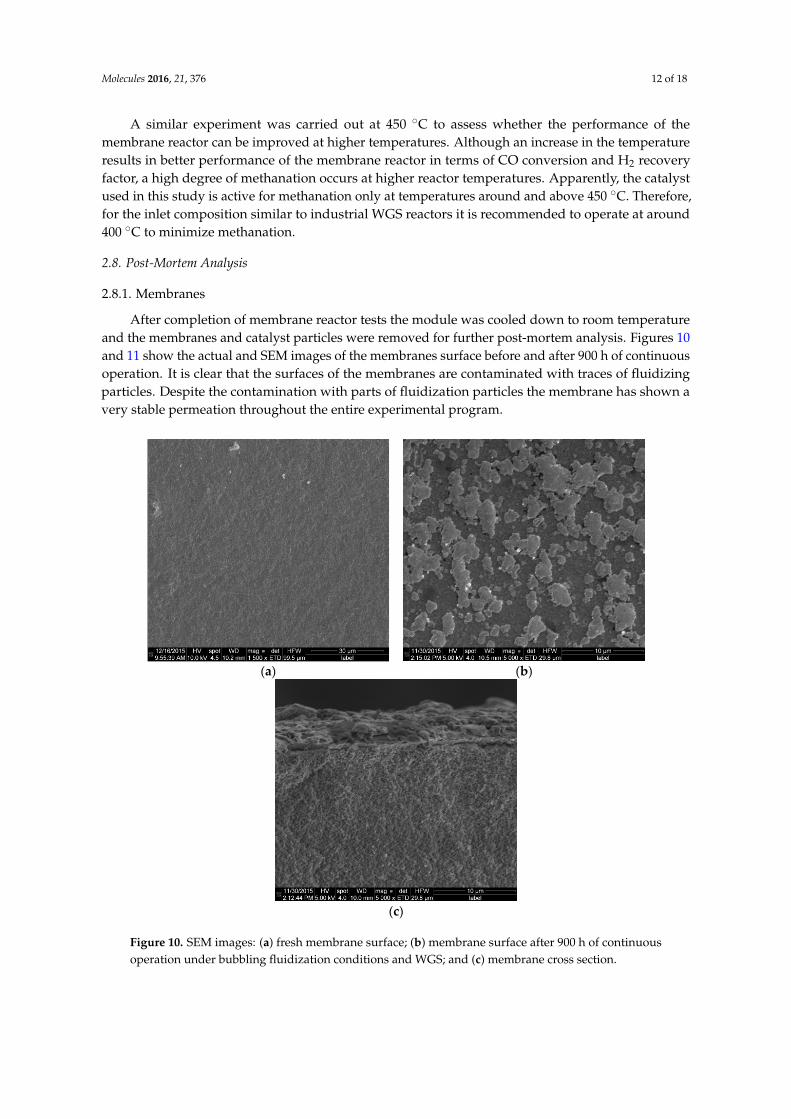
After completion of membrane reactor tests the module was cooled down to room temperatureand the membranes and catalyst particles were removed for further post-mortem analysis. Figures 10and 11 show the actual and SEM images of the membranes surface before and after 900 h of continuousoperation. It is clear that the surfaces of the membranes are contaminated with traces of fluidizingparticles. Despite the contamination with parts of fluidization particles the membrane has shown avery stable permeation throughout the entire experimental program.
Molecules 2016, 21, 376 12 of 17
2.8. Post-Mortem Analysis
2.8.1. Membranes
After completion of membrane reactor tests the module was cooled down to room temperature and the membranes and catalyst particles were removed for further post-mortem analysis. Figures 10 and 11 show the actual and SEM images of the membranes surface before and after 900 h of continuous operation. It is clear that the surfaces of the membranes are contaminated with traces of fluidizing particles. Despite the contamination with parts of fluidization particles the membrane has shown a very stable permeation throughout the entire experimental program.
(a) (b)
(c)
Figure 10. SEM images: (a) fresh membrane surface; (b) membrane surface after 900 h of continuous operation under bubbling fluidization conditions and WGS; and (c) membrane cross section.
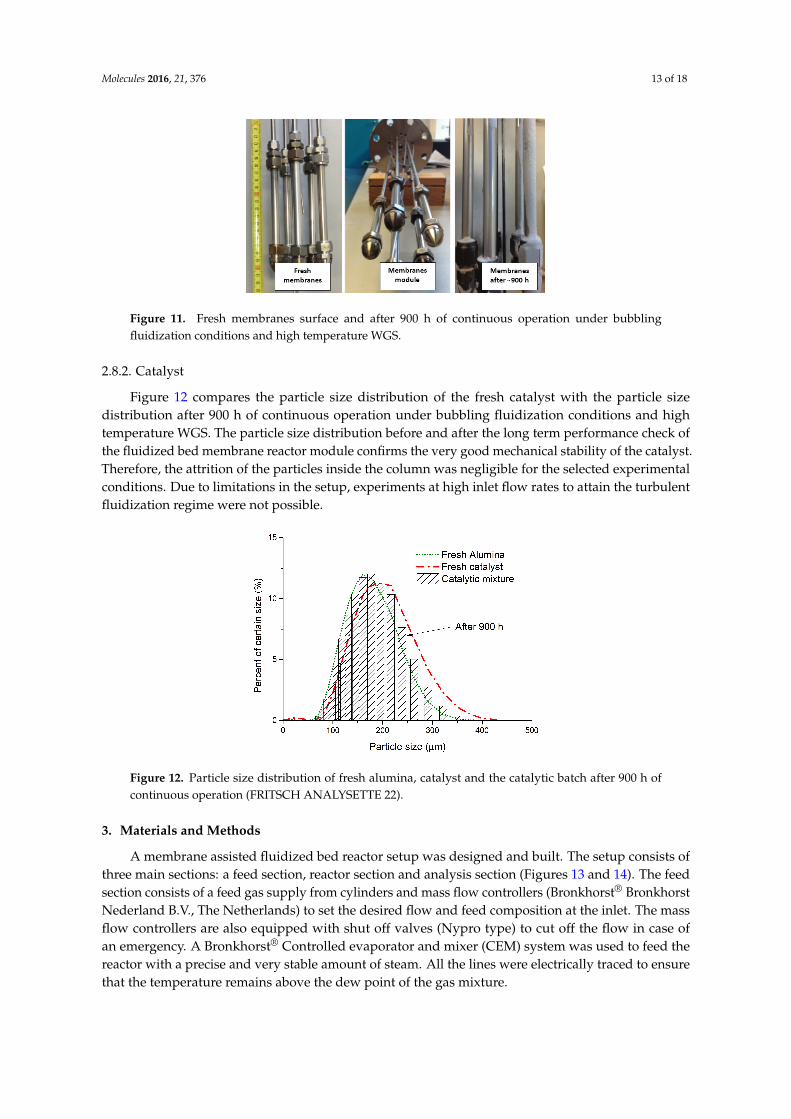
Figure 11. Fresh membranes surface and after 900 h of continuous operation under bubbling fluidization conditions and high temperature WGS.
Figure 10. SEM images: (a) fresh membrane surface; (b) membrane surface after 900 h of continuousoperation under bubbling fluidization conditions and WGS; and (c) membrane cross section.
Molecules 2016, 21, 376 13 of 18
Molecules 2016, 21, 376 12 of 17
2.8. Post-Mortem Analysis
2.8.1. Membranes
After completion of membrane reactor tests the module was cooled down to room temperature and the membranes and catalyst particles were removed for further post-mortem analysis. Figures 10 and 11 show the actual and SEM images of the membranes surface before and after 900 h of continuous operation. It is clear that the surfaces of the membranes are contaminated with traces of fluidizing particles. Despite the contamination with parts of fluidization particles the membrane has shown a very stable permeation throughout the entire experimental program.
(a) (b)
(c)
Figure 10. SEM images: (a) fresh membrane surface; (b) membrane surface after 900 h of continuous operation under bubbling fluidization conditions and WGS; and (c) membrane cross section.
Figure 11. Fresh membranes surface and after 900 h of continuous operation under bubbling fluidization conditions and high temperature WGS. Figure 11. Fresh membranes surface and after 900 h of continuous operation under bubblingfluidization conditions and high temperature WGS.
2.8.2. Catalyst
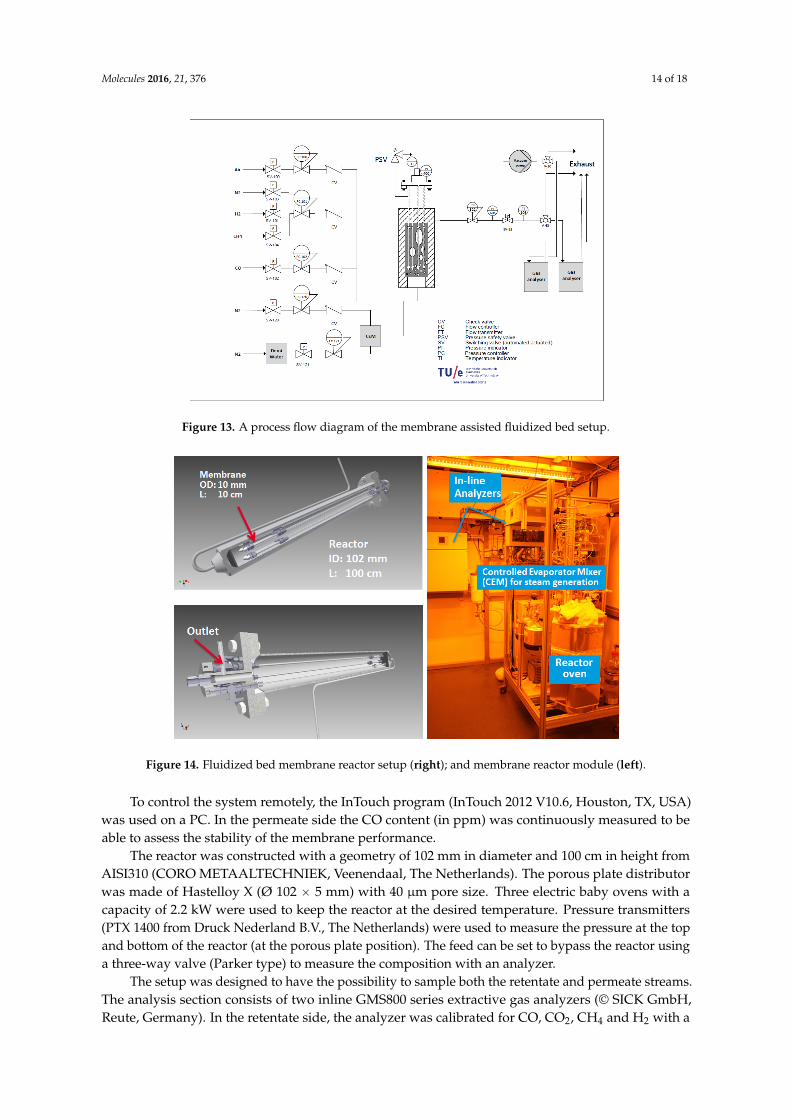
Figure 12 compares the particle size distribution of the fresh catalyst with the particle sizedistribution after 900 h of continuous operation under bubbling fluidization conditions and hightemperature WGS. The particle size distribution before and after the long term performance check ofthe fluidized bed membrane reactor module confirms the very good mechanical stability of the catalyst.Therefore, the attrition of the particles inside the column was negligible for the selected experimentalconditions. Due to limitations in the setup, experiments at high inlet flow rates to attain the turbulentfluidization regime were not possible.
Molecules 2016, 21, 376 13 of 17
2.8.2. Catalyst
Figure 12 compares the particle size distribution of the fresh catalyst with the particle size distribution after 900 h of continuous operation under bubbling fluidization conditions and high temperature WGS. The particle size distribution before and after the long term performance check of the fluidized bed membrane reactor module confirms the very good mechanical stability of the catalyst. Therefore, the attrition of the particles inside the column was negligible for the selected experimental conditions. Due to limitations in the setup, experiments at high inlet flow rates to attain the turbulent fluidization regime were not possible.
Figure 12. Particle size distribution of fresh alumina, catalyst and the catalytic batch after 900 h of continuous operation (FRITSCH ANALYSETTE 22).
3. Materials and Methods
A membrane assisted fluidized bed reactor setup was designed and built. The setup consists of three main sections: a feed section, reactor section and analysis section (Figures 13 and 14). The feed section consists of a feed gas supply from cylinders and mass flow controllers (Bronkhorst® Bronkhorst Nederland B.V., The Netherlands) to set the desired flow and feed composition at the inlet. The mass flow controllers are also equipped with shut off valves (Nypro type) to cut off the flow in case of an emergency. A Bronkhorst® Controlled evaporator and mixer (CEM) system was used to feed the reactor with a precise and very stable amount of steam. All the lines were electrically traced to ensure that the temperature remains above the dew point of the gas mixture.
Figure 13. A process flow diagram of the membrane assisted fluidized bed setup.
Figure 12. Particle size distribution of fresh alumina, catalyst and the catalytic batch after 900 h ofcontinuous operation (FRITSCH ANALYSETTE 22).
3. Materials and Methods
A membrane assisted fluidized bed reactor setup was designed and built. The setup consists ofthree main sections: a feed section, reactor section and analysis section (Figures 13 and 14). The feedsection consists of a feed gas supply from cylinders and mass flow controllers (Bronkhorst® BronkhorstNederland B.V., The Netherlands) to set the desired flow and feed composition at the inlet. The massflow controllers are also equipped with shut off valves (Nypro type) to cut off the flow in case ofan emergency. A Bronkhorst® Controlled evaporator and mixer (CEM) system was used to feed thereactor with a precise and very stable amount of steam. All the lines were electrically traced to ensurethat the temperature remains above the dew point of the gas mixture.
Molecules 2016, 21, 376 14 of 18
Molecules 2016, 21, 376 13 of 17
2.8.2. Catalyst
Figure 12 compares the particle size distribution of the fresh catalyst with the particle size distribution after 900 h of continuous operation under bubbling fluidization conditions and high temperature WGS. The particle size distribution before and after the long term performance check of the fluidized bed membrane reactor module confirms the very good mechanical stability of the catalyst. Therefore, the attrition of the particles inside the column was negligible for the selected experimental conditions. Due to limitations in the setup, experiments at high inlet flow rates to attain the turbulent fluidization regime were not possible.
Figure 12. Particle size distribution of fresh alumina, catalyst and the catalytic batch after 900 h of continuous operation (FRITSCH ANALYSETTE 22).
3. Materials and Methods
A membrane assisted fluidized bed reactor setup was designed and built. The setup consists of three main sections: a feed section, reactor section and analysis section (Figures 13 and 14). The feed section consists of a feed gas supply from cylinders and mass flow controllers (Bronkhorst® Bronkhorst Nederland B.V., The Netherlands) to set the desired flow and feed composition at the inlet. The mass flow controllers are also equipped with shut off valves (Nypro type) to cut off the flow in case of an emergency. A Bronkhorst® Controlled evaporator and mixer (CEM) system was used to feed the reactor with a precise and very stable amount of steam. All the lines were electrically traced to ensure that the temperature remains above the dew point of the gas mixture.
Figure 13. A process flow diagram of the membrane assisted fluidized bed setup. Figure 13. A process flow diagram of the membrane assisted fluidized bed setup.Molecules 2016, 21, 376 14 of 17
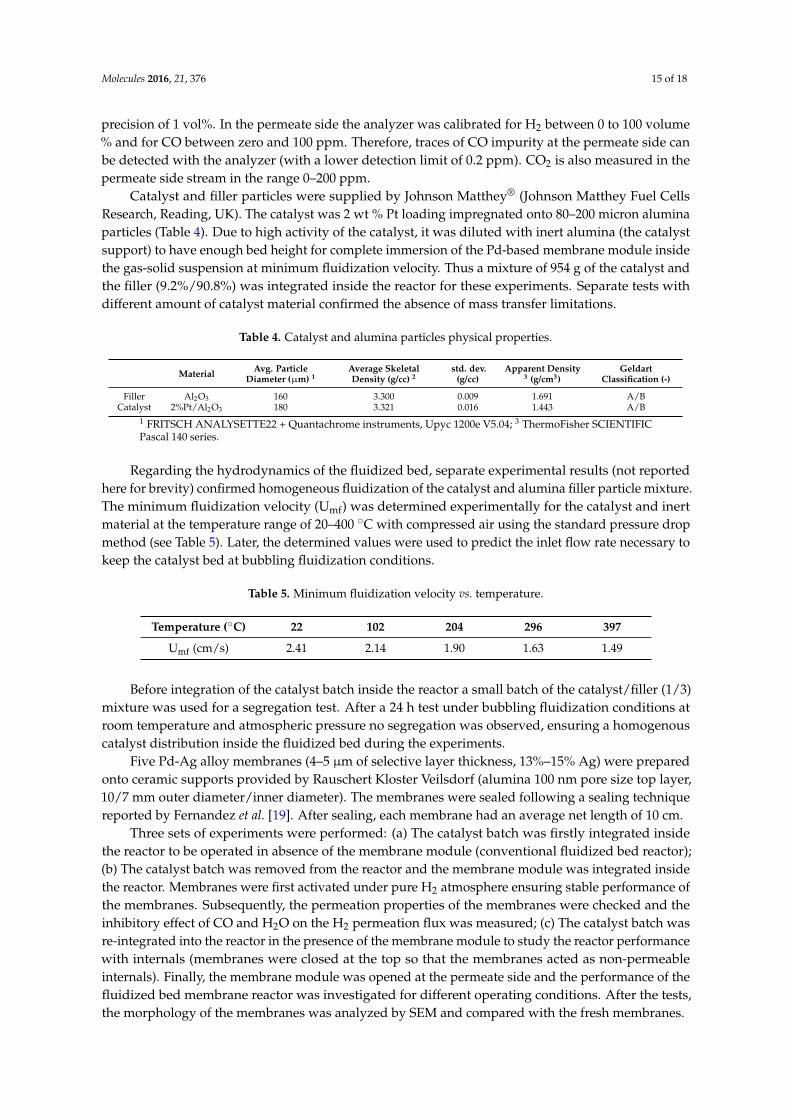
Figure 14. Fluidized bed membrane reactor setup (right); and membrane reactor module (left).
To control the system remotely, the InTouch program (InTouch 2012 V10.6, Houston, TX, USA) was used on a PC. In the permeate side the CO content (in ppm) was continuously measured to be able to assess the stability of the membrane performance.
The reactor was constructed with a geometry of 102 mm in diameter and 100 cm in height from AISI310 (CORO METAALTECHNIEK, Veenendaal, The Netherlands). The porous plate distributor was made of Hastelloy X (Ø 102 × 5 mm) with 40 µm pore size. Three electric baby ovens with a capacity of 2.2 kW were used to keep the reactor at the desired temperature. Pressure transmitters (PTX 1400 from Druck Nederland B.V., The Netherlands) were used to measure the pressure at the top and bottom of the reactor (at the porous plate position). The feed can be set to bypass the reactor using a three-way valve (Parker type) to measure the composition with an analyzer.
The setup was designed to have the possibility to sample both the retentate and permeate streams. The analysis section consists of two inline GMS800 series extractive gas analyzers (© SICK GmbH, Reute, Germany). In the retentate side, the analyzer was calibrated for CO, CO2, CH4 and H2 with a precision of 1 vol%. In the permeate side the analyzer was calibrated for H2 between 0 to 100 volume % and for CO between zero and 100 ppm. Therefore, traces of CO impurity at the permeate side can be detected with the analyzer (with a lower detection limit of 0.2 ppm). CO2 is also measured in the permeate side stream in the range 0–200 ppm.
Catalyst and filler particles were supplied by Johnson Matthey® (Johnson Matthey Fuel Cells Research, Reading, UK). The catalyst was 2 wt % Pt loading impregnated onto 80–200 micron alumina particles (Table 4). Due to high activity of the catalyst, it was diluted with inert alumina (the catalyst support) to have enough bed height for complete immersion of the Pd-based membrane module inside the gas-solid suspension at minimum fluidization velocity. Thus a mixture of 954 g of the catalyst and the filler (9.2%/90.8%) was integrated inside the reactor for these experiments. Separate tests with different amount of catalyst material confirmed the absence of mass transfer limitations.
Table 4. Catalyst and alumina particles physical properties.
Material Avg. Particle Diameter (µm) 1
Average Skeletal Density (g/cc) 2
std. dev. (g/cc)
Apparent Density 3 (g/cm3)
Geldart Classification (-)
Filler Al2O3 160 3.300 0.009 1.691 A/B Catalyst 2%Pt/Al2O3 180 3.321 0.016 1.443 A/B
1 FRITSCH ANALYSETTE22 + Quantachrome instruments, Upyc 1200e V5.04; 3 ThermoFisher SCIENTIFIC Pascal 140 series.
Regarding the hydrodynamics of the fluidized bed, separate experimental results (not reported here for brevity) confirmed homogeneous fluidization of the catalyst and alumina filler particle
Figure 14. Fluidized bed membrane reactor setup (right); and membrane reactor module (left).
To control the system remotely, the InTouch program (InTouch 2012 V10.6, Houston, TX, USA)was used on a PC. In the permeate side the CO content (in ppm) was continuously measured to beable to assess the stability of the membrane performance.
The reactor was constructed with a geometry of 102 mm in diameter and 100 cm in height fromAISI310 (CORO METAALTECHNIEK, Veenendaal, The Netherlands). The porous plate distributorwas made of Hastelloy X (Ø 102 ˆ 5 mm) with 40 µm pore size. Three electric baby ovens with acapacity of 2.2 kW were used to keep the reactor at the desired temperature. Pressure transmitters(PTX 1400 from Druck Nederland B.V., The Netherlands) were used to measure the pressure at the topand bottom of the reactor (at the porous plate position). The feed can be set to bypass the reactor usinga three-way valve (Parker type) to measure the composition with an analyzer.
The setup was designed to have the possibility to sample both the retentate and permeate streams.The analysis section consists of two inline GMS800 series extractive gas analyzers (© SICK GmbH,Reute, Germany). In the retentate side, the analyzer was calibrated for CO, CO2, CH4 and H2 with a
Molecules 2016, 21, 376 15 of 18
precision of 1 vol%. In the permeate side the analyzer was calibrated for H2 between 0 to 100 volume% and for CO between zero and 100 ppm. Therefore, traces of CO impurity at the permeate side canbe detected with the analyzer (with a lower detection limit of 0.2 ppm). CO2 is also measured in thepermeate side stream in the range 0–200 ppm.
Catalyst and filler particles were supplied by Johnson Matthey® (Johnson Matthey Fuel CellsResearch, Reading, UK). The catalyst was 2 wt % Pt loading impregnated onto 80–200 micron aluminaparticles (Table 4). Due to high activity of the catalyst, it was diluted with inert alumina (the catalystsupport) to have enough bed height for complete immersion of the Pd-based membrane module insidethe gas-solid suspension at minimum fluidization velocity. Thus a mixture of 954 g of the catalyst andthe filler (9.2%/90.8%) was integrated inside the reactor for these experiments. Separate tests withdifferent amount of catalyst material confirmed the absence of mass transfer limitations.
Table 4. Catalyst and alumina particles physical properties.
Material Avg. ParticleDiameter (µm) 1
Average SkeletalDensity (g/cc) 2
std. dev.(g/cc)
Apparent Density3 (g/cm3)
GeldartClassification (-)
Filler Al2O3 160 3.300 0.009 1.691 A/BCatalyst 2%Pt/Al2O3 180 3.321 0.016 1.443 A/B
1 FRITSCH ANALYSETTE22 + Quantachrome instruments, Upyc 1200e V5.04; 3 ThermoFisher SCIENTIFICPascal 140 series.
Regarding the hydrodynamics of the fluidized bed, separate experimental results (not reportedhere for brevity) confirmed homogeneous fluidization of the catalyst and alumina filler particle mixture.The minimum fluidization velocity (Umf) was determined experimentally for the catalyst and inertmaterial at the temperature range of 20–400 ˝C with compressed air using the standard pressure dropmethod (see Table 5). Later, the determined values were used to predict the inlet flow rate necessary tokeep the catalyst bed at bubbling fluidization conditions.
Table 5. Minimum fluidization velocity vs. temperature.
Temperature (˝C) 22 102 204 296 397
Umf (cm/s) 2.41 2.14 1.90 1.63 1.49
Before integration of the catalyst batch inside the reactor a small batch of the catalyst/filler (1/3)mixture was used for a segregation test. After a 24 h test under bubbling fluidization conditions atroom temperature and atmospheric pressure no segregation was observed, ensuring a homogenouscatalyst distribution inside the fluidized bed during the experiments.
Five Pd-Ag alloy membranes (4–5 µm of selective layer thickness, 13%–15% Ag) were preparedonto ceramic supports provided by Rauschert Kloster Veilsdorf (alumina 100 nm pore size top layer,10/7 mm outer diameter/inner diameter). The membranes were sealed following a sealing techniquereported by Fernandez et al. [19]. After sealing, each membrane had an average net length of 10 cm.
Three sets of experiments were performed: (a) The catalyst batch was firstly integrated insidethe reactor to be operated in absence of the membrane module (conventional fluidized bed reactor);(b) The catalyst batch was removed from the reactor and the membrane module was integrated insidethe reactor. Membranes were first activated under pure H2 atmosphere ensuring stable performance ofthe membranes. Subsequently, the permeation properties of the membranes were checked and theinhibitory effect of CO and H2O on the H2 permeation flux was measured; (c) The catalyst batch wasre-integrated into the reactor in the presence of the membrane module to study the reactor performancewith internals (membranes were closed at the top so that the membranes acted as non-permeableinternals). Finally, the membrane module was opened at the permeate side and the performance of thefluidized bed membrane reactor was investigated for different operating conditions. After the tests,the morphology of the membranes was analyzed by SEM and compared with the fresh membranes.
Molecules 2016, 21, 376 16 of 18
4. Conclusions
A fluidized bed Pd-based membrane reactor unit with a capacity of 1 Nm3/h of ultra-pure H2
was designed, built and operated for over 900 h of work. Initially, the permeation properties of themembranes were measured in absence of catalytic particles, confirming a very high H2 permeanceand outstanding H2/N2 ideal perm-selectivities (up to 21,000 when integrating five membranes in themodule) in comparison with the best ever reported Pd based membranes in the literature. Independenteffects of external mass transfer limitations (concentration polarization), CO poisoning and H2Oinhibition on the performance of the membranes were investigated in the single-phase module over atemperature range of 350–450 ˝C and for different H2 concentrations in the feed. The obtained resultsrevealed that concentration polarization is the rate limiting factor for H2 molecules to reach the surfaceof the membranes and a better mixing inside the membrane reactor module is essential, which can beachieved with fluidization. In line with other findings in the open literature, the poisoning effect ofCO was decreased at higher temperatures while the inhibitory effect of H2O was negligible over theinvestigated temperature range.
Monitoring the performance of the membrane reactor for a reference case over 900 h of continuouswork under bubbling fluidization and high-temperature WGS conditions confirmed a very stableperformance of both the membranes and the catalyst. The membrane reactor performance was studiedat different operating conditions and compared with the performance of a conventional fluidized bedreactor and used to evaluate the optimal operating conditions. The fluidized bed reactor performancewith and without and the membranes as internals without permeation was practically the same,indicating that the presence of the membranes tubes did not improve the bubble-to-emulsion phasemass transfer, possibly related to the suboptimal positioning of the membrane module inside thereactor. Further studies are required to optimize the positioning of the membrane module.
In general, increasing the temperature to between 350 and 450 ˝C results in higher COconversions and improved H2 recovery factors, although at higher temperatures the performancecan be deteriorated due to the increasing importance of methanation (at least for the catalyst used inthis work). In addition, it is recommended to operate at higher pressures to enhance the permeationthrough the membranes thereby shifting the equilibrium more towards the products. Analysis ofthe H2 quality in the permeate stream has shown very low CO concentrations (in average <10 ppm),so that the produced hydrogen can be directly fed to a low temperature PEM fuel cell.
Acknowledgments:
Molecules 2016, 21, 376 16 of 17
In general, increasing the temperature to between 350 and 450 °C results in higher CO conversions and improved H2 recovery factors, although at higher temperatures the performance can be deteriorated due to the increasing importance of methanation (at least for the catalyst used in this work). In addition, it is recommended to operate at higher pressures to enhance the permeation through the membranes thereby shifting the equilibrium more towards the products. Analysis of the H2 quality in the permeate stream has shown very low CO concentrations (in average <10 ppm), so that the produced hydrogen can be directly fed to a low temperature PEM fuel cell.
Acknowledgments:
The research leading to these results has received funding from the European Union Seventh Framework Programme (FP7/2007-2013) under grant agreement no. NMP3-LA-2011-262840 (DEMCAMER project). The authors would like to thank Rauschert Kloster Veilsdorf for providing the ceramic tubular supports and Johnson Matthey for the catalyst. Finally, the authors would like to thank University of Basque Country (UPV-EHU) for Zabalduz
scholarship program and Pedro Luis Arias.
Author Contributions: AH., E.F., J.M., D.A.P.T., F.G. and M.S.A conceived and designed the experiments. E.F. and J.M. prepared the membranes. A.H. characterized the membranes and performed the membrane reactor tests. AH., E.F., J.M., D.A.P.T., F.G. and M.S.A analyzed the data. AH., E.F., J.M., D.A.P.T., F.G. and M.S.A coordinated and wrote the paper.
Conflicts of Interest: The authors declare no conflict of interest.
References
1. Patil, C.S.; van Sint Annaland, M.; Kuipers, J.A. M. Design of a Novel Autothermal Membrane-Assisted Fluidized-Bed Reactor for the Production of Ultrapure Hydrogen from Methane. Ind. Eng. Chem. Res. 2005, 44, 9502–9512.
2. Barbieri, G.; Brunetti, A.; Caravella, A.; Drioli, E. Pd-based membrane reactors for one-stage process of water gas shift. RSC Adv. 2011, 1, 651–661.
3. Moe, J.M. Design of Water-Gas-Shift Reactors. Chem. Eng. Prog. 1962, 58, 33–36. 4. Gallucci, F.; Fernandez, E.; Corengia, P.; van Sint Annaland, M. Recent advances on membranes and
membrane reactors for hydrogen production. Chem. Eng. Sci. 2013, 92, 40–66. 5. Tiemersma, T.P.; Patil, C.S.; Sint Annaland, M.V.; Kuipers, J.A. M. Modelling of packed bed membrane
reactors for autothermal production of ultrapure hydrogen. Chem. Eng. Sci. 2006, 61, 1602–1616. 6. Gallucci, F.; Sint Annaland, M.; Kuipers, J.A. M. Autothermal Reforming of Methane with Integrated CO2
Capture in a Novel Fluidized Bed Membrane Reactor. Part 2 Comparison of Reactor Configurations. Top. Catal. 2008, 51, 146–157.
7. Gallucci, F.; Van Sintannaland, M.; Kuipers, J.A. M. Theoretical comparison of packed bed and fluidized bed membrane reactors for methane reforming. Int. J. Hydrog. Energy 2010, 35, 7142–7150.
8. Helmi, A.; Gallucci, F.; van Sint Annaland, M. Resource scarcity in palladium membrane applications for carbon capture in integrated gasification combined cycle units. Int. J. Hydrog. Energy 2014, 39, 10498–10506.
9. Maurer, S.; Wagner, E.C.; Schildhauer, T.J.; van Ommen, J.R.; Biollaz, S.M. A.; Mudde, R.F. X-ray measurements of bubble hold-up in fluidized beds with and without vertical internals. Int. J. Multiph. Flow 2015, 74, 118–124.
10. Fernandez, E.; Medrano, J.A.; Melendez, J.; Parco, M.; Viviente, J.L.; van Sint Annaland, M.; Gallucci, F.; Pacheco Tanaka, D.A. Preparation and characterization of metallic supported thin Pd–Ag membranes for hydrogen separation. Chem. Eng. J. 2015, doi:10.1016/j.cej.2015.09.119.
11. Medrano, J.A.; Fernandez, E.; Melendez, J.; Parco, M.; Tanaka, D.A. P.; van Sint Annaland, M.; Gallucci, F. Pd-based metallic supported membranes: High-temperature stability and fluidized bed reactor testing. Int. J. Hydrogen Energy 2015, doi:10.1016/j.ijhydene.2015.10.094.
12. US Department of Energy, DOE Hydrogen and Fuel Cells Program—2011 Annual Progress Report. Available online: https://www.hydrogen.energy.gov/annual_progress11.html (accessed on 13 March 2016).
13. Peters, T.A.; Stange, M.; Bredesen, R. On the high pressure performance of thin supported Pd–23%Ag membranes—Evidence of ultrahigh hydrogen flux after air treatment. J. Membr. Sci. 2011, 378, 28–34.
The research leading to these results has received funding from the EuropeanUnion Seventh Framework Programme (FP7/2007-2013) under grant agreement no.NMP3-LA-2011-262840 (DEMCAMER project). The authors would like to thank RauschertKloster Veilsdorf for providing the ceramic tubular supports and Johnson Matthey for thecatalyst. Finally, the authors would like to thank University of Basque Country (UPV-EHU)for Zabalduz scholarship program and Pedro Luis Arias.
Author Contributions: AH., E.F., J.M., D.A.P.T., F.G. and M.S.A conceived and designed the experiments. E.F. andJ.M. prepared the membranes. A.H. characterized the membranes and performed the membrane reactor tests.AH., E.F., J.M., D.A.P.T., F.G. and M.S.A analyzed the data. AH., E.F., J.M., D.A.P.T., F.G. and M.S.A coordinatedand wrote the paper.
Conflicts of Interest: The authors declare no conflict of interest.
References
1. Patil, C.S.; van Sint Annaland, M.; Kuipers, J.A.M. Design of a Novel Autothermal Membrane-AssistedFluidized-Bed Reactor for the Production of Ultrapure Hydrogen from Methane. Ind. Eng. Chem. Res. 2005,44, 9502–9512. [CrossRef]
2. Barbieri, G.; Brunetti, A.; Caravella, A.; Drioli, E. Pd-based membrane reactors for one-stage process of watergas shift. RSC Adv. 2011, 1, 651–661. [CrossRef]
3. Moe, J.M. Design of Water-Gas-Shift Reactors. Chem. Eng. Prog. 1962, 58, 33–36.
Molecules 2016, 21, 376 17 of 18
4. Gallucci, F.; Fernandez, E.; Corengia, P.; van Sint Annaland, M. Recent advances on membranes andmembrane reactors for hydrogen production. Chem. Eng. Sci. 2013, 92, 40–66. [CrossRef]
5. Tiemersma, T.P.; Patil, C.S.; Sint Annaland, M.V.; Kuipers, J.A.M. Modelling of packed bed membranereactors for autothermal production of ultrapure hydrogen. Chem. Eng. Sci. 2006, 61, 1602–1616. [CrossRef]
6. Gallucci, F.; Sint Annaland, M.; Kuipers, J.A.M. Autothermal Reforming of Methane with Integrated CO2
Capture in a Novel Fluidized Bed Membrane Reactor. Part 2 Comparison of Reactor Configurations.Top. Catal. 2008, 51, 146–157. [CrossRef]
7. Gallucci, F.; Van Sintannaland, M.; Kuipers, J.A.M. Theoretical comparison of packed bed and fluidized bedmembrane reactors for methane reforming. Int. J. Hydrog. Energy 2010, 35, 7142–7150. [CrossRef]
8. Helmi, A.; Gallucci, F.; van Sint Annaland, M. Resource scarcity in palladium membrane applications forcarbon capture in integrated gasification combined cycle units. Int. J. Hydrog. Energy 2014, 39, 10498–10506.[CrossRef]
9. Maurer, S.; Wagner, E.C.; Schildhauer, T.J.; van Ommen, J.R.; Biollaz, S.M.A.; Mudde, R.F. X-raymeasurements of bubble hold-up in fluidized beds with and without vertical internals. Int. J. Multiph. Flow2015, 74, 118–124. [CrossRef]
10. Fernandez, E.; Medrano, J.A.; Melendez, J.; Parco, M.; Viviente, J.L.; van Sint Annaland, M.; Gallucci, F.;Pacheco Tanaka, D.A. Preparation and characterization of metallic supported thin Pd–Ag membranes forhydrogen separation. Chem. Eng. J. 2015. [CrossRef]
11. Medrano, J.A.; Fernandez, E.; Melendez, J.; Parco, M.; Tanaka, D.A.P.; van Sint Annaland, M.; Gallucci, F.Pd-based metallic supported membranes: High-temperature stability and fluidized bed reactor testing. Int. J.Hydrogen Energy 2015. [CrossRef]
12. US Department of Energy, DOE Hydrogen and Fuel Cells Program—2011 Annual Progress Report. Availableonline: https://www.hydrogen.energy.gov/annual_progress11.html (accessed on 13 March 2016).
13. Peters, T.A.; Stange, M.; Bredesen, R. On the high pressure performance of thin supported Pd–23%Agmembranes—Evidence of ultrahigh hydrogen flux after air treatment. J. Membr. Sci. 2011, 378, 28–34.[CrossRef]
14. Melendez, J.; Fernandez, E.; Helmi Siasi Farimani, A.; Gallucci, F.; Arias, P.L.; Pacheko Tanaka, D.A.Preparation and characterization of ultra-thin (<1 micron) Pd-Ag membranes on porous alumina support(100 nm pore size). In Proceedings of the 12th International Conference on Catalysis in MembraneReactors (ICCMR12), Szczecin, Poland, 22–25 June 2015; Technische Universiteit Eindhoven: Eindhoven,The Netherlands, 2015.
15. Vicinanza, N.; Svenum, I.-H.; Næss, L.N.; Peters, T.A.; Bredesen, R.; Borg, A.; Venvik, H.J. Thicknessdependent effects of solubility and surface phenomena on the hydrogen transport properties of sputteredPd77%Ag23% thin film membranes. J. Membr. Sci. 2015, 476, 602–608. [CrossRef]
16. Pacheco Tanaka, D.A.; Okazaki, J.; Llosa Tanco, M.A.; Suzuki, T.M. 5-Fabrication of supported palladiumalloy membranes using electroless plating techniques A2—Doukelis, Aggelos. In Palladium MembraneTechnology for Hydrogen Production, Carbon Capture and Other Applications; Panopoulos, K., Koumanakos, A.,Kakaras, E., Eds.; Woodhead Publishing: Amsterdam, The Netherlands, 2014; pp. 83–99.
17. Shi, L.; Goldbach, A.; Xu, H. High-flux H2 separation membranes from (Pd/Au)n nanolayers. Int. J.Hydrog. Energy 2011, 36, 2281–2284. [CrossRef]
18. Damle, A.; Acquaviva, J. Membrane Reactor for Hydrogen Production. In Proceedings of the AIChE 2008Annual Meeting, Philadelphia, PA, USA, 16–21 November 2008.
19. Fernandez, E.; Helmi, A.; Coenen, K.; Melendez, J.; Viviente, J.L.; Pacheco Tanaka, D.A.;van Sint Annaland, M.; Gallucci, F. Development of thin Pd–Ag supported membranes for fluidized bedmembrane reactors including WGS related gases. Int. J. Hydrog. Energy 2015, 40, 3506–3519. [CrossRef]
20. Media and Process Technology Inc. Hydrogen Selective Ceramic Membranes For High TemperatureApplications. Available online: http://www.mediaandprocess.com/products/products02.html (accessed on14 March 2016).
21. 2Goldbach, A.; Bao, F.; Qi, C.; Bao, C.; Zhao, L.; Hao, C.; Jiang, C.; Xu, H. Evaluation of Pd compositemembrane for pre-combustion CO2 capture. Int. J. Greenh. Gas Control 2015, 33, 69–76. [CrossRef]
22. Veenstra, P.; Iyer, M.; Nijmeijer, A.; Geuzebroek, F.; Moene, R.; Saukaitis, J. Integrated Approach to CO2
Capture: Fuel Gas Decarbonisation. Energy Procedia 2014, 63, 2054–2059. [CrossRef]
Molecules 2016, 21, 376 18 of 18
23. Li, A.; Boyd, T.; Gulamhusein, A.; Mahecha-Botero, A.; Grace, J.; Lim, J.; Xu, N. Towards IndustrialApplications: Membrane and Fluidized Bed Reactor Research at MRT and NORAM. In Proceedings of ECNWorkshop on Pd-Membrane Technology Scale-Up, Petten, The Netherlands, 20–21 November 2014.
24. ECN, Hydrogen Seperation Modules. Available online: http://www.hysep.com/fileadmin/hysep/user/documents/B-09–010_hysep_A4_wb.pdf (accessed on 14 March 2016).
25. Dittmar, B.; Behrens, A.; Schödel, N.; Rüttinger, M.; Franco, T.; Straczewski, G.; Dittmeyer, R. Methane steamreforming operation and thermal stability of new porous metal supported tubular palladium compositemembranes. Int. J. Hydrog. Energy 2013, 38, 8759–8771. [CrossRef]
26. Ma, Y.; Diemant, T.; Bansmann, J.; Behm, R.J. The interaction of CO with PdAg/Pd(111) surface alloys-A casestudy of ensemble effects on a bimetallic surface. Phys. Chem. Chem. Phys. 2011, 13, 10741–10754. [CrossRef][PubMed]
27. Gallucci, F.; Chiaravalloti, F.; Tosti, S.; Drioli, E.; Basile, A. The effect of mixture gas on hydrogen permeationthrough a palladium membrane: Experimental study and theoretical approach. Int. J. Hydrog. Energy 2007,32, 1837–1845. [CrossRef]
28. Dang, N.T.Y.; Gallucci, F.; van Sint Annaland, M. Micro-structured fluidized bed membrane reactors: Solidscirculation and densified zones distribution. Chem. Eng. J. 2014, 239, 42–52. [CrossRef]
Sample Availability: Not available.
© 2016 by the authors; licensee MDPI, Basel, Switzerland. This article is an open accessarticle distributed under the terms and conditions of the Creative Commons by Attribution(CC-BY) license (http://creativecommons.org/licenses/by/4.0/).