fluid electrification measurements of oil currents to conductors or segmented conductors surrounding...
TRANSCRIPT

8 70
REVIEW
IEEE Transactions on Electrical Insulation Vol. 26 No. 5, October 1991
Fluid Electrification Measurements of Transformer Pressboard/ Oil
Insulation in a Couette Charger
A. J. Morin II, M.. Zahn, and J. R. Melcher
Massachusetts Institute of Technology Department of Electrical Engineering and Computer
Science Laboratory for Electromagnetic and Electronic
Systems Cambridge, MA
ABSTRACT A Couette Charger (CC) facility has been built to simulate flow electrification processes in transformers, where transformer oil fills the annulus between coaxial cylindrical electrodes that can be bare metal or transformer pressboard covered. The inner cylinder can rotate at speeds giving controlled turbulent flow which brings electric charge to the volume from the electrical double layer at the liquid/solid interfaces. This compact ap- paratus allows for flexibility in testing various oils and trans- former pressboards at controlled temperatures and moisture levels in the oil and pressboard. Flow electrification charge density measurements as a function of inner cylinder speed were performed using an absolute charge sensor (ACS). Tran- sient measurements with a step change in temperature have shown the charge density to change from an initial value to a new steady state value, including cases of polarity reversal, both values dependent on the equilibrium moisture levels in oil and pressboard. Through a model that accounts for diffusion of charge from the paper-oil interface into the bulk of the oil, these measurements are used to deduce the equilibrium wall charge density, a parameter which has been found to describe the electrification at all Reynolds numbers. By applying low frequency (0.5 to 4 Hz) high voltages (field strength up to 1.8 kV/cm peak) across the cylinders of the CC the effects of trans- former energization are also simulated. To help understand the effects of energization and to scale laboratory measurements at low voltages and low frequencies to operating transformers, a charge injection model was refined to examine the migration of double layer and injected charge in the imposed sinusoidally time varying electric field. Good fits between this model and measurements are achieved with a three parameter estimation of equilibrium charge density at the solid/liquid interface, in- jected charge density due to energization, and diffusivity in the diffusive sublayer near the wall.

IEEE Transactions on Electrical Insulation Vol. 26 No. 5 , October 1991 8 71
1. INTRODUCTION
1.1 BACKGROUND
LECTRIFICATION has been a past problem in the flow E of petroleum liquids in pipes, through filters, and in charge accumulation in storage tanks [l-111. With changes in the chemical make-up of insulating liquids used to transfer heat and withstand high electric stress, the use of new dielectric materials such as polymers and cellulosic materials, and an increase in the flow speeds for greater cooling, the electrification problem has recently arisen in electric power apparatus [12-241. Charge separation a t interfaces between moving fluid and boundaries with the accumulation of charge on insulators or isolated conduc- tors can lead to high field strengths and electrical dis- charges. The potential builds up until the rate of charge accumulation equals the rate of charge leakage, or until spark discharges occur. Electrification effects are initiat- ed by fluid flow, whether or not the equipment is ener- gized. Energization usually augments charge separation and exacerbates electrical discharge problems through the insulation. An understanding of electrification requires coupling the laws of electromagnetism, fluid mechanics, heat, and electro-chemistry to describe the four stages of electrification:
1. charge generation, 2. charge transport, 3. charge accumulation, and 4. charge leakage
and to determine how these relate to the observed factors of temperature, moisture, flow rate and tur-
bulence, contaminants and surface active agents, wall sur- face condition, energization, and flow configuration. What makes understanding difficult is that there is a lack of common denominators in failures. Identical side-by-side transformers have different failure experiences. Trace dif- ferences in material properties that are not easily iden- tifiable or controlled, apparently have a strong effect on flow electrification.
1.2 ELECT RI F I CAT IO N MEASUREMENT METHODS
There is no standard test procedure for evaluating the charging of flowing dielectric liquids, so that each labo- ratory has developed their own approach. However, it is important to be aware of artificial effects where flow electrification by the measurement apparatus itself con- tributes to the measurements. Typical measurement ap- proaches include:
1. Ministatic Tester. This is adapted from electrifica- tion measurements in jet fuels to characterize the charge separation process in transformer oils by measuiing the electrostatic charging tendency in forcing oil through stan- dard filter paper, a high grade cellulose material chemi- cally similar to transformer paper [25-281. The oil electri- cal charging tendency (ECT) is measured by the current from ground necessary to compensate double layer charge entrained in the fluid flow through the filter, or equiva- lently, measurement of the convection current to the fluid receiver grounded through a low impedance electrometer. The measured current equals the charge density in the oil entering the receiver multiplied by the volume rate of flow through the filter. This apparatus is fast and simple for comparing the relative charging tendencies of different oil samples against a particular material filter. Howev- er, it does not seem suited to providing parameters that characterize actual oil-liquid interfaces, especially under operating conditions with energization and/or with tran- sients in temperature, moisture and concentration of oth- er trace materials. The single pass of liquid through the filter does not allow adequate time for the oil and paper to reach moisture or chemical equilibrium.
2. Conducting Probes. A conducting probe placed into the flow results in an open-circuit voltage or short- circuit current but does not provide an unambiguous val- ue of charge density [29] as one may never be certain to the extent to which the probe response is due to im- pacting charge from the flow, or from charge removed from the probe by the flow by the same charge separa- tion process that is being studied. This objection can also be applied to a charge density probe composed of three equally spaced circular plates [20]. The outer elec- trodes were grounded and the potential of the floating center electrode was measured by a high-impedance elec- trometer. Fluid flowing through the probe, even if enter- ing uncharged, will separate some charge from the elec- trode surfaces, raising the measured potential. There is no way to separate the effects of entering charge due to upstream flow electrification from charge separation with- in the probe.
3. Isolated Test Pipe Sections. Measurement of the current t o an isolated metallic test pipe section gives the difference between the current leaving to that entering [30-321. Generally, a pipe section simultaneously acts as a relaxation region for entering charge and as a charging region for charge separated within the pipe section. To simulate the transformer duct region, insulating press- board pipe models have also been used [28]. Measured variables include the streaming current exiting the pipe, leakage currents to conductors or segmented conductors surrounding the pressboard pipe, and the surface poten- tial distribution along the pressboard pipe.

8 72 Morin et al.: Fluid Electrification Measurements of Transformer Insulation
4. Tandem Charge Monitor. Without moving parts, two identical shielded chambers have a dielectric fluid passing through in laminar flow [33]. Each chamber is virtually grounded through electrometers which measure the current to each chamber, from which the charge den- sity in the fluid is computed.
Our work measures the charge density in a fluid dielec- tric by taking a sample of charged fluid into a Faraday cage to measure the induced image charge via the current from ground required for a short-circuited Faraday cage, or equivalently, measurement of the potential rise of the Faraday cage if it is open circuited. In test pipe mea- surements, the four electrification stages of charge gen- eration, transport, accumulation, and leakage, spatially overlap, making it difficult t o sort out cause and effect. For basic studies, it is desirable to have a flow that is fully developed in both mechanical and electrical senses, which for insulating fluids requires an inconveniently long pipe length.
Our earlier work [34-361 used the Couette Charger (CC) of coaxial cylinders shown in Figure 1 without the abso- lute charge sensor, but with a small continuous fluid flow to allow charge measurement in the receiver section. The flow path within the CC is closed on itself, so that all parameters must be independent of the azimuthal angle. What appears as a spatial transient in a developing pipe flow appears here as a temporal transient.
Pressure in the fluid reservoir forces the oil through a relaxation chamber (charge trap) so that charge enter- ing the CC is negligibly small. The fluid is charged by the rotation of the inner cylinder and by injection due to applied HV. The charged fluid exits the CC through a shielded metal pipe electrically connected to the receiv- er tank but insulated from the outer cylinder of the CC by a short length of insulating tube. As charged fluid flows out of the CC into the metal pipe, the convection current is measured by the electrometer connecting the receiver to ground. The electrometer current is the prod- uct of the oil charge density and sampling volume rate of flow. With the inner cylinder rotating, the CC isolates the charge generation stage and is a convenient and con- trollable source of net charge, just as a current source is in an electrical circuit.
The charge density of the fluid is controlled by the rota- tional speed of the inner cylinder or by the magnitude and frequency of the applied voltage. In our earlier reported work [34-361 charged fluid is delivered at a slow sam- pling flow rate, independent of the shaft speed as shown in Figure 1. The output current is then measured by summing the currents from the ensuing metal pipe and
the receiver. The pipe and metal receiver act as a Fara- day cage so that once the charge exits the CC and enters the conducting pipe, it is immediately recorded by the electrometer, whether or not it remains entrained in the fluid or is conducted to the wall by relaxation or mixing. The recorded current also is not affected by charge gen- eration by the flowing fluid within the Faraday cage, as additional charge entrained in the flow is balanced by the image charge remaining on the wall, so that there is no net change in total charge within the Faraday cage.
Central to sorting out electrification processes in the laboratory or in the field, is having an instrument for measuring the net charge density entrained in a liquid. Using the same sampling principles as the CC, the Ab- solute Charge Sensor also shown in Figure 1 can sample the flow with no net accumulation of fluid independent of the fluid's electrical properties, velocity, and any elec- trification process within the instrument [37-431. The ACS periodically transfers a small volume of charged flu- id through a shielded sampling probe into an electrically isolated Faraday cage composed of a metal bellows vol- ume driven by a digitally controlled stepper motor. If the fluid is t o be returned to the system at a downstream location or t o a charge relaxation region, a check valve is used so that the exiting fluid is not in the proximity of the sampling probe. The charge density is calculated from the known filling flow rate and measurement of either the short-circuit current or open-circuit voltage by low or high-impedance electrometers respectively connected to the electrically isolated Faraday cage. For the fluid entering the Faraday cage, streaming currents from flow electrification on the inner surfaces of the probe, check valve, and bellows are not reflected in the measurement as there is no net change in total charge within the ACS.
The system shown in Figure 1 was used simultaneous- ly to measure electrification currents generated by rota- tion of the inner cylinder by the continuous flow sam- pling method and with the ACS. On the average, m e a surements agreed within 1.7% so that the continuous flow measurement approach was no longer used. This allowed the measurement apparatus to be reduced to just the CC and ACS as shown in Figure 2.
1.3 SCOPE OF THIS WORK
The objective here is t o measure the fundamental pa- rameters of the flow electrification process that together with the laws of electroquasistatics and physico-chemical hydrodynamics can be used to predict the performance of complex transformer systems. The CC is used because the flow is mechanically and electrically fully developed

IEEE Transactions on Electrical Insulation Vol. 26 No. 5, October 1991 8 73
Figure 1. Couette charging apparatus with the ACS and continuous sampling flow system connected for simul- taneous measurements. The outlet metal tube, connected to the CC through an insulating coupling, is electrically connected to the metal fluid receiver to act as a Faraday cage.
Figure 2. Couette Charger (CC) with electrical terminals connecting inner and outer cylinders for measur- ing voltage or current [40] or for applying an ac voltage between the cylinders. The Absolute Charge Sensor (ACS) [38,43] is used to measure the charge density in the turbulent core.
and has been well studied by hydrodynamicists. All hy- drodynamic parameters are set by the rotational velocity of the inner cylinder. Small inventories of oil are used and the wall materials are easily changed. Temperature, ap- plied electrical stress, moisture, and antistatic additives are all easily controllable so that both equilibrium and nonequilibrium conditions can be studied.
The CC annular gap models the cooling ducts in the interwinding regions of a transformer or the coolant tubes of power semiconductor components used in HVDC valves [30-321. It also models pumps, plenums, and secondary flows due to spacer blocks, protuberances, and bends.
This paper first reviews the critical time scales and characteristic lengths of electrical and mechanical pro- cesses in the CC focusing on turbulent fluid mechan- ics. Using the simplist electrochemical model where the charge density in the electrical double layer pw at the sol- id/liquid interface wall is fixed, independent of flow ve- locity, relationships between the measurable variables of charge density po in the turbulent core the terminal volt- age and terminal current are derived from charge conser- vation relationships and fitted to measurements in the CC with bare metal and paper-covered cylinders by param- eter estimating pw for a best fit between the theory and measurements. Measured variables are the charge densi- ty in the turbulent core using the ACS, the short-circuit terminal current, and the open-circuit terminal voltage.
Because of the minimum radius allowed for standard treated pressboard, a larger CC facility was also built with improvements for in situ oil impregnation and vacu- um drying of the oil/pressboard system to control mois- ture levels in oil and paper and for control of the oper- ating temperature during measurements. The turbulent core charge density for various transformer oils with bare metal or various pressboard covered cylinders were me* sured with the ACS during transient step increases and

8 74 Morin et al.: Fluid Electrification Measurements of nansformer Insulation
coefficient I Schmidt number Inner cylinder I RI
I S = Y I D ,
decreases in temperature for various initial moisture lev- els in oil and paper. Certain material combinations and operating conditions would result in charge polarity re- versal.
7.2 x lob 2.54 cm 17.62 cm
Charge density measurements using the ACS were al- so performed with ac HV applied across the cylinder for various amplitudes and frequencies. The earlier charge injection model used by Lyon et al. [34-361 is extended here to also include 'equilibrium' electrical double layer charge that migrates in the electric field across a migra- tion based sub-layer to be entrained in the fully mixed turbulent core. The addition of this charge to the charg- ing current of the turbulent core removes the inconsis- tency of the earlier Lyon et al. analysis which predicted a threshold electric field amplitude before voltage depen- dent turbulent core charging would occur which was not observed in measurements. With this refined model good fits between turbulent core charge density analysis and data collected for various voltages and frequencies over a wide speed range were obtained by estimating the equilib- rium wall charge density pw, the injected charge density due to energisation p i n j , and the diffusivity in the diffu- sive sub-layer near the wall.
radius
2. THE COUETTE CHARGERS
I 1
HE range of speeds a t which the inner cylinder can T rotate (< 2000 rpm) in the CC provides the ability to study flows varying from the laminar to fully turbu- lent regimes, and the symmetry of the experiment en- forces uniformity in the circumferential direction, crest- ing a flow that is fully developed in both mechanical and electrical senses.
Height of 1 Couette Charger
2.1 MATERIALS USED IN T H E COUETTE CHARGER
22.9 cm 40.64 cm
An important attribute of the Couette system is the relative ease with which it allows for a meaningful ex- amination of different materials: the small inventory of oil can easily be replaced or altered, and the small sur- face area exposed in the mixer means that different solid materials can be quickly wrapped on the cylinders. The solid insulations tested are representative of those used in transformers and consist primarily of sheets of pressboard and layers of kraft paper.
Two different Couette Chargers were built for our ex- periments, a small and a large one. The small one of alu- minum cylinders was used in experiments [34-361 to ex- amine thin layers of Kraft paper. A larger CC of stainless
steel cylinders was required to examine commercial press- board which for standard fabrication procedures could not be rolled less than 6 inches in diameter to fit over the inner cylinder.
Physical and electric constants of room temperature oil and the dimensions in the two CC units are listed in Table 1 for reference.
Table 1. Representative room temperature physical and electrical oil parameter values and Couette Charger dimensions.
Symbol I Small 1 Large 1 I Parameter I Oil permittivity 2.2 E O
Oil conductivity 10- to 10- S m Ion mobility b = 2 x 10- / q 10- m / Vs Dynamic viscosity 0.02 Ns/m
1.8 x lo-. m /s Mass density Pm 900 k /m Molecular diffusion D , = b k T / q 2.5 x 10- m /s
Pressboards used were EHV-Weidmann T-IV and HIVAL, 0.1 cm thick. They were supplied in a rolled form with the seam left unjoined but prepared for a scarf joint ( a gradual tapering on both sides of the seam so that there is no ridge when joined). The pressboard was mounted to the CC cylinders with epoxy and the seam was glued with Imperial Vetak, an oil-compatible white glue supplied by EHV-Weidmann.
The pressboards installed in the CC were generally dried at 9O'C for 16 h under a vacuum to remove the moisture that had naturally been absorbed following the drying process used for commercial transformers. Dry oil was then added to the CC while still under vacuum to oil-impregnate the pressboard.
2.2 CRITICAL PARAMETERS
2.2.1 CHARACTERISTIC TIMES
Certain time constants associated with electrification phenomena help explain the transients evident in mea- surements. These are described below and listed in Ta- ble 2 including typical values in the CC units:
IEEE Transactions on Electrical Insulation Vol. 26 No. 5 , October lQQl
Typical Values i n Typical Values i n T i m e Formula Small Couet te S y s t e m Large Couct te S y s t e m
Self- precipitation TP = ?- p = 3 - 150 pC/mS
Time Relaxation Time re = - U = 10-l' - 10-l' s /m
6500 - 130 s for
Pb
200 - 0.2 s with E
U
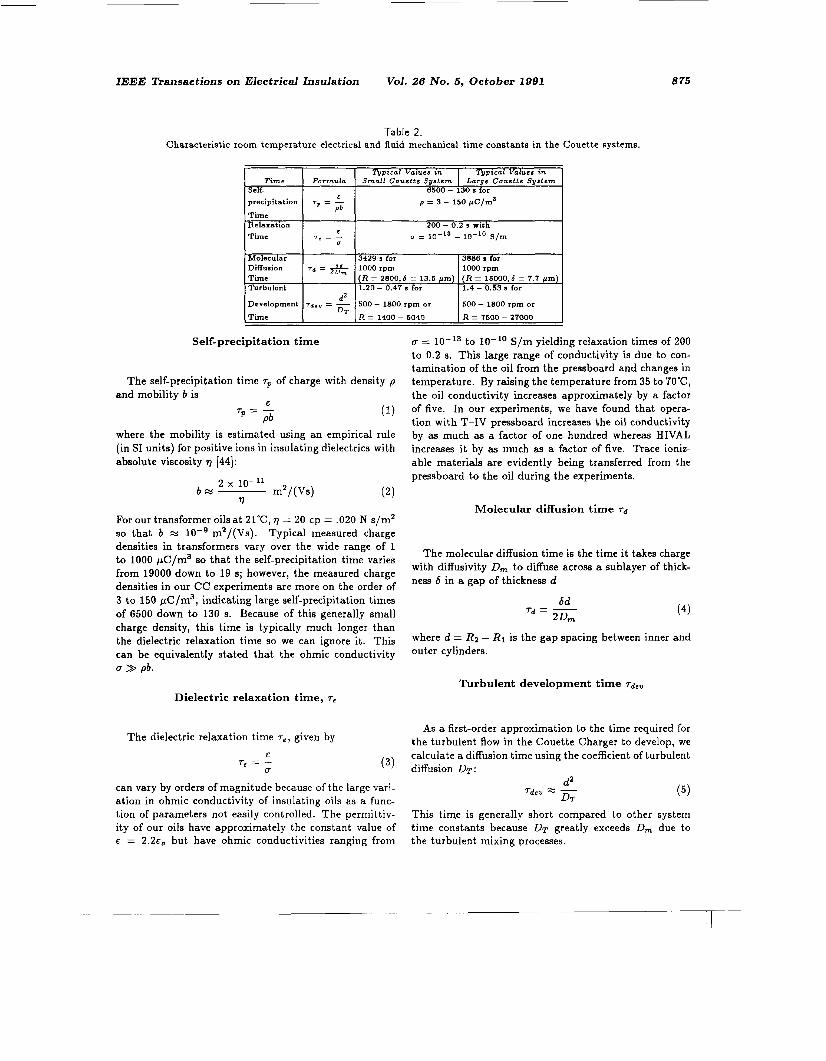
Table 2. Characteristic room temperature electrical and fluid mechanical time constants in the Couette systems.
'Molecular Diffusion Time Turbulent
3429 s for 3886 s for 1000 rpm 7 2 = 1000 rpm
(R = 2s00,6 = 13.5 p m ) (R = 15000,6 = 7.7 p m l 1.20 - 0.47 s for 1.4 - 0.53 s for
8 75
Development
Time
7d.v = d2 500 - 1800 rpm or 500 - 1800 rpm or DT
R = 1400 - 5040 R = 7500 - woo0
Self-precipitation time
The self-precipitation time rp of charge with density p and mobility b is
E (1) rp = -
pb where the mobility is estimated using an empirical rule (in SI units) for positive ions in insulating dielectrics with absolute viscosity 77 [44]:
2 x 10-11 b x - m2/(Vs)
77
For our transformer oils a t 21'C, 77 = 20 cp = .020 N s / m 2 so that b x lo-' m2/(Vs). Typical measured charge densities in transformers vary over the wide range of 1 to 1000 pC/m3 so that the self-precipitation time varies from 19000 down to 19 s; however, the measured charge densities in our CC experiments are more on the order of 3 to 150 pC/m3, indicating large self-precipitation times of 6500 down to 130 s. Because of this generally small charge density, this time is typically much longer than the dielectric relaxation time so we can ignore it. This can be equivalently stated that the ohmic conductivity U >> pb.
U = to lo-'' S/m yielding relaxation times of 200 to 0 . 2 s . This large range of conductivity is due to con- tamination of the oil from the pressboard and changes in temperature. By raising the temperature from 35 to 70'C, the oil conductivity increases approximately by a factor of five. In our experiments, we have found that opera- tion with T-IV pressboard increases the oil conductivity by as much as a factor of one hundred whereas HIVAL increases it by as much as a factor of five. Trace ioniz- able materials are evidently being transferred from the pressboard to the oil during the experiments.
Molecular diffusion time T d
The molecular diffusion time is the time it takes charge with diffusivity 0, t o diffuse across a sublayer of thick- ness 6 in a gap of thickness d
(4)
where d = Ra - R1 is the gap spacing between inner and outer cylinders.
Turbulent development time Tdev
Dielectr ic relaxation time, re
The dielectric relaxation time re, given by E
U 7, = - (3)
can vary by orders of magnitude because of the large vari- ation in ohmic conductivity of insulating oils as a func- tion of parameters not easily controlled. The permittiv- ity of our oils have approximately the constant value of E = 2.2.5, but have ohmic conductivities ranging from
As a first-order approximation to the time required for the turbulent flow in the Couette Charger to develop, we calculate a diffusion time using the coefficient of turbulent diffusion DT:
(5)
This time is generally short compared to other system time constants because DT greatly exceeds D, due to the turbulent mixing processes.
876 Morin et al.: Fluid Electrification Measurements of nansformer Insulation
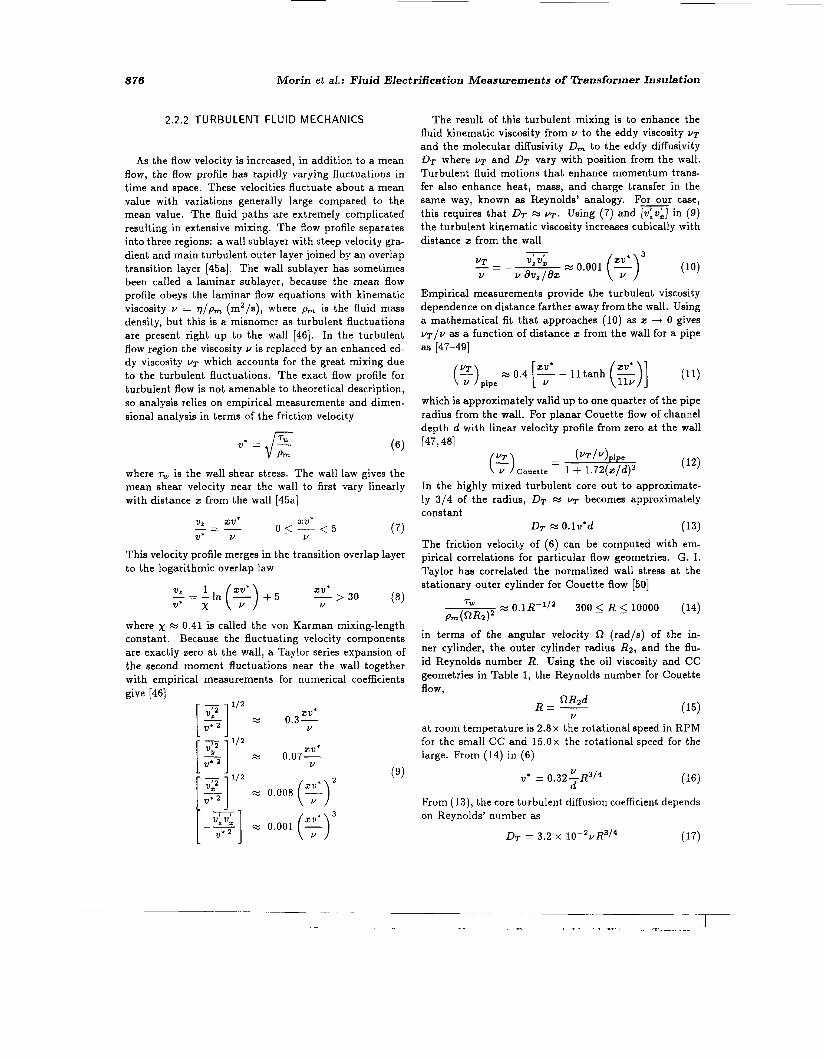
2.2.2 TURBULENT FLUID MECHANICS
As the flow velocity is increased, in addition to a mean flow, the flow profile has rapidly varying fluctuations in time and space. These velocities fluctuate about a mean value with variations generally large compared to the mean value. The fluid paths are extremely complicated resulting in extensive mixing. The flow profile separates into three regions: a wall sublayer with steep velocity gra- dient and main turbulent outer layer joined by an overlap transition layer [45a]. The wall sublayer has sometimes been called a laminar sublayer, because the mean flow profile obeys the laminar flow equations with kinematic viscosity v = r]/p,,, (m2/s), where pm is the fluid mass density, but this is a misnomer as turbulent fluctuations are present right up to the wall [46]. In the turbulent flow region the viscosity v is replaced by an enhanced ed- dy viscosity UT which accounts for the great mixing due to the turbulent fluctuations. The exact flow profile for turbulent flow is not amenable to theoretical description, so analysis relies on empirical measurements and dimen- sional analysis in terms of the friction velocity
(6) = J" Pm where rw is the wall shear stress. The wall law gives the mean shear velocity near the wall to first vary linearly with distance x from the wall [45a]
U, xu* xu* _ - - - 0 5 - < 5 U* v v ('7)
This velocity profile merges in the transition overlap layer to the logarithmic overlap law
where x x 0.41 is called the von Karman mixing-length constant. Because the fluctuating velocity components are exactly zero at the wall, a Taylor series expansion of the second moment fluctuations near the wall together with empirical measurements for numerical coefficients give [46]
L
r -
v * ' J - 1-51 M 0.001 (33
The result of this turbulent mixing is t o enhance the fluid kinematic viscosity from U to the eddy viscosity UT and the molecular diffusivity Dm t o the eddy diffusivity DT where UT and DT vary with position from the wall. Turbulent fluid motions that enhance momentum trans- fer also enhance heat, mass, and charge transfer in the same way, known as Reynolds' analogy. For our case, this requires that DT x VT. Using (7) and [v:v:] in (9) the turbulent kinematic viscosity increases cubically with distance x from the wall
Empirical measurements provide the turbulent viscosity dependence on distance farther away from the wall. Using a mathematical fit that approaches (10) as t -+ 0 gives V T / V as a function of distance x from the wall for a pipe as [47-491
l l t a n h (E)] (11)
which is approximately valid up to one quarter of the pipe radius from the wall. For planar Couette flow of channel depth d with linear velocity profile from zero at the wall
(F)couettc - 1 + 1 . 7 2 ( ~ / d ) ~ In the highly mixed turbulent core out t o approximate- ly 3/4 of the radius, DT x UT becomes approximately constant
[47,481
(12) UT - ( vT l U ) p i p e
DT x O.lv*d (13) The friction velocity of (6) can be computed with em- pirical correlations for particular flow geometries. G. I. Taylor has correlated the normalized wall stress a t the stationary outer cylinder for Couette flow [50]
x 0.1R-1/2 300 5 R 5 10000 (14) TW
pm(RR2)' in terms of the angular velocity R (rad/s) of the in- ner cylinder, the outer cylinder radius Ra, and the flu- id Reynolds number R. Using the oil viscosity and CC geometries in Table 1, the Reynolds number for Couette flow ,
U (15) R Rzd R = -
at room temperature is 2 . 8 ~ the rotational speed in RPM for the small CC and 1 5 . 0 ~ the rotational speed for the large. From (14) in (6)
From (13) , the core turbulent diffusion coefficient depends on Reynolds' number as

IEEE !l'ransactions on Electrical Insulation Vol. 26 No. 5, October 1991 8 77
Thus for our oil viscosity of II = 1.8 x lo-' m2/s (pm = 900 kg/m3) and a t a rotational speed of 1000 rpm, the Reynolds number in the small CC is 2800 which gives a turbulent diffusion coefficient of DT = 2.2 x mz/s and a turbulent development time of Tde, = 0.73 s. In the large CC with a rotational speed of 1000 rpm, the Reynolds number is 15, 000 which gives DT = 7.8 x
m2/s and Tdev = 0.83 s. Thus within the second that the inner cylinder has reached a steady speed of 1000 rpm, the core for either CC is fully mixed and turbulent.
2.2.3 CHARACTERISTIC LENGTH SCALES
Because of the spatial dependence of turbulent fluid flow, there are several important electrical and hydrody- namic length scales. These lengths are summarized in Table 3, which includes typical values of each parameter in our CC systems.
Debye length, A
The stagnant Debye length results from a balance of the ion diffusion time, Az/Dm, with the relaxation time,
The molecular diffusion coefficient D, is related to charge mobility by the Einstein relation:
so that at room temperature our mobility b x (Vs) yields 0, x 2.5 x ity range of ranges approximately from 70 to 2.2 pm.
m2/ m2/s. For our conductiv-
to 10-'oS/m, the Debye length then
Turbulent Debye length, AT
If the double layer extends past the diffusion sublayer into the turbulent core, the mixing uniformly disperses the charge over a thickness given by the turbulent Debye length described by the turbulent diffusion coefficient DT .
Using (17) the conductivity range of to 10-l' S/m yields a turbulent Debye length from approximately 210 mm to 6.6 mm for a rotational speed of 1000 rpm in the small CC. In the large CC with a rotational speed of 1000
rpm, the turbulent Debye length ranges approximately from 390 to 12 mm. For most of our measurements AT > d so that the core is fully mixed.
Viscous sublayer thickness, 6,
As the simplest approximation for electrification phe- nomena, we divide the turbulent flow profile into two re- gions, a wall viscous sublayer with mean flow described by laminar flow equations, and a turbulent core. The thick- ness of the viscous sublayer is that distance from the wall c = 6, where y ~ / u x 1. The exact numerical coefficient is picked to best fit measurements so that [45a,51]
5u 6, = -
U*
which becomes 6, = 15.6dR-3/4 (22)
which is 515 pm for the small CC and 292 p m for the large CC a t 1000 rpm.
Diffusion sublayer thickness, 6 d
The thickness of the diffusion sublayer is similarly de- fined as that distance where DT/D, x UT/D,,, x l, again choosing the numerical coefficient from best fits to empirical measurements [49,52]
which is 13.6 pm for the small CC and 7.7 p m for the large CC at 1000 rpm.
These thicknesses differ by factors of the Schmidt num- ber S which generally greatly exceeds unity. Thus for usual dielectric liquids the Schmidt number is large so that bd < 6,. Within the viscous sublayer, the kinemat- ic viscosity is taken to be U while outside the sublayer the kinematic viscosity is UT = DT given by ( l l ) , (12) or (13). Within the diffusive sublayer the diffusivity is given by the molecular diffusion coefficient D, , while outside the sublayer the diffusivity is given by DT = UT.
Migration length, dmig
The maximum distance that charge can migrate in an ac electric field with amplitude E, and frequency w is
This length is important for energization charging where the electric field drives the electrical double layer charge into the strongly mixed turbulent core.

8 78
Typical Values in Length Fo r m u 1 a Small Couet te System
Morin et al.: Fluid Electrification Measurements of fiansformer Insulation
Typical Values in Large Couet te System
Table 3. Characteristic room temperature electrical and fluid mechanical lengths in the Couette systems.
Length
Migration Sublayer
6m;g = 2bE,/w E , = 0.5 x 10' V/m and w/2a = 1 Ha
63pm for 27 pm for E, = 0.5 x 10' V/m 6 b = 63dR-9/8[bE.,d/v]'/2 IE. = 0.5 X 10' v / m
V " D, = 2.5 x 10-l' m2/s
Turbulent
Debye . " Length Viscous I I S 6 6 - 331 pm for I492 - 188 pm for
(d = 12.7 mm) I (d = 25.4 mm) Thickness Diffusion I I22 - 9 um for I13 - 5 Wm for
Sub-Layer I 6.4 = 11'7u I500 - 1'800 RPM 1 500 - 1.800 RPM S'I3 ,c
Thickness I = 36.5dR-5/4/S'/3 I I Migration I I 159 pm for
Thickness I I and 1000 rpm I and 1000 rpm
Migration sub-layer thickness, 68
Charge within the electrical double layer will migrate in an electric field of amplitude Eo with a velocity bEo. The charge migration sublayer thickness is defined as that distance from the wall when the peak migration velocity just equals the fluid fluctuation rms velocity component perpendicular to the wall ( v ; ~ ) ' / ~ given in (9)
= 2.53 x 10-46;vR9/4/d3
Migrating charge which crosses this sublayer becomes en- trained into the turbulent core flow.
2.3 COUETTE FLUID MECHANICS
2.3.1 FLOW REGIMES
The flow distributions in the CC with the inner cylin- der rotating have three regimes: laminar, cellular con- vection, and turbulent. The rotational speeds for each of these regimes for both the small and large CC are ap- proximately calculated from the Taylor number [45b, pp. 423-4261 Ta for a small gap:
Rld3n2 U2
Ta = -
Laminar flow
Applies t o low rotational speeds such that Ta < 1708, (Small CC, R < with no radial velocity component.
31 rpm; Large CC, R < 6 rpm).
Cellular convection
As the speed passes through a (relatively low) critical value, the flow experiences a type of instability not found in pipe flows: the smooth laminar flow breaks up into three-dimensional convection cells. This occurs for Taylor numbers 1708 < T, < 160000. (Small CC, 31 rpm< S2 <301 rpm; Large CC, 6 rpm< Cl <62 rpm).
Turbulence
As the rotational speed increases past the critical value, the cells begin to break up and eventually give way to fully developed turbulent flow. This occurs for Taylor numbers Ta > 160000. (Small CC, R > 301 rpm; Large CC, R > 62 rpm).
2.3.2 TURBULENT FLOW
With steady rotational speed, the torques on the inner and outer cylinders of length 1 are equal and related to
IEEE Tkansactions on Electrical Insulation Vol. 26 No. 5, October 1991 8 79
the wall shear stresses rwl and r w 2 a t the oil/cylinder interfaces and respective radii R1 and Rz by
Torque = rw12?rR:I = 7,227rR~l (27)
With a fully developed turbulent flow, the diffusion sub- layer thicknesses 6 1 , ~ [49,52] at these interfaces are re- lated to the wall shear stresses 7,,,1,2, mass density p,,,, molecular diffusion coefficient D,,, , and kinematic viscos- ity U by
Since from (27) the wall shear stresses are in inverse pro- portion to the square of the radii, (28) shows that the diffusion sub-layer thicknesses are in direct proportion to the cylinder radii, 61/62 = Rl/R2. The Taylor correla- tion (14) [50] relates the wall shear stress a t the stationary outer cylinder t o the inner cylinder rotational velocity R by
2.4 CHARGE CONSERVATION
A wall volume charge density pw is used to describe the governing electrokinetics in the CC at the oil/cylinder interface. I t can be inferred from ACS measurements of the core charge density po.
Conservation of charge
/ I . t i d a = --/pdV d dt
S V i = i d + c 7 E = - D v p + f f E
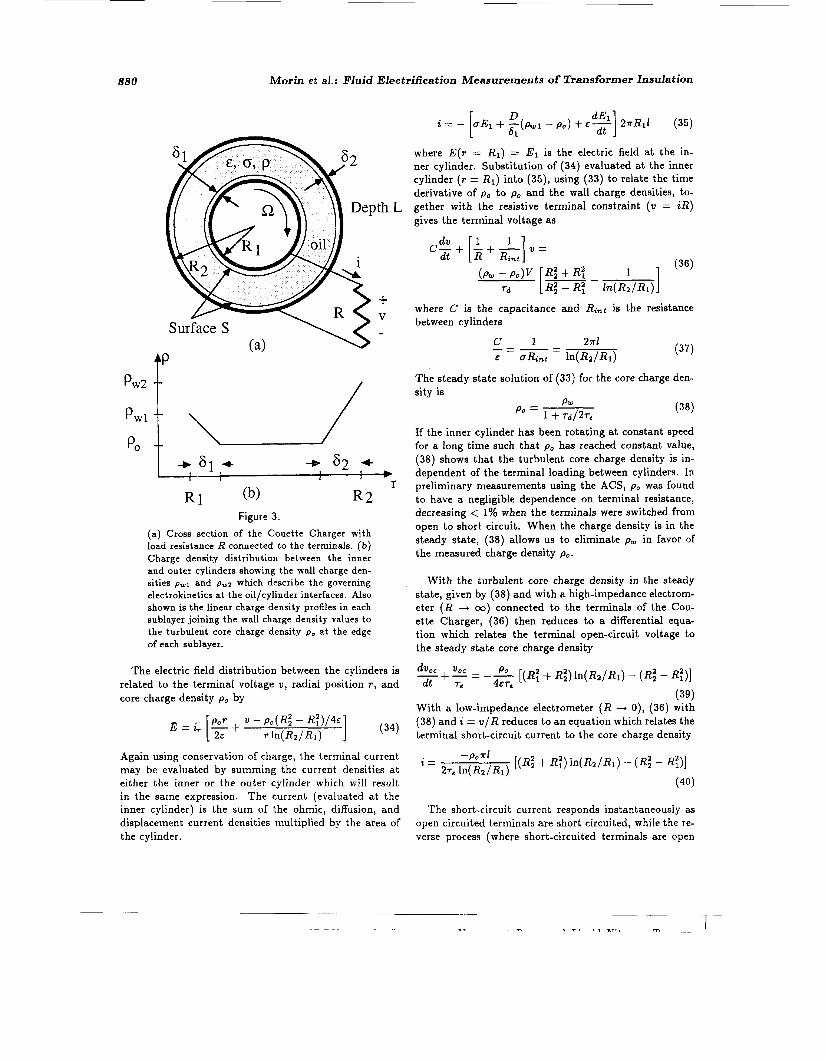
with current density due to diffusion and ohmic conduc- tion is applied to a closed surface S as shown in Figure 3a which contains the volume V = x(Ri - R:)l of oil be- tween the cylinders. Because 61 and 6 2 are typically much smaller than RI , the volume of the fully mixed turbulent core where the charge density is assumed to be uniform is approximately the same. A linear profile as shown in Fig- ure 3b of the charge density over the sub-layer thickness is assumed so that (30) yields
field through the closed surface to equal the total volume charge.
In the large CC with radii R1 = 7.62cm and R2 = 10.16cm, length 1 = 40.64cm, oil conductivity 0 x S/m, permittivity E = 2.2 eo, mass density p,,, = 900 kg/m3, kinematic viscosity Y = 1.8 x 10-'m2/s, and molecular diffusion coefficient D,,, = 2.5 x 10⁻¹¹m2/s, the Debye length X = (~D,,,/c7)~/' is 22pm and the diffusion sub- layer thickness decreases from 43 to 5 p m as the speed is increased from 100 to 1800rpm. The assumption of a linear profile over the sub-layer is somewhat approximate because the Debye length is less than the sub-layer thick- ness over the low speed ranges. But for speeds > 247 rpm, where the Debye and sublayer lengths are equal, this ap- proximation will give results close to those of more com- plete analysis. The charge density in the turbulent core is essentially uniform due to the great mixing because the turbulent Debye length AT = ( E D T / C ) ~ / ~ with turbulent diffusion coefficient DT = 3.2 x 10⁻²uR3f4 ranges from 5.2 to 15.3cm which is greater than the gap thickness between the cylinders of 2.54 cm.
Reducing (31), the governing equation for the core charge density is related to the wall charge densities pw1,2, dif- fusion times rd1,2, and dielectric relaxation time re by
(33)
E
0 re = -
where The diffusion times at the inner and outer cylinders are equal because the sublayer thicknesses 61,2, are in direct proportion to the radii R ~ J . In our experiments the inner and outer cylinder walls were covered with the same materials so in continuing analysis we will take the wall charge densities a t inner and outer cylinders to be equal, pwl = pWz pW.
2.5 TERMINAL VOLTAGE AND CURRENT
dP vD = Znl(JdlR1 + JdzRz) - V ~ , U / E dt (31) The core charge density po and coaxial cylindrical ge- ometry also gives rise to a short-circuit current or open- circuit voltage in the external circuit connecting inner and outer cylinders [40].
Jd1,2 = (Pw1,Z - Po)D/61,2
where The last term on the right of (31) comes from Gauss' law which requires that the flux of displacement
880 Morin et al.: Fluid Electrification Measurements of Transformer Insulation
- po) + E%] d t 27rR11 (35)
where E ( r = R1) = E1 is the electric field at the in- ner cylinder. Substitution of (34) evaluated a t the inner cylinder ( r = R1) into (35), using (33) to relate the time derivative of po to pa and the wall charge densities, to- gether with the resistive terminal constraint (U = ZR) gives the terminal voltage as
dv 1 1 dt c- + 1, + 7 1 v =
(I- ,, - . ", I
Td ~ 1RT-R; h ( R z / & ) ]
where C is the capacitance and Rint is the resistance between cylinders
(37) 2Tl - c 1
E URint ln(&/Ri)
The steady state solution of (33) for the core charge den- sity is
- - - --
tP
R1 I
R 2 Figure 3.
(a) Cross section of the Couette Charger with load resistance R connected to the terminals. (b) Charge density distribution between the inner and outer cylinders showing the wall charge den- sities p W l and p w 2 which describe the governing electrokinetics at the oil/cylinder interfaces. Also shown is the linear charge density profiles in each sublayer joining the wall charge density values to the turbulent core charge density po at the edge of each sublayer.
The electric field distribution between the cylinders is related to the terminal voltage U , radial position T , and core charge density pa by
Again using conservation of charge, the terminal current may be evaluated by summing the current densities at either the inner or the outer cylinder which will result in the same expression. The current (evaluated at the inner cylinder) is the sum of the ohmic, diffusion, and displacement current densities multiplied by the area of the cylinder.
If the inner cylinder has been rotating a t constant speed for a long time such that po has reached constant value, (38) shows that the turbulent core charge density is in- dependent of the terminal loading between cylinders. In preliminary measurements using the ACS, pa was found to have a negligible dependence on terminal resistance, decreasing < 1% when the terminals were switched from open to short circuit. When the charge density is in the steady state, (38) allows us to eliminate pw in favor of the measured charge density po.
With the turbulent core charge density in the steady state, given by (38) and with a high-impedance electrom- eter (R -+ w) connected to the terminals of the Cou- ette Charger, (36) then reduces to a differential equa- tion which relates the terminal open-circuit voltage to the steady state core charge density
-E [(R: + Ri)ln(Ra/R1) - ( R i - R:)] +-- With a low-impedance electrometer ( R -+ 0), (36) with (38) and i = v/R reduces to an equation which relates the terminal short-circuit current to the core charge density
d v a c 210, - dt re 4ETe -
(39)
[(R: + R:)ln(Rz/Ri) - ( R i - R:)] -POT1
2 ~ , ln(RzlR1) 2 =
(40)
The short-circuit current responds instantaneously as open circuited terminals are short circuited, while the re- verse process (where short-circuited terminals are open

IEEE Zkansactions on Electrical Insulation Vol. 26 No. 5 , October lQQl 881
circuited) has a time constant of re for the voltage to reach steady state. The ratio of steady state open-circuit voltage to short-circuit current is just Rint. For the po- larity convention chosen, as shown in Figures 2 and 3, a positive core charge density will have an open-circuit voltage and short-circuit current that are negative.
Although there is no mean flow in the direction of the generated radial electric field, there are fluctuating veloci- ty components in the radial direction so that the terminal current delivers a small amount of power to a resistive load connected between the cylinders. These measure- ments and analysis illustrate how turbulent diffusion can do work and hence be the mechanism for mechanical t o electrical energy conversion.
3. UNENERGIZED CHARGING MEASUREMENTS
EASUREMENTS of the core charge density po and ter- M minal current or voltage have been taken in both CC for a variety of oils and materials covering the cylin- ders. Some of the data was taken with a step change in temperature to examine the effects of moisture dynamics between oil and pressboard. All data were taken with the ACS probe at half the height of the CC to minimize end effects from the CC top and bottom. To examine the spatial uniformity of the core charge density, initial ACS measurements were made with bare aluminum cylinders in the small CC with the probe t ip moved radially from the outer wall t o gap center. Measurements showed that the charge density spatial distribution was essentially uni- form for inner cylinder rotational speeds above 400 rpm. For all subsequent measurements in either CC the probe was placed flush with the inner surface of the outer cylin- der when bare metal cylinders were tested. With press- board covered cylinders, the probe was placed flush with the inner surface of the pressboard on the outer cylinder. This position minimizes the probe effect on the flow and reduces the electric field at the probe t ip when ac voltages are applied.
3.1 DIELECTRIC RELAXATION MEASUREMENTS
The dielectric relaxation times re t o be reported were the measured time constants of the open-circuit voltage decay when a 22 V battery was disconnected from the terminals of the CC without rotation as shown in Fig- ure 4. For a representative measurement of new Shell oil, the conductivity for a measured dielectric relaxation time of re = 38 s is U = 0.51 pS/m.
This measurement with Shell oil was initially checked by the following additional methods: [39,42]
.l. Measurement of resistance between cylinders using an electrometer in resistance measurement mode and then calculating the ohmic conductivity. For the test sam- ple in the small CC, this measurement gave = 0.75
2. Measurement of dc resistance R and capacitance C of an open parallel plate capacitor submerged into the oil and calculating the relaxation time from
pS/m.
re = RC (41)
For the initial test sample this method gave an oil con- ductivity of U = 0.88 pS/m.
3. Measurement of the open-circuit relaxation time when the submerged parallel plate capacitor is initially charg- ed and then open circuited. For the test sample the oil conductivity by this method was & = 0.59 pS/m.
4. Impedance measurement of magnitude and angle a t 0.1 Ha across the plates of the submerged capacitor. This measurement gave U = 0.97 pS/m and & / E , = 2.2.
As often occurs for such highly insulating liquids, dif- ferent measurement methods give slightly different con- ductivity values. We chose the open-circuit voltage de- cay time constant method as illustrated in Figure 4 &
our standard method for measurement of the dielectric relaxation time. The open-circuit voltage decay method was also used for pressboard-covered cylinders because the thin oil-impregnated pressboard had series resistance much less than the thicker oil gap.
3.2 MEASUREMENTS IN THE SMALL CC WITH BTA
Japanese researchers report a reduction in charging tendency with the use of 10 ppm BTA (1, 2, 3-Benzotria- zole) in transformer oil [28], but this antistatic effect has not been observed by U. S. researchers [25-271. Ieda et al. [53] report that the addition of 50 ppm BTA reduced the charge density of - 3.2 to - 0.3 pC/m3. In our prelim- inary studies on the effects of BTA on the charging ten- dency in the small CC with Manning-220 paper-covered cylinders, we found that core charge densities decreased only by about 30% with the addition of 50 ppm BTA [39,42]. However, the Japanese investigators believe that the beneficial effect of BTA on reducing the electrification hazard is due to suppression of the oxidative degradation of copper and long-term (many months to years) selec- tive adsorption of BTA to paper. In our experiments there was no copper, just the aluminum cylinders of the small CC, and the BTA was in the oil/paper system for

882 Morin et al.: Fluid Electrification Measurements of Transformer Insulation
O . * ! 1
I O t
-0.1 I/ ii' I
15 _A 9 -"*LO-- 5 10
Time (=.)
Figure 4. Representative dielectric relaxation time mea- surement (Entry 8 in Table 6). A 22 V source was disconnected from the CC terminals and the open-circuit voltage decay was recorded. This was done twice and then the source was reversed in polarity and the measurement repeated. The time constant was estimated for each response and then an average was taken.
only 31 days. Future work will place a copper sleeve be- tween the stainless steel cylinders of the large CC and pressboard covering. Transformer oil with BTA additive will contact the copper/pressboard cylinder coverings for long enough time to see if BTA has a beneficial effect in reducing electrification processes.
3.2.1 TEMPORAL TRANSIENT M EASU REM ENTS
Gulf Transcrest H oil with 50 ppm BTA in contact with Manning-220 paper was used for terminal measurement experiments. With the terminals of the small Couette Charger (shown in Figure 2) connected to a low imped- ance electrometer, the short-circuit current was measured as shown in Figure 5. A negative current was measured which increased in magnitude with increasing speed. Fig- ure 6 . shows the transient response of the negative ter- minal voltage when switched from an initial short-circuit condition to an open circuit a t t = 0. For each value of rotational speed, the speed was held constant for a t least 5 min before the terminals were opened so that the core charge density was a t its steady state value. For each speed, the voltage magnitude increased exponential- ly with a measured time constant of 43 s. From (39), this time constant should be the dielectric relaxation time of
the oil which was estimated by two different methods to be 7, M 30 s. One of the methods was a dc resistance measurement, using a Keithley 616 electrometer, across an open parallel plate capacitor submerged in the oil. The other measured the time constant of the open-circuit volt- age decay when a 22 V battery was disconnected from the terminals of the CC without rotation as in Figure 4. Both methods gave approximately the same value of conduc- tivity which was CT M 6 x 10-13S/m. Using E = 2 . 2 ~ ~ ~ this gives a dielectric relaxation time of 7, M 30 s, some- what lower than the measured 43 s charging time constant in Figure 6 . Also shown in Figure 6 is the unexplained much faster open-circuit voltage decay after rotation of the inner cylinder was stopped. Since the turbulent de- velopment time is short, the turbulent flow in the gap be- tween the cylinders will quickly settle when the rotation is stopped. With essentially no flow in the CC, 61,2 become large so that the diffusion times become so large that all diffusion time terms in (33) become negligibly small. The charge density then decreases as po = poo exp(-t/r,) af- ter the rotation is stopped where poo is the initial charge density value equal t o the steady state charge density of (38) when the cylinder is rotating. With the right hand side of (36) negligibly small, the open-circuit volt- age ( R --+ CO) then should decay from its initial value to zero with dielectric relaxation time constant re. Possible reasons for the disagreement in measured time constants for charging and decay from the model are discussed in Section 3.2.3,
3.2.2 STEADY STATE MEASUREMENTS
Using the ACS, the steady state turbulent core charge density po was also measured as a function of inner cylin- der rotational speed as shown in Figure 7. Simultaneously measured were the short-circuit current or open-circuit voltage across the terminals of the charger. Using (39) and (40) in the steady state, the fully mixed turbulent core charge density was calculated from the measured steady state open-circuit voltage and short-circuit current which are also shown in Figure 7. Fitting the wall charge density to pw x 740 pC/m3 so that (38) (with re = 30 9.) agreed with the ACS measured charge density value a t 1800 rpm, (38) was plotted as a function of rotational speed to have excellent correlation with the other charge density values measured by the ACS a t lower speeds.
The measured short-circuit current gave core charge densities about 3 to 4 x greater than those measured from the ACS. The correlation from the measured open-circuit voltage was slightly better.

IEEE Transactions on Electrical Insulation Vol. 26 No. 5 , October 1991
- 20
- 10
- 60
- 40
- 20
0
rotation tumed on
2000 rpm
1500 rpm + lo00 rpm e
I I I I
0 1 2 3 4 5
Figure 5.
883
\ rotation
tumed off
I time
6
Measured (negative) short-circuit current as a function of time in the small CC with the rotational speed changed from 0 to 2000 rpm in steps of 500 rpm.
. . 0
time d
2 4 6
Figure 6.
Measured (negative) open-circuit voltage tran- sient response from an initial short circuit for dif- ferent rotational speeds in the small CC. A dielec- tric relaxation time of 43 s would give good agree- ment between the measurements and the theoret- ical exponentially rising charging transient.
3.2.3 POSSIBLE REASONS FOR DlSAG RE EM E N T BETWEEN T E R M IN AL
MEASUREMENTS A N D ANALYSIS
The motivation for the terminal voltage and current measurements was to examine the self-consistency of the
50
8 40
m
v
0
30 2.
.U 20
.- B F .eo 10 2 3
0
calculated from current
e calculated from voltage El
m measured with ACS 1
1
0 I300 2000
rotational speed (rpm)
Figure 7. Core charge density in the small CC measured directly with the ACS and by calculation from measured terminal short-circuit current or open- circuit voltage. Also shown is the solid curve which is the theoretical core charge density as a function of rotational speed. The wall charge density was set to pur x 740 pC/m3 so that (38) (with 7. z 30 s) gave a theoretical p4 the same as that measured by the ACS at 1800 rpm [40,42].
analytical model. However, the terminal voltage and cur- rent are.much more dependent on the details of the ge- ometry and hydrodynamics than is the turbulent core

884 Morin et al.: Fluid Electrification Measurements of Tkansformer Insulation
charge density, as the terminal variables are non-zero on- ly because of the asymmetry of the diffusion sub-layer thicknesses a t inner and outer cylinders. If the flow were truly between parallel plate electrodes, the steady state terminal voltage and current would be zero as seen by the right-hand side of (39) and (40) approaching zero as Rz -+ RI. Thus, even though po may be finite between parallel plate electrodes, the terminal voltage and current would be zero. The details of the asymmetry in bound- ary layer thicknesses given by (28) and (29) may not be accurate because of surface roughness or secondary flow end effects in the CC. Such inaccuracies have little effect on the turbulent core charge density but have large ef- fects on the terminal voltage and current. This sensitivity to the asymmetry between diffusive sub-layer thicknesses may be the cause of the disagreement in turbulent core charge densities in Figure 7 between ACS measurements and computations from measured short-circuit currents and open-circuit voltages. This sensitivity may also be the cause of the difference in time constants in Figure 6 for charging and decay of the open-circuit voltage, both values being different from the expected dielectric relax- ation time. Our simplified electrokinetic model has al- so taken pw to be a constant independent of rotational speed and independent of interfacial electric field. It may be that the wall charge density actually depends on field and flow parameters.
3.3 T E M P E R A T U R E TRANStENT M E A S U R E M E N T S IN T H E LARGE CC
3.3.1 EX P E R I M EN TAL PRO C ED U R ES
Unenergized measurements of the turbulent core charge density po have been made for a variety of oils and ma- terials covering short-circuited cylinders in the large CC using the computer controlled facility shown in Figure 8. The CC Facility allows easy changes of oil and press- board covering of inner and outer cylinders. Water cool- ing through heat exchanging copper tubing wound around the outer cylinder and heating tape also wound around the outer cylinder allow the control of temperatures over the range of 15 t o 140'C. Using the various pumps, ports and reservoir the oil and pressboard can be dried with vacuum and heat, and moisture can be added by bubbling moist gas through the system for many hours. Dielectric properties of oil and paper permittivity and conductivi- ty and moisture in oil and paper (MOPS) are measured using microdielectrometry sensors [54] at the inlet and outlet of the CC. Oil charge density in the turbulent core imposed by rotating the inner cylinder is measured with the ACS. The rotation speed of the inner cylinder, tem- perature, applied voltage magnitude and frequency, and
ACS parameters are all under computer control so that a long series of measurements can proceed over many days time without operator attention.
Table 4 is a summary of the data taken in the CC with ACS measured values of po reported a t speeds of 500 or 1OOOrpm [39,41,42]. The wall charge density pw is found from (38). For the large CC at 1000 rpm, the diffusion sub-layer thickness at the outer cylinder wall is 62 M 7.6pm so that the diffusion time is T d M 6800s. At 500 rpm, 62 x 1 3 p m and T d x 11600s. For both these speeds, T,j >> re so that (38) yields pw/po M rd/2Tee For a typical measured core charge density of po M 30 pC/m3 at 1000 rpm with a dielectric relaxation time of re 10 s the wall charge density is pw M 0.02 C/m3.
The oil dielectric relaxation time was measured at 35°C using the open-circuit voltage decay method described in Section 3.1. Most of the measurements in Table 4 involve a step temperature change up or down from a steady state. The inner cylinder rotation was started - 1 h be- fore the temperature was changed. It then took about 30 to 60 min for the system to reach thermal equilibrium a t the new temperature. In each of these runs the system was first held at the starting temperature long enough so that steady state conditions were established before the temperature was changed. At equilibrium, there is no net transfer of moisture between the oil and pressboard which results in a constant oil and pressboard moisture content. By increasing the temperature, moisture diffuses out of the pressboard and into the oil until a new equilibrium is established. This increases the oil moisture but on- ly slightly decreases the amount in the pressboard which contains approximately 120x the volume of water than the oil contains. The steady state oil moisture was mea- sured before the temperature was changed and after the oil reached a new steady state at the new temperature, 5 to 60 h later, by taking oil samples to a Mitsubishi mois- ture meter using the Karl Fischer titration method. Oil moisture levels below 2 ppm are not very accurate because this is the level of precision of the instrument. For many measurements the pressboard moisture was measured at the end of a measurement set by taking a sample of press- board into an oven accessory attached to the moisture meter. The oil and pressboard moistures were not nec- essarily in equilibrium when tabulated in Table 4. The charge density during the temperature transient was con- tinually measured using the ACS. Starting and final Val- ues are listed in Table 4. Most measurements were taken at constant speeds of the inner cylinder of 1000 rpm but the first early measurements were taken a t 500 rpm. The comments column briefly describes oil and paper-drying treatment before measurements began. The normal dry- ing procedure is similar t o that used in commercial trans- formers. The large CC with only pressboard covering the

IEEE Dansactions on Electrical Insulation Vol. 26 No. 5 , October 1001 885
R +
m - ..a- I.?
l l
Figure 8. Couette Charger Facility allowing easy changes of oil and pressboard with cooling and heating ca- pability to control temperatures over the range of 15 to 1 4 0 C Using the various pumps, ports and reservoir the oil and pressboard can be dried with vacuum and heat or moisture can be added by bub- bling moist gas through the system. Conductivity, permittivity, and moisture (MOPS) are measured in oil and paper at the inlet and outlet of the CC. Moisture in oil and paper are also measured by taking samples to the moisture meter. Oil charge density is measured with the ACS.
cylinders is heated under vacuum a t 9O'C to remove nat- urally absorbed moisture. Then dried oil was added to the CC while still under vacuum to oil-impregnate the pressboard. Some measurements added moisture to the system by bubbling dry nitrogen through water and then bubbling the moist gas through the oil in the CC for many hours. This would increase the moisture in the oil and slowly increase the moisture in the pressboard.
Measurements for Entries 1-10 in Table 4 had an ex- ternal reservoir under vacuum connected to the CC. This reservoir was used to hold the oil when filling the CC and to dry the oil by pulling a vacuum. A pump continuously circulated the oil in a flow loop from the reservoir under vacuum to the CC and back. The oil entered the CC outer cylinder near the bottom and exited near the top. In order to measure the moisture in the oil, a slight flow
was required because the oil sampling port was connect- ed to the flow loop between the outlet of the CC and the reservoir. A low flow rate of 0.062 ml/s was used which had no effect on the measured charge density. This was because the fluid residence time in the CC was T~ x 18 h (volume 5.77 1) which was much longer than the di- electric relaxation time T, and diffusion times Td1,2. As long as T~ >> T,, a slight flow through the CC will not change the charge density generated. With 1 to 6 1 of oil in the reservoir, the reservoir residence time was 4.5 to 27 h. For pressboard covered cylinders in entries 1-5 of Table 4, the charge density and short-circuit termi- nal current had long time constants after a fast change in temperature, like that shown in Figure 9. The long time transients in these entries are believed to be due to this residence time of continuous vacuum drying in the reservoir so that the oil and pressboard in the CC take

886 Morin et al.: Fluid Electrification Measurements of Transformer Insulation
Table 4. Unenergised ACS measurements of the turbulent core charge density in the large CC which shows the starting and ending temperatures with corresponding starting and ending oil and paper moisture. The oil dielectric relaxation time T= was measured at 35'C. The wall charge density can be calculated from (38) as ptu /po = [l + T ~ / ~ T = C ] .
1
2
3
4
5
6
7
8
9
10
11
12
13
14
15
16
17
18
19
(Sec) ( P P 4 (percent) ( a c l m " ) 500 oil and paper Oct l3a 10 HIVAL 2.5 - 8 0.87 35 -70 8 -4 -13
Oct l4a
Oct26
Nov7a
Novl4a
Dec9a
Dec 12a
Decl6a
Qmaria
9mar24a
9aprlOb
9aprl2a
Dapr2Ob
9npr27b
DmayO8b
9jun30b
9ju113a
9aug14b
9augl8a
9.5
7.2
7.2
7.1
6.7
11.8
12.3
38
3.2
0.56
0.56
0.39
11.2
10
9.5
8.5
s.3
5.7
Exxon 60
HIVAL Exxon 60
nIVAL Exxon 60
HIVAL Exxon 60
WVAL Exvon 60
Bare SS E-won 60
Bare SS Esxon 60
Bare SS Exvon 60
Bare SS Shell DA
T-IV Shell DA
T-IV Shell DA
T-IV Shell DA
T-IV Shell DA
HIVAL Shell DA
HIVAL Shell DA
HIVAL Shell DA
IIIVAL Exxoii 60
Dare SS Albuquerque
Dare SS Albuquerque
8 - 3
46 --f 13
21 --+ 35
16 --+ 12.5
20
4
1
2.7 -* 4.1
4.2 - 2.1
2.3 -. 2.2
2.1 - 4.3
1.7 - 0.9
2.9 -.+ 2.3
2.5 - 1
4.7 - 2
4 + 5
23 -+ 31
36 - 29
0.87
1.66
1.66
1.66
-
-
-
-
0.5
0.5
0.5
0.5
0.3
0.3
0.54
?
-
-
70 - 40
40
40 - 70
70 --. 40
50 4 40
35 - 70
70 - 35
35 - 70
70 - 35
.35 -+ 15
15 - 70
70 - 35
TO - 35
35 - 70
70 - 35
35 + 70
35 + 70
70 - 35
-6 -5
5 4 29
95 -+ -31
-30 -+ 19
10 - 4.9
1 - 3.4
1 - 1.5
5.6 -.. 12.2
31 -+ 18
42 - 25
23 -+ 68
34 - (22 - 62)
4 - -2
-10 - -10
47 - 34
17 4 -10
a -, 32
22 - 4
500
500
1000
1000
1000
IO00
1000
1000
1000
1000
1000
1000
1000
1000
1000
1000
1000
1000
had been dried
no further drying from I
moist gas had been bubb. led through oil from 2
no further drying from 3
system failcd after 2.5 hours
oil not dried
oil had been dried
no further drying from 7
oil had becn dried
oil and paper had been dried
no further drying from 10
no further drying from 11
110 further dryiug froin 12,erralic charge derisities a1 35°C
oil a i d paper liad beeit dried
no further drying froni 14
rrioist gay liad been bubb- led through oil from 15
oil and paper had been dried
used oil not dried
a much longer time to reach moisture equilibrium. For entries 6-9 with bare stainless steel cylinders, the charge

IEEE "kansactions on Electrical Insulation Vol. 26 No. 5, October 1991 88 7
density changed directly with temperature changes. The reservoir was filled with approximately 1 1 of oil result- ing in a residence time of approximately 4.5 h. In or- der for all of the oil in the CC and reservoir to reach moisture equilibrium, oil must come in contact with the moisture laden pressboard in the CC. Oil entering the CC was drier than oil leaving, accounting for the long time constant to reach equilibrium. To study the mois- ture and charge transients in pressboard/oil systems more carefully, the continuous flow of oil through the reservoir under vacuum was stopped for data in Entries 11-19 of Table 4. The charge density and short-circuit terminal current transients with pressboard covered cylinders then directly followed temperature changes. In order to mea- sure the oil moisture, oil was directly sampled from the CC through the port where the continuous flow loop had been connected.
3.3.2 SUMMARY OF EXPERIMENTAL RESULTS
1. Exxon oil was dried and impregnated into dry HIVAL pressboard. The CC ran for 48 h at 500 rpm and 35°C to allow for moisture equilibrium between the oil and press- board. The temperature was then stepped up from 35 to 70'C increasing the oil moisture from 2.5 ppm to 8 ppm. The paper moisture was 0.87%. With the inner cylinder rotating a t 500 rpm the ACS measured the charge density a t 35'C to be 8 pC/m3. With the step increase in tem- perature to 70°C the charge density decreased smoothly through zero and reversed polarity reaching x -13 pC/m3 after 18 h.
2. With the system of #1 running for 6 more h, the charge density gradually decreased to -6 pC/m3 although the oil moisture remained unchanged at 8 ppm. The tem- perature was then step decreased to 40°C. The oil mois- ture content then decreased to 3 ppm. The charge density gradually increased passing through zero after about 10 h and reached a steady state value of 5 pC/m3 after about 40 h.
3. After the completion of #2 the oil was taken from the CC and placed into the reservoir. Nitrogen gas first bubbled through water a t 50°C was then bubbled through the oil in the reservoir raising the oil moisture level to 46 ppm. The oil was then returned to the CC and mea- surements began again with the inner cylinder rotating at 500 rpm with the system temperature maintained a t 40'C. The oil charge density was initially 5 pC/m3 but then rose quickly within 1 h to about 29 pC/m3 and re- mained steady about this value for the experiment run time of about 49 h. The oil moisture measured after 49 h
had decreased to 13 ppm while the pressboard moisture level had risen to 1.66%.
4. Experiments began nine days after the completion of #3 with the system temperature maintained a t 40'C. The moisture level in the oil was 21 ppm. With the inner cylinder now rotating a t 1000 rpm the ACS measured the charge density as 95 pC/m3. The temperature was then step increased to 70'C and the charge density decreased through zero after about 2.5 h reaching a steady state of -31 pC/m3 after about 6 h remaining constant thereafter to 19 h. The transient measurement of the charge density and short-circuit terminal current is shown in Figure 9. The data shows that the current and charge density are proportional and opposite in polarity which is consistent with the sign convention in (40) and in Figures 2 and 3.
5. The system was then maintained a t 70'C for sev- en days. The oil moisture decreased to 16 ppm but the charge density was about the same at -30 pC/m3. The temperature was step decreased to 40'C but after 2.5 h, the pressboard came off the outer cylinder and the exper- iment had to be stopped. At this time the charge density had reversed polarity to x 19 pC/m3 and the oil moisture content had decreased to about 12.5 ppm.
6. New Exxon oil from the drum without drying and with bare stainless steel cylinders had a constant moisture level of 20 ppm at 40 and 70'C. This constant moisture level is expected because there was no paper present to absorb or release moisture. The charge density a t 70°C was 10 pC/m3 and decreased to 4.9 pC/m3 at 40°C.
7. The system was then dried for three days decreasing the oil moisture level to 4 ppm and decreasing the charge density at 35'C to 1 pC/m3. The temperature was then step increased to 70'C. Within the first hour, the charge density increased to M 4.4 pC/m3 in direct proportion to the temperature but then with the temperature essential- ly constant a t 70'C the charge density decreased to about 3.4 pC/m3.
8. The system was maintained at 70'C for four days under vacuum which dried the oil to 1 ppm moisture with the charge density a t 4 pC/m3. The temperature was then step decreased to 35°C and the charge density dropped to x 0.7pC/m3 in synchronism with the tem- perature drop. With the temperature then essentially constant a t 35°C the oil charge density slightly increased to 1.5 pC/m3.
9. The oil was then changed to Shell and with bare stainless steel cylinders was dried to 2.7 ppm moisture. At 35°C the oil dielectric relaxation time was 38 s and with

888 Morin et al.: Fluid Electrification Measurements of Dansformer Insulation
inner cylinder rotation of 1000 rpm the oil charge density was 5.5 pC/m3. The temperature was then stepped up to 70'C. The oil moisture level slightly changed to 4.1 ppm and the charge density increased in synchronism with the temperature change to M 16 pC/m3 then decreasing to a steady state value of 12.2 pC/m3.
10. T-IV pressboard was then used with Shell oil and the system was dried with 0.5% moisture in the press- board and 4.2 ppm moisture in the oil a t 70°C. The oil dielectric relaxation time at 35'C dropped to 3.2 s indi- cating the presence of some ionizable material in the T-IV pressboard. This is contrary to EHV-Weidmann's experi- ence where oil conductivities were found to decrease by a factor of 1.6 when in contact with HIVAL or T-IV press- board as measured by applying h750 dc [42,55]. This suggests that some contamination of the system or press- board had occurred. The charge density a t 70°C was 31 pC/m3. Note that this positive charge polarity is oppo- site to that found with Exxon oil and HIVAL pressboard a t 70'C. The temperature was then decreased to 35°C. The charge density dropped in synchronism with the tem- perature decrease to M 8 pC/m3 gradually increasing to 18 pC/m3 after 12 h. The oil moisture decreased to 2.1 ppm. This was the last set of data that had a continuous flow between the CC and reservoir.
11. The experiment then sat for 16 days with no further drying with the dielectric relaxation time dropping fur- ther to 0.56 s. The oil moisture remained about constant at 2.3 ppm at 35'C but during the first hour of inner cylin- der rotation a t 1000 rpm the charge density was erratic with values between 20 and 59 pC/m3. The temperature was then step decreased to 15'C and the charge density smoothly decreased in synchronism with the temperature drop to M 25 pC/m3. The oil moisture level after 18 h was about the same at 2.2 ppm.
12. The system was maintained a t 15'C for two days with no further drying. The oil moisture remained about constant at 2.1 ppm. The oil charge density increased during the first hour of inner cylinder rotation at 1000 rpm from 10 to 23 pC/m3. With an increase in tempera- ture to 70'C in M 30 min, the charge density increased in synchronism with the temperature to M 79 pC/m3. With the temperature now constant a t 70°C the charge density varied for 18 h over the range of 55 to 80 pC/m3. The oil moisture increased to 4.3 ppm.
13. The system was maintained a t 70°C for the next eight days without further drying. The dielectric relax- ation time dropped to 0.39 s. The oil moisture dropped to 1.7 ppm and the charge density dropped to x 34 pC/m3. The temperature was then decreased to 35°C. The charge
density was erratic varying over the range of 20 to 78 pC/m3. The oil moisture dropped slightly to 0.9 ppm.
14. The system was changed to new Shell oil and HIVAL pressboard. The system was dried to 2.9 ppm moisture in the oil and 0.3% moisture in the pressboard. The dielectric relaxation time was 11.2 s and the oil charge density was 4 pC/m3 a t the start of inner cylinder rota- tion at 1000 rpm rising to % 10 pC/m3 after 1 h. The charge density decreased to M -2.5 pC/m3 in synchro- nism with the decrease in temperature to 35'C being somewhat erratic to 20 h time over the range of -1 to -5 pC/m3 as shown in Figure loa. The oil moisture level decreased to 2.3 ppm.
15. The system then sat for 8 days at 35'C when the inner cylinder was started rotating at 1000 rpm for 48 h. The oil moisture level was essentially unchanged a t 2.5 ppm and the charge density was M -10 pC/m3. The dielectric relaxation time was also essentially unchanged a t 10 s. With the inner cylinder rotating a t 1000 rpm the temperature was then increased to 70'C. The charge den- sity magnitude then decreased in synchronism with the temperature to M -2.5 pC/m3 as shown in Figure lob. Then with the temperature constant at 70'C the charge density smoothly decreased back to M -10 pC/m3 after 18 h. The oil was very dry and unlike all other tempera- ture rise experiments, the moisture content at 1 ppm was less at the higher temperature which may account for the strange charge density transient.
16. Moist gas was then bubbled through the oil to raise the oil moisture level to 4.7 ppm a t 70'C and the press- board moisture to 0.54%. The charge density increased to 40 pC/m3 at the start of inner cylinder rotation at 1000 rpm. The charge density slightly increased to 47 pC/m3 after 1 h of rotation when the temperature was decreased to 35'C as shown in Figure 1Oc. The charge density then decreased to e 34 pC/m3. Also shown in Figure 10c is the time dependence of the oil moisture level with the step decrease in temperature. The oil moisture tracked the oil temperature as did the charge density and short- circuit terminal current. Since a diffusion process governs the relations between oil and pressboard moisture, the oil moisture can not change instantaneously. The time for the oil moisture to reach a steady state value after this step change in temperature was calculated [56] to be M 1.3 h. In this experiment, the temperature step change took - 1 to 2 h which was not fast enough to see the transient governed by the diffusion of moisture in the oil and pressboard.
17. The system was changed to new Exxon oil and HIVAL pressboard with dielectric relaxation time at 35'C

IEEE Transactions on Electrical Insulation Vol. 26 No. 5, October 1891 889
of 8.5 s. The system was dried for 10 h rather than the usual 16 h to allow the oil moisture level to be 4 ppm at 35'C. The pressboard moisture level could not be mea- sured because of malfunction of the moisture meter. The charge density was erratic for the first hour of inner cylin- der rotation a t 1000 rpm varying from 1 to 18 pC/m3. The temperature was then step increased to 70'C and the charge density slowly decreased to zero after = 5 h reach- ing a steady value of -10pC/m3 after - 24 h. The oil moisture only slightly increased to 5 ppm. This measure- ment had test conditions similar to that of measurements #4-5 with similar results. Confidence was gained by this reproducibility for measurements taken eight months lat- er.
18. The system was then changed to used oil from an Albuquerque transformer using bare stainless steel cylin- ders without drying with dielectric relaxation time of 5.3 s. The initial oil moisture at 35'C was 23 ppm and the charge density a t 1000 rpm inner cylinder rotation rate was steady at x 8 pC/m3. The temperature was then step increased to 70'C and the charge density varied over the range of 32 to 37 pC/m3 as the oil moisture level increased to 31 ppm.
19. After sitting for four days a t 70'C the oil moisture was 36 ppm and the charge density varied over the range of 16 to 21 pC/m3 during the first hour of inner cylinder rotation a t 1000 rpm. The temperature was then step decreased to 35'C reducing the charge density to about 4 pC/m3 as the moisture dropped slightly to 29 ppm.
3.3.3 RELATIONSHIP OF CORE CHARGE
CURRENT DENSITY T O SHORT-CIRCUIT TERMINAL
The measurements in Figures 9 and 10 also show the short-circuit terminal current magnitudes in the large CC a t 1000 rpm to be - 3000 PA. Figure 5 shows the same measurement in the small CC to be - -28 pA a t 1000 rpm. Equation (40) gives the predicted relationship be- tween steady state short-circuit terminal current i , tur- bulent core charge density po, dielectric relaxation time re, and geometric dimensions of the CC. Separating out measured variables from the geometric factor G, (40) can be written in the form
-%.re ?rl [(Ri + R?)ln(Rz/Rl) - (Ri - R:)] - = G = P o 2 q RZ/Rl)
(42)
For all CC dimensions in centimeters, the geometric factor G is 275 for the large CC and 61.5 for the small CC. The measured charge density in Figure 7 a t 1000
IV I I I 1-4000 5 10 15 20
-100 I Time (hours)
Figure 9. Entry 4 of Table 4. Charge density and short-circuit terminal current responses to a step change in temperature from 40 to 70'C. Oil moisture started at a non-equilibrium value of 2lppm and ended at a value of 35ppm which was approaching equilibrium. Exxon Univolt 60 and HIVAL pressboard at 1.66 % moisture were used with a rotational speed of 1000rpm. With this oil/pressboard combination and at 70'C, charging becomes negative as the oil m-isture approaches equilibrium.
rpm is x 8 pC/m3. With a measured dielectric relaxation time of 30 s and a measured terminal current of -28 PA, ( - i r e / p , , ) = 105. This is of the same order of the pre- dicted value of 61.5. The deviation can be attributed to the measurement sensitivity discussed in Section 3.2.3.
Table 5 lists the measured steady state values of ( - - i ~ J p ~ ) a t two temperatures in the large CC which should be compared to the predicted value of G=275. Accounting for the measurement sensitivity discussed in Section 3.2.3, the measurements in Table 5 are in reasonable agreement with analysis.
3.3.4 OBSERVATIONS OF EL E CTR I F IC AT ION DE P E N DEN C E 0 N
TEMPERATURE, MOISTURE, AND D I E L E CT R IC R E LAX AT ION TI M E
1. A reversal in the polarity of the charge density was only observed when HIVAL pressboard was tested. T- IV covered and bare stainless steel cylinders always gave positive charge densities in the oil, that increased with temperature.

890
r # T Po 1 r e - i T e / P o
‘C pC/m3 pA s 2 70 -5 120 2 48
Morin et al.: Fluid Electrification Measurements of Transformer Insulation
19
Table 5. Measurement of turbulent core charge density and short-circuit terminal current in the large CC. The predicted value in the large CC is ( - - i ~ ~ / p ~ ) =G=275. The value of T. at 70°C was taken from Table 6 or if not measured at 70% was estimat- ed as 1/5 the measured value at 35OC as given in Table 4.
70 27 -4, 400 1.2 196 70 16 -2, 800 1.3 228 1 1351 4 I -500 15.71 713 I
2. From measurements with bare stainless steel cylin- ders so that the oil moisture level remained essentially constant even with changes in temperature (#6-8,9, 18- 19), the oil charge density was positive and increased with increasing temperature. At a given temperature, the oil charge density was higher when the oil moisture level was higher (compare #6, 18, and 19 to #7 and 8).
3. The oil charge densities were much higher and the oil dielectric relaxation times were much smaller with T-IV pressboard than with HIVAL pressboard and bare metal cylinders. This indicates the presence of ionizable im- purities from the T-IV pressboard that increases the oil conductivity and increases the wall charge density, per- haps by enhanced adsorption into the T-IV pressboard.
4. The oil charge density increased as the moisture level in the pressboard increased (see #3).
5. When the oil system was contained during the mea- surements (#ll-19), the charge density transient was generally in synchronism with the temperature transient except for #17 which was only dried for 10 h rather than the usual 16 h where it took about 8 h for the charge density to reach an essentially steady value.
6. The typical slight increase of the charge density and oil moisture during the first hour of the experiment is shown in Figure 10a,c in which the rotation of the inner cylinder was started a t time zero. During this period, the oil temperature was held at 70’C by cooling the outer cylinder of the large CC. The CC must be cooled while
the inner cylinder is rotating to remove the heat generated by the fluid shear stresses on the inner and outer cylin- ders. Since the inner cylinder was not directly cooled, the pressboard surface temperature on the inner cylinder was greater than the oil in the core as recorded by the temperature sensor in Figure 10. This would probably result in increased oil moisture due to diffusion of mois- ture out of the inner cylinder pressboard and into the oil. The core charge density could also be affected by this increased surface temperature.
4. ENERGIZATION CHARGING
E might picture the oil-impregnated pressboard to W not only have a layer of net charge on the fluid side of the interface, but t o also have interstices filled with ions. For net positive charge accumulation due to HV energization, positive ions are presumably more readily coerced into the adjacent oil by an electric field so that more positive than negative charge is injected during a cycle. In the case of bare metal electrodes, the charges may be due to ionization of materials adsorbed on the oxide surface. Tentatively, the parameter being measured is the ‘injection charge density’ P ; ~ , , to be estimated from measurements as the field amplitude and frequency are varied [39,41,42].
4.1 CHARGE INJECTION MODEL
As a limiting case, consider the boundary in Figure 11 which only injects positive charge with mobility b when the electric field points away from the boundary. When the sinusoidally varying electric field E, cos w t perpendic- ular to the wall is positive, positive charge is injected and migrates away from the wall. When the electric field re- verses polarity, the charge returns to the wall. Charges are injected from c = 0 a t different times to in the voltage cycle and thus penetrate different distances into the flow. In addition, the already present equilibrium double-layer charge not included in earlier analysis [34-361 will mi- grate in the imposed electric field somewhat analogously to an ac field modulated double layer model developed for laminar flow [57]. Some of this additional charge will be injected into the turbulent core for any applied voltage as seen in earlier measurements [34-361. This resolves the disagreement with past analysis that predicted a thresh- old field strength before energization charging would oc- cur as only charge injected from the boundary was con- sidered, neglecting charge injected from the ‘equilibrium’ double layer.

IEEE Transactions on Electrical Insulation Vol. 26 No. 5 , October 1991 801
-5' 5 10 IS 20
U!- I
I I I I ob 5 10 15 20
O i
I =
I I I I I 5 10 11 0 -15'
I 5 10 1s
I I
T i i (hours)
25 t Time (hours)
I I I I OO 5 10 15 20
Charge Plus, Current Cross
10 l$ oc 10 15 20
Time (hours)
>
I
2500
5000 - d v
4
,7500 5 U
L. 
.10000
.12500
4 h
't I I I 5
I 10 15 20
(c) Time (hours)
Figure 10. Large CC with HIVAL pressboard covered cylinders and Shell Diala A oil with 1000 rpm rotational speed comparing dried oil with a (a) step decrease and (b) step increase in temperature and (c) moist oil after moist gas had been bubbled through to raise oil moisture from 1 to 4.7 ppm at 70% and to raise pressboard moisture from 0.3 to 0.54%. (a) Entry 14 of Table 4 with 70 to 35OC step decrease in temperature. The oil moisture decreased from 2.9 to 2.3 ppm. The paper moisture was 0.3% and the dielectric relaxation time was 11.2 s. (b) Entry 15 of Table 4 with a 35 to 7OPC temperature step increase. The oil moisture decreased from 2.5 to 1 ppm and the dielectric relaxation time was 10 s (at 35°C); (c) Entry 16 of Table 4 with paper moisture raised to 0.54%. Oil temperature step decrease from 70 to 35T, core charge density and terminal current as a function of time, oil moisture transient which decreased from 4.7 to 2 ppm. The oil dielectricnrelaxation time was 9.5 s (at 35-C).
Neglecting self-field effects from the space charge and the small amount of turbulent diffusion near the wall, the

892 Morin et al. : Fluid Electrification Measurements of Transformer Insulation
Figure 11. ac charge injection trajectories starting at the oil/pressboard interface z = 0 at time to with density p;,,j and injection trajectories starting within the migration based sublayer of thickness 6 b at io at time t = - -s /2w with charge density p(z,).
charge velocity
(43) d x d t - = bE = bE, COS w t
yields by integration the charge trajectories
bEo x ( t ) = bE, cos w t d t = -(sin w t -sin w t , ) + c, (44) 1 W
t.Y
where to is the time the charge is injected from the c, = 0 boundary and x , # 0 is the initial position of the equilib- rium charge in the double layer a t time to = - ~ / 2 w . Be- cause the peak distance that the charge migrates, bmis = 2bE,/w, is much less than the inner radius of the cylin- ders or the gap d , even for large fields at low frequency, the boundaries are treated as flat and non-interacting. Because the dielectric relaxation time 7; = E / V , and self- precipitation time T~ = ~ / p b , are generally much longer than the charge flight times we take the charge density along a trajectory to be constant.
If charge reaches beyond a boundary layer thickness 6 b into the turbulent core, it becomes entrained in the flow and does not return to the wall. This thickness is defined
in (25) as that distance at which the peak migration ve- locity bE, just equals the fluid fluctuation rms velocity component perpendicular t o the wall ( I J ~ ~ ) ' / ~ as given in (9). The boundary layer thickness for the Taylor correla- tion of (14) is then
66 = 6 3 d R - 9 / 8 ( b E , d / ~ ) 1 / 2 (45)
where R = QRzd/u is the Reynolds number. Repre- sentative values for our experiments have an ion mobil- ity of b x 10-'m2/(Vs), maximum electric field E , = 0.5 x 10⁶V/m, and maximum inner cylinder speed of 1800 rpm, which gives 6b x 30 p m .
If the field E , is too low or the frequency w is too high so that the maximum charge migration length is less than the sublayer thickness (2bE, /w < bb), charge trajectories given by (44) for charge injected at the x = 0 wall do not cross the boundary layer into the turbulent core and thus do not contribute to injected current. However, the equilibrium charge density taken to linearly vary from the wall charge density pw at a = 0 to the turbulent core cfiarge density p, a t a = 66 as

IEEE Transactions on Electrical Insulation Vol. 26 No. 5 , October 1991 893
has some charge that crosses x = 6 b . Since we take the charge density to remain constant along a trajectory we can use (44) t o relate position x at time t to initial posi- tion x, a t time wt, = -7r/2 so that the charge density of (46) a t later positions and time is
In particular, with x = 6 b , the current density J i = pbE, cos w t crosses into the turbulent core over the time interval -7r/2 5 w t 5 ~ / 2 . For the time interval 7r/2 5 wt 5 3 ~ 1 2 , charge with density po in the turbulent core crosses back over into the sublayer. We assume that once in the sublayer, equilibrium diffusion processes convert this charge density of po back to the linear profile of (46) before the field reverses direction. Then the net current that crosses the sublayer into the turbulent core is
bE, cos(&) dt
1 + ' T p 0 b E O cos w t dt n l 2 w
- ('U - 'o)b2E,2 - r w 6 b
If the field E, is high enough, or frequency w is low enough, such that 2bE,/w > 68 then injected charge with density p i n j can also cross the sublayer which re- sults in additional current charging the turbulent core. Equilibrium charge now crosses a = 6 b into the turbulent core in the time interval -7r/2 5 w t 5 wt6 and inject- ed charges cross x = 66 into the turbulent core in the time interval 5 w t 5 7r/2. Turbulent core charge crosses a = 6 b back into the sublayer in the time interval a/2 5 w t 5 3 ~ 1 2 . The time t 6 is found for that trajectory starting a t x, = 0, wt, = -n/2 t o reach x = 6 b
The net current density crossing z = 66 is then
L-r/2w
bE, cos w t dt K/2W 3n/2w
+ / pinjbE,coswtdt + p,bE,coswtdt J t 6 n / 2 w
.Charge conservation requires that the time rate of change of the charge in the volume V be equal to the sum of the injected, diffusion, and ohmic currents
dP0 V- = 2 n l ( J 1 R 1 + J 2 R 2 ) - V p , a / E (51) dt where J l , 2 = J , l , 2 + J d l , p is the sum of the injected and diffusion current densities evaluated at the inner and out- er cylinders. Provided that the space charge field is neg- ligible compared to the imposed field, the electric field a t the inner and outer cylinders with an applied voltage V is
(52) V
R 1 , 2 l n ( R 2 l R 1 ) E l , 2 =
Reducing ( 5 1 ) , the governing equation for the core charge density is related to the wall charge densities p w 1 , 2 ,
injection charge densities ~ i n j l , ~ , diffusion times 7 d 1 , 2 , di- electric relaxation time T ~ , and injection times Ta1,21 7b1 ,2 ,
and 7 c l , 2 by
+= + p w 1 (f + '> + 'U2 (f + ') 7 c 2 Td1 T b l 7 d 2 Tb2 ( 5 3 )
5 1 , 2 ( R : - R:) 2DRi,a
7 d 1 , 2 =
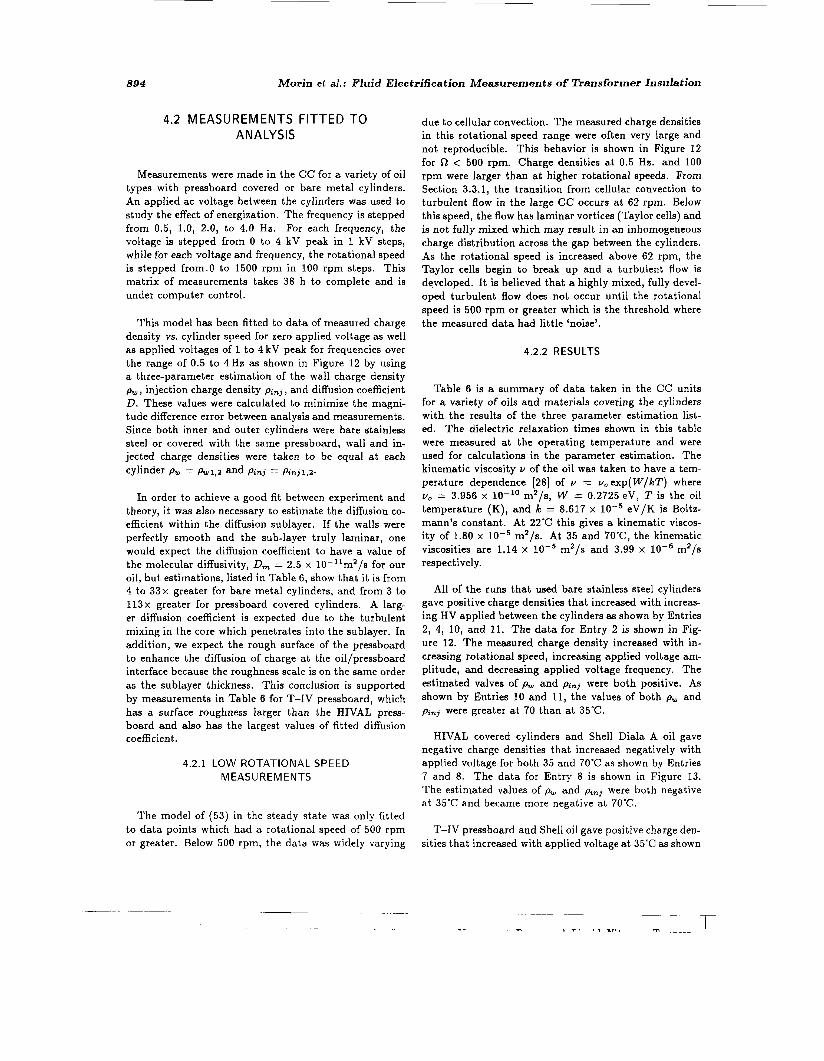
894 Morin et al.: Fluid Electrification Measurements of Transformer Insulation
4.2 MEASUREMENTS FITTED TO A N A LY S IS
Measurements were made in the CC for a variety of oil types with pressboard covered or bare metal cylinders. An applied ac voltage between the cylinders was used to study the effect of energization. The frequency is stepped from 0.5, 1.0, 2.0, to 4.0 Hz. For each frequency, the voltage is stepped from 0 to 4 kV peak in 1 kV steps, while for each voltage and frequency, the rotational speed is stepped from.0 to 1500 rpm in 100 rpm steps. This matrix of measurements takes 38 h to complete and is under computer control.
This model has been fitted to data of measured charge density vs. cylinder speed for zero applied voltage as well as applied voltages of 1 to 4 kV peak for frequencies over the range of 0.5 t o 4Hz as shown in Figure 12 by using a three-parameter estimation of the wall charge density pw , injection charge density pin, , and diffusion coefficient D. These values were calculated to minimize the magni- tude difference error between analysis and measurements. Since both inner and outer cylinders were bare stainless steel or covered with the same pressboard, wall and in- jected charge densities were taken to be equal a t each cylinder PW = p w i , z and Pinj = Pinj1,Z-
In order to achieve a good fit between experiment and theory, it was also necessary to estimate the diffusion co- efficient within the diffusion sublayer. If the walls were perfectly smooth and the sub-layer truly laminar, one would expect the diffusion coefficient to have a value of the molecular diffusivity, D, = 2.5 x 10-"m2/s for our oil, but estimations, listed in Table 6, show that it is from 4 to 33x greater for bare metal cylinders, and from 3 t o 113x greater for pressboard covered cylinders. A larg- er diffusion coefficient is expected due to the turbulent mixing in the core which penetrates into the sublayer. In addition, we expect the rough surface of the pressboard to enhance the diffusion of charge at the oil/pressboard interface because the roughness scale is on the same order as the sublayer thickness. This conclusion is supported by measurements in Table 6 for T-IV pressboard, which has a surface roughness larger than the HIVAL press- board and also has the largest values of fitted diffusion coefficient.
4.2.1 LOW ROTATIONAL SPEED MEASUREMENTS
The model of (53) in the steady state was only fitted to data points which had a rotational speed of 500 rpm or greater. Below 500 rpm, the data was widely varying
due to cellular convection. The measured charge densities in this rotational speed range were often very large and not reproducible. This behavior is shown in Figure 12 for R < 500 rpm. Charge densities a t 0.5 Hz. and 100 rpm were larger than at higher rotational speeds. From Section 3.3.1, the transition from cellular convection to turbulent flow in the large CC occurs at 62 rpm. Below this speed, the flow has laminar vortices (Taylor cells) and is not fully mixed which may result in an inhomogeneous charge distribution across the gap between the cylinders. As the rotational speed is increased above 62 rpm, the Taylor cells begin to break up and a turbulent flow is developed. I t is believed that a highly mixed, fully devel- oped turbulent flow does not occur until the rotational speed is 500 rpm or greater which is the threshold where the measured data had little 'noise'.
4.2.2 RESULTS
Table 6 is a summary of data taken in the C C units for a variety of oils and materials covering the cylinders with the results of the three parameter estimation list- ed. The dielectric relaxation times shown in this table were measured a t the operating temperature and were used for calculations in the parameter estimation. The kinematic viscosity v of the oil was taken to have a tem- perature dependence [28] of v = voexp(W/kT) where vo = 3.956 x 10-l' m2/s, W = 0.2725 eV, T is the oil temperature (K), and k = 8.617 x eV/K is Boltz- mann's constant. At 22°C this gives a kinematic viscos- ity of 1.80 x mz/s. At 35 and 70'C, the kinematic viscosities are 1.14 x m2/s and 3.99 x m2/s respectively.
All of the runs that used bare stainless steel cylinders gave positive charge densities that increased with increas- ing HV applied between the cylinders as shown by Entries 2, 4, 10, and 11. The data for Entry 2 is shown in Fig- ure 12. The measured charge density increased with in- creasing rotational speed, increasing applied voltage am- plitude, and decreasing applied voltage frequency. The estimated valves of pw and pinj were both positive. As shown by Entries 10 and 11, the values of both pw and pinj were greater a t 70 than at 35'C.
HIVAL covered cylinders and Shell Diala A oil gave negative charge densities that increased negatively with applied voltage for both 35 and 70°C as shown by Entries 7 and 8. The data for Entry 8 is shown in Figure 13. The estimated values of pw and pin, were both negative a t 35'C and became more negative at 70'C.
T-IV pressboard and Shell oil gave positive charge den- sities that increased with applied voltage a t 35°C as shown
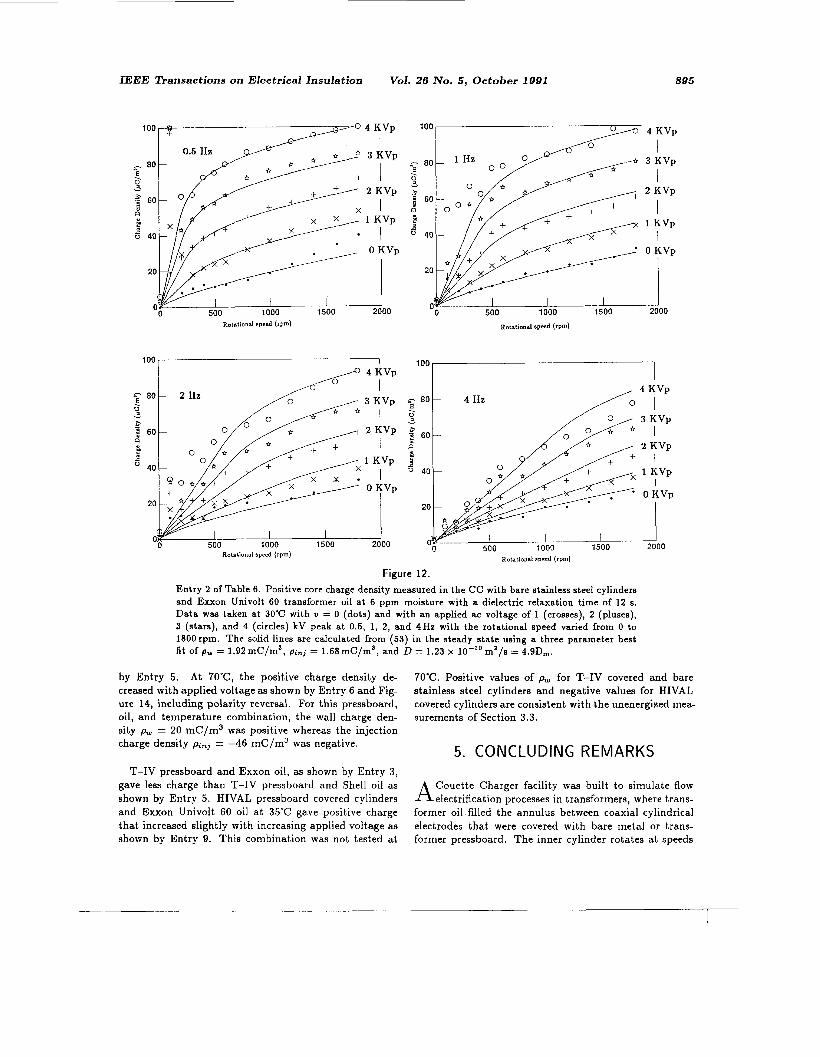
IEEE Transactions on Electrical Insulation Vol. 26 No. 5, October 1991 895
100
- so "a . U - .: 60 2
6 40
M
20
500 1000 1500 2000
Rotational speed (rpm) Rotational speed (rpm)
100. I
c SO- 2 HZ . U a
500 1000 1500 2000 Rotational speed (rpm)
Rotational speed (rpm)
4 KVp
3 KVp I
2 KVp I
1 KVp I
0 KVp
I
I 2000
Figure 12. Entry 2 of Table 6. Positive core charge density measured in the CC with bare stainless steel cylinders and E n o n Univolt 60 transformer oil at 6 ppm moisture with a dielectric relaxation time of 12 s. Data was taken at 30°C with 'U = 0 (dots) and with an applied ac voltage of 1 (crosses), 2 (pluses), 3 (stars), and 4 (circles) kV peak at 0.5, 1, 2, and 4Hz with the rotational speed varied from 0 to 1800rpm. The solid lines are calculated from (53) in the steady state using a three parameter best fit of pur = 1.92mC/m3, pinj = 1.68mC/m3, and D = 1.23 x lo-'' ma/s = 4.9Dm.
by Entry 5. At 70'C, the positive charge density de- creased with applied voltage as shown by Entry 6 and Fig- ure 14, including polarity reversal. For this pressboard, oil, and temperature combination, the wall charge den- sity pw = 20 mC/m3 was positive whereas the injection charge density pinj = -46 mC/m3 was negative.
70'C. Positive values of pw for T-IV covered and bare stainless steel cylinders and negative values for HIVAL covered cylinders are consistent with the unenergized mea- surements of Section 3.3.
5. CONCLUDING REMARKS T-IV pressboard and Exxon oil, as shown by Entry 3,
gave less charge than T-IV pressboard and Shell oil as shown by Entry 5. HIVAL pressboard covered cylinders and Exxon Univolt 60 oil a t 35°C gave positive charge that increased slightly with increasing applied voltage as shown by Entry 9. This combination was not tested a t
Couette Charger facility was built to simulate flow A electrification processes in transformers, where trans- former oil.filled the annulus between coaxial cylindrical electrodes that were covered with bare metal or trans- former pressboard. The inner cylinder rotates a t speeds

806 Morin et al.: Fluid Electrification Measurements of Transformer Insulation
Table 6. Estimated parameters for energized measurements in the CC for a variety of oils and materials covering the cylinders. Entry 1 is data taken in the small CC with 50 ppm BTA. All other entries are in the large CC without additives. The core charge density, po, with a rotation speed of 1500 rpm, is also shown for zero voltage (unenergized) and for an ac voltage of 4 kV peak at 0.5 Hz applied between the cylinders (energized).
# Name Materials Oil Temp. T~ Pw Pinj D/10-" D/Dm P o P o Moisture ("C) (sec) (mC/m3) (mC/m3) (m?/s) (D, = 25x (pC/m3) (pC/m3) ( P P 4 lo-'' m?/s) unenerglzed energized
1 bmar22 Manning 220 50 30 39 0.105 0.255 Gulf T H with 50 ppm BTA
Exson 60 2 bjun22 Bare SS G
3 sept2b T-IV G Esson GO
4 jan4a Bare SS 11 Shell DA
5 9aprOSa T-IV 2.3 Shell DA
G 9apr13b T-IV 2.7 Shell Di\
7 YmayO5a HIVAL 2.5 Shell DA
8 9mayl2b HIVAL 1 Shell DA
9 9jullOc HIVAL 8.8 Exyon GO
10 9auglOa Bare SS 23 AI buquerque
11 9aug15b Bare SS 36 Albuquerque
giving controlled turbulent flow
30
30
30
35
TO
35
70
35
35
i o
12
4
56
1.16
2 2
10
1.44
8.5
4.08
1.2
1.92
2.6
0.040
7.09
20
-1.26
-8.75
0.454
0.752
16.4
which brings electric charge to the volume from the electrical double layer at the liquid/solid interfaces.
Flow electrification charge density measurements as a function of inner cylinder speed were made using the ab- solute charge sensor which brings a sample of fluid from the turbulent core into a Faraday cage and measures the total charge with no extraneous contributions from charge separated within the ACS itself.
Transient measurements with a step change in tem- perature have shown the charge density to change from an initial value to a new steady state value, both values probably dependent on the equilibrium moisture levels in oil and pressboard. For all bare metal and T-IV press- board cases, the oil charge density was positive but with
1.68
2.57
0.191
5.24
-46
- 1.50
-4.58
0.139
2.14
17.4
74 1
123
1200
816
2447
2828
280
75
1293
520
93
29.6
4.9
48.0
32.G
97.9
113.1
10.9
3.0
51.5
20.8
3.7
16
32
58
8
97
-- f I
-15
-17
46
10
25
92
97
95
37
92
13
-23
-35
29
58
89
HIVAL pressboard there were some moisture and tem- perature regimes where the charge polarity reversed.
The effects of transformer energization were also sim- ulated by applying low frequency (0.5 to 4 Hz) HV (field strength < 1.8 kV/cm peak) across the cylinders of the CC. Generally this energization increased the magnitude of net charge in the turbulent core which increased with decreasing frequency, but the T-IV pressboard and Shell oil combination had a decrease in charge density with increasing voltage including polarity reversal. This in- dicates that injected charge can be the same or opposite polarity to the charge on the liquid side of the equilibrium double layer. To help understand the effects of energiza- tion and to scale laboratory measurements a t low voltages and low frequencies to operating transformers, a charge injection model was developed that examined the migra- tion of double layer and injected charge in the imposed

IEEE Transactions on Electrical Insulation Vol. 26 No. 5 , October 1991
-40 t 4 K v p
-50 8 IC 1000 0 500
Rotational speed (rpm)
-50 - 0 500 1000 IC
Rotational speed (rpm)
500 1000 1500 -50 0 500 1000 1500 - -50 0
Rotational speed (rpm) Rotational speed (rpm)
Figure i3. Entry 8 of Table 6. Negative core charge density measured in the large CC with HIVAL covered cylinders and Shell Diala A transformer oil at 1 ppm moisture with a dielectric relaxation time of 1.44 s. Data was taken at 7OPC with v = 0 (dots) and with an applied ac voltage of 1 (crosses), 2 (pluses), 3 (stars), and 4 (circles) kV peak at 0.5, 1, 2, and 4 Hz with the rotational speed varied from 0 to 1500 rpm. The solid lines are calculated from (53) in the steady state using a three parameter best fit of pw = -6.7mC/m3, pinj = -4.6mC/m3, and D = 7.5 x lo-" m2/s = 3.0Dm.
897
3
sinusoidally time-varying electric field.
Good fits between this model and measurements were achieved by finding best fits of equilibrium charge density a t the solid/liquid interface, injected charge density due to energization, and diffusivity in the diffusive sublayer near the wall. The diffusivity exceeded the molecular diffusivity by - 5 to 30x for bare metal cylinders, and by 5 113 for pressboard covered cylinders. This enhanced diffusivity was probably due to the turbulent mixing of the core penetrating the diffusive sublayer and due to the
rough surface variations of the pressboard which are of the same order as the sublayer thickness.
Measurements will continue with new transformer oils and used oils taken from operating transformers. The equilibrium and energization models are also being im- proved by generalizing the electrochemical boundary con- dition at the interface to include chemical rate process- es and moisture dynamics between pressboard and oil. Because of the bipolar nature of our measurements the charge transport model is also being extended to include

808
80
Morin et al.: Fluid Electrification Measurements of Transformer Insulation
1 100 7 100
4 Hz -
1 0.5 Hz
8o r
-20
f x . i
-
I I
I I 500 1000 1500
Rotational speed (rpm)
-40 0
-20L- -40 0 500 1000 1500
Rotational speed (rpm)
8 0 1 l H z
60
40
20
0
I I
-20- O
0 500 1000 1500 -40
Rotational speed (rpm)
Rotational speed (rpm)
Figure 14. Entry 6 of Table 6. Core charge density measured in the large CC with T-IV covered cylinders and Shell Diala A transformer oil at 2.7 ppm moisture with a dielectric relaxation time of 0.22 s. Data was taken at 70’C with ‘v = 0 (dots) and with an applied ac voltage of 1 (crosses), 2 (pluses), 3 (stars), and 4 (circles) kV peak at 0.5, 1, 2, and 4Hz with the rotational speed varied from 0 to 1500rpm. The solid lines are calculated from (53) in the steady state using a three parameter best fit of p,,, = 20mC/m3, pinj = -46mC/m3, and D = 2.83 x lo-’ m2/s = 113Dm.
two opposite polarity charge carriers which are generat- ed from dissociated neutral molecules with current due to migration in the electric field and by charge diffusion [58,59]. Ion pairs can also recombine to reform neutrals, where in equilibrium the generation and recombination rates are equal. Such time and space dependent charge distributions are a better model of the conduction pro- cesses in highly insulating oils than the ohmic conductiv- ity model generally used in this work.
ACKNOWLEDGMENT
HIS work was supported by the Electric Power Re- T search Institute under Research Project 8000-31 un- der the management of Mr. S. R. Lindgren. Most of this work was part of A. J . Morin’s thesis submitted to the M. I. T. Department of Electrical Engineering and Com- puter Science in partial fulfillment for the MS degree. Special thanks go to R. Albano for excellent machining of parts for the ACS and Couette Charger, D. Otten and T. Caloggero for design and construction of the circuitry
IEEE “ransactions on Electrical Insulation Vol. 26 No. 5 , October 1991 899
and mechanical components in the ACS, and W. Ryan, J . Kalt, P. von Guggenberg, A. Washabaugh, and P. Warren for help in taking and interpreting data.
[13] T. Takagi, T. Ishii, T. Okada, K. Kurita, R. Tamura, and H. Murata, “Reliablity Improvement of 550 kV Large Capacity Power Transformer,” CIGRE Inter-
REFERENCES
A. Klinkenberg and J. L. Van der Minne, Electrostat- ics in the Petroleum Industry, Elsevier, Amsterdam, 1958.
A. Klinkenberg, “Theoretical Aspects and Practical Implications of Static Electricity in the Petroleum Industry,” in J . J . McKetta (ed.) Advances in Petro- leum Chemistry and Refining, John Wiley and Sons, New York, Vol. 8, Chpt. 2, 1964.
J. T. Leonard, “Generation of Electrostatic Charge in Fuel Handling Systems: A Literature Survey,” NRL Report 8484, Sept., 1981.
N. Denbow and A. W. Bright, “The Design and Performance of Novel On-line Electrostatic Charge- Density Monitors, Injectors, and Neutralizers for Use in Fuel Systems,” in J. Lowell (ed.) Electrostatics, 1979, The Institute of Physics, London, pp. 171-179, 1979.
I. Ginsburgh, “The Static Charge Reducer,” J. Col- loid Interface Sci., Vol. 32, pp. 424-432, 1970.
A. Klinkenberg and B. V. Poulston, “Antistatic Ad- ditives in the Petroleum Industry,” J. Inst. Petrol., Vol. 44, pp. 379-393, 1958.
J . T . Leonard and H. F. Bogardus, “Pro-Static Agents in Jet Fuels,” NRL Report 8021, August 1976.
J . A. Carruthers and K. J. Marsh, “Charge Relax- ation in Hydrocarbon Liquids Flowing Through Con- ducting and Non-Conducting Pipes,” J. Inst. Petrol.,
B. Abedian, “Electrostatic Charge Relaxation in Tank Filling Operations,” J . Electrostatics, Vol. 14,
Vol. 48, pp. 169-179, 1962.
pp. 35-57, 1983.
K. Asano, “Electrostatic Potential and Field in a Cylindrical Tank Containing Charged Liquid,” Proc.
J . A. Carruthers and K. J . Wigley, “The Estimate of Electrostatic Potentials, Fields, and Energies in a Rectangular Metal Tank Containing Charged Fuel,” J . Inst. Petrol., Vol. 48, pp. 180-195, 1962.
S. Yasufuku, J. Ise, Y. Inoue, and Y. Ishioka, “Elec- trokinetic Phenomena in Electrical Insulation Oil/ Impregnated Cellulosic Pressboard System,” IEEE International Symposium on Electrical Insulation, Paper No. E-4, 1967.
IEE, Vol. 124, pp. 1277-1281, 1977.
national Conference on large HV Electric Systems, Paper No. 12-02, August/Sept., 1978.
[14] M. Higaki, Y. Kako, M. Moriyama, M. Hirano, K. Hiraishi, and K. Kurita, “Static Electrification and Partial Discharges Caused Power Engineering Soci- ety Winter Meeting,” Paper No. F79 231-2, New York, Feb., 1979.
[15] H. Okubo, M. Ikeda, M. Honda, and T . Yanari, “Charging Tendency Measurement of Transformer Oil,” IEEE Power Engineering Society Winter Meet- ing, Paper No. A79051-4, New York, Feb., 1979.
[16] M. Higaki, H. Miyao, K. Endou, and H. Ohtani, “A Calculation of Potential Distribution Caused by Static Electrification Owing to Oil Flow in an Oil- Paper Insulation System and its Application to Par- tial Discharge Phenomena in Oil,” IEEE Trans. Pow- er App. and Sys., Vol. 98, No. 4, pp. 1250-1275, Ju- ly/August, 1979.
[17] S. Shimizu, H. Murata, and M. Honda, “Electro- statics in Power Transformers,” IEEE Trans. Power App., and Sys., Vol. 98, No. 4, pp. 1244-1250, Ju- ly/August, 1979.
[18] H. Okubo, M. Ikeda, M. Honda, and S. Menju, “Elec- trostatic Discharges in Insulation Oil” International Symposium on HV Engineering, Paper No. 23.14, Milan, August, 1979.
[19] R. Tamura, Y. Miura, T . Watanabe, T. Ishii, N. Ya- mada, and T. Nitta, “Static Electrification by Forced Oil Flow in Large Power Transformers”, IEEE Trans. Power App. and Sys., Vol. 99, No. 1, pp. 335-343, Jan./Feb., 1980.
[20] T. Tanaka, Y. Yasojima, N. Yamada, A. Kishi, and T . Nitta, ‘<Model Approach to the Static Electrifica- tion Phenomena Induced by the Flow of Oil in Large Power Transformers”, IEEE Trans. Power App. and Sys., Vol. 99, No. 3, pp. 1097-1106, May/June, 1980.
[21] M. Yasuda, K. Goto, H. Okubo, T . Ishii, E. Mori, and M. Masunaga, “Suppression of Static Electrifi- cation of Insulating Oil for Large Power Transform- ers”, IEEE Power Engineering Society Winter Meet- ing, Paper No. 82 WM 197-2, New York, Jan./Feb., 1982.
[22] D. W. Crofts, “An Update of the Static Electrifica- tion Phenomena in Power Transformers” , Presented to the Pennsylvania Electric Association, Hershey, PA, Sept. 16, 1985.
900 Morin et al.: Fluid Electrification Measurements of Transformer Insulation
D. W. Crofts, “Static Electrification Phenomena in Power Transformers”, Special Session on Flow Elec- trification Effects in Electric Power Apparatus at the 1986 Conference on Electrical Insulation and Dielec- tric Phenomena, IEEE No. 86 CH2315-0, pp. 206- 216, Nov.4, 1986.
D. W. Crofts, “The Static Electrification Phenom- ena in Power Transformers”, Special Issue on Flow Electrification in Electric Power Apparatus, IEEE Trans. Electrical Insulation, Vol. 23, No. 1, pp. 137- 146, Feb., 1988.
T. V. Oommen, “Static Electrification Properties of Transformer Oil”, Special Session on Flow Electri- fication Effects in Electric Power Apparatus at the 1986 Conference on Electrical Insulation and Dielec- tric Phenomena, IEEE No. 86 CH2315-0, pp. 206- 216, Nov.4, 1986.
T. V. Oommen and E. M. Petrie, “Electrostatic Charging Tendency of Transformer Oils”, IEEE Power Engineering Society Winter Meeting, Paper No. 84 WM164-0, Dallas, Jan./Feb., 1984.
T. V. Oommen, “Static Electrification Properties of Transformer Oil”, Special Issue on Flow Electrifica- tion in Electric Power Apparatus, IEEE Trans. Elec- trical Insulation, Vol. 23, No. 1, pp. 123-128, Feb., 1988.
T. V. Oommen, “Static Electrification Control in Power Transformers”, EPRI Final Report for RP 1499-7, NOV. 1987.
E. Howells, M. Zahn, and S. R. Lindgren, “Static Electrification Effects In Transformer Oil Circulat- ing Pumps”, IEEE Trans. on Power Delivery, Vol. 5, No.2, pp. 1000-1006, April, 1990.
S. M. Gasworth, J . R. Melcher, and M. Zahn, “Elec- trification Problems Resulting from Liquid Dielectric Flow”, Technical Report EL-4501, EPRI, 1986.
S. M. Gasworth, Electrification by Liquid Dielectric Flow, Ph. D. Thesis, Department of Electrical En- gineering and Computer Science, MIT, Cambridge, MA, June, 1985.
S. M. Gasworth, J . R. Melcher, and M. Zahn,“Flow- Induced Charge Accumulation In Thin Insulating Tubes”, IEEE Transactions on Electrical Insulation, Vol. 23, No.1, pp. 103-115, Feb., 1988.
J. K. Nelson,“The Use of a Tandem Chamber Charge Density Monitor In Transformer Applica- tions”, IEEE Transact,ions on Electrical Insulation, Vol. 25, No.2, pp. 399-404, 1990:
[34] J . R. Melcher, D. J . Lyon, and M. Zahn, “Flow Elec- trification in Transformer Oil/Cellulosic Systems”, Special Session on Flow Electrification Effects in Electric Power Apparatus a t the 1986 Conference on Electrical Insulation and Dielectric Phenomena, IEEE NO. 86 CH2315-0, pp. 257-265, NOV.4, 1986.
[35] D. J . Lyon, J . R. Melcher, and M. Zahn, “Cou- ette Charger for Measurement of Equilibrium and Energization Flow Electrification Parameters. Ap- plication to Transformer Insulation,” Special Issue on Flow Electrification in Electric Power Apparatus, IEEE Trans. Electrical Insulation, Vol. 23, No. 1, pp. 15g-176, Feb., 1988.
[36] D. J . Lyon, Couette Flow Measurement of Equilibri- um and Energization Charging in Transformer Insu- lation, M. S. thesis, Dept. of Elect. Eng. and Comp. Sci., M. I. T., Cambridge, MA, July, 1987.
[37] J. R. Melcher, A. J. Morin 11, and M. Zahn, An In- strument for the Detection of Electrical Charge En- trained in a Fluid U. S. Patent No.: 4, 873, 489, 1989.
[38] A. J . Morin 11, J . R. Melcher, and M. Zahn, “An Ab- solute Charge Sensor for Fluid Electrification Mea- surements”, Conference Record of the 1988 IEEE In- ternational Symposium on Electrical Insulation, pp. 18-22, June 5-8, 1988.
[39] A. J . Morin 11, Fluid Electrification Measurements of Transformer Pressboard/Oil Insulation In A Couette Charger Using An Absolute Charge Sensor, M. S. thesis, Dept. of Elect. Eng. and Comp. Sci., M. I. T., Cambridge, MA, Sept. 1989.
1401 A. J . Morin 11, M. Zahn, and J . €2. Melcher, “Equilib- rium Electrification Parameters Inferred from Cou- ette Charger Terminal Measurements,” Annual Re- port of the Conference on Electrical Insulation and Dielectric Phenomena, pp. 286-292, 1988.
[41] A. J . Morin 11, M. Zahn, and J . R. Melcher, “Fluid Electrification Measurements in Transformer Press- board/Oil Insulation”, Conference Record of the 1989 International Symposium on HV Engineering, August/Sept., 1989.
1421 A. J . Morin 11, M. Zahn, and J . R. Melcher, “Fluid Electrification Measurements of Transformer Press- board/Oil Insulation In a Couette Charger Using An Absolute Charge Sensor”, EPRI Technical Report EL-6918, Project 1499-98, Workshop Proceedings: Static Electrification in Power Transformers (Nov. 15-17, 1989, Princeton, NJ), pp. 3-3-1 to 3-3-33, July, 1990.
IEEE Transactions on Electrical Insulation Vol. 26 No. 5 , October 1991 901
[43] A. J . Morin 11, M. Zahn, J. R. Melcher, and D. Otten, “An Absolute Charge Sensor for Fluid Electrification Measurements”, to be published, IEEE Transactions on Electrical Insulation, Vol. 26, pp. 181-199, 1991.
Transformers”, Special Issue on Flow Electrification in Electric Power Apparatus, IEEE Trans. Electrical Insulation, Vol. 23, No. 1, pp. 153-157, Feb., 1988.
[54] M. C. Zaretsky, L. Mouayad, and J . R. Melcher, [44] I. Adamczewski, Ionization, Conductivity and “Continuum Properties from Interdigital Electrode
Breakdown in Dielectric Liquids, Taylor and Dielectrometry” , IEEE Transactions on Electrical Francis, London, pp. 224-225, 1969. Insulation, Vol. 23, No.6, pp. 897-917, Dec. 1988.
[45] (a) F. M. White, Fluid Mechanics, McGraw-Hill, New York, Chapter 6, 1979; (b) Viscous Fluid Flow, McGraw-Hill, New York, pp. 423-426, 1974.
[46] A. S. Monin and A. M. Yaglom, Statistical Fluid Me- chanics, Cambridge, MA, MIT Press, Vol. 1, Section 5.3, 1979.
[47] M. M. M. El Telbanny and A. J . Reynolds, “The Structure of Turbulent Plane Couette Flow” , Trans. of the ASME Journal of Fluids Engineering, Vol. 104, pp. 367-372, Sept. 1982.
[48] A. A. Sonin, Notes from M. I. T. Course 2.273.
[49] B. Abedian and A. A. Sonin, “Theory for Electrical Charging in Turbulent Pipe Flow”, J. Fluid Mech, Vol. 120, pp. 199-217, 1982.
[50] G. I. Taylor, “Fluid Friction Between Rotating Cylinders, Part I. Torque Measurements,” Proc. Royal Society, Vol. CLVII, pp. 546-564, 1936.
[51] H. Schlicting, Boundary-Layer Theory, McGraw-Hill
[52] B. Abedian, Electric Charging of Low Conductivity Liquids in Turbulent Flows Through Pipes, Ph. D. Thesis, Dept of Mechanical Engineering, M. I. T., Cambridge, MA., Sept. 1979.
[53] M. Ieda, K. Goto, H. Okubo, T . Miyamoto, H. Tsukioka, and Y. Kohno, “Suppression of Static Electrification of Insulating Oil for Large Power
New York, chapter 20, 1979.
[55] H. G. Fischer, “Discussion to: Fluid Electrifica- tion Measurements of Transformer Pressboard/Oil Insulation In a Couette Charger Using An Abso- lute Charge Sensor”, EPRI Technical Report EL- 6918, Project 1499-98, Workshop Proceedings: Stat- ic Electrification in Power Transformers (Nov. 15-17, 1989, Princeton, NJ), p. A-1, July, 1990.
[56] P. von Guggenberg and J. R. Melcher,“Moisture Dy- namics in Paper/Oil Systems Subject to Thermal Transients,” EPRI Technical Report EL-6918, Pro- ject 1499-98, Workshop Proceedings: Static Elec- trification in Power Transformers (Nov.15-17, 1989, Princeton, NJ), pp. 3-4-1 to 3-4-16, July, 1990.
[57] H. Miyao, M. Higaki, and Y. Kamata, “Influence of AC and dc Fields on Streaming Electrification of Transformer Oil,” IEEE Trans. on Electrical Insula- tion, Vol. 23, No. 1, pp. 129-135, Feb., 1988.
[58] E. W. Jansen, Bipolar Conduction Models for Di- electric Electrification, M. S. Thesis, Dept. of Elec- trical Engineering and Computer Science, M. I. T., Cambridge, MA, Feb. 1990.
[59] E. W. Jansen and M. Zahn,“Drift/Diffusion Conduc- tion Model for Flow Electrification”, 1990 Confer- ence on Electrical Insulation and Dielectric Phenom- ena, pp. 672-677, Oct. 1990.
Manuscript was received on 4 March 1991