flughafen wien ag - vienna airport · 2017-01-17 · traffic development 2016 flughafen wien ag 3...
TRANSCRIPT

FLUGHAFEN WIEN AGTraffic Results in 2016 andBusiness Outlook for 2017
2016: Three records set in one year
2
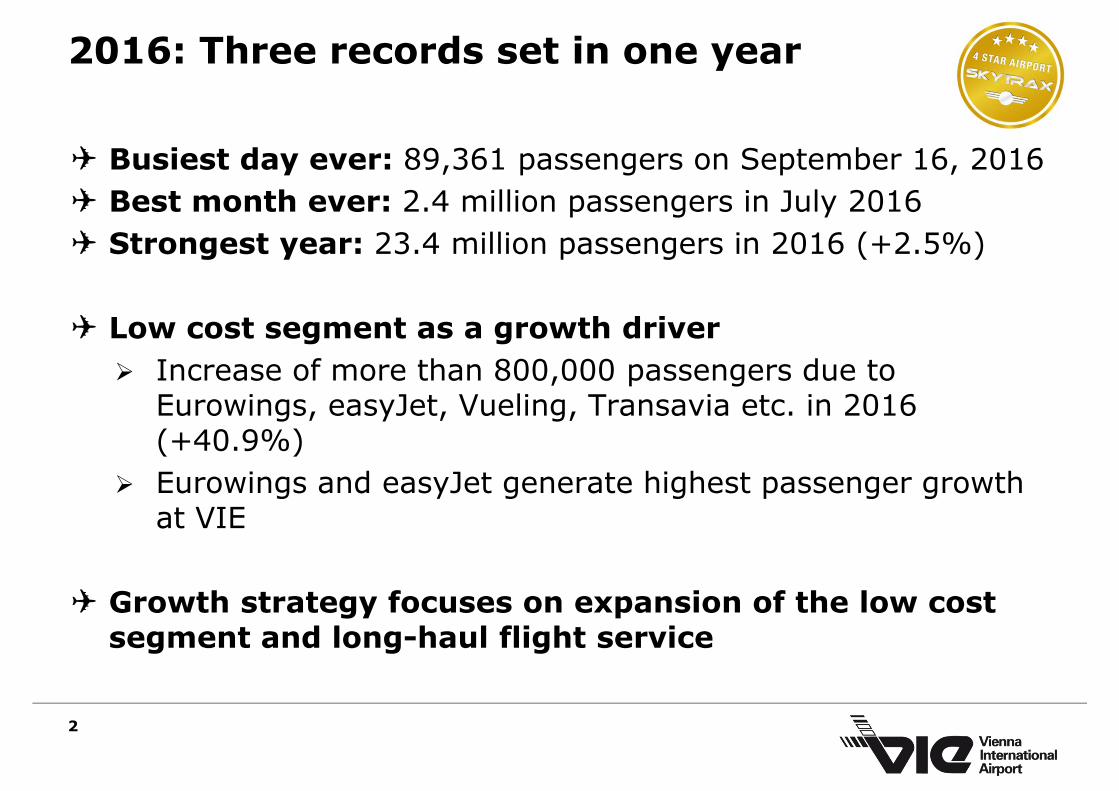
✈ Busiest day ever: 89,361 passengers on September 16, 2016✈ Best month ever: 2.4 million passengers in July 2016✈ Strongest year: 23.4 million passengers in 2016 (+2.5%)
✈ Low cost segment as a growth driver Increase of more than 800,000 passengers due to
Eurowings, easyJet, Vueling, Transavia etc. in 2016 (+40.9%)
Eurowings and easyJet generate highest passenger growth at VIE
✈ Growth strategy focuses on expansion of the low cost segment and long-haul flight service

Traffic development 2016Flughafen Wien AG
3
Traffic developmentat Vienna Airport 2016 2015 ∆ in %
Passengers (millions) 23.35 22.78 +2.5Local passengers (millions) 17.08 16.38 +4.3Transfer passengers (millions) 6.17 6.30 -2.0
Flight movements (in 1,000) 226.40 226.81 -0.2MTOW (millions of tonnes) 8.65 8.40 +3.1Seats (departure/arrival) 31,932,676 30,810,577 +3.6Seat load factor (percent) 73.4 74.3 -0.8%pCargo incl. trucking (in 1,000 tonnes) 282.73 272.58 +3.7

74 airlines serve 186 destinations in 72 countries
4
Departed passengers, 2016 development compared to 2015 and share of total passenger volume in 2016
Passenger growth compared to previous year
Share of total passenger volume
1.3%
-13.1%
Africa
Decline above all to tourist destinations in Egypt
5.3%
+6.2%
Middle East
Growth due to capacity expansion to Iran and Qatar
3.7%
+0.2%
Far East
Stable passenger volume related to addition of Shanghai and Hong Kong as new destinations to
offset termination of flight service to Tokyo
Growth driven by low cost carriers such as Eurowings, Easyjet, Transavia and Vueling 70.3%
+3.4%
thereof Western Europe
16.4%
-0.5%
thereof Eastern Europe
Decrease especially to Russia, growth to Ukrainian destinations
86.7%
+2.6%
Europe
Increase related to launch of flights to Miami 2.9%
+2.4%
North America
Growth thanks to addition of flights to Havana 0.1%
+11.0%
Latin America
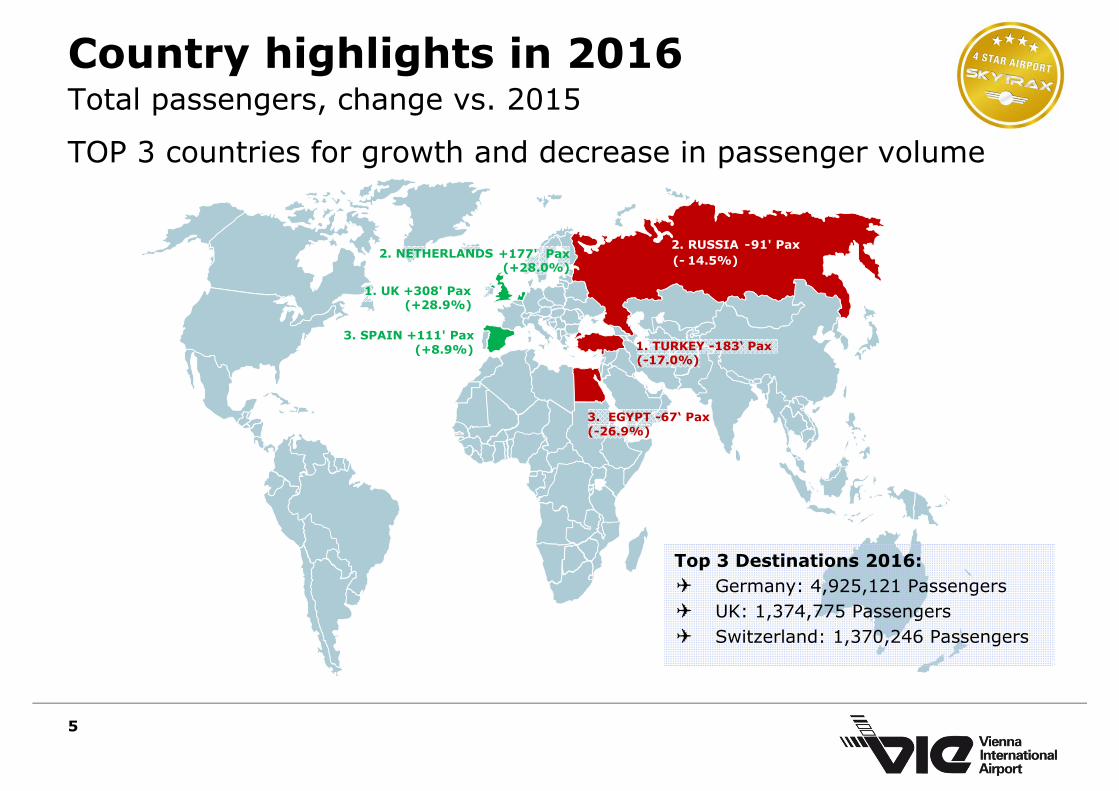
Country highlights in 2016Total passengers, change vs. 2015
TOP 3 countries for growth and decrease in passenger volume
5
2. RUSSIA -91' Pax(- 14.5%)
Top 3 Destinations 2016:✈ Germany: 4,925,121 Passengers✈ UK: 1,374,775 Passengers✈ Switzerland: 1,370,246 Passengers
2. NETHERLANDS +177' Pax(+28.0%)
1. UK +308' Pax(+28.9%)
3. SPAIN +111' Pax(+8.9%) 1. TURKEY -183‘ Pax
(-17.0%)
3. EGYPT -67‘ Pax(-26.9%)

Strategic goal to expand long-haul flight service: strong rise in passenger volume since 2011
6
+60.6%+13.0% -3.9%
+445.3% -12.3%
+23.8% +4.0%
Western Europe Eastern Europe
Far East
AfricaLatin America
Middle East
North America
207 212 234299 326 333
2011 2012 2013 2014 2015 2016
7.2 7.5 7.5 7.8 7.9 8.2
2011 2012 2013 2014 2015 2016
2.0 2.2 2.2 2.0 1.9 1.9
2011 2012 2013 2014 2015 2016
2 8 11 12 11 12
2011 2012 2013 2014 2015 2016
175 190 157 167 176 153
2011 2012 2013 2014 2015 2016
500 542 523 539 583 619
2011 2012 2013 2014 2015 2016
409 385 363409 424 425
2011 2012 2013 2014 2015 2016
Departed passengers, figures for Europe in millions, otherwise in thousands
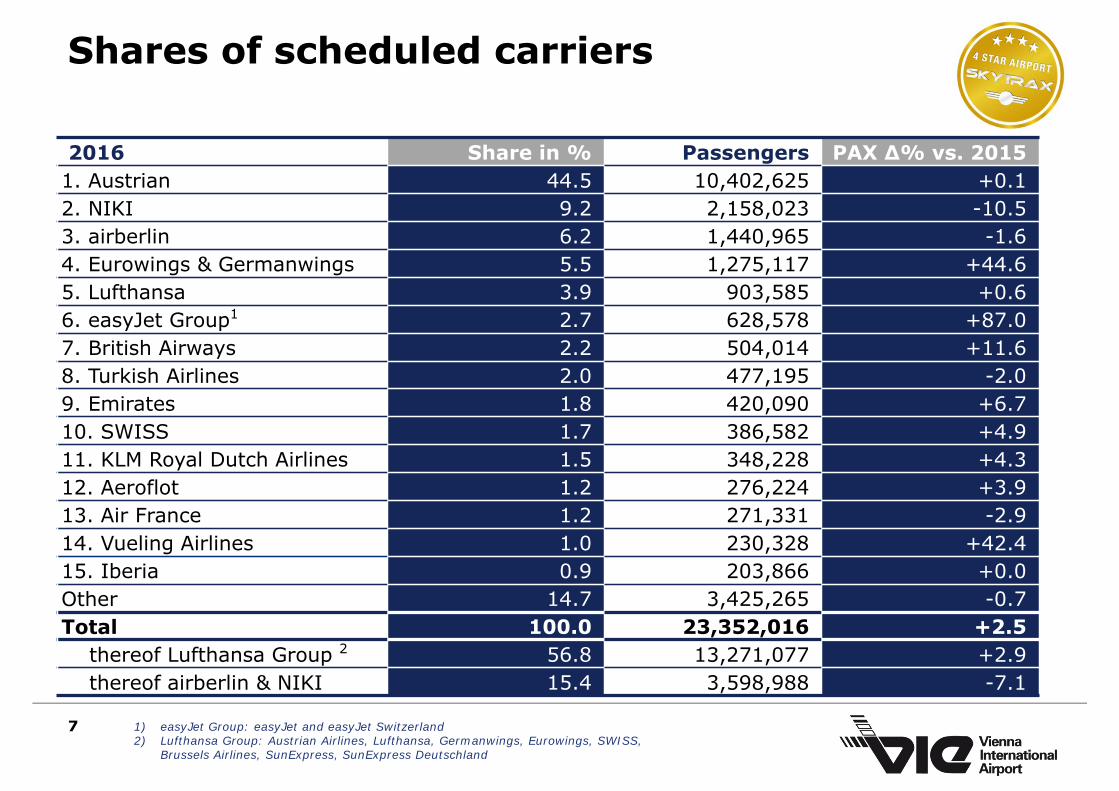
Shares of scheduled carriers
7
2016 Share in % Passengers PAX ∆% vs. 20151. Austrian 44.5 10,402,625 +0.12. NIKI 9.2 2,158,023 -10.53. airberlin 6.2 1,440,965 -1.64. Eurowings & Germanwings 5.5 1,275,117 +44.65. Lufthansa 3.9 903,585 +0.66. easyJet Group1 2.7 628,578 +87.07. British Airways 2.2 504,014 +11.68. Turkish Airlines 2.0 477,195 -2.09. Emirates 1.8 420,090 +6.710. SWISS 1.7 386,582 +4.911. KLM Royal Dutch Airlines 1.5 348,228 +4.312. Aeroflot 1.2 276,224 +3.913. Air France 1.2 271,331 -2.914. Vueling Airlines 1.0 230,328 +42.415. Iberia 0.9 203,866 +0.0Other 14.7 3,425,265 -0.7Total 100.0 23,352,016 +2.5
thereof Lufthansa Group 2 56.8 13,271,077 +2.9thereof airberlin & NIKI 15.4 3,598,988 -7.1
1) easyJet Group: easyJet and easyJet Switzerland2) Lufthansa Group: Austrian Airlines, Lufthansa, Germanwings, Eurowings, SWISS,
Brussels Airlines, SunExpress, SunExpress Deutschland
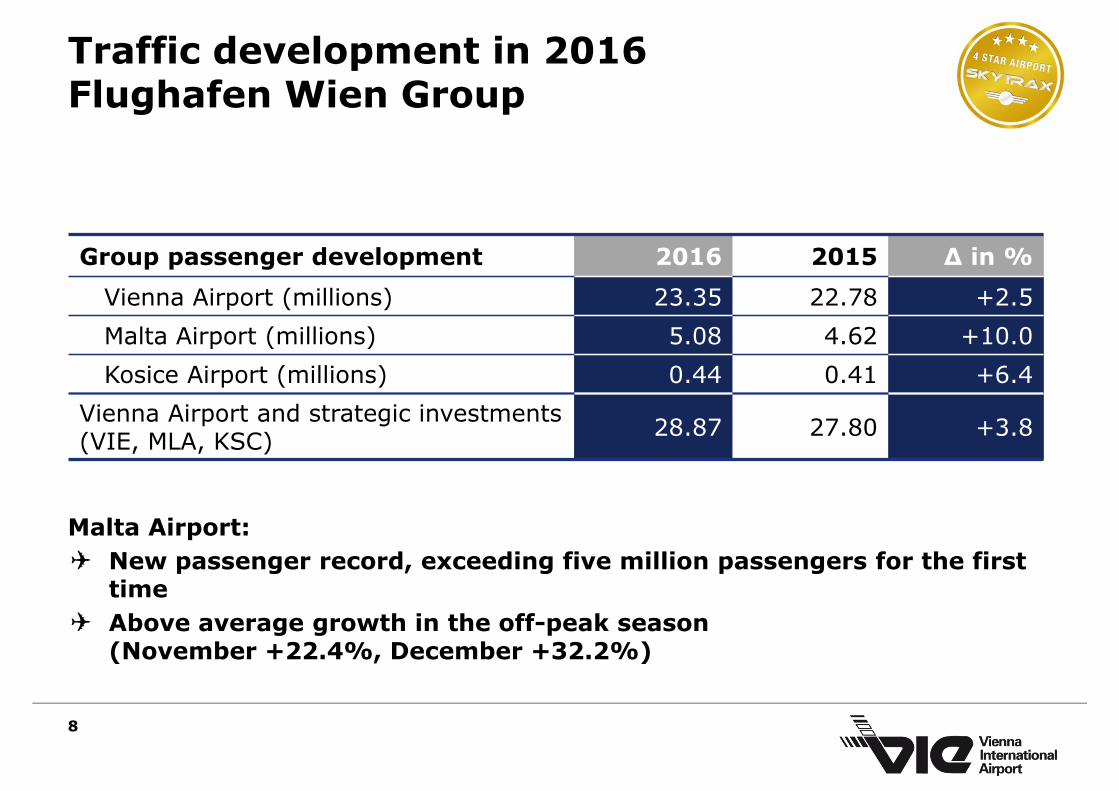
Traffic development in 2016Flughafen Wien Group
8
Group passenger development 2016 2015 ∆ in %
Vienna Airport (millions) 23.35 22.78 +2.5Malta Airport (millions) 5.08 4.62 +10.0Kosice Airport (millions) 0.44 0.41 +6.4
Vienna Airport and strategic investments (VIE, MLA, KSC) 28.87 27.80 +3.8
Malta Airport: ✈ New passenger record, exceeding five million passengers for the first
time✈ Above average growth in the off-peak season
(November +22.4%, December +32.2%)

Traffic forecast for 2017
9
2016 Forecast for 2017
Passengers 28.9 million +1% to +3%
✈ Crises continue – Recovery in flight traffic to Eastern Europe✈ Ticket tax remains a competitive disadvantage✈ Far-reaching capacity reductions due to restructuring of the airberlin
Group – Low cost segment and Lufthansa Group as growth drivers in 2017 expected to more than offset this development
Flughafen Wien Group:
Vienna Airport: 2016 Forecast for 2017
Passengers 23.4 million 0% to +2%
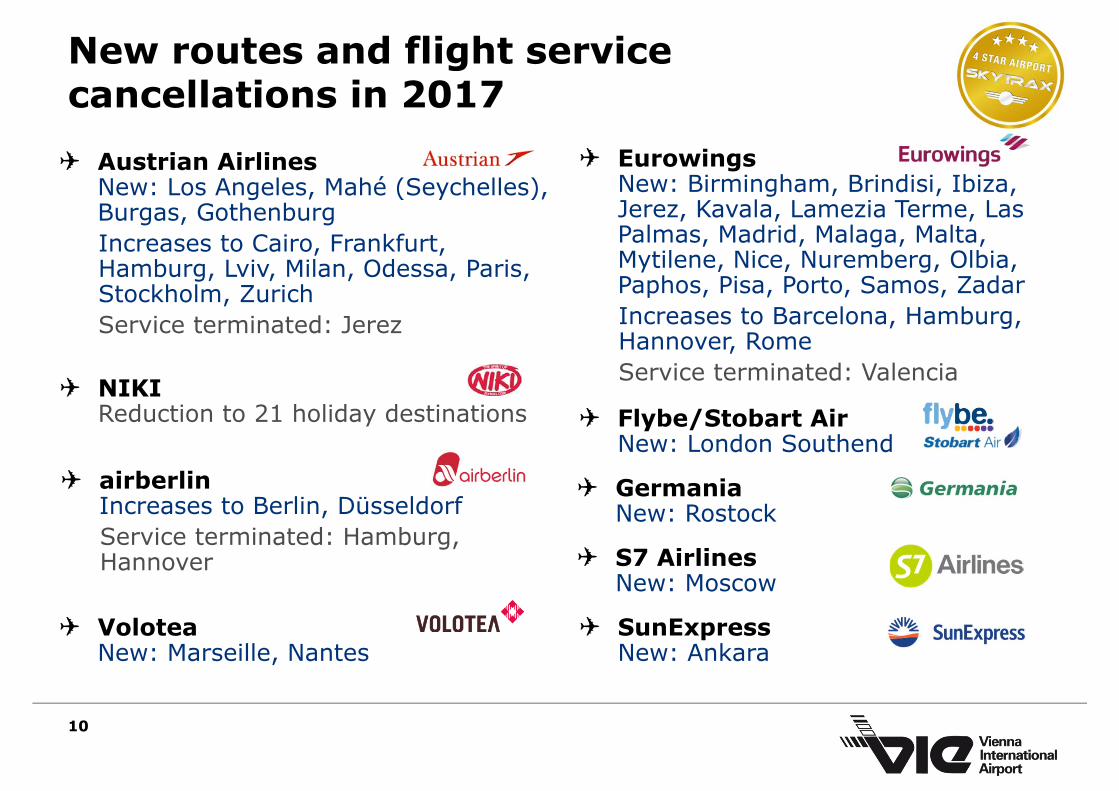
New routes and flight servicecancellations in 2017
10
✈ Austrian AirlinesNew: Los Angeles, Mahé (Seychelles), Burgas, GothenburgIncreases to Cairo, Frankfurt, Hamburg, Lviv, Milan, Odessa, Paris, Stockholm, ZurichService terminated: Jerez
✈ NIKIReduction to 21 holiday destinations
✈ airberlinIncreases to Berlin, DüsseldorfService terminated: Hamburg, Hannover ✈ S7 Airlines
New: Moscow
✈ VoloteaNew: Marseille, Nantes
✈ Flybe/Stobart AirNew: London Southend
✈ EurowingsNew: Birmingham, Brindisi, Ibiza, Jerez, Kavala, Lamezia Terme, Las Palmas, Madrid, Malaga, Malta, Mytilene, Nice, Nuremberg, Olbia, Paphos, Pisa, Porto, Samos, ZadarIncreases to Barcelona, Hamburg, Hannover, Rome Service terminated: Valencia
✈ GermaniaNew: Rostock
✈ SunExpressNew: Ankara

Vienna Airport is preparing for the future
11
✈Successful completion of large-scale runway renovation 11/29 – Repair of 210,000 m², 95,000 tonnes of concrete, 270 km of cables, 15 km of conduits –securing of long-term resilience of both runways
✈Technological progress also perceptible at VIE: Airbus 380, Airbus 350 and Boeing 787 Dreamliner in regular operation, baggage drop off at Terminal 3
✈Terminal development underway – € 500 million in investments to modernise the terminal infrastructure by 2023

12
BUSINESS DEVELOPMENT AND FINANCIAL GUIDANCE FOR 2017

Meet challenges on the basis of cost efficiency and higher productivityInvestments in quality and growth while maintaining the strategy to enhance productivity and reduce costs
✈€ 1.6 billion investment programme up to 2025 to ensure growth and secure employment
✈Significantly higher dividends for 2016
13
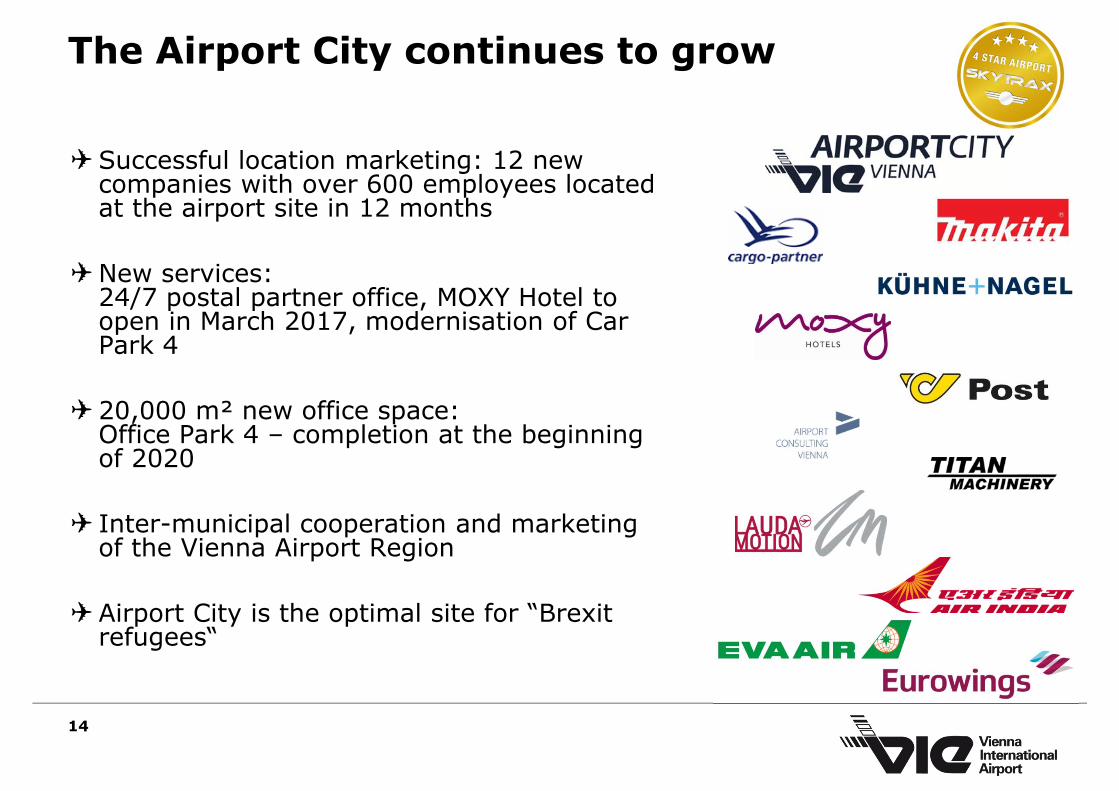
The Airport City continues to grow
✈Successful location marketing: 12 new companies with over 600 employees located at the airport site in 12 months
✈New services: 24/7 postal partner office, MOXY Hotel to open in March 2017, modernisation of Car Park 4
✈20,000 m² new office space: Office Park 4 – completion at the beginning of 2020
✈ Inter-municipal cooperation and marketing of the Vienna Airport Region
✈Airport City is the optimal site for “Brexitrefugees“
14

Expectations for 2017
✈Further increase in revenue, EBITDA and consolidated net profit, ongoing reduction in net debt
✈Significantly higher dividends for 2016 due to earnings improvement
✈Investments in quality and capacities of about € 100 million (€ 16 million for expansion of Air Cargo Center, € 50 million for Office Park 4 and much more in the coming years)
✈Focus in 2017 on further expansion and aggressive marketing of the Airport City and Vienna Airport Region
15

Share price development since January2012: market capitalisation over € 2 billion
16
50
100
150
200
250
300
350
400
FWAG ATX Benchmark (FRA, ADP, ZRH) average
+230%
+42%Reb
ased
to10
0
Share price development from January 1, 2012 to January 13, 2017
+117%

Outlook for 2017 – Further earningsimprovement expected
17
Outlook 2017 (Outlook 2016)
Revenue > € 740 million (> € 725 million)
EBITDA > € 315 million (> € 310 million)
Consolidated net profit > € 120 million (≥ € 115 million)
Net debt < € 350 million (≤ 400 million)
CAPEX > € 100 million (~ € 95 million)

THANK YOU FOR YOUR ATTENTION!
18