“flow valve” microfluidic devices for simple, detectorless, and label-free analyte quantitation
TRANSCRIPT
“Flow Valve” Microfluidic Devices for Simple, Detectorless, andLabel-Free Analyte QuantitationDebolina Chatterjee, Danielle S. Mansfield, Neil G. Anderson, Sudeep Subedi, and Adam T. Woolley*
Department of Chemistry and Biochemistry, Brigham Young University, Provo, Utah 84602, United States
ABSTRACT: Simplified analysis systems that offer theperformance of benchtop instruments but the convenienceof portability are highly desirable. We have developed novel,miniature devices that feature visual inspection readout of atarget’s concentration from a ∼1 μL volume of solutionintroduced into a microfluidic channel. Microchannels areconstructed within an elastomeric material, and channelsurfaces are coated with receptors to the target. When asolution is flowed into the channel, the target cross-linksmultiple receptors on the surface, resulting in constriction of the first few millimeters of the channel and stopping of flow.Quantitation is performed by measuring the distance traveled by the target solution in the channel before flow stops. A keyadvantage of our approach is that quantitation is accomplished by simple visual inspection of the channel, without the need forcomplex detection instrumentation. We have tested these devices using the model system of biotin as a receptor and streptavidinas the target. We have also characterized three factors that influence flow distance: solution viscosity, device thickness, andchannel height. We found that solution capillary flow distance scales with the negative logarithm of target concentration and havedetected streptavidin concentrations as low as 1 ng/mL. Finally, we have identified and evaluated a plausible mechanism whereintime-dependent channel constriction in the first few millimeters leads to concentration-dependent flow distances. Theirsimplicity coupled with performance makes these “flow valve” systems especially attractive for a host of analysis applications.
Advanced analysis systems have a number of importantdesired performance characteristics, namely, accuracy,
reliability, selectivity for target analytes, quantitation, lowdetection limits, simplicity, speed, cost, multiplexing, and soon. Frequently, there is a trade-off between these objectives(e.g., low cost vs high accuracy), requiring a compromise thatbest meets the analysis requirements. For example, theperformance of benchtop analyzers takes precedence overportability, while for point-of-care (POC) systems, versatilityand performance are often sacrificed in favor of convenience.A number of automated and robust laboratory-based systems
are available for analyses. Liquid chromatography1 is widelyused and has seen recent progress in stationary phases2,3 andwith increased pressures.4 Mass spectrometry methods5,6 haveadvanced through improved mass analyzers7 and sampleintroduction techniques.8 Spectroscopy can provide analyte-specific information from absorbance9 or Raman10 techniques.In addition, clinical diagnostic tools11 such as enzyme-linkedimmunosorbent assay (ELISA)12 are broadly used for targeteddetection of biomolecules of interest. The above examplesnicely illustrate systems with excellent performance, but thatcapability generally comes at the expense of portability.On the other hand, portable instruments offer significantly
increased analysis convenience. For example, POC diagnosticdevices have been implemented in monitoring blood glucosefor diabetes13 and in home pregnancy testing.14 Paper-basedmicrofluidic systems15−17 offer simplified analysis coupled withlow cost. These portable systems are advantageous in terms ofsimplicity and speed but this generally comes at the cost of
some performance characteristics such as low detection limits,quantitation capabilities, or multiplexing. In this paper wedescribe a simple, portable, and detectorless microdevicesystem with quantitation capabilities, ∼1 ng/mL detectionlimits, and potential for broad applicability, addressing keylimitations of both benchtop and portable systems.Our method involves the capillary flow of target solution
through a receptor-coated microchannel in a deformablematerial, which leads to channel constriction and flow stoppagedue to target-receptor interaction. Importantly, in this “flow-valve” method, the distance of capillary flow is correlated withthe target’s concentration, and the ability to differentiatebetween filled and empty channels visually enables detectorlessdetermination of flow distance and hence target concentration.Our use of flow distance as a quantitative detector is somewhatcomplementary to the work of Zhong et al.,18 who very recentlydemonstrated a microfluidic adsorption-length-based approachfor quantifying peptides, albeit requiring external massspectrometry detection. We have fabricated polydimethylsilox-ane (PDMS) devices and tested them with the model target-receptor system of streptavidin and biotin. Furthermore, wehave studied three factors that affect assay performance:solution viscosity, device material thickness, and channelheight. We have also measured the concentration dependenceof flow distance and assayed streptavidin solutions as dilute as 1
Received: May 14, 2012Accepted: July 26, 2012Published: July 26, 2012
Article
pubs.acs.org/ac
© 2012 American Chemical Society 7057 dx.doi.org/10.1021/ac301278s | Anal. Chem. 2012, 84, 7057−7063
ng/mL. Finally, we have evaluated the mechanism of channelclosure in these assays. Notably, the “flow valve” approachshould be adaptable to various target-receptor pairs, offering avery broadly applicable analysis method.
■ EXPERIMENTAL SECTION
Mold Design and Preparation. Molds were preparedusing a 500 μm thickness, 10 cm diameter glass wafer (Figure1A) with spun on AZ50XT positive photoresist (AZ ElectronicMaterials, Branchburg, NJ) of 5−20 μm thickness (Figure 1B).Next, photolithography was used to transfer the serpentine
design of the mask (Figure 2A) onto the glass wafer by UVexposure followed by development in AZ400K developer (AZElectronic Materials), resulting in elevated features of 50 μmwidth on the wafer (Figure 1C). Reflowing of photoresist19 wasthen done at 150 °C for 5 min to round the edges of theelevated features in the mold (Figure 1D).
PDMS Device Fabrication. Devices were fabricated bycasting PDMS against the positive relief mold. PDMS (DowCorning, Centennial, CO) was prepared by mixing the base andcuring agent in a 10:1 ratio, pouring it on the mold to athickness of 0.45−1.1 mm (Figure 1E), and heating to 80 °Cfor 45 min for curing. This PDMS was removed from the mold(Figure 1F) and bonded to an unpatterned PDMS layer(thickness, 0.4−1.1 mm) after exposure to an oxygen plasmafor 30 s20 to form a completed device with an embeddedchannel (Figure 1G). Fabrication reliability prevented the usageof devices with PDMS films thinner than ∼0.4 mm. Afterplasma bonding, devices were stored with water in the channelsto ensure that the surface remained hydrophilic.
Procedure for Experimentation. Experiments werecarried out on a biotin-streptavidin model system using thegeneral protocols given here. The water-filled microchannel wasfirst aspirated and then filled with biotinylated bovine serumalbumin (b-BSA, Thermo Scientific, Rockford, IL, 2 mg/mL in0.14 mM citrate, pH 6.8) or a control solution of BSA (Sigma-Aldrich, St. Louis, MO, 2 mg/mL in phosphate buffered saline,PBS) via capillary action. The b-BSA was allowed to adsorb tothe PDMS channel walls for 15 min, leaving exposed biotingroups. Then, the b-BSA solution was removed and the channelwas flushed with PBS (10 mM, pH 7.2) to remove unadsorbedmaterial. Finally, PBS was aspirated from the channel and a 1μL streptavidin solution (New England Biolabs, Ipswich, MA)of specified concentration in PBS was pipetted into thereservoir (see Figure 2C,D). The flow distance of streptavidinsolution in the microchannel was measured with a ruler, andphotographs were obtained with a digital camera. Some flowexperiments were also carried out with streptavidin solutionshaving added glycerol (0−36%) to explore the influence ofviscosity.
Flow Restriction Mechanism. Fluorescein sodium salt (80ng/mL, Spectrum, Gardena, CA) in PBS was mixed withunlabeled streptavidin or BSA as a control (both 500 μg/mL inPBS) and allowed to flow in 13 μm tall biotin-modifiedmicrochannels.Fluorescence signal was monitored using a CCD camera
(CoolSNAP HQ2, Photometrics, Tucson, AZ) attached to anupright microscope (Axio Scope, A1, Zeiss, Thornwood, NY).Illumination was provided by a 625 mW LED (MBLED,Thorlabs, Newton, NJ) that passed through a filter cube(FITC-LP01-Clinical-OMF, Semrock, Rochester, NY). Imageswere acquired using a 400 ms exposure time. Image acquisitionand data analysis were performed using Image J software. Thefluorescence signal from fluorescein in these images, integratedacross the channel at different flow distances, was obtained.From these traces, background subtracted and normalizedchannel fluorescence signal peak areas (proportional to channelcross-sectional areas) were obtained for flow solutionscontaining either streptavidin or BSA (control).Contact angles of streptavidin solution droplets of different
concentrations on biotinylated PDMS substrates were meas-ured using a contact angle goniometer (Rame-Hart, Succa-sunna, NJ).
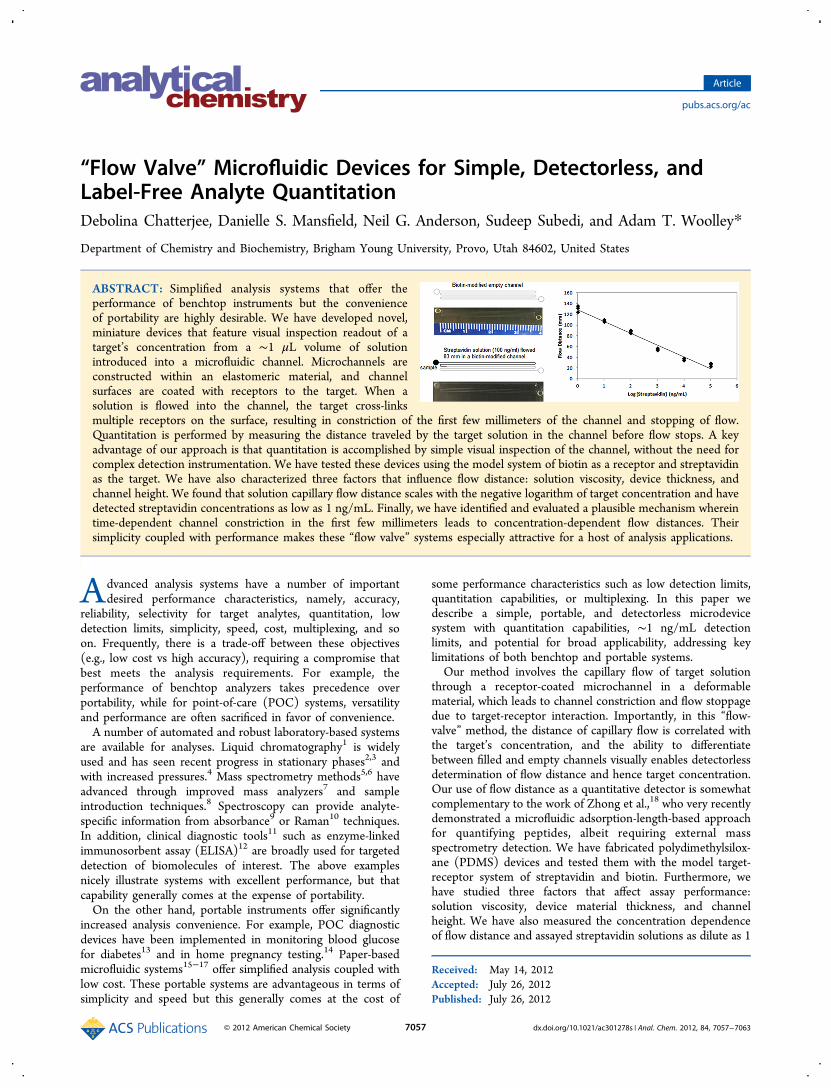
Figure 1. “Flow valve” device fabrication and channel closure process.Microchannel and PDMS layer dimensions are not shown to scale. (A)Glass wafer (gray). (B) AZ50XT positive photoresist (black) spun onwafer. (C) Photolithographic patterning to form a mold with elevatedfeature using UV exposure and development with AZ400K developer.(D) Reflowing of photoresist at 150 °C for 5 min to yield a curvedfeature. (E) PDMS cured (80 °C, 45 min) on mold. (F) Cured PDMSreleased. (G) Plasma bonding to enclose the microchannel. (H) Crosssection zoom view of the open channel in part G coated withreceptors. (I) Zoom view (∼1000×) of the boxes in part H, showingreceptors on the top and bottom channel walls. (J) Cross section of apartially closed channel. (K) Zoom view (∼1000× ) of the box in partJ, showing receptor-target interaction leading to channel closure.
Analytical Chemistry Article
dx.doi.org/10.1021/ac301278s | Anal. Chem. 2012, 84, 7057−70637058
■ RESULTS AND DISCUSSION
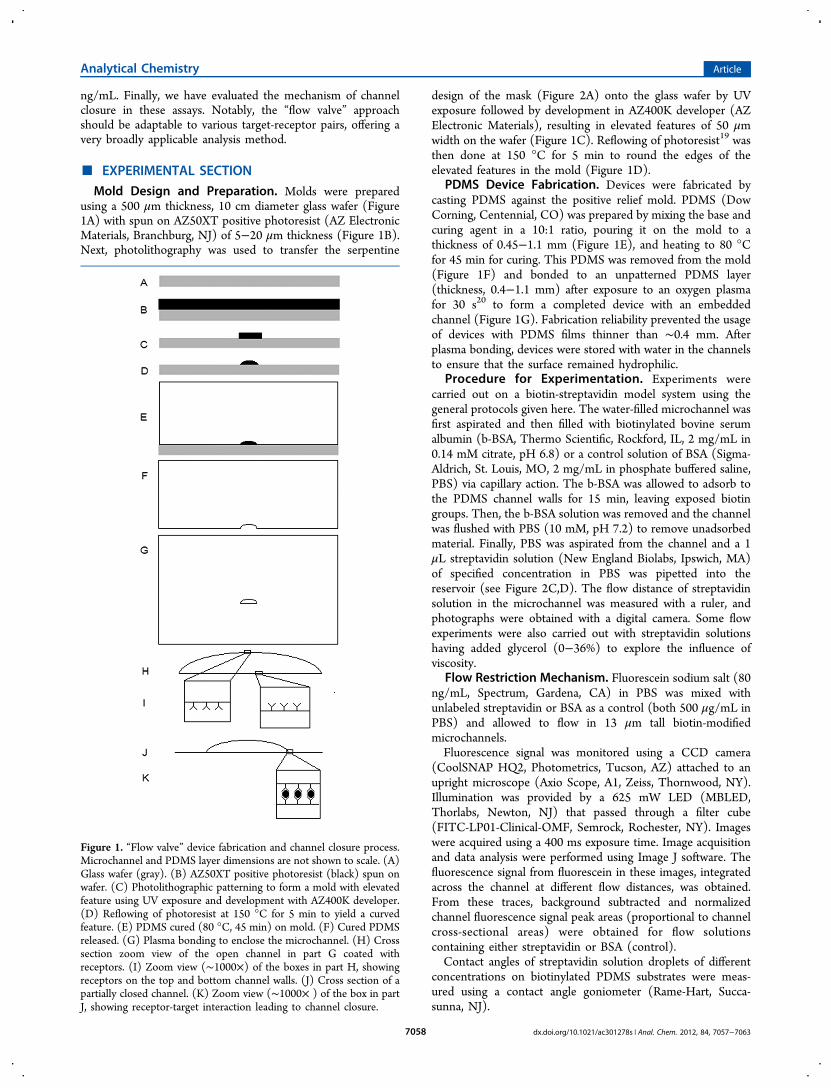
Experiments on a model system, biotin-streptavidin, wereconducted to test the devices and enable their optimization. Westudied the effects on flow distance of channel height andshape, PDMS cover layer thickness, and solution viscosity. Wealso probed the mechanism through which channel closureaffects flow. Figure 2 shows a few examples of the data resultingfrom “flow valve” assays. Unfilled flow channels are easily seenin the photographs (e.g., Figure 2A) and similarly under simplevisual inspection. In contrast, microchannels containing liquid,as demonstrated in Figure 2B, are no longer seen readily.Initial experiments were conducted on 35 mm long, 58 μm
wide channels with a 1.1 mm thick PDMS cover layer.Channels with a height <5 μm usually became blocked by theflow of only water or during coating with b-BSA, either becauseof channel deformation due to capillary forces or due to surfacecross-linking during BSA adsorption. In a revised device designwith slightly taller microchannels (5.2 μm) and a PDMS coverlayer thickness of 0.7 mm, a 1.0 mg/mL streptavidin solutiontraveled 10 mm, and a 0.88 mg/mL streptavidin solutiontraveled 15 mm, while solutions lacking streptavidin flowed thefull length (35 mm) of the b-BSA coated channel. Whenglycerol was added to a 28% concentration, a solution with astreptavidin concentration of 60 μg/mL flowed 30 mm in a 5.2μm tall channel with a 0.7 mm PDMS cover layer thickness.These experiments identified three assay parameters (channelheight, cover layer thickness, and solution viscosity) that couldbe altered to affect the dynamic range and limit of detection for“flow valve” experiments. Reproducible results for these initialdevice designs were still somewhat difficult to obtain, which weattribute to the above-noted blockage issues associated withrelatively shallow channels.A curved channel cross-section (Figure 1G) was necessary
for channel constriction, probably because pinching shut fromthe sides toward the center was possible with this geometry(see Figure 1H, J). We did flow experiments with curved andrectangular cross-section channels coated with biotin (both 58
μm wide and 5.2 μm tall with a 0.7 mm PDMS top layerthickness); 1.0 mg/mL streptavidin solution flowed only 10mm in the curved cross-section channel before flow stopped,but the same solution flowed the full length of the rectangularcross-section channel. Our results with this channel geometryare also consistent with published work showing that a curvedchannel is easier to close than a rectangular channel for valvesactuated by external pressure.21
Building on these initial studies, we further characterized thethree factors that affected channel closure: solution viscosity,PDMS cover layer thickness, and channel height. We varied oneparameter while holding others constant and observed anyeffects on the flow distance. We also used taller (13−17 μm)channels to avoid some of the issues previously seen withshallower ones. When a higher streptavidin concentration (10μg/mL) was introduced into a biotin-modified channel (Figure2C), more rapid cross-linking of the biotin anchored to thesurface in the first few millimeters of the channel length led tofaster constriction at the start of the channel and a shortercapillary flow distance traveled by the streptavidin solution. Onthe other hand, when a lower concentration of streptavidinsolution (100 ng/mL) was loaded (Figure 2D), slower cross-linking led to a greater capillary flow distance for thestreptavidin solution before constriction in the first fewmillimeters of the channel stopped flow. A more in-depthdiscussion of this hypothesized mechanism of channel closureand flow stoppage is provided later.The effect of solution viscosity on the flow distance was
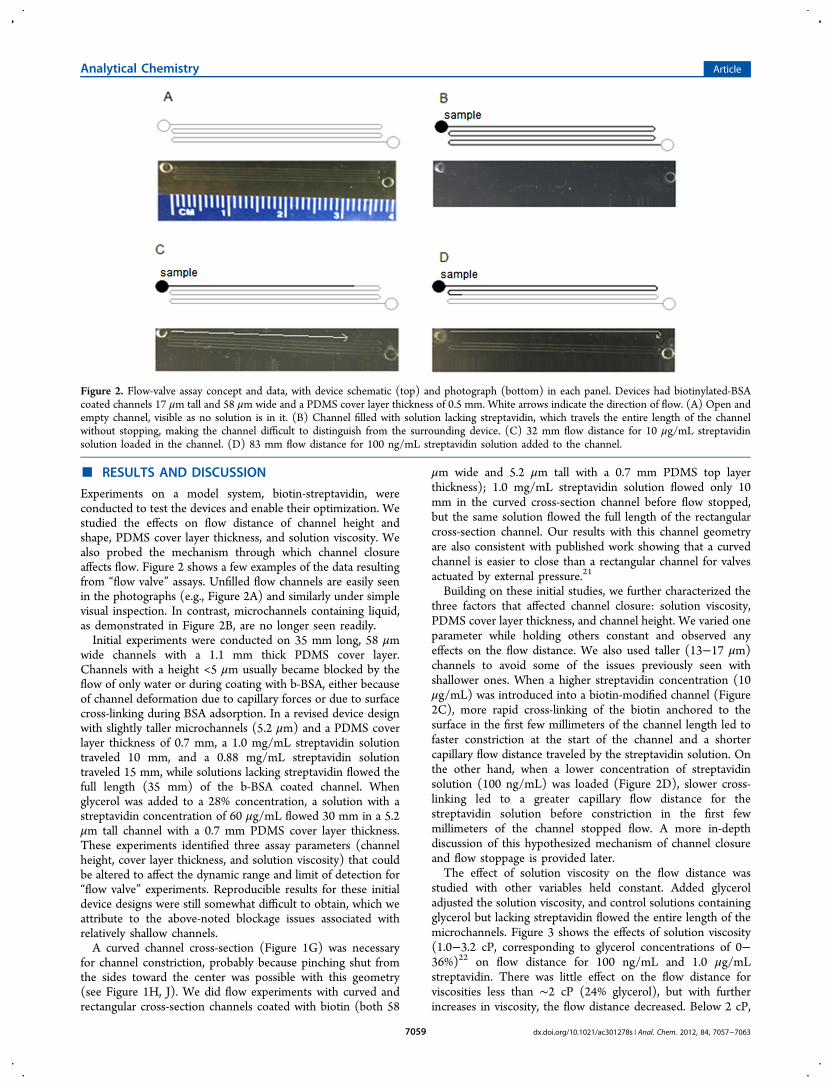
studied with other variables held constant. Added glyceroladjusted the solution viscosity, and control solutions containingglycerol but lacking streptavidin flowed the entire length of themicrochannels. Figure 3 shows the effects of solution viscosity(1.0−3.2 cP, corresponding to glycerol concentrations of 0−36%)22 on flow distance for 100 ng/mL and 1.0 μg/mLstreptavidin. There was little effect on the flow distance forviscosities less than ∼2 cP (24% glycerol), but with furtherincreases in viscosity, the flow distance decreased. Below 2 cP,
Figure 2. Flow-valve assay concept and data, with device schematic (top) and photograph (bottom) in each panel. Devices had biotinylated-BSAcoated channels 17 μm tall and 58 μm wide and a PDMS cover layer thickness of 0.5 mm. White arrows indicate the direction of flow. (A) Open andempty channel, visible as no solution is in it. (B) Channel filled with solution lacking streptavidin, which travels the entire length of the channelwithout stopping, making the channel difficult to distinguish from the surrounding device. (C) 32 mm flow distance for 10 μg/mL streptavidinsolution loaded in the channel. (D) 83 mm flow distance for 100 ng/mL streptavidin solution added to the channel.
Analytical Chemistry Article
dx.doi.org/10.1021/ac301278s | Anal. Chem. 2012, 84, 7057−70637059
the solution viscosity also had little effect on flow velocity (10−12 s to flow 80 mm, with or without glycerol). However, above2 cP, the solution viscosity led to slower solution flow throughthe channel that increased the time for biotin-streptavidininteraction and closure of the first few millimeters of thechannel. Thus, the distance solution traveled before channelconstriction restricted flow was shorter for both concentrationsof streptavidin. The 100 ng/mL solutions traveled a greaterdistance than the 1.0 μg/mL ones, in line with expectations. Wefurther found that added glycerol could be used to adjust thelinear range for detection for a given microchannel length,although adding glycerol increased the assay complexitycompared to flowing solution without viscosity adjustment.Indeed, flow experiments done in duplicate in glycerol-adjusted3.0 cP solutions in biotin-modified 17 μm tall channels yieldedthe following results: control solutions lacking streptavidinflowed 95 and 100 mm; solutions containing 1 ng/mLstreptavidin flowed 56 and 67 mm; and 100 pg/mL streptavidinsolutions (a factor of 10 lower concentration than we have beenable to detect reliably in 1.0 cP solutions) flowed 71 and 84mm. It is also valuable to understand the viscosity dependenceof flow distance in these devices for possible future work withviscous samples like blood.The effect of PDMS cover layer thickness on the flow
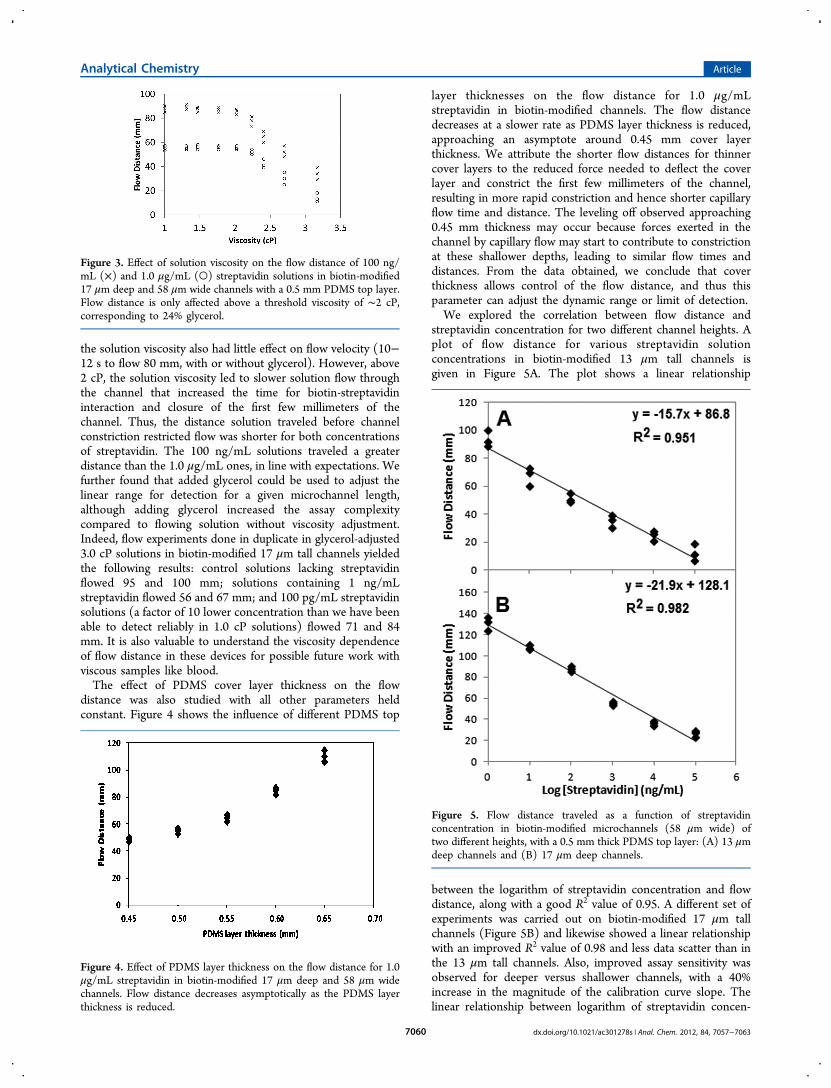
distance was also studied with all other parameters heldconstant. Figure 4 shows the influence of different PDMS top
layer thicknesses on the flow distance for 1.0 μg/mLstreptavidin in biotin-modified channels. The flow distancedecreases at a slower rate as PDMS layer thickness is reduced,approaching an asymptote around 0.45 mm cover layerthickness. We attribute the shorter flow distances for thinnercover layers to the reduced force needed to deflect the coverlayer and constrict the first few millimeters of the channel,resulting in more rapid constriction and hence shorter capillaryflow time and distance. The leveling off observed approaching0.45 mm thickness may occur because forces exerted in thechannel by capillary flow may start to contribute to constrictionat these shallower depths, leading to similar flow times anddistances. From the data obtained, we conclude that coverthickness allows control of the flow distance, and thus thisparameter can adjust the dynamic range or limit of detection.We explored the correlation between flow distance and
streptavidin concentration for two different channel heights. Aplot of flow distance for various streptavidin solutionconcentrations in biotin-modified 13 μm tall channels isgiven in Figure 5A. The plot shows a linear relationship
between the logarithm of streptavidin concentration and flowdistance, along with a good R2 value of 0.95. A different set ofexperiments was carried out on biotin-modified 17 μm tallchannels (Figure 5B) and likewise showed a linear relationshipwith an improved R2 value of 0.98 and less data scatter than inthe 13 μm tall channels. Also, improved assay sensitivity wasobserved for deeper versus shallower channels, with a 40%increase in the magnitude of the calibration curve slope. Thelinear relationship between logarithm of streptavidin concen-
Figure 3. Effect of solution viscosity on the flow distance of 100 ng/mL (×) and 1.0 μg/mL (○) streptavidin solutions in biotin-modified17 μm deep and 58 μm wide channels with a 0.5 mm PDMS top layer.Flow distance is only affected above a threshold viscosity of ∼2 cP,corresponding to 24% glycerol.
Figure 4. Effect of PDMS layer thickness on the flow distance for 1.0μg/mL streptavidin in biotin-modified 17 μm deep and 58 μm widechannels. Flow distance decreases asymptotically as the PDMS layerthickness is reduced.
Figure 5. Flow distance traveled as a function of streptavidinconcentration in biotin-modified microchannels (58 μm wide) oftwo different heights, with a 0.5 mm thick PDMS top layer: (A) 13 μmdeep channels and (B) 17 μm deep channels.
Analytical Chemistry Article
dx.doi.org/10.1021/ac301278s | Anal. Chem. 2012, 84, 7057−70637060
tration and flow distance across a broad swath of concen-trations in different channel heights highlights the widedynamic range for this method. The lowest quantifiedstreptavidin concentration was 1.0 ng/mL, with flow distancesof ∼100 mm for 13 μm tall channels and ∼130 mm for 17 μmtall channels, with potential to detect lower streptavidinconcentrations using longer channels. This very low detectionlimit compared to the ∼0.2 μg/mL protein detection limits inpaper-based assays17,23 and excellent quantitation capabilitymarks an important improvement in performance for simple,rapid, and inexpensive assays.We have evaluated and eliminated several plausible
explanations for the observed flow behavior that do not involvechannel constriction. We measured contact angles of solutionsof different streptavidin concentrations (1 ng/mL−100 μg/mL) on b-BSA coated PDMS to be 25−26°. Thus, themechanism of flow stoppage is clearly not linked toconcentration-dependent changes in surface wettability ortension. In addition, flow experiments on buffer solutionslacking streptavidin were performed in biotin-modified 13 μmtall PDMS microchannels with 0.45 and 0.5 mm cover layers.These solutions flowed the entire channel length, indicatingthat the flow stoppage was not due to any pressure drop orchannel constriction caused by capillary action. Finally, flowwas unaffected by nonspecific adsorption, as streptavidinsolutions from 1 ng/mL to 100 μg/mL in 13 μm tall channelscoated with BSA (lacking biotin) flowed the entire channeldistance. Thus nonspecific adsorption, which is a significantproblem for conventional immunoassays, appears not to play amajor role in our “flow valve” devices, showing promisingpotential for extension to other assay systems.We further explored the mechanism of flow stoppage via
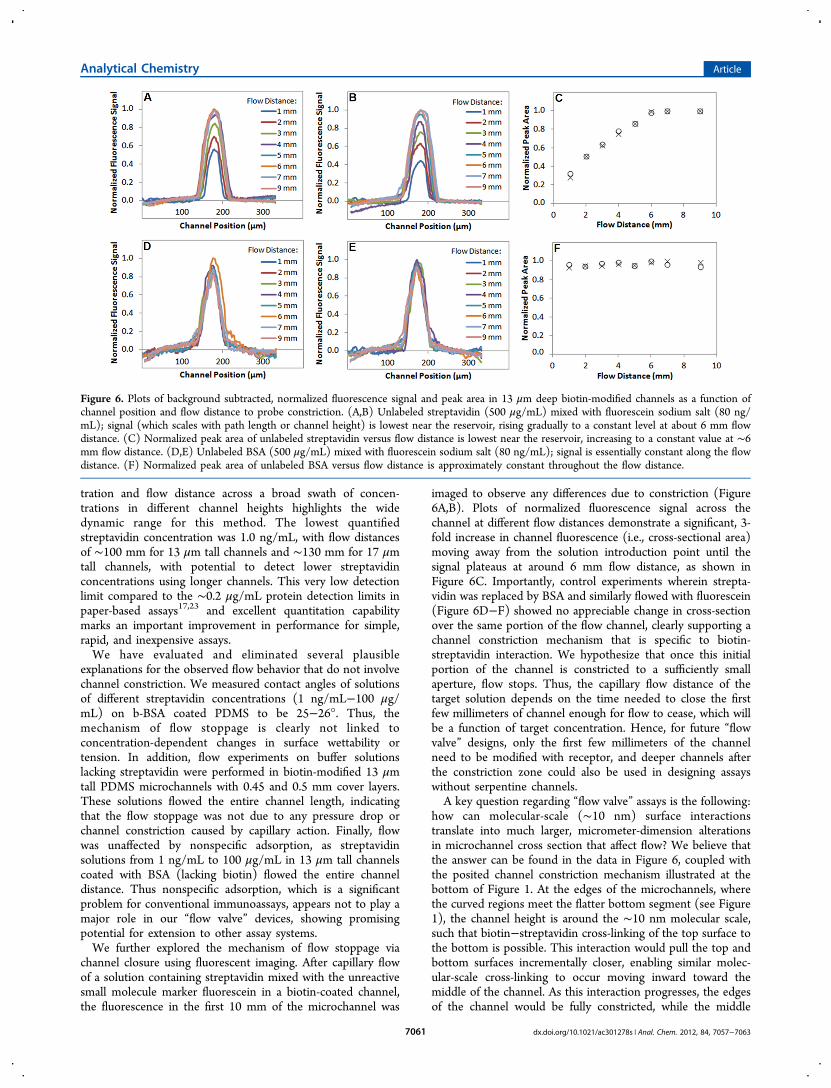
channel closure using fluorescent imaging. After capillary flowof a solution containing streptavidin mixed with the unreactivesmall molecule marker fluorescein in a biotin-coated channel,the fluorescence in the first 10 mm of the microchannel was
imaged to observe any differences due to constriction (Figure6A,B). Plots of normalized fluorescence signal across thechannel at different flow distances demonstrate a significant, 3-fold increase in channel fluorescence (i.e., cross-sectional area)moving away from the solution introduction point until thesignal plateaus at around 6 mm flow distance, as shown inFigure 6C. Importantly, control experiments wherein strepta-vidin was replaced by BSA and similarly flowed with fluorescein(Figure 6D−F) showed no appreciable change in cross-sectionover the same portion of the flow channel, clearly supporting achannel constriction mechanism that is specific to biotin-streptavidin interaction. We hypothesize that once this initialportion of the channel is constricted to a sufficiently smallaperture, flow stops. Thus, the capillary flow distance of thetarget solution depends on the time needed to close the firstfew millimeters of channel enough for flow to cease, which willbe a function of target concentration. Hence, for future “flowvalve” designs, only the first few millimeters of the channelneed to be modified with receptor, and deeper channels afterthe constriction zone could also be used in designing assayswithout serpentine channels.A key question regarding “flow valve” assays is the following:
how can molecular-scale (∼10 nm) surface interactionstranslate into much larger, micrometer-dimension alterationsin microchannel cross section that affect flow? We believe thatthe answer can be found in the data in Figure 6, coupled withthe posited channel constriction mechanism illustrated at thebottom of Figure 1. At the edges of the microchannels, wherethe curved regions meet the flatter bottom segment (see Figure1), the channel height is around the ∼10 nm molecular scale,such that biotin−streptavidin cross-linking of the top surface tothe bottom is possible. This interaction would pull the top andbottom surfaces incrementally closer, enabling similar molec-ular-scale cross-linking to occur moving inward toward themiddle of the channel. As this interaction progresses, the edgesof the channel would be fully constricted, while the middle
Figure 6. Plots of background subtracted, normalized fluorescence signal and peak area in 13 μm deep biotin-modified channels as a function ofchannel position and flow distance to probe constriction. (A,B) Unlabeled streptavidin (500 μg/mL) mixed with fluorescein sodium salt (80 ng/mL); signal (which scales with path length or channel height) is lowest near the reservoir, rising gradually to a constant level at about 6 mm flowdistance. (C) Normalized peak area of unlabeled streptavidin versus flow distance is lowest near the reservoir, increasing to a constant value at ∼6mm flow distance. (D,E) Unlabeled BSA (500 μg/mL) mixed with fluorescein sodium salt (80 ng/mL); signal is essentially constant along the flowdistance. (F) Normalized peak area of unlabeled BSA versus flow distance is approximately constant throughout the flow distance.
Analytical Chemistry Article
dx.doi.org/10.1021/ac301278s | Anal. Chem. 2012, 84, 7057−70637061
would remain partially open (i.e., Figure 1J,K). Importantly, thedata in Figure 6A,B are indicative of exactly this type of changein the cross-sectional channel profile induced by streptavidinsolution flow, strongly supporting our hypothesized mecha-nism. In further support of surface intermolecular interactionsleading to channel constriction, we have carried out simpleforce calculations. A typical surface density of b-BSA moleculesis 6 × 10¹⁶/m2,24 while the force needed to unbind one biotin−streptavidin molecular pair has been measured as 200−300pN.25,26 Hence, the force per area exerted by biotin-streptavidinsurface interactions would be at least 1.2 × 10⁷ N/m2, or 1740psi, which is over a factor of 100 greater than the 5−10 psineeded to completely close similarly shaped PDMS microfluidicvalves.21 Thus, we conclude that molecular-scale interactionshave sufficient force to induce channel constriction and that theoccurrence of such interactions from the edges toward thecenter of a microchannel is both plausible and consistent withthe channel imaging data we have obtained.Several matters must be considered as we look toward
extending this assay method beyond biotin-streptavidin.Receptors must recognize at least two distinct sites on thetarget to cross-link channels. Streptavidin readily meets thiscriterion with four biotin binding sites. Polyclonal antibodies ortwo different monoclonal antibodies to a target wouldrecognize different epitopes and should also cause receptor-mediated cross-linking of microchannels in response to anantigen target. Additionally, hybridization of a target nucleicacid sequence to complementary surface-attached single-stranded oligonucleotides should mediate microchannelclosure. Are antigen−antibody or base pairing interactionsstrong enough to develop “flow valve” assays? The unbindingforces for target-receptor pairs have been studied by scanningprobe microscopy and were 200−300 pN25,26 per biotin-streptavidin molecular pair. The measured unbinding force for asingle antigen−antibody pair is 50−60 pN,27−29 which is lessthan biotin-streptavidin by a small factor of 3−6 that couldlikely be accommodated through adjusting device parameters.The unbinding force for hybridized DNA oligonucleotides,depending on the sequence and number of base pairs, rangesfrom 450 pN30 for 14-mer sequences to 2700 pN for 20-base-long hybridized pairs.31 These published unbinding data affirmthe likely feasibility of generalization of “flow valve” systemsbeyond biotin-streptavidin measurements to nucleic acidhybridization and antigen−antibody interactions.
■ CONCLUSIONSWe have demonstrated a detectorless microfluidic approach forquantifying target analytes through simple visual inspection ofcapillary flow distance in a microchannel. We have identifiedand characterized three important parameters (solutionviscosity, PDMS cover layer thickness, and channel height)that affect the flow distance in these assays for the biotin-streptavidin model system. In addition, we found a linearrelationship between flow distance in biotin-modified channelsand logarithm of streptavidin concentration over a 100 000-foldrange of concentrations. Moreover, we identified and studied aplausible mechanism of channel constriction and how this leadsto concentration-dependent flow distances. Importantly, wehave measured streptavidin concentrations as low as 1 ng/mLusing these microsystems, demonstrating low detection limits,with potential for future improvement. “Flow valve” micro-fluidic devices show great promise for simplified, low cost, buthigh performance chemical analysis that could be extended to
antigen and nucleic acid determinations. “Flow valve” systemsare especially promising for POC testing due to their portabilityand detectorless and label-free quantitation.
■ AUTHOR INFORMATIONCorresponding Author*E-mail: [email protected].
NotesThe authors declare no competing financial interest.
■ ACKNOWLEDGMENTSWe thank Prof. Paul Farnsworth for helpful suggestions abouttesting the mechanism of flow stoppage and Prof. MatthewLinford for letting us use his goniometer. This work wassupported by the National Institutes of Health (Grant R01EB006124).
■ REFERENCES(1) LaCourse, W. R. Anal. Chem. 2002, 74, 2813−2831.(2) Svec, F. J. Chromatogr., A 2010, 1217, 902−924.(3) Li, Y.; Lee, M. L. J. Sep. Sci. 2009, 32, 3369−3378.(4) Jorgenson, J. W. Annu. Rev. Anal. Chem. 2010, 3, 129−150.(5) Aebersold, R.; Goodlett, D. R. Chem. Rev. 2001, 101, 269−295.(6) Griffiths, W. J.; Wang, Y. Chem. Soc. Rev. 2009, 38, 1882−1896.(7) Perry, R. H.; Cooks, R. G.; Noll, R. J. Mass. Spectrom. Rev. 2008,27, 661−699.(8) Harris, G. A.; Galhena, A. S.; Fernandez, F. M. Anal. Chem. 2011,83, 4508−4538.(9) Gillie, J. K.; Hochlowski, J.; Arbuckle-Keil, G. A. Anal. Chem.2000, 72, 71R−79R.(10) Mulvaney, S. P.; Keating, C. D. Anal. Chem. 2000, 72, 145R−157R.(11) Kaplan, L. A.; Pesce, A. J. Clinical Chemistry: Theory, Analysis,Correlation, 5th ed.; Elsevier: Amsterdam, The Netherlands, 2010.(12) Zhang, H.; Wang, S.; Fang, G. J. Immunol. Meth. 2011, 368, 1−23.(13) Vashist, S. K.; Zheng, D.; Al-Rubeaan, K.; Luong, J. H. T.; Sheu,F.-S. Anal. Chim. Acta 2011, 703, 124−136.(14) Tomlinson, C.; Marshall, J.; Ellis, J. E. Curr. Med. Res. Opin.2008, 24, 1645−1649.(15) Martinez, A. W.; Phillips, S. T.; Butte, M. J.; Whitesides, G. M.Angew. Chem., Int. Ed. 2007, 46, 1318−1320.(16) Dungchai, W.; Chailapakul, O.; Henry, C. S. Analyst 2011, 136,77−82.(17) Liu, H.; Crooks, R. M. J. Am. Chem. Soc. 2011, 133, 17564−17566.(18) Zhong, M.; Lee, C. Y.; Croushore, C. A.; Sweedler, J. V. LabChip 2012, 12, 2037−2045.(19) Barber, J. P.; Lunt, E. J.; George, Z. A.; Yin, D.; Schmidt, H.;Hawkins, A. R. IEEE Photon. Technol. Lett. 2006, 18, 28−30.(20) Duffy, D. C.; McDonald, J. C.; Schueller, O. J. A.; Whitesides, G.M. Anal. Chem. 1998, 70, 4974−4984.(21) Unger, M. A.; Chou, H.-P.; Thorsen, T.; Scherer, A.; Quake, S.R. Science 2000, 288, 113−116.(22) Sheely, M. L. Indust. Eng. Chem. 1932, 24, 1060−1064.(23) Martinez, A. W.; Phillips, S. T.; Butte, M. J.; Whitesides, G. M.Angew. Chem., Int. Ed. 2007, 46, 1318−1320.(24) Sun, Y. S.; Landry, J. P.; Fei, Y. Y.; Zhu, X. D.; Luo, J. T.; Wang,X. B.; Lam, K. S. Anal. Chem. 2009, 81, 5373−5380.(25) Wong, S. S.; Joselevich, E.; Woolley, A. T.; Cheung, C. L.;Lieber, C. M. Nature 1998, 394, 52−55.(26) Moy, V. T.; Florin, E.-L.; Gaub, H. E. Science 1994, 266, 257−259.(27) Allen, S.; Chen, X.; Davies, J.; Davies, M. C.; Dawkes, A. C.;Edwards, J. C.; Roberts, C. J.; Sefton, J.; Tendler, S. J. B.; Williams, P.M. Biochemistry 1997, 36, 7457−7463.
Analytical Chemistry Article
dx.doi.org/10.1021/ac301278s | Anal. Chem. 2012, 84, 7057−70637062

(28) Ros, R.; Schwesinger, F.; Anselmetti, D.; Kubon, M.; Schafer, R.;Pluckthun, A.; Tiefenauer, L. Proc. Natl. Acad. Sci. U.S.A. 1998, 95,7402−7405.(29) Harada, Y.; Kuroda, M.; Ishida, A. Langmuir 2000, 16, 708−715.(30) Noy, A.; Vezenov, D. V.; Kayyem, J. F.; Meade, T. J.; Lieber, C.M. Chem. Biol. 1997, 4, 519−527.(31) Mazzola, L. T.; Frank, C. W.; Fodor, S. P. A.; Mosher, C.;Lartius, R.; Henderson, E. Biophys. J. 1999, 76, 2922−2933.
Analytical Chemistry Article
dx.doi.org/10.1021/ac301278s | Anal. Chem. 2012, 84, 7057−70637063