flow-excited acoustic resonance in industry
TRANSCRIPT

Flow Induced Vibration, Zolotarev & Horacek eds. Institute of Thermomechanics, Prague, 2008
FLOW-EXCITED ACOUSTIC RESONANCE IN INDUSTRY
Samir Ziada McMaster University, Hamilton, Ontario, Canada
ABSTRACT The excitation mechanism of acoustic resonances
has long been recognized, but industry continues to be plagued by its undesirable consequences; manifested in severe vibration and noise problems in a wide range of industrial applications. The talk will focus on the nature of the acoustic resonance excitation mechanism and some basic design considerations to predict its onset and intensity. Two industrial examples involving flow-excited acoustic resonance of closed side-branches are presented. The first example deals with acoustic fatigue failure of the steam dryer in a boiling water reactor (BWR) due to acoustic resonance in the main steam piping system whereas the second example considers acoustic resonances in the roll posts of the STOVL Joint Strike Fighter (JSF). In both examples, effective means to alleviate the acoustic resonance mechanism are discussed.
1. INTRODUCTION Flow-excited acoustic resonances are often
encountered in many engineering applications involving internal or external flows. The acoustic pressure associated with such resonances can cause severe noise and vibration problems and, in some cases, endanger the structural integrity of the installation. Flow-excited acoustic resonance has been reported for piping systems conveying gas or liquid flows, flow control devices, turbomachines, boilers, heat exchangers, jet engines, cavities in moving vehicles, and many other applications. In the majority of these examples, the resonance is excited by unstable separated flows, such as shear layers, jets, or bluff body wakes. Rockwell & Naudascher (1979) classified this excitation mechanism of acoustic resonance as fluid-resonant in contrast to the fluid-dynamic mechanism, which generates self-sustained oscillations of impinging shear flows in the absence of resonance effects. In the fluid-resonant mechanism, which is the subject matter of this paper, the upstream feedback event, which sustains the oscillation, is provided by the resonant sound field. At the upstream separation edge, the sound field induces velocity perturbations in the unstable separated flow. Blevins (1985) and Hall et al. (2003), for example, have illustrated that
sound can shift the frequency of vortex formation from the natural frequency. As the initial perturbations travel downstream, they are amplified by the flow instability into vortical structures. Further downstream, the phase of the resonant sound field becomes favorable and the vortical structures generate acoustic energy which sustains the resonance of the acoustic mode. The main events of this excitation mechanism are schematically illustrated in Fig. 1 for the case of flow over the mouth of a closed side-branch. This flow geometry is encountered in many industrial applications and is therefore the main topic of this paper.
Figure 1: Schematic presentation of flow-excited acoustic resonance mechanism.
Substantial progress in understanding and
modeling the acoustic resonance mechanism has been achieved since Howe (1975, 1984) formulated his acoustic analogy in which vorticity is identified as a source of sound. He showed that the instantaneous acoustic power, P, generated by vorticity, ω, within a fluid volume, ∀, can be expressed as
P = - ρ ∫ u . (ω x v) d∀ (1)
where ρ is the fluid density, v is the fluid velocity and u is the particle velocity of the sound field. Whether vorticity acts as an acoustic source or sink, depends on the triple product in equation (1). Resonances are self-generated if the integral of

equation (1) over an acoustic cycle is positive, which imposes a phase condition on the timing of vortex convection within the resonant sound field. Figure 2 illustrates this phenomenon for the case of a deep cavity resonance. During the earlier part of the oscillation cycle, the particle velocity is downwards and the vortex absorbs acoustic energy, whereas during the latter part, the particle velocity is upwards and the vortex generates acoustic energy. The net acoustic energy over a complete cycle is positive in this case because the vortex is more developed, or stronger, and therefore it generates a larger amount of energy during the latter part of the cycle, than it absorbs during the earlier part.
Figure 2: Flow visualization and acoustic particle velocity at two different time instants during the acoustic resonance cycle of a deep cavity.
Stoneman et al. (1988), Bruggeman et al. (1989,
1991), Hourigan et al. (1986, 1990), Tan et al. (2003), Mohany and Ziada (2007), and others have used Howe’s theory to explore the nature of the aeroacoustic sources and to develop phenomeno-logical models or numerical methods to predict the onset and the intensity of resonance. Although these models and numerical methods have been successful in predicting the pulsation amplitude at resonance for two-dimensional applications, they are not suitable for the majority of industrial applications which involve non-linear flow-sound interaction in three-dimensional complex flows.
This paper focuses on flow-excited acoustic resonance of closed side-branches. First, a design guide that can be used to predict the onset and the intensity of resonance is introduced. This includes a Strouhal number chart to predict the critical flow velocity at the onset of resonance. In addition, a design chart to estimate the aeroacoustic source strength, which represents the shear layer excitation, is also presented and its use to predict the amplitude of pressure pulsation is demonstrated.
Finally, two industrial examples involving flow-excited acoustic resonance of closed side-branches are described. In both examples, effective means to alleviate the acoustic resonance mechanism are discussed.
2. ACOUSTIC RESONANCE OF CLOSED SIDE-BRANCHES: A DESIGN GUIDE
2.1. Onset of Resonance Ziada and Shine (1999) performed a series of
experiments on single, tandem and co-axial arrangements of closed side-branches (Fig. 3) to investigate the effects of the flow and geometric parameters on the critical Strouhal number (So=fd/Vo) at which acoustic resonances are initiated. These arrangements have substantially different radiation losses. The effects of viscous and heat conduction losses were also investigated by altering the test static pressure and the length of the branches. The test results showed that although radiation, viscous and heat conduction losses do strongly influence the maximum pulsation amplitude at resonance, these losses were found to have negligible effect on the critical Strouhal number at the onset of resonance. Typical results are reproduced in Fig. 4 for the co-axial case. The maximum pulsation amplitude and the lock-in range are seen to be dependent on the branch length. However, the resonance in all three cases is initiated at the same critical Strouhal number (So).
Figure 3: Various arrangements of closed side-branches and associated acoustic pressure distributions of the first acoustic mode. The arrows in the bottom figures indicate the acoustic flux of the resonant acoustic modes (Ziada & Shine, 1999).
Sound Power = - ρ ∫ u . (ω x v) d∀
v
u
vv
u
v
u
V
vv
u
VV
ωx v
ωx v
Single Co-axialTandemSingle Co-axialTandem

Strouhal No, fd/V
Onse
t of
reso
nan
ceS
o
Increasing flowvelocity
0.1 0.3 0.70.50
5
10
15D
imen
sion
less
am
plit
ude
Strouhal No, fd/V
Onse
t of
reso
nan
ceS
o
Increasing flowvelocity
0.1 0.3 0.70.50
5
10
15D
imen
sion
less
am
plit
ude
d/D = 0.57
0.25
0.135
L /D
d/D
L
d/D = 0.57
0.25
0.135
L /D
d/D
L
P1
P2
∆P= P1–P2
u
V
P1
P2
∆P= P1–P2
u
V
Figure 4: Acoustic response of coaxial side-branches showing the effect of the branch length L (i.e., the effect of acoustic attenuation). ∆, L=61cm, PS=3.5bar; ○, L=110cm, PS=4bar; ▲, L=158.5cm, PS=4bar (Ziada & Shine 1999).
On the other hand, the geometric parameters were
found to strongly affect the critical Strouhal number. These parameters include the diameter ratio (d/D) and the distance of the branch from the nearest upstream elbow, which affects the shape of the velocity profile approaching the branch. The test results of this investigation have been used to develop the Strouhal number chart shown in Fig. 5 (Ziada and Shine, 1999). This chart can be used to predict the critical flow velocity (Vo) in the main pipe at which acoustic resonances may be initiated.
If the maximum flow velocity of the installation Vmax is found to be higher than Vo, design modifications should be adopted to increase Vo above Vmax. This can be achieved by enlarging the branch inlet diameter to reduce the excitation frequency, or by shortening the branch length to increase the resonance frequency. If these modifications are not feasible or insufficient, the pulsation amplitude at resonance should be estimated as outlined in the following section.
2.2. Amplitude of Pulsation
When the side-branch is at resonance, the excitation mechanism becomes highly non-linear. In order to estimate the amplitude of pulsation, the shear layer instability and its interaction with the resonant sound field must be described by means of the non-linear theory. This difficult approach becomes even more complex and cost prohibitive for industrial applications involving high Reynolds number pipe flows which are normally rather turbulent and three dimensional.
Figure 5: Design chart of critical Strouhal number (So=f d/Vo) at the onset of resonance (Ziada & Shine 1999).
Figure 6: Model of the aeroacoustic source resulting from the interaction of the shear layer oscillation with the resonant sound field.
Graf and Ziada (1992) suggested describing the
integrated effect of the shear layer excitation by means of an experimentally determined complex source term. They also measured the amplitude and the phase of this source term for a wide range of Strouhal number and sound pressure level, the latter is expressed by the dimensionless acoustic particle velocity (u/V). As shown in Fig. 6, this source term, Q, represents the ratio between the induced acoustic pressure difference across the shear layer, ∆P, and the acoustic particle velocity at the mouth of the branch, u. This ratio is normalized by the dynamic head, ½ ρV2, and the mean velocity, V, in the main pipe. Thus, the source term Q has the form of dimensionless acoustic impedance:

Real Q
u/V=
S=0.4
S=0.5
S=0.3
S=0.6
Imag Q
S=0.7
Real Q
u/V=
S=0.4
S=0.5
S=0.3
S=0.6
Imag Q
S=0.7
VuVPQ
221 ρ∆
= (2)
Figure 7 shows the measured source term in the
complex Q-plane. The Strouhal number, S, and the acoustic particle velocity, u/V, are taken as parameters. Since the interaction mechanism between the shear layer and the sound field is strongly non-linear, the source term is a function of the pulsation level (u/V).
Figure 7: Experimentally determined source term Q presented in the Q-compex plane. The acoustic particle velocity (u/V) and the Strouhal number (S) are taken as parameters (Graf & Ziada 1992).
As an example, the acoustic pressure predicted
by means of the source term Q for the case of co-axial branches is compared with the experimental data in Fig. 8. Four cases are considered; including symmetric and asymmetric branches: L1=L2=0.6m; L1=L2=1.8m; L1=0.6m & L2= 3L1; and L1=0.6m & L2= 5L1. In all four cases, the amplitude of pulsation, the onset of resonance, and the lock-in range are well predicted. Additional comparisons for other pipe geometries can be found in Graf and Ziada (1992).
2.3. Counter-Measures
Several counter-measures can be implemented during the design phase to reduce the resonance intensity or eliminate it altogether. In addition to enlarging the branch inlet or shortening the branch length, which have already been mentioned, several other design changes are possible, such as rounding the edge of the branch mouth (Bruggeman, 1987), detuning the branches by making them of different lengths (Graf and Ziada, 1992), adding upstream spoilers in the main pipe (Bruggeman et al., 1991),
or inserting anti-vortex elements in the branch inlet (Jungowski and Studzinski, 1989). Additional measures are discussed in conjunction with the industrial examples presented in the next section.
Figure 8: Oscillation amplitude as function of flow velocity for different depth modes for co-axial branches. The resonance frequency is 137 Hz in all four cases. The symbols indicate measured data and the lines are computed from the experimentally determined source term (Graf & Ziada 1992).
3. ACOUSTIC FATIGUE OF A BWR STEAM DRYER
This section deals with the acoustic fatigue failure of the steam dryer of a boiling water reactor (BWR) in Quad Cities (QC) nuclear power plant (NRC, 2002; Hambric et al., 2006; DeBoo, 2007). First, the steam flow path through the dryer and into the main steam lines (MSLs) is explained. Thereafter, the root cause of the problem is identified followed by a discussion of the counter-measure adopted to solve the problem.
A simplified representation of the internal components within the upper portion of a typical BWR is given in Fig. 9 (Hambric et al., 2006). Wet steam rises from the boiling water and flows upwards through the water separator and the steam dryer. The steam then collects in the reactor dome above the dryer before turning downwards to enter the inlet nozzles of four main steam lines.
The steam dryer in QC Unit 2 experienced high cycle fatigue cracks after the reactor’s maximum power was increased by approximately 17%. Repairing the dryer by using thicker plates and stronger welds did not resolve the problem, as the dryer exhibited new cracks upon continued operation (NRC, 2004). As shown in Fig. 10 (GENE, 2003), the cracks appeared on the outer hood plates, which face the inlet nozzles of the MSLs. Similar cracks were also observed on the steam dryer of Unit 1. The steam dryers of both units were therefore replaced with new ones which
P/ρ
VC
V (m/s)
P/ρ
VC
V (m/s)
L1L2
L1L2

are substantially more robust. In addition, the new dryer of Unit 2 was instrumented with pressure transducers to provide direct measurements of the pressure fluctuations at numerous locations on the dryer. During this course of events, the safety relief valves (SRVs) on the MSLs of both units were experiencing high vibration levels, and subsequent inspection for maintenance during a refueling outage showed that some valves had been damaged.
Figure 9: Schematic of the upper section of a
boiling water reactor (BWR) showing the steam separator, steam dryer, inlet nozzle to a main steam line (MSL) and the path of steam flow through the dryer and into the MSL (Hambric et al., 2006).
Figure 10: Steam dryer assembly of Quad Cities
Unit 2 (top left) and details of the acoustic fatigue failure on the outer hood (GENE, 2003).
Figure 11: Power spectral density of fluctuating pressure on the dryer showing the tonal excitation near 150 Hz (Ramsden, 2005).
Figure 11 shows a typical power spectral density
of a pressure transducer on the dryer (Ramsden, 2005). Pressure spectra obtained at other locations on the dryer showed similar characteristics. The pressure fluctuations are seen to be dominated by several narrow band peaks in the range of 135 to 160 Hz. The frequency of these tones did not change appreciably, but their amplitudes were strongly dependent on the steam flow rate; with the higher frequency tones becoming more dominant as the steam flow rate was increased. Analysis of the steam piping system, which is shown schematically in Fig. 12 (Kitajima, 2006), indicated that the frequencies of these tones correspond to the one quarter wavelength resonance modes of the standpipes leading to the SRVs, see the inset in Fig. 12. Three different types of SRVs were used and the standpipe of each valve type had a different length, and therefore several tones were generated corresponding to the resonance frequencies of different standpipes. The Strouhal number associated with the appearance of each tone was found to agree well with the design chart in Fig. 5.
Although the new steam dryer was made sufficiently robust to withstand the dynamic loading generated by the standpipe tonal excitations, the SRVs with the shortest standpipe were experiencing intense acoustic resonance at the extended maximum power level, and therefore, these valves were expected to be damaged again upon continued operation at the extended power level. This necessitated a solution which either reduced the intensity of the standpipe resonance or eliminated it altogether.
As discussed earlier, the simplest solution to such a problem is to enlarge the inlet or shorten the length of the standpipe, see the middle inset in Fig. 13. This would generally increase the standpipe resonance frequency above the shear layer excitation frequency. However, these solutions were deemed impractical because they require major pipe
SteamDryer
Skirt
MSLInlet
(1 of 4)
RPVSteam
flow
Steam Separators
Pres
sure
PSD
Frequency (Hz)
Pres
sure
PSD
Frequency (Hz)
RPV
Main steam linesof BWRs showingsafety relief valves
SRV
MSL
SRV
MSL
RPV
Main steam linesof BWRs showingsafety relief valves
SRV
MSL
SRV
MSL
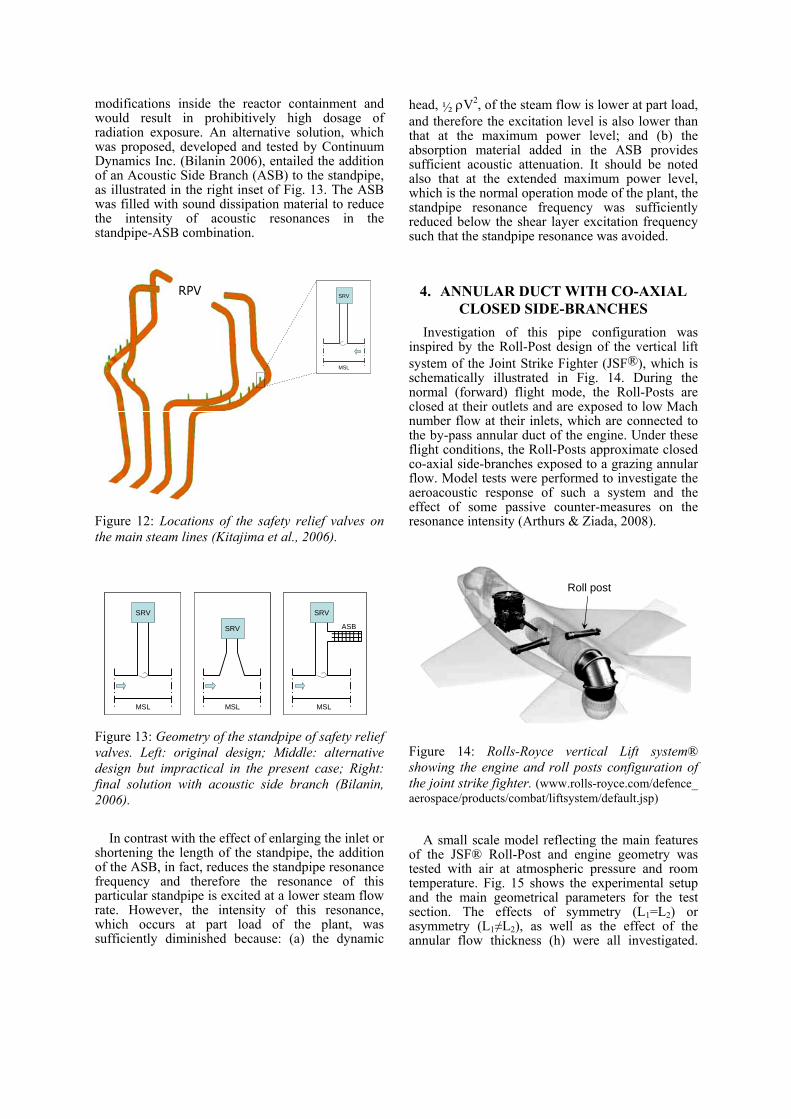
modifications inside the reactor containment and would result in prohibitively high dosage of radiation exposure. An alternative solution, which was proposed, developed and tested by Continuum Dynamics Inc. (Bilanin 2006), entailed the addition of an Acoustic Side Branch (ASB) to the standpipe, as illustrated in the right inset of Fig. 13. The ASB was filled with sound dissipation material to reduce the intensity of acoustic resonances in the standpipe-ASB combination.
Figure 12: Locations of the safety relief valves on the main steam lines (Kitajima et al., 2006).
Figure 13: Geometry of the standpipe of safety relief valves. Left: original design; Middle: alternative design but impractical in the present case; Right: final solution with acoustic side branch (Bilanin, 2006).
In contrast with the effect of enlarging the inlet or
shortening the length of the standpipe, the addition of the ASB, in fact, reduces the standpipe resonance frequency and therefore the resonance of this particular standpipe is excited at a lower steam flow rate. However, the intensity of this resonance, which occurs at part load of the plant, was sufficiently diminished because: (a) the dynamic
head, ½ ρV2, of the steam flow is lower at part load, and therefore the excitation level is also lower than that at the maximum power level; and (b) the absorption material added in the ASB provides sufficient acoustic attenuation. It should be noted also that at the extended maximum power level, which is the normal operation mode of the plant, the standpipe resonance frequency was sufficiently reduced below the shear layer excitation frequency such that the standpipe resonance was avoided.
4. ANNULAR DUCT WITH CO-AXIAL CLOSED SIDE-BRANCHES
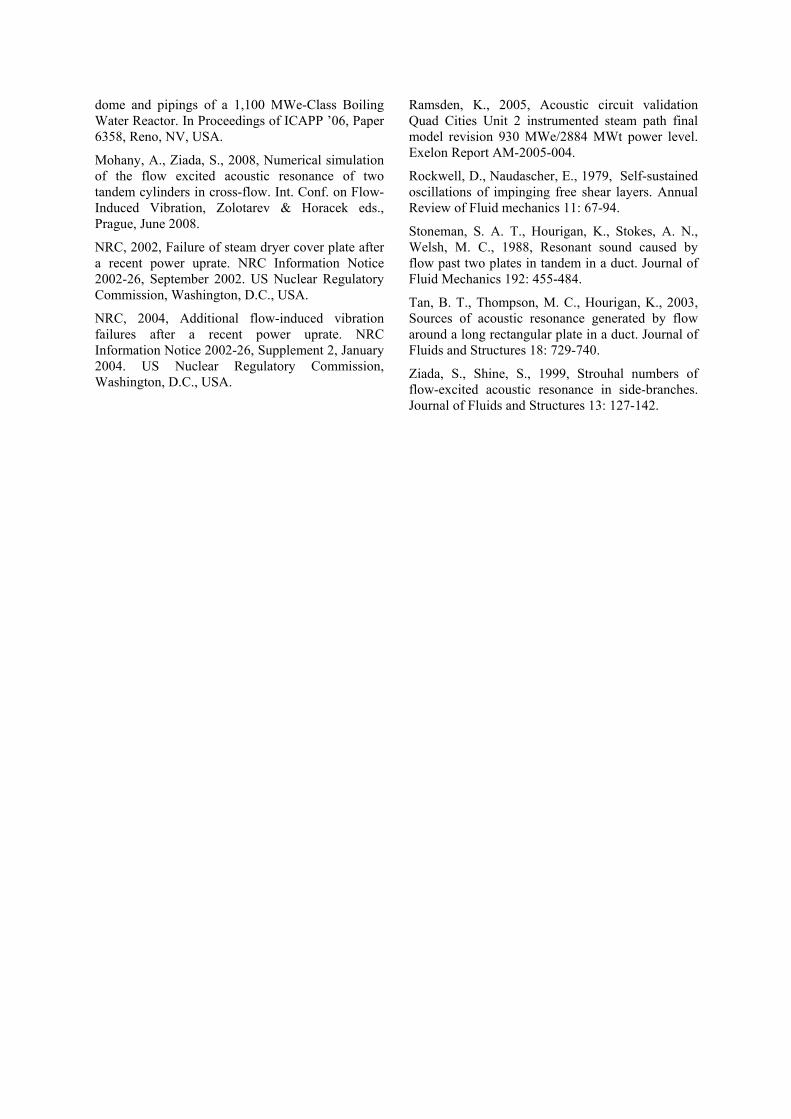
Investigation of this pipe configuration was inspired by the Roll-Post design of the vertical lift system of the Joint Strike Fighter (JSF®), which is schematically illustrated in Fig. 14. During the normal (forward) flight mode, the Roll-Posts are closed at their outlets and are exposed to low Mach number flow at their inlets, which are connected to the by-pass annular duct of the engine. Under these flight conditions, the Roll-Posts approximate closed co-axial side-branches exposed to a grazing annular flow. Model tests were performed to investigate the aeroacoustic response of such a system and the effect of some passive counter-measures on the resonance intensity (Arthurs & Ziada, 2008).
Figure 14: Rolls-Royce vertical Lift system® showing the engine and roll posts configuration of the joint strike fighter. (www.rolls-royce.com/defence_ aerospace/products/combat/liftsystem/default.jsp)
A small scale model reflecting the main features
of the JSF® Roll-Post and engine geometry was tested with air at atmospheric pressure and room temperature. Fig. 15 shows the experimental setup and the main geometrical parameters for the test section. The effects of symmetry (L1=L2) or asymmetry (L1≠L2), as well as the effect of the annular flow thickness (h) were all investigated.
Roll postRoll post
SRV
MSL
ASB
SRV
MSLMSL
SRV
SRV
MSL
SRV
MSL
ASB
SRV
MSL
ASB
SRV
MSLMSL
SRV
MSL
SRV

m1 m2
Splitter Plates
L1L2
m1 m2
Splitter Plates
L1L2
1
1 2
3
4
5
5 6
6
7
7
8
8
9
9
0 20 40 60 80 100 120 1400
500
1000
1500
2000
(a)
(b) (c)
(d)
Freq
uenc
y (H
z) St=0.55
St=0.27
0 2 4 6 8 10 120
2
4
6
8
(a)
(b) (c) (d)2 p/ρ
V2
Reduced velocity (V/(f1 d))
Freq
. (H
z)D
imen
sion
less
Am
p.
Reduced Velocity
1
1 2
3
4
5
5 6
6
7
7
8
8
9
9
0 20 40 60 80 100 120 1400
500
1000
1500
2000
(a)
(b) (c)
(d)
Freq
uenc
y (H
z) St=0.55
St=0.27
0 2 4 6 8 10 120
2
4
6
8
(a)
(b) (c) (d)2 p/ρ
V2
Reduced velocity (V/(f1 d))
Freq
. (H
z)D
imen
sion
less
Am
p.
Reduced Velocity
The splitter plate shown in Fig. 15 was not originally used in the model tests, but was added at a later time to reduce the resonance intensity. All the results reported hereafter were obtained without the splitter plate except those given in Fig. 20.
Figure 15: Geometry of test section showing the inner cylinder, splitter plates and microphone locations m1 and m2. The splitter plates were not used in the original design, but were added later as a counter-measure (Arthurs & Ziada 2008).
Figure 16: Frequency spectrum and mode shape for the first acoustic mode f1 (Arthurs & Ziada 2008).
Figure 16 shows a frequency spectrum of pressure pulsations measured at the closed end of one branch. It is seen that the lowest acoustic mode of the branches, f1=304 Hz, is excited. This acoustic mode was identified by means of numerical simulation in conjunction with its measured frequency and an observed phase shift of 180° between the pressure oscillations at the two closed ends of the branches. As shown in Fig. 16, this mode consists of one half acoustic wavelength (λ) between the closed ends of the side-branches. The acoustic pressure node is therefore placed in the main annular duct, which minimizes the acoustic pressure in the main duct and the resulting acoustic radiation from the side-branches into the main duct.
Similar spectra taken over the tested range of
flow velocity provided the overall aeroacoustic behavior of the system, which is illustrated in Fig. 17. The higher acoustic modes are seen to be excited consecutively as the flow velocity is increased. All modes are excited within a Strouhal number range of 0.27 to 0.55, and the dimensionless amplitude of the lowest mode is the strongest of all modes. Fig. 18 shows contour plots of sound pressure level as function of flow velocity and frequency. The consecutive excitation of acoustic modes can be clearly seen. For almost any flow velocity above 20 m/s in the annular duct, there is at least one acoustic mode in resonance. This underlines the susceptibility of this duct arrangement to flow-excited acoustic resonance.
Figure 17: Overview of the system acoustic response. Top figure shows acoustic resonance (lock-in) frequency and bottom figure shows dimensionless acoustic pressure as functions of flow velocity (Arthurs & Ziada 2008).
0
20
40
60
80
100
120
140
160
180
0 250 500 750 1000 1250 1500 1750 2000
Frequency [Hz]
Aco
ustic
Pre
ssur
e [d
B]
f1= 304 Hz
f1= 299 Hz+ve
-ve
0
20
40
60
80
100
120
140
160
180
0 250 500 750 1000 1250 1500 1750 2000
Frequency [Hz]
Aco
ustic
Pre
ssur
e [d
B]
f1= 304 Hz
f1= 299 Hz+ve
-ve

Figure 18: Sound pressure level in dB measured at the branch closed end (Arthurs & Ziada 2008).
100
110
120
130
140
150
160
170
0 10 20 30 40 50 60 70
Flow Velocity [m/s]
SPL
[dB
re: 2
0 µP
a]
60
80
100
120
140
160
0 200 400 600 800 1000Frequency [Hz]
SPL
[dB
re: 2
0 µP
a]
60
80
100
120
140
160
0 200 400 600 800 1000
SPL
[dB
re: 2
0 Pa
]
(a)
(b)
(c)
f 1''
f 1'' f 1'
f 1'
Figure 19: Frequency spectra of (a) shortened and (b) unchanged branches for V=30m/s, ∆L/L1 =42%. (c) Acoustic pressure (□) at f1’ in the un-changed branch; and (×) at f1’’in the shortened branch for ∆L/L1 = 42% (Arthurs & Ziada 2008).
The effect of offsetting the length of one branch,
by an amount ∆L=L1-L2, to detune the resonance frequency of one branch from the other was also
examined. For branch offsets as small as ∆L/L=7%, the appearance of two distinct frequencies f1’ and f1’’ was evident. These two frequencies can be clearly seen in Fig. 13, which shows typical pressure spectra taken from each branch at ∆L/L = 42% for a flow velocity in the annular duct of V = 30.5 m/s. These frequencies corresponded to the resonance frequencies of each of the separate branches. Figure 13(c) shows the magnitude of the two acoustic tones, f1’ and f1’’, as a function of the flow velocity in the main duct for a branch offset ratio of ∆L/L = 42%. It is evident that the two tones are excited over two different ranges of flow velocity, with the lower frequency tone f1’ being excited for lower flow velocities, and the higher frequency tone f1’’ being excited for higher flow velocities. It was also evident from the frequency spectra, as well as from the time signals of the two microphones, that these two resonant tones were generated simultaneously throughout the tested range of offset ratio; see for example Fig. 13(a).
Figure 20: Acoustic pressure of the duct with and without splitter plates (Arthurs & Ziada 2008).
In order to alleviate the intensity of acoustic
resonances, especially that of the first mode, splitter plates were implemented in the annular duct, as shown in Fig. 15. The purpose of the splitter plates was to attenuate the resonance of the first acoustic mode, which is the only mode relevant to the JSF® application, by de-coupling the two branches and thereby weakens their mutual enhancement of pressure pulsation. In addition, the splitter plates would increase acoustic radiation into the main duct by imposing a greater portion of the acoustic standing wave in the annular duct. Fig. 20 shows the acoustic pressure versus reduced velocity for the cases with and without the splitter plates. The acoustic pressure of the first mode is seen to be reduced substantially when the splitter plates are added; ensuring a low level of pressure pulsations up to a flow velocity of 60 m/s.
SPLSPL
0
2000
4000
6000
0 20 40 60 80 100 120 140
Flow Velocity [m/s]
Aco
ustic
Pre
ssur
e [P
a] BaselineSplitter

5. CONCLUDING REMARKS The excitation mechanism of acoustic resonances
in closed side-branches has been briefly reviewed and a design guide to predict the onset and the amplitude of acoustic resonances is introduced. It is important to note that the source term, Q, which describes the integrated effect of the shear layer excitation, is measured for a three-dimensional, high Reynolds number flow over the mouth of a cylindrical pipe. Since these are the flow characteristics encountered in industry, this source term is suitable to be used in industrial applications.
Despite the considerable advances in our ability
to predict the occurrence of acoustic resonance, researchers and design engineers still rely on scale model tests in many situations involving complex flow or piping systems. In this regard, two main concerns must be carefully considered when performing small scale model tests. First, sound attenuation in the model must be at least similar, if not lower, than in the full size plant. Secondly, the model geometry must be an exact replica of the prototype, and the termination impedance in the model must be equivalent to that of the prototype. Since it is not possible to meet all these requirements in small scale model testing, the scaling of the pulsation amplitude at resonance from the model to the full size plant is often not conservative. The development of reliable scaling laws for pulsation amplitude in these situations is one of the areas that need further research.
6. REFERENCES Arthurs, D., Ziada, S., 2008, Flow excited acoustic resonances of co-axial side-branches in an annular duct. J Fluids and Structures (in press).
Blevins, R. D., 1985, The effect of sound on vortex shedding from cylinders. Journal of Fluid Mechanics 161: 217-237.
Bilanin, A.J., 2006, Private Communication, Continuum Dynamics Inc, Ewing, NJ, USA
Bruggeman, J.C., 1987, Flow-induced pulsations in pipe systems. Doctoral dissertation, Technical University Eindhoven, The Netherlands.
Bruggeman, J.C., Herschberg, A., Van Dongen, M.E.H., Wijnads, A.P.J., Gorter, J., 1989, Flow-induced pulsations in gas transport systems: Analysis of the influence of closed side branches. ASME J Fluids Engineering 111:484-491.
Bruggeman, J.C., Herschberg, A., Van Dongen, M.E.H., Wijnads, A.P.J., Gorter, J., 1991, Self-
sustained aero-acoustic pulsations in gas transport syatems. J Sound and Vibration, 150:371-393.
DeBoo, G., Ramsden, K., Gesior, R., Strub, B., 2007, Identification of Quad Cities main steam line acoustic sources and vibration reduction. Proceedings of ASME PVP conference, Paper No PVP2007-26658.
GENE, 2003, BWR steam dryer integrity. Services Information Letter, SIL No. 644, Supplement 1, September 2003, GE Nuclear Energy, San Jose, CA, USA.
Graf, H.R., Ziada, S., 1992, Flow-excited acoustic resonance of closed side-branches: An experimental characterization of the excitation source. Proceedings of the 3rd International Symposium on Flow-Induced Vibration and Noise, ASME WAM, Anaheim, Vol. 7: 63-80.
Hall, J.W., Ziada, S., Weaver, D.S., 2003, The effect of applied sound on vortex shedding from two tandem cylinders. Journal of Fluids and Structures 18: 741-758.
Hambric, S.A., Mulcahy, T.M., Shah, V.N., Scarbrough, T., Wu, J., 2006, Acoustic loading on BWR steam dryers caused by valve singing. 9th NRC/ASME Symposium on Valves, Pumps, and Inservice Testing, July 2006, Washington DC, USA.
Hourigan, K., Stokes, A. N., Thompson, M. C., Welsh, M. C., 1986, Flow induced acoustic resonances for a bluff body in a duct: a numerical study. 9th Australian fluid mechanics conference, Auckland, pp. 504-507.
Hourigan, K., Welsh, M. C., Thompson, M. C., Stokes, A. N., 1990, Areodynamic sources of acoustic resonance in a duct with baffles. Journal of Fluids and Structures 4: 345-370.
Howe M. S., 1975, Contributions to the theory of aerodynamic sound with application to engine jet noise and theory of the flute. Journal of Fluid Mechanics 71: 625 – 673.
Howe M. S., 1984, On the absorption of sound by turbulence and other hydrodynamic flows. IMA Journal of Applied Mathematics 32: 187 – 209.
Jungowski, W.M., Studzinski, W., 1989, Damping pressure pulsations in piping systems. US Patent No. 486 7190.
Kitajima, Y., Watanabe, M., Matsunaga, K., Hagiwara, T., 2006, Acoustic analysis for a steam
dome and pipings of a 1,100 MWe-Class Boiling Water Reactor. In Proceedings of ICAPP ’06, Paper 6358, Reno, NV, USA.
Mohany, A., Ziada, S., 2008, Numerical simulation of the flow excited acoustic resonance of two tandem cylinders in cross-flow. Int. Conf. on Flow-Induced Vibration, Zolotarev & Horacek eds., Prague, June 2008.
NRC, 2002, Failure of steam dryer cover plate after a recent power uprate. NRC Information Notice 2002-26, September 2002. US Nuclear Regulatory Commission, Washington, D.C., USA.
NRC, 2004, Additional flow-induced vibration failures after a recent power uprate. NRC Information Notice 2002-26, Supplement 2, January 2004. US Nuclear Regulatory Commission, Washington, D.C., USA.
Ramsden, K., 2005, Acoustic circuit validation Quad Cities Unit 2 instrumented steam path final model revision 930 MWe/2884 MWt power level. Exelon Report AM-2005-004.
Rockwell, D., Naudascher, E., 1979, Self-sustained oscillations of impinging free shear layers. Annual Review of Fluid mechanics 11: 67-94.
Stoneman, S. A. T., Hourigan, K., Stokes, A. N., Welsh, M. C., 1988, Resonant sound caused by flow past two plates in tandem in a duct. Journal of Fluid Mechanics 192: 455-484.
Tan, B. T., Thompson, M. C., Hourigan, K., 2003, Sources of acoustic resonance generated by flow around a long rectangular plate in a duct. Journal of Fluids and Structures 18: 729-740.
Ziada, S., Shine, S., 1999, Strouhal numbers of flow-excited acoustic resonance in side-branches. Journal of Fluids and Structures 13: 127-142.