florida retirement system pension plan and other state ... · rick scott, governor chad poppell,...
TRANSCRIPT

Florida Retirement System Pension Plan AndOther State Administered Systems
Comprehensive Annual Financial ReportFiscal Year Ended June 30, 2015

[Inside Front Cover]

| 1
Florida Retirement System Pension Plan AndOther State Administered Retirement Systems
Comprehensive Annual Financial ReportFiscal Year Ended June 30, 2015
Division of Retirement1317 Winewood BoulevardBuilding 8Tallahassee, FL 32399-1560
Toll Free: 844-377-1888Local: 850-907-6500TTY: 800-955-8771
www.frs.myflorida.com
Rick Scott, GovernorChad Poppell, Secretary
Dan Drake, State Retirement Director
The photographs used throughout this report represent various wildlife of the State of Florida. On the cover is the manatee, which is the state’s marine mammal. This report has been prepared by the Department of Management Services
Division of Retirement and Division of Finance and Administration.
The panther is Florida’s official state animal.

This page is intentionally left blank
2

TABLE OF CONTENTS INTRODUCTORY SECTION .................................................................................................................................................................... 5
Transmittal Letter ..................................................................................................................................................................................... 6
Management Staff .................................................................................................................................................................................... 8
Administrative Organization Chart and List of Consulting Services .......................................................................................................... 9
Public Pension Standards Award for Funding and Administration .......................................................................................................... 10
FINANCIAL SECTION ........................................................................................................................................................................... 11
INDEPENDENT AUDITOR’S REPORT.................................................................................................................................................. 12
Management’s Discussion and Analysis ................................................................................................................................................ 15
Financial Statements
Statement of Fiduciary Net Position ....................................................................................................................................................... 22
Statement of Changes in Fiduciary Net Position .................................................................................................................................... 24
Governmental Fund Balance Sheet / Statement of Net Position ............................................................................................................ 26
Statement of Revenues, Expenditures and Changes in Fund Balance - Governmental Fund / Statement of Activities ......................... 27
Notes to the Financial Statements
Notes to the Financial Statements Table of Contents ............................................................................................................................ 28
Note 1 – Plan Description ....................................................................................................................................................................... 29
Note 2 – Summary of Significant Accounting Policies ............................................................................................................................ 40
Note 3 – Plan Investments ..................................................................................................................................................................... 45
Note 4 – Net Pension Liability ................................................................................................................................................................ 61
Note 5 – Interfund Balances and Transfers ............................................................................................................................................ 68
Note 6 – Changes in Long-Term Liabilities............................................................................................................................................. 69
Note 7 – Related Parties ........................................................................................................................................................................ 70
Required Supplementary Information
Florida Retirement System Pension Plan ............................................................................................................................................... 71
Retiree Health Insurance Subsidy Program ........................................................................................................................................... 75
Florida National Guard Supplemental Retirement Benefit Plan .............................................................................................................. 77
Budgetary Reporting .............................................................................................................................................................................. 79
Budgetary Comparison Schedules ......................................................................................................................................................... 81
Budget to GAAP Reconciliation .............................................................................................................................................................. 81
Other Supplementary Information ...................................................................................................................................................... 83
Schedule of Administrative Expenses .................................................................................................................................................... 84
INVESTMENT SECTION ....................................................................................................................................................................... 85
Statement from the State Board of Administration Executive Director ................................................................................................... 86
FRS Trust Fund Performance ................................................................................................................................................................ 87
FRS Trust Fund Distribution of Investments ........................................................................................................................................... 88
ACTUARIAL SECTION.......................................................................................................................................................................... 89
Florida Retirement System Pension Plan Overview of GASB 67 and GASB 68 .................................................................................... 90
Actuary’s Statement Regarding FRS 2015 Actuarial Valuation and Certification ................................................................................... 91
History of the FRS Pension Plan Unfunded Actuarial Liability / Surplus with Total Liabilities and Total Assets ..................................... 99
FRS Pension Plan Membership ........................................................................................................................................................... 100
FRS Pension Plan Payroll .................................................................................................................................................................... 101
FRS Pension Plan Cash Flows ............................................................................................................................................................ 101
Projected FRS Pension Plan Benefit Payments ................................................................................................................................... 102
FRS Pension Plan Trust Fund Assets .................................................................................................................................................. 103
Statement of Fund Balance / Fiduciary Net Position ............................................................................................................................ 103
FRS Pension Plan Total Actuarial Assets Compared to Total Actuarial Liabilities ............................................................................... 104
Total Composite Blended Rate ............................................................................................................................................................. 105
FRS Pension Plan Retirement Contributions ........................................................................................................................................ 106
Actuary’s Statement Regarding HIS 2015 Valuation ............................................................................................................................ 107
3

TABLE OF CONTENTS (continued) Retiree Health Insurance Subsidy Program Overview of GASB 67 and GASB 68 ............................................................................... 111
Actuary’s Statement Regarding National Guard 2015 Valuation .......................................................................................................... 113 Florida National Guard Supplemental Retirement Benefit Plan Overview of GASB 67 and GASB 68 ................................................. 117
STATISTICAL SECTION ..................................................................................................................................................................... 119
Membership and Payroll ....................................................................................................................................................................... 120
Annuitants and Benefit Payments for the FRS Pension Plan ............................................................................................................... 120
Source of FRS Membership and Covered Payroll for Fiscal Year 2014-15 .......................................................................................... 121
Ratio of FRS Active Members to Retirees ............................................................................................................................................ 122
Active FRS Members by System / Class .............................................................................................................................................. 123
Annual FRS Payroll by System / Class ................................................................................................................................................ 123
Members’ Required Contributions by System / Class .......................................................................................................................... 123
Profile of Active FRS Members ............................................................................................................................................................ 124
Profile of Active FRS Investment Plan Members .................................................................................................................................. 125
Profile of Active FRS Pension Plan Members ...................................................................................................................................... 126
Active FRS Members 2011-2015 ......................................................................................................................................................... 127
Growth of FRS Annuitants – All Systems 2011-2015 ........................................................................................................................... 127
FRS Pension Plan Refund Payments by Type ..................................................................................................................................... 128
FRS Pension Plan Total Refund Payments by Type ............................................................................................................................ 128
Active FRS Pension Plan DROP Participants by System / Class ......................................................................................................... 129
Profile of Active FRS Pension Plan DROP Participants ....................................................................................................................... 129
FRS Pension Plan DROP Accrued Benefits and Interest by System / Class ....................................................................................... 131
Terminated FRS Pension Plan DROP Participants by System / Class ................................................................................................ 132
Profile of Terminated FRS Pension Plan DROP Participants ............................................................................................................... 132
Total Annuitants by System / Class ...................................................................................................................................................... 134
Average Benefits by System / Class .................................................................................................................................................... 134
Total Annual Benefits by System / Class .............................................................................................................................................. 135
Total Disability Benefits by System / Class........................................................................................................................................... 135
Profile of Total Annuitants by System / Class ....................................................................................................................................... 136
Profile of FRS Annuitants ..................................................................................................................................................................... 136
FRS Retirees and Beneficiaries by Age at Retirement ......................................................................................................................... 139
FRS Retirees and Beneficiaries by Years of Service at Retirement ..................................................................................................... 139
Total FRS Annuitants by Type of Retirement ....................................................................................................................................... 140
Total FRS Annual Benefits by Type of Retirement ............................................................................................................................... 140
Total FRS Annuitants Added During Fiscal Year by Type of Retirement ............................................................................................. 140
Total Annual Benefits of FRS Annuitants Added During Fiscal Year by Type of Retirement................................................................ 140
Schedule of Average FRS Benefits ...................................................................................................................................................... 141
FRS Pension Benefits by Florida County ............................................................................................................................................. 142
FRS Retirees by State .......................................................................................................................................................................... 143
FRS Retirees Outside the United States .............................................................................................................................................. 143
Reemployed Retirees Not Eligible for Renewed Membership by System / Class ................................................................................ 144
Profile of Reemployed Retirees Not Eligible for Renewed Membership ............................................................................................... 144
SYSTEM SUMMARY SECTION .......................................................................................................................................................... 145
Chronological Highlights of State-Administered Retirement and Pension Systems Since 2000 ........................................................... 146
FRS Participating Employers ................................................................................................................................................................ 148
Police and Firefighters’ Premium Tax Trust Fund ................................................................................................................................ 155
INDEPENDENT AUDITOR’S REPORT ON INTERNAL CONTROL OVER FINANCIAL REPORTING AND ON COMPLIANCE
AND OTHER MATTERS BASED ON AN AUDIT OF FINANCIAL STATEMENTS PERFORMED IN ACCORDANCE WITH
GOVERNMENT AUDITNG STANDARDS ........................................................................................................................................ 156
4

Introductory Section
The common mockingbird is Florida’s state bird.
5

Director’s Office
P.O. Box 9000
Tallahassee, Florida 32315-9000
Tel: 850-907-6500 | Fax: 850-410-2010 | Toll-Free: 844-377-1888
Rick Scott, Governor Chad Poppell, Secretary
Dan Drake State Retirement Director
Letter of Transmittal Dear Members: We are pleased to present the Comprehensive Annual Financial Report (CAFR) of the state retirement systems administered by the Department of Management Services’ Division of Retirement (division). This annual report covers the period from July 1, 2014, through June 30, 2015. It includes the operations and financial status of the state retirement systems administered by the division, investment objectives and policy, actuarial reports, historical and statistical information on active members, annuitants and benefit payments, and a summary description of the retirement plans. This transmittal letter is designed to complement the Management Discussion and Analysis (MD&A) in the Financial Section of this report and should be read in conjunction with it.
State-Administered Retirement Systems Profile The state-administered retirement systems include three separate defined benefit pension plans: the Florida Retirement System (FRS) Pension Plan, the Retiree Health Insurance Subsidy Program, and the Florida National Guard Supplemental Retirement Plan; two separate defined contribution retirement plans: one for state senior managers and one for specified staff of the State University System; general revenue funded pensions; and funding to certain local government plans. The FRS is the fifth largest state retirement system that provides retirement, disability, or death benefits to 377,671 retirees or their designated beneficiaries and 34,829 Deferred Retirement Option Program (DROP) participants and offers a wide range of information services to 626,578 non-retired members. The FRS offers members a choice between the Pension Plan (a defined benefit plan) and the Investment Plan (a defined contribution plan). FRS participation is required by all state, county, district school board, state college, and state university employers with optional participation offered to cities, charter schools, metropolitan planning districts, and special districts. As of June 30, 2015, the FRS had 1,016 participating employers. Participation in non-integrated defined contribution plan alternatives to the FRS are provided to specified State University System employees through the State University System Optional Retirement Program and state senior managers through the Senior Management Service Optional Annuity Program. General revenue funded pensions include a retirement benefit to retirees of the Florida National Guard. This is the first year the Florida National Guard Supplemental Retirement Benefit Program is accounted for separately as a pension plan. Oversight is provided to local government pension plans with premium tax collections distributed to eligible municipal police and firefighters plans.
Economic Condition All FRS assets are invested under the authority and direction of the State Board of Administration (SBA). The primary investment objectives for the FRS Pension Plan are to provide investment returns sufficient to ensure timely payment of promised benefits and keep plan costs at a reasonable level. The portfolio consists of a highly diversified asset mix of investments, which includes government and corporate bonds, common stocks, income-producing real estate, alternative investments, and short-term money market instruments. As of June 30, 2015, the market value of assets for the FRS Pension Plan was approximately $148.0 billion. This reflects a 3.67 percent annualized investment return. The fiduciary net position as of June 30, 2015, was $148.5 billion, a 1.04 percent decrease over the previous year. The FRS Pension Plan is 86.5 percent funded on a plan funding basis as of June 30, 2015, and 92.0 percent funded on a Governmental Accounting Standards Board Statement No. 67, reporting basis. Since the benefit payments are not all immediately payable, the SBA can maintain a long-term investment strategy. This approach, along with a well-diversified investment portfolio, helps weather periods of volatility in the investment markets.
6

Legislation The Florida Legislature enacted the following substantive changes during the 2015 Legislative Session:
Established uniform employer contribution rates for the FRS membership classes and the contribution rate for the Deferred Retirement Option Program (DROP) effective July 1, 2015. New uniform employer contribution rates include fully funding the recommended unfunded actuarial liability contribution. The required employee contribution rate remains at 3 percent.
Increased the employer contribution rate for the Health Insurance Subsidy (HIS) from 1.26 percent to 1.66 percent effective July 1, 2015.
Awards and Recognition The FRS was awarded the Public Pension Coordinating Council’s Public Pensions Standards Award for Funding and Administration in 2015. This award recognizes plans that meet professional standards for plan funding and administration in categories such as benefits, actuarial valuations, financial reporting and communications to members. The Department of Management Services’ Division of Retirement and Division of Finance and Administration prepared this report. To the best of our knowledge, the enclosed data is accurate in all material respects and reported in a manner designed to fairly present the financial position and operations of the state-administered retirement systems. We created this report to provide complete and reliable information to members of these systems, the Governor, the Florida Legislature and the citizens of Florida. We continue to work to make the state-administered retirement systems cost effective and managed for the benefit of active and retired members. Respectfully submitted,
Dan Drake State Retirement Director
7

MANAGEMENT STAFF The Division of Retirement manages Florida’s state-administered retirement systems. The Governor appoints the Secretary of the Department of Management Services who appoints the State Retirement Director. The following individuals are involved in managing the state-administered retirement systems:
Chad Poppell
Secretary
Dan Drake Elizabeth Stevens
Director Assistant Director
Delanah Gebhart, Manager Garry Green, Chief Shirley Beauford, Chief
Administrative Services Bureau of Research and
Member Communications
Bureau of Benefit Payments
Kathy Gould, Chief Keith Brinkman, Chief Joyce Morgan, Chief
Bureau of Retirement
Calculations
Bureau of Local Retirement
Systems
Bureau of Enrollment and
Contributions
MAILING ADDRESS
Division of Retirement
P.O. Box 9000 Tallahassee, Florida 32315-9000
8

ADMINISTRATIVE ORGANIZATION as of June 30, 2015
The following sections are managed at the department level:
CONSULTING SERVICES
Actuary
Milliman, Inc., Consultants and Actuaries Seattle, Washington
Information Technology
Deloitte Tallahassee, Florida
Investment
State Board of Administration Tallahassee, Florida
Bureau of Research and
Member Communications
Bureau of Enrollment
and Contributions
Bureau of Retirement Calculations
Bureau of Local
Retirement Systems
Bureau of Benefit
Payments
Bureau of Financial
Management Services
DMS Administration
Office of the General Counsel
Office of Inspector General
Administrative Services and Operations
Assistant Retirement
Director
Retirement Director
9

P CP CPublic Pension Coordinating Council
Public Pension Standards AwardFor Funding and Administration
2015
Presented to
Florida Retirement System Pension Plan
In recognition of meeting professional standards for plan funding and administration as
set forth in the Public Pension Standards.
Presented by the Public Pension Coordinating Council, a confederation of
National Association of State Retirement Administrators (NASRA)National Conference on Public Employee Retirement Systems (NCPERS)
National Council on Teacher Retirement (NCTR)
Alan H. WinkleProgram Administrator
10

Financial Section
Small key deer in the woods of Florida’s Keys.
11

AUDITOR GENERAL
STATE OF FLORIDA Claude Denson Pepper Building, Suite G74
111 West Madison Street Tallahassee, Florida 32399-1450
The President of the Senate, the Speaker of the House of Representatives, and the Legislative Auditing Committee
INDEPENDENT AUDITOR’S REPORT
Report on the Financial Statements
We have audited the accompanying financial statements of the fiduciary funds, governmental fund, and
governmental activities of the Florida Retirement System Pension Plan and Other State-Administered
Systems (System) administered by the Florida Department of Management Services, as of and for the fiscal
year ended June 30, 2015, and the related notes to the financial statements, which collectively comprise
the System’s basic financial statements as listed in the table of contents.
Management’s Responsibility for the Financial Statements
Management is responsible for the preparation and fair presentation of these financial statements in
accordance with accounting principles generally accepted in the United States of America; this includes the
design, implementation, and maintenance of internal control relevant to the preparation and fair
presentation of financial statements that are free from material misstatement, whether due to fraud or error.
Auditor’s Responsibility
Our responsibility is to express opinions on these financial statements based on our audit. We did not audit
the investment assets and investment income of the Florida Retirement System Defined Benefits Plan
which represent 99 percent of the assets and 62 percent of the additions of the Florida Retirement System
Defined Benefit Plan as reported on the Statement of Fiduciary Net Position and Statement of Changes in
Fiduciary Net Position, respectively. Those assets and additions were audited by other auditors whose
report has been furnished to us, and our opinion, insofar as it relates to the amounts included for the Florida
Retirement System Defined Benefits Plan, is based solely on the report of the other auditors. We conducted
our audit in accordance with auditing standards generally accepted in the United States of America and the
standards applicable to financial audits contained in Government Auditing Standards, issued by the
Comptroller General of the United States. Those standards require that we plan and perform the audit to
obtain reasonable assurance about whether the financial statements are free from material misstatement.
An audit involves performing procedures to obtain audit evidence about the amounts and disclosures in the
financial statements. The procedures selected depend on the auditor’s judgment, including the assessment
of the risks of material misstatement of the financial statements, whether due to fraud or error. In making
those risk assessments, the auditor considers internal control relevant to the entity’s preparation and fair
presentation of the financial statements in order to design audit procedures that are appropriate in the
Phone: (850) 412-2722 Fax: (850) 488-6975
Sherrill F. Norman, CPA Auditor General
12

circumstances, but not for the purpose of expressing an opinion on the effectiveness of the entity’s internal
control. Accordingly, we express no such opinion. An audit also includes evaluating the appropriateness
of accounting policies used and the reasonableness of significant accounting estimates made by
management, as well as evaluating the overall presentation of the financial statements.
We believe that the audit evidence we have obtained is sufficient and appropriate to provide a basis for our
audit opinions.
Opinions
In our opinion, based on our audit and the report of other auditors, the financial statements referred to
above present fairly, in all material respects, the respective financial position of the fiduciary funds,
governmental fund, and governmental activities of the System, as of June 30, 2015, and the respective
changes in financial position for the year then ended in accordance with accounting principles generally
accepted in the United States of America.
Emphasis of Matters
As discussed in Note 1, the financial statements present only the Florida Retirement System Pension Plan
and Other State-Administered Systems and do not purport to, and do not, present fairly the financial position
of the State of Florida as of June 30, 2015, or the changes in its financial position for the year then ended
in accordance with accounting principles generally accepted in the United States of America. Our opinion
is not modified with respect to this matter.
As discussed in Note 2.J., the unfunded actuarial liability portion of the employer’s total contribution for
defined contribution plan members, previously reported as contributions in the defined contribution plans
and transfers to the Florida Retirement System Pension Plan, are now reported as contributions in the
Florida Retirement System Pension Plan. In addition, other income items that were previously reported as
contributions are now reported as other income. Our opinion is not modified with respect to these matters.
As discussed in the Management’s Discussion and Analysis section of the report, the ability of the current
statutory contribution rate to pay full Retiree Health Insurance Subsidy (HIS) Program benefits is very
sensitive to near-term demographic experience, particularly the volume and timing of retirements on the
amount of payroll on which the statutory rate is charged. This matter had no effect on our opinion.
Other Matters
Required Supplementary Information
Accounting principles generally accepted in the United States of America require that the accompanying
Management’s Discussion and Analysis, on pages 15 through 21, and the Required Supplementary
Schedules of Changes in Net Pension Liability and Related Ratios, Schedule of Employer Contributions,
Schedule of Money-Weighted Rate of Return, and related Notes to Required Supplementary Information,
on pages 71 through 78, and required budgetary information on pages 79 through 81, be presented to
supplement the basic financial statements. Such information, although not a required part of the basic
financial statements, is required by the Governmental Accounting Standards Board who considers it to be
an essential part of financial reporting for placing the basic financial statements in an appropriate
operational, economic, or historical context. We have applied certain limited procedures to the required
supplementary information in accordance with auditing standards generally accepted in the United States
of America, which consisted of inquiries of management about the methods of preparing the information
and comparing the information for consistency with management’s responses to our inquiries, the basic
financial statements, and other knowledge we obtained during our audit of the basic financial statements.
13
We do not express an opinion or provide any assurance on the information because the limited procedures
do not provide us with sufficient evidence to express an opinion or provide any assurance.
Supplementary and Other Information
Our audit was conducted for the purpose of forming opinions on the financial statements that collectively
comprise the System’s basic financial statements. The Introductory Section, on pages 5 through 10, the
Investment, Actuarial, Statistical, and System Summary Sections, on pages 85 through 155, and the
Schedule of Administrative Expenses, on page 84, are presented for purposes of additional analysis and
are not a required part of the basic financial statements. Such information is the responsibility of
management and was derived from and relates directly to the underlying accounting and other records
used to prepare the basic financial statements.
The Schedule of Administrative Expenses has been subjected to the auditing procedures applied in the
audit of the basic financial statements and certain additional procedures, including comparing and
reconciling such information directly to the underlying accounting and other records used to prepare the
basic financial statements or to the basic financial statements themselves, and other additional procedures
in accordance with auditing standards generally accepted in the United States of America by us. In our
opinion, based on our audit and the procedures performed as described above, the Schedule of
Administrative Expenses is fairly stated, in all material respects, in relation to the basic financial statements
as a whole.
The Introductory, Investment, Actuarial, Statistical, and System Summary Sections have not been
subjected to the auditing procedures applied in the audit of the basic financial statements and, accordingly,
we do not express an opinion or provide any assurance on them.
Other Reporting Required by Government Auditing Standards
In accordance with Government Auditing Standards, we have also issued our report dated
February 25, 2016, on our consideration of the System’s internal control over financial reporting and on our
tests of its compliance with certain provisions of laws, administrative rules, regulations, contracts, and other
matters included under the heading INDEPENDENT AUDITOR’S REPORT ON INTERNAL CONTROL
OVER FINANCIAL REPORTING AND ON COMPLIANCE AND OTHER MATTERS BASED ON AN
AUDIT OF FINANCIAL STATEMENTS PERFORMED IN ACCORDANCE WITH GOVERNMENT
AUDITING STANDARDS. The purpose of that report is to describe the scope of our testing of internal
control over financial reporting and compliance and the results of that testing, and not to provide an opinion
on internal control over financial reporting or on compliance. That report is an integral part of an audit
performed in accordance with Government Auditing Standards in considering the System’s internal control
over financial reporting and compliance.
Respectfully submitted,
Sherrill F. Norman, CPA Tallahassee, Florida February 25, 2016 Audit Report No. 2016-097
14
Management's Discussion and Analysis Management’s Discussion and Analysis provides an overview of the financial activities of the state-administered retirement systems and the fund for local government pension plans administered by the Florida Department of Management Services’ Division of Retirement (division) for the fiscal year ended June 30, 2015. This section should be read in conjunction with the financial statements and other information provided in this Comprehensive Annual Financial Report (CAFR). The Florida Retirement System (FRS) Pension Plan is the primary retirement plan administered by the division. It is a section 401(a), Internal Revenue Code, qualified cost-sharing, multiple-employer defined benefit plan for participating public employers and their covered employees. In addition to the FRS Pension Plan, the division administers several smaller plans and other retirement activities, including the:
Retiree Health Insurance Subsidy (HIS) Program, a supplemental benefit provided to eligible FRS retirees that is treated as a defined benefit plan for reporting purposes;
State University System Optional Retirement Program (SUSORP), a section 403(b), Internal Revenue Code, qualified defined contribution plan for faculty, members of the State University System Executive Service, and administrative and professional staff positions that are exempt from career service;
Senior Management Service Optional Annuity Program (SMSOAP), a section 401(a), Internal Revenue Code, qualified defined contribution plan for state senior managers;
Police and Firefighters’ Premium Tax Trust Fund, a supplemental funding of defined benefit plans for municipal police officers and firefighters who are not in the FRS;
Florida National Guard Supplemental Retirement (National Guard) Plan; and
Various General Revenue funded pension programs.
The division’s responsibilities include making benefit payments to retirees, collecting contributions to the plans and transmitting contributions to the State Board of Administration (SBA) and other third party providers for investment and directing actuarial studies. The SBA is responsible for, among other duties, investing defined benefit retirement fund assets consistent with statutory authority. The Florida Legislature is responsible for establishing plan structure, benefit levels and contribution rates, and providing statutory authority for the administration of the state-administered retirement systems. Financial and Actuarial Highlights The FRS Pension Plan represents over 99.9 percent of the financial activity of the state-administered retirement systems. The following financial highlights relate specifically to the FRS Pension Plan:
The overall financial position of the FRS Pension Plan decreased slightly during the year ended June 30, 2015; the fiduciary net position of the FRS Pension Plan decreased to $148.5 billion, a decrease of $1.6 billion, or 1.04 percent below fiscal year 2014. The decrease in value was due primarily to lower than anticipated investment returns across all asset classes. As detailed in the Investment Section, the market value of assets for the FRS Trust Fund was $148.0 billion. The FRS earned an overall investment return of 3.67 percent for fiscal year 2015, compared with a return of 17.4 percent for fiscal year 2014.
The FRS relies upon contributions from employees and employers, along with investment income, to meet the funding requirements of an actuarially-determined accrued liability. As of July 1, 2015, the date of the latest actuarial valuation, the FRS’ funded ratio was 86.5 percent on the valuation funding basis, as compared to 86.6 percent as of July 1, 2014. The funded ratio on the Governmental Accounting Standards Board Statement No. 67 basis was 92.0 percent as of July 1, 2015, as compared to 96.09 percent in the prior year.
Administrative expense of the plan for fiscal year 2015 totaled $18.0 million as compared to $18.3 million for fiscal year 2014. Administrative expenses reported on the Statement of Changes in Fiduciary Net Position for fiscal year 2015 include items such as personnel and professional service cost, communication cost, and other operating costs which include administrative overhead assessment charges and facilities rental expenses. For additional information on administrative expenses refer to the Schedule of Administrative Expenses located immediately following the Required Supplementary Information Section.
Contribution revenue recognized from employees and employers during fiscal year 2015 totaled $3.1 billion, an increase of 8.5 percent over the prior year. The employers continue to be required to pay the full unfunded actuarial liability (UAL) rates recommended by the plan’s consulting actuary. Increased membership and a higher payroll base, primarily in local government employers, account for the majority of the increase over the prior year.
15

Pension benefits paid to retirees and beneficiaries during fiscal year 2015 increased 15.1 percent or $1.2 billion over fiscal year 2014 benefit payments, for a total of $9.2 billion. These benefits include payouts to terminating participants of the Deferred Retirement Option Program before being added to the monthly payroll for benefit payments. In addition to the expected growth in retired members due to baby boomers exiting the workforce, legislative changes enacted in 2011 resulted in a large increase in members entering DROP by June 2011. The last of this large group are completing DROP and will be added to the retired payroll for monthly benefits in this fiscal year and the next fiscal year.
Refunds of employee and employer contributions increased by $2.4 million in fiscal year 2015 to a total of $9.4 million.
Actuarial Valuations
The FRS actuarial valuation was prepared as of July 1, 2015.
The HIS actuarial valuation was prepared as of July 1, 2014, and update procedures were used to determine liabilities as of July 1, 2015.
The National Guard actuarial valuation was prepared as of July 1, 2014, and update procedures were used to determine liabilities as of July 1, 2015.
Note 4, the Required Supplementary Information and the Actuarial Section of this report provide information on the net pension liability, key methods and assumptions used, and other required disclosures for each of the defined benefit plans.
Retiree Health Insurance Subsidy (HIS) Program
The HIS Program provides a health insurance subsidy payment to most retired employees and beneficiaries. The Florida Legislature sets the contribution rate for this program, which operates using a pay-as-you-go funding structure. As discussed in the actuary’s report, the most recent valuation, dated July 1, 2015, accumulated HIS assets constituted less than two months of projected benefit payments. The ability of the current statutory contribution rate to pay full HIS benefits is very sensitive to near-term demographic experience, particularly the volume and timing of retirements on the amount of payroll on which the statutory rate is charged. Effective July 1, 2015, the Legislature increased the HIS employer contribution rate from 1.26 percent to 1.66 percent to address the cash flow needs of the program. For further discussion of this, refer to Part B of the Required Supplementary Information section.
Florida National Guard Supplemental Retirement Benefit (National Guard) Plan
The National Guard Plan is a single-employer, non-qualified defined benefit pension plan established under Section 250.22, Florida Statutes. The monthly benefit is equal to the difference between fifty percent of the federal military pay table rate for the highest rank held while in the Florida National Guard and the reservist pension benefit received from the federal government for military service. The plan is funded by an annual appropriation from the General Revenue Fund. In prior years, this plan was considered de minimis and was accounted for as a component of the FRS. As of the fiscal year ended June 30, 2014, the long-term liabilities of the National Guard Supplemental Retirement Benefit Plan were determined to be material and the plan is now being accounted for separately in the financial statements.
16
Overview of the Financial Statements As required by accounting principles generally accepted in the United States, the systems’ financial statements consist of the following components: basic financial statements, notes to the financial statements and required supplementary information. Basic Financial Statements The systems’ basic financial statements include the following elements as of and for fiscal year ended June 30, 2015:
Statement of Fiduciary Net Position and Statement of Changes in Fiduciary Net Position – The pension plans report operations and fiduciary net position on a full accrual basis of accounting and a focus on economic resources. The Statement of Fiduciary Net Position reports the assets, deferred outflows of resources, liabilities, deferred inflows of resources and resulting fiduciary net position, providing a measurement of the financial position of the funds as of the end of the fiscal year. The Statement of Changes in Fiduciary Net Position presents the results of operating activities in the fiduciary funds during the fiscal year and reflects the changes in resources available to provide future retirement benefits.
Balance Sheet and Statement of Revenues, Expenditures and Changes in Fund Balance – The Police and Firefighters’ Premium Tax Trust Fund is a special revenue fund, reported as a governmental fund type using a modified accrual basis of accounting with a focus on current financial resources. The Balance Sheet reports the assets, liabilities and resulting fund balance as of the end of the fiscal year. The Statement of Revenues, Expenditures and Changes in Fund Balance presents the results of operating activities during the fiscal year and reflects the changes in resources available to provide the services administered by the division.
Statement of Net Position and Statement of Activities – The Police and Firefighters’ Premium Tax Trust Fund is converted to a government-wide perspective which reports on a full accrual basis of accounting and a focus on economic resources. The Statement of Net Position presents the assets, liabilities and resulting net position as of the end of the fiscal year. The Statement of Activities presents the results of operating activities during the fiscal year.
Notes to the financial statements are an integral part of the financial statements. They are important to the reader's understanding of the statements and provide additional information regarding the state-administered retirement funds such as significant accounting policies, material account balances and activities, obligations, contingencies and subsequent events, if any.
Required Supplementary Information The following schedules and reconciliation are included to assist the reader by adding operational, economic, and historical context to the financial statements and notes to the financial statements.
Schedule of Changes in Net Pension Liability and Related Ratios
Schedule of Employer Contributions
Schedule of Money-Weighted Rate of Return
Budgetary Comparison Schedule
Budget to GAAP Reconciliation
17

Other Supplementary Information The Schedule of Administrative Expenses provides additional information not included in the basic financial statements, notes, or required supplementary information. Condensed Financial Statements and Overall Financial Analysis Statements of Fiduciary Net Position / Net Position These statements present the assets, deferred outflows of resources, liabilities, deferred inflows of resources and net position of the state-administered retirement funds as of the end of the fiscal year and are point-in-time financial statements. Table 1, below, presents the condensed Statements of Fiduciary Net Position / Net Position for the fiscal years ended June 30, summarizing the activities of the various retirement funds. The net position at the close of the fiscal year for all funds combined was $148.6 billion, with the defined benefit plans comprising over 99.9 percent of the total. Net position decreased 1.07 percent from the previous year’s total net position of $150.2 billion.
2015 2014 2015 2014 2015 2014 2015 2014
Cash and investments 160,290,145$ 157,905,336$ 4,303$ 4,122$ 236,975$ 228,666$ 160,531,423$ 158,138,124$
Other assets 4,474,569 5,563,639 25 20 3,704 14,131 4,478,298 5,577,790
Total assets 164,764,714 163,468,975 4,328 4,142 240,679 242,797 165,009,721 163,715,914
Total deferred outflows of resources1 - - 21 - - - 21 -
Total liabilities 16,259,547 13,361,298 215 187 166,388 170,101 16,426,150 13,531,586
Total deferred inflows of resources1 - - 42 - - - 42 -
Fiduciary net position /
net position 148,505,167$ 150,107,677$ 4,092$ 3,955$ 74,291$ 72,696$ 148,583,550$ 150,184,328$
1 Refer to Note 2.J.
TOTAL
(in thousands)
As of June 30
Table 1: Condensed Statements of Fiduciary Net Position / Net Position
Defined
Benefit Plans Contribution Plans
Defined Governmental
Activities
18

Statements of Changes in Fiduciary Net Position / Activities These statements detail the changes in fiduciary net position/net position that occurred during the fiscal year. All changes are reported on an accrual basis and show net investment income earned, contributions from employers and employees, and withdrawals for members and beneficiaries that occurred during the fiscal year. Table 2 presents the Condensed Statements of Changes in Fiduciary Net Position / Activities for the fiscal years ended June 30. Over time, increases and decreases in the fiduciary net position/net position measure whether the financial position of the state-administered retirement funds is improving or deteriorating. The total net position for all funds decreased by $1.6 billion dollars during the fiscal year. The FRS Pension Plan accounts for 99.9 percent of the decrease.
2015 2014 2015 2014 2015 2014 2015 2014
Additions / Revenues
Employer contributions 2,820,347$ 2,532,990$ 83,162$ 112,313$ -$ -$ 2,903,509$ 2,645,303$
Employee contributions 698,304 699,579 85,985 81,978 - - 784,289 781,557
Premium taxes - - - - 170,704 173,085 170,704 173,085
Transfers and other additions 82,459 114,190 248 358 550 - 83,257 114,548
Net investment income / (loss) 5,205,768 22,812,506 64 81 380 260 5,206,212 22,812,847
Total additions / revenues 8,806,878 26,159,265 169,459 194,730 171,634 173,345 9,147,971 26,527,340
Deductions / Expenses
Benefit payments 9,661,895 8,421,910 - - - - 9,661,895 8,421,910
Refunds of contributions 9,426 6,994 - - - - 9,426 6,994
Payments to annuity companies - - 168,965 160,998 - - 168,965 160,998
Distribution to cities - - - - 140,476 139,417 140,476 139,417
Administrative expenses 18,334 18,406 281 264 759 784 19,374 19,454
Transfers and other deductions 719,733 823,884 8 33,613 28,804 32,863 748,545 890,360
Total deductions / expenses 10,409,388 9,271,194 169,254 194,875 170,039 173,064 10,748,681 9,639,133
Change in net position (1,602,510) 16,888,071 205 (145) 1,595 281 (1,600,710) 16,888,207
Fiduciary net position / net position - beginning,
as restated (Note 2) 150,107,677 133,219,606 3,887 4,100 72,696 72,415 150,184,260 133,296,121
Fiduciary net position/
net position - ending 148,505,167$ 150,107,677$ 4,092$ 3,955$ 74,291$ 72,696$ 148,583,550$ 150,184,328$
Table 2: Condensed Statements of Changes in Fiduciary Net Position / Activities
For the fiscal year ended June 30
(in thousands)
Defined
Benefit Plans
Defined
Contribution Plans
Governmental
Activities TOTAL
19

The pie charts below provide a visual representation of activity for all plans for the fiscal year ended June 30, 2015: Additions to Fiduciary Net Position Of the total additions of $9.1 billion for all plans during the fiscal year, 59.11 percent was attributable to net investment income of $5.2 billion. Employer and employee contributions represent 32.02 percent and 7.93 percent, respectively, while the remaining 0.94 percent was allocated between transfers and other additions.
Deductions from Fiduciary Net Position
Of the total deductions of $10.7 billion for all plans during the fiscal year, benefit payments account for the majority of deductions from fiduciary net position, comprising 92.82 percent or $9.7 billion. Transfers and other deductions made up 7.00 percent of total deductions. Administrative expense represents only 0.18 percent of total deductions.
Employer contributions32.02%
Employee contributions7.93%
Transfers and other additions
0.94%
Net Investment Income59.11%
ADDITIONS TO FIDUCIARY NET POSITION
Benefit payments92.82%
Transfers and other deductions
7.00%
Administrative expenses0.18%
DEDUCTIONS FROM FIDUCIARY NET POSITION
20

Summary
The long-term financial health of all retirement plans is dependent upon two key items: future investment returns and contributions. In the defined contribution plans, the members bear the investment risk to insure adequate resources are available for retirement. For the FRS Pension Plan, a defined-benefit plan, the long-term financial health depends on contributions and meeting the plan’s assumptions including the assumed investment return. The division’s funding objective is to accumulate sufficient assets over time to meet its long-term benefit obligations as they become due. Accordingly, collecting employer and employee contributions as well as earning an adequate long-term rate of return on its investments are essential components of the division’s plan for accumulating the assets needed to finance future retirement benefits. The investment performance for the FRS Pension Plan for the fiscal year ended June 30, 2015, was 3.67 percent which was less than the assumed investment return of 7.65 percent, resulting in a slight decrease in the fiduciary net position held in trust for pension benefits. The amount of assets required to meet future obligations is based, in part, on estimated or expected long-term investment returns. While management cannot predict future market returns, the changes in assets reflect the volatility of the market. The division is required by state law to provide an actuarial valuation of the defined benefit pension plans to assist decision makers in assessing the funding strength and net position of the defined benefit pension plans. The results of these actuarial valuation reports are included in Note 4, Net Pension Liability; and the Required Supplementary Information and Actuarial Sections. Assumptions changes adopted for the 2015 FRS Pension Plan Valuation included:
Retaining the assumed investment rate of return of 7.65 percent,
Retaining the inflation assumption of 2.60 percent, and
Retaining the real wage growth assumption of 0.65 percent. Contacting the Division This report is designed to provide an overview of the division’s activities to citizens, taxpayers, retirement plan members, and other interested parties. Questions concerning any of the information provided in this report or requests for additional information should be addressed to the Department of Management Services, Division of Retirement, Bureau of Research and Member Communications, P.O. Box 9000, Tallahassee, Florida, 32315-9000; phone 850-488-5706.
21

Florida Retirement Retiree HealthSystem Insurance Subsidy National Guard
722,768,630$ -$ -$ 4,154,994 75,463 72,500
726,923,624 75,463 72,500
1,936,529,355 - - 7,622,314,823 - - 9,458,712,224 - - 5,867,392,218 - -
33,150 - - 400,000,000 - -
2,636,428,966 - - 7,735,700,449 - -
10,142,273,433 - - 6,315,997,920 - -
12,264,488 15,399,687 - 43,387,207,094 - - 19,596,356,887 - - 36,089,572,296 - -
151,200,783,303 15,399,687 -
4,470,728 24,105 - 210,652,630 32,916,372 - 136,328,564 - - 173,306,013 - -
1,477,146,161 - - 111,120,939 - -
2,203,248,822 - - 15,732,977 - - 45,268,775 2,377,953 -
- - - 52,984,011 - -
4,430,259,620 35,318,430 -
8,346,890,175 - - 8,397,559 - - 1,110,257 - - (516,429) - -
164,713,848,109 50,793,580 72,500
- - - - - -
92,266,597 19,265 72,500 2,132,800 - -
308,549,911 - - 66,021 - -
- - - 5,631,848 - -
223,996 - - 8,395,913,686 - - 4,984,157,006 - -
111,062,194 - - 2,198,672,804 - -
729,256 - - 156,976,254 - -
807,844 - - - - -
2,263,990 - - 16,259,454,207 19,265 72,500
- - - - - -
148,454,393,902$ 50,774,315$ -$
Defined Benefit
Accrued DROP liability
STATEMENT OF FIDUCIARY NET POSITIONas of June 30, 2015
U.S. government and federally guaranteed obligationsFederal agenciesCommercial paperOptionsRepurchase agreementsInternational bonds and notesBonds and notes
ASSETSCash and cash equivalentsState treasury investment pool Total cash and cash equivalents
InvestmentsCertificates of deposit
Accounts receivableContributions receivableInterest receivable
Real estate contractsInternational equity commingledShort term investment fundsDomestic equity / domestic equity commingledAlternative investmentInternational equity
Dividends receivablePending investment salesPending spot fx trades receivableForward contracts receivableFutures trade equity
Prepaid items
Due from other funds
Due from other departments
LIABILITIES
Benefits payableAccounts payable
DEFERRED OUTFLOWS OF RESOURCESDeferred outflows related to pension Total deferred outflows of resources
Total investments
Receivables
Obligations under security lending agreementsPending investment purchasesPending spot fx trades payable
Due to other funds within division
Accrued interest payable
Security lending collateral
Furniture and equipment
Total receivables
Compensated absences liability
Broker rebate feesShort sell obligations - fixed income
Due to other departments
Net pension liability
Restricted for pension
Other liabilities
DEFERRED INFLOWS OF RESOURCESDeferred inflows related to pension Total deferred inflows of resources
Forward contracts payable
FIDUCIARY NET POSITION
Due from other funds within division
Accumulated depreciation Total assets
Due to other funds
Total liabilities
The notes to the financial statements are an integral part of this statement.
22

State University Senior ManagementSystem Optional Service Optional Total
Retirement Program Annuity Program June 30, 2015
-$ -$ 722,768,630$ 4,245,887 57,573 8,606,417 4,245,887 57,573 731,375,047
- - 1,936,529,355 - - 7,622,314,823 - - 9,458,712,224 - - 5,867,392,218 - - 33,150 - - 400,000,000 - - 2,636,428,966 - - 7,735,700,449 - - 10,142,273,433 - - 6,315,997,920 - - 27,664,175 - - 43,387,207,094 - - 19,596,356,887 - - 36,089,572,296 - - 151,216,182,990
- - 4,494,833 12,688 - 243,581,690 4,582 28 136,333,174
- - 173,306,013 - - 1,477,146,161 - - 111,120,939 - - 2,203,248,822 - - 15,732,977 - - 47,646,728
7,620 - 7,620 - - 52,984,011
24,890 28 4,465,602,968
- - 8,346,890,175 - - 8,397,559 - - 1,110,257 - - (516,429)
4,270,777 57,601 164,769,042,567
20,791 - 20,791 20,791 - 20,791
93,539 8,984 92,460,885 - - 2,132,800 - - 308,549,911
22 - 66,043 - 7,620 7,620
585 4 5,632,437 - - 223,996 - - 8,395,913,686 - - 4,984,157,006 - - 111,062,194 - - 2,198,672,804 - - 729,256 - - 156,976,254
33,811 - 841,655 46,698 - 46,698 23,259 - 2,287,249
197,914 16,608 16,259,760,494
41,511 - 41,511 41,511 - 41,511
4,052,143$ 40,993$ 148,509,261,353$
STATEMENT OF FIDUCIARY NET POSITIONas of June 30, 2015
Defined Contribution
The notes to the financial statements are an integral part of this statement.
23

Florida Retirement Retiree Health System Insurance Subsidy National Guard
2,438,084,925$ 382,262,242$ -$ 687,864,970 - - 10,439,142 ‐ - 1,365,053 ‐ - 5,275,798 192,154 -
‐ ‐ - 3,143,029,888 382,454,396 -
- ‐ - 57,536,043 ‐ - 3,595,035 ‐ -
- ‐ 14,495,208 61,131,078 ‐ 14,495,208
3,204,160,966 382,454,396 14,495,208
2,093,623,230 36,009 - 901,745,439 94,936 -
2,002,846,459 ‐ - 488,969,490 ‐ - 209,831,981 78,942 -
5,697,016,599 209,887 -
(529,631,944) (634) - 5,167,384,655 209,253 -
46,845,509 ‐ - (8,671,776) ‐ - 38,173,733 ‐ -
5,205,558,388 209,253 -
8,409,719,354 382,663,649 14,495,208
9,221,329,459 425,086,006 - 1,056,713 ‐ 14,422,708 9,425,580 ‐ -
- 1,106 - 549,982 ‐ -
719,182,111 ‐ - ‐ ‐ -
18,073,979 187,672 72,500 9,969,617,824 425,274,784 14,495,208
(1,559,898,470) (42,611,135) -
150,014,292,372 93,385,450 -
148,454,393,902$ 50,774,315$ -$
Fiduciary net position - beginning, restated (Note 2)
Fiduciary net position - ending
Transfers to FRS investment planPayments to annuity companiesAdministrative expenses Total deductions
Change in fiduciary net position
DEDUCTIONSBenefit paymentsBenefit payments - general revenue fundedRefunds of contributionsTransfers to other fundsTransfers to other funds within division
Net income (loss) from investing activity
Security lending activitySecurity lending incomeSecurity lending expense Net income from security lending
Total additions
Interest incomeDividendsReal estate operating income, netOther investment income Total investment income (loss)
Investment activity expense
Other funds within divisionOther funds - FRS investment planOther departments
Total transfers
Investment incomeNet appreciation in fair value
General revenue
Other income
Total contributions and other deposits
Total contributions and transfers
Total net investment income (loss)
ADDITIONSContributions and other depositsPension contributions - employerPension contributions - employee
Forfeiture of employee benefit
Transfers
Purchase of time by employeesGeneral revenue
STATEMENT OF CHANGES IN FIDUCIARY NET POSITIONfor the fiscal year ended June 30, 2015
Defined Benefit
The notes to the financial statements are an integral part of this statement.
24

State University Senior ManagementSystem Optional Service Optional Total
Retirement Program Annuity Program June 30, 2015
82,951,015$ 210,655$ 2,903,508,837$ 85,866,214 118,485 773,849,669
- - 10,439,142 - - 1,365,053
240,751 - 5,708,703 - - -
169,057,980 329,140 3,694,871,404
7,620 - 7,620 - - 57,536,043 - - 3,595,035 - - 14,495,208
7,620 - 75,633,906
169,065,600 329,140 3,770,505,310
- - 2,093,659,239 - - 901,840,375 - - 2,002,846,459 - - 488,969,490
70,774 295 209,981,992 70,774 295 5,697,297,555
(6,584) (42) (529,639,204) 64,190 253 5,167,658,351
- - 46,845,509 - - (8,671,776) - - 38,173,733
64,190 253 5,205,832,084
169,129,790 329,393 8,976,337,394
- - 9,646,415,465 - - 15,479,421 - - 9,425,580 - - 1,106 - 7,620 557,602 - - 719,182,111
168,633,491 331,631 168,965,122 280,595 - 18,614,746
168,914,086 339,251 10,578,641,153
215,704 (9,858) (1,602,303,759)
3,836,439 50,851 150,111,565,112
4,052,143$ 40,993$ 148,509,261,353$
STATEMENT OF CHANGES IN FIDUCIARY NET POSITIONfor the fiscal year ended June 30, 2015
Defined Contribution
The notes to the financial statements are an integral part of this statement.
25

Reconciliation
Special Revenue Adjustments Statement of
Fund (Note 2) Net Position
12,001,555$ -$ 12,001,555$ 224,973,176 - 224,973,176
- - - - - -
3,704,392 - 3,704,392 240,679,123 - 240,679,123
101,204 - 101,204 251 - 251
15,123,616 - 15,123,616 140,904,863 - 140,904,863 10,056,351 - 10,056,351
29,391 60,237 89,628 166,215,676 60,237 166,275,913
- 111,454 111,454
166,215,676 171,691 166,387,367
74,463,447 (74,463,447) -
240,679,123$
74,291,756$ 74,291,756$ Net position - restricted
Fund balance - committed
Total current liabilities
Total liabilities and fund balance
GOVERNMENTAL FUND BALANCE SHEET /STATEMENT OF NET POSITION
Noncurrent liabilitiesOther long-term liabilities
Total liabilities
Due from other funds within divisionDue from other departments
Due to other governmental units
Total assets
LIABILITIES AND FUND BALANCE
Current liabilitiesAccounts payableDue to other funds
Police and Firefighters' Premium Tax Trust Fund
as of June 30, 2015
ASSETS
State treasury investment poolInvestments
Compensated absences liability
Due to other departments
Due to general revenue
Interest receivable
The notes to the financial statements are an integral part of this statement.
26

.
Reconciliation
Special Revenue Adjustments Statement of
Fund (Note 2) Activities
170,704,392$ -$ 170,704,392$ 380,039 ‐ 380,039
171,084,431 ‐ 171,084,431
140,476,282 ‐ 140,476,282 745,380 13,193 758,573
70 ‐ 70 141,221,732 13,193 141,234,925
29,862,699 29,849,506
549,982 549,982
(28,803,697) (28,803,697)
1,608,984 (1,608,984) -
- 1,595,791 1,595,791
72,854,463 (158,498) 72,695,965
74,463,447$ (171,691)$ 74,291,756$
Fund balance / net position - beginning
OTHER FINANCING SOURCES (USES)
Change in net position
and transfers out
Operating transfers out to other funds
Revenues and transfers in over expenditures
Fund balance / net position - ending
Premium taxes
Administrative expense
Investment earnings
Distribution to cities
Interest and fiscal charges
within division
Revenues over (under) expenditures
STATEMENT OF REVENUES, EXPENDITURES AND CHANGES IN FUND BALANCE - GOVERNMENTAL FUND / STATEMENT OF ACTIVITIES
For the fiscal year ended June 30, 2015
Total revenues
REVENUES
Operating transfers in from other funds
Police and Firefighters' Premium Tax Trust Fund
Total expenditures/expenses
EXPENDITURES / EXPENSES
The notes to the financial statements are an integral part of this statement.
27

NOTES TO THE FINANCIAL STATEMENTS FOR THE FISCAL YEAR ENDED JUNE 30, 2015
TABLE OF CONTENTS
NOTE PAGE
1 PLAN DESCRIPTION 29
2 SUMMARY OF SIGNIFICANT ACCOUNTING POLICIES 40
3 PLAN INVESTMENTS 45
4 NET PENSION LIABILITY 61
5 INTERFUND BALANCES AND TRANSFERS 68
6 CHANGES IN LONG-TERM LIABILITIES 69
7 RELATED PARTIES 70
28

NOTE 1 – PLAN DESCRIPTION A. Reporting Entity
The Florida Retirement System Pension Plan and Other State-Administered Systems (System) are administered by the Florida Department of Management Services, Division of Retirement and are part of the primary government of the State of Florida. The division administers three defined benefit plans, two defined contribution plans, a supplemental funding of defined benefit plans for municipal police officers and firefighters, and various general revenue funded pension programs. These state-administered retirement systems are included in the department’s Comprehensive Annual Financial Report (CAFR). The financial statements do not include the pension liabilities of the participating employers. B. Defined Benefit Plans 1. The Florida Retirement System Pension Plan
Organization:
The Florida Retirement System (FRS) Pension Plan was created in Chapter 121, Florida Statutes, effective Dec. 1, 1970, by consolidating and closing these existing plans to new members: the Teachers’ Retirement System (Chapter 238, Florida Statutes), the State and County Officers and Employees’ Retirement System (Chapter 122, Florida Statutes), and the Highway Patrol Pension Trust Fund (Chapter 321, Florida Statutes). In 1972, the Judicial Retirement System (Chapter 123, Florida Statutes) was closed and consolidated into the FRS. The FRS was created to provide a defined benefit pension plan for participating public employees. The FRS was amended in 1998 to add the Deferred Retirement Option Program (DROP) under the defined benefit plan and amended in 2000 to provide a defined contribution plan alternative to the defined benefit plan for FRS members effective July 1, 2002. This integrated defined contribution plan is the FRS Investment Plan, which is administered by the State Board of Administration. Effective July 1, 2007, the Institute of Food and Agricultural Sciences (IFAS) Supplemental Retirement Program, established under Section 121.40, Florida Statutes, was consolidated under the Florida Retirement System Pension Plan as a closed retirement plan. Participation in the IFAS Supplemental Retirement Program does not constitute membership in the FRS.
Chapter 121, Florida Statutes, also provides for nonintegrated, optional retirement programs in lieu of the FRS to certain members of the Senior Management Service Class (SMSC) employed by the state, state elected officials who chose SMSC membership in lieu of Elected Officers’ Class membership, and faculty and specified employees in the State University System and Florida College System institutions. Provisions relating to the FRS are also contained in Chapter 112, Florida Statutes.
Covered Members and Classes:
FRS membership is compulsory for employees filling a regularly established position in a state agency, county agency, state university, state college, or district school board, unless restricted from FRS membership under Section 121.053 or Section 121.122, Florida Statutes, or allowed to participate in a non-integrated defined contribution plan in lieu of FRS membership. Participation by cities, municipalities, special districts, charter schools, and metropolitan planning organizations, although optional, is generally irrevocable after election to participate is made. Members hired into certain positions may be eligible to withdraw from the FRS altogether or elect to participate in the non-integrated optional retirement programs in lieu of the FRS except faculty of a medical college in a state university who must participate in the State University System Optional Retirement Program.
There are five classes of membership, as follows:
Regular Class – Members of the FRS who do not qualify for membership in the other classes.
Senior Management Service Class (SMSC) – Members in senior management level positions in state and local governments as well as assistant state attorneys, assistant statewide prosecutors, assistant public defenders, assistant attorneys general, deputy court administrators, assistant capital collateral representatives, and judges of compensation claims. Members of the Elected Officers’ Class may elect to withdraw from the FRS or participate in the SMSC in lieu of the Elected Officers’ Class.
Special Risk Class – Members who are employed as law enforcement officers, firefighters, firefighter trainers, fire prevention officers, state fixed-wing pilots for aerial firefighting surveillance, correctional officers, emergency medical technicians, paramedics, community-based correctional probation officers, youth custody officers (from July 1, 2001, through June 30, 2014), certain health-care related positions within state forensic or correctional facilities, or specified forensic employees of a medical examiner’s office or a law enforcement agency, and meet the criteria to qualify for this class.
29

Special Risk Administrative Support Class – Former Special Risk Class members who are transferred or reassigned to nonspecial risk law enforcement, firefighting, emergency medical care, or correctional administrative support positions within an FRS special risk-employing agency.
Elected Officers’ Class (EOC) – Members who are elected state and county officers and the elected officers of cities and special districts that choose to place their elected officials in this class.
Beginning July 1, 2001, through June 30, 2011, the FRS Pension Plan provided for vesting of benefits after six years of creditable service for members initially enrolled during this period. Members not actively working in a position covered by the FRS on July 1, 2001, must return to covered employment for up to one work year to be eligible to vest with less service than was required under the law in effect before July 1, 2001. Members initially enrolled on or after July 1, 2011, vest after eight years of creditable service. Members are eligible for normal retirement when they have met the requirements listed below. Early retirement may be taken any time after vesting within 20 years of normal retirement age; however, there is a 5 percent benefit reduction for each year prior to the normal retirement age.
Regular Class, Senior Management Service Class, and Elected Officers' Class Members – For members initially enrolled in the FRS before July 1, 2011, six or more years of creditable service and age 62, or the age after completing six years of creditable service if after age 62. Thirty years of creditable service regardless of age before age 62. For members initially enrolled in the FRS on or after July 1, 2011, eight or more years of creditable service and age 65, or the age after completing eight years of creditable service if after age 65. Thirty-three years of creditable service regardless of age before age 65.
Special Risk Class and Special Risk Administrative Support Class Members – For members initially enrolled in the FRS before July 1, 2011, six or more years of Special Risk Class service and age 55, or the age after completing six years of Special Risk Class service if after age 55. Twenty-five years of special risk service regardless of age before age 55. A total of 25 years of service including special risk service and up to four years of active duty wartime service and age 52. Without six years of Special Risk Class service, members of the Special Risk Administrative Support Class must meet the requirements of the Regular Class. For members initially enrolled in the FRS on or after July 1, 2011, eight or more years of Special Risk Class service and age 60, or the age after completing eight years of Special Risk Class service if after age 60. Thirty years of special risk service regardless of age before age 60. Without eight years of Special Risk Class service, members of the Special Risk Administrative Support Class must meet the requirements of the Regular Class.
Significant Plan Provisions:
The Florida Legislature establishes and amends the contribution requirements and benefit terms of the FRS Pension Plan. Benefits are computed on the basis of age and/or years of service, average final compensation, and service credit. Credit for each year of service is expressed as a percentage of the average final compensation. For members initially enrolled before July 1, 2011, the average final compensation is the average of the five highest fiscal years’ earnings; for members initially enrolled on or after July 1, 2011, the average final compensation is the average of the eight highest fiscal years’ earnings. The total percentage value of the benefit received is determined by calculating the total value of all service, which is based on the retirement plan and/or class to which the member belonged when the service credit was earned. The following chart shows the percentage value for each year of service credit earned:
30

Florida Retirement System
% Value
(per year of service)
Regular Class members initially enrolled before July 1, 2011
Retirement up to age 62 or up to 30 years of service ............................................................... 1.60%
Retirement at age 63 or with 31 years of service ...................................................................... 1.63%
Retirement at age 64 or with 32 years of service ...................................................................... 1.65%
Retirement at age 65 or with 33 or more years of service......................................................... 1.68%
Regular Class members initially enrolled on or after July 1, 2011
Retirement up to age 65 or up to 33 years of service ............................................................... 1.60%
Retirement at age 66 or with 34 years of service ...................................................................... 1.63%
Retirement at age 67 or with 35 years of service ...................................................................... 1.65%
Retirement at age 68 or with 36 or more years of service......................................................... 1.68%
Special Risk Class
Service from Dec. 1, 1970 through Sept. 30, 1974 ................................................................... 2.00%
Service on and after Oct. 1, 1974 ............................................................................................. 3.00%
Special Risk Administrative Support Class members initially enrolled before July 1, 2011
(With six or more years of special risk service, the service in this class counts towards specia l risk normal retirement; otherwise, Regular Class requirements apply.)
Retirement up to age 55; or up to 25 total years special risk service; or at age 52 with 25 years (if total service includes wartime military service) .................... 1.60%
Retirement at age 56; or with 26 total years special risk service; or at age 53 with 26 years (if total service includes wartime military service) .................... 1.63%
Retirement at age 57; or with 27 total years special risk service; or at age 54 with 27 years (if total service includes wartime military service) .................... 1.65%
Retirement at age 58; or with 28 total years special risk service; or at age 55 with 28 years (if total service includes wartime military service) .................... 1.68%
Special Risk Administrative Support Class members initially enrolled on or after July 1, 2011
(With eight or more years of special risk service, the service in this class counts towards special risk normal retirement; otherwise, Regular Class requirements apply.)
Retirement up to age 60; or up to 30 total years special risk service ........................................ 1.60%
Retirement at age 61; or with 31 total years special risk service .............................................. 1.63%
Retirement at age 62; or with 32 total years special risk service .............................................. 1.65%
Retirement at age 63; or with 33 total years special risk service .............................................. 1.68%
Elected Officers’ Class
Service as Supreme Court Justice, district court of appeal judge, circuit court judge, or county court judge ........................................................................... 3.33%
Service as Governor, Lt. Governor, Cabinet Officer, Legislator, state attorney, public defender, elected county officer, or elected official of a city or special district that chose EOC membership for its elected officials .............................................. 3.00%
Senior Management Service Class ............................................................................................ 2.00%
There are three steps in computing an annual retirement benefit:
Step 1. Determine the member’s retirement plan(s) and class(es) of membership, years of creditable service in each, and the total percentage value earned.
Step 2. Calculate the average final compensation.
Step 3. Multiply the figures obtained in Steps 1 and 2 to determine the annual normal retirement benefit. (If you elect to retire early, your benefit will be reduced by 5 percent for each year remaining before you would reach your normal retirement age. Your benefit may also be reduced if you elect to provide a continuing benefit to a beneficiary.)
31

Members must select one of the four benefit options at retirement:
Option 1 — Member receives a benefit for life with no continuing survivor benefit at death.
Option 2 — Member receives a reduced benefit for life. If member dies anytime within ten years after retiring, the beneficiary will receive the benefit for the remainder of the ten-year period from the member’s retirement date or DROP begin date. No survivor benefits are paid if the member dies ten or more years after the effective retirement date.
Option 3 — Member receives a reduced benefit for life. Upon the member’s death, the joint annuitant, if living, will receive the same benefit for life. A joint annuitant who is under age 25 and is the member’s child or other dependent for whom the member has guardianship will receive the member’s Option 1 benefit, but only until age 25, or, if disabled, until no longer disabled.
Option 4 — Member receives a reduced benefit for life. Upon the death of either the member or the joint annuitant, the survivor will receive a lifetime benefit equal to two-thirds of the benefit the member was receiving when both were living. A joint annuitant who is under age 25 and is the member’s child or other dependent for whom the member has guardianship will receive the member’s Option 1 benefit, but only until age 25, or, if disabled, until no longer disabled.
Members must end all employment relationships with all FRS employers for the first six calendar months after their DROP termination date or their non-DROP effective retirement dates to complete their retirement process, in addition to meeting all other requirements to receive monthly benefits payable under the FRS Pension Plan. Florida Retirement System members employed by an agency that withdrew from the FRS effective Jan. 1, 1996, for new employees must remain unemployed by that agency and all other FRS-covered employers for the first six calendar months.
The DROP is available under the FRS Pension Plan when the member first reaches eligibility for normal retirement. The DROP allows a member to retire while continuing employment for up to 60 months. While in the DROP, the member’s retirement benefits accumulate in the FRS Trust Fund increased by a cost-of-living adjustment (COLA) each July and earn monthly interest equivalent to an annual rate of 1.30 percent. (DROP participants with an effective DROP begin date before July 1, 2011, earn monthly interest equivalent to an annual rate of 6.50 percent.) As of June 30, 2015, the FRS Trust Fund held $3,119,220,735 in accumulated benefits for 34,829 participants in the DROP.
The election to participate in the DROP must be made within 12 months of the member’s normal retirement date, unless the member is eligible to defer the election. To participate for the maximum DROP period, the member must enter the DROP upon first reaching eligibility for normal retirement, or upon reaching an eligible deferral date as described below:
A Special Risk Class member initially enrolled in the FRS before July 1, 2011, who reaches the normal retirement date based upon years of service before reaching age 52 may defer DROP entry up to age 52 and still participate for 60 months. Also, a member of the Special Risk Administrative Support Class who has at least the number of years of Special Risk Class service required to be vested and reaches the normal retirement date based upon years of service before reaching age 52 may defer DROP entry up to age 52 and still participate for 60 months.
A Special Risk Class member initially enrolled in the FRS on or after July 1, 2011, who reaches the normal retirement date based upon years of service before reaching age 55 may defer DROP entry up to age 55 and still participate for 60 months. Also, a member of the Special Risk Administrative Support Class who has at least the number of years of Special Risk Class service required to be vested and reaches the normal retirement date based upon years of service before reaching age 55 may defer DROP entry up to age 55 and still participate for 60 months.
A member of the Regular Class, EOC, or the SMSC initially enrolled in the FRS before July 1, 2011, who reaches the normal retirement date before reaching age 57 may defer DROP entry until age 57 and still participate for 60 months. A member of the Special Risk Administrative Support Class who does not have the number of years of Special Risk Class service required to be vested would be subject to these deferral requirements.
A member of the Regular Class, EOC, or the SMSC initially enrolled in the FRS on or after July 1, 2011, who reaches the normal retirement date before reaching age 60 may defer DROP entry until age 60 and still participate for 60 months. A member of the Special Risk Administrative Support Class who does not have the number of years of Special Risk Class service required to be vested would be subject to these deferral requirements.
A member who reaches the normal retirement date during a term of office may defer the DROP election until the next succeeding term in that office and still participate for up to 60 months or until the end of that succeeding term, whichever is less.
A member who is employed as K-12 instructional personnel as defined in Section 1012.01(2), Florida Statutes, may elect to participate in the DROP at any time after reaching the normal retirement date and still participate for 60 months.
32
Upon termination, the DROP account is paid out as a lump sum payment, a rollover, or a combination partial lump sum payment and rollover, and monthly benefits are paid to the member in the amount as calculated upon entry into the DROP, plus a COLA for intervening years.
In most cases, the DROP participant must cease employment after a maximum of 60 months in the DROP, must satisfy the termination requirements for retirement and must comply with applicable reemployment restrictions thereafter. However, certain exceptions apply:
Effective July 1, 2002, a DROP participant who holds an elective office may end DROP participation and postpone compliance with termination requirements and reemployment limitations until no longer holding the elective office (including consecutive terms in the same office). For the period between the end of DROP participation and termination, no retirement credit is earned and the member’s DROP accumulation accrues no additional monthly benefits. If DROP participation began before July 1, 2010, the member’s DROP accumulation continues to earn interest after participation ends and before termination. If DROP participation begins on or after July 1, 2010, the DROP accumulation does not earn interest during the period after DROP participation ends and termination.
K-12 instructional personnel employed with a district school board, the Florida School for the Deaf and the Blind or a developmental research school of a state university may be allowed to extend their DROP participation for up to an additional 36 months beyond their initial 60-month DROP participation period. To qualify for the extension, the DROP participant must receive authorization from the employer and be approved by the division. If authorized to extend DROP participation, a participant must remain employed in an eligible position during the period of DROP extension.
There are two types of disability retirement available under the FRS: In-line-of-duty disability retirement and regular disability retirement. To qualify for either type of disability retirement, members must be totally and permanently disabled to the extent that they are unable to work in any job for any employer. In-line-of-duty disability benefits are available to members from their first day of employment. The minimum Option 1 benefit for in-line-of-duty disability retirement is 42 percent of their average final compensation for all members except those in the Special Risk Class, who receive a minimum Option 1 in-line-of-duty disability benefit of 65 percent of their average final compensation. To be eligible for regular disability retirement, members must complete eight years of creditable service. The minimum Option 1 benefit under regular disability retirement is 25 percent of their average final compensation. If a disabled member’s service benefit would be higher than the minimum disability benefit, the member may elect to receive the higher benefit.
If an active member dies in the line of duty, the spouse will receive a lifetime monthly benefit equal to one-half of the member’s monthly salary at death. If the spouse dies, the benefit will continue to be paid on behalf of the member’s dependent children until the youngest child reaches age 18 or is married, if earlier. If an active member dies before becoming vested and the death was not suffered in the line of duty, the designated beneficiary will receive a refund of any member-paid retirement contributions. However, if the active member dies within one year of vesting, the member’s joint annuitant may use the deceased member’s accumulated leave on an hour-by-hour basis, or the member’s eligible in-state or out-of-state service, to purchase enough service credit to vest the deceased member and receive monthly benefits.
If the member was vested at death, the beneficiary may receive a refund of any contributions that may have been paid by the member or, if the beneficiary qualifies as a joint annuitant, a lifetime monthly benefit calculated as though the member had retired on the month following the date of death and had chosen Option 3. If the joint annuitant is the member’s child or other dependent for whom the member has guardianship who is under age 25, the joint annuitant will receive the member’s maximum benefit until age 25, or, if disabled, until no longer disabled. A deceased member’s joint annuitant may buy any service credit that could have been claimed by the member at the time of death if the member’s termination of employment was due to death.
The benefits received by retirees and beneficiaries are increased by a COLA each July based on their June benefit amount (excluding the Retiree Health Insurance Subsidy benefit). For retirees who have been retired for less than 12 months on July 1, the first COLA increase is prorated. The COLA applies to all continuing monthly retirement benefits paid under the FRS Pension Plan (i.e., normal and early service retirement benefits and benefits accruing in participant accounts under the DROP, disability retirement benefits, and survivor benefits). The COLA for retirements or DROP participation effective before Aug. 1, 2011, is 3 percent per year. The COLA formula for retirees with an effective retirement date or DROP begin date on or after Aug. 1, 2011, will be the sum of the pre-July 2011 service credit divided by the total service credit at retirement multiplied by 3 percent. Each Pension Plan member with an effective retirement date of Aug. 1, 2011, or after will have an individual COLA factor for retirement. FRS Pension Plan members initially enrolled on or after July 1, 2011, will not have a COLA after retirement.
After retirement or the DROP termination date, retired FRS members may be employed by any private employer or any public employer not participating in the FRS without affecting their FRS benefits. However, restrictions apply to reemployment with an FRS employer regardless of whether the employment is covered for retirement. Any retired FRS
33
member who is reemployed by an FRS employer before meeting the definition of termination is not considered to have retired. Active membership will be reinstated and all benefits received must be repaid. If a member retires from an FRS employer that withdrew for new employees effective Jan. 1, 1996, the member must remain unemployed by the withdrawn employer to meet the definition of termination in order to finalize the retirement.
Upon meeting termination requirements, FRS retirees who are reemployed by FRS employers may not receive both salary and retirement benefits for the rest of the first 12 calendar months after retirement or the DROP termination date. The retirement benefit must be suspended in any month employed in any capacity by an FRS employer. There are no reemployment exceptions for the seventh through the twelfth calendar months after meeting the definition of termination (the first six calendar months).
Retirees of the FRS who are initially reemployed in regularly established positions no later than June 30, 2010, will have renewed membership in the Regular Class, the SMSC, or the EOC and earn credit toward a second-career benefit based on requirements for their class of membership. Having a break in service or not being employed on July 1, 2010, does not change a renewed member’s status. Once retirees have established renewed membership in the system, they will have the same opportunities to elect to participate in alternative defined contribution retirement programs instead of the FRS as do similarly situated newly hired members of that membership class until they retire. Renewed members are subject to the same vesting requirements and other limitations as apply to other active members. However, renewed members are not eligible to participate in the Special Risk Class, retire and participate in DROP, or to retire under disability retirement provisions.
FRS retirees who are initially reemployed on or after July 1, 2010, are not eligible for renewed membership. In addition to FRS Pension and Investment Plan retirees, the renewed membership restriction also includes retirees of the State University System Optional Retirement Program, the State Community College System Optional Retirement Program, the Senior Management Service Optional Retirement Programs, and local government senior managers who chose to withdraw from the FRS.
Whenever the division makes a decision that will reduce, suspend or terminate a member’s retirement benefits, the member may petition the division for a hearing. Section 28-106.201, Florida Administrative Code (F.A.C.), outlines the requirements for filing a petition. After the division reviews the petition, the state retirement director may ask a hearing officer from the Division of Administrative Hearings to conduct the hearing, or in some cases the Department of Management Services may conduct the hearing. If the outcome of the hearing is not in the member’s favor, the member will be informed of the time period during which the member can appeal the decision to the District Court of Appeal.
If, before retirement, a member commits a felony specified by law and is found guilty of or enters a plea of no contest to such crime, or their employment was terminated due to admission of committing, aiding, or abetting a specified crime, the member’s retirement rights and benefits are forfeited (except for a refund of personal retirement contributions, if any). The forfeiture of benefits provision applies in the case of any job-related felony offense as outlined below:
Committing, aiding or abetting an embezzlement of public funds or any grand theft from the employer;
Committing bribery in connection with employment;
Committing any other felony specified in Chapter 838, Florida Statutes, (bribery and misuse of public office), except Sections 838.15 and 838.16, Florida Statutes, (commercial bribes);
Committing any felony with intent to defraud the public or the employer of the right to receive the faithful performance of duty, or receiving or attempting to receive profit or advantage for the member or another person through the use of the member’s position; or
Committing an impeachable offense (applies to elected officials only); or
Committing of certain felony offenses against a minor through the use or attempted use of rights, privileges, duties, or position of public employment or office.
In addition to the aforementioned crimes, if a court of competent jurisdiction finds the member guilty of violating any state law against strikes by public employees, the member's benefits are forfeited.
If the member's designated beneficiary is found guilty of intentionally killing or procuring the death of the member, the beneficiary forfeits all rights to retirement benefits. Any benefits payable would then be paid as if the beneficiary died before the member.
The Clerk of the Court, the Secretary of the Senate or the employer, as appropriate, must notify the Commission on Ethics if the member is found guilty, impeached, or terminated prior to retirement due to any of the above offenses. The Commission on Ethics will notify the division. The member's benefits will be suspended subject to a hearing held by a hearing officer of the Division of Administrative Hearings. The hearing officer’s decision may be appealed to the District Court of Appeal. (See Section 112.3173, Florida Statutes, and Article II, Section 8, of the Florida Constitution for more information.)
34
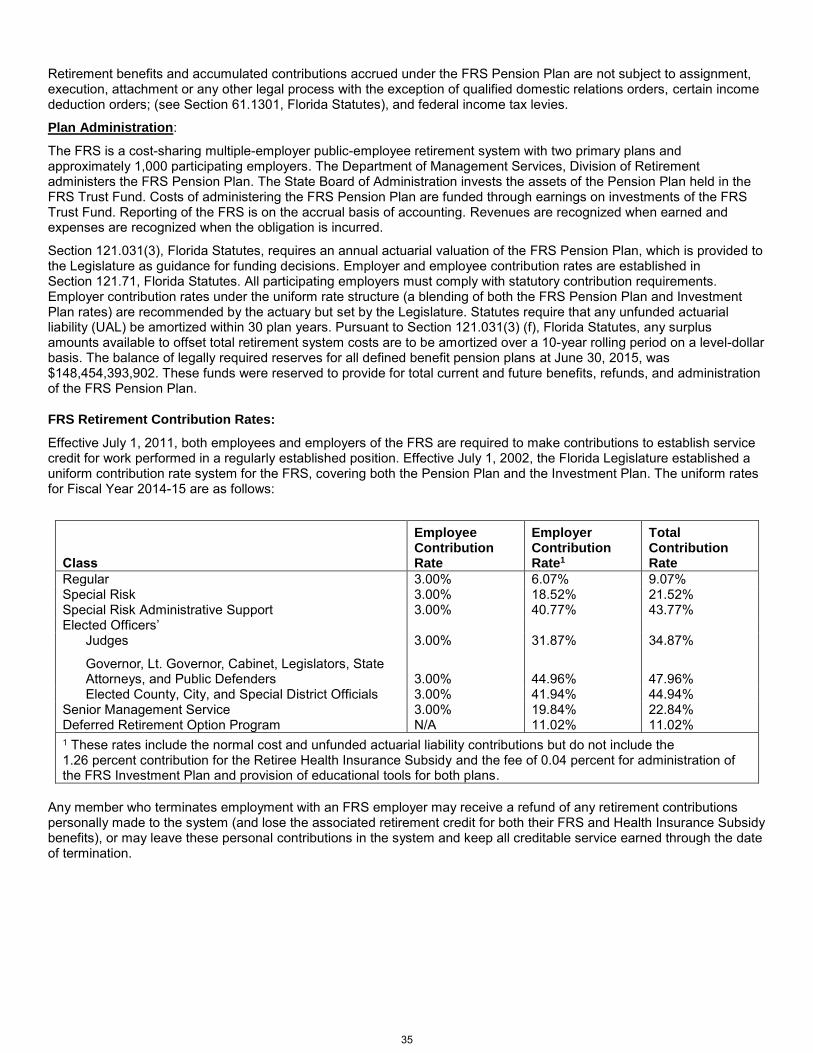
Retirement benefits and accumulated contributions accrued under the FRS Pension Plan are not subject to assignment, execution, attachment or any other legal process with the exception of qualified domestic relations orders, certain income deduction orders; (see Section 61.1301, Florida Statutes), and federal income tax levies.
Plan Administration:
The FRS is a cost-sharing multiple-employer public-employee retirement system with two primary plans and approximately 1,000 participating employers. The Department of Management Services, Division of Retirement administers the FRS Pension Plan. The State Board of Administration invests the assets of the Pension Plan held in the FRS Trust Fund. Costs of administering the FRS Pension Plan are funded through earnings on investments of the FRS Trust Fund. Reporting of the FRS is on the accrual basis of accounting. Revenues are recognized when earned and expenses are recognized when the obligation is incurred.
Section 121.031(3), Florida Statutes, requires an annual actuarial valuation of the FRS Pension Plan, which is provided to the Legislature as guidance for funding decisions. Employer and employee contribution rates are established in Section 121.71, Florida Statutes. All participating employers must comply with statutory contribution requirements. Employer contribution rates under the uniform rate structure (a blending of both the FRS Pension Plan and Investment Plan rates) are recommended by the actuary but set by the Legislature. Statutes require that any unfunded actuarial liability (UAL) be amortized within 30 plan years. Pursuant to Section 121.031(3) (f), Florida Statutes, any surplus amounts available to offset total retirement system costs are to be amortized over a 10-year rolling period on a level-dollar basis. The balance of legally required reserves for all defined benefit pension plans at June 30, 2015, was $148,454,393,902. These funds were reserved to provide for total current and future benefits, refunds, and administration of the FRS Pension Plan.
FRS Retirement Contribution Rates:
Effective July 1, 2011, both employees and employers of the FRS are required to make contributions to establish service credit for work performed in a regularly established position. Effective July 1, 2002, the Florida Legislature established a uniform contribution rate system for the FRS, covering both the Pension Plan and the Investment Plan. The uniform rates for Fiscal Year 2014-15 are as follows:
Class
Employee Contribution Rate
Employer Contribution Rate1
Total Contribution Rate
Regular 3.00% 6.07% 9.07% Special Risk 3.00% 18.52% 21.52% Special Risk Administrative Support 3.00% 40.77% 43.77% Elected Officers’
Judges 3.00% 31.87% 34.87%
Governor, Lt. Governor, Cabinet, Legislators, State Attorneys, and Public Defenders 3.00% 44.96% 47.96% Elected County, City, and Special District Officials 3.00% 41.94% 44.94%
Senior Management Service 3.00% 19.84% 22.84% Deferred Retirement Option Program N/A 11.02% 11.02%
1 These rates include the normal cost and unfunded actuarial liability contributions but do not include the 1.26 percent contribution for the Retiree Health Insurance Subsidy and the fee of 0.04 percent for administration of the FRS Investment Plan and provision of educational tools for both plans.
Any member who terminates employment with an FRS employer may receive a refund of any retirement contributions personally made to the system (and lose the associated retirement credit for both their FRS and Health Insurance Subsidy benefits), or may leave these personal contributions in the system and keep all creditable service earned through the date of termination.
35

FRS Membership:
Regular Special Special Risk Member Types Class SMSC Risk Admin Supp. EOC Total
Active1: Non-vested 142,119 1,523 19,050 3 413 163,108 Vested 404,176 6,393 51,052 79 1,770 463,470 Current Retirees And Beneficiaries 337,703 3,866 33,107 173 2,409 377,258 Vested Terminated1 105,273 1,415 6,403 17 404 113,512
Total Members 1,019,094 13,838 113,730 279 5,236 1,152,177
1 Member counts include 112,325 active and 8,450 vested terminated FRS Investment Plan members.
The table below provides additional information for the FRS Pension Plan as of June 30 (in thousands where amounts are dollars):
Fiscal Year Ended June 30
2015 2014 2013
Recipients 377,671 363,034 347,962
Contributions $3,136,389 $2,890,003 $2,027,998
Benefits paid $9,221,329 $8,014,634 $7,756,178
Fiduciary net position $148,454,394 $150,014,292 $129,852,5281
1 Fiduciary net position as of July 1, 2014, was restated.
2. Retiree Health Insurance Subsidy Program
The Retiree Health Insurance Subsidy (HIS) Program is a cost-sharing multiple-employer defined benefit pension plan established under Section 112.363, Florida Statutes. The Florida Legislature establishes and amends the contribution requirements and benefit terms of the HIS Program. The benefit is a monthly payment to assist retirees of state-administered retirement systems in paying their health insurance costs and is administered by the Department of Management Services, Division of Retirement. For the fiscal year ended June 30, 2015, eligible retirees and beneficiaries received a monthly HIS payment equal to the number of years of creditable service completed at the time of retirement multiplied by $5. The payments are at least $30 but not more than $150 per month, pursuant to Section 112.363, Florida Statutes. To be eligible to receive a HIS benefit, a retiree under a state-administered retirement system must provide proof of health insurance coverage, which can include Medicare.
The HIS Program is funded by required contributions from FRS participating employers as set by the Legislature. Employer contributions are a percentage of gross compensation for all active FRS members. For the fiscal year ended June 30, 2015, the contribution rate was 1.26 percent of payroll pursuant to Section 112.363, Florida Statutes. Health Insurance Subsidy contributions are deposited in a separate trust fund from which HIS payments are authorized. Health Insurance Subsidy benefits are not guaranteed and are subject to annual legislative appropriation. In the event the legislative appropriation or available funds fail to provide full subsidy benefits to all participants, the legislation may reduce or cancel HIS Payments.
Note 4 and the Actuarial section of this report include actuarial and other information regarding the HIS Program. The table below provides additional information for the HIS as of June 30 (in thousands where amounts are dollars):
Fiscal Year Ended June 30
2015 2014 2013
Recipients 336,529 323,098 310,139
Contributions $382,262 $342,566 $327,574
Benefits paid $425,086 $407,276 $390,973
Fiduciary net position $50,774 $93,385 $157,929
36

3. The Florida National Guard Supplemental Retirement Benefit Plan
The Florida National Guard Supplemental Retirement Benefit Plan is a single-employer, non-qualified defined benefit pension plan established under Section 250.22, Florida Statutes, and is administered by the Department of Management Services, Division of Retirement. The Florida Legislature establishes and amends the benefit terms of the plan, which provide a monthly benefit equal to the difference between 50 percent of the federal military pay table for the highest rank held while in the Florida National Guard and the reservist benefit received from the federal government for military service. The benefit amount is recalculated whenever the federal military pay table is increased or the federal benefit is increased by a cost of living adjustment. Florida National Guard retirees must have at least 30 years of Florida National Guard service. The benefit is payable for the lifetime of the retiree without a survivor benefit option. Normal retirement is at age 62 with early retirement available beginning at age 60. The Florida National Guard Supplemental Retirement Benefit Plan is funded by an annual appropriation from General Revenue by the Legislature. Any appropriated funds not obligated for benefit payments and expenses owed at June 30 each year revert to the General Revenue Fund.
Note 4 and the Actuarial section of this report include actuarial and other information regarding the Florida National Guard Supplemental Retirement Benefit Plan. The table below provides additional information for the plan as of June 30 (in thousands where amounts are dollars):
Fiscal Year Ended June 30
2015 2014
Active Members
Vested 447 454
Non-Vested 11,000 10,413
Total Active 11,447 10,867
Terminated Vested 129 126
Retirees 792 777
Fiscal Year Ended June 30
2015 2014
Benefits paid $14,423 $14,465
Fiduciary net position $0 $0
37

C. Defined Contribution Programs (Optional Retirement Programs) State University System Optional Retirement Program (SUSORP) Section 121.35, Florida Statutes, created the SUSORP for eligible State University System faculty, administrators, and administrative and professional staff. The Florida Legislature establishes and amends the contribution requirements and benefit terms of the Program. This program is designed to aid universities in recruiting employees who may not remain in the FRS long enough to vest. The SUSORP is a defined contribution plan that provides full and immediate vesting of all contributions paid on behalf of the participants to the participating provider companies to invest as directed by the participant to provide retirement and death benefits. Employees in eligible positions are compulsory participants in the SUSORP unless they elect FRS membership. Faculty in a college of medicine with a faculty practice plan are mandatory SUSORP participants and cannot elect FRS membership. The employers were statutorily required to contribute 5.15 percent of the participants’ gross monthly compensation from July 2014 through June 2015. In accordance with Chapter 60U-2, F.A.C., 0.01 percent of the employer contribution rate was used for the administration of the SUSORP program and 5.14 percent was transferred to the provider companies designated by the participant. SUSORP members are not eligible to receive (HIS) payments from the HIS Trust Fund. There is an HIS component included in the employer’s contribution deposited to the members’ accounts. Effective July 1, 2011, there is a mandatory employee contribution of 3 percent. A participant may contribute by salary reduction an amount not to exceed the percentage contributed by the employer.
When applicable, the employer is also required to contribute the unfunded actuarial liability (UAL) contribution for the Regular Class on the salaries of SUSORP members which is transferred to the FRS Trust Fund to help amortize any UAL. The UAL contribution required for the fiscal year 2014-15 was 2.54 percent. Additional information pertaining to the SUSORP is as follows:
Members 18,228
Payroll $1,660,585,350
Contributions:
Employee $85,866,214
Employer $82,951,015
Senior Management Service Optional Annuity Program (SMSOAP) Section 121.055, Florida Statutes, created the SMSOAP as an optional retirement program for state members of the Senior Management Service Class. The Florida Legislature establishes and amends the contribution requirements and benefit terms of the Program. The SMSOAP is a defined contribution plan that provides full and immediate vesting of all contributions paid on behalf of the participants to the participating provider companies to invest as directed to provide retirement and death benefits. Employees in eligible state positions may make an irrevocable election to participate in the SMSOAP in lieu of the Senior Management Service Class (SMSC). Employers were required to contribute 6.27 percent of covered payroll from July 2014 through June 2015. The employers’ contributions were transferred to the provider companies designated by the participant. SMSOAP members are not eligible to receive (HIS) payments from the HIS Trust Fund. There is an HIS component included in the employer’s contribution deposited to the members’ accounts. Effective July 1, 2011, there is a mandatory employee contribution of 3 percent. A participant may contribute by salary reduction an amount not to exceed the percentage contributed by the employer. When applicable, the employer is also required to contribute the unfunded actuarial liability (UAL) contribution for the SMSC on the salaries of SMSOAP members which is transferred to the FRS Trust Fund to help amortize the UAL. The required UAL contribution rate for fiscal year 2014-15 was 15.04 percent. Additional information pertaining to the SMSOAP is as follows:
Members 25
Payroll $3,145,500
Contributions:
Employee $118,485
Employer $210,655
38
D. Social Security Coverage
The Division of Retirement is responsible for administering the Social Security coverage for public employers in Florida. Public employees are provided Social Security coverage through a federal-state agreement with various modifications applicable to specific employers in political subdivisions. As of June 30, 2015, there were 667 modifications to the initial 1951 agreement. Existing modifications provide Social Security coverage for most state, county, and district school board employees and employees of a number of cities and special districts. Public employers must provide Social Security coverage for their employees who participate in the FRS Pension Plan and Investment Plan, SUSORP, SMSOAP, and the existing defined benefit plans grandfathered under the FRS except for members of the Teachers’ Retirement System or the IFAS Supplemental Retirement Program.
For the 2015 calendar year, the combined Social Security contribution rate for employees and employers totaled 15.30 percent (12.40 percent for Old Age, Survivors, and Disability Insurance and 2.90 percent for Medicare). The maximum taxable wage base on which Old Age, Survivors, and Disability Insurance contributions were paid increased from $117,000 to $118,500. There is no limitation on Medicare wages.
39
NOTE 2 – SUMMARY OF SIGNIFICANT ACCOUNTING POLICIES
A. Measurement Focus and Basis of Accounting
The accompanying financial statements have been prepared in accordance with generally accepted accounting principles as prescribed by GASB. The fiduciary financial statements are reported using the economic resources measurement focus and the accrual basis of accounting. Under this method, revenues are recorded when earned and expenses are recorded at the time liabilities are incurred. Member contributions are recognized in the period of time for which the contributions are assessed. Employer contributions are recognized when due in the period in which employee services are performed and the employer has made a formal commitment to provide the contributions. Benefits and refunds are recognized when due and payable in accordance with the terms of each plan. The government-wide financial statements are reported using the economic resources measurement focus and the accrual basis of accounting. Revenues are recorded when earned, while expenses are recorded when a liability is incurred, regardless of the timing of cash flows. Governmental fund financial statements are reported using the current financial resources measurement focus and the modified accrual basis of accounting. Revenues are recognized as they become susceptible to accrual, generally when they are both measurable and available. Revenues collected within 60 days of the end of the current fiscal year are considered available. Liabilities due within 60 days of the end of the current fiscal year are expected to be liquidated with expendable financial resources. Expenditures generally are recorded when a liability is incurred, as under accrual accounting. B. Basis of Presentation
Defined Benefit and Defined Contribution Trust Funds – fiduciary funds used to report resources that are required to be held in trust for the members and beneficiaries of the state’s pension plan, retiree health insurance subsidy program, national guard supplemental retirement benefit plan and optional retirement plans. Police and Firefighters’ Premium Tax Trust Fund – a governmental special revenue fund that accounts for excise taxes assessed on insurance premiums. The premiums are used to supplement the funding of municipal police and firefighter pension plans and relief funds. C. Assets, Deferred Outflows of Resources, Liabilities, Deferred Inflows of Resources, and Net Position/Fund
Balance
Cash and Cash Equivalents Cash and cash equivalents include cash on hand and short-term investments with an original maturity date within 90 days of the acquisition date. State treasury cash management pools are included as cash. Details of deposits are included in Note 3. A. Investments
Florida Statutes authorize the state to invest in various instruments. The state reports investments in accordance with GASB Codification Section I50, Investments.
Investments with the State Treasury are reported at fair value which is obtained from independent pricing service providers. Independent pricing service providers use quoted market prices when available and employ various, sometimes proprietary, multifactor models for determining a security’s fair value if it is not available from quoted market prices. Some securities, including U.S. government, municipal bonds, and mortgage-backed and asset-backed securities, are priced using evaluated bid prices. Evaluated bid prices are determined by taking bid prices and adjusting them by an evaluated adjustment factor derived from the independent pricing service’s multifactor model. If values are not available using the above methods, secondary methods such as non-evaluated mid-price and bid price are used. If no source of values is available, cost or last available price from any source is used or other pricing methodology as directed by the State Treasury.
The State Board of Administration (SBA) has statutory responsibility for custody and investment of pension plan assets. Section 215.47, Florida Statutes, gives the SBA the authority to invest in a range of instruments, including security lending
40
agreements. All of the investments are reported at fair value in accordance with GASB 31. Realized and unrealized gains and losses are reflected in the statements of changes in net position as “Net appreciation in fair value.”
The fair values of the plans’ assets are obtained or estimated in accordance with the Global Pricing Guidelines established with the SBA’s custodian bank, BNY Mellon. BNY Mellon uses a variety of independent pricing sources and designates certain vendors as the primary source based on asset type, class or issue. BNY Mellon monitors pricing information supplied by these primary sources and may use a supplemental pricing source or change the primary pricing source if any of the following occurs:
The price of a security is not received from the primary pricing source.
The primary pricing source no longer provides prices for a particular asset type, class or issue.
The SBA or its portfolio investment manager challenges a price and BNY Mellon reviews the price with the vendor, who agrees that the price provided by that vendor may not be appropriate.
The price from the primary source exceeds BNY Mellon’s price tolerance checkpoints and results in a vendor comparison review where another source is deemed to be more appropriate by BNY Mellon.
When a portfolio includes securities or instruments for which the custodian bank does not receive fair value information from its vendor pricing source, the custodian bank uses a “non-vendor pricing source.” Examples include, but are not limited to, limited partnerships or similar private investment vehicles that do not actively trade through established exchange mechanisms; other private placements where there is limited or no information in the market place; and unique fixed income and equity instruments. The SBA does not provide direction regarding the substitution of prices in instances where securities or instruments are in the portfolio of an investment manager appointed by the SBA. In cases where the SBA directed the purchase of securities or instruments, BNY Mellon may obtain the non-vendor prices by contacting the SBA only if it is not commercially reasonable to directly obtain the non-vendor price information from the broker of record, as identified by the SBA.
For private market investments, where no readily ascertainable market value exists (including limited partnerships, hedge funds, direct-owned real estate, and real estate pooled funds), fair values for the individual investments are based on the net asset value (capital account balance) at the closest available reporting period, as communicated by the general partner and/or investment manager, adjusted for subsequent contributions and distributions. The valuation techniques vary based upon investment type and involve a certain degree of judgment. The most significant input into the net asset value of an entity is the value of its investment holdings. The net asset value is provided by the general partner and/or investment manager and reviewed by SBA management. Annually, the financial statements of all private market investments are audited by independent auditors.
Private market investments in which the SBA has a controlling interest are also required to be valued annually by independent, licensed external appraisers selected by an appraisal management company retained by the SBA.
All derivative financial instruments are reported at fair value in the statements of net position. The instruments are adjusted to fair value at least monthly, with valuation changes recognized during the period as gains or losses in the statements of changes in net position and included in the “net appreciation in fair value”. The nature and use of derivative instruments is discussed in Note 3. Because of the inherent uncertainty of the valuation using pricing methodologies other than the quoted market prices, the estimated fair values may differ from the values that would have been used had a ready market existed.
Investment detail is included in Note 3.
Capital Assets Tangible capital assets are recorded at cost at the time of acquisition. All property, furniture and equipment with an original acquisition cost of $1,000 or more is capitalized, as well as other selected items regardless of cost, such as computer equipment. Depreciation is computed on the straight-line basis over the estimated useful life of the asset. Deferred Outflows of Resources A consumption of net assets by the division that is applicable to a future reporting period is presented as a deferred outflow of resources. The State University System Optional Retirement Program (SUSORP) Trust Fund shares in reporting the FRS and HIS pension liabilities and related components with other funds within the state. Each fiscal year end, the SUSORP Trust Fund recognizes its allocated share of the state’s deferred outflows of resources related to applicable pensions, as determined by the Florida Department of Financial Services, Statewide Financial Reporting Section.
41

Compensated Absences Liability Employees earn the right to be compensated during absences for vacation and illness as well as for unused special compensatory leave earned for hours worked on legal holidays and other specifically authorized overtime. Compensated absences for annual leave are recorded as a liability when the benefits are earned. Compensated absences for sick leave are calculated based on the vesting method. Within the limits established by law or rule, the value of unused leave benefits will be paid to employees upon separation from state service. The amounts reported for compensated absences are based on current year-end salary rates and include employer Social Security and Medicare tax and pension contributions, as applicable, at current rates. Refer to Note 6 for details of the compensated absences liability. Long-term Liabilities The SUSORP Trust Fund shares the reported FRS and HIS pension liabilities and related components with other funds within the state. Each fiscal year end, the SUSORP Trust Fund recognizes its allocated share of the state’s applicable pension liability, as determined by the Florida Department of Financial Services, Statewide Financial Reporting Section. The division shares the cost of Other Postemployment Benefits (OPEB) with other funds within the state. The state-administered retirement funds recognize their proportionate share of the state’s OPEB liability, as determined by the Florida Department of Financial Services, Statewide Financial Reporting Section. Refer to Note 6 for changes in long-term liabilities. Deferred Inflows of Resources A deferred inflow of resources is an acquisition of net assets by the division that is applicable to a future reporting period. The SUSORP Trust Fund shares the reported FRS and HIS pension liabilities and related components with other funds within the state. Each fiscal year end, the SUSORP Trust Fund recognizes its allocated share of the state’s deferred inflows of resources related to applicable pensions, as determined by the Florida Department of Financial Services, Statewide Financial Reporting Section. Components of Net Position Net position is classified as (1) net investment in capital assets, (2) restricted, and (3) unrestricted. Restricted net position is reported when constraints are placed on net position that are either (a) externally imposed by creditors, grantors, contributors, or laws or regulations of other governments, or (b) imposed by law through constitutional provisions or enabling legislation. The net position of all the fiduciary funds reported are classified as restricted for pension. Components of Fund Balance Fund balance is classified as nonspendable, restricted, committed or unassigned. Committed fund balance includes amounts that can be used only for the specific purposes determined by a formal action of the State’s highest level of decision-making authority, the Legislature and the Governor, i.e., through legislation passed into law. Commitments may only be modified or rescinded by equivalent formal, highest-level action. The fund balance of the Police and Firefighters’ Premium Tax Trust Fund reported in this CAFR is classified as committed. D. Contributions
Contributions are recognized as revenues when due, pursuant to statutory and contractual requirements. Total employer contributions for the FRS are determined on a uniform basis (blended rate) as required by Part III of Chapter 121, Florida Statutes, and employers also pay a required assessment to cover financial planning education costs for all FRS members and administrative costs of the FRS Investment Plan (IP). For purposes of financial statement presentation, the unfunded actuarial liability (UAL) portion of the employer’s total contribution remitted on the salaries of members in the FRS IP, the SUSORP, the State Community College System Optional Retirement Program, and the Senior Management Service Optional Annuity Program (SMSOAP) is classified as contributions in the FRS Pension Plan financial statements. Other items, such as delinquent fees and recovery of benefit overpayments, are reported as other income. The administrative fee paid on the salaries of members in the SUSORP defined contribution plan is classified as other income. Refer to Section J, Accounting and Reporting Changes.
42
Employee contributions required pursuant to Section 121.71(3), Florida Statutes, are accounted for by the FRS as employer-paid employee contributions and are treated as employer contributions under 26 U.S.C. s. 414(h)(2) allowing these contributions to be deducted on a pre-tax basis.
E. Adjustments Between Governmental Fund and Governmental Activities Financial Statement Amounts
The adjustments necessary to convert the Governmental Fund financial statements to the governmental activities financial statement presentation are: (1) Recognition of long-term liabilities which are not due and payable in the current period and therefore are not reported in the Governmental Fund; (2) Recognition of expenses not recognized under governmental accounting; and (3) Reclassification of Fund Balance reported in the Governmental Fund into the Net Position categories reported for governmental activities in the Statement of Net Position. F. Interfund Activity and Balances
In the fund financial statements, transfers represent flows of assets without equivalent flows of assets in return or a requirement for repayment. Transfers are recorded when a fund receiving revenue provides it to the fund which expends the resources. Transfers between funds are made to accomplish various provisions of law. Refer to Note 5.
G. Use of Estimates
The preparation of financial statements in accordance with generally accepted accounting principles requires management to make estimates and assumptions that affect the reported amounts of assets and liabilities at the date of the financial statements and reported amounts of revenues (additions) and expenses (deductions) during the reporting period. Actual results could differ from those estimates. H. Investment and Administrative Expenses For investments in the State Treasury cash management pool, an administrative fee is charged on the average daily balance in the account. These fees are recorded as ‘Investment activity expense’ on the Statement of Changes in Fiduciary Net Position. For investments managed by the SBA, external investment managers are hired to invest a significant portion of the retirement system’s assets. Investment management fees are typically paid based on individually-negotiated investment management agreements. The fees, usually paid quarterly, may be based on a sliding scale of the portfolio’s net asset value at quarter-end, calculated by multiplying each level of net position by a specified basis point charge, or may be performance related, typically associated with exceeding a market benchmark or hurdle rate. Fees are paid from the appropriate manager’s portfolio and are recognized as an expense over the time period for which the fees are applicable. These fees are recorded as ‘Investment activity expense’ on the Statement of Changes in Fiduciary Net Position. Certain investment management fees, usually in private equity portfolios, are paid at the beginning of the period. These fees are recorded as ‘Prepaid items’ on the Statement of Fiduciary Net Position and are expensed over their applicable time period. Administrative expenses represent the cost of administering the various state-administered retirement systems, including such costs as salaries, rent, telephone, printing and the like. Administrative expenses also include transfers for administrative assessments, depreciation expense, and the allocated share of compensated absences’ expense, Other Postemployment Benefit (OPEB) liability costs, and applicable pension-related expenses. A detailed Schedule of Administrative Expenses is located in the Other Supplementary Schedules section. I. Restatement Fiduciary net position at July 1, 2014, for the SUSORP has been decreased by $67,927 for the program’s share of the applicable beginning pension liability, pursuant to implementation requirements of GASB Statement No. 68, Accounting and Financial Reporting for Pensions. The SUSORP recognizes its allocated share of the state’s portion of net pension liabilities, deferred outflows/inflows of resources, and pension-related expenses related to applicable pensions, as determined by the Florida Department of Financial Services, Statewide Financial Reporting Section.
43

J. Accounting and Reporting Changes
Florida National Guard Supplemental Retirement Plan
The Florida National Guard Supplemental Retirement Benefit Plan is a single-employer, non-qualified defined benefit pension plan established under Section 250.22, Florida Statutes. The plan pays a monthly supplemental benefit to eligible Florida National Guard retirees funded by an annual legislative appropriation from the General Revenue Fund. In prior years, this plan was considered de minimis and was accounted for as a component of the Florida Retirement System. As of the fiscal year ended June 30, 2014, the long-term liabilities of the Florida National Guard Supplemental Retirement Benefit Plan were determined to be material and are accounted for separately in the financial statements. Contributions and Other Income For purposes of financial statement presentation, the unfunded actuarial liability (UAL) portion of the employer’s total contribution remitted on the salaries of members in the defined contribution plans is reported as contributions in the FRS Pension Plan. In prior years, these amounts were reported as transfers into the FRS and transfers out of the defined contribution plans. Other items, such as delinquent fees and recovery of benefit overpayments, were previously reported as contributions but are now reported as other income. The administrative fee paid on the salaries of members in the SUSORP defined contribution plan is classified as other income; in prior years it was reported as contributions. Pensions The SUSORP is a defined contribution plan administered by the division. Division employees who are FRS members administer the SUSORP, and, therefore, this plan shares in the reporting of the net pension liability and related components with other funds within the state, as determined by the Florida Department of Financial Services, Statewide Financial Reporting Section.
44
NOTE 3 – PLAN INVESTMENTS A. Deposits As of June 30, 2015, the state-administered retirement fund deposits in financial institutions pending investment totaled $722,768,630 for fiduciary activities. There were no deposits in financial institutions for governmental activities.
1. Custodial Credit Risk
The custodial credit risk for deposits is the risk that, in the event of the failure of a depository financial institution, the state will not be able to recover deposits or will not be able to recover collateral securities that are in the possession of an outside party. The state mitigates custodial credit risk by generally requiring public funds to be deposited in a bank or savings association that is designated by the Chief Financial Officer (CFO) as authorized to receive deposits in the state and meets the collateral requirements set forth in Chapter 280, Florida Statutes.
The CFO determines the collateral requirements and collateral pledging level for each Qualified Public Depository (QPD) following guidelines outlined in Section 280.04, Florida Statutes, and Department of Financial Services Rules, Chapter 69C-2, Florida Administrative Code. Collateral pledging levels include 25, 50, 110, and 150 percent of a QPD’s average daily deposit balance, or, if needed, an amount as prescribed by the CFO. Section 280.13, Florida Statutes, outlines eligible types of collateral including direct obligations of the United States (U.S.) Government, federal agency obligations fully guaranteed by the U.S. Government, certain federal agency obligations, state and local government obligations, corporate bonds, and letters of credit issued by a Federal Home Loan Bank. Also, with the CFO’s permission, eligible collateral includes collateralized mortgage obligations, real estate mortgage investment conduits and securities or other interests in any open-end management investment company registered under the Investment Company Act of 1940. However, the portfolio of the investment company must be limited to direct obligations of the U.S. Government and to repurchase agreements fully collateralized by such direct obligations of the U.S. Government, and the investment company must take delivery of such collateral either directly or through an authorized custodian.
In accordance with Section 280.08, Florida Statutes, if a QPD defaults, losses to public depositors are first satisfied with any applicable depository insurance, followed by demands of payment under any letters of credit or sale of the defaulting QPD’s collateral. If necessary, any remaining losses are to be satisfied by assessments against the other participating QPDs according to a statutory based ratio. At June 30, 2015, the Florida Retirement System (FRS) Pension Trust Fund held deposits in foreign currencies, totaling $160,256,719 in the SBA’s custodian nominee name that were uninsured and uncollateralized.
2. Foreign Currency Risk
Foreign currency risk is the risk that changes in exchange rates will adversely affect the fair value of a deposit. Under Section 215.47, Florida Statutes, and subject to the limitations and conditions of the State Constitution or of the trust agreement relating to a trust fund, moneys available for investments by the State Board of Administration (SBA) may be invested in fixed income obligations or stocks denominated in foreign currency. The SBA has developed total fund investment policies for the investment of assets in the FRS Pension Trust Fund that set ranges on investments by asset class in each fund. Under the investment policy statement approved by SBA Trustees effective January 1, 2015, foreign and domestic equity securities are included in the global equity asset class. The FRS Pension Trust Fund has target allocations to global equities of 53 percent, with a policy of 45-70 percent, but within this range there are no limits on the amount of foreign equity securities that are not denominated in U.S. dollars. Florida law limits the exposure to foreign securities held outside of commingled trusts to 50 percent of the total fund. The investment plan may be modified in the future if the SBA adopts changes. This investment activity in foreign investments resulted in deposits in foreign currency as of June 30, 2015, as illustrated in the following schedule (in thousands):
45

B. Investments Surplus cash is maintained in the State Treasury’s general pool of investments. The State CFO pools funds from all State agencies. Included in the pool are primarily time deposits, U.S. Government securities, federal agency securities, commercial paper, corporate bonds and notes, and repurchase agreements. The FRS Pension Trust Fund, Health Insurance Subsidy Program (HIS), National Guard Supplemental Benefit Plan (National Guard), State University System Optional Retirement Program (SUSORP), Senior Management Service Optional Annuity Program (SMSOAP), and Police and Firefighters’ Premium Tax Trust Fund (Police and Fire)’s share of the investment pool was $4,154,994, $75,463, $72,500, $4,245,887, $57,573, and $12,001,555 at June 30, 2015, respectively. No allocation will be made as to the share of the types of investments or their risk categories for the FRS Pension Trust Fund, the HIS Program, the National Guard Plan, the SUSORP, the SMSOAP, or Police and Fire. The share of the assets and liabilities for the FRS Pension Trust Fund, the HIS Program, the National Guard Plan, the SUSORP, the SMSOAP and Police and Fire arising from the securities lending agreements administered by the State Treasury will likewise not be carried on the Statements of Net Position since the State Treasury operates on a pooled basis and to do so may give the misleading impression that the funds themselves have entered into such agreements. For further information, refer to the State of Florida’s Comprehensive Annual Financial Report or publications of the State of Florida Department of Financial Services.
FRS Pension
Currency Trust Fund
Australian dollar 17,014$
Brazilian real 2,243
British pound sterling 25,719
Canadian dollar 6,825
Chilean peso 124
Danish krone 889
Egyptian pound 211
Euro currency unit 32,727
Hong Kong dollar 8,138
Hungarian forint 13
Indian rupee 4,684
Indonesian rupiah 294
Israeli shekel 739
Japanese yen 34,524
Kenyan shilling 618
Malaysian ringgit 628
Mexican peso 267
New Zealand dollar 703
Nigerian naira 2
Norwegian krone 2,599
Pakistan rupee 173
Philippines peso 95
Polish zloty 228
Qatari riyal 147
Singapore dollar 2,101
South African rand 1,636
South Korean won 1,275
Swedish krona 1,826
Swiss franc 1,164
Taiwan new dollar 11,885
Thailand baht 189
Turkish lira 502
UAE dirham 43
Other 32
Total deposits subject to
foreign currency risk 160,257$
Foreign Currency Deposits Held
As of June 30, 2015
Bank Statement Balance (in U.S. dollars)
46
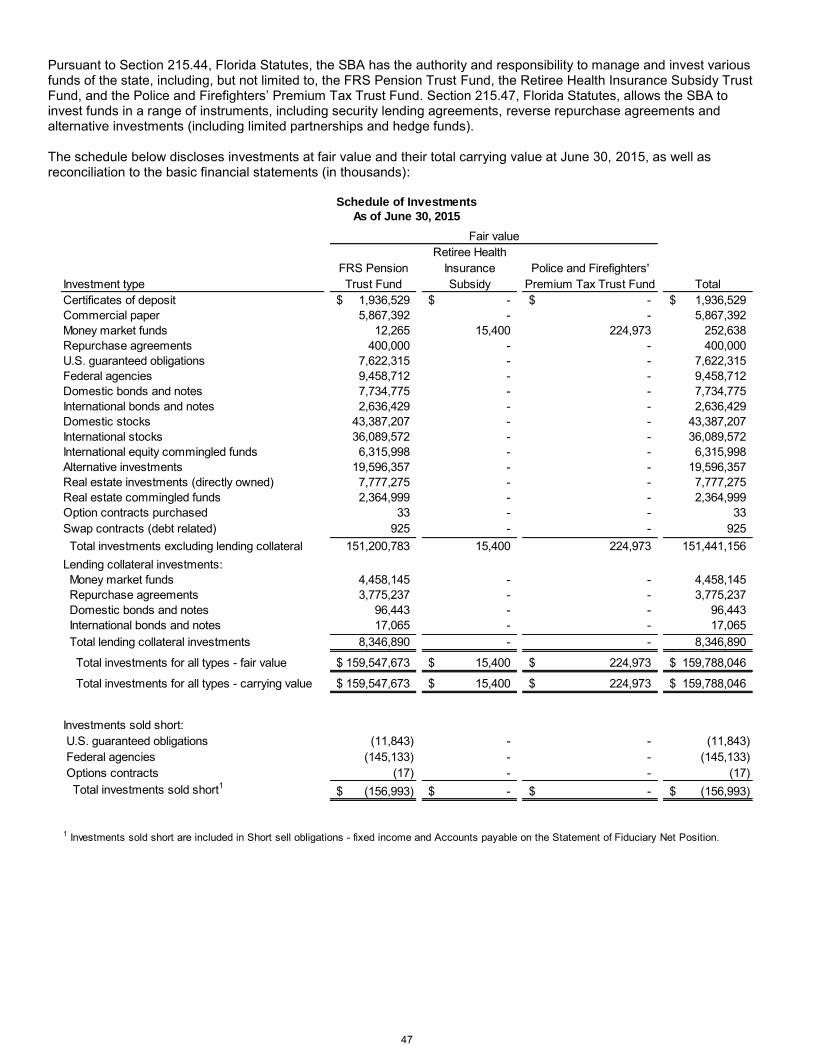
Pursuant to Section 215.44, Florida Statutes, the SBA has the authority and responsibility to manage and invest various funds of the state, including, but not limited to, the FRS Pension Trust Fund, the Retiree Health Insurance Subsidy Trust Fund, and the Police and Firefighters’ Premium Tax Trust Fund. Section 215.47, Florida Statutes, allows the SBA to invest funds in a range of instruments, including security lending agreements, reverse repurchase agreements and alternative investments (including limited partnerships and hedge funds). The schedule below discloses investments at fair value and their total carrying value at June 30, 2015, as well as reconciliation to the basic financial statements (in thousands):
Retiree Health
FRS Pension Insurance Police and Firefighters'
Investment type Trust Fund Subsidy Premium Tax Trust Fund Total
Certificates of deposit 1,936,529$ -$ -$ 1,936,529$
Commercial paper 5,867,392 - - 5,867,392
Money market funds 12,265 15,400 224,973 252,638
Repurchase agreements 400,000 - - 400,000
U.S. guaranteed obligations 7,622,315 - - 7,622,315
Federal agencies 9,458,712 - - 9,458,712
Domestic bonds and notes 7,734,775 - - 7,734,775
International bonds and notes 2,636,429 - - 2,636,429
Domestic stocks 43,387,207 - - 43,387,207
International stocks 36,089,572 - - 36,089,572
International equity commingled funds 6,315,998 - - 6,315,998
Alternative investments 19,596,357 - - 19,596,357
Real estate investments (directly owned) 7,777,275 - - 7,777,275
Real estate commingled funds 2,364,999 - - 2,364,999
Option contracts purchased 33 - - 33
Swap contracts (debt related) 925 - - 925 - ......
Total investments excluding lending collateral 151,200,783 15,400 224,973 151,441,156 - ......
Lending collateral investments:
Money market funds 4,458,145 - - 4,458,145
Repurchase agreements 3,775,237 - - 3,775,237
Domestic bonds and notes 96,443 - - 96,443
International bonds and notes 17,065 - - 17,065 - ......
Total lending collateral investments 8,346,890 - - 8,346,890 8,346,890 8,346,890$
Total investments for all types - fair value 159,547,673$ 15,400$ 224,973$ 159,788,046$ -$
Total investments for all types - carrying value 159,547,673$ 15,400$ 224,973$ 159,788,046$
Investments sold short:
U.S. guaranteed obligations (11,843) - - (11,843)
Federal agencies (145,133) - - (145,133)
Options contracts (17) - - (17)
Total investments sold short1 (156,993)$ -$ -$ (156,993)$
Schedule of Investments
As of June 30, 2015
Fair value
1 Investments sold short are included in Short sell obligations - fixed income and Accounts payable on the Statement of Fiduciary Net Position.
47

Reconciliation of carrying value to the basic financial statements (in thousands):
Certain investments included in the above schedule were pledged as collateral with the SBA’s futures and swaps clearing brokers. These investments are presented below (in thousands):
In addition, cash required to open futures contracts (i.e., initial margin) in the FRS Pension Trust Fund was pledged as collateral with the SBA’s futures brokers. Variation margins received from or paid to clearing brokers may be required as frequently, as daily, and represent the net settlement of profit or loss (i.e., the fair value increase or decrease) on open positions in futures and swaps. The initial and variation margin amounts held by brokers, and the variation margins held by the SBA in the FRS Pension Trust Fund as of June 30, 2015, are included in the “Accounts receivable” and “Accounts payable and accrued liabilities” balances, respectively, on the Statement of Fiduciary Net Position. These amounts are presented in the table below (in thousands):
Governmental Fiduciary
activities funds Total
Investments 224,973$ 151,216,183$ 151,441,156$
Security lending collateral - 8,346,890 8,346,890
Total Investments 224,973$ 159,563,073$ 159,788,046$
Investment Type Fair Value
U.S. guaranteed obligations 22,974$
Federal agencies 14,833
Domestic stocks 24,966
Total 62,773$
FRS Pension Trust Fund
Securities Pledged as Collateral for Futures and Swaps Contracts
As of June 30, 2015
Fair value (U.S. dollar)
Margin receivable from broker:
Futures initial margin 8,597$
Futures variation margin 7,136
Swaps variation margin 3,789
Total margin receivable 19,522$
Margin payable to broker:
Futures variation margin 6,674$
Swaps variation margin 1,390
Total margin payable 8,064$
FRS Pension Trust Fund
Cash and Foreign Currency Pledged as Collateral for Futures and Swaps Contracts
As of June 30, 2015
48

1. Credit Risk and Concentration of Credit Risk of Debt Securities
Credit risk is the risk that an issuer or other counterparty to an investment will not fulfill its obligations. Concentration of credit risk is the risk of loss attributed to the magnitude of the state’s investment in a single issuer. The State Treasury Investment Pool’s current rating by Standard and Poor’s was A+f as of June 30, 2015.
The SBA, in compliance with Section 215.47, Florida Statutes, has adopted certain investment policies with regard to credit risk of debt securities. Investment policies vary by fund or portfolio. Below are the investment policies and credit risk disclosures for the FRS Pension Trust Fund.
Investments are generally managed through individual portfolios within various asset classes, as listed below. Some of the individual portfolios have slightly different restrictions on credit quality.
Short-term Portfolio – Securities must be high quality at the time of purchase. For short-term investment ratings, this is defined as the highest applicable rating from one of the three nationally recognized statistical rating organizations (NRSROs) – Standard & Poor’s (S&P) A-1, Moody’s P-1, Fitch F1. For long-term investment ratings, this is defined as a minimum mid-single A rating from one of the three NRSROs – S&P A, Moody’s A2, Fitch A.
Mortgage Index Portfolio – Securities are generally limited to those issued by the Government National Mortgage Association (GNMA), Federal National Mortgage Association (FNMA), and Federal Home Loan Mortgage Corporation (FHLMC). No specific credit rating criteria are listed.
Intermediate Aggregate Less MBS Index Portfolio – Securities should be rated investment grade by at least one of the three NRSROs at the time of purchase. Minimum ratings include S&P BBB-, Moody’s Baa3, and Fitch BBB-. This portfolio primarily contains U.S. Treasuries, government agencies, and corporates.
Core portfolios – Securities should generally be rated investment grade by one of the three NRSROs at the time of purchase. Minimum ratings include S&P BBB-, Moody’s Baa3, and Fitch BBB-. Securities of a single issuer are generally limited to 5 percent of the market value of the portfolio (excluding U.S. Treasuries and Agencies). These portfolios can contain: U.S. Treasuries; government agencies; investment grade residential mortgage backed, commercial mortgage backed and asset backed securities; investment grade foreign sovereign debt; municipals; and corporates.
Lending portfolios – Under investment policy guidelines in effect for the FRS Pension Trust Fund since May 2015, eligible cash collateral investments are:
Tri-party qualified repurchase agreement transactions in which the subject securities thereunder will be
repurchased by the seller no later than one business day from the purchase date, and such repurchase
agreements are collateralized by U.S. Treasury bills, notes and/or bonds, U.S. Government Agency securities,
and U.S. Government Agency mortgage backed securities having a market value of at least 100 percent of the
market value of the securities subject to being repurchased.
Money market mutual funds regulated by SEC rule 2a-7 and rated the highest applicable rating by at least one of
the three NRSROs – S&P AAAmmf, Moody’s Aaamf, Fitch AAAmmf.
U.S. Treasury bills, notes, and bonds.
Under investment policy guidelines in effect during the fiscal year prior to this new policy, eligible cash collateral could only be invested in tri-party qualified repurchase agreement transactions that were collateralized by “U.S. Government securities” having a market value of at least 100 percent of the market value of securities subject to being repurchased, and money market mutual funds regulated by SEC rule 2a-7. “U.S. Government Securities” means any security issued or guaranteed as to principal or interest by the United States, or by a person controlled or supervised by and acting as an instrumentality of the Government of the United States pursuant to authority granted by the Congress of the United States, or any certificate of deposit for any of the foregoing, including without limitation notes, bonds and other debt securities issued by the FNMA and the FHLMC. In addition to tri-party repurchase agreements, investments purchased prior to the policy guidelines established in December 2008 are being held to maturity in existing lending portfolios. The previous investment policy guidelines contained short-term rating requirements that were similar to the current short-term portfolio rating requirements. Repurchase agreements were required to be fully collateralized.
49

The FRS Pension Trust Fund did not hold any investments with a single issuer representing 5 percent or more of the fund’s fair market value at June 30, 2015. The schedule below discloses credit quality ratings on investments held in the FRS Pension Trust Fund at June 30, 2015 (in thousands):
All futures, options and swaps contracts held by the FRS Pension Trust Fund at June 30, 2015, were exchange traded, therefore minimizing counterparty credit risk through the use of a futures and swap clearing merchant and a clearing house.
S&P Moody Total2
A-1/AAAm 10,337,802$ -$ 5,867,392$ 4,470,410$ -$ -$ -$ -$
AAA 1,202,995 - - - - - 653,190 549,805
AA 1,733,439 99,992 - - 370,254 9,700 948,396 305,097
A 3,419,301 - - - - 1,050 2,590,631 827,620
BBB 3,143,907 - - - - - 2,478,599 665,308
BB 123,659 - - - - - 54,475 69,184
B 20,410 - - - - - 20,410 -
CCC 30,429 - - - - - 30,429 -
D 3,159 - - - - - 3,159 -
Not rated Aaa 606,020 - - - 10 17,004 506,708 82,298
Not rated Aa 226,493 149,988 - - - 4,572 58,120 13,813
Not rated A 132,841 - - - - - 125,336 7,505
Not rated Baa 120,567 - - - - - 60,900 59,667
Not rated Ba 4,918 - - - - - 4,918 -
Not rated Caa 9,218 - - - - - 9,218 -
Not rated Ca 4,374 - - - - - 4,374 -
Not rated Not rated 12,760,775 1,686,549 - - 1,292,288 9,426,386 282,355 73,197
33,880,307 1,936,529$ 5,867,392$ 4,470,410$ 1,662,552$ 9,458,712$ 7,831,218$ 2,653,494$
Ratings not applicable:
Repurchase agreements3 2,512,685
U.S. guaranteed obligations3 7,622,315
Domestic stocks 43,387,207
International stocks 36,089,572
International equity
commingled funds 6,315,998
Alternative investments 19,596,357
Real estate investments 10,142,274
Options purchased 33
Swaps 925
Total investments 159,547,673$
3 U.S. obligations and repurchase agreements that are collateralized by securities explicitly guaranteed by the U.S. government do not require disclosure of credit quality.
FRS Pension Trust Fund
Credit Quality Ratings
As of June 30, 2015
Credit Rating1
1 S&P ratings were primarily used. If S&P did not rate a security, then Moody ratings were used, if available. If neither rating agency issued a rating, the security was listed as
"Not rated." Long-term ratings are presented except for "A-1", which is a top tier short-tem rating for S&P, and "AAAm", the top money market fund rating for S&P.
Certificates
of deposit
Commercial
paper
Money market
funds
Repurchase
agreements
Federal
agencies
Domestic
bonds and notes
International
bonds and notes
2All FRS investments are included in this schedule, including security lending collateral investments.
50

Counterparty credit ratings for spot and forward foreign currency exchange contracts held in the FRS Pension Trust Fund at June 30, 2015, are listed below (in thousands):
The Police and Firefighters’ Premium Tax Trust Fund and the Retiree Health Insurance Subsidy Trust Fund had investments in money market funds, totaling $224,973,176 and $15,399,687, respectively, which held an S&P rating of AAAm at June 30, 2015. 2. Custodial Credit Risk Custodial credit risk for investments is the risk that, in the event of the failure of the counterparty to a transaction, the state will not be able to recover the value of investment or collateral securities that are in the possession of an outside party. The SBA’s custodial credit risk policy states that custodial credit risk will be minimized through the use of trust accounts maintained at top tier third party custodian banks. To the extent possible, negotiated trust and custody contracts shall require that all deposits, investments, and collateral be held in accounts in the SBA’s name, or in the case of certain foreign investments, in an omnibus client account, but separate and apart from the assets of the custodian banks. This policy applies to investments evidenced by cash or securities, and does not apply to investments evidenced by contractual agreements such as private equity or real estate investments. As required by negotiated trust and custody contracts, many of the state’s investments were held in the state’s name (or, in the case of certain foreign investments, in an omnibus client account) by the SBA’s custodial financial institutions at June 30, 2015. Investments that were uninsured and unregistered, with securities held by the counterparty, or by its trust department, included the following (in thousands):
S&P Moody Fitch
AA/A-1 Aaa/P-1 AA/F1 407,169$ (408,200)$ (1,031)$
AA/A-1 Aa/P-1 AA/F1 852 (852) -
AA/A-1 NR/P-1 AA/F1 9,367 (9,266) 101
A/A-1 Aa/P-1 AA/F1 20,186 (20,202) (16)
A/A-1 Aa/P-1 A/F1 687 (688) (1)
A/A-1 A/P-1 AA/F1 4,493 (4,495) (2)
A/A-1 A/P-1 A/F1 297,840 (300,054) (2,214)
A/A-1 NR/P-1 AA/F1 6,515 (6,510) 5
A/A-1 NR/P-1 A/F1 3,186 (3,208) (22)
A/A-1 NR/NR NR/NR 132 (132) -
A/A-2 Aa/P-1 A/F1 493,014 (488,187) 4,827
BBB/A-1 NR/P-2 NR/NR 292,565 (292,285) 280
NR/NR NR/P-1 NR/NR 639,860 (641,107) (1,247)
NR/NR NR/NR A/F1 35,933 (35,930) 3
NR/NR NR/NR NR/NR 98,782 (98,619) 163
Total: 2,310,581$ (2,309,735)$ 846$
1 If no rating exists, "NR" is reported.
FRS Pension Trust Fund
Foreign Currency Exchange Contract Counterparty Credit Ratings
As of June 30, 2015
Counterparty Credit Rating (Long Term)1Receivable
Fair Value
Payable Fair
Value
Net Unrealized
Gain (Loss)
Fair Value
Invested security lending collateral:
Repurchase agreements 459,782$
Domestic bonds and notes 96,443
International bonds and notes 7,387
Total 563,612$
FRS Pension Trust Fund
Custodial Credit Risk
As of June 30, 2015
51
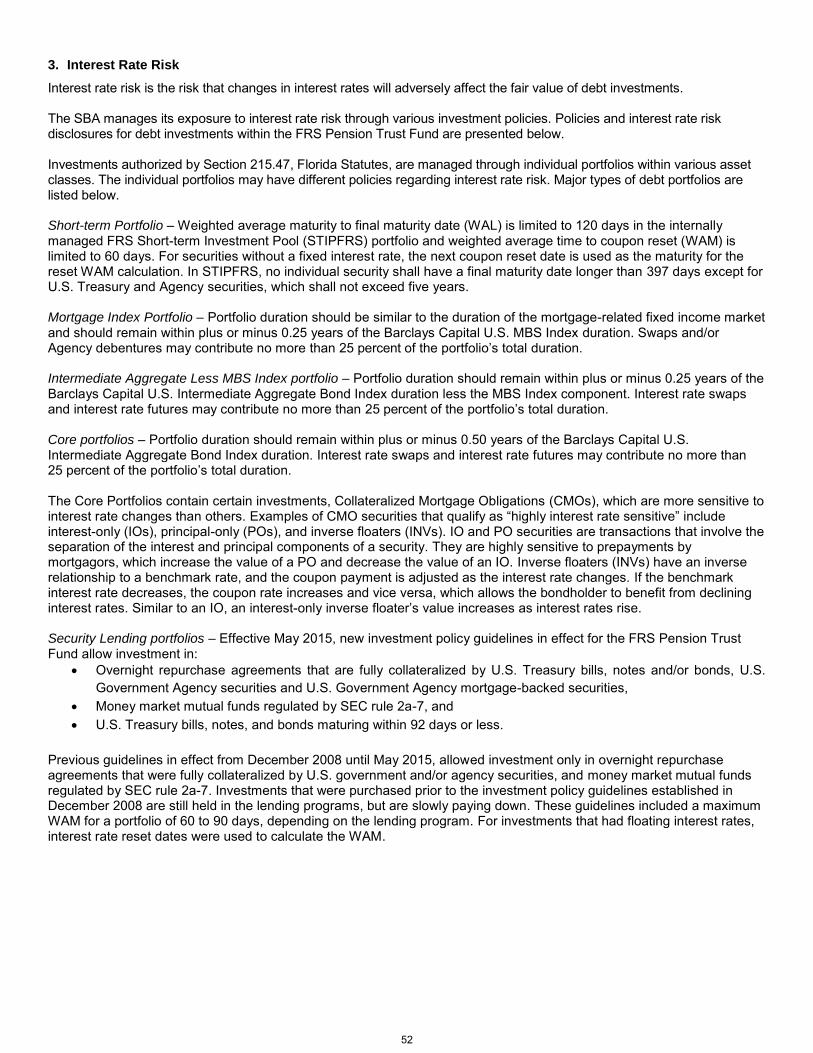
3. Interest Rate Risk
Interest rate risk is the risk that changes in interest rates will adversely affect the fair value of debt investments. The SBA manages its exposure to interest rate risk through various investment policies. Policies and interest rate risk disclosures for debt investments within the FRS Pension Trust Fund are presented below. Investments authorized by Section 215.47, Florida Statutes, are managed through individual portfolios within various asset classes. The individual portfolios may have different policies regarding interest rate risk. Major types of debt portfolios are listed below. Short-term Portfolio – Weighted average maturity to final maturity date (WAL) is limited to 120 days in the internally managed FRS Short-term Investment Pool (STIPFRS) portfolio and weighted average time to coupon reset (WAM) is limited to 60 days. For securities without a fixed interest rate, the next coupon reset date is used as the maturity for the reset WAM calculation. In STIPFRS, no individual security shall have a final maturity date longer than 397 days except for U.S. Treasury and Agency securities, which shall not exceed five years. Mortgage Index Portfolio – Portfolio duration should be similar to the duration of the mortgage-related fixed income market and should remain within plus or minus 0.25 years of the Barclays Capital U.S. MBS Index duration. Swaps and/or Agency debentures may contribute no more than 25 percent of the portfolio’s total duration. Intermediate Aggregate Less MBS Index portfolio – Portfolio duration should remain within plus or minus 0.25 years of the Barclays Capital U.S. Intermediate Aggregate Bond Index duration less the MBS Index component. Interest rate swaps and interest rate futures may contribute no more than 25 percent of the portfolio’s total duration. Core portfolios – Portfolio duration should remain within plus or minus 0.50 years of the Barclays Capital U.S. Intermediate Aggregate Bond Index duration. Interest rate swaps and interest rate futures may contribute no more than 25 percent of the portfolio’s total duration. The Core Portfolios contain certain investments, Collateralized Mortgage Obligations (CMOs), which are more sensitive to interest rate changes than others. Examples of CMO securities that qualify as “highly interest rate sensitive” include interest-only (IOs), principal-only (POs), and inverse floaters (INVs). IO and PO securities are transactions that involve the separation of the interest and principal components of a security. They are highly sensitive to prepayments by mortgagors, which increase the value of a PO and decrease the value of an IO. Inverse floaters (INVs) have an inverse relationship to a benchmark rate, and the coupon payment is adjusted as the interest rate changes. If the benchmark interest rate decreases, the coupon rate increases and vice versa, which allows the bondholder to benefit from declining interest rates. Similar to an IO, an interest-only inverse floater’s value increases as interest rates rise. Security Lending portfolios – Effective May 2015, new investment policy guidelines in effect for the FRS Pension Trust Fund allow investment in:
Overnight repurchase agreements that are fully collateralized by U.S. Treasury bills, notes and/or bonds, U.S.
Government Agency securities and U.S. Government Agency mortgage-backed securities,
Money market mutual funds regulated by SEC rule 2a-7, and
U.S. Treasury bills, notes, and bonds maturing within 92 days or less.
Previous guidelines in effect from December 2008 until May 2015, allowed investment only in overnight repurchase agreements that were fully collateralized by U.S. government and/or agency securities, and money market mutual funds regulated by SEC rule 2a-7. Investments that were purchased prior to the investment policy guidelines established in December 2008 are still held in the lending programs, but are slowly paying down. These guidelines included a maximum WAM for a portfolio of 60 to 90 days, depending on the lending program. For investments that had floating interest rates, interest rate reset dates were used to calculate the WAM.
52
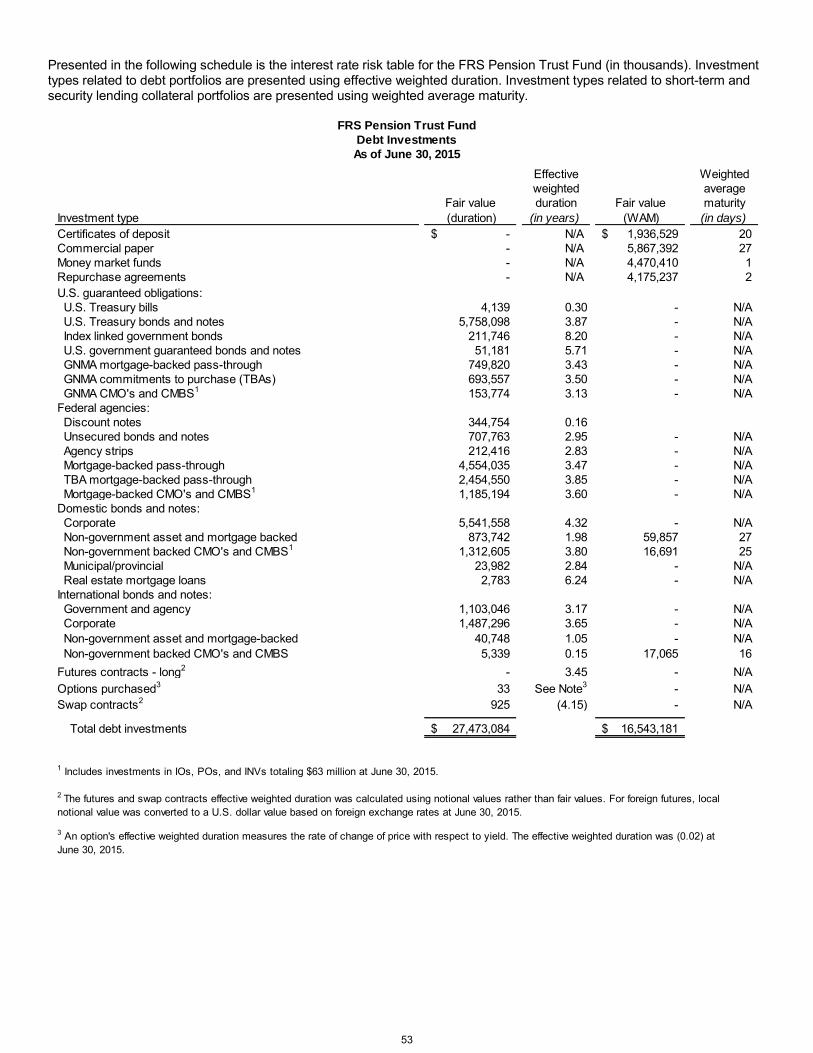
Presented in the following schedule is the interest rate risk table for the FRS Pension Trust Fund (in thousands). Investment types related to debt portfolios are presented using effective weighted duration. Investment types related to short-term and security lending collateral portfolios are presented using weighted average maturity.
Effective Weighted
weighted average
Fair value duration Fair value maturity
Investment type (duration) (in years) (WAM) (in days)
Certificates of deposit -$ N/A 1,936,529$ 20
Commercial paper - N/A 5,867,392 27
Money market funds - N/A 4,470,410 1
Repurchase agreements - N/A 4,175,237 2
U.S. guaranteed obligations:
U.S. Treasury bills 4,139 0.30 - N/A
U.S. Treasury bonds and notes 5,758,098 3.87 - N/A
Index linked government bonds 211,746 8.20 - N/A
U.S. government guaranteed bonds and notes 51,181 5.71 - N/A
GNMA mortgage-backed pass-through 749,820 3.43 - N/A
GNMA commitments to purchase (TBAs) 693,557 3.50 - N/A
GNMA CMO's and CMBS1 153,774 3.13 - N/A
Federal agencies:
Discount notes 344,754 0.16
Unsecured bonds and notes 707,763 2.95 - N/A
Agency strips 212,416 2.83 - N/A
Mortgage-backed pass-through 4,554,035 3.47 - N/A
TBA mortgage-backed pass-through 2,454,550 3.85 - N/A
Mortgage-backed CMO's and CMBS1 1,185,194 3.60 - N/A
Domestic bonds and notes:
Corporate 5,541,558 4.32 - N/A
Non-government asset and mortgage backed 873,742 1.98 59,857 27
Non-government backed CMO's and CMBS1 1,312,605 3.80 16,691 25
Municipal/provincial 23,982 2.84 - N/A
Real estate mortgage loans 2,783 6.24 - N/A
International bonds and notes:
Government and agency 1,103,046 3.17 - N/A
Corporate 1,487,296 3.65 - N/A
Non-government asset and mortgage-backed 40,748 1.05 - N/A
Non-government backed CMO's and CMBS 5,339 0.15 17,065 16
Futures contracts - long2 - 3.45 - N/A
Options purchased3 33 See Note3 - N/A
Swap contracts2 925 (4.15) - N/A
Total debt investments 27,473,084$ 16,543,181$
FRS Pension Trust Fund
Debt Investments
As of June 30, 2015
2 The futures and swap contracts effective weighted duration was calculated using notional values rather than fair values. For foreign futures, local
notional value was converted to a U.S. dollar value based on foreign exchange rates at June 30, 2015.
3 An option's effective weighted duration measures the rate of change of price with respect to yield. The effective weighted duration was (0.02) at
June 30, 2015.
1 Includes investments in IOs, POs, and INVs totaling $63 million at June 30, 2015.
53

The effective duration of the State Treasury Investment Pool at June 30, 2015, was approximately 2.67 years. Interest rate risk information for debt investments sold short is presented below (in thousands):
The Police and Firefighters’ Premium Tax Trust Fund and the Retiree Health Insurance Subsidy Trust Fund had investments in money market funds, totaling $224,973,176 and $15,399,687, respectively, which had daily liquidity at June 30, 2015. 4. Foreign Currency Risk
Foreign currency risk is the risk that changes in exchange rates will adversely affect the fair value of an investment. The FRS Pension Trust Fund had exposure to foreign currency risk at June 30, 2015. These funds are managed primarily by the use of “asset classes”. The FRS Pension Trust Fund investment policy, approved by SBA Trustees effective January 1, 2015, limits the global equity asset class (including domestic and foreign equities) to a policy range of 45-70 percent and a target allocation of 53 percent. All asset classes may hold non-U.S. securities, depending on portfolio guidelines. Within the global equity asset class, the FRS Pension Trust Fund holds units in international equity commingled funds. The FRS Pension Trust Fund owns only a portion of the overall investment in the funds, which are also owned by other investors. Equity linked notes are participatory notes that allow the FRS Pension Trust Fund to participate in certain foreign equity markets where direct participation is not possible due to local government regulations, tax policies, or other reasons. The FRS Pension Trust Fund’s unit holdings in the overall investments or notes themselves may be valued in U.S. dollars, but a portion of the underlying assets are exposed to foreign currency risk in various currencies. Within the alternative investment asset class, the FRS Pension Trust owns an interest in several alternative investment commingled funds (primarily limited partnerships) with other investors and, therefore, owns only a portion of the overall investment in the funds. For the alternative investment funds denominated in U.S. dollars, some of the underlying investments may be exposed to foreign currency risk in various currencies. The alternative investment funds denominated in Euro currency units are included in the foreign currency risk table below. Other alternative investments with potential exposure to foreign currency risk totaled $17.4 billion as of June 30, 2015.
Fair value Effective weighted
Investment type (duration) duration (in years)
GNMA commitments to sell (TBAs) (11,843)$ 3.24
FNMA, FHLMC commitments to sell (TBAs) (145,133) 3.47
Futures contracts20 4.22
Options sold3(17) See Note3
Total debt investments sold short (156,993)$
3 An option's effective weighted duration measures the rate of change of price with respect to yield. Effective
weighted duration was (.01) at June 30, 2015.
FRS Pension Trust Fund
Sold Short1 Debt Investment Positions
As of June 30, 2015
1 Investments sold short are reported as liabilities on the Statement of Fiduciary Net Position.
2 The futures contracts effective weighted duration was calculated using notional values rather than fair values. For
foreign futures, local notional value was converted to a U.S. dollar value based on foreign exchange rates at
June 30, 2015.
54

Presented below in U.S. dollars are the FRS Pension Trust Fund investments exposed to foreign currency risk as of June 30, 2015, listed for each major asset type, by currency (in thousands):
In addition to the investments presented above, the FRS Pension Trust Fund holds positions in futures contracts that are subject to foreign currency risk. A futures contract is an agreement between two parties, a buyer and a seller, to exchange a particular good for a particular price at a particular date in the future, all of which are specified in a contract common to all participants in a market on an organized futures exchange. Upon entering into a futures contract, collateral is deposited with the broker, in the SBA’s name, in accordance with the initial margin requirements of the broker. Futures contracts are marked to market daily by the board of trade or exchange on which they are traded. The resulting gain/loss is received/paid the following day until the contract expires. The frequency of cash flows depends upon specified collateral and margin limits mutually agreed upon by the SBA and the third-party broker. The margin payments are exposed to foreign currency risk. The FRS Pension Trust Fund’s futures contract positions at June 30, 2015, that have exposure to foreign currency risk are presented below (values in thousands):
Currency Equity
Alternative
Investments Fixed Income
Australian dollar 1,191,743$ -$ -$
Brazilian real 466,067 - -
British pound sterling 5,667,070 413 -
Canadian dollar 1,461,287 - -
Chilean peso 25,764 - -
Danish krone 359,608 - -
Egyptian pound 38,629 - -
Euro currency unit 7,490,040 410,370 -
Hong Kong dollar 2,511,811 - -
Hungarian forint 36,560 - -
Indian rupee 530,925 - -
Indonesian rupiah 111,122 - -
Israeli shekel 81,576 - -
Japanese yen 5,061,576 - -
Kenyan shilling 21,686 - -
Malaysian ringgit 147,957 - -
Mexican peso 211,216 - -
New Zealand dollar 49,496 - -
Nigerian naira 49,172 - -
Norwegian krone 215,902 - -
Omani rial 14,469 - 195
Pakistani rupee 23,499 - -
Philippines peso 114,618 - -
Polish zloty 80,819 - -
Qatari riyal 48,006 - -
Singapore dollar 510,134 - -
South African rand 484,997 - -
South Korean won 905,714 - -
Sri Lankan rupee 22,731 - -
Swedish krona 727,736 - -
Swiss franc 2,351,834 - -
Taiwan new dollar 753,626 - -
Thailand baht 198,953 - -
Turkish lira 212,228 - -
United Arab Emirates dirham 65,203 - -
Other 50,857 - -
Equity linked notes (various currencies) 129,240 - -
International equity commingled funds 6,315,998 - -
Total investments subject to foreign currency risk 38,739,869$ 410,783$ 195$
FRS Pension Trust Fund
Investments Exposed to Foreign Currency Risk (fair values in U.S. dollars, in thousands)
As of June 30, 2015
FRS Pension Trust Fund Investment Type
55

The FRS Pension Trust Fund also enters into foreign currency exchange contracts, which are agreements to exchange the currency of one country for the currency of another country at an agreed-upon price and settlement date. In the FRS Pension Trust Fund a currency overlay program is used to seek additional value and is run independently of the underlying equity assets. Currently, there are two types of foreign currency contracts being utilized by the FRS Pension Trust Fund. Spot currency contracts are used primarily for trade settlement and currency repatriation and are valued at spot (traded) currency rates. Forward currency contracts are valued at interpolated forward rates and are generally used to mitigate currency risk for changes in value associated with foreign holdings, payables and/or receivables. These contracts are recorded as receivables and payables on the Statement of Fiduciary Net Position. All of the contracts are subject to foreign currency risk. A schedule of the FRS Pension Trust Fund’s foreign currency exchange contracts outstanding at June 30, 2015, is presented below, by currency (in thousands):
FRS Pension Trust Fund
Futures Positions Exposed to Foreign Currency Risk
As of June 30, 2015
In U.S. dollars
Notional Notional
Number of Traded Market Unrealized
Currency Contracts1 Exposure Exposure Gain/(Loss)2
Bond Futures:
Euro BTP Euro currency unit 709 95,674 92,319 (3,355) (3,738)$
Euro Bund Euro currency unit (568) (87,858) (86,336) 1,522 (1,696)$
Stock Index Futures:
GBP FTSE 100 Index British pound sterling 275 18,244 17,858 (386) (606)$
Canada S&P/TSE 60 Index Canadian dollar 87 14,849 14,684 (165) (133)$
DJ Euro STOXX 50 Euro currency unit 631 21,502 21,681 179 200$
TOPIX Index Future Japanese yen 222 3,663,623 3,619,710 (43,913) (359)$
2 Margin receipts or payments are settled periodically in the respective local currency and are subject to foreign currency risk.
In Local Currency
1 Long positions are positive and short positions are negative.
Unrealized
Gain/(Loss)
56

Currency to Buy
Amount to Buy
(Local
Currency) Currency to Sell
Amount to Sell
(Local
Currency)
Receivable Fair
Value
(U.S. dollars)
Payable Fair
Value
(U.S. dollars)
Net Unrealized
Gain/(Loss)
(U.S. dollars)
Australian dollar 21,959 U.S. dollar (17,084) 16,868$ (17,084)$ (216)$
Brazilian real 162,805 U.S. dollar (51,375) 51,857 (51,375) 482
British pound sterling 27,251 U.S. dollar (42,452) 42,842 (42,452) 390
Canadian dollar 15,148 U.S. dollar (12,216) 12,129 (12,216) (87)
Chilean peso 21,056,102 U.S. dollar (33,671) 32,846 (33,671) (825)
Chinese yuan renminbi 111,434 U.S. dollar (18,120) 18,146 (18,120) 26
Columbian peso 10,711,943 U.S. dollar (4,090) 4,088 (4,090) (2)
Danish krone 9,010 U.S. dollar (1,369) 1,349 (1,369) (20)
Euro currency unit 909 British pound sterling (644) 1,013 (1,013) -
Euro currency unit 143,383 U.S. dollar (161,056) 159,853 (161,056) (1,203)
Hong Kong dollar 245 Japanese yen (3,869) 32 (32) -
Hong Kong dollar 21,400 U.S. dollar (2,760) 2,760 (2,760) -
Hungarian forint 1,060,000 Euro currency unit (3,396) 3,742 (3,788) (46)
Hungarian forint 5,269,943 U.S. dollar (19,100) 18,619 (19,100) (481)
Indian rupee 3,729,368 U.S. dollar (57,536) 58,048 (57,536) 512
Indonesian rupiah 628,193,642 U.S. dollar (45,853) 46,424 (45,853) 571
Israeli shekel 45,576 U.S. dollar (11,904) 12,082 (11,904) 178
Japenese yen 843,316 Australian dollar (8,948) 6,892 (6,877) 15
Japenese yen 4,408 British pound sterling (23) 36 (36) -
Japenese yen 9,529,044 U.S. dollar (77,200) 77,906 (77,200) 706
Malaysian ringgit 17,189 U.S. dollar (4,599) 4,532 (4,599) (67)
Mexican peso 250,019 U.S. dollar (16,247) 15,899 (16,247) (348)
Moroccan dirham 1,598 U.S. dollar (164) 164 (164) -
New Zealand dollar 7,830 U.S. dollar (5,549) 5,264 (5,549) (285)
Norwegian krone 282,167 U.S. dollar (35,906) 35,848 (35,906) (58)
Pakistan rupee 3,826 U.S. dollar (37) 37 (37) -
Peruvian nuevo sol 25,855 U.S. dollar (8,092) 8,053 (8,092) (39)
Philippines peso 208,960 Euro currency unit (4,633) 4,617 (4,633) (16)
Polish zioty 28,200 Euro currency unit (6,806) 7,484 (7,591) (107)
Polish zioty 137,777 U.S. dollar (36,820) 36,597 (36,820) (223)
Qatari riyal 104 U.S. dollar (29) 29 (29) -
Romanian leu 15,200 Euro currency unit (3,417) 3,777 (3,811) (34)
Russian ruble 361,002 U.S. dollar (6,367) 6,307 (6,367) (60)
Singapore dollar 369 Japanese yen (33,538) 274 (274) -
Singapore dollar 2,518 U.S. dollar (1,868) 1,870 (1,868) 2
South African rand 411,084 U.S. dollar (33,118) 33,669 (33,118) 551
South Korean won 10,779,172 U.S. dollar (9,661) 9,639 (9,661) (22)
Swedish krona 177,397 U.S. dollar (21,135) 21,397 (21,135) 262
Swiss franc 470 British pound sterling (319) 503 (502) 1
Swiss franc 17,659 U.S. dollar (19,153) 18,932 (19,153) (221)
Taiwan new dollar 332,673 U.S. dollar (10,796) 10,793 (10,796) (3)
Thailand baht 23,753 U.S. dollar (701) 702 (701) 1
Turkish lira 144,071 U.S. dollar (52,707) 53,437 (52,707) 730
U.S. dollar 89,501 Australian dollar (116,203) 89,501 (89,090) 411
U.S. dollar 7,674 Brazilian real (24,532) 7,674 (7,718) (44)
U.S. dollar 77,884 British pound sterling (50,208) 77,884 (78,933) (1,049)
U.S. dollar 102,323 Canadian dollar (126,278) 102,323 (101,095) 1,228
U.S. dollar 41,024 Chilean peso (25,391,581) 41,024 (39,646) 1,378
U.S. dollar 16,539 Chinese yuan renminbi (101,876) 16,539 (16,587) (48)
U.S. dollar 153 Danish krone (1,024) 153 (153) -
U.S. dollar 327,162 Euro currency unit (293,289) 327,162 (326,880) 282
U.S. dollar 17,905 Hong Kong dollar (138,812) 17,905 (17,905) -
U.S. dollar 72,550 Hungarian forint (20,176,444) 72,550 (71,285) 1,265
U.S. dollar 8,010 Indian rupee (522,629) 8,010 (8,107) (97)
U.S. dollar 2,066 Indonesian rupiah (28,179,203) 2,066 (2,086) (20)
U.S. dollar 15,445 Israeli shekel (59,079) 15,445 (15,662) (217)
U.S. dollar 247,702 Japanese yen (30,877,564) 247,702 (252,440) (4,738)
U.S. dollar 769 Kenyan shilling (76,292) 769 (769) -
U.S. dollar 56,431 Mexican peso (876,796) 56,431 (55,811) 620
U.S. dollar 54,067 New Zealand dollar (77,979) 54,067 (52,604) 1,463
U.S. dollar 45,172 Norwegian krone (350,200) 45,172 (44,470) 702
U.S. dollar 29 Pakistan rupee (2,939) 29 (29) -
U.S. dollar 1,921 Phillipines peso (86,774) 1,921 (1,924) (3)
U.S. dollar 26,041 Polish zloty (96,711) 26,041 (25,706) 335
U.S. dollar 2,386 Russian ruble (137,869) 2,386 (2,404) (18)
U.S. dollar 23,531 Singapore dollar (31,700) 23,531 (23,517) 14
U.S. dollar 12,943 South African rand (161,406) 12,943 (13,226) (283)
U.S. dollar 53,955 South Korean won (60,382,650) 53,955 (54,009) (54)
U.S. dollar 58,947 Swedish krona (486,487) 58,947 (58,684) 263
U.S. dollar 80,907 Swiss franc (75,647) 80,907 (81,143) (236)
U.S. dollar 8,204 Taiwan new dollar (256,137) 8,204 (8,311) (107)
U.S. dollar 11,984 Turkish lira (32,939) 11,984 (12,249) (265)
Total 2,310,581$ (2,309,735)$ 846$
FRS Pension Trust Fund
Forward Foreign Currency Exchange Contracts
As of June 30, 2015
57

5. Security Lending Through the SBA, the FRS Pension Trust Fund participates in security lending programs. Initial collateral requirements for securities on loan range from 100 percent to 105 percent, depending on the lending agent, the type of security lent and the type of collateral received. The SBA had received and invested approximately $8.4 billion in cash and $3.1 billion in U.S. government securities as collateral for the lending programs as of June 30, 2015. At June 30, 2015, the collateral held for the security lending transactions exceeded the fair value of the securities underlying the agreements (including accrued interest). All security lending programs have indemnity clauses requiring the lending agent to assume borrower’s risk from default. The SBA does not have the ability to pledge or sell the non-cash collateral securities, so the non-cash portion is not reported on the Statement of Fiduciary Net Position. Maturities of investments made with cash collateral generally are not matched to maturities of the securities loaned, because security loan agreements are generally open-ended with no fixed expiration date. As such, investments made with cash collateral are primarily in overnight repurchase agreements. However, investments purchased for some security lending programs included investments with final maturities of six months or more representing a range of approximately 18 percent or less of total collateral invested. There are no restrictions on the amount of securities that can be loaned at one time to one borrower for most funds. The portfolios contain some legacy non-repo securities that will remain until they are either sold or mature. At June 30, 2015, there were three lending agents, including the master custodian and two third-party agents. The schedule below discloses the fair value and carrying value of investments on loan at June 30, 2015 (in thousands):
Fair value of Securities on Loan1
Securities on Loan for Cash Collateral, FRS Pension
by Security type Trust Fund
U.S. guaranteed obligations 274,393$
Federal agencies 19,012
Domestic bonds and notes 462,601
International bonds and notes 162,012
Domestic stocks 4,605,884
International stocks 2,596,899
Total securities on loan for cash collateral 8,120,801$
Securities on Loan for Non-Cash Collateral,
by Security type
Domestic stocks 2,986,967$
International stocks 59,094
Total securities on loan for non-cash collateral 3,046,061
Total securities on loan 11,166,862$
Schedule of Investments on Loan Under Security Lending Agreements
As of June 30, 2015
1The fair value equals the carrying value of investments on loan. Fair value includes accrued
interest on debt securities.
58
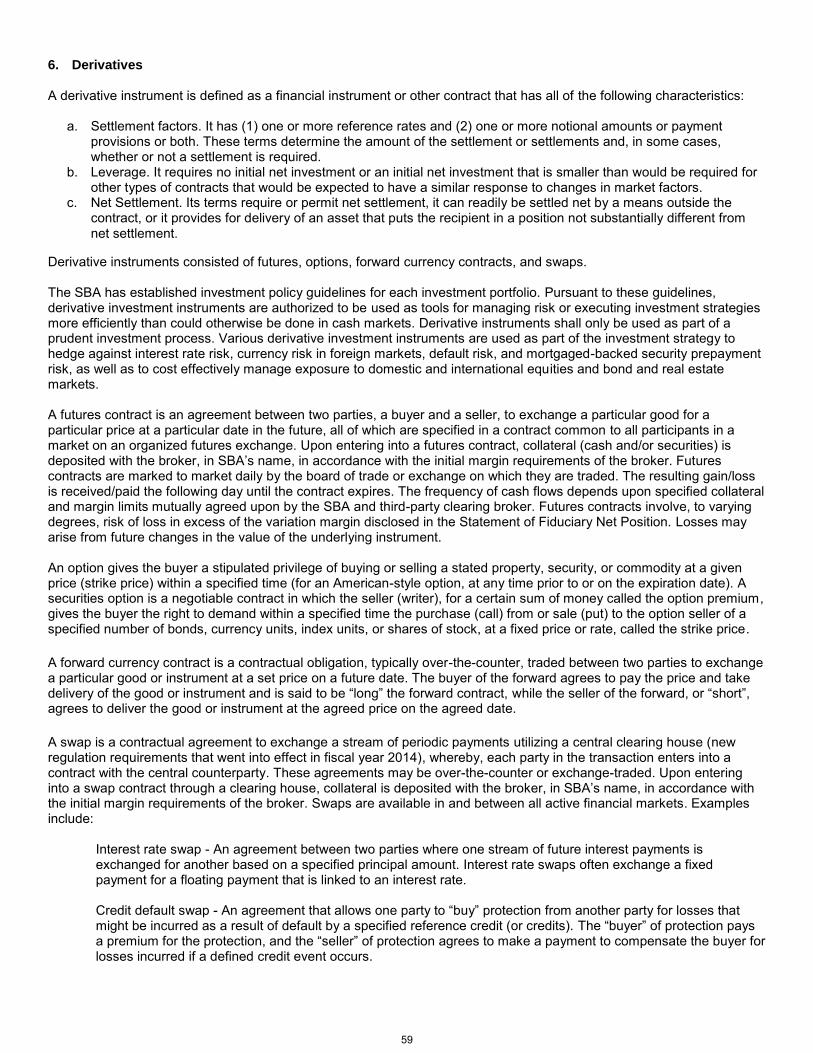
6. Derivatives
A derivative instrument is defined as a financial instrument or other contract that has all of the following characteristics:
a. Settlement factors. It has (1) one or more reference rates and (2) one or more notional amounts or payment provisions or both. These terms determine the amount of the settlement or settlements and, in some cases, whether or not a settlement is required.
b. Leverage. It requires no initial net investment or an initial net investment that is smaller than would be required for other types of contracts that would be expected to have a similar response to changes in market factors.
c. Net Settlement. Its terms require or permit net settlement, it can readily be settled net by a means outside the contract, or it provides for delivery of an asset that puts the recipient in a position not substantially different from net settlement.
Derivative instruments consisted of futures, options, forward currency contracts, and swaps. The SBA has established investment policy guidelines for each investment portfolio. Pursuant to these guidelines, derivative investment instruments are authorized to be used as tools for managing risk or executing investment strategies more efficiently than could otherwise be done in cash markets. Derivative instruments shall only be used as part of a prudent investment process. Various derivative investment instruments are used as part of the investment strategy to hedge against interest rate risk, currency risk in foreign markets, default risk, and mortgaged-backed security prepayment risk, as well as to cost effectively manage exposure to domestic and international equities and bond and real estate markets. A futures contract is an agreement between two parties, a buyer and a seller, to exchange a particular good for a particular price at a particular date in the future, all of which are specified in a contract common to all participants in a market on an organized futures exchange. Upon entering into a futures contract, collateral (cash and/or securities) is deposited with the broker, in SBA’s name, in accordance with the initial margin requirements of the broker. Futures contracts are marked to market daily by the board of trade or exchange on which they are traded. The resulting gain/loss is received/paid the following day until the contract expires. The frequency of cash flows depends upon specified collateral and margin limits mutually agreed upon by the SBA and third-party clearing broker. Futures contracts involve, to varying degrees, risk of loss in excess of the variation margin disclosed in the Statement of Fiduciary Net Position. Losses may arise from future changes in the value of the underlying instrument. An option gives the buyer a stipulated privilege of buying or selling a stated property, security, or commodity at a given price (strike price) within a specified time (for an American-style option, at any time prior to or on the expiration date). A securities option is a negotiable contract in which the seller (writer), for a certain sum of money called the option premium, gives the buyer the right to demand within a specified time the purchase (call) from or sale (put) to the option seller of a specified number of bonds, currency units, index units, or shares of stock, at a fixed price or rate, called the strike price.
A forward currency contract is a contractual obligation, typically over-the-counter, traded between two parties to exchange a particular good or instrument at a set price on a future date. The buyer of the forward agrees to pay the price and take delivery of the good or instrument and is said to be “long” the forward contract, while the seller of the forward, or “short”, agrees to deliver the good or instrument at the agreed price on the agreed date.
A swap is a contractual agreement to exchange a stream of periodic payments utilizing a central clearing house (new regulation requirements that went into effect in fiscal year 2014), whereby, each party in the transaction enters into a contract with the central counterparty. These agreements may be over-the-counter or exchange-traded. Upon entering into a swap contract through a clearing house, collateral is deposited with the broker, in SBA’s name, in accordance with the initial margin requirements of the broker. Swaps are available in and between all active financial markets. Examples include:
Interest rate swap - An agreement between two parties where one stream of future interest payments is exchanged for another based on a specified principal amount. Interest rate swaps often exchange a fixed payment for a floating payment that is linked to an interest rate. Credit default swap - An agreement that allows one party to “buy” protection from another party for losses that might be incurred as a result of default by a specified reference credit (or credits). The “buyer” of protection pays a premium for the protection, and the “seller” of protection agrees to make a payment to compensate the buyer for losses incurred if a defined credit event occurs.
59

A summary of investment derivatives traded in the FRS Pension Trust Fund is presented below (in thousands). As of June 30, 2015, all of the SBA investment derivatives were reported at fair value.
7. Commitments Each year the FRS Pension Trust Fund enters into a number of agreements that commit the Fund, upon request, to make additional investment purchases (i.e., capital commitments) up to predetermined amounts over certain investment time periods. The unfunded capital commitments that are not reported on the FRS Pension Trust Fund Statement of Fiduciary Net Position totaled $11.2 billion as of June 30, 2015.
Classification
Amount
(in U.S. dollars) Classification
Amount
(in U.S. dollars)
Notional
(in U.S. dollars)
FRS Pension Trust Fund
Investment derivative instruments:
Futures1Investment Income 97,210$ Receivable/(Payable) (8,967)$ 2,751,145$
Options Investment Income (2,819)$ Investment/(Liability)217$ 1,000$
Forward currency contracts Investment Income 109,342$ Receivable/(Payable)3787$ 787$
Interest rate swaps Investment Income (559)$ Investment (542)$ 101,000$
Credit default swaps Investment Income 1,114$ Investment 1,467$ 103,000$
Increase/(Decrease) in Fair Value Fair Value at June 30, 2015
1 The total unrealized loss for open futures contracts at June 30, 2015, was $(8,967,409) in the FRS Pension Trust Fund. Cash payments in the amount of
$18,026,406 had already been settled with the broker on or before June 30, 2015. Outstanding remaining net futures margin at June 30, 2015, totaled $9,058,997
for the FRS Pension Trust Fund, which is reported gross on the Statement of Fiduciary Net Position as "Futures trade equity" and "Pending investment
purchases". The total notional value on long and short futures positions were $4,226,231,605 and $(1,475,086,560), respectively.
2 Purchased options are reported as investments and short sales of options are reported as liabilities on the Statement of Fiduciary Net Position. This schedule
nets both long and short positions.
3 The total receivable and payable notional and fair values (in U.S. dollars) for forward currency contracts in the FRS Pension Trust Fund were $2,199,459,653 and
($2,198,672,804) as of June 30, 2015. These amounts are included in "Forward contracts receivable" and "Forward contracts payable" on the Statement of
Fiduciary Net Position.
60

NOTE 4 - NET PENSION LIABILITY
The components of the net pension liability of the state-administered pension plans are presented below:
A. Florida Retirement System (FRS) Pension Plan
Net Pension Liability June 30, 2014 June 30, 2015
Total pension liability $156,115,762,947 $161,370,735,088
Fiduciary net position 150,014,292,372 148,454,393,902
Net pension liability 6,101,470,575 12,916,341,186
Fiduciary net position as a % of total pension liability 96.09% 92.00%
Covered payroll1 24,723,565,000 32,726,034,000
Net pension liability as a % of covered payroll 24.68% 39.47%
The total pension liability was determined by an actuarial valuation as of the valuation date, calculated based on the
discount rate and actuarial assumptions below. The total pension liability is calculated using the Individual Entry Age
Normal cost allocation method, which differs from the Ultimate Entry Age Normal cost allocation method used in the
funding valuation for the plan.
Discount Rate
Discount rate 7.65% 7.65%
Long-term expected rate of return, net of investment expense 7.65% 7.65%
Municipal bond rate N/A N/A
The plan's fiduciary net position was projected to be available to make all projected future benefit payments of current active and inactive employees. Therefore, the discount rate for calculating the total pension liability is equal to the long-term expected rate of return.
Other Key Actuarial Assumptions
The actuarial assumptions that determined the total pension liability as of June 30, 2015, were based on the results of an
actuarial experience study for the period July 1, 2008 – June 30, 2013.
Valuation Date July 1, 2014 July 1, 2015
Measurement date June 30, 2014 June 30, 2015
Inflation 2.60% 2.60%
Salary increases including inflation 3.25% 3.25%
Mortality Generational RP-2000 with
Projection Scale BB2
Generational RP-2000 with
Projection Scale BB3
Actuarial cost method Individual Entry Age Individual Entry Age
1 For June 30, 2014, covered payroll includes the normal cost and unfunded actuarial liability (UAL) payroll of active Pension Plan members and reemployed retirees without renewed membership, but excludes the payroll for Investment Plan members and payroll on which only UAL rates are charged. For June 30, 2015, covered payroll includes the normal cost and UAL payroll for active Pension Plan and Investment Plan members and payroll of reemployed retirees without renewed membership and the salaries of SMSOAP, SUSORP, and SCCSORP members. 2 See July 1, 2014, Actuarial Valuation Report for details. 3 See July 1, 2015, Actuarial Valuation Report for details.
61

Increase (Decrease) Total Pension Plan Fiduciary Net Pension Liability Net Position Liability Changes in Net Pension Liability (a) (b) (a) – (b)
Balances as of June 30, 2014 $156,115,762,947 $150,014,292,372 $6,101,470,575 Changes for the year: Service cost 2,114,046,879 2,114,046,879 Interest on total pension liability 11,721,563,262 11,721,563,262 Effect of plan changes 0 0 Effect of economic / demographic gains or losses 1,620,863,000 1,620,863,000 Effect of assumptions changes or inputs 0 0 Benefit payments1 (10,201,501,000) (10,201,501,000) 0 Employer contributions 2,438,084,925 (2,438,084,925) Member contributions 698,304,112 (698,304,112) Net investment income 5,523,287,472 (5,523,287,472) Administrative expenses (18,073,979) 18,073,979
Balances as of June 30, 2015 $161,370,735,088 $148,454,393,902 $12,916,341,186
Sensitivity Analysis
The following presents the net pension liability of the FRS, calculated using the discount rate of 7.65 percent, as well as what the FRS’s net pension liability would be if it were calculated using a discount rate that is one percentage point lower (6.65 percent) or one percentage point higher (8.65 percent) than the current rate.
1% Current 1% Decrease Discount Rate Increase 6.65% 7.65% 8.65%
Total pension liability $181,923,555,126 $161,370,735,088 $144,267,412,898 Fiduciary net position 148,454,393,902 148,454,393,902 148,454,393,902
Net pension liability $33,469,161,224 $12,916,341,186 $(4,186,981,004)
1 Benefit payments shown above include outbound transfers to the Investment Plan and returns of contributions, net of $57,536,043 inbound transfers from the Investment Plan.
62

Long-Term Expected Rate of Return
To develop an analytical basis for the selection of the long-term expected rate of return assumption, in October 2015 the FRS Actuarial Assumptions conference reviewed long-term assumptions developed by both Milliman’s capital market assumptions team and by a capital market assumptions team from Aon Hewitt Investment Consulting, which consults to the Florida State Board of Administration. The table below shows Milliman’s assumptions for each of the asset classes in which the plan was invested at that time based on the long-term target asset allocation. The allocation policy’s description of each asset class was used to map the target allocation to the asset classes shown below. Each asset class assumption is based on a consistent set of underlying assumptions, and includes an adjustment for the inflation assumption. These assumptions are not based on historical returns, but instead are based on a forward-looking capital market economic model.
Compound
Annual Annual Target Arithmetic (Geometric) Standard
Asset Class Allocation1 Return Return Deviation
Cash 1% 3.2% 3.1% 1.7%
Fixed income 18% 4.8% 4.7% 4.7%
Global equity 53% 8.5% 7.2% 17.7%
Real estate (property) 10% 6.8% 6.2% 12.0%
Private equity 6% 11.9% 8.2% 30.0%
Strategic investments 12% 6.7% 6.1% 11.4%
Assumed Inflation – Mean 2.6% 1.9%
1 As outlined in the Plan’s investment policy.
63

B. Retiree Health Insurance Subsidy (HIS) Program
Actuarial valuations for the HIS Program are conducted biennially. The July 1, 2014, HIS valuation is the most recent actuarial valuation which was used to develop the liabilities for the June 30, 2015, financial reporting exhibits shown below. Liabilities originally calculated as of the actuarial valuation date have been recalculated as of a later GASB Measurement Date using a standard actuarial roll-forward technique.
Net Pension Liability June 30, 2014 June 30, 2015
Total pension liability $9,443,629,461 $10,249,201,290
Fiduciary net position 93,385,450 50,774,315
Net pension liability 9,350,244,011 10,198,426,975
Fiduciary net position as a % of total pension liability 0.99% 0.50%
Covered payroll1 29,676,340,167 30,340,449,100
Net pension liability as a % of covered payroll 31.51% 33.61%
The total pension liability was determined by an actuarial valuation as of the valuation date, calculated based on the discount rate and actuarial assumptions below, and was then projected to the measurement date. Any significant changes during this period have been reflected as prescribed by GASB 67.
Discount Rate
Discount rate 4.29% 3.80%
Long-term expected rate of return, net of investment expense N/A N/A
Bond Buyer General Obligation 20-Bond Municipal Bond Index 4.29% 3.80%
In general, the discount rate for calculating the total pension liability under GASB 67 is equal to the single rate equivalent to discounting at the long-term expected rate of return for benefit payments prior to the projected depletion date. Because the HIS benefit is essentially funded on a pay-as-you-go basis, the depletion date is considered to be immediate, and the single equivalent discount rate is equal to the municipal bond rate selected by the plan sponsor. The discount rates used at the two dates differ due to changes in the applicable municipal bond rate.
Other Key Actuarial Assumptions
The actuarial assumptions that determined the total pension liability as of June 30, 2015, were based on certain results of an actuarial experience study of the FRS for the period July 1, 2008 - June 30, 2013.
Valuation Date July 1, 2014 July 1, 2015
Measurement date June 30, 2014 June 30, 2015
Inflation 2.60% 2.60%
Salary increases including inflation 3.25% 3.25%
Mortality
Generational RP-2000 with
Projection Scale BB; details in
valuation report
Generational RP-2000 with
Projection Scale BB; details in
valuation report
Actuarial cost method Individual Entry Age Individual Entry Age
1 Covered payroll includes the normal cost and unfunded actuarial liability payroll for active Pension Plan and Investment Plan members and the payroll of reemployed retirees without renewed membership.
64
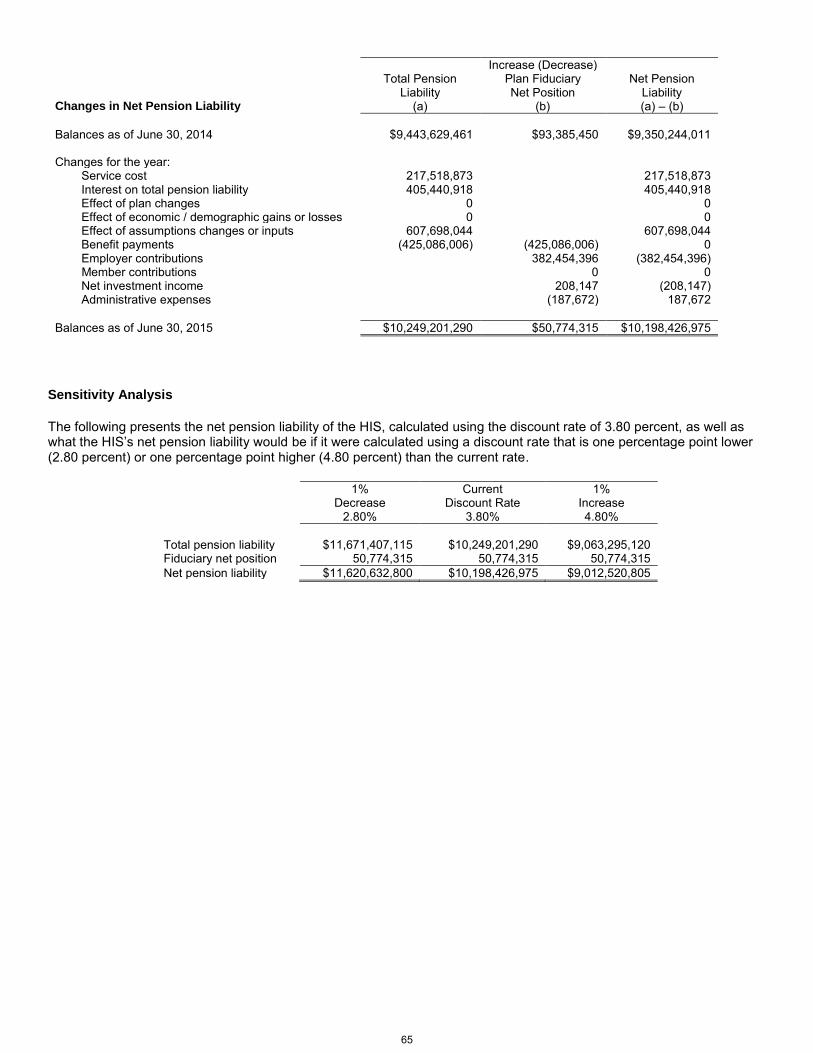
Increase (Decrease) Total Pension Plan Fiduciary Net Pension Liability Net Position Liability Changes in Net Pension Liability (a) (b) (a) – (b)
Balances as of June 30, 2014 $9,443,629,461 $93,385,450 $9,350,244,011 Changes for the year: Service cost 217,518,873 217,518,873 Interest on total pension liability 405,440,918 405,440,918 Effect of plan changes 0 0 Effect of economic / demographic gains or losses 0 0 Effect of assumptions changes or inputs 607,698,044 607,698,044 Benefit payments (425,086,006) (425,086,006) 0 Employer contributions 382,454,396 (382,454,396) Member contributions 0 0 Net investment income 208,147 (208,147) Administrative expenses (187,672) 187,672
Balances as of June 30, 2015 $10,249,201,290 $50,774,315 $10,198,426,975
Sensitivity Analysis
The following presents the net pension liability of the HIS, calculated using the discount rate of 3.80 percent, as well as what the HIS’s net pension liability would be if it were calculated using a discount rate that is one percentage point lower (2.80 percent) or one percentage point higher (4.80 percent) than the current rate.
1% Current 1% Decrease Discount Rate Increase 2.80% 3.80% 4.80%
Total pension liability $11,671,407,115 $10,249,201,290 $9,063,295,120 Fiduciary net position 50,774,315 50,774,315 50,774,315
Net pension liability $11,620,632,800 $10,198,426,975 $9,012,520,805
65
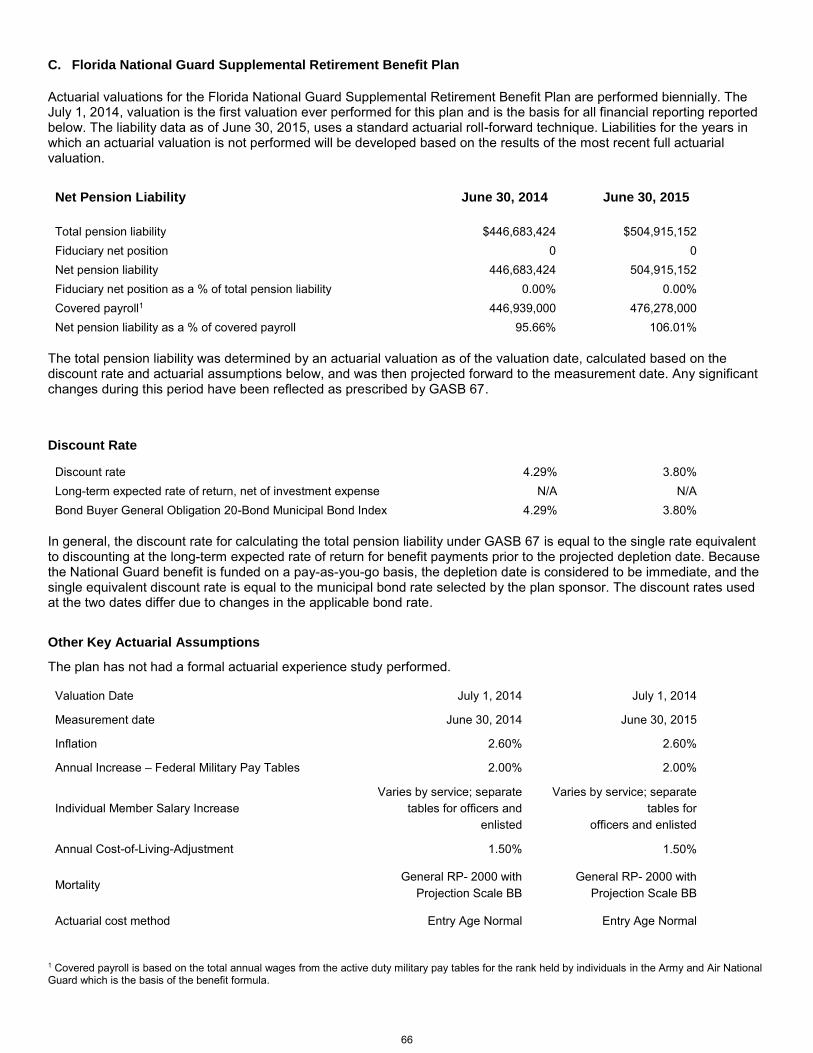
C. Florida National Guard Supplemental Retirement Benefit Plan
Actuarial valuations for the Florida National Guard Supplemental Retirement Benefit Plan are performed biennially. The July 1, 2014, valuation is the first valuation ever performed for this plan and is the basis for all financial reporting reported below. The liability data as of June 30, 2015, uses a standard actuarial roll-forward technique. Liabilities for the years in which an actuarial valuation is not performed will be developed based on the results of the most recent full actuarial valuation.
Net Pension Liability June 30, 2014 June 30, 2015
Total pension liability $446,683,424 $504,915,152
Fiduciary net position 0 0
Net pension liability 446,683,424 504,915,152
Fiduciary net position as a % of total pension liability 0.00% 0.00%
Covered payroll1 446,939,000 476,278,000
Net pension liability as a % of covered payroll 95.66% 106.01%
The total pension liability was determined by an actuarial valuation as of the valuation date, calculated based on the discount rate and actuarial assumptions below, and was then projected forward to the measurement date. Any significant changes during this period have been reflected as prescribed by GASB 67.
Discount Rate
Discount rate 4.29% 3.80%
Long-term expected rate of return, net of investment expense N/A N/A
Bond Buyer General Obligation 20-Bond Municipal Bond Index 4.29% 3.80%
In general, the discount rate for calculating the total pension liability under GASB 67 is equal to the single rate equivalent to discounting at the long-term expected rate of return for benefit payments prior to the projected depletion date. Because the National Guard benefit is funded on a pay-as-you-go basis, the depletion date is considered to be immediate, and the single equivalent discount rate is equal to the municipal bond rate selected by the plan sponsor. The discount rates used at the two dates differ due to changes in the applicable bond rate.
Other Key Actuarial Assumptions
The plan has not had a formal actuarial experience study performed.
Valuation Date July 1, 2014 July 1, 2014
Measurement date June 30, 2014 June 30, 2015
Inflation 2.60% 2.60%
Annual Increase – Federal Military Pay Tables 2.00% 2.00%
Individual Member Salary Increase
Varies by service; separate
tables for officers and
enlisted
Varies by service; separate
tables for
officers and enlisted
Annual Cost-of-Living-Adjustment 1.50% 1.50%
Mortality General RP- 2000 with
Projection Scale BB
General RP- 2000 with
Projection Scale BB
Actuarial cost method Entry Age Normal Entry Age Normal
1 Covered payroll is based on the total annual wages from the active duty military pay tables for the rank held by individuals in the Army and Air National Guard which is the basis of the benefit formula.
66

Increase (Decrease) Total Pension Plan Fiduciary Net Pension Liability Net Position Liability Changes in Net Pension Liability (a) (b) (a) – (b)
Balances as of June 30, 2014 $446,683,424 $0 $446,683,424 Changes for the year: Service cost 7,160,731 7,160,731 Interest on total pension liability 19,163,795 19,163,795 Effect of plan changes 0 0 Effect of economic / demographic gains or losses 0 0 Effect of assumptions changes or inputs 46,329,910 46,329,910 Benefit payments (14,422,708) (14,422,708) 0 Employer contributions1 14,495,208 (14,495,208) Member contributions 0 0 Net investment income 0 0 Administrative expenses (72,500) 72,500
Balances as of June 30, 2015 $504,915,152 $0 $504,915,152
Sensitivity Analysis
The following presents the net pension liability of the plan, calculated using the discount rate of 3.80%, as well as what the plan's net pension liability would be if it were calculated using a discount rate that is 1 percentage point lower (2.80%) or 1 percentage point higher (4.80%) than the current rate.
1% Current 1% Decrease Discount Rate Increase 2.80% 3.80% 4.80%
Total pension liability $622,192,468 $504,915,152 $416,578,642 Fiduciary net position 0 0 0
Net pension liability $622,192,468 $504,915,152 $416,578,642
1 Contributions are provided by annual legislative appropriation to cover expenses and benefit payments.
67

NOTE 5 – INTERFUND BALANCES AND TRANSFERS
At June 30, 2015, amounts to be received or paid with current available resources are reported as due from or due to other funds, whereas the noncurrent portion is reported as advances from other funds. Interfund balances at June 30, 2015, consist of the following:
During the course of operations, transactions occur between funds within the division. Interfund transfers during the year are as follows:
Due from Other Funds
within Division
Fiduciary Funds
State University System
Optional Retirement
Due to Other Funds within Division Program
Fiduciary Funds
Senior Management Service Optional Annuity Program 7,620$
Total 7,620$
Governmental Activities Fiduciary Funds
State University System
Police and Firefighters' Optional Retirement
Transfers to Other Funds within Division Premium Tax Trust Fund Program
Fiduciary Funds
Florida Retirement System 549,982$ -$
Senior Management Service Optional Annuity Program - 7,620
Total 549,982$ 7,620$
Transfers from Other Funds within Division
68

NOTE 6 – CHANGES IN LONG-TERM LIABILITIES
Changes in long-term liabilities for fiduciary and governmental activities during the fiscal year ended June 30, 2015, are as follows:
The long-term liability for fiduciary activities related to pension liability represents the State University System Optional Retirement Plan (SUSORP) Trust Fund’s allocated share of the applicable state’s pension liability. Changes to the trust fund’s allocated share of the liability occur as a result of the state’s allocation process and are non-liquidating by the trust fund itself. The liability related to compensated absences will be liquidated by the SUSORP Trust Fund. The fund’s allocated share of the state’s Other Postemployment Benefits (OPEB) liability is also reported above. The state does not currently fund the OPEB liability, so it is non-liquidating. The long-term liabilities for governmental activities related to compensated absences will be liquidated by the Police and Firefighters’ Premium Tax Trust Fund, a special revenue fund. The fund’s allocated share of the state’s Other Postemployment Benefits (OPEB) liability is also reported above. The state does not currently fund the OPEB liability, so it is non-liquidating.
Due Within
Balance Balance One Year
July 1, 2014 Additions Deletions June 30, 2015 (Current)
Fiduciary Activities
Pension Liability 67,927$ -$ 21,229$ 46,698$ 22,972$
Compensated absences 33,251 560 - 33,811 4,738
Other Postemployment Benefits 17,970 5,289 - 23,259 -
Total Fiduciary Activities 119,148$ 5,849$ 21,229$ 103,768$ 27,710$
Governmental Activities
Compensated absences 85,027$ 4,601$ -$ 89,628$ 29,391$
Other Postemployment Benefits 87,655 23,799 - 111,454 -
Total Governmental Activities 172,682$ 28,400$ -$ 201,082$ 29,391$
69

NOTE 7 – RELATED PARTIES
The State Board of Administration (SBA), the FRS Investment Plan Trust Fund, and the Department of Management
Services (DMS) state-administered defined benefit pension plans are considered to be related parties for the purposes of
the system’s financial statements.
The defined benefit state-administered pension funds have a variety of transactions with the SBA and the FRS Investment
Plan. The DMS administers the state-administered defined benefit pension plans, including collecting employer and
employee contributions, remitting those contributions to SBA for investment, requesting withdrawals from SBA for benefit
payments, and paying those benefit payments to members. The SBA administers the FRS Investment Plan Trust Fund,
including working with DMS to collect employer and employee contributions and processing member-directed-benefit
amounts between the FRS Pension Plan Trust Fund and the FRS Investment Plan Trust Fund. The SBA provides
investment services to the FRS Pension Plan and the Retiree Health Insurance Subsidy Pension Plan and charges an
investment service charge on the net asset value at the end of each month.
Significant transactions between the SBA, the FRS Investment Plan Trust Fund and the DMS state-administered defined benefit pension plans for fiscal year 2015 are as follows:
Florida Retiree Health
Retirement Insurance
System Pension Subsidy
Plan Trust Fund
Payables:
Due to SBA for investment service charges 5,615$ -$
Additions:
Funds received from SBA for benefit payments 8,893,553$ 425,100$
Transfers from FRS Investment Plan Trust Fund 57,536 -
Total Additions 8,951,089$ 425,100$
Deductions:
Employer / employee contributions sent to SBA 3,112,534$ 386,875$
Member-directed benefits sent to FRS
Investment Plan Trust Fund 719,182 -
Investment service charges to the SBA 33,308 -
Total Deductions 3,865,024$ 386,875$
(in thousands)
70

REQUIRED SUPPLEMENTARY INFORMATION
A. Florida Retirement System (FRS) Pension Plan
Required supplementary information for the FRS Pension Plan is presented below:
Schedule of Changes in Net Pension Liability and Related Ratios1
(in thousands)
Total Pension Liability June 30, 2014 June 30, 2015
Service cost $2,256,738 $2,114,047
Interest on total pension liability 11,489,921 11,721,563
Effect of plan changes 0 0
Effect of economic/demographic (gains) or losses (448,818) 1,620,863
Effect of assumption changes or inputs 1,256,045 0
Benefit payments (8,714,251) (10,201,501)
Net change in total pension liability 5,839,635 5,254,972
Total pension liability, beginning 150,276,128 156,115,763
Total pension liability, ending (a) $156,115,763 $161,370,735
Fiduciary Net Position
Employer contributions $2,190,424 $2,438,085
Member contributions 682,507 698,304
Investment income net of investment expenses 22,812,286 5,523,287
Benefit payments (8,714,250) (10,201,500)
Administrative expenses (18,352) (18,074)
Net change in plan fiduciary net position 16,952,615 (1,559,898)
Fiduciary net position, beginning 133,061,677 150,014,292
Fiduciary net position, ending (b) $150,014,292 $148,454,394
Net pension liability, ending = (a) -(b) $6,101,471 $12,916,341
Fiduciary net position as a % of total pension liability 96.09% 92.00%
Covered payroll2 $24,723,565 $32,726,034
Net pension liability as a % of covered payroll 24.68% 39.47%
1 This schedule will fill in to a ten-year schedule as results for new fiscal years are calculated. 2 For June 30, 2014, covered payroll shown includes defined benefit plan actives and members in DROP, but excludes the payroll for Investment Plan members and payroll on which only UAL rates are charged. For June 30, 2015, and later, covered payroll shown includes the payroll for Investment Plan members and payroll on which only UAL rates are charged.
The notes to required supplementary information are an integral part of these schedules.
71

Notes to the Schedule of Changes in Net Pension Liability and Related Ratios
The total pension liability was determined by an actuarial valuation as of the valuation date of July 1, 2015, calculated based on the discount rate and actuarial assumptions below:
Discount Rate
June 30, 2014 June 30, 2015
Discount rate 7.65% 7.65%
Long-term expected rate of return, net of investment expense 7.65% 7.65%
Bond Buyer General Obligation 20-Bond Municipal Bond Index N/A N/A
The plan’s fiduciary net position was projected to be available to make all projected future benefit payments of current active and inactive employees in the determining the projected depletion date. Therefore, the discount rate for calculating the total pension liability is equal to the long-term expected rate of return.
Other Key Actuarial Assumptions
The actuarial assumptions used to determine the total pension liability as of June 30, 2015, were based on the results of an actuarial experience study for the period July 1, 2008 - June 30, 2013.
Valuation Date July 1, 2015
Measurement Date June 30, 2015
Asset Valuation Method Fair Market Value
Inflation 2.60%
Salary increases including inflation 3.25%
Mortality Generational RP-2000 with Projection Scale BB1
Actuarial cost method Individual Entry Age Normal
1 See July 1, 2015, Actuarial Valuation Report for details.
72
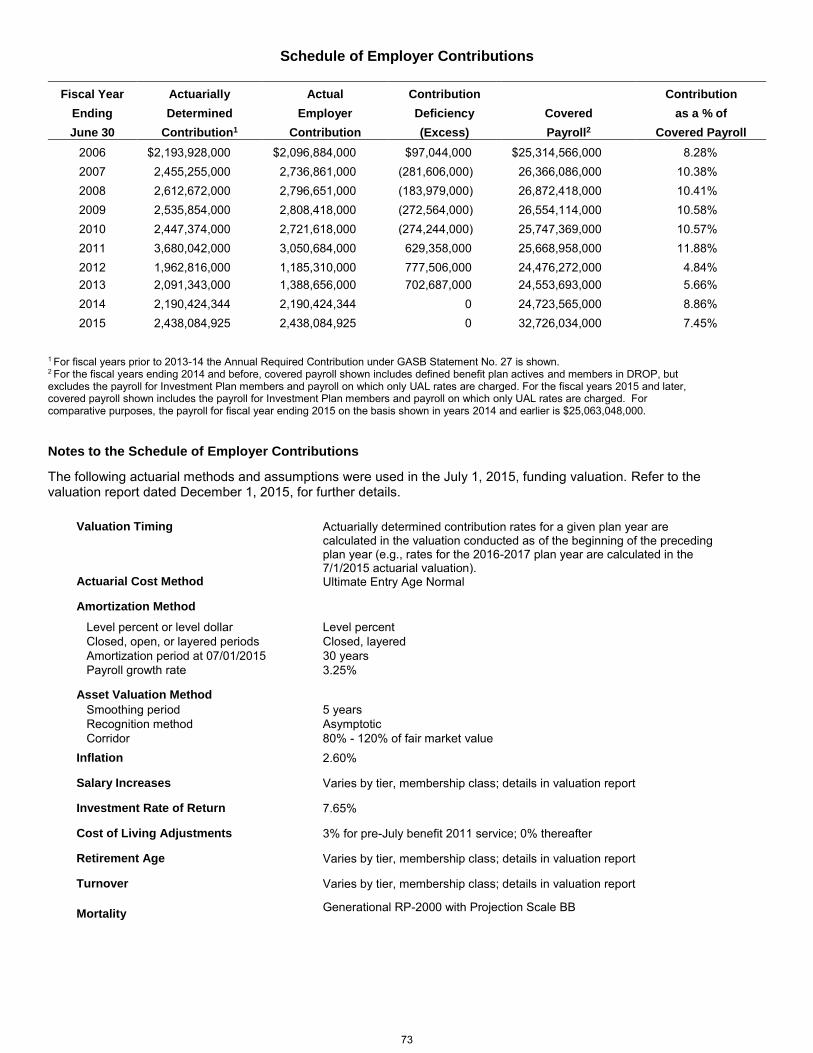
Schedule of Employer Contributions
Fiscal Year Actuarially Actual Contribution Contribution
Ending Determined Employer Deficiency Covered as a % of
June 30 Contribution1 Contribution (Excess) Payroll2 Covered Payroll
2006 $2,193,928,000 $2,096,884,000 $97,044,000 $25,314,566,000 8.28%
2007 2,455,255,000 2,736,861,000 (281,606,000) 26,366,086,000 10.38%
2008 2,612,672,000 2,796,651,000 (183,979,000) 26,872,418,000 10.41%
2009 2,535,854,000 2,808,418,000 (272,564,000) 26,554,114,000 10.58%
2010 2,447,374,000 2,721,618,000 (274,244,000) 25,747,369,000 10.57%
2011 3,680,042,000 3,050,684,000 629,358,000 25,668,958,000 11.88%
2012 1,962,816,000 1,185,310,000 777,506,000 24,476,272,000 4.84%
2013 2,091,343,000 1,388,656,000 702,687,000 24,553,693,000 5.66%
2014 2,190,424,344 2,190,424,344 0 24,723,565,000 8.86%
2015 2,438,084,925 2,438,084,925 0 32,726,034,000 7.45%
1 For fiscal years prior to 2013-14 the Annual Required Contribution under GASB Statement No. 27 is shown. 2 For the fiscal years ending 2014 and before, covered payroll shown includes defined benefit plan actives and members in DROP, but excludes the payroll for Investment Plan members and payroll on which only UAL rates are charged. For the fiscal years 2015 and later, covered payroll shown includes the payroll for Investment Plan members and payroll on which only UAL rates are charged. For comparative purposes, the payroll for fiscal year ending 2015 on the basis shown in years 2014 and earlier is $25,063,048,000.
Notes to the Schedule of Employer Contributions
The following actuarial methods and assumptions were used in the July 1, 2015, funding valuation. Refer to the valuation report dated December 1, 2015, for further details.
Valuation Timing Actuarially determined contribution rates for a given plan year are
calculated in the valuation conducted as of the beginning of the preceding plan year (e.g., rates for the 2016-2017 plan year are calculated in the 7/1/2015 actuarial valuation).
Actuarial Cost Method
Amortization Method
Ultimate Entry Age Normal
Level percent or level dollar Level percent
Closed, open, or layered periods Closed, layered
Amortization period at 07/01/2015 30 years
Payroll growth rate
Asset Valuation Method
3.25%
Smoothing period 5 years
Recognition method Asymptotic
Corridor 80% - 120% of fair market value
Inflation 2.60%
Salary Increases Varies by tier, membership class; details in valuation report
Investment Rate of Return 7.65%
Cost of Living Adjustments 3% for pre-July benefit 2011 service; 0% thereafter
Retirement Age Varies by tier, membership class; details in valuation report
Turnover Varies by tier, membership class; details in valuation report
Mortality Generational RP-2000 with Projection Scale BB
73

Money-Weighted Rate of Return
Fiscal Year Net
Ending Money-Weighted
June 30 Rate of Return
2015 3.77%
2014 17.57%
The above schedule is presented to illustrate the requirement to show information for 10 years. However, recalculations of
prior years are not required, and if prior years are not reported in accordance with the current GASB standards, they
should not be reported.
Calculation of Money-Weighted Rate of Return
The money-weighted rate of return considers the changing amounts estimated as invested during a period and weights the amount of pension plan investments by the proportion of time they are available to earn a return during that period. Cash flows are estimated on a monthly basis and are assumed to occur at the beginning of each month. Cash inflows are netted with cash outflows, resulting in a net cash flow in each month. The money-weighted rate of return is calculated net of investment expenses.
Net External
Net External Periods Period Cash Flows
Cash Flows Invested Weight with Interest
Beginning value -July 1, 2014 $150,014,292,372 12 1.00 $155,672,422,060
Monthly net external cash flows:
July (590,265,495) 12 1.00 (612,528,699)
August (590,265,495) 11 0.92 (610,717,153)
September (590,265,495) 10 0.83 (608,685,567)
October (590,265,495) 9 0.75 (606,885,387)
November (590,265,495) 8 0.67 (605,090,531)
December (590,265,495) 7 0.58 (603,077,662)
January (590,265,495) 6 0.50 (601,294,068)
February (590,265,495) 5 0.42 (599,515,748)
March (590,265,495) 4 0.33 (597,521,424)
April (590,265,495) 3 0.25 (595,754,262)
May (590,265,495) 2 0.17 (593,992,326)
June (590,265,495) 1 0.08 (592,016,376)
Ending value -June 30, 2015 $148,454,393,902 $148,445,342,857
Money-weighted rate of return 3.77%
74
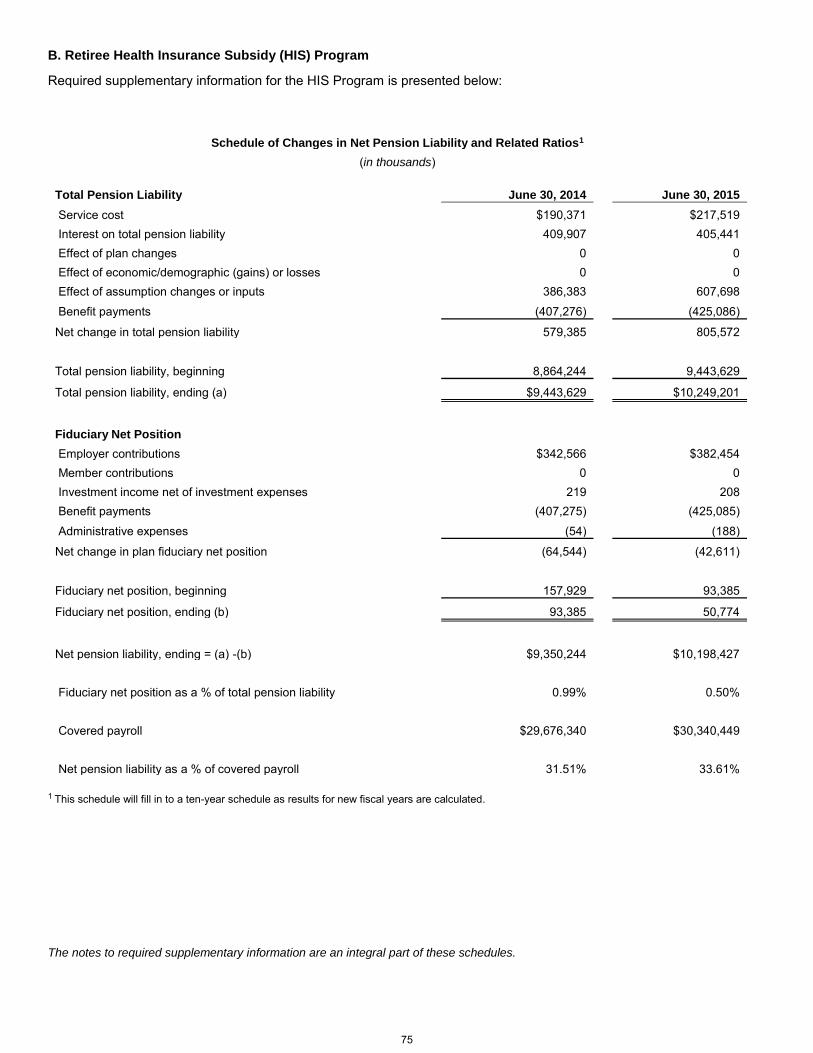
B. Retiree Health Insurance Subsidy (HIS) Program
Required supplementary information for the HIS Program is presented below:
Schedule of Changes in Net Pension Liability and Related Ratios1
(in thousands)
Total Pension Liability June 30, 2014 June 30, 2015
Service cost $190,371 $217,519
Interest on total pension liability 409,907 405,441
Effect of plan changes 0 0
Effect of economic/demographic (gains) or losses 0 0
Effect of assumption changes or inputs 386,383 607,698
Benefit payments (407,276) (425,086)
Net change in total pension liability 579,385 805,572
Total pension liability, beginning 8,864,244 9,443,629
Total pension liability, ending (a) $9,443,629 $10,249,201
Fiduciary Net Position
Employer contributions $342,566 $382,454
Member contributions 0 0
Investment income net of investment expenses 219 208
Benefit payments (407,275) (425,085)
Administrative expenses (54) (188)
Net change in plan fiduciary net position (64,544) (42,611)
Fiduciary net position, beginning 157,929 93,385
Fiduciary net position, ending (b) 93,385 50,774
Net pension liability, ending = (a) -(b) $9,350,244 $10,198,427
Fiduciary net position as a % of total pension liability 0.99% 0.50%
Covered payroll $29,676,340 $30,340,449
Net pension liability as a % of covered payroll 31.51% 33.61%
1 This schedule will fill in to a ten-year schedule as results for new fiscal years are calculated.
The notes to required supplementary information are an integral part of these schedules.
75

Notes to Schedule of Changes in Net Pension Liability and Related Ratios
The total pension liability was determined by an actuarial valuation as of the valuation date, calculated based on the discount rate and actuarial assumptions below, and then was projected to the measurement date. Any significant changes during this period have been reflected as prescribed by GASB 67.
Actuarial Methods and Assumptions
The same demographic and economic assumptions that were used in the Florida Retirement System Actuarial Valuation as of July 1, 2014 (“funding valuation”) were used for the HIS program, unless otherwise noted. In a given membership class and tier, the same assumptions for both Investment Plan (IP) members and for FRS Pension Plan members were used.
Discount Rate
June 30, 2014 June 30, 2015
Discount rate 4.29% 3.80 %
Long-term expected rate of return, net of investment expense N/A N/A
Bond Buyer General Obligation 20-Bond Municipal Bond Index 4.29% 3.80%
In general, the discount rate for calculating the total pension liability under GASB 67 is equal to the single rate equivalent to discounting at the long-term expected rate of return for benefit payments prior to the projected depletion date. Because the HIS benefit is essentially funded on a pay-as-you-go basis, the depletion date is considered to be immediate, and the single equivalent discount rate is equal to the municipal bond rate selected by the plan sponsor. In September 2014 the Actuarial Assumptions Conference adopted the Bond Buyer General Obligation 20-Bond Municipal Bond Index as the applicable municipal bond index. The discount rate used in the 2014 valuation was updated from 4.29% to 3.80%, reflecting the change in the Bond Buyer General Obligation 20- Bond Municipal Bond Index as of June 30, 2015. Other Key Actuarial Assumptions
The actuarial assumptions that determined the total pension liability as of June 30, 2015 were based on the results of an actuarial experience study of the FRS for the period July 1, 2008 - June 30, 2013.
Valuation Date July 1, 2014
Measurement Date June 30, 2015
Asset Valuation Method Fair Market Value
Discount rate (municipal bond rate) 3.80%
Inflation 2.60%
Salary increases including inflation 3.25%
Mortality Generational RP-2000 with Projection Scale BB
Actuarial cost method Individual Entry Age
Program Contribution Rates
The HIS essentially uses a “pay-as-you-go” funding structure. As of the June 30, 2015, accumulated HIS assets constituted less than two months of projected benefit payments. Effective July 1, 2015, the Legislature increased the HIS employer contribution rate from 1.26 percent to 1.66 percent to address the cash flow needs of the program. The ability of the current statutory contribution rate to pay full HIS benefits is very sensitive to near-term demographic experience, particularly the volume and timing of retirements and the amount of payroll on which the statutory rate is charged.
76
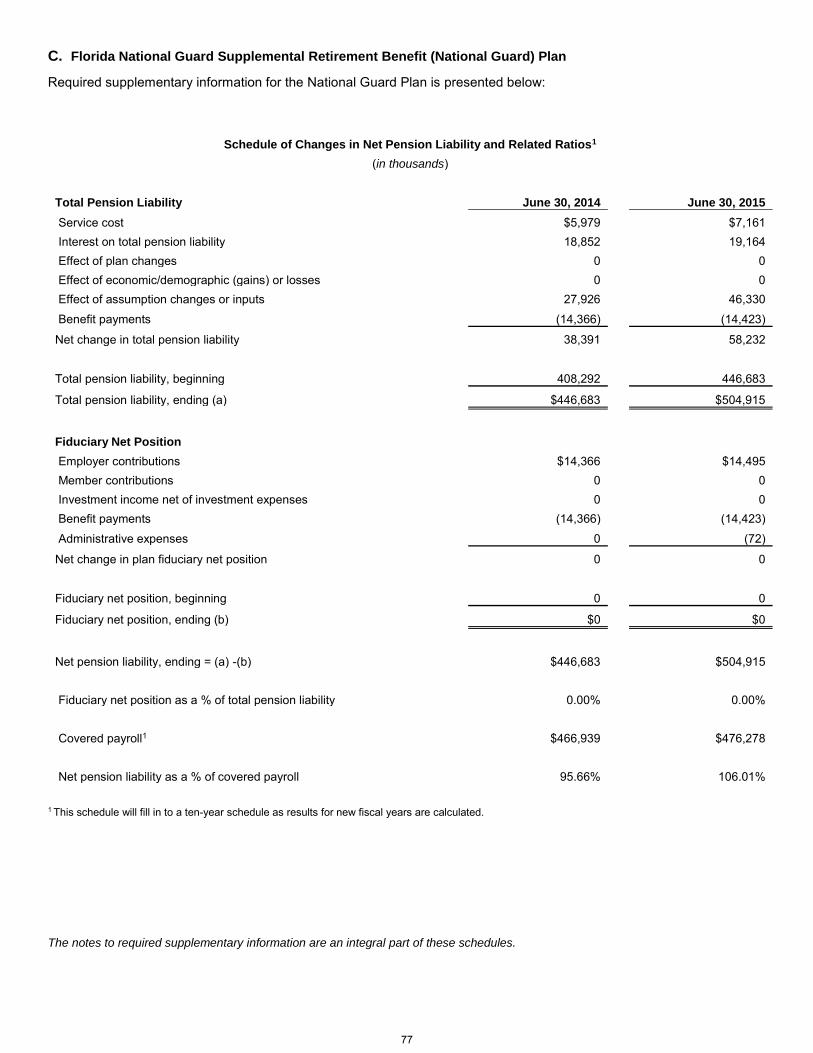
C. Florida National Guard Supplemental Retirement Benefit (National Guard) Plan
Required supplementary information for the National Guard Plan is presented below:
Schedule of Changes in Net Pension Liability and Related Ratios1
(in thousands)
Total Pension Liability June 30, 2014 June 30, 2015
Service cost $5,979 $7,161
Interest on total pension liability 18,852 19,164
Effect of plan changes 0 0
Effect of economic/demographic (gains) or losses 0 0
Effect of assumption changes or inputs 27,926 46,330
Benefit payments (14,366) (14,423)
Net change in total pension liability 38,391 58,232
Total pension liability, beginning 408,292 446,683
Total pension liability, ending (a) $446,683 $504,915
Fiduciary Net Position
Employer contributions $14,366 $14,495
Member contributions 0 0
Investment income net of investment expenses 0 0
Benefit payments (14,366) (14,423)
Administrative expenses 0 (72)
Net change in plan fiduciary net position 0 0
Fiduciary net position, beginning 0 0
Fiduciary net position, ending (b) $0 $0
Net pension liability, ending = (a) -(b) $446,683 $504,915
Fiduciary net position as a % of total pension liability 0.00% 0.00%
Covered payroll1 $466,939 $476,278
Net pension liability as a % of covered payroll 95.66% 106.01%
1 This schedule will fill in to a ten-year schedule as results for new fiscal years are calculated.
The notes to required supplementary information are an integral part of these schedules.
77

Notes to Schedule of Changes in Net Pension Liability and Related Ratios:
The Florida National Guard Supplemental Retirement Benefit Plan is funded on a pay-as-you-go basis by an annual appropriation from General Revenue by the Legislature, rather than by employer contributions and investment earnings. Any appropriated funds not obligated for benefit payments and expenses owed at June 30 of each year revert to the General Revenue Fund.
Discount Rate
In general, the discount rate for calculating the total pension liability under GASB 67 is equal to the single rate equivalent to discounting at the long-term expected rate of return for benefit payments prior to the projected depletion date. Because the National Guard benefit is funded on a pay-as-you-go basis, the depletion date is considered to be immediate, and the single equivalent discount rate is equal to the municipal bond rate selected by the plan sponsor. In September 2014 the Actuarial Assumptions Conference adopted the Bond Buyer General Obligation 20-Bond Municipal Bond Index as the applicable municipal bond index. The discount rate used was updated from 4.29% to 3.80% as of June 30, 2015, reflecting the change during the fiscal year in the Bond Buyer General Obligation 20-Bond Municipal Bond Index.
June 30, 2014 June 30, 2015
Discount rate 4.29% 3.80 %
Long-term expected rate of return, net of investment expense N/A N/A
Bond Buyer General Obligation 20-Bond Municipal Bond Index 4.29% 3.80%
Other Key Actuarial Assumptions
The plan has not had a formal actuarial experience study performed.
Valuation Date July 1, 2014
Measurement date June 30, 2015
Inflation 2.60%
Annual Increase – Federal Military Pay Tables
2.00%
Individual Member Salary Increase
Varies by service; separate tables
for officers &
enlisted
Annual Cost-of-Living-Adjustment
1.50%
Mortality
General RP- 2000
with Projection
Scale BB (see valuation report for details)
Actuarial cost method Individual Entry Age
78

D. Budgetary Reporting
Budget Process
Each year, the head of the Department of Management Services submits a legislative budget request to the Governor and
Legislature as required by Section 216.023(01), Florida Statutes. The Governor, as Chief Budget Officer, submits his
recommended budget to each legislator at least 30 days before the annual legislative session.
Revenue estimates for trust funds not projected by the Revenue Estimating Conference, such as the Police and
Firefighters’ Premium Tax Trust Fund, are provided by the state agency. These estimates may be revised during the
course of the Legislature’s consideration and adoption of a final budget. These estimates, together with known available
cash balances, are further considered by the Governor during the preparation of annual spending plans. Adjustments to
the original budget’s trust fund revenue estimates may be made to conform agency revenue estimates to actual and
projected revenue streams.
The Legislature considers and amends the Governor’s recommended budget and a final appropriations bill is then
approved by the Legislature (subject to the line-item veto power of the Governor and override authority of the Legislature);
this bill then becomes the General Appropriations Act. The Governor may, under certain conditions and subject to the
review and objection procedures set forth in Section 216.177, Florida Statutes, establish appropriations and
corresponding releases for amounts not appropriated by the Legislature to agencies. This includes appropriations for
non-operating disbursements, such as the purchase of investments and the transfer of money between state funds.
The head of a department may transfer appropriations, but only to the extent of 5 percent of the original appropriation or
$250,000, whichever is greater, or within certain programs and between identical funding sources and specific
appropriation categories. The Governor may approve changes of expenditure authority within any trust fund if the changes
are less than $1 million. The Legislative Budget Commission may approve trust fund changes in excess of $1 million. At
the end of the fiscal year, any balance of an operating appropriation which has not been disbursed but is expended
(recorded as a payable) or contracted to be expended (recorded as a reserve for encumbrances), may be carried forward
into the next fiscal year. Any appropriations not disbursed by September 30 will revert pursuant to Section 216.301(1),
Florida Statutes.
The Chief Financial Officer approves disbursements in accordance with legislative authorizations. The budget is controlled
at the account code level, which is defined as an appropriation category (e.g., salaries and benefits), and funded within a
budget entity. The Governor and Chief Financial Officer are responsible for detecting conditions which could lead to a
deficit in an agency’s funds and reporting that fact to the Legislative Budget Commission. The Constitution of the State,
Article VII, Section 1(d), states, “Provision shall be made by law for raising sufficient revenue to defray the expenses of
the state for each fiscal period.”
Budgetary Basis of Accounting
The budgetary basis of accounting required by state law differs materially from the basis used to report revenues and
expenditures in accordance with generally accepted accounting principles (GAAP). Appropriations are made from various
funds that are prescribed by law, such as the Police and Firefighters’ Premium Tax Trust Fund.
A budgetary comparison schedule for the Police and Firefighters’ Premium Tax Trust Fund is presented as part of the
other required supplementary information.
Budgetary basis revenues are essentially reported on a cash basis and include amounts classified by GAAP as other
financing sources. Budgetary basis expenditures include disbursements, except for those for prior year carry/certified
forwards, plus current year payables and encumbrances which are carried/certified forward into the next fiscal year. They
also include amounts classified by GAAP as other financing uses. State law requires prior year payables and
encumbrances not carried/certified forward to be paid from the current year budget.
79
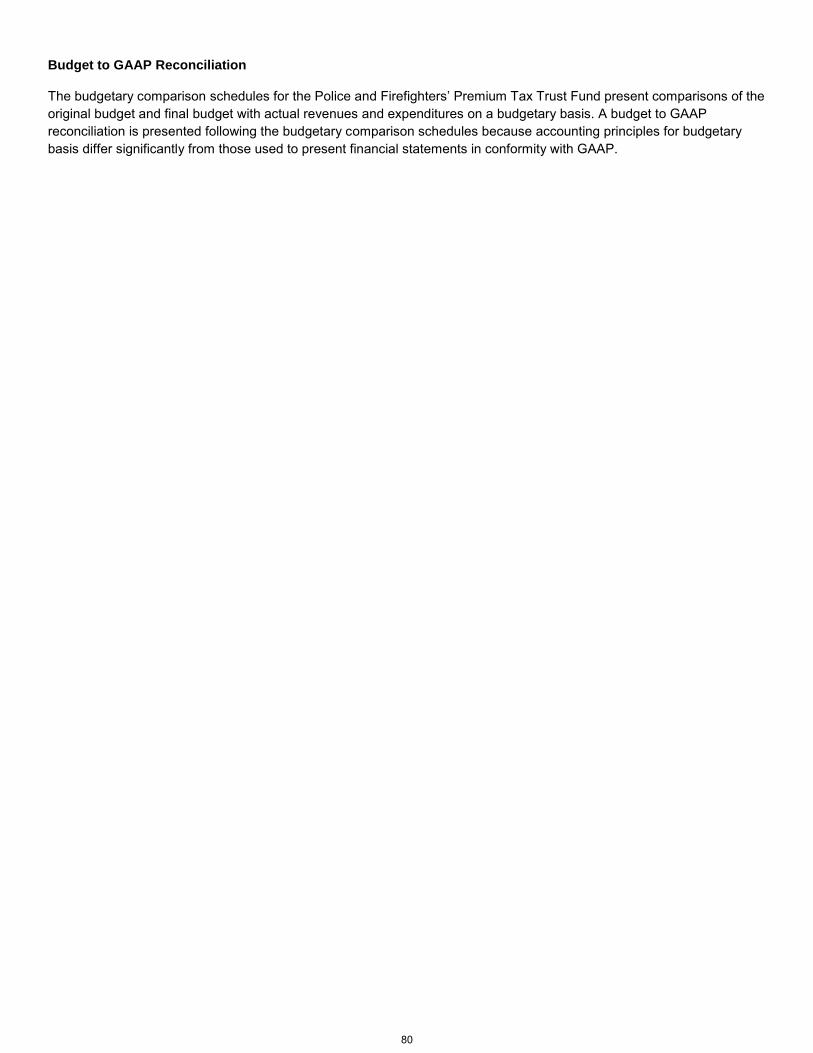
Budget to GAAP Reconciliation
The budgetary comparison schedules for the Police and Firefighters’ Premium Tax Trust Fund present comparisons of the
original budget and final budget with actual revenues and expenditures on a budgetary basis. A budget to GAAP
reconciliation is presented following the budgetary comparison schedules because accounting principles for budgetary
basis differ significantly from those used to present financial statements in conformity with GAAP.
80
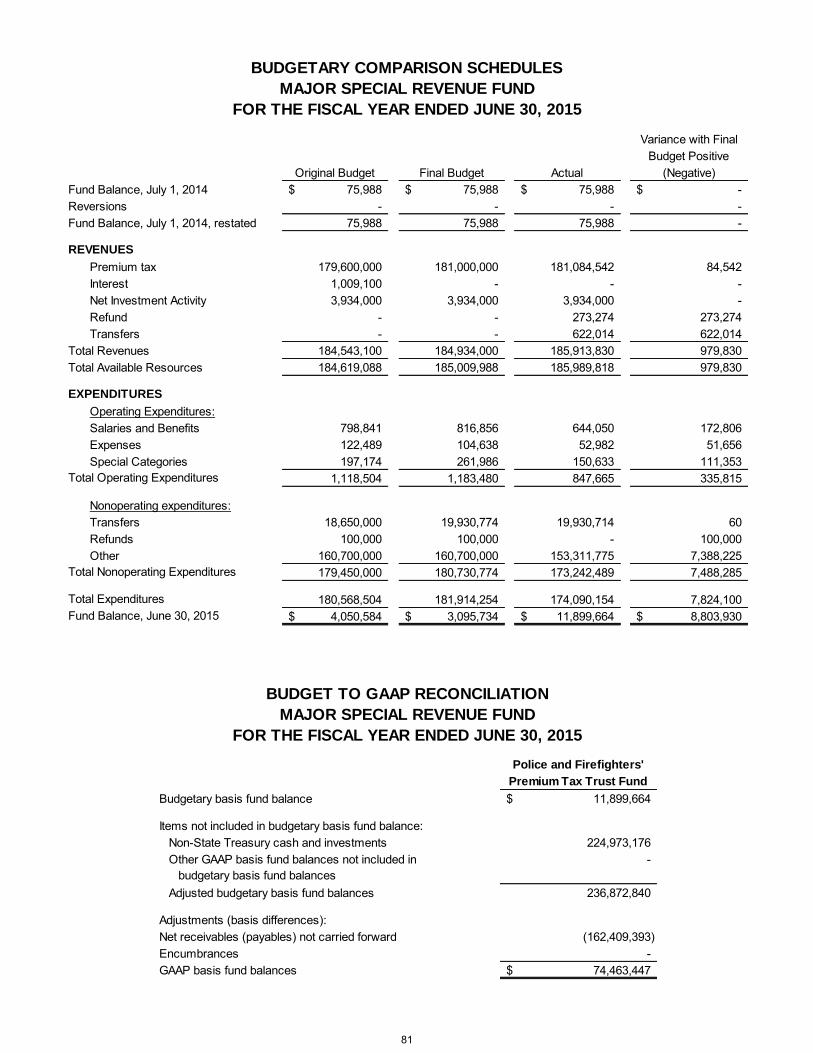
Variance with Final
Budget Positive
Original Budget Final Budget Actual (Negative)
Fund Balance, July 1, 2014 75,988$ 75,988$ 75,988$ -$
Reversions - - - -
Fund Balance, July 1, 2014, restated 75,988 75,988 75,988 -
REVENUES
Premium tax 179,600,000 181,000,000 181,084,542 84,542
Interest 1,009,100 - - -
Net Investment Activity 3,934,000 3,934,000 3,934,000 -
Refund - - 273,274 273,274
Transfers - - 622,014 622,014
Total Revenues 184,543,100 184,934,000 185,913,830 979,830
Total Available Resources 184,619,088 185,009,988 185,989,818 979,830
EXPENDITURES
Operating Expenditures:
Salaries and Benefits 798,841 816,856 644,050 172,806
Expenses 122,489 104,638 52,982 51,656
Special Categories 197,174 261,986 150,633 111,353
1,118,504 1,183,480 847,665 335,815
Nonoperating expenditures:
Transfers 18,650,000 19,930,774 19,930,714 60
Refunds 100,000 100,000 - 100,000
Other 160,700,000 160,700,000 153,311,775 7,388,225
179,450,000 180,730,774 173,242,489 7,488,285
180,568,504 181,914,254 174,090,154 7,824,100
4,050,584$ 3,095,734$ 11,899,664$ 8,803,930$ Fund Balance, June 30, 2015
BUDGETARY COMPARISON SCHEDULES
MAJOR SPECIAL REVENUE FUND
FOR THE FISCAL YEAR ENDED JUNE 30, 2015
Total Operating Expenditures
Total Nonoperating Expenditures
Total Expenditures
Police and Firefighters'
Premium Tax Trust Fund
Budgetary basis fund balance 11,899,664$
Items not included in budgetary basis fund balance:
Non-State Treasury cash and investments 224,973,176
Other GAAP basis fund balances not included in -
Adjusted budgetary basis fund balances 236,872,840
Adjustments (basis differences):
Net receivables (payables) not carried forward (162,409,393)
Encumbrances -
GAAP basis fund balances 74,463,447$
BUDGET TO GAAP RECONCILIATION
MAJOR SPECIAL REVENUE FUND
FOR THE FISCAL YEAR ENDED JUNE 30, 2015
budgetary basis fund balances
81

This page is intentionally left blank
82

Other SupplementaryInformation
The alligator is the state reptile of Florida.
83

Florida State University
National Guard System
Florida Retiree Health Supplemental Optional
Retirement Insurance Retirement Retirement
System Subsidy Benefit Plan Program
6,719,451$ 129,729$ -$ 155,446$ 526,266 - - 9,173
1,736,419 - - 32,585 499,822 - - 7,028
47,405 - - - 435,657 - - 5,289 (61,384) - - 560
- - - (509) 9,903,636 129,729 - 209,572
480,826 39,985 72,500 - 2,813,145 - - -
169,902 - - 50,000 474,162 - - 339 878,024 - - -
4,816,059 39,985 72,500 50,339
537,620 17,943 - 8,515 46,997 - - -
331,064 - - 62 56,640 - - -
972,321 17,943 - 8,577
1,017,946 - - - 51,720 - - -
130,411 - - - 13,052 - - 1,380 19,922 - - - 17,998 - - - 56,119 - - 1,327
8,283 - - - 566 - - -
32,010 - - - 12,447 15 - 78
892,240 - - 8,433 39,609 - - 88 21,890 - - - 67,750 - - 801
2,381,963 15 - 12,107
18,073,979$ 187,672$ 72,500$ 280,595$
InsuranceLoss on disposal of equipmentMaterials and supplies
Human resources overhead assessment
Depreciation
Equipment leasingFurniture and equipment
Total Administrative Expenses
Miscellaneous expensesOffice rentalOffice supplies
Utilities Subtotal
Repairs and maintenance
TelephoneTravel Subtotal
Other operating expenses
Dues and subscriptions
Other contractual services - data processing Subtotal
Communication
Postage and freightPrinting and reproduction
SalariesState retirement contributions
Social security
Legal servicesOther contractual services
Other post employment benefitsCompensated absences1
Subtotal
Pension expense2
SCHEDULE OF ADMINISTRATIVE EXPENSESas of June 30, 2015
Insurance contributions
Workers' compensation
Administrative overhead assessmentData processing supplies
Professional services
Actuarial servicesContractual IT services and monitoring
Personnel services
1 Compensated Absences usage exceeded accrual.2 This represents the SUSORP Trust Fund's allocated share of pension-related expense. Charges may be positive or negative.
84

Investment Section
Four great blue heron at the beach as the sun rises.
85

STATE BOARD OF ADMINISTRATION OF FLORIDA
1801 HERMITAGE BOULEVARD TALLAHASSEE, FLORIDA 32308
(850) 488-4406
POST OFFICE BOX 13300 32317-3300
RICK SCOTT GOVERNOR
CHAIR
JEFF ATWATER CHIEF FINANCIAL OFFICER
PAM BONDI
ATTORNEY GENERAL
ASH WILLIAMS EXECUTIVE DIRECTOR & CIO
December 31, 2015 TO: Members of the Florida Legislature Members of the Florida Retirement System RE: Assets of the Florida Retirement System Pension Plan The State Board of Administration of Florida (SBA) manages the assets of the Florida Retirement System (FRS). The Board consists of Governor Rick Scott, Chairman, Chief Financial Officer Jeff Atwater, and Attorney General Pam Bondi. The primary investment objectives for the FRS Pension Plan are to provide investment returns sufficient to ensure timely payment of promised benefits and keep plan costs at a reasonable level. The portfolio consists of a highly diversified asset mix of investments, which includes government and corporate bonds, common stocks, income-producing real estate, alternative investments, and short-term money market instruments. The proportions of major asset classes in the FRS Pension Plan portfolio, by quarter, are shown below:
Investment performance of the FRS Pension Plan is reported in the SBA’s 2014-15 Investment Report. The annual report is prepared before January 1, in compliance with Section 215.44(5), Florida Statutes, and includes detailed information on FRS Pension Plan investment assets, strategy, and performance. The SBA’s performance consultant, Bank of New York Mellon, independently prepares reported performance data.
Respectfully submitted,
Ashbel C. Williams
9/30/14 12/31/14 3/31/15 6/30/15Fund Market Value $145.82 billion $146.56 billion $148.50 billion $147.97 billion
Asset Classes 9/30/14 12/31/14 3/31/15 6/30/15Global Equity 59.3% 59.0% 58.9% 58.1%Fixed Income 20.6% 20.1% 19.9% 19.8%Real Estate 7.7% 7.9% 8.1% 8.3%Private Equity 5.8% 5.6% 5.7% 6.0%Strategic Investments 5.9% 6.5% 6.7% 6.9%Cash Equivalents/Short Term 0.7% 0.7% 0.8% 0.8%Total** 100.0% 100.0% 100.0% 100.0%**Columns may not add to totals due to rounding.
FRS Pension Plan Public and 10 Years 5 Years 3 Years 1 YearPrivate Markets 2005-2015 2010-2015 2012-2015 2014-2015Total FRS Pension Plan 6.86% 11.01% 11.24% 3.67%
Annualized FRS Pension Plan Investment Performance(By Fiscal Year Periods)
Actual Quarter-End Asset Allocation
FRS Pension Plan Market Value for Fiscal Year 2014-2015
Fiscal Year 2014-2015
86

FRS TRUST FUND PERFORMANCE The following shows the FRS Trust Fund’s investment performance reported at fair value for one-year periods as of June 30 of each year.
Fiscal Year
Based On Fair Value
2006 10.56% 2007 18.07% 2008 (4.42)% 2009 (19.03)% 2010 14.03% 2011 22.09% 2012 0.29% 2013 13.12% 2014 17.40% 2015 3.67%
87

DISTRIBUTION OF INVESTMENTS1
FRS TRUST FUND
Global EquityFixed IncomeReal Estate
Value as of June 30, 2015
$29,313,167,689$12,284,305,293
as of June 30, 2015
Private Equity
Cash Equivalents/Short Term
Total $147,972,946,329
Strategic Investments
$86,001,699,601
$1,216,236,641
$8,938,200,649$10,219,336,456
Fund Market Value $147,972,946,329
Investments by Asset Class
Asset Class
Fixed Income 19.8%
Real Estate 8.3%
Private Equity 6.0%
Strategic Investments
6.9%
Cash/Short Term 0.8%
Global Equity 58.1%
1 Percentages may not add to 100 percent due to rounding.
88

Actuarial Section
Florida bobcats.
89

Florida Retirement System Pension Plan
Overview of GASB 67 and GASB 68
The Governmental Accounting Standards Board (GASB) released new accounting standards for public pension plans and participating employers in 2012. These standards, GASB Statements No. 67 and 68, have substantially revised the accounting requirements previously mandated under GASB Statements No. 25 and 27. The most notable change is the distinct separation of funding from financial reporting. The Annual Required Contribution (ARC) has been eliminated under GASB 67 and 68 and is no longer relevant for financial reporting purposes. As a result, plan sponsors have been encouraged to establish a formal funding policy that is separate from financial reporting calculations.
GASB 67 applies to financial reporting for public pension plans. Under GASB 67, enhancements to the financial statement disclosures are required, along with certain required supplementary information.
GASB 68 governs the specifics of accounting for public pension plan obligations for participating employers. GASB 68 requires a liability for pension obligations, known as the Net Pension Liability, to be recognized on the balance sheets of participating employers. Changes in the Net Pension Liability will be immediately recognized as Pension Expense on the Statement of Changes in Net Position or reported on the Statement of Fiduciary Net Position as deferred inflows/outflows of resources depending on the nature of the change.
Relationship Between Valuation Date and Measurement Date
The Valuation Date is July 1, 2015. This is the date as of which the actuarial valuation is performed. The Measurement Date is June 30, 2015.
Depletion Date Projection
GASB 67 generally requires that a blended discount rate be used to measure the Total Pension Liability (the Actuarial Accrued Liability calculated using the Individual Entry Age Normal Cost Method). The long-term expected return on plan investments may be used to discount liabilities to the extent that the plan’s Fiduciary Net Position (fair market value of assets) is projected to cover benefit payments and administrative expenses. A 20-year high quality (AA/Aa or higher) municipal bond rate must be used for periods where the Fiduciary Net Position is not projected to cover benefit payments and administrative expenses. Determining the discount rate under GASB 67 will often require that the actuary perform projections of future benefit payments and asset values. GASB 67 (paragraph 43) does allow for alternative evaluations of projected solvency, if such evaluation can reliably be made. GASB does not contemplate a specific method for making an alternative evaluation of sufficiency; it is left to professional judgment.
The following circumstances justify an alternative evaluation of sufficiency for the Florida Retirement System:
The Florida Retirement System has a formal written policy to calculate an Actuarially Determined Contribution (ADC), which is articulated in the actuarial valuation report.
The ADC is based on a closed, layered amortization period, which means that payment of the full ADC each year will bring the plan to a 100% funded position by the end of the amortization period if future experience follows assumption.
GASB 67 specifies that the projections regarding future solvency assume that plan assets earn the assumed rate of return and there are no future changes in the plan provisions or actuarial methods and assumptions, which means that the projections would not reflect any adverse future experience which might impact the plan’s funded position.
Based on these circumstances, it is our professional opinion that the detailed depletion date projections outlined in GASB 67 would clearly indicate that the Fiduciary Net Position is always projected to be sufficient to cover benefit payments and administrative expenses. As such, the detailed projections were not developed.
90

This work product was prepared solely for the Florida Department of Management Services for the purposes stated herein, and may not be appropriate to use for other purposes. Milliman does not intend to benefit and assumes no duty or liability to other parties who receive this work. Milliman
recommends that third parties be aided by their own actuary or other qualified professional when reviewing the Milliman work product.
111 SW Fifth Avenue, Suite 3700 Portland, OR 97204 Tel 503 227 0634
1301 Fifth Ave, Suite 3800 Seattle, WA 98101 Tel 206 504 5695
milliman.com
January 22, 2016
Florida Legislature Members and Florida Retirement System Members
Re: Actuary’s Statement Regarding FRS 2015 Actuarial Valuation
Dear Florida Legislators and FRS Members: Milliman has completed an actuarial valuation as of July 1, 2015 for the Florida Retirement System (FRS) Pension Plan. Due to current Governmental Accounting Standards Board (GASB) financial reporting standards, the actuarial valuation now has two distinct sets of calculations which fulfill two separate requirements:
System funding calculations, which assess system funded status and determine
actuarially calculated contribution rates for the July 1, 2016 – June 30, 2017 plan year. The methods and assumptions for these calculations are unchanged from those used in the prior valuation as of July 1, 2014 and in the preliminary 2015 valuation results, which were presented to the 2015 FRS Actuarial Assumptions Conference.
System GASB 67 financial reporting calculations, which satisfy relevant accounting
standards for annual financial reporting to interested parties. These calculations use demographic and economic assumptions identical to those used in system funding calculations. However, as discussed later in this letter, the methods used to determine assets and actuarial liabilities differ in order to comply with GASB mandates which are designed to allow financial statement comparability between pension systems.
In this year’s valuation, the two sets of calculations were issued under separate cover due to the differing methodologies as noted above and as discussed later in this letter. System Funding Calculations On the smoothed Actuarial Value of Assets (AVA) basis used to determine actuarially calculated contribution rates, Pension Plan funded status decreased slightly from 86.6% to 86.5%. On a Market Value of Assets (MVA) basis, Pension Plan funded status decreased from 93.7% to 89.7% due to an actual plan year investment return of 3.76% compared to an assumed return of 7.65%. Due to strong overall investment performance over the past several years, the MVA exceeds the AVA used for funded status and contribution rate calculations by $5.3 billion as of July 1, 2015. The $5.3 billion not-yet-recognized investment gain will be systematically recognized in the AVA over the next several years if actual investment experience during
91

January 22, 2016 Page 2
This work product was prepared solely for the Florida Department of Management Services for the purposes stated herein, and may not be appropriate
to use for other purposes. Milliman does not intend to benefit and assumes no duty or liability to other parties who receive this work. Milliman recommends that third parties be aided by their own actuary or other qualified professional when reviewing the Milliman work product.
that period meets or exceeds assumption. Alternatively, if actual investment experience during that period fails to meet the 7.65% assumption used in this valuation, the not-yet-recognized $5.3 billion gain will serve as a cushion to help mitigate the magnitude of increases in actuarially calculated employer contribution rates. The composite actuarially calculated employer contribution rate in the funding valuation (prior to blending with Investment Plan contribution rates to create proposed statutory rates) for the 2016-2017 plan year increased by 0.24% of payroll when compared to the 2015-2016 rate calculated in the prior valuation. The most significant rate increase sources were:
a) Actual growth of the payroll to amortize the UAL was only 2.3%, compared to the assumed payroll growth of 3.25%,
b) An increased percentage of Pension Plan payroll in the Special Risk Membership class, which has higher cost benefits than Regular Membership Class, and
c) Actual plan year demographic experience differing from assumptions, including the effects of actual retirement/DROP entry at rates higher than assumed.
The actuarially calculated contribution rates in the valuation are determined in a manner such that they will remain level as a percentage of projected payroll in future years if experience follows the valuation’s assumptions until system funded status nears 100%. This valuation used a long-term average annual future investment return assumption of 7.65%, as initially adopted for use by the 2014 FRS Actuarial Assumptions Conference. While the assumption is identical to that used in the previous valuation, it is materially above the 50th percentile average returns in the proprietary capital market outlook models of both Milliman and the State Board of Administration’s consultant (Aon Hewitt Investment Consulting) as presented at the 2015 FRS Actuarial Assumptions Conference. Both models have 50th percentile average annual long-term future returns in the 6.8% - 6.9% range and both indicate an approximately 35% likelihood of actual long-term future returns meeting or exceeding 7.65%. All else being equal, the lower the selected investment return assumption, the higher the likelihood the Pension Plan will meet or exceed its assumed investment return in future years. A lower assumption would result in higher short-term actuarially calculated contribution rates for employers, but would also serve to lessen the magnitude of actuarially calculated contribution rate increases in the event that actual future investment performance fails to meet the assumption. Actual future investment return experience for the Pension Plan is not affected by the assumption used in the actuarial valuation. Applying the 7.65% valuation assumption, the
92

January 22, 2016 Page 3
This work product was prepared solely for the Florida Department of Management Services for the purposes stated herein, and may not be appropriate
to use for other purposes. Milliman does not intend to benefit and assumes no duty or liability to other parties who receive this work. Milliman recommends that third parties be aided by their own actuary or other qualified professional when reviewing the Milliman work product.
following graph illustrates the UAL on a Market Value of Assets basis under three scenarios for steady actual future investment returns:
7.65%, which is the assumption used in the valuation
7.50%, which is slight underperformance compared to the valuation assumption
6.80%, which is near the 50th percentile return in the Aon Hewitt model
As illustrated in the graph, if actual returns match the 7.65% assumption the UAL is expected to decrease over time. This is consistent with the closed period amortization method used to calculate contribution rates in the valuation. If actual returns have modest underperformance compared to the 7.65% assumption, the UAL neither increases nor decreases materially over the illustrated projection period. On the other hand, if actual investment returns consistently underperform the assumption (0.85% underperformance is illustrated) the UAL will increase over time even if actuarially calculated contributions are made and all other experience follows the assumptions used in the valuation.
System GASB Financial Reporting Calculations Unchanged from last year’s valuation, GASB Statement No. 67 is the governing standard for system financial reporting. GASB 67 calculation methodology differs in two significant ways from the system funding calculation methodology. First, GASB 67 mandates use of fair market asset values for calculation of unfunded liability. Second, GASB 67 mandates a
93

January 22, 2016 Page 4
This work product was prepared solely for the Florida Department of Management Services for the purposes stated herein, and may not be appropriate
to use for other purposes. Milliman does not intend to benefit and assumes no duty or liability to other parties who receive this work. Milliman recommends that third parties be aided by their own actuary or other qualified professional when reviewing the Milliman work product.
specific actuarial cost method (Individual Entry Age Normal) for financial reporting. That method differs from that used in the system funding valuation calculations (Ultimate Entry Age Normal.) An actuarial cost method allocates the net present value of projected retirement benefits across a member’s projected working career, thus establishing values for actuarial liability (allocation to past service) and normal cost (allocation to current year service). As of the date of this valuation, both of the GASB-mandated methods noted above cause the calculated unfunded liability for financial reporting calculations to be significantly lower than the unfunded liability determined for system funding calculations. For FRS GASB 67 financial reporting calculations, the unfunded liability (Net Pension Liability) as of July 1, 2015 is $12.9 billion, whereas the system funding calculations have an unfunded liability (UAL) of $22.3 billion. Other Comments
Actuarial assumptions are needed to estimate the future economic and demographic experience of the system. Any deviations between actual and expected future experience will result in corresponding changes in the on-going costs of the system. The economic assumptions were developed from both external economic forecasts and information and forecasts furnished by the State Board of Administration. The demographic actuarial assumptions were developed both from recent experience of the System and from standard actuarial sources. The actuarial assumptions used in performing the July 1, 2015 valuation are identical to those used in the previous valuation, and were adopted by the 2014 FRS Actuarial Assumptions Conference. Details on the development of assumptions can be found in our 2014 FRS Experience Study, which was published in September 2014 and reviewed FRS experience for the five-year period ending June 30, 2013.
A single set of assumptions was used for both system funding calculations and system GASB 67 financial reporting calculations. We believe the assumptions used are reasonable.
The methodology differences between the funding and GASB calculations are identified above. The assumptions and methods used in performing the GASB calculations meet the parameters set by GASB Statement No. 67, Financial Reporting for Pension Plans.
The results of the report are dependent upon future experience conforming to these assumptions. Future actuarial measurements may differ significantly from the current measurements presented in the report due to many factors, including: plan experience differing from that anticipated by the economic or demographic assumptions; changes in economic or demographic assumptions; increases or decreases expected as part of the natural operation of the methodology used for these measurements (such as the end of an amortization period) and changes in plan provisions or applicable law. Due to the limited scope of our assignment, we did not perform an analysis of the potential range of future measurements.
94

January 22, 2016 Page 5
This work product was prepared solely for the Florida Department of Management Services for the purposes stated herein, and may not be appropriate
to use for other purposes. Milliman does not intend to benefit and assumes no duty or liability to other parties who receive this work. Milliman recommends that third parties be aided by their own actuary or other qualified professional when reviewing the Milliman work product.
In performing the valuation, we relied without audit upon the financial statements, membership data, and other cost and benefits provision information furnished by the Division of Retirement. Although membership data was subjected to standard editing procedures and the other information was reviewed for reasonableness, Milliman, Inc. does not assume responsibility for either its accuracy or its completeness. In preparing our report we relied, without audit, on information (some oral and some written) supplied by the Division of Retirement. This information includes, but is not limited to, statutory provisions, employee census, and financial information. In our examination of this data, we have found it to be reasonably consistent and comparable with data used for other purposes. Since the valuation results are dependent on the integrity of the data supplied, the results can be expected to differ if the underlying data is incomplete or missing. It should be noted that if any data or other information is inaccurate or incomplete, our calculations may need to be revised. This report has been prepared exclusively for the Florida Department of Management Services, Division of Retirement for a specific and limited purpose. Milliman does not intend to benefit and assumes no duty or liability to other parties who receive this work. It is a complex, technical analysis that assumes a high level of knowledge concerning the Florida Retirement System’s operations, and uses Division data, which Milliman has not audited.
Milliman does not intend to benefit or create a legal duty to any third party recipient of this report. No third party recipient of Milliman's work product should rely upon this report. Such recipients should engage qualified professionals for advice appropriate to their own specific needs.
The consultants who worked on this assignment are pension actuaries. Milliman’s advice is not intended to be a substitute for qualified legal or accounting counsel.
The signing actuary is independent of the plan sponsors. I am not aware of any relationship that would impair the objectivity of Milliman’s work.
This actuarial valuation was prepared and completed by me and those under my direct supervision, and I acknowledge responsibility for the results. I hereby certify that the valuation report is complete and accurate to the best of my knowledge, and in my opinion the techniques and assumptions used are reasonable and meet the requirements and intent of Part VII, Chapter 112, Florida Statutes, and Section 14, Article X of the State Constitution. There is no benefit provision or related expense to be provided by the plan and/or paid from the plan’s assets for which liabilities or current costs have not been established or otherwise taken into account in the valuation. To the best of my knowledge, there were no known events that were not taken into account in the valuation. On the basis of the foregoing, I hereby certify that, to the best of my knowledge and belief, this report is
95

January 22, 2016 Page 6
This work product was prepared solely for the Florida Department of Management Services for the purposes stated herein, and may not be appropriate
to use for other purposes. Milliman does not intend to benefit and assumes no duty or liability to other parties who receive this work. Milliman recommends that third parties be aided by their own actuary or other qualified professional when reviewing the Milliman work product.
complete and accurate and has been prepared in accordance with generally recognized and accepted actuarial principles and practices which are consistent with Actuarial Standards of Practice, the Code of Professional Conduct and Qualification Standards for Public Statements of Actuarial Opinion of the American Academy of Actuaries. I am a member of the American Academy of Actuaries and meet the Qualification Standards to render the actuarial opinion contained herein.
Respectfully submitted,
Matt Larrabee, FSA, EA, MAAA Principal & Consulting Actuary
96

This work product was prepared solely for the Florida Department of Management Services for the purposes stated herein, and may not be appropriate
to use for other purposes. Milliman does not intend to benefit and assumes no duty or liability to other parties who receive this work. Milliman
recommends that third parties be aided by their own actuary or other qualified professional when reviewing the Milliman work product.
Certification Actuarial computations presented in this report under Statement No. 67 of the Governmental Accounting Standards Board are for purposes of assisting the FRS in fulfilling its financial accounting requirements. No attempt is being made to offer any accounting opinion or advice. This report is for fiscal year July 1, 2014 to June 30, 2015. The reporting date for determining plan assets and obligations is June 30, 2015. The calculations enclosed in this report have been made on a basis consistent with our understanding of the plan provisions. Determinations for purposes other than meeting financial reporting requirements may be significantly different than the results contained in this report. Accordingly, additional determinations may be needed for other purposes, such as judging benefit security or meeting employer funding requirements. In preparing this report, we relied, without audit, on information as of June 30, 2014 and June 30, 2015 furnished by the FRS. This information includes, but is not limited to, statutory provisions, member census data, and financial information. Please note that this report is based on the June 30, 2015 assets for the program as reported to us by the Division of Retirement. Please see Milliman's funding valuation report dated December 1, 2015 for more information on the plan's participant group as of July 1, 2015 as well as a summary of the plan provisions and a summary of the actuarial methods and assumptions used for funding purposes. We performed a limited review of the census and financial information used directly in our analysis and have found them to be reasonably consistent and comparable with information used for other purposes. The valuation results depend on the integrity of this information. If any of this information is inaccurate or incomplete our results may be different and our calculations may need to be revised. We hereby certify that, to the best of our knowledge, this report, including all costs and liabilities based on actuarial assumptions and methods, is complete and accurate and determined in conformance with generally recognized and accepted actuarial principles and practices, which are consistent with the Actuarial Standards of Practice promulgated by the Actuarial Standards Board and the applicable Code of Professional Conduct and supporting Recommendations of the American Academy of Actuaries. This valuation report is only an estimate of the Plan's financial condition as of a single date. It can neither predict the Plan's future condition nor guarantee future financial soundness. Actuarial valuations do not affect the ultimate cost of Plan benefits, only the timing of Plan contributions. While the valuation is based on an array of individually reasonable assumptions, other assumption sets may also be reasonable and valuation results based on those assumptions would be different. No one set of assumptions is uniquely correct. Determining results using alternative assumptions is outside the scope of our engagement. Future actuarial measurements may differ significantly from the current measurements presented in this report due to factors such as, but not limited to, the following: plan experience differing from that anticipated by the economic or demographic assumptions; changes in economic or demographic assumptions; increases or decreases expected as part of the natural operation of the methodology used for these measurements (such as the end of an amortization period or additional cost or contribution requirements based on the plan’s funded status); and changes in plan provisions or applicable law. Due to the limited scope of the actuarial assignment, we did not perform an analysis of the potential range of such future measurements. Milliman’s work is prepared solely for the internal use and benefit of the Florida Retirement System. To the extent that Milliman's work is not subject to disclosure under applicable public records laws, Milliman’s work may not be provided to third parties without Milliman’s prior written consent. Milliman does not intend to benefit or create a legal duty to any third party recipient of its work product. Milliman’s consent to release its work product to any third party may be conditioned on the third party signing a Release, subject to the following exceptions: (a) the Plan Sponsor may provide a copy of Milliman’s work, in its entirety, to the Plan Sponsor's professional service advisors who are subject to a duty of confidentiality and who agree to not use Milliman’s work for any purpose other than to benefit the Fund; and (b) the Plan Sponsor may provide a copy of Milliman's work, in its entirety, to other governmental entities, as required by law. No third party recipient of Milliman's work product should rely upon Milliman's work product. Such recipients should engage qualified professionals for advice appropriate to their specific needs.
97

This work product was prepared solely for the Florida Department of Management Services for the purposes stated herein, and may not be appropriate
to use for other purposes. Milliman does not intend to benefit and assumes no duty or liability to other parties who receive this work. Milliman
recommends that third parties be aided by their own actuary or other qualified professional when reviewing the Milliman work product.
The consultants who worked on this assignment are pension actuaries. Milliman's advice is not intended to be a substitute for qualified legal or accounting counsel. The signing actuaries are independent of the plan sponsor. We are not aware of any relationship that would impair the objectivity of our work. On the basis of the foregoing, we hereby certify that, to the best of our knowledge and belief, this report is complete and has been prepared in accordance with generally recognized accepted actuarial principles and practices. We are members of the American Academy of Actuaries and meet the Qualification Standards to render the actuarial opinion contained herein.
Matt R. Larrabee, FSA, EA, MAAA Kathryn M. Hunter, ASA, MAAA Principal and Consulting Actuary Consulting Actuary
Daniel R. Wade, FSA, MAAA Consulting Actuary
98
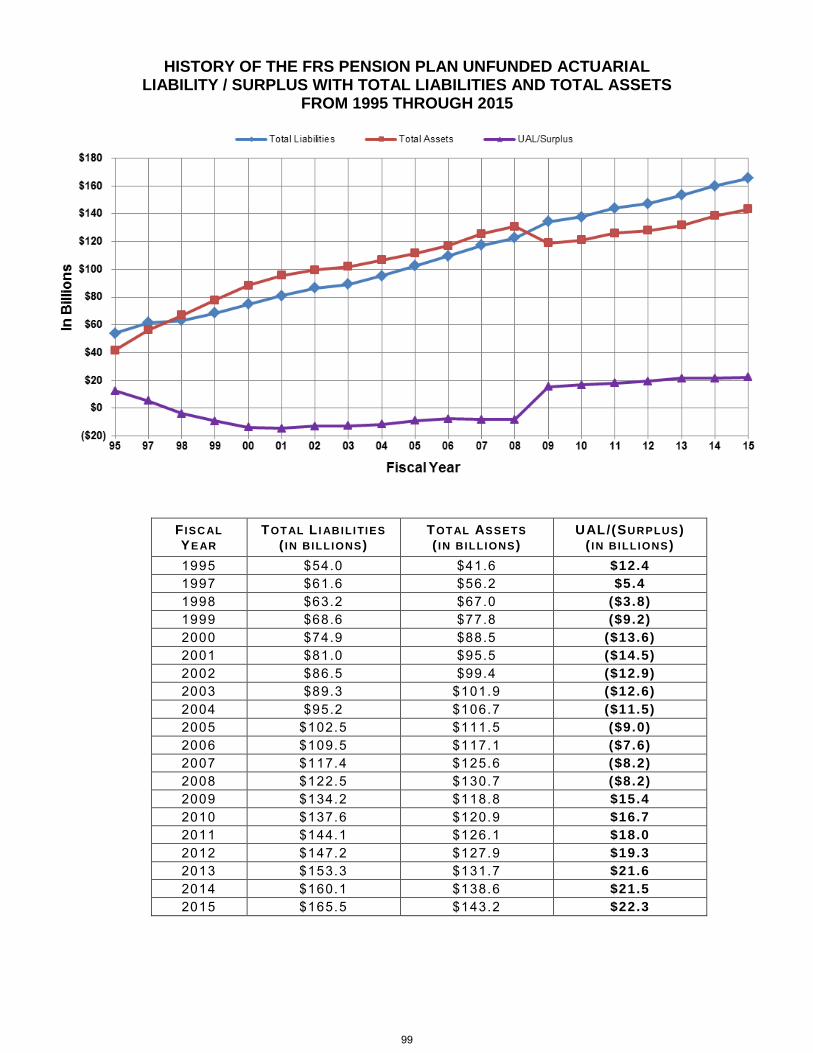
HISTORY OF THE FRS PENSION PLAN UNFUNDED ACTUARIAL LIABILITY / SURPLUS WITH TOTAL LIABILITIES AND TOTAL ASSETS
FROM 1995 THROUGH 2015
F ISC AL YEAR
TOTAL L I ABILITIES ( IN BILLIONS )
TOTAL ASSETS ( IN BILLIONS )
UAL/(SURPLUS ) ( IN BILLIONS )
1995 $54.0 $41.6 $12.4
1997 $61.6 $56.2 $5.4
1998 $63.2 $67.0 ($3.8)
1999 $68.6 $77.8 ($9.2)
2000 $74.9 $88.5 ($13.6)
2001 $81.0 $95.5 ($14.5)
2002 $86.5 $99.4 ($12.9)
2003 $89.3 $101.9 ($12.6)
2004 $95.2 $106.7 ($11.5)
2005 $102.5 $111.5 ($9.0)
2006 $109.5 $117.1 ($7.6)
2007 $117.4 $125.6 ($8.2)
2008 $122.5 $130.7 ($8.2)
2009 $134.2 $118.8 $15.4
2010 $137.6 $120.9 $16.7
2011 $144.1 $126.1 $18.0
2012 $147.2 $127.9 $19.3
2013 $153.3 $131.7 $21.6
2014 $160.1 $138.6 $21.5
2015 $165.5 $143.2 $22.3
99
FRS PENSION PLAN MEMBERSHIP
Inactive members include retirees, DROP participants and vested terminated pension plan members. Active members
include only pension plan members.
100

FRS PENSION PLAN PAYROLL
FRS PENSION PLAN CASH FLOWS
1 Includes payroll for participants in certain non-FRS defined contribution plans upon which UAL rate contributions to the FRS are made.
2 Includes transfers to IP; Initial transfers in 2003 were $353 Million.
101
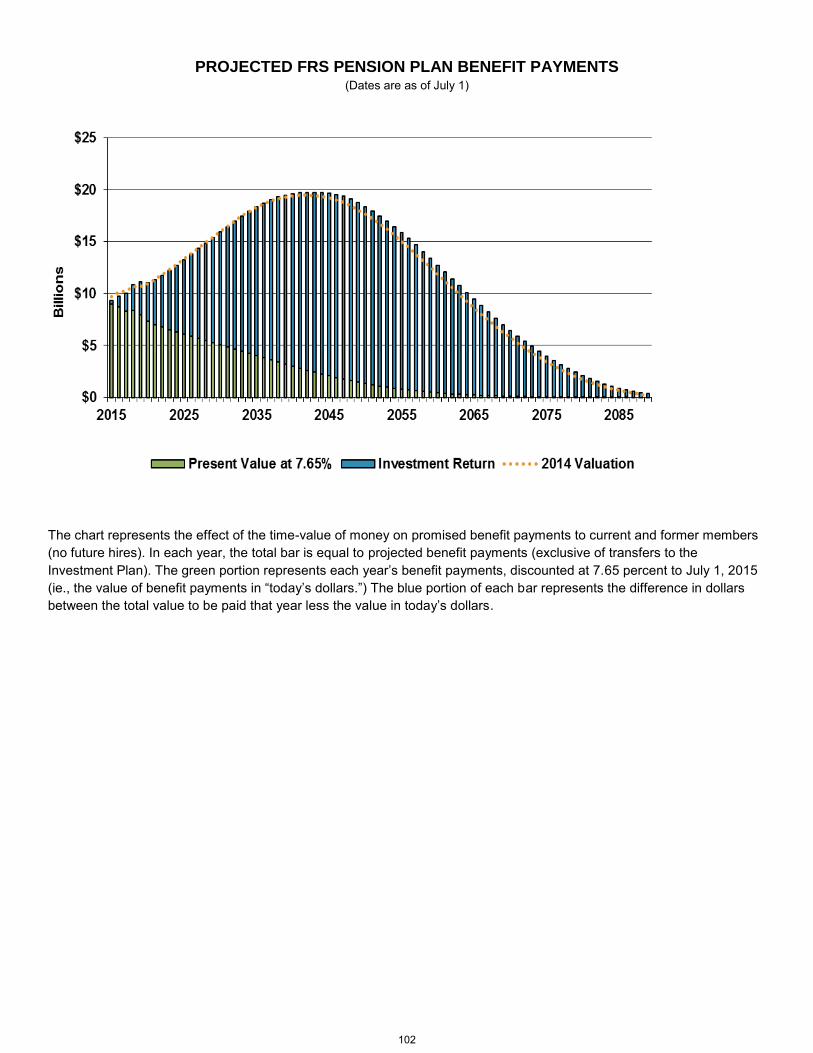
PROJECTED FRS PENSION PLAN BENEFIT PAYMENTS (Dates are as of July 1)
The chart represents the effect of the time-value of money on promised benefit payments to current and former members
(no future hires). In each year, the total bar is equal to projected benefit payments (exclusive of transfers to the
Investment Plan). The green portion represents each year’s benefit payments, discounted at 7.65 percent to July 1, 2015
(ie., the value of benefit payments in “today’s dollars.”) The blue portion of each bar represents the difference in dollars
between the total value to be paid that year less the value in today’s dollars.
102

Florida Retirement System Trust Fund
93,385,450
3,904,366
148,454,393,902$
50,774,315
4,052,143
150,014,292,372$
National Guard -
FRS PENSION PLAN TRUST FUND ASSETSas of June 30
STATEMENT OF FUND BALANCE / FIDUCIARY NET POSITIONas of June 30
2014
Police Officers and Firefighters' Premium Tax Trust Fund
50,851
2015
Health Insurance Subsidy Trust Fund
State University System Optional Retirement Program Trust Fund1
Senior Management Service Optional Annuity Program Trust Fund1
Total Fund Balance/Fiduciary Net Position
74,291,756
148,583,553,109$
40,993
-
150,184,329,004$
72,695,965
$126.580
$119.981
$129.853
$150.014$148.454
$100.000
$110.000
$120.000
$130.000
$140.000
$150.000
$160.000
$170.000
2011 2012 2013 2014 2015
In B
illi
on
s
Fiscal Year
1
Fund Balance represents residual funds pending transfer to individual member accounts with program provider companies.
103

FRS PENSION PLAN TOTAL ACTUARIAL ASSETS COMPARED
TO TOTAL ACTUARIAL LIABILITIES
This chart illustrates the overall financial health of the FRS defined benefit plan. Annual benefit payments are identified as part of the
total liabilities.
$126.08 $127.89 $131.68 $138.62
$143.20 $144.12 $147.19 $153.30
$160.13 $165.55
$6.69 $7.35 $7.90 $8.19 $9.22
$0.00
$20.00
$40.00
$60.00
$80.00
$100.00
$120.00
$140.00
$160.00
$180.00
$200.00
In B
illi
on
s
Fiscal Year
Assets
Liabilities
BenefitPayments
2012-13 2013-14 2014-15 2010-11 2011-12
104

TOTAL COMPOSITE BLENDED RATEas of June 30
For 2011-2013, the difference between the enacted rate and the recommended rate represents underfunding of the benefitobligation.
12.04%
14.78%
8.47% 8.67% 9.17% 11.59%
5.05% 5.42%
8.67% 9.17%
0.00%
2.00%
4.00%
6.00%
8.00%
10.00%
12.00%
14.00%
16.00%
2011 2012 2013 2014 2015
Co
ntr
ibu
tio
n R
ate
Fiscal Year
Valuation Recommended Rate Rate Enacted by Legislature
105

FRS PENSION PLAN RETIREMENT CONTRIBUTIONSas of June 30
All other disclosures and information not separartely contained in this section may be found in the RSI, the Note disclosures, andthe 2015 FRS Valuation dated Dec. 1, 2015.
$3.520
$2.309 $2.371
$2.890
$3.167
2.000
2.200
2.400
2.600
2.800
3.000
3.200
3.400
3.600
3.800
4.000
2011 2012 2013 2014 2015
In B
illi
on
s
Fiscal Year
106

Offices in Principal Cities Worldwide
This work product was prepared solely for the Florida Department of Management Services for the purposes described herein and may not be appropriate to use for other purposes. Milliman does not intend to benefit and assumes no duty or liability to other parties who receive this work. Milliman
recommends that third parties be aided by their own actuary or other qualified professional when reviewing the Milliman work product.
111 SW Fifth Avenue, Suite 3700
Portland, OR 97204
Tel 503 227 0634
1301 Fifth Avenue, Suite 3800
Seattle, WA 98101
Tel 206 624 7940
milliman.com
January 28, 2016
VIA E-MAIL
Mr. Dan Drake State Retirement Director Florida Retirement System 1317 Winewood Boulevard, Building 8 Tallahassee, FL 32399
Re: Health Insurance Subsidy (HIS) GASB 67 Reporting for Fiscal Year End 2015
Dear Dan:
As requested, we prepared actuarial exhibits to assist the State of Florida in completing financial reporting for the Health Insurance Subsidy for the fiscal year ending June 30, 2015. The exhibits are attached to this letter.
The exhibits provide information to assist the Department of Management Services (DMS) in complying with GASB Statement No. 67, which governs plan reporting and replaced GASB 25 beginning with last year’s initial GASB year-end Measurement Date of June 30, 2014. They provide the same GASB 67 elements provided last year.
Health Insurance Subsidy valuations are conducted biennially. The most recently completed actuarial valuation report for HIS used an actuarial valuation date of July 1, 2014. That actuarial valuation was also used to develop the liabilities for the enclosed June 30, 2015 financial reporting exhibits. Liabilities originally calculated as of the actuarial valuation date are recalculated as of a later GASB Measurement Date using a standard actuarial roll-forward technique. The enclosed exhibits show the recalculated liability results at June 30, 2015, as required for GASB 67, and reflect asset information from the June 30, 2015 financial statements. The actuarial liability is labeled the “Total Pension Liability”, consistent with terminology introduced by GASB 67. The Total Pension Liability as of June 30, 2014 is identical to that developed for the implementation of GASB 67 at fiscal-year-end 2014, and was based upon the July 1, 2014 actuarial valuation report.
The formal July 1, 2014 actuarial valuation report should be referenced for full detail on the data and assumptions used, actuarial methods applied, provisions valued, and other important information regarding the use and applicability of actuarial valuation results. Differences between the assumptions used for June 30, 2015 financial reporting compared to those shown in the actuarial valuation report are discussed below.
107
Mr. Dan Drake January 28, 2016 Page 2
This work product was prepared solely for the Florida Department of Management Services for the purposes described herein and may not be appropriate to use for other purposes. Milliman does not intend to benefit and assumes no duty or liability to other parties who receive this work. Milliman
recommends that third parties be aided by their own actuary or other qualified professional when reviewing the Milliman work product.
Assumption changes since July 1, 2014 Actuarial Valuation
Assumptions used to calculate the Total Pension Liability are as described in the July 1, 2014 actuarial valuation report, with the following exception:
The Total Pension Liability is calculated based on a single equivalent discount rate as required by GASB 67. The discount rate used was updated from 4.29% to 3.80%, reflecting the change during the fiscal year in the Bond Buyer General Obligation 20-Bond Municipal Bond Index. That index was originally approved for use in HIS GASB 67 calculations by the 2014 FRS Actuarial Assumptions Conference.
Actuarial Basis
Our analysis and conclusions are based on our understanding of the request and the data, methods, and assumptions described above. Differences in the data, methods, assumptions, and interpretations of the plan provisions may produce different results.
In preparing this letter, we relied, without audit, on information (some oral and some in writing) supplied by the Division of Retirement. This information includes, but is not limited to, statutory provisions, employee data, and financial information. We found this information to be reasonably consistent and comparable with information used for other purposes. The attached schedules depend on the integrity of this information. If any of this information is inaccurate or incomplete our results may be different and our calculations may need to be revised.
All costs, liabilities, rates of interest, and other factors for the plan have been determined on the basis of actuarial assumptions and methods which are individually reasonable (taking into account the experience of the plan and reasonable expectations); and which, in combination, offer a reasonable estimate of anticipated experience affecting the plan. Future actuarial measurements may differ significantly from the current measurements presented in this letter due to such factors as the following: plan experience differing from that anticipated by the economic or demographic assumptions; changes in economic or demographic assumptions; increases or decreases expected as part of the natural operation of the methodology used for these measurements (such as the end of an amortization period); and changes in plan provisions or applicable law. Due to the limited scope of this letter, we did not perform an analysis of the potential range of future measurements. The FRS Actuarial Assumptions Conference has the final decision regarding the appropriateness of the assumptions and approved them in September 2014.
Actuarial computations presented in this letter are for purposes of assisting DMS in completing the FYE 2015 CAFR in accordance with GASB 67. They cannot be relied upon for other purposes, and calculations for purposes other than this use may be significantly different from the estimates contained in this letter. Accordingly, additional determinations may be needed for other purposes.
Milliman’s work product was prepared exclusively for the internal business use of the Florida Department of Management Services, Division of Retirement for a specific and limited purpose. It is a complex technical analysis that assumes a high level of knowledge concerning the plan’s operations and uses Division data, which Milliman has not audited. To the extent that Milliman’s work is not subject to
108
Mr. Dan Drake January 28, 2016 Page 3
This work product was prepared solely for the Florida Department of Management Services for the purposes described herein and may not be appropriate to use for other purposes. Milliman does not intend to benefit and assumes no duty or liability to other parties who receive this work. Milliman
recommends that third parties be aided by their own actuary or other qualified professional when reviewing the Milliman work product.
disclosure under applicable public records laws, Milliman’s work may not be provided to third parties without Milliman's prior written consent. Milliman does not intend to benefit or create a legal duty to any third party recipient of its work product. Milliman’s consent to release its work product to any third party may be conditioned on the third party signing a Release, subject to the following exception(s):
(a) The Division of Retirement may provide a copy of Milliman’s work, in its entirety, to the System's professional service advisors who are subject to a duty of confidentiality and who agree to not use Milliman’s work for any purpose other than to benefit the Plan.
(b) The Division may provide a copy of Milliman’s work, in its entirety, to other governmental entities, as required by law.
No third party recipient of Milliman's work product should rely upon Milliman's work product. Such recipients should engage qualified professionals for advice appropriate to their own specific needs.
The consultants who worked on this assignment are pension actuaries. Milliman’s advice is not intended to be a substitute for qualified legal or accounting counsel.
The signing actuaries are independent of the plan sponsor. We are not aware of any relationship that would impair the objectivity of our work.
On the basis of the foregoing, we hereby certify that, to the best of our knowledge and belief, this report is complete and accurate and has been prepared in accordance with generally recognized and accepted actuarial principles and practices. We are members of the American Academy of Actuaries and meet the Qualification Standards to render the actuarial opinion contained herein.
109
Mr. Dan Drake January 28, 2016 Page 4
This work product was prepared solely for the Florida Department of Management Services for the purposes described herein and may not be appropriate to use for other purposes. Milliman does not intend to benefit and assumes no duty or liability to other parties who receive this work. Milliman
recommends that third parties be aided by their own actuary or other qualified professional when reviewing the Milliman work product.
If you have any questions about our response or need any additional information, please let us know.
Respectfully submitted,
Matt R. Larrabee, FSA, MAAA Kathryn M. Hunter, ASA, MAAA
Principal and Consulting Actuary Consulting Actuary
Daniel R. Wade, FSA, MAAA
Consulting Actuary
110

RETIREE HEALTH INSURANCE SUBSIDY (HIS) PROGRAM
Overview of GASB 67 and GASB 68 GASB released new accounting standards for public pension plans and participating employers in 2012. These standards,
GASB 67 and 68, have substantially revised the accounting requirements previously mandated under GASB 25 and 27.
The Annual Required Contribution (ARC) has been eliminated under GASB 67 and 68 and is no longer relevant for
financial reporting purposes.
GASB 67 applies to pension plan financial reporting and is effective for plan fiscal years beginning after June 15, 2013.
Based on discussions with the Division of Retirement, it is our understanding that this is the applicable accounting
standard for the HIS program. Note that a plan’s fiscal year might not be the same as the employer’s fiscal year. Even if
the plan does not issue stand-alone financial statements, but rather is considered a pension trust fund of a government, it
is subject to GASB 67. Under GASB 67, enhancements to the financial statement disclosures are required, along with
certain required supplementary information.
GASB 68 governs the specifics of accounting for public pension plan obligations for participating employers and is
required to be implemented for employer fiscal years beginning after June 15, 2014. GASB 68 requires a liability for
pension obligations, known as the Net Pension Liability, to be recognized on the balance sheets of participating
employers. Changes in the Net Pension Liability will be immediately recognized as Pension Expense on the income
statement or reported as deferred inflows/outflows of resources depending on the nature of the change.
Demographic Data
The following table summarizes the demographic census data used in the valuation:
Active Members1 621,455
Retirees and Dependents2 315,217
Terminated Vested Members1 114,373
Members in DROP 1 38,058
Total 1,089,103
1 Used to project future Health Insurance Subsidy benefit recipients.
2 HIS benefit recipients identified by the Division; includes FRS Defined Benefit Program and Investment Plan retirees.
111

Benefits
The benefits are described in section112.363 of the Florida Statutes. In general, an eligible retiree is entitled to a benefit
of $5 per month per year of service, with a minimum benefit of $30 per month and a maximum benefit of $150 per month.
The retiree must apply for and provide certification of health insurance coverage to be eligible for the subsidy. The benefit
is a cash payment without direct relationship to the member’s health insurance cost or type of health coverage. The
benefits are not pre-funded and paid only to the extent funds are available and budget authority is provided by the Florida
Legislature.
The projected year-by-year HIS benefit payments for the next forty years are shown on the table below. The table is
based on this valuation’s demographic data and actuarial assumptions. It does not reflect the effects of projected benefits
for individuals who join the FRS defined benefit program or the Investment Plan subsequent to the actuarial valuation
date.
Projected Annual Benefit Payments
Fiscal Year (Millions) Fiscal Year (Million) Fiscal Year (Million) Fiscal Year (Million)
2014-2015 $427 2024-2025 $578 2034-2035 $666 2044-2045 $618
2015-2016 440 2025-2026 590 2035-2036 668 2045-2046 605
2016-2017 456 2026-2027 602 2036-2037 670 2046-2047 590
2017-2018 474 2027-2028 613 2037-2038 669 2047-2048 575
2018-2019 496 2028-2029 623 2038-2039 667 2048-2049 560
2019-2020 511 2029-2030 633 2039-2040 663 2049-2050 543
2020-2021 524 2030-2031 641 2040-2041 658 2050-2051 525
2021-2022 537 2031-2032 649 2041-2042 650 2051-2052 505
2022-2023 551 2032-2033 656 2042-2043 641 2052-2053 485
2023-2024 565 2033-2034 662 2043-2044 630 2053-2054 465
All other disclosures and information not separately contained in this section may be found in the RSI, the Note disclosures, and the 2014 HIS Valuation dated Feb. 5, 2015.
112

Offices in Principal Cities Worldwide
This work product was prepared solely for the Florida Department of Management Services for the purposes described herein and may not be appropriate to use for other purposes. Milliman does not intend to benefit and assumes no duty or liability to other parties who receive this work. Milliman
recommends that third parties be aided by their own actuary or other qualified professional when reviewing the Milliman work product.
111 SW Fifth Avenue, Suite 3700
Portland, OR 97204
Tel 503 227 0634
1301 Fifth Avenue, Suite 3800
Seattle, WA 98101
Tel 206 624 7940
milliman.com
January 28, 2016
VIA E-MAIL
Mr. Dan Drake State Retirement Director Florida Retirement System 1317 Winewood Boulevard, Building 8 Tallahassee, FL 32399
Re: National Guard Supplemental Retirement Benefit GASB 67 and 68 Reporting for Fiscal
Year End 2015
Dear Dan:
As requested, we prepared actuarial exhibits to assist the State of Florida in completing financial reporting for the National Guard Supplemental Retirement Benefit (“National Guard Benefit”) for the fiscal year ending June 30, 2015. The exhibits are attached to this letter.
The exhibits provide information to assist the Department of Management Services (DMS) in complying with GASB Statement No. 67 and 68, which govern plan reporting and sponsoring employer reporting, respectively. GASB 67 and 68 replaced GASB 25 and 27 beginning with last year’s initial GASB year-end Measurement Date of June 30, 2014. The exhibits provide the same GASB 67 and 68 elements provided in the July 1, 2014 Actuarial Valuation of Florida National Guard Supplemental Retirement Benefit report dated September 15, 2015 (“July 1, 2014 actuarial valuation report”).
The National Guard valuations will be conducted biennially. The first completed actuarial valuation report for the National Guard Benefit used an actuarial valuation date of July 1, 2014. That actuarial valuation was also used to develop the liabilities for the enclosed June 30, 2015 financial reporting exhibits. Liabilities originally calculated as of the actuarial valuation date are recalculated as of a later GASB Measurement Date using a standard actuarial roll-forward technique. The enclosed exhibits show the recalculated liability results at June 30, 2015, as required for GASB 67 and 68, and reflect actual contributions and benefit payments for the fiscal year ending June 30, 2015. The actuarial liability is labeled the “Total Pension Liability”, consistent with terminology introduced by GASB 67 and 68. The Total Pension Liability as of June 30, 2014 is identical to that developed for the implementation of GASB 67 and 68 at fiscal-year-end 2014, and was based upon the July 1, 2014 actuarial valuation report.
The formal July 1, 2014 actuarial valuation report should be referenced for full detail on the data and assumptions used, actuarial methods applied, provisions valued, and other important information regarding the use and applicability of actuarial valuation results. Differences between the assumptions used for June 30, 2015 financial reporting compared to those shown in the actuarial valuation report are discussed below.
113
Mr. Dan Drake January 28, 2016 Page 2
This work product was prepared solely for the Florida Department of Management Services for the purposes described herein and may not be appropriate to use for other purposes. Milliman does not intend to benefit and assumes no duty or liability to other parties who receive this work. Milliman
recommends that third parties be aided by their own actuary or other qualified professional when reviewing the Milliman work product.
Assumption changes since July 1, 2014 Actuarial Valuation
Assumptions used to calculate the Total Pension Liability are as described in the July 1, 2014 actuarial valuation report, with the following exception:
The Total Pension Liability is calculated based on a single equivalent discount rate as required by GASB 67 and 68. The discount rate used was updated from 4.29% to 3.80%, reflecting the change during the fiscal year in the Bond Buyer General Obligation 20-Bond Municipal Bond Index. That index was originally approved for use in National Guard GASB 67 calculations by the 2014 FRS Actuarial Assumptions Conference.
Actuarial Basis
Our analysis and conclusions are based on our understanding of the request and the data, methods, and assumptions described above. Differences in the data, methods, assumptions, and interpretations of the plan provisions may produce different results.
In preparing this letter, we relied, without audit, on information (some oral and some in writing) supplied by the Division of Retirement. This information includes, but is not limited to, statutory provisions, employee data, and financial information. We found this information to be reasonably consistent and comparable with information used for other purposes. The attached schedules depend on the integrity of this information. If any of this information is inaccurate or incomplete our results may be different and our calculations may need to be revised.
All costs, liabilities, rates of interest, and other factors for the plan have been determined on the basis of actuarial assumptions and methods which are individually reasonable (taking into account the experience of the plan and reasonable expectations); and which, in combination, offer a reasonable estimate of anticipated experience affecting the plan. Future actuarial measurements may differ significantly from the current measurements presented in this letter due to such factors as the following: plan experience differing from that anticipated by the economic or demographic assumptions; changes in economic or demographic assumptions; increases or decreases expected as part of the natural operation of the methodology used for these measurements (such as the end of an amortization period); and changes in plan provisions or applicable law. Due to the limited scope of this letter, we did not perform an analysis of the potential range of future measurements. The FRS Actuarial Assumptions Conference has the final decision regarding the appropriateness of the assumptions.
Actuarial computations presented in this letter are for purposes of assisting DMS in completing the FYE 2015 CAFR in accordance with GASB 67. They cannot be relied upon for other purposes, and calculations for purposes other than this use may be significantly different from the estimates contained in this letter. Accordingly, additional determinations may be needed for other purposes.
Milliman’s work product was prepared exclusively for the internal business use of the Florida Department of Management Services, Division of Retirement for a specific and limited purpose. It is a complex technical analysis that assumes a high level of knowledge concerning the plan’s operations and uses data from the Division of Retirement and Office of Military Affairs, which Milliman has not audited. To the
114
Mr. Dan Drake January 28, 2016 Page 3
This work product was prepared solely for the Florida Department of Management Services for the purposes described herein and may not be appropriate to use for other purposes. Milliman does not intend to benefit and assumes no duty or liability to other parties who receive this work. Milliman
recommends that third parties be aided by their own actuary or other qualified professional when reviewing the Milliman work product.
extent that Milliman’s work is not subject to disclosure under applicable public records laws, Milliman’s work may not be provided to third parties without Milliman's prior written consent. Milliman does not intend to benefit or create a legal duty to any third party recipient of its work product. Milliman’s consent to release its work product to any third party may be conditioned on the third party signing a Release, subject to the following exception(s):
(a) The Division of Retirement may provide a copy of Milliman’s work, in its entirety, to the System's professional service advisors who are subject to a duty of confidentiality and who agree to not use Milliman’s work for any purpose other than to benefit the Plan.
(b) The Division may provide a copy of Milliman’s work, in its entirety, to other governmental entities, as required by law.
No third party recipient of Milliman's work product should rely upon Milliman's work product. Such recipients should engage qualified professionals for advice appropriate to their own specific needs.
The consultants who worked on this assignment are pension actuaries. Milliman’s advice is not intended to be a substitute for qualified legal or accounting counsel.
The signing actuaries are independent of the plan sponsor. We are not aware of any relationship that would impair the objectivity of our work.
On the basis of the foregoing, we hereby certify that, to the best of our knowledge and belief, this report is complete and accurate and has been prepared in accordance with generally recognized and accepted actuarial principles and practices. We are members of the American Academy of Actuaries and meet the Qualification Standards to render the actuarial opinion contained herein.
115
Mr. Dan Drake January 28, 2016 Page 4
This work product was prepared solely for the Florida Department of Management Services for the purposes described herein and may not be appropriate to use for other purposes. Milliman does not intend to benefit and assumes no duty or liability to other parties who receive this work. Milliman
recommends that third parties be aided by their own actuary or other qualified professional when reviewing the Milliman work product.
If you have any questions about our response or need any additional information, please let us know.
Respectfully submitted,
Matt R. Larrabee, FSA, MAAA Kathryn M. Hunter, ASA, MAAA
Principal and Consulting Actuary Consulting Actuary
Daniel R. Wade, FSA, MAAA
Consulting Actuary
116
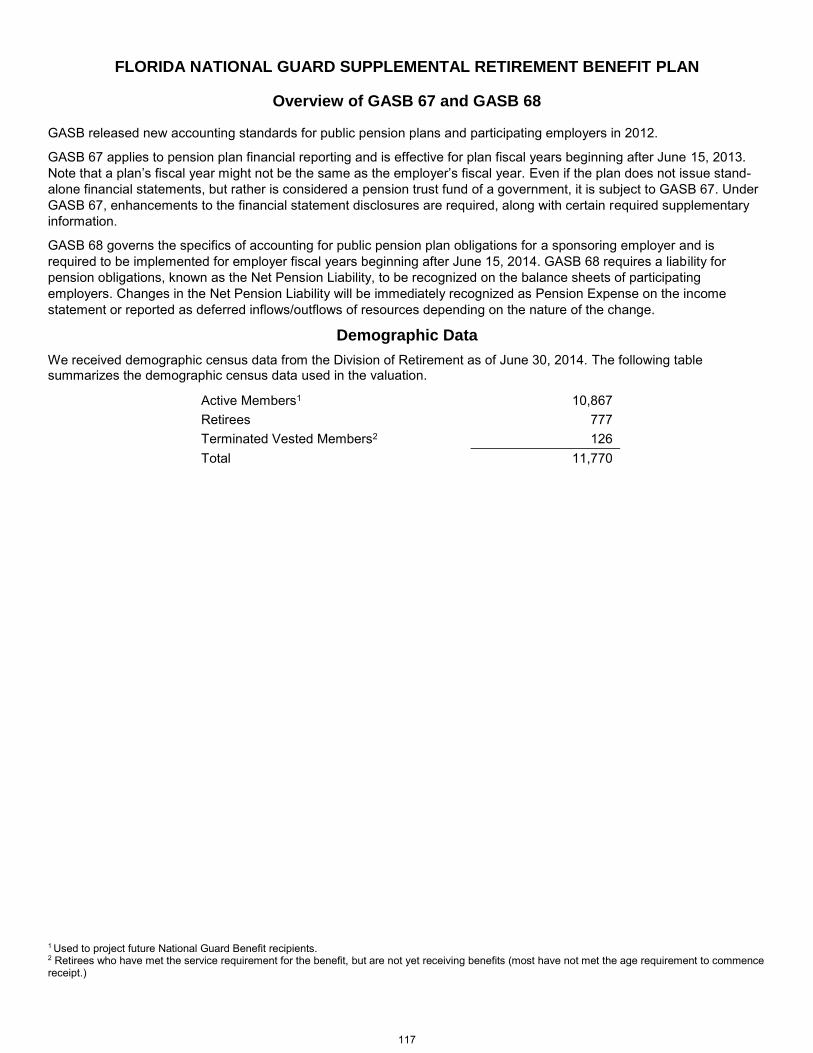
FLORIDA NATIONAL GUARD SUPPLEMENTAL RETIREMENT BENEFIT PLAN
Overview of GASB 67 and GASB 68 GASB released new accounting standards for public pension plans and participating employers in 2012.
GASB 67 applies to pension plan financial reporting and is effective for plan fiscal years beginning after June 15, 2013.
Note that a plan’s fiscal year might not be the same as the employer’s fiscal year. Even if the plan does not issue stand-
alone financial statements, but rather is considered a pension trust fund of a government, it is subject to GASB 67. Under
GASB 67, enhancements to the financial statement disclosures are required, along with certain required supplementary
information.
GASB 68 governs the specifics of accounting for public pension plan obligations for a sponsoring employer and is
required to be implemented for employer fiscal years beginning after June 15, 2014. GASB 68 requires a liability for
pension obligations, known as the Net Pension Liability, to be recognized on the balance sheets of participating
employers. Changes in the Net Pension Liability will be immediately recognized as Pension Expense on the income
statement or reported as deferred inflows/outflows of resources depending on the nature of the change.
Demographic Data
We received demographic census data from the Division of Retirement as of June 30, 2014. The following table summarizes the demographic census data used in the valuation.
Active Members1 10,867
Retirees 777
Terminated Vested Members2 126
Total 11,770
1 Used to project future National Guard Benefit recipients. 2 Retirees who have met the service requirement for the benefit, but are not yet receiving benefits (most have not met the age requirement to commence receipt.)
117

Benefits
The benefits are described in section 250.22 of the Florida Statutes. In general, an eligible retiree is entitled to a benefit
equal to 50 percent of the base military salary for the highest rank attained, less any federal retirement benefit derived
from military service. Eligibility for the benefit is met when service members have completed at least 30 years of service in
the Florida National Guard. Benefits may start as early as age 601.
The projected year-by-year National Guard benefit payments for the next 40 years are shown on the table below. The
table is based on this valuation’s demographic data and actuarial assumptions. It does not reflect the effects of projected
benefits for individuals who join the Florida National Guard subsequent to the actuarial valuation date.
Projected Annual Benefit Payments
Fiscal Year (Millions) Fiscal Year (Millions) Fiscal Year (Millions) Fiscal Year (Millions)
2014-2015 $14.2 2024-2025 $15.8 2034-2035 $27.8 2044-2045 $37.6
2015-2016 14.0 2025-2026 17.0 2035-2036 28.8 2045-2046 38.5
2016-2017 13.8 2026-2027 18.2 2036-2037 29.7 2046-2047 39.3
2017-2018 13.8 2027-2028 19.4 2037-2038 30.4 2047-2048 39.9
2018-2019 13.7 2028-2029 21.0 2038-2039 31.1 2048-2049 40.3
2019-2020 13.8 2029-2030 21.9 2039-2040 32.0 2049-2050 40.7
2020-2021 14.0 2030-2031 23.2 2040-2041 33.0 2050-2051 40.9
2021-2022 14.2 2031-2032 24.4 2041-2042 34.0 2051-2052 41.1
2022-2023 14.7 2032-2033 25.8 2042-2043 35.4 2052-2053 41.0
2023-2024 15.2 2033-2034 27.0 2043-2044 36.5 2053-2054 40.6
1 The benefit is unreduced at age 62; an early retirement factor applies to benefits paid as early as age 60.
118

Statistical Section
Wild dolphin mother and calf.
119

2014 1
2015 1
% Change
Members 622,089 626,578 0.72Annual Payroll $26,142,416,182 $26,731,330,633 2.25Average Annual Salary $42,712 $43,452 1.73
2014 1
2015 1
% Change
Members 109,725 112,325 2.37Annual Payroll $4,589,868,836 $4,804,087,794 4.67Average Annual Salary $42,348 $43,303 2.26
2014 1
2015 1
% Change
Members 512,364 514,253 0.37Annual Payroll $21,552,547,346 $21,927,242,839 1.74Average Annual Salary $42,790 $43,485 1.62
The increase in benefit payments is the result of several factors: (1) an increase in the number of new retirees; (2) higher salaries; and (3) cost-of-living adjustments to retirees. The figures below include disability payments, IFAS, General Revenue, and TRS-SB,
2014 1
2015 1
% Change
Annuitants 363,034 377,671 4.03Benefit Payments (Annualized) $7,175,496,291 $7,731,851,133 7.75Average Benefits (Annualized) $19,765 $20,472 3.58
2014 1
2015 1
% Change
Disabled Retirees 16,137 16,185 0.30Benefit Payments (Annualized) $224,690,544 $233,008,641 3.70Average Benefits (Annualized) $13,924 $14,397 3.40
2014 2015 % Change
DROP Participants 38,058 34,829 -8.48Annual Payroll $2,158,869,852 $1,982,846,218 -8.15DROP Accrued Liability $3,061,303,437 $2,725,449,095 -10.97
but do not include refunds of member contributions.
MEMBERSHIP AND PAYROLL
ANNUITANTS AND BENEFIT PAYMENTS FOR THE FRS PENSION PLAN
DROP PARTICIPANTS
DISABILITIES
as of June 30
as of June 30
TOTAL FRS MEMBERSHIP
FRS INVESTMENT PLAN MEMBERSHIP
FRS PENSION PLAN MEMBERSHIP
1 Excludes DROP participants.
120
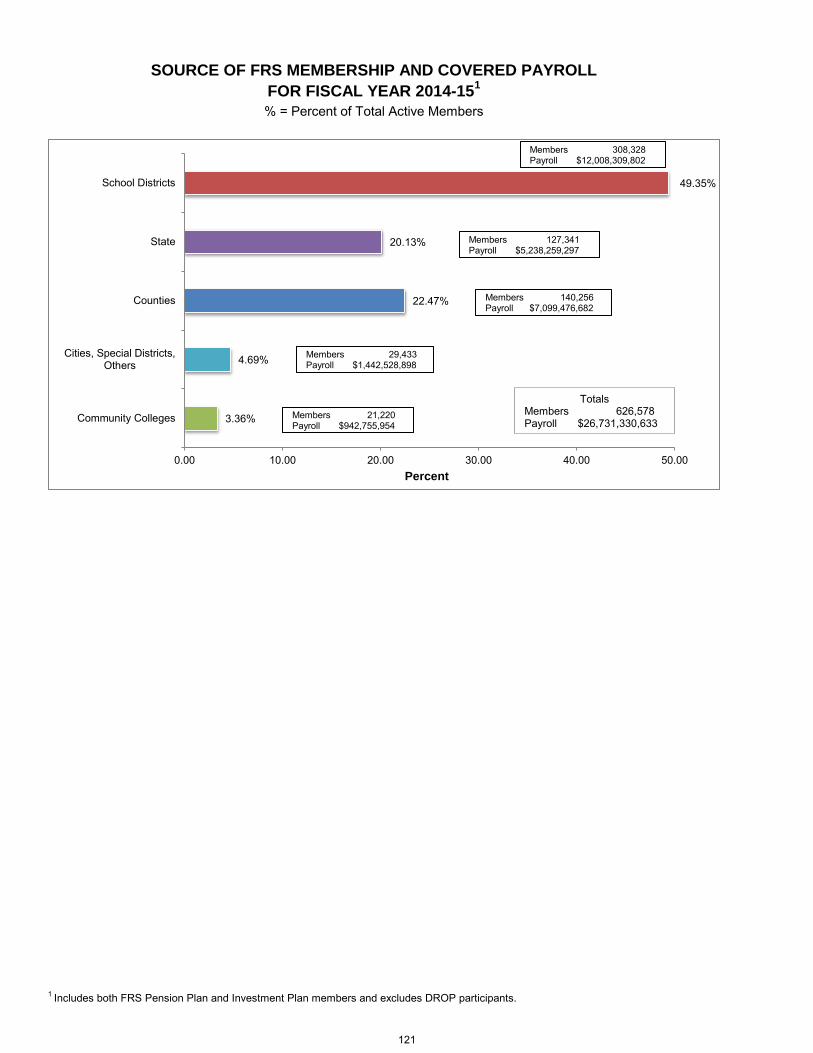
Community Colleges
Cities, Special Districts, Others
Counties
State
School Districts
SOURCE OF FRS MEMBERSHIP AND COVERED PAYROLL
FOR FISCAL YEAR 2014-151
% = Percent of Total Active Members
3.36%
4.69%
22.47%
20.13%
49.35%
0.00 10.00 20.00 30.00 40.00 50.00
Community Colleges
Cities, Special Districts,Others
Counties
State
School Districts
Percent
Members 29,433 Payroll $1,442,528,898
Members 21,220 Payroll $942,755,954
Totals Members 626,578 Payroll $26,731,330,633
Members 140,256 Payroll $7,099,476,682
Members 127,341 Payroll $5,238,259,297
Members 308,328 Payroll $12,008,309,802
1 Includes both FRS Pension Plan and Investment Plan members and excludes DROP participants.
121
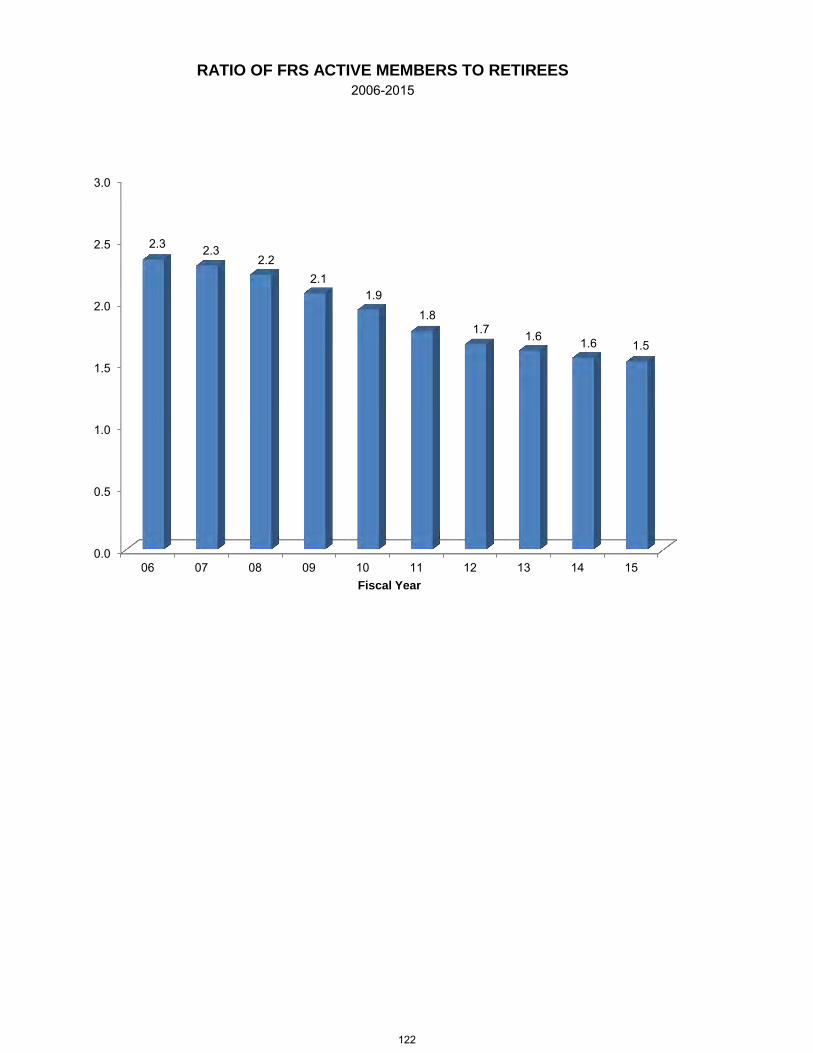
06070809101112131415
RATIO OF FRS ACTIVE MEMBERS TO RETIREES
2006-2015
0.0
0.5
1.0
1.5
2.0
2.5
3.0
06 07 08 09 10 11 12 13 14 15
2.3 2.3 2.2
2.1 1.9
1.8 1.7 1.6 1.6 1.5
Fiscal Year
122
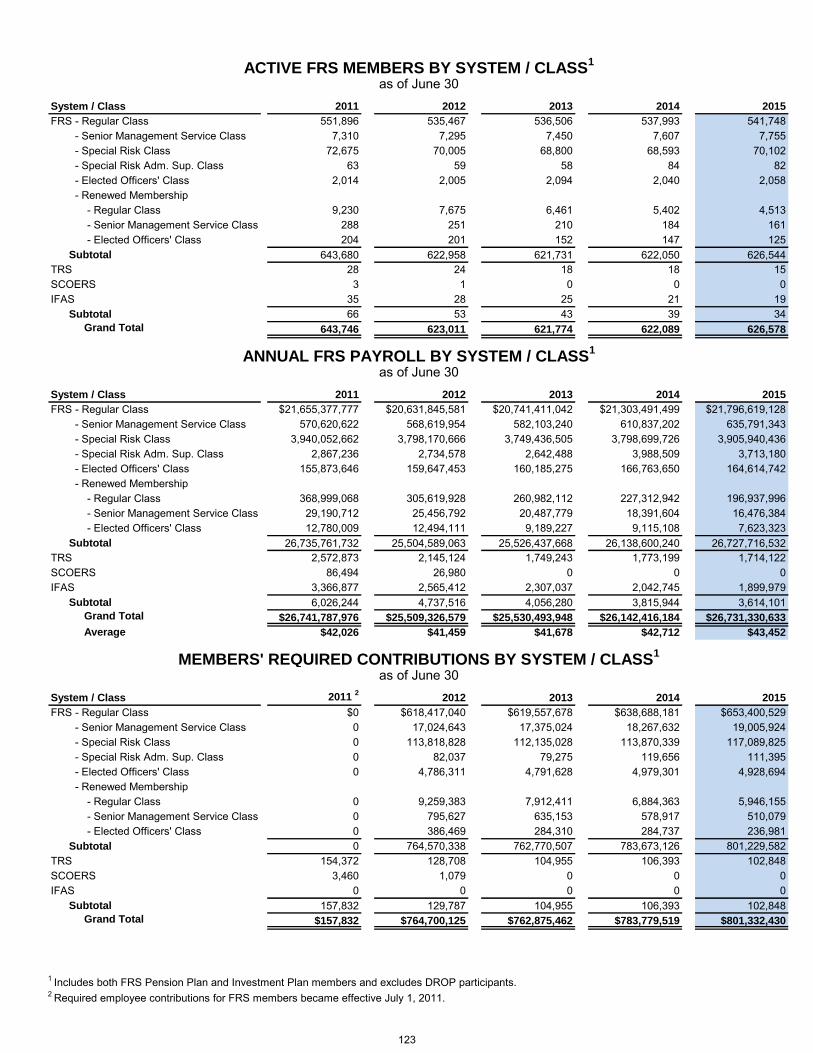
System / Class 2011 2012 2013 2014 2015
FRS - Regular Class 551,896 535,467 536,506 537,993 541,748 - Senior Management Service Class 7,310 7,295 7,450 7,607 7,755 - Special Risk Class 72,675 70,005 68,800 68,593 70,102 - Special Risk Adm. Sup. Class 63 59 58 84 82 - Elected Officers' Class 2,014 2,005 2,094 2,040 2,058 - Renewed Membership - Regular Class 9,230 7,675 6,461 5,402 4,513 - Senior Management Service Class 288 251 210 184 161 - Elected Officers' Class 204 201 152 147 125 Subtotal 643,680 622,958 621,731 622,050 626,544TRS 28 24 18 18 15SCOERS 3 1 0 0 0IFAS 35 28 25 21 19 Subtotal 66 53 43 39 34 Grand Total 643,746 623,011 621,774 622,089 626,578
System / Class 2011 2012 2013 2014 2015
FRS - Regular Class $21,655,377,777 $20,631,845,581 $20,741,411,042 $21,303,491,499 $21,796,619,128 - Senior Management Service Class 570,620,622 568,619,954 582,103,240 610,837,202 635,791,343 - Special Risk Class 3,940,052,662 3,798,170,666 3,749,436,505 3,798,699,726 3,905,940,436 - Special Risk Adm. Sup. Class 2,867,236 2,734,578 2,642,488 3,988,509 3,713,180 - Elected Officers' Class 155,873,646 159,647,453 160,185,275 166,763,650 164,614,742 - Renewed Membership - Regular Class 368,999,068 305,619,928 260,982,112 227,312,942 196,937,996 - Senior Management Service Class 29,190,712 25,456,792 20,487,779 18,391,604 16,476,384 - Elected Officers' Class 12,780,009 12,494,111 9,189,227 9,115,108 7,623,323 Subtotal 26,735,761,732 25,504,589,063 25,526,437,668 26,138,600,240 26,727,716,532TRS 2,572,873 2,145,124 1,749,243 1,773,199 1,714,122SCOERS 86,494 26,980 0 0 0IFAS 3,366,877 2,565,412 2,307,037 2,042,745 1,899,979 Subtotal 6,026,244 4,737,516 4,056,280 3,815,944 3,614,101 Grand Total $26,741,787,976 $25,509,326,579 $25,530,493,948 $26,142,416,184 $26,731,330,633
Average $42,026 $41,459 $41,678 $42,712 $43,452
System / Class 2011 2
2012 2013 2014 2015
FRS - Regular Class $0 $618,417,040 $619,557,678 $638,688,181 $653,400,529 - Senior Management Service Class 0 17,024,643 17,375,024 18,267,632 19,005,924 - Special Risk Class 0 113,818,828 112,135,028 113,870,339 117,089,825 - Special Risk Adm. Sup. Class 0 82,037 79,275 119,656 111,395 - Elected Officers' Class 0 4,786,311 4,791,628 4,979,301 4,928,694 - Renewed Membership - Regular Class 0 9,259,383 7,912,411 6,884,363 5,946,155 - Senior Management Service Class 0 795,627 635,153 578,917 510,079 - Elected Officers' Class 0 386,469 284,310 284,737 236,981 Subtotal 0 764,570,338 762,770,507 783,673,126 801,229,582TRS 154,372 128,708 104,955 106,393 102,848SCOERS 3,460 1,079 0 0 0IFAS 0 0 0 0 0 Subtotal 157,832 129,787 104,955 106,393 102,848 Grand Total $157,832 $764,700,125 $762,875,462 $783,779,519 $801,332,430
as of June 30
ACTIVE FRS MEMBERS BY SYSTEM / CLASS1
as of June 30
ANNUAL FRS PAYROLL BY SYSTEM / CLASS1
as of June 30
MEMBERS' REQUIRED CONTRIBUTIONS BY SYSTEM / CLASS1
1 Includes both FRS Pension Plan and Investment Plan members and excludes DROP participants.2 Required employee contributions for FRS members became effective July 1, 2011.
123
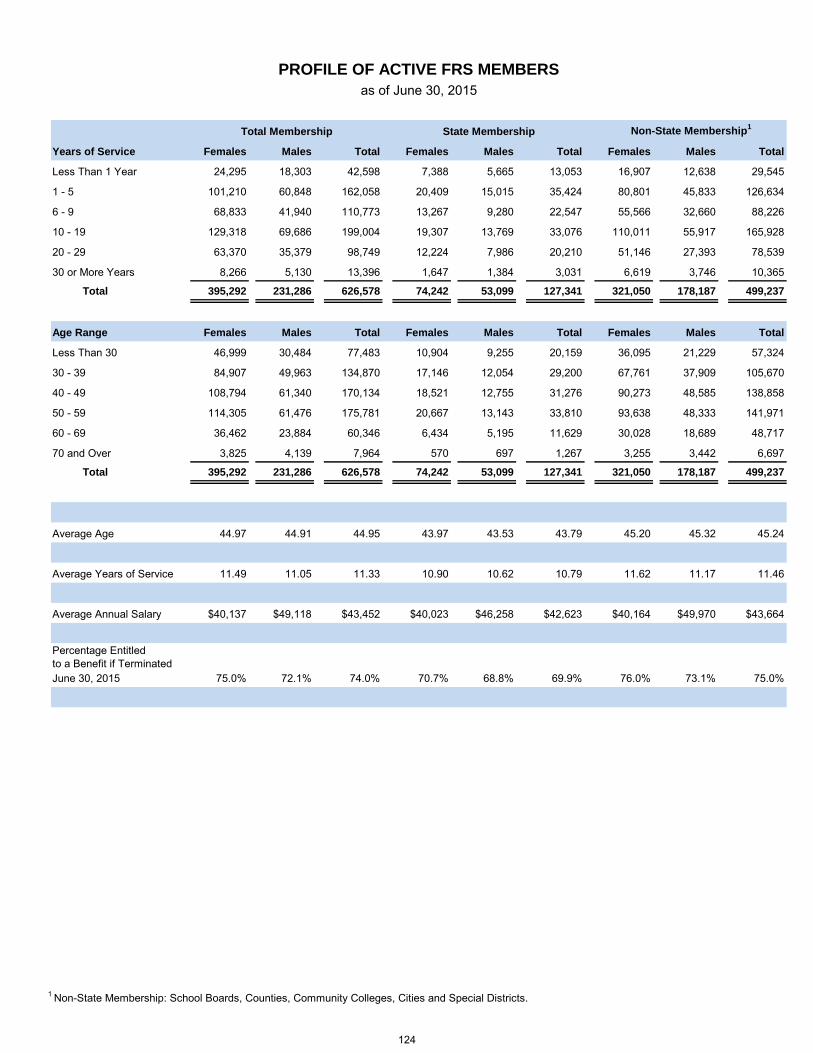
Years of Service Females Males Total Females Males Total Females Males Total
Less Than 1 Year 24,295 18,303 42,598 7,388 5,665 13,053 16,907 12,638 29,545
1 - 5 101,210 60,848 162,058 20,409 15,015 35,424 80,801 45,833 126,634
6 - 9 68,833 41,940 110,773 13,267 9,280 22,547 55,566 32,660 88,226
10 - 19 129,318 69,686 199,004 19,307 13,769 33,076 110,011 55,917 165,928
20 - 29 63,370 35,379 98,749 12,224 7,986 20,210 51,146 27,393 78,539
30 or More Years 8,266 5,130 13,396 1,647 1,384 3,031 6,619 3,746 10,365
Total 395,292 231,286 626,578 74,242 53,099 127,341 321,050 178,187 499,237
Age Range Females Males Total Females Males Total Females Males Total
Less Than 30 46,999 30,484 77,483 10,904 9,255 20,159 36,095 21,229 57,324
30 - 39 84,907 49,963 134,870 17,146 12,054 29,200 67,761 37,909 105,670
40 - 49 108,794 61,340 170,134 18,521 12,755 31,276 90,273 48,585 138,858
50 - 59 114,305 61,476 175,781 20,667 13,143 33,810 93,638 48,333 141,971
60 - 69 36,462 23,884 60,346 6,434 5,195 11,629 30,028 18,689 48,717
70 and Over 3,825 4,139 7,964 570 697 1,267 3,255 3,442 6,697
Total 395,292 231,286 626,578 74,242 53,099 127,341 321,050 178,187 499,237
Average Age 44.97 44.91 44.95 43.97 43.53 43.79 45.20 45.32 45.24
Average Years of Service 11.49 11.05 11.33 10.90 10.62 10.79 11.62 11.17 11.46
Average Annual Salary $40,137 $49,118 $43,452 $40,023 $46,258 $42,623 $40,164 $49,970 $43,664
Percentage Entitledto a Benefit if TerminatedJune 30, 2015 75.0% 72.1% 74.0% 70.7% 68.8% 69.9% 76.0% 73.1% 75.0%
PROFILE OF ACTIVE FRS MEMBERS
as of June 30, 2015
Total Membership State Membership Non-State Membership1
1 Non-State Membership: School Boards, Counties, Community Colleges, Cities and Special Districts.
124

Years of Service Females Males Total Females Males Total Females Males Total
Less Than 1 Year 3,817 2,494 6,311 1,298 869 2,167 2,519 1,625 4,144
1 - 5 26,850 14,700 41,550 6,056 4,138 10,194 20,794 10,562 31,356
6 - 9 16,905 9,674 26,579 3,659 2,460 6,119 13,246 7,214 20,460
10 - 19 17,569 10,611 28,180 3,336 2,767 6,103 14,233 7,844 22,077
20 - 29 4,057 3,512 7,569 921 907 1,828 3,136 2,605 5,741
30 or More Years 1,098 1,038 2,136 178 257 435 920 781 1,701
Total 70,296 42,029 112,325 15,448 11,398 26,846 54,848 30,631 85,479
Age Range Females Males Total Females Males Total Females Males Total
Less Than 30 9,424 4,585 14,009 2,536 1,741 4,277 6,888 2,844 9,732
30 - 39 17,582 9,416 26,998 4,579 3,191 7,770 13,003 6,225 19,228
40 - 49 17,964 10,174 28,138 3,587 2,727 6,314 14,377 7,447 21,824
50 - 59 15,970 9,687 25,657 3,106 2,266 5,372 12,864 7,421 20,285
60 - 69 7,990 6,465 14,455 1,460 1,255 2,715 6,530 5,210 11,740
70 and Over 1,366 1,702 3,068 180 218 398 1,186 1,484 2,670
Total 70,296 42,029 112,325 15,448 11,398 26,846 54,848 30,631 85,479
Average Age 44.44 46.71 45.29 42.54 43.48 42.94 44.98 47.91 46.03
Average Years of Service 8.32 9.23 8.66 7.92 8.94 8.35 8.44 9.34 8.76
Average Annual Salary $39,832 $49,109 $43,303 $41,542 $47,984 $44,277 $39,350 $49,528 $42,997
Percentage Entitledto a Benefit if TerminatedJune 30, 2015 94.6% 94.1% 94.4% 91.6% 92.4% 91.9% 95.4% 94.7% 95.2%
PROFILE OF ACTIVE FRS INVESTMENT PLAN MEMBERS
as of June 30, 2015
Total Membership State Membership Non-State Membership1
1 Non-State Membership: School Boards, Counties, Community Colleges, Cities and Special Districts.
125
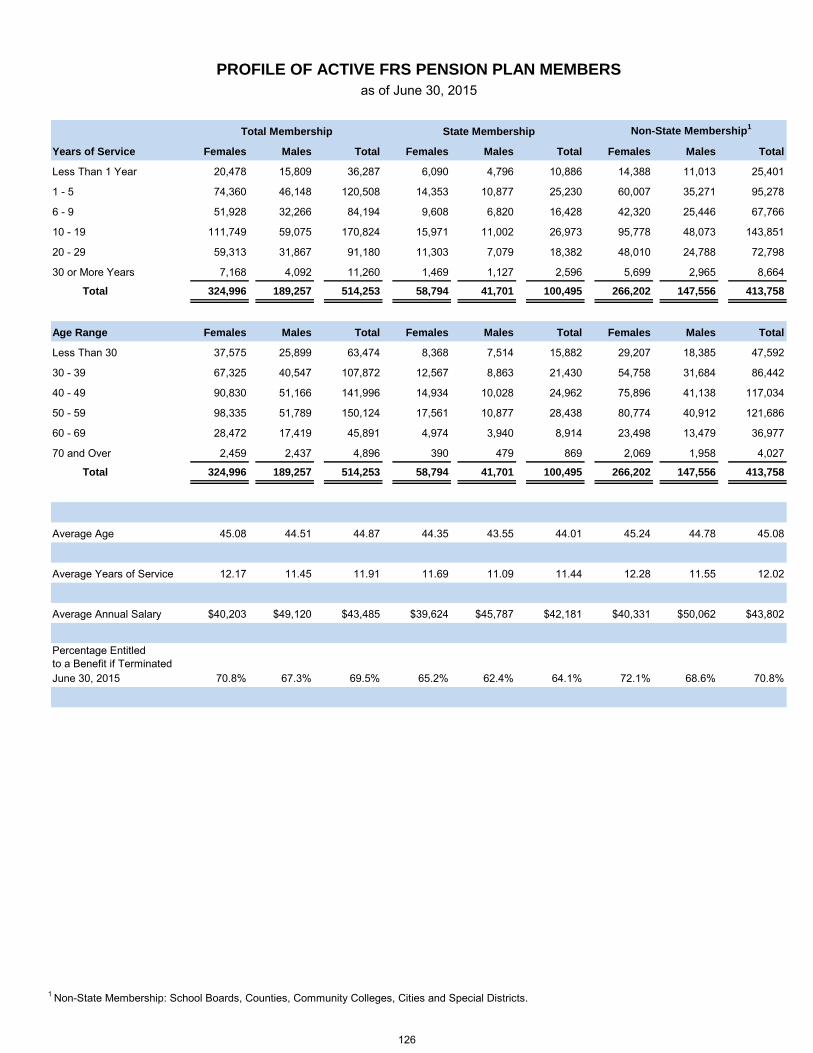
Years of Service Females Males Total Females Males Total Females Males Total
Less Than 1 Year 20,478 15,809 36,287 6,090 4,796 10,886 14,388 11,013 25,401
1 - 5 74,360 46,148 120,508 14,353 10,877 25,230 60,007 35,271 95,278
6 - 9 51,928 32,266 84,194 9,608 6,820 16,428 42,320 25,446 67,766
10 - 19 111,749 59,075 170,824 15,971 11,002 26,973 95,778 48,073 143,851
20 - 29 59,313 31,867 91,180 11,303 7,079 18,382 48,010 24,788 72,798
30 or More Years 7,168 4,092 11,260 1,469 1,127 2,596 5,699 2,965 8,664
Total 324,996 189,257 514,253 58,794 41,701 100,495 266,202 147,556 413,758
Age Range Females Males Total Females Males Total Females Males Total
Less Than 30 37,575 25,899 63,474 8,368 7,514 15,882 29,207 18,385 47,592
30 - 39 67,325 40,547 107,872 12,567 8,863 21,430 54,758 31,684 86,442
40 - 49 90,830 51,166 141,996 14,934 10,028 24,962 75,896 41,138 117,034
50 - 59 98,335 51,789 150,124 17,561 10,877 28,438 80,774 40,912 121,686
60 - 69 28,472 17,419 45,891 4,974 3,940 8,914 23,498 13,479 36,977
70 and Over 2,459 2,437 4,896 390 479 869 2,069 1,958 4,027
Total 324,996 189,257 514,253 58,794 41,701 100,495 266,202 147,556 413,758
Average Age 45.08 44.51 44.87 44.35 43.55 44.01 45.24 44.78 45.08
Average Years of Service 12.17 11.45 11.91 11.69 11.09 11.44 12.28 11.55 12.02
Average Annual Salary $40,203 $49,120 $43,485 $39,624 $45,787 $42,181 $40,331 $50,062 $43,802
Percentage Entitledto a Benefit if TerminatedJune 30, 2015 70.8% 67.3% 69.5% 65.2% 62.4% 64.1% 72.1% 68.6% 70.8%
PROFILE OF ACTIVE FRS PENSION PLAN MEMBERS
as of June 30, 2015
Total Membership State Membership Non-State Membership1
1 Non-State Membership: School Boards, Counties, Community Colleges, Cities and Special Districts.
126

2015
GROWTH OF FRS ANNUITANTS - ALL SYSTEMS 2011-20152
as of June 30
ACTIVE FRS MEMBERS 2011-20151
as of June 30
364,781
375,238
386,686
401,092
412,500
340,000
350,000
360,000
370,000
380,000
390,000
400,000
410,000
420,000
430,000
2011 2012 2013 2014 2015
An
nu
itan
ts
Fiscal Year
643,746
623,011 621,774 622,089 626,578
580,000
590,000
600,000
610,000
620,000
630,000
640,000
650,000
660,000
670,000
2011 2012 2013 2014 2015
Acti
ve M
em
bers
Fiscal Year
1 Includes both FRS Pension Plan and Investment Plan members and excludes DROP participants.2 Includes DROP participants.
127
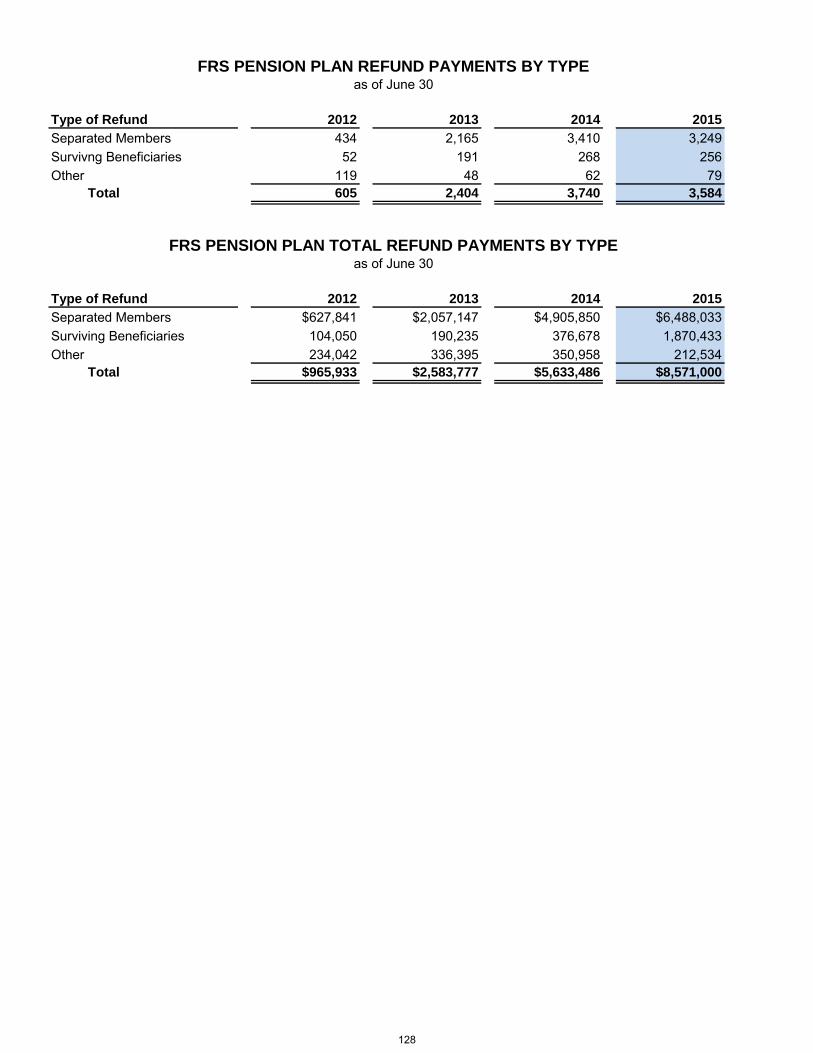
Type of Refund 2012 2013 2014 2015
Separated Members 434 2,165 3,410 3,249Survivng Beneficiaries 52 191 268 256Other 119 48 62 79 Total 605 2,404 3,740 3,584
Type of Refund 2012 2013 2014 2015
Separated Members $627,841 $2,057,147 $4,905,850 $6,488,033Surviving Beneficiaries 104,050 190,235 376,678 1,870,433Other 234,042 336,395 350,958 212,534 Total $965,933 $2,583,777 $5,633,486 $8,571,000
FRS PENSION PLAN REFUND PAYMENTS BY TYPEas of June 30
FRS PENSION PLAN TOTAL REFUND PAYMENTS BY TYPEas of June 30
128

Average Average Average Annual Average Annual
System / Class Count Service AFC Initial Benefit Current Benefit
FRS - Regular 29,819 25.12 $54,424 $21,865 $24,775FRS - SMSC 641 27.55 106,547 48,643 55,081FRS - Special Risk 4,118 24.79 82,141 56,913 64,359FRS - Special Risk Adm. Sup. 7 22.30 44,023 23,008 25,918FRS - EOC 240 25.02 129,349 80,669 91,258TRS 4 45.65 68,084 58,589 66,396 Total / Average 34,829 25.13 $59,176 $26,911 $30,476
Average Average Average Annual Average Annual
By Monthly Benefit Range Count Service AFC Initial Benefit Current Benefit
Less Than $50 0 0.00 $0 $0 $0$50 - $99 23 6.70 9,398 921 1,015$100 - $149 66 8.04 12,344 1,387 1,541$150 - $199 122 7.94 17,009 1,950 2,158$200 - $249 191 8.52 20,210 2,421 2,691$250 - $299 255 9.57 22,421 2,958 3,286$300 - $349 251 10.35 24,499 3,517 3,917$350 - $399 297 11.48 25,764 4,019 4,481$400 - $449 330 12.45 27,214 4,586 5,115$450 - $499 325 12.78 29,225 5,090 5,692$500 - $999 4,050 16.97 34,373 8,094 9,107$1,000 - $1,999 10,050 24.41 44,777 15,903 17,987$2,000 - $2,999 8,630 28.44 60,395 26,390 29,925$3,000 - $3,999 5,094 29.80 74,814 36,174 41,031$4,000 - $4,999 1,994 29.28 88,110 47,085 53,361$5,000 or More 3,151 27.12 110,716 73,621 83,318 Total / Average 34,829 25.13 $59,176 $26,911 $30,476
By Option Selection1
Lifetime Benefit (1) 20,027 24.81 $57,447 $26,796 $30,343Benefit with a Guarantee (2) 5,218 25.32 56,106 26,168 29,630Member with a Joint Annuitant (3) 8,629 25.74 63,544 27,002 30,591Reduced Benefit on 1st Death (4) 955 25.25 72,753 32,581 36,856 Total / Average 34,829 25.13 $59,176 $26,911 $30,476
By Employer Group
State 6,253 25.50 $51,999 $23,990 $27,159State University System 1,402 25.62 59,173 24,188 27,412Counties 8,519 24.68 71,637 38,015 42,980School Boards 16,139 25.26 54,203 22,216 25,202Community Colleges 1,089 23.49 60,838 23,199 26,279Cities and Special Districts 1,427 25.46 71,219 32,041 36,227 Total / Average 34,829 25.13 $59,176 $26,911 $30,476
ACTIVE FRS PENSION PLAN DROP PARTICIPANTS BY SYSTEM / CLASS
PROFILE OF ACTIVE FRS PENSION PLAN DROP PARTICIPANTS
as of June 30, 2015
as of June 30, 2015
1 Option selections for existing systems have been included in the FRS options outlined even though they are different.
129
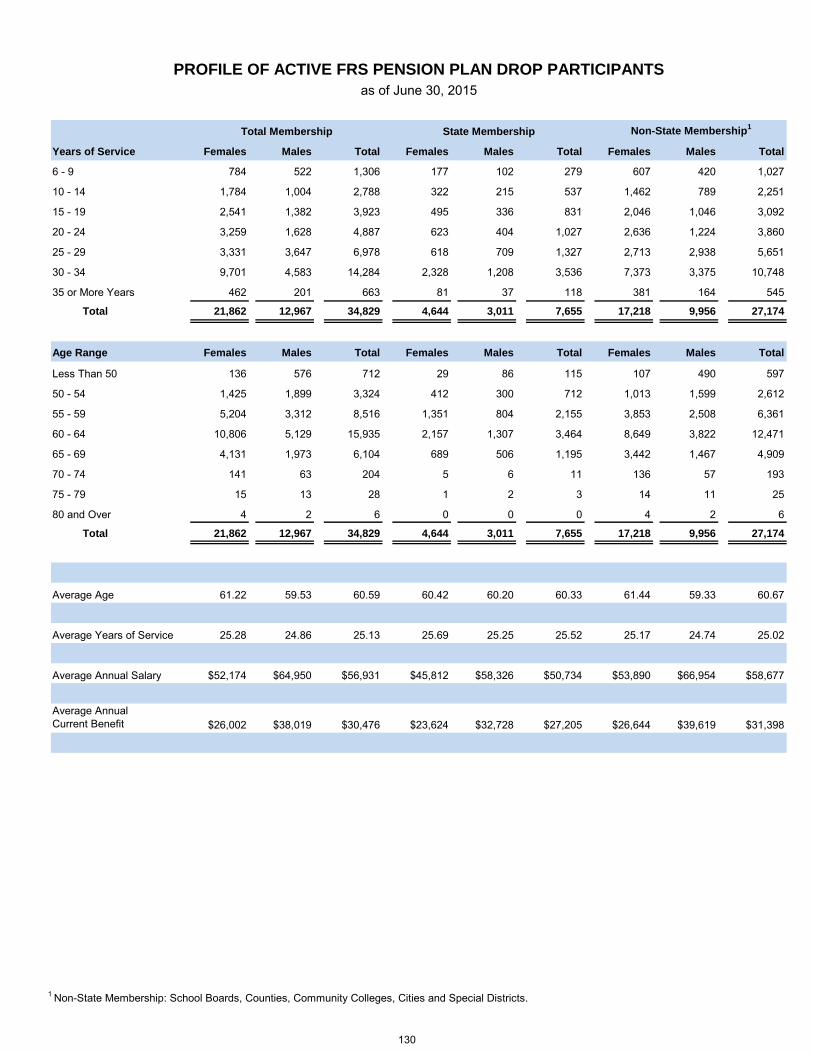
Years of Service Females Males Total Females Males Total Females Males Total
6 - 9 784 522 1,306 177 102 279 607 420 1,027
10 - 14 1,784 1,004 2,788 322 215 537 1,462 789 2,251
15 - 19 2,541 1,382 3,923 495 336 831 2,046 1,046 3,092
20 - 24 3,259 1,628 4,887 623 404 1,027 2,636 1,224 3,860
25 - 29 3,331 3,647 6,978 618 709 1,327 2,713 2,938 5,651
30 - 34 9,701 4,583 14,284 2,328 1,208 3,536 7,373 3,375 10,748
35 or More Years 462 201 663 81 37 118 381 164 545
Total 21,862 12,967 34,829 4,644 3,011 7,655 17,218 9,956 27,174
Age Range Females Males Total Females Males Total Females Males Total
Less Than 50 136 576 712 29 86 115 107 490 597
50 - 54 1,425 1,899 3,324 412 300 712 1,013 1,599 2,612
55 - 59 5,204 3,312 8,516 1,351 804 2,155 3,853 2,508 6,361
60 - 64 10,806 5,129 15,935 2,157 1,307 3,464 8,649 3,822 12,471
65 - 69 4,131 1,973 6,104 689 506 1,195 3,442 1,467 4,909
70 - 74 141 63 204 5 6 11 136 57 193
75 - 79 15 13 28 1 2 3 14 11 25
80 and Over 4 2 6 0 0 0 4 2 6
Total 21,862 12,967 34,829 4,644 3,011 7,655 17,218 9,956 27,174
Average Age 61.22 59.53 60.59 60.42 60.20 60.33 61.44 59.33 60.67
Average Years of Service 25.28 24.86 25.13 25.69 25.25 25.52 25.17 24.74 25.02
Average Annual Salary $52,174 $64,950 $56,931 $45,812 $58,326 $50,734 $53,890 $66,954 $58,677
Average AnnualCurrent Benefit $26,002 $38,019 $30,476 $23,624 $32,728 $27,205 $26,644 $39,619 $31,398
PROFILE OF ACTIVE FRS PENSION PLAN DROP PARTICIPANTS
as of June 30, 2015
Total Membership State Membership Non-State Membership1
1 Non-State Membership: School Boards, Counties, Community Colleges, Cities and Special Districts.
130

System / Class Females Males Total
FRS - Regular $1,320,173,810 $620,886,726 $1,941,060,536FRS - SMSC 39,766,483 44,272,748 84,039,231FRS - Special Risk 97,038,293 539,094,531 636,132,824FRS - Special Risk Adm. Sup. 61,776 442,672 504,448FRS - EOC 17,113,512 45,686,449 62,799,961TRS 912,097 0 912,097 Total $1,475,065,971 $1,250,383,126 $2,725,449,097
System / Class Females Males Total
FRS - Regular $238,743,945 $134,398,790 $373,142,735FRS - SMSC 14,703,429 18,602,580 33,306,009FRS - Special Risk 21,211,527 72,852,347 94,063,874FRS - Special Risk Adm. Sup. 61,776 277,393 339,169FRS - EOC 12,169,479 40,391,446 52,560,925TRS 0 0 0 Total $286,890,156 $266,522,556 $553,412,712
System / Class Females Males Total
FRS - Regular $1,081,429,865 $486,487,936 $1,567,917,801FRS - SMSC 25,063,054 25,670,167 50,733,221FRS - Special Risk 75,826,766 466,242,184 542,068,950FRS - Special Risk Adm. Sup. 0 165,279 165,279FRS - EOC 4,944,033 5,295,003 10,239,036TRS 912,097 0 912,097 Total $1,188,175,815 $983,860,569 $2,172,036,384
FRS PENSION PLAN DROP ACCRUED BENEFITS AND INTEREST
BY SYSTEM / CLASS
as of June 30, 2015
Total Membership
State Membership
Non-State Membership1
1 Non-State Membership: School Boards, Counties, Community Colleges, Cities and Special Districts.
131
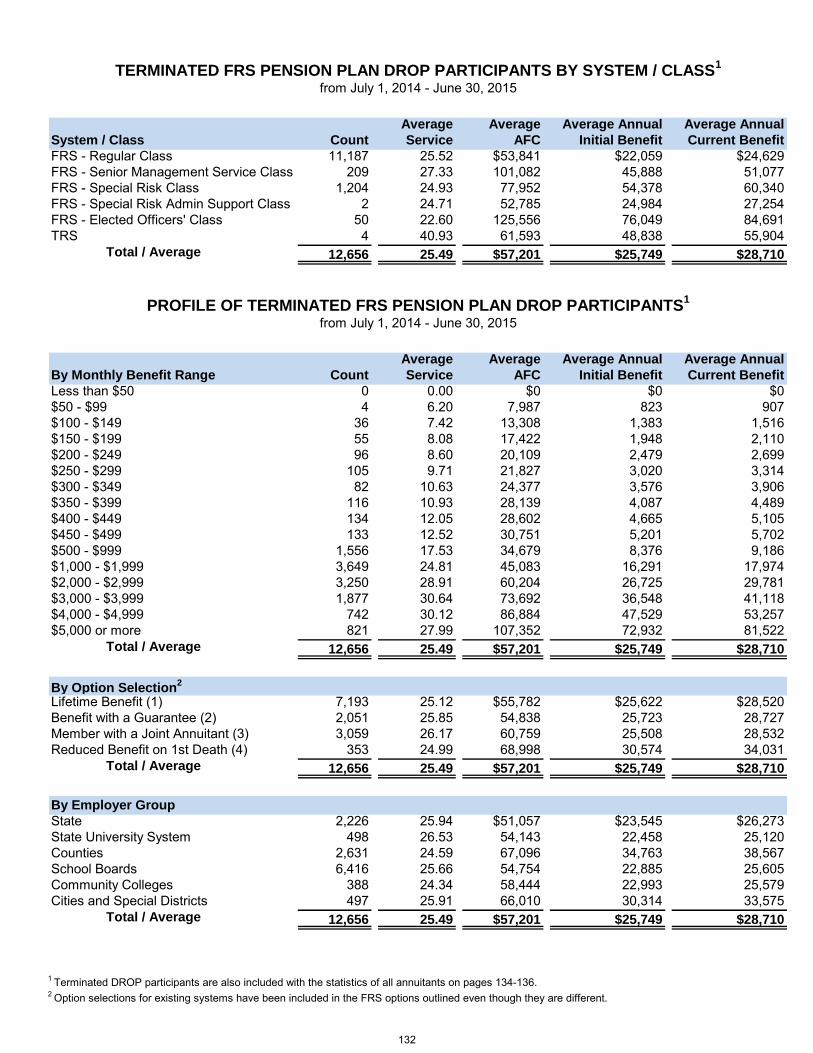
Average Average Average Annual Average Annual
System / Class Count Service AFC Initial Benefit Current Benefit
FRS - Regular Class 11,187 25.52 $53,841 $22,059 $24,629FRS - Senior Management Service Class 209 27.33 101,082 45,888 51,077FRS - Special Risk Class 1,204 24.93 77,952 54,378 60,340FRS - Special Risk Admin Support Class 2 24.71 52,785 24,984 27,254FRS - Elected Officers' Class 50 22.60 125,556 76,049 84,691TRS 4 40.93 61,593 48,838 55,904 Total / Average 12,656 25.49 $57,201 $25,749 $28,710
Average Average Average Annual Average Annual
By Monthly Benefit Range Count Service AFC Initial Benefit Current Benefit
Less than $50 0 0.00 $0 $0 $0$50 - $99 4 6.20 7,987 823 907$100 - $149 36 7.42 13,308 1,383 1,516$150 - $199 55 8.08 17,422 1,948 2,110$200 - $249 96 8.60 20,109 2,479 2,699$250 - $299 105 9.71 21,827 3,020 3,314$300 - $349 82 10.63 24,377 3,576 3,906$350 - $399 116 10.93 28,139 4,087 4,489$400 - $449 134 12.05 28,602 4,665 5,105$450 - $499 133 12.52 30,751 5,201 5,702$500 - $999 1,556 17.53 34,679 8,376 9,186$1,000 - $1,999 3,649 24.81 45,083 16,291 17,974$2,000 - $2,999 3,250 28.91 60,204 26,725 29,781$3,000 - $3,999 1,877 30.64 73,692 36,548 41,118$4,000 - $4,999 742 30.12 86,884 47,529 53,257$5,000 or more 821 27.99 107,352 72,932 81,522 Total / Average 12,656 25.49 $57,201 $25,749 $28,710
By Option Selection2
Lifetime Benefit (1) 7,193 25.12 $55,782 $25,622 $28,520Benefit with a Guarantee (2) 2,051 25.85 54,838 25,723 28,727Member with a Joint Annuitant (3) 3,059 26.17 60,759 25,508 28,532Reduced Benefit on 1st Death (4) 353 24.99 68,998 30,574 34,031 Total / Average 12,656 25.49 $57,201 $25,749 $28,710
By Employer Group
State 2,226 25.94 $51,057 $23,545 $26,273State University System 498 26.53 54,143 22,458 25,120Counties 2,631 24.59 67,096 34,763 38,567School Boards 6,416 25.66 54,754 22,885 25,605Community Colleges 388 24.34 58,444 22,993 25,579Cities and Special Districts 497 25.91 66,010 30,314 33,575 Total / Average 12,656 25.49 $57,201 $25,749 $28,710
TERMINATED FRS PENSION PLAN DROP PARTICIPANTS BY SYSTEM / CLASS1
PROFILE OF TERMINATED FRS PENSION PLAN DROP PARTICIPANTS1
from July 1, 2014 - June 30, 2015
from July 1, 2014 - June 30, 2015
1 Terminated DROP participants are also included with the statistics of all annuitants on pages 134-136.2 Option selections for existing systems have been included in the FRS options outlined even though they are different.
132

Average Average Average Annual Average Annual
By Years of Service Count Service AFC Initial Benefit Current Benefit
6 - 9 544 7.75 $37,597 $4,854 $5,33210 - 14 955 12.58 41,565 8,476 9,32515 - 19 1,370 17.56 48,590 14,029 15,49520 - 24 1,712 22.43 54,474 20,126 22,17725 - 29 2,153 26.87 66,939 37,499 41,35730 - 34 5,433 30.96 60,583 29,947 33,64535 or More Years 489 36.48 62,764 36,879 41,963 Total / Average 12,656 25.49 $57,201 $25,749 $28,710
By Age Range
Less than 50 75 25.47 $86,721 $62,002 $64,53150 - 54 638 27.84 70,818 46,477 50,81555 - 59 2,281 29.80 62,685 34,665 38,80660 - 64 4,599 28.02 58,518 26,875 29,86365 - 69 4,850 21.14 51,396 17,636 19,88170 - 74 184 17.28 52,978 16,814 19,11675 - 79 23 12.81 40,464 9,381 10,36780 and Over 6 18.08 30,890 9,918 10,473 Total / Average 12,656 25.49 $57,201 $25,749 $28,710
By Gender
Female 8,292 25.74 $53,086 $22,966 $25,625Male 4,364 25.02 65,019 31,036 34,572 Total / Average 12,656 25.49 $57,201 $25,749 $28,710
By Cause of Termination
Deceased 71 23.70 $52,870 $21,035 $22,585Termination 12,585 25.50 57,225 25,776 28,745 Total / Average 12,656 25.49 $57,201 $25,749 $28,710
Average length of participation - 3.24 years
PROFILE OF TERMINATED FRS PENSION PLAN DROP PARTICIPANTS1
from July 1, 2014 - June 30, 2015
1 Terminated DROP participants are also included with the statistics of all annuitants on pages 134-136.
133

System / Class 2011 2012 2013 2014 2015
FRS Pension Plan - Regular Class 280,910 294,413 306,121 319,663 332,410 - Senior Management Service Class 2,611 2,910 3,237 3,531 3,866 - Special Risk Class 26,808 28,295 29,743 31,314 33,076 - Special Risk Adm. Sup. Class 170 169 170 171 173 - Elected Officers' Class 2,187 2,189 2,311 2,310 2,397 Subtotal 312,686 327,976 341,582 356,989 371,922
TRS 4,762 4,557 4,326 4,084 3,873TRS-SB 540 506 469 441 413SCOERS 678 617 556 496 440Highway Patrol 43 39 38 34 31JRS 7 4 4 3 3IFAS 165 171 172 169 170 Subtotal 6,195 5,894 5,565 5,227 4,930 Total 318,881 333,870 347,147 362,216 376,852
General Revenue
Noncontributory (s. 112.05, F.S.) 43 32 25 22 18National Guard 756 772 780 787 792Judicial Retirement 8 7 9 8 9Teachers (s. 238.171, F.S.) 1 1 1 1 0 Total 808 812 815 818 819
Grand Total 319,689 334,682 347,962 363,034 377,671
System / Class 2011 2012 2013 2014 2015
FRS Pension Plan - Regular Class $16,045 $16,506 $16,973 $17,394 $17,951 - Senior Management Service Class 43,503 44,557 45,495 46,518 47,373 - Special Risk Class 32,931 34,262 35,755 37,207 38,962 - Special Risk Adm. Sup. Class 33,847 34,764 35,700 36,338 37,499 - Elected Officers' Class 43,387 44,577 46,740 47,966 49,875TRS 30,636 32,149 33,679 35,348 36,818TRS-SB 1,882 1,883 1,885 1,887 1,885SCOERS 9,607 10,224 10,889 11,209 12,152Highway Patrol 18,818 17,666 18,314 18,576 19,373JRS 19,074 14,996 15,446 13,607 14,016IFAS 10,663 10,953 11,252 11,680 12,005 Average $18,064 $18,626 $19,231 $19,789 $20,476
General Revenue
Noncontributory (s. 112.05, F.S.) $14,615 $16,173 $16,343 $16,245 $16,528National Guard 18,274 18,120 18,381 18,306 18,178Judicial Retirement 75,421 74,824 76,909 82,758 86,688Teachers (s. 238.171, F.S.) 2,168 2,233 2,300 2,369 0 Average $18,625 $18,512 $18,945 $18,861 $18,895
Average All Annuitants $18,066 $18,625 $19,230 $19,765 $20,472
AVERAGE BENEFITS BY SYSTEM / CLASSas of June 30
TOTAL ANNUITANTS BY SYSTEM / CLASS1
as of June 30
1 Total annuitants include General Revenue and TRS-SB annuitants and exclude DROP participants.
134

System / Class
FRS Pension Plan
- Regular Class
- Senior Management Service Class
- Special Risk Class
- Special Risk Adm. Sup. Class
- Elected Officers' Class
Subtotal
TRS
TRS-SB
SCOERS
Highway Patrol
JRS
IFAS
Subtotal
Total
General Revenue
Noncontributory (s. 112.05, F.S.)
National Guard
Judicial Retirement
Teachers (s. 238.171, F.S.)
Total
Grand Total
Average All Annuitants
System / Class
FRS Pension Plan
- Regular Class
- Senior Management Service Class
- Special Risk Class
- Special Risk Adm. Sup. Class
- Elected Officers' Class
FRS Investment Plan
- Regular Class
- Senior Management Service Class
- Special Risk Class
- Special Risk Adm. Sup. Class
TRS
SCOERS
Highway Patrol
General Revenue
Total / Average
14,191
34,149
45,324
14,180
37,259
46,684
25,460 26,0331 1
3,448,372
2,834,326
45,324
25,460
5,559,757
778,682
285
94
1
4,041,346
3,502,392
46,684
26,033
144,359,396
1,973,905
as of June 30
631,575
15,428,583
40,822
14,406,750
$357,397
153,397,417
$7,160,067,708
662,067
2,369
$7,175,496,291
155,327,210
6,054,351
145,890,628 146,500,765 145,695,711
1,016,360 952,580 884,162
6,513,450 6,308,298
97,579,092
6,062,190,693 7,006,670,291
831,962
$5,775,404,887
$17,465
15,049,215 15,032,077
$19,230
$6,691,436,720
1,165,109,331
6,213,772
110,800,310
2012 2013
$5,560,290,675
108,016,759
$4,859,628,720
129,659,493
156,122,596 156,383,659
2011
$4,507,199,721
113,586,769
882,805,653
809,165 688,988
2015
$12,330
$6,675,996,292
$18,066
$6,233,606,429
$517,544
13,988,534
523,766
2,233
Number of Retirees
$628,433
13,815,246
$6,218,574,352
$18,625
$408,570
14,337,374
692,184
TOTAL DISABILITY BENEFITS BY SYSTEM / CLASS
10,548
93
603,368
11,463
75,074
Average Annual BenefitsTotal Annual Benefits
26,471
24,296
35,466
44
1
229,261
243
83
1
16,137
102
8
16,185
9
1,584,178
2024
$14,397$13,924$233,008,641$224,690,546
86,688
10,548
662,067
25,025
212,796
3
$173,717,651
1
14,087
49
1,536
3
10,241
249,872
10,241
40,553,872
82,758780,195
1,273,499
72,888
1,435,770
15,531
28,943
15,967
695,922
$12,706
1,484,908
29,301
10,411
$178,994,618
36,530
2014
27,450
219,180
20142014
14,089
2015
6
1,532 42,162,632
6
2015
1,063,459,505
6,069,001
133,517 59,984 61,783
1,759,476
969,448,345
5,875,043
6,520,669,082
15,440,428
5,753,973
94,886,960
5,604,233,076
1,873,044 1,935,281
2,168 2,300
$5,760,355,672
TOTAL ANNUAL BENEFITS BY SYSTEM / CLASSas of June 30
2015
$5,967,096,004
183,145,731
2014
$5,195,856,141
147,267,676 164,256,203
1,288,693,588
6,487,328
119,550,041
7,564,972,692
142,594,320
5,347,069
600,551
42,047
2,040,823
151,403,492
$7,716,376,184
15,474,948
$7,731,851,132
$20,472
$297,496
14,397,257
780,195
0
135

Average Average Average Annual Average Annual
Count Service AFC Initial Benefit Current Benefit
285 16.90 $40,720 $12,612 $14,1801 10.33 100,891 25,223 26,0331 32.91 49,487 39,288 46,684
94 16.81 56,008 33,239 37,2591 17.75 143,640 48,645 51,268
332,125 20.91 37,578 12,922 17,9543,865 24.28 94,696 37,058 47,379
32,982 20.82 51,462 29,014 38,966172 25.16 48,482 24,202 37,446
2,396 20.31 67,399 36,231 49,8743,873 29.28 36,995 22,093 36,818
413 0.00 0 2,289 1,8853 11.71 20,160 11,089 14,016
31 25.29 16,396 14,536 19,373440 23.05 13,201 6,219 12,152170 0.07 94 9,158 12,005819 32.90 1,548 12,284 18,895
377,671 21.01 $39,405 $14,804 $20,472
Average Average Average Annual Average Annual
Count Service AFC Initial Benefit Current Benefit
1,973 42.32 $51,246 $36,378 $54,6289,173 36.79 48,289 30,164 46,398
87,114 30.94 50,424 25,362 35,68146,449 26.95 48,944 24,250 32,54753,896 22.29 40,311 13,909 18,81162,096 17.35 34,845 9,200 12,48883,281 12.16 28,543 5,356 7,34331,954 7.80 29,757 3,892 4,823
503 2.08 12,578 9,047 14,218376,439 21.01 $39,530 $14,823 $20,496
1,448 17.99 $38,429 $6,991 $8,402770 16.42 37,390 10,295 11,250
2,165 17.29 45,164 17,743 18,5178,139 19.49 46,484 20,111 22,052
25,267 20.93 45,476 18,733 21,65361,524 22.02 45,923 18,026 22,02195,882 21.27 43,775 16,017 21,05672,796 20.63 39,158 13,929 20,09547,810 20.32 33,974 12,112 19,20532,112 21.02 30,404 11,558 19,94628,520 21.18 24,438 9,733 18,681
6 22.34 59,632 11,614 12,503376,439 21.01 $39,530 $14,823 $20,496
Option 2 Payees - Member Deceased Total / Average
85 and Older
FRS IP Senior Management Service Class2
FRS IP Elected Officers' Class2
as of June 30, 2015
45 - 4950 - 54
80 - 84
20 - 24
PROFILE OF TOTAL ANNUITANTS BY SYSTEM / CLASS1
PROFILE OF FRS ANNUITANTS3
as of June 30, 2015
By Years of Service
40 or More Years35 - 3930 - 34
70 - 7475 - 79
60 - 64
By Age Range
Under 40
15 - 1910 - 145 - 9
65 - 69
55 - 59
Less Than 5 Years
40 - 44
Total / Average
25 - 29
SCOERSIFASGeneral Revenue Total / Average
FRS PP Special Risk Adm. Sup. ClassFRS PP Elected Officers' ClassTRSTRS-SBJudicial Retirement SystemHighway Patrol
By System / Class
FRS Investment Plan (IP) Regular Class2
FRS IP Special Risk Class2
FRS Pension Plan (PP) Regular ClassFRS PP Senior Management Service ClassFRS PP Special Risk Class
FRS IP Special Risk Adm. Sup. Class2
1 Total annuitants include General Revenue and TRS-SB annuitants and exclude DROP participants.2 IP disability retirees.3 FRS annuitants exclude General Revenue and TRS-SB annuitants and exclude DROP participants.
136

Average Average Average Annual Average AnnualBy Option Selection
2Count Service AFC Initial Benefit Current Benefit
Lifetime Benefit (1) 219,809 20.29 $37,437 $14,053 $19,432Benefit with a Guarantee (2) 62,410 22.00 39,741 15,733 22,281Member with a Joint Annuitant (3) 79,591 21.89 43,738 15,418 21,221Reduced Benefit on First Death (4) 14,629 22.86 47,184 19,286 24,925 Total / Average 376,439 21.01 $39,530 $14,823 $20,496
By Monthly Benefit Amount
Less Than $50 606 9.79 $12,297 $506 $421$50 - $99 3,270 9.34 11,211 858 951$100 - $149 5,817 9.88 13,403 1,322 1,519$150 - $199 7,949 10.60 15,984 1,808 2,108$200 - $249 9,688 10.93 18,268 2,239 2,708$250 - $299 10,625 11.44 19,685 2,680 3,307$300 - $349 11,182 11.96 20,695 3,025 3,899$350 - $399 11,191 12.60 22,359 3,503 4,495$400 - $449 10,772 13.28 24,018 3,964 5,101$450 - $499 10,351 13.76 25,399 4,444 5,695$500 - $999 80,726 16.37 30,173 6,668 8,755$1000 - $1999 91,392 22.42 39,381 12,901 17,369$2000 - $2999 59,845 27.86 49,549 21,566 29,821$3000 - $3999 33,341 30.05 58,206 28,854 41,256$4000 - $4999 14,799 30.67 67,619 36,679 53,227$5000 or more 14,885 30.20 87,385 55,774 78,970 Total / Average 376,439 21.01 $39,530 $14,823 $20,496
By Benefit Recipient
Member Deceased 28,122 20.12 $35,628 $12,312 $15,822Member Living 348,317 21.08 39,845 15,026 20,874 Total / Average 376,439 21.01 $39,530 $14,823 $20,496
By Retirement Date
Before 12/1970 108 21.33 $7,279 $2,754 $8,12912/1970 - 6/1995 47,943 22.08 25,903 10,358 20,1417/1995 - 6/2000 64,150 23.17 36,809 15,150 24,9237/2000 - 6/2005 87,709 21.51 39,887 15,434 21,9877/2005 - 6/2010 101,389 20.97 45,136 17,128 20,9447/2010 - 6/2011 19,791 19.25 44,954 15,446 17,4257/2011 - 6/2012 15,297 17.77 42,158 13,160 14,4517/2012 - 6/2013 14,019 17.82 42,723 13,553 14,3967/2013 - 6/2014 14,564 16.95 40,368 12,088 12,5187/2014 - 6/2015 11,469 17.50 41,906 12,900 12,937 Total / Average 376,439 21.01 $39,530 $14,823 $20,496
By Employer
State 76,547 20.85 $37,124 $13,841 $19,104State University System 17,986 22.20 44,322 16,441 22,850Counties 83,239 19.29 44,176 17,226 22,906School Boards 174,711 21.89 37,259 13,856 19,655Community Colleges 12,272 20.98 43,558 15,553 22,029Cities and Special Districts 11,684 19.41 44,545 15,349 19,800 Total / Average 376,439 21.01 $39,530 $14,823 $20,496
PROFILE OF FRS ANNUITANTS1
as of June 30, 2015
1 FRS annuitants exclude General Revenue and TRS-SB annuitants and exclude DROP participants.2 Option selections for existing systems have been included in the FRS options outlined even though they are different.
137

Average Average Average Annual Average Annual
By Gender Count Service AFC Initial Benefit Current Benefit
Female 239,102 21.04 $35,952 $13,145 $17,914Male 137,337 20.97 45,760 17,745 24,992 Total / Average 376,439 21.01 $39,530 $14,823 $20,496
By Type of Retirement
Line of Duty Death 368 10.26 $32,483 $16,078 $27,109Not Line of Duty Death 9,081 17.77 34,877 7,121 10,844Line of Duty Disability 3,493 14.65 30,027 14,011 20,013Not Line of Duty Disability 12,684 17.54 31,741 9,558 12,802Early 97,694 16.92 33,887 8,801 11,930Normal 253,119 22.98 42,407 17,697 24,532 Total / Average 376,439 21.01 $39,530 $14,823 $20,496
By Duration of Benefit Payments
to Date
Less Than 5 Years 75,140 17.97 $42,615 $13,588 $14,6185 - 10 101,389 20.97 45,136 17,128 20,94410 - 15 87,709 21.51 39,887 15,434 21,98715 - 20 64,150 23.17 36,809 15,150 24,92320 - 25 26,728 22.29 29,961 11,870 21,87725 - 30 13,001 22.01 23,440 9,413 19,35630 - 35 6,120 21.82 18,028 7,631 16,86135 - 40 1,703 20.84 13,081 5,250 12,94740 or More Years 499 19.50 9,018 3,192 9,764 Total / Average 376,439 21.01 $39,530 $14,823 $20,496
By Duration of Benefit Payments -
Deaths in Current Year
Less Than 1 Year 306 17.18 $41,310 $9,444 $9,4831 -2 155 16.09 38,023 9,312 9,3352 - 3 111 19.23 44,892 13,242 13,7093 - 4 132 18.53 45,981 13,933 14,7074 - 5 157 20.28 42,659 13,482 14,3925 - 10 735 19.48 41,497 14,260 15,82110 - 15 464 20.37 40,518 14,809 17,20415 - 20 689 23.97 41,834 19,965 24,47820 - 25 305 23.40 35,435 17,508 22,74325 - 30 166 25.39 30,002 17,683 23,56130 - 35 65 29.08 24,748 19,261 26,14735 - 40 16 26.86 16,758 13,392 18,88540 or More Years 8 18.00 11,327 8,038 12,404 Total / Average 3,309 21.04 $39,941 $15,314 $17,980
as of June 30, 2015PROFILE OF FRS ANNUITANTS
1
Average duration of benefit payments in years - 11.09 years
Average duration of benefit payments in years - 11.34 years
1 FRS annuitants exclude General Revenue and TRS-SB annuitants and exclude DROP participants.
138
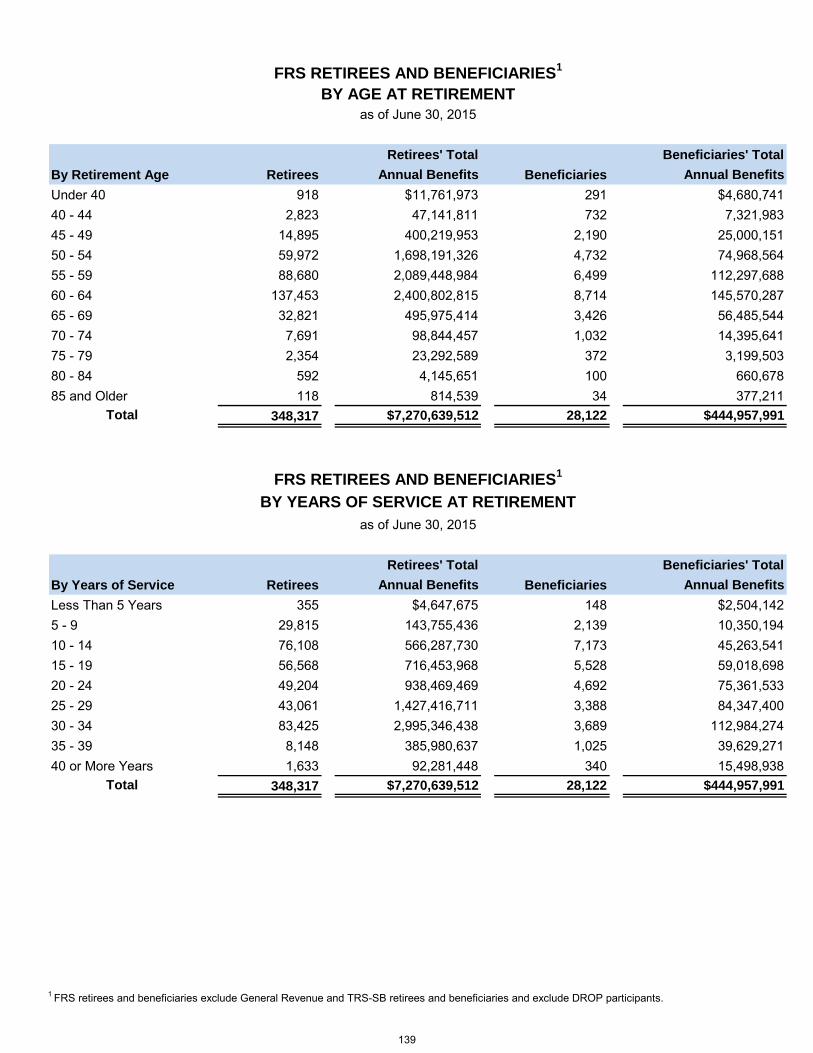
By Retirement Age Retirees
Under 40 91840 - 44 2,82345 - 49 14,89550 - 54 59,97255 - 59 88,68060 - 64 137,45365 - 69 32,82170 - 74 7,69175 - 79 2,35480 - 84 59285 and Older 118 Total 348,317
By Years of Service Retirees
Less Than 5 Years 3555 - 9 29,81510 - 14 76,10815 - 19 56,56820 - 24 49,20425 - 29 43,06130 - 34 83,42535 - 39 8,14840 or More Years 1,633 Total 348,317
291732
2,1904,7326,4998,714
74,968,564
2,400,802,815
Beneficiaries' Total
Annual Benefits
28,122
Beneficiaries
100
$4,680,7417,321,983
3,199,50323,292,589
495,975,414 3,426145,570,287112,297,688
14,395,6411,032
Annual Benefits
148
1,698,191,326
660,678377,211
$7,270,639,512 $444,957,991
98,844,457
2,089,448,984
Beneficiaries
1,427,416,7112,995,346,438
938,469,469
4,145,651814,539
716,453,968
47,141,811
59,018,698
34
372
25,000,151
566,287,7302,1397,173
56,485,544
Beneficiaries' Total
1,025
$2,504,142
5,528
84,347,400112,984,27439,629,271
3,6893,388
75,361,533
45,263,541
Retirees' Total
Annual Benefits
$7,270,639,512
385,980,63792,281,448
$4,647,675143,755,436
400,219,953
$11,761,973
$444,957,991
Retirees' Total
Annual Benefits
4,692
28,122
10,350,194
340 15,498,938
FRS RETIREES AND BENEFICIARIES1
BY AGE AT RETIREMENT
as of June 30, 2015
FRS RETIREES AND BENEFICIARIES1
BY YEARS OF SERVICE AT RETIREMENT
as of June 30, 2015
1 FRS retirees and beneficiaries exclude General Revenue and TRS-SB retirees and beneficiaries and exclude DROP participants.
139
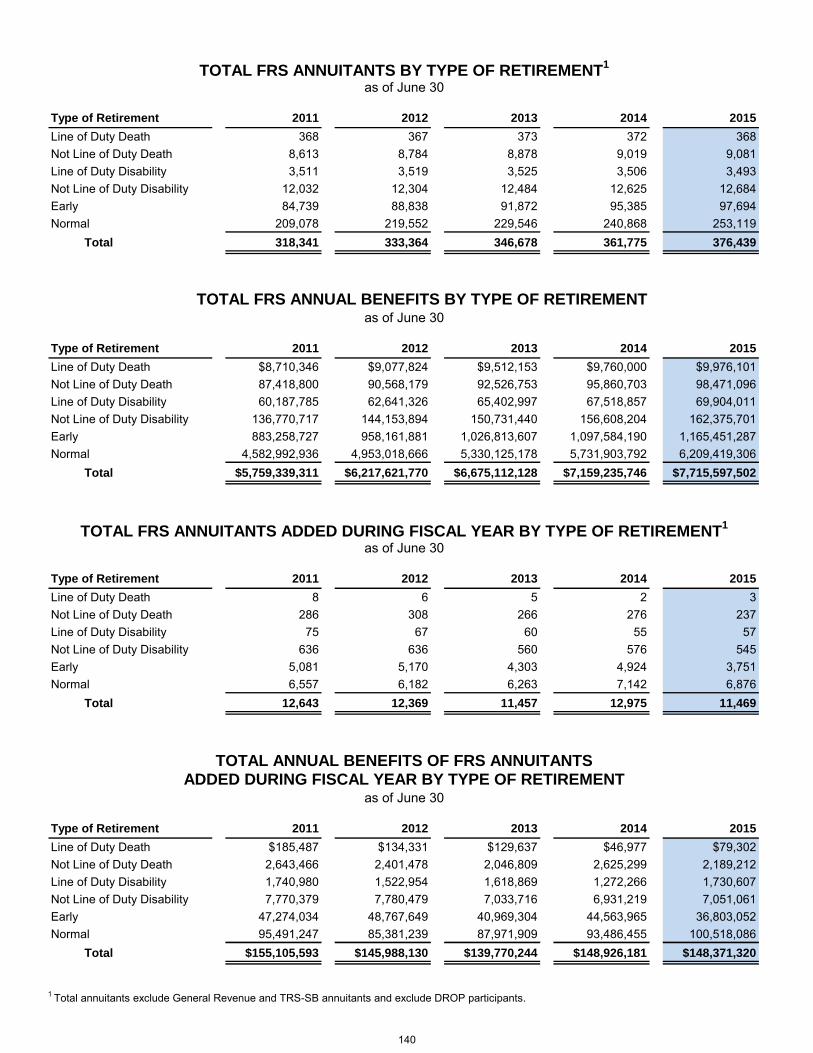
Type of Retirement 2011 2012 2013 2014 2015
Line of Duty Death 368 367 373 372 368Not Line of Duty Death 8,613 8,784 8,878 9,019 9,081Line of Duty Disability 3,511 3,519 3,525 3,506 3,493Not Line of Duty Disability 12,032 12,304 12,484 12,625 12,684Early 84,739 88,838 91,872 95,385 97,694Normal 209,078 219,552 229,546 240,868 253,119 Total 318,341 333,364 346,678 361,775 376,439
Type of Retirement 2011 2012 2013 2014 2015
Line of Duty Death $8,710,346 $9,077,824 $9,512,153 $9,760,000 $9,976,101Not Line of Duty Death 87,418,800 90,568,179 92,526,753 95,860,703 98,471,096Line of Duty Disability 60,187,785 62,641,326 65,402,997 67,518,857 69,904,011Not Line of Duty Disability 136,770,717 144,153,894 150,731,440 156,608,204 162,375,701Early 883,258,727 958,161,881 1,026,813,607 1,097,584,190 1,165,451,287Normal 4,582,992,936 4,953,018,666 5,330,125,178 5,731,903,792 6,209,419,306 Total $5,759,339,311 $6,217,621,770 $6,675,112,128 $7,159,235,746 $7,715,597,502
Type of Retirement 2011 2012 2013 2014 2015
Line of Duty Death 8 6 5 2 3Not Line of Duty Death 286 308 266 276 237Line of Duty Disability 75 67 60 55 57Not Line of Duty Disability 636 636 560 576 545Early 5,081 5,170 4,303 4,924 3,751Normal 6,557 6,182 6,263 7,142 6,876 Total 12,643 12,369 11,457 12,975 11,469
Type of Retirement 2011 2012 2013 2014 2015
Line of Duty Death $185,487 $134,331 $129,637 $46,977 $79,302Not Line of Duty Death 2,643,466 2,401,478 2,046,809 2,625,299 2,189,212Line of Duty Disability 1,740,980 1,522,954 1,618,869 1,272,266 1,730,607Not Line of Duty Disability 7,770,379 7,780,479 7,033,716 6,931,219 7,051,061Early 47,274,034 48,767,649 40,969,304 44,563,965 36,803,052Normal 95,491,247 85,381,239 87,971,909 93,486,455 100,518,086 Total $155,105,593 $145,988,130 $139,770,244 $148,926,181 $148,371,320
ADDED DURING FISCAL YEAR BY TYPE OF RETIREMENTTOTAL ANNUAL BENEFITS OF FRS ANNUITANTS
as of June 30
TOTAL FRS ANNUITANTS BY TYPE OF RETIREMENT1
as of June 30
TOTAL FRS ANNUAL BENEFITS BY TYPE OF RETIREMENTas of June 30
TOTAL FRS ANNUITANTS ADDED DURING FISCAL YEAR BY TYPE OF RETIREMENT1
as of June 30
1 Total annuitants exclude General Revenue and TRS-SB annuitants and exclude DROP participants.
140

Less
Than 5 1
5 - 9 10 - 14 15 - 19 20 - 24 25 - 29 30 - 34 35 - 39
40 or
More
Average Annual Benefit $14,218 $4,823 $7,343 $12,488 $18,811 $32,547 $35,681 $46,398 $54,628
Average AFC $12,578 $29,757 $28,543 $34,845 $40,311 $48,944 $50,424 $48,289 $51,246
Count 503 31,954 83,281 62,096 53,896 46,449 87,114 9,173 1,973
Average Annual Benefit $13,921 $4,686 $7,118 $12,113 $18,198 $31,189 $34,775 $45,352 $53,674
Average AFC $12,645 $29,192 $27,891 $34,071 $39,326 $47,453 $49,466 $46,921 $50,414
Count 506 29,973 81,618 60,299 51,985 43,894 82,454 9,005 2,041
Average Annual Benefit $13,402 $4,600 $6,924 $11,790 $17,599 $30,006 $33,868 $44,232 $51,876
Average AFC $12,425 $28,675 $27,276 $33,339 $38,294 $46,118 $48,651 $45,976 $48,789
Count 511 27,340 78,982 58,106 50,062 41,793 78,779 9,002 2,103
Average Annual Benefit $12,998 $4,484 $6,721 $11,407 $16,977 $28,760 $32,921 $43,008 $50,466
Average AFC $12,311 $28,079 $26,638 $32,516 $37,234 $44,734 $47,754 $44,983 $47,727
Count 512 25,160 74,934 56,235 48,273 39,924 75,046 9,114 2,166
Average Annual Benefit $12,594 $4,404 $6,522 $11,041 $16,410 $27,628 $32,059 $41,729 $49,194
Average AFC $12,359 $27,501 $25,958 $31,662 $36,138 $43,343 $46,872 $43,950 $46,796
Count 513 22,631 74,657 54,238 46,143 37,948 70,869 9,122 2,220
Average Annual Benefit $12,191 $4,317 $6,323 $10,672 $15,802 $26,491 $31,141 $40,464 $47,675
Average AFC $12,510 $26,863 $25,275 $30,788 $34,899 $41,993 $45,838 $42,853 $45,393
Count 513 20,238 72,375 52,211 43,835 36,084 66,346 9,136 2,240
Average Annual Benefit $11,815 $4,252 $6,127 $10,317 $15,198 $25,386 $30,288 $39,161 $46,227
Average AFC $12,648 $26,357 $24,625 $29,901 $33,740 $40,710 $44,747 $41,882 $44,407
Count 504 17,814 70,404 50,295 42,171 34,511 61,037 9,168 2,312
Average Annual Benefit $11,194 $4,202 $5,936 $9,945 $14,647 $24,291 $29,380 $37,846 $44,723
Average AFC $12,333 $25,842 $24,034 $28,979 $32,746 $39,535 $43,638 $41,006 $43,416
Count 485 15,512 68,578 48,467 40,624 33,059 56,430 9,280 2,407
Average Annual Benefit $11,340 $4,137 $5,734 $9,603 $14,114 $23,135 $28,508 $36,534 $43,316
Average AFC $16,487 $25,220 $23,424 $28,135 $31,850 $38,299 $42,589 $40,185 $42,767
Count 347 13,438 67,175 46,894 39,481 31,601 52,376 9,407 2,479
Average Annual Benefit $10,801 $4,138 $5,543 $9,266 $13,595 $22,031 $27,705 $35,424 $41,729
Average AFC $15,723 $24,688 $22,799 $27,274 $30,950 $37,087 $41,559 $39,554 $41,923
Count 340 10,901 65,570 45,168 38,151 30,105 48,186 9,474 2,601
2006
2010
SCHEDULE OF AVERAGE FRS BENEFITS
Fiscal Year
2009
2008
2007
Years of Creditable Service
2015
2014
2013
2012
as of June 30
2011
1 Represents in-line-of-duty disability and death benefits with guaranteed minimum benefit levels.
141

FRS PENSION BENEFITS BY FLORIDA COUNTY as of June 30, 2015
Color Key
$0 - $15 million
$15 - $25 million
$25 - $50 million
$50 - $100 million
$100 - $200 million
$200 million +
Of the 377,671 retirees in the FRS, 329,704 or 87.3%, remain Florida residents as of June 30, 2015. During the Fiscal Year 2014-15, pension benefit payments of $6.47 billion were distributed to retirees and their beneficiaries throughout the 67 counties of Florida as shown on the map above.
142

FRS RETIREES BY STATE as of June 30, 2015
FRS RETIREES OUTSIDE THE UNITED STATES as of June 30, 2015
Antilles (1) Cayman Islands (1) Guam (2) Pakistan (1) Trinidad & Tobago (3) Argentina (4) Chile (4) Guatemala (2) Panama (7) Turkey (1) Armed Forces (39) China (3) Hungary (4) Peru (6) United Arab Emirates (1) Armenia (1) Colombia (15) India (4) Philippines (15) United Kingdom (48) Aruba (1) Costa Rica (8) Israel (12) Poland (2) Uruguay (2) Australia (19) Croatia (1) Italy (4) Portugal (2) Vietnam (1) Bahamas (4) Czech Republic (1) Jamaica (8) Puerto Rico (218) Virgin Islands (18) Barbados (2) Dominican Republic (3) Japan (1) Romania (1) West Indies (20) Belize (1) Ecuador (7) Mexico (13) South Africa (1) Other (22) Bolivia (1) Egypt (2) Micronesia (1) Spain (20) Bosnia-Herzegovina (1) Finland (2) Monaco (1) Switzerland (3) Brazil (2) France (8) Netherlands (1) Syria (1) Bulgaria (2) Germany (22) New Zealand (10) Thailand (21) Canada (90) Greece (6) Nicaragua (3) Tonga (1)
143

By System / Class 20111
20121
2013 2014 2015
FRS - Regular Class 1,668 2,783 4,160 5,562 6,709 - Senior Management Service Class 32 54 86 113 150 - Special Risk Class 143 284 550 817 1,062 - Elected Officers' Class 33 36 70 82 102 Total 1,876 3,157 4,866 6,574 8,023
By Employer Group Count
State 1,881State University System 415School Boards 3,373Counties 1,582Community Colleges 392Cities and Special Districts 380 Total / Average 8,023 2.03 $32,456
Less than 30 8430 - 39 96840 - 49 1,39650 - 59 2,04360 - 69 2,76370 and Over 769 Total / Average 8,023 2.03 $32,456
Female 4,628Male 3,395 Total / Average 8,023 2.03 $32,456
2.01
1.991.882.152.40
2.05
1.89
By Age Range
By Gender
$24,50434,330
1.311.85
of Employment
1.892.232.15
$29,623
23,689
30,185
1.922.16
36,319
$33,95056,44828,57333,09432,934
35,52733,04632,495
Average
Salary
REEMPLOYED RETIREES NOT ELIGIBLE
FOR RENEWED MEMBERSHIP BY SYSTEM / CLASS
as of June 30
PROFILE OF REEMPLOYED RETIREES NOT ELIGIBLE
FOR RENEWED MEMBERSHIPas of June 30, 2015
Average Length
1 These totals were understated in previous annual reports and have been revised to reflect the correct totals.
144

System Summary Section
American Black Bear.
145

CHRONOLOGICAL HIGHLIGHTS OF STATE-ADMINISTERED RETIREMENT
AND PENSION SYSTEMS SINCE 2000
2000 — The Public Employee Optional Retirement Program (also referred to as the Investment Plan) was established to be implemented in 2002.
Special risk annual retirement credit was upgraded to 3 percent for all years between Oct. 1, 1978, and Jan. 1, 1993, for members retiring on and after July 1, 2000.
Minimum special risk in-line-of-duty disability benefits were increased from 42 percent to 65 percent, effective July 1, 2000.
The vesting requirement was reduced to six years for all FRS membership classes, beginning July 1, 2001.
The vesting requirement for regular disability retirement was reduced to eight years, beginning July 1, 2001.
2001 — A one-time special 12 percent benefit increase was provided, effective Jan. 1, 2002, for FRS retirees with special risk service between Oct. 1, 1978, and Dec. 31, 1992, for members retiring before July 1, 2000.
Cities and special districts already participating in the FRS for their elected officials were given a second opportunity to designate their elected officials for membership in the Elected Officers’ Class.
2002 — A uniform employer contribution rate structure was created effective July 1, 2002, for members of the Pension Plan and members of the Investment Plan.
A 90-day window was provided to allow members to convert their Senior Management Service Optional Annuity Program service to creditable service under the Pension Plan.
2003 — Participants of the Community College Optional Retirement Program were provided a one-time opportunity to transfer to the FRS.
2005 — Local government service managers who withdrew from the FRS were given a one-time opportunity to transfer to the FRS between Jan. 1, 2006, and June 30, 2006.
2007 — Participants of the State University System Optional Retirement Program were provided a one-time opportunity to transfer to the FRS between Jan. 1, 2008, and Dec. 31, 2008.
The Institute of Food and Agricultural Sciences Supplemental Retirement Program was consolidated as a closed-retirement system under the Regular Class of the FRS, effective July 1, 2007.
2009 — The definition of termination was changed from one calendar month to six calendar months for Pension Plan members whose DROP termination dates or non-DROP retirements are effective on or after July 1, 2010.
For Pension Plan members whose DROP termination dates or non-DROP retirements are effective on or after July 1, 2010, the reemployment limitation period was changed to six calendar months after meeting the definition of termination.
All exceptions to employment with FRS-covered employers during the reemployment limitation period were closed to Pension Plan members whose DROP termination dates are on or after July 1, 2010, or whose non-DROP retirements are effective July 1, 2010. Investment Plan members and participants in the State University System Optional Retirement Program, Senior Management Service Optional Annuity Program, State Community College Optional Retirement Program, and withdrawn local senior managers who received a distribution in June 2010 or after no longer have exceptions to employment with FRS-covered employers during the reemployment limitation period.
Renewed membership was closed to retirees of a state-administered retirement system initially reemployed by an FRS participating employer on or after July 1, 2010.
2010 — Continued Special Risk Class participation for employment in a non-special risk position is provided for members suffering specified in-line-of-duty injuries and who reach maximum medical improvement on or after Aug. 1, 2008, for as long as employed by the same employer at the time of injury.
146

2011 — Required 3 percent pre-tax employee contributions on compensation reported on or after July 1, 2011, for all members except those participating in the DROP or reemployed retirees who are not eligible for renewed membership.
Changed the cost-of-living adjustment formula for FRS Pension Plan retirements effective on or after Aug. 1, 2011, to be a proportional amount of 3 percent excluding service credit earned on or after July 1, 2011.
Created different benefit structure for FRS Pension Plan members initially enrolled on or after July 1, 2011, in addition to required employee contributions that require:
Eight-year vesting,
Highest eight fiscal years of salary used in the calculation of average final compensation,
Normal retirement for Special Risk Class members at age 60 and vested or a total of 30 years of service; and age 65 and vested or a total of 33 years of service for all other classes,
Elimination of cost-of-living adjustments after retirement.
147

FRS PARTICIPATING EMPLOYERS as of June 30, 2015
Note: Italicized agencies withdrew from the FRS effective Jan. 1, 1996, and, new employees hired on or after this date do not participate in the FRS. 1 This agency participates in the FRS for its police employees. 3 This agency participates in the FRS for its elected officials. 2 This agency participates in the FRS for its fire employees. 4 This agency participates in the FRS for its general employees.
STATE AGENCIES –
EXECUTIVE BRANCH
Agency for Health Care Administration Agency for Persons with Disabilities Department of Agriculture and Consumer
Services Department of Business and Professional
Regulation Department of Children and Families Department of Citrus Department of Community Affairs Department of Corrections Department of Economic Opportunity Department of Education Department of Elder Affairs Department of Environmental Protection Department of Financial Services Department of Health Department of Highway Safety and Motor
Vehicles Department of Juvenile Justice Department of Law Enforcement Department of Legal Affairs Department of Lottery Department of Management Services Department of Military Affairs Department of Revenue Department of State Department of Transportation Department of Veterans' Affairs Executive Office of the Governor Fish and Wildlife Conservation Commission Florida Clerks of Court Operations
Corporation Justice Administrative Commission Parole and Probation Commission State Board of Administration Vending Facilities Operators
LEGISLATIVE BRANCH
Auditor General Commission on Ethics The Legislature Public Service Commission
JUDICIAL BRANCH
Capital Collateral Regional Counsels Florida Board of Bar Examiners Guardian Ad Litem Public Defenders State Attorneys State Courts - Circuit Courts State Courts - County Courts State Courts - District Courts of Appeal State Courts - Supreme Court
STATE UNIVERSITY SYSTEM
Florida A&M University Florida Atlantic University Florida Gulf Coast University Florida International University Florida Polytechnic University Florida State University
New College University of Central Florida University of Florida University of North Florida University of South Florida University of West Florida
LOCAL AGENCIES –
ALACHUA COUNTY
Alachua County Library District Alachua MYcroSchool of Integrated
Academics and Technologies Board of County Commissioners Caring and Sharing Learning School City of Alachua 1,4
City of Gainesville 3 City of High Springs 1,2,4
City of Newberry 2,4
Clerk of Circuit Court Genesis Preparatory School of
Gainesville, Inc. Micanopy Middle School, Inc. Property Appraiser Santa Fe College School Board Sheriff SIATech Gainesville Supervisor of Elections Tax Collector
BAKER COUNTY
Board of County Commissioners City of MacClenny 2,3,4
Clerk of Circuit Court New River Solid Waste Association Property Appraiser School Board Sheriff Supervisor of Elections Tax Collector Town of Glen St Mary 3,4
BAY COUNTY
Bay Haven Charter Academy Elementary School
Bay Haven Charter Academy Middle School
Bay Haven Charter Academy, Inc. Beach Mosquito Control District Board of County Commissioners Chautauqua Learn and Serve Charter
School City of Callaway 2,3,4
City of Mexico Beach 1,4
City of Panama City City of Parker City of Springfield Clerk of Circuit Court Gulf Coast State College North Bay Haven Charter Career School North Bay Haven Charter Elementary
School North Bay Haven Charter Middle School
Panama City Port Authority Property Appraiser Rising Leader Academy, Inc. School Board Sheriff Supervisor of Elections Tax Collector University Academy, Inc.
BRADFORD COUNTY
Board of County Commissioners Clerk of Circuit Court Property Appraiser School Board Sheriff Supervisor of Elections Tax Collector
BREVARD COUNTY
Board of County Commissioners Eastern Florida State College Canaveral Port Authority City of Cocoa 4 City of Indian Harbour Beach 4
City of Melbourne 1,3,4
City of Palm Bay 3 City of West Melbourne 4 Clerk of Circuit Court Merritt Island Public Library Tax District Property Appraiser School Board Sebastian Inlet District Sheriff Supervisor of Elections Tax Collector Town of Malabar Town of Melbourne Beach 4
BROWARD COUNTY
Board of County Commissioners Broward College Broward Community Charter Middle
School Broward Community Charter School Broward Community Charter School West Broward County Housing Authority Broward Metropolitan Planning
Organization Central Broward Water Control District Central Charter School Charter School of Excellence Davie 1
Campus
Charter School of Excellence Davie 2 Campus
Charter School of Excellence Fort Lauderdale 1 Campus
Charter School of Excellence Fort Lauderdale 2 Campus
Charter School of Excellence Riverland 1 Campus
Charter School of Excellence Riverland 2 Campus
Charter School of Excellence Tamarac 1 Campus
148

Note: Italicized agencies withdrew from the FRS effective Jan. 1, 1996, and, new employees hired on or after this date do not participate in the FRS. 1 This agency participates in the FRS for its police employees. 3 This agency participates in the FRS for its elected officials. 2 This agency participates in the FRS for its fire employees. 4 This agency participates in the FRS for its general employees.
Charter School of Excellence Tamarac 2 Campus
Children’s Services Council of Broward City of Coconut Creek City of Cooper City 4 City of Dania Beach 3,4
City of Deerfield Beach 3
City of Hollywood 3
City of Lauderdale Lakes City of Margate City of Miramar 3
City of North Lauderdale 2 City of Oakland Park 4
City of Pembroke Pines Charter Elementary School
City of Pembroke Pines Charter High School City of Pembroke Pines Charter Middle
School City of Pembroke Pines FSU Charter School City of Pompano Beach 3 City of Weston 3
City of West Park 3,4
City of Wilton Manors 1,3,4
Clerk of Circuit and County Courts Dayspring Elementary Charter School Discovery Middle Charter School Fort Lauderdale Downtown Development
Authority Hillsborough Inlet Improvement and
Maintenance North Broward Hospital District
Old Plantation Water Control District Paragon Elementary Charter School Plantation Acres Improvement District Property Appraiser School Board Sheriff Smart School, Inc. South Broward Drainage District South Florida Regional Planning Council Sunrise Community Charter School Sunshine Elementary Charter School Supervisor of Elections Tax Collector Town of Hillsboro Beach 1,4
Town of Lauderdale-by-the-Sea 3,4
Town of Pembroke Park 4
Tri-County Commuter Rail
CALHOUN COUNTY
Apalachee Regional Planning Council Board of County Commissioners City of Blountstown 1,2,4
Clerk of Circuit Court Property Appraiser School Board Sheriff Supervisor of Elections Tax Collector Town of Altha 1,4
CHARLOTTE COUNTY
Board of County Commissioners Charlotte County Airport Authority Clerk of Circuit Court Property Appraiser School Board
Sheriff Supervisor of Elections Tax Collector
CITRUS COUNTY
Board of County Commissioners Citrus County Mosquito Control District City of Crystal River City of Inverness 3,4 Clerk of Circuit Court Homosassa Special Water District Property Appraiser School Board Sheriff Supervisor of Elections Tax Collector
CLAY COUNTY
Board of County Commissioners City of Green Cove Springs 3,4
Clay County Utility Authority Clerk of Circuit Court First Coast Workforce Consortium Property Appraiser School Board Sheriff Supervisor of Elections Tax Collector
COLLIER COUNTY
Board of County Commissioners City of Marco Island Clerk of Circuit Court Collier County Soil and Water
Conservation District Collier Mosquito Control District Golden Gate Fire Control District Immokalee Fire Control District Marco Island Academy Marco Island Charter Middle School Marco Island Fire Control District North Collier Fire Rescue District Property Appraiser School Board Sheriff Supervisor of Elections Tax Collector
COLUMBIA COUNTY
Board of County Commissioners City of Lake City 3,4
Clerk of Circuit Court Florida Gateway College Lake Shore Hospital Authority Property Appraiser School Board Sheriff Supervisor of Elections Tax Collector
DADE COUNTY
See Miami-Dade County
DE SOTO COUNTY
Board of County Commissioners Clerk of Circuit Court Joshua Water Control District Property Appraiser
School Board Sheriff Supervisor of Elections Tax Collector
DIXIE COUNTY
Board of County Commissioners Clerk of Circuit Court Kinder Cub School, Inc. Property Appraiser School Board Sheriff Supervisor of Elections Tax Collector Three Rivers Regional Library System Town of Cross City
DUVAL COUNTY
Duval MYcroSchool of Integrated Academics and Technologies
Florida State College at Jacksonville Jacksonville Aviation Authority Jacksonville Seaport Authority Jacksonville Transportation Authority Northeast Florida Regional Planning
Council River City Science Academy River City Science Academy Elementary River City Science Academy Innovation School Board SIATech Jacksonville
ESCAMBIA COUNTY
Board of County Commissioners Byrneville Elementary School, Inc. Clerk of Circuit and County Courts City of Pensacola 1,3,4
Emerald Coast Utility Authority Pensacola Beach Elementary School Pensacola State College Property Appraiser School Board Sheriff Supervisor of Elections Tax Collector West Florida Regional Planning Council
FLAGLER COUNTY
Board of County Commissioners City of Bunnell Clerk of Circuit Court East Flagler Mosquito Control District Flagler County Housing Authority Property Appraiser School Board Sheriff Supervisor of Elections Tax Collector
FRANKLIN COUNTY
Apalachicola Housing Authority Board of County Commissioners City of Apalachicola 1,4
City of Carrabelle 1,3,4
Clerk of Circuit Court Eastpoint Water and Sewer District Property Appraiser School Board
149

Note: Italicized agencies withdrew from the FRS effective Jan. 1, 1996, and, new employees hired on or after this date do not participate in the FRS. 1 This agency participates in the FRS for its police employees. 3 This agency participates in the FRS for its elected officials. 2 This agency participates in the FRS for its fire employees. 4 This agency participates in the FRS for its general employees.
Sheriff Supervisor of Elections Tax Collector
GADSDEN COUNTY
Board of County Commissioners City of Chattahoochee 1,3,4
City of Gretna City of Midway 1,3,4 Clerk of Circuit Court Northwest Florida Water Management
District Property Appraiser School Board Sheriff Supervisor of Elections Tax Collector Town of Greensboro 1,4
Town of Havana 1,4
GILCHRIST COUNTY
Board of County Commissioners City of Trenton 1,3,4
Clerk of Circuit Court Property Appraiser School Board Sheriff Supervisor of Elections Tax Collector
GLADES COUNTY
Board of County Commissioners City of Moore Haven 4
Clerk of Circuit Court Moore Haven Mosquito Control District Pemayetv Emahakv, Inc. Property Appraiser School Board Sheriff Supervisor of Elections Tax Collector
GULF COUNTY
Board of County Commissioners City of Port Saint Joe Clerk of Circuit Court Port Saint Joe Port Authority Property Appraiser School Board Sheriff Supervisor of Elections Tax Collector
HAMILTON COUNTY
Board of County Commissioners City of Jasper Clerk of Circuit Court Property Appraiser School Board Sheriff Supervisor of Elections Tax Collector
HARDEE COUNTY
Board of County Commissioners Clerk of Circuit Court Property Appraiser School Board
Sheriff Supervisor of Elections Tax Collector
HENDRY COUNTY
Barron Water Control District Board of County Commissioners Central County Water Control District City of Clewiston 1 City of La Belle 3,4
Clerk of Circuit Court Hendry County Hospital Authority Port La Belle Community Development
District Property Appraiser School Board Sheriff Supervisor of Elections Tax Collector
HERNANDO COUNTY
Board of County Commissioners City of Brooksville 3,4
Clerk of Circuit Court Hernando County Housing Authority Property Appraiser School Board Sheriff Southwest Florida Water Management
District Spring Hill Fire Rescue District and
Emergency Medical Services Supervisor of Elections Tax Collector
HIGHLANDS COUNTY
Board of County Commissioners City of Avon Park 3,4 City of Sebring 4
Clerk of Circuit Court Highlands Soil and Water Conservation
District Property Appraiser School Board Sebring Airport Authority Sheriff South Florida State College Supervisor of Elections Tax Collector Town of Lake Placid 1,3,4
HILLSBOROUGH COUNTY
Board of County Commissioners Children's Board of Hillsborough County City of Temple Terrace Clerk of Circuit Court Hillsborough Area Regional Transit Hillsborough Community College Hillsborough County Aviation Authority Hillsborough County Civil Service Board Hillsborough County Public
Transportation Commission Property Appraiser School Board Sheriff Supervisor of Elections Tampa Bay Estuary Program
Tampa-Hillsborough County Expressway Authority
Tampa Port Authority Tampa Sports Authority Tax Collector
HOLMES COUNTY
Board of County Commissioners Clerk of Circuit Court Holmes County Housing Authority Property Appraiser School Board Sheriff Supervisor of Elections Tax Collector
INDIAN RIVER COUNTY
Board of County Commissioners Clerk of Circuit Court Fellsmere Water Control District Indian River Farms Water Control District Indian River Mosquito Control District Property Appraiser Saint Johns Water Control District School Board Sheriff Supervisor of Elections Tax Collector
JACKSON COUNTY
Board of County Commissioners Challenge for Success Charter School Chipola College City of Graceville 1,4
City of Marianna 4 Clerk of Circuit Court Jackson Hospital Northwest Florida Regional Housing
Authority Property Appraiser School Board Sheriff Supervisor of Elections Tax Collector Town of Alford 4
Town of Grand Ridge 4
Town of Sneads 1,4
JEFFERSON COUNTY
Board of County Commissioners Clerk of Circuit Court Property Appraiser School Board Sheriff Supervisor of Elections Tax Collector
LAFAYETTE COUNTY
Board of County Commissioners Clerk of Circuit Court Property Appraiser School Board Sheriff Supervisor of Elections Tax Collector Town of Mayo 3,4
150
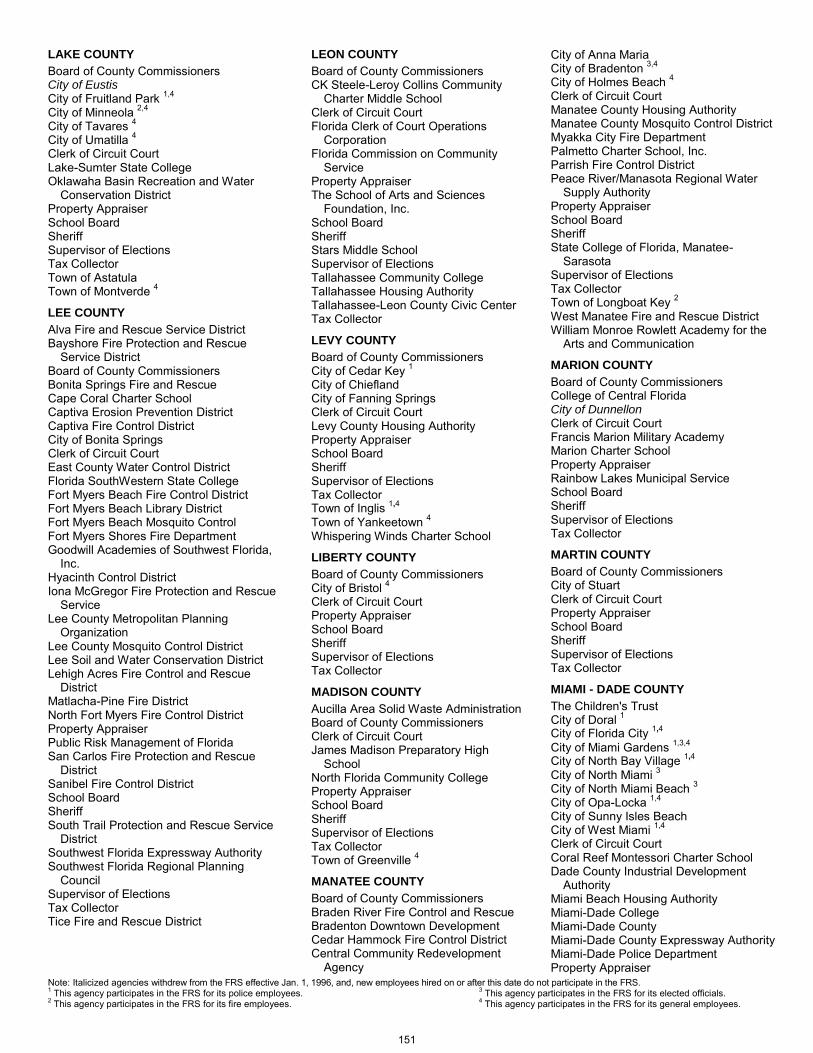
Note: Italicized agencies withdrew from the FRS effective Jan. 1, 1996, and, new employees hired on or after this date do not participate in the FRS. 1 This agency participates in the FRS for its police employees. 3 This agency participates in the FRS for its elected officials. 2 This agency participates in the FRS for its fire employees. 4 This agency participates in the FRS for its general employees.
LAKE COUNTY
Board of County Commissioners City of Eustis City of Fruitland Park 1,4
City of Minneola 2,4 City of Tavares 4
City of Umatilla 4
Clerk of Circuit Court Lake-Sumter State College Oklawaha Basin Recreation and Water
Conservation District Property Appraiser School Board Sheriff Supervisor of Elections Tax Collector Town of Astatula Town of Montverde 4
LEE COUNTY
Alva Fire and Rescue Service District Bayshore Fire Protection and Rescue
Service District Board of County Commissioners Bonita Springs Fire and Rescue Cape Coral Charter School Captiva Erosion Prevention District Captiva Fire Control District City of Bonita Springs Clerk of Circuit Court East County Water Control District Florida SouthWestern State College Fort Myers Beach Fire Control District Fort Myers Beach Library District Fort Myers Beach Mosquito Control Fort Myers Shores Fire Department Goodwill Academies of Southwest Florida,
Inc. Hyacinth Control District Iona McGregor Fire Protection and Rescue
Service Lee County Metropolitan Planning
Organization Lee County Mosquito Control District Lee Soil and Water Conservation District Lehigh Acres Fire Control and Rescue
District Matlacha-Pine Fire District North Fort Myers Fire Control District Property Appraiser Public Risk Management of Florida San Carlos Fire Protection and Rescue
District Sanibel Fire Control District School Board Sheriff South Trail Protection and Rescue Service
District Southwest Florida Expressway Authority Southwest Florida Regional Planning
Council Supervisor of Elections Tax Collector Tice Fire and Rescue District
LEON COUNTY
Board of County Commissioners CK Steele-Leroy Collins Community
Charter Middle School Clerk of Circuit Court Florida Clerk of Court Operations
Corporation Florida Commission on Community
Service Property Appraiser The School of Arts and Sciences
Foundation, Inc. School Board Sheriff Stars Middle School Supervisor of Elections Tallahassee Community College Tallahassee Housing Authority Tallahassee-Leon County Civic Center Tax Collector
LEVY COUNTY
Board of County Commissioners City of Cedar Key 1 City of Chiefland City of Fanning Springs Clerk of Circuit Court Levy County Housing Authority Property Appraiser School Board Sheriff Supervisor of Elections Tax Collector Town of Inglis 1,4 Town of Yankeetown 4
Whispering Winds Charter School
LIBERTY COUNTY
Board of County Commissioners City of Bristol 4
Clerk of Circuit Court Property Appraiser School Board Sheriff Supervisor of Elections Tax Collector
MADISON COUNTY
Aucilla Area Solid Waste Administration Board of County Commissioners Clerk of Circuit Court James Madison Preparatory High
School North Florida Community College Property Appraiser School Board Sheriff Supervisor of Elections Tax Collector Town of Greenville 4
MANATEE COUNTY
Board of County Commissioners Braden River Fire Control and Rescue Bradenton Downtown Development Cedar Hammock Fire Control District Central Community Redevelopment
Agency
City of Anna Maria City of Bradenton 3,4
City of Holmes Beach 4
Clerk of Circuit Court Manatee County Housing Authority Manatee County Mosquito Control District Myakka City Fire Department Palmetto Charter School, Inc. Parrish Fire Control District Peace River/Manasota Regional Water
Supply Authority Property Appraiser School Board Sheriff State College of Florida, Manatee-
Sarasota Supervisor of Elections Tax Collector Town of Longboat Key 2 West Manatee Fire and Rescue District William Monroe Rowlett Academy for the
Arts and Communication
MARION COUNTY
Board of County Commissioners College of Central Florida City of Dunnellon Clerk of Circuit Court Francis Marion Military Academy Marion Charter School Property Appraiser Rainbow Lakes Municipal Service School Board Sheriff Supervisor of Elections Tax Collector
MARTIN COUNTY
Board of County Commissioners City of Stuart Clerk of Circuit Court Property Appraiser School Board Sheriff Supervisor of Elections Tax Collector
MIAMI - DADE COUNTY
The Children's Trust City of Doral 1
City of Florida City 1,4
City of Miami Gardens 1,3,4
City of North Bay Village 1,4 City of North Miami 3
City of North Miami Beach 3 City of Opa-Locka 1,4
City of Sunny Isles Beach City of West Miami 1,4
Clerk of Circuit Court Coral Reef Montessori Charter School Dade County Industrial Development
Authority Miami Beach Housing Authority Miami-Dade College Miami-Dade County Miami-Dade County Expressway Authority Miami-Dade Police Department Property Appraiser
151

Note: Italicized agencies withdrew from the FRS effective Jan. 1, 1996, and, new employees hired on or after this date do not participate in the FRS. 1 This agency participates in the FRS for its police employees. 3 This agency participates in the FRS for its elected officials. 2 This agency participates in the FRS for its fire employees. 4 This agency participates in the FRS for its general employees.
Public Health Trust Jackson Memorial School Board SIATech Miami-Dade Supervisor of Elections Tax Collector Town of Cutler Bay Town of Miami Lakes 1,3,4
Village of Biscayne Park 1,4
Village of El Portal 1,4
Village of Pinecrest 1
MONROE COUNTY
Board of County Commissioners City of Key Colony Beach 1,4
City of Marathon 3 Clerk of Circuit Court Florida Keys Aqueduct Authority Florida Keys Community College Florida Keys Mosquito Control District Islamorada, Village of Islands Property Appraiser School Board Sheriff Supervisor of Elections Tax Collector
NASSAU COUNTY
Amelia Island Mosquito Control Board of County Commissioners City of Fernandina Beach 3 Clerk of Circuit Court Property Appraiser School Board Sheriff Supervisor of Elections Tax Collector Town of Callahan 3,4
Town of Hilliard 3,4
OKALOOSA COUNTY
Board of County Commissioners City of Niceville 1,2,4
City of Valparaiso
Clerk of Circuit Court Liza Jackson Preparatory School Northwest Florida State College Okaloosa County Gas District
Property Appraiser School Board Sheriff Supervisor of Elections Tax Collector Town of Shalimar
OKEECHOBEE COUNTY
Board of County Commissioners Clerk of Circuit Court Okeechobee Soil and Water Conservation
District Property Appraiser School Board Sheriff Supervisor of Elections Tax Collector
ORANGE COUNTY
Board of County Commissioners Central Florida Expressway Authority
Central Florida Regional Transit Authority
City of Edgewood City of Maitland Clerk of Circuit Court Florida Virtual High School Greater Orlando Aviation Authority 2
Lake Apopka Natural Gas District Nap Ford Community School Office of the Comptroller Orlando Science Elementary School Orlando Science Middle/High School Property Appraiser Reedy Creek Improvement District Rio Grand Charter School of Excellence School Board Sheriff Supervisor of Elections Tax Collector Valencia College
OSCEOLA COUNTY
Board of County Commissioners Clerk of Circuit Court Harmony Neighborhood School, Inc. New Dimensions High School Property Appraiser School Board Sheriff Supervisor of Elections Tax Collector
PALM BEACH COUNTY
Acme Improvement District Board of County Commissioners City of Atlantis 1,4 City of Boca Raton 3 City of Boynton Beach 3
City of Greenacres City of Pahokee
City of Palm Beach Gardens 3,4
City of Riviera Beach 3 City of South Bay 3 Clerk of Circuit Court Day Star Academy of Excellence Florida Inland Navigation District Good Schools for All Leadership
Academy G-STAR School of the Arts for Motion
Pictures and Television Gulf Stream Goodwill Academies, Inc. Indian Trail Improvement District Inlet Grove Community High School,
Inc. Lake Worth Drainage District Loxahatchee Groves Water Control
District Palm Beach State College Palm Beach County Solid Waste
Authority Palm Beach Soil and Water
Conservation Palm Beach Workforce Development
Consortium Port of Palm Beach Property Appraiser Riviera Beach Maritime Academy
School Board Shawano Drainage District Sheriff South Florida Conservancy South Florida Water Management District South Indian River Water Control District South Tech Charter Academy, Inc. Supervisor of Elections Survivors Charter School Tax Collector Town of Haverhill 4 Town of Highland Beach 1,3,4
Town of Juno Beach 1,4 Town of Jupiter 3,4
Town of Ocean Ridge 1,3,4
Town of Palm Beach Shores 1,2,4
Town of South Palm Beach 1,4 Village of Tequesta Village of Palm Springs 1,3,4 Village of Wellington 3,4
Western Academy Charter School
PASCO COUNTY
Board of County Commissioners City of Dade City City of New Port Richey 4 City of Port Richey City of San Antonio 4
City of Zephyrhills 1,2,4
Clerk of Circuit Court Pasco County Housing Authority Pasco County Mosquito Control District Pasco-Hernando State College Property Appraiser School Board Sheriff Supervisor of Elections Tax Collector
PINELLAS COUNTY
Board of County Commissioners City of Belleair Beach
City of Dunedin City of Indian Rocks Beach
City of Madeira Beach 2,4 City of Oldsmar 2 City of Safety Harbor City of Seminole 3,4
City of South Pasadena 4
City of Treasure Island 1,2 Clerk of Court Juvenile Welfare Board Lealman Special Fire Control District Palm Harbor Special Fire Control District Pinellas County Planning Council Pinellas Housing Authority Pinellas MYcroSchool of Integrated
Academics and Technologies Pinellas Park Water Management District Pinellas Suncoast Fire and Rescue District Pinellas-Suncoast Transit Authority Property Appraiser Saint Petersburg College School Board Sheriff Supervisor of Elections Tampa Bay Regional Planning Council
152

Note: Italicized agencies withdrew from the FRS effective Jan. 1, 1996, and, new employees hired on or after this date do not participate in the FRS. 1 This agency participates in the FRS for its police employees. 3 This agency participates in the FRS for its elected officials. 2 This agency participates in the FRS for its fire employees. 4 This agency participates in the FRS for its general employees.
Tampa Bay Water Tax Collector Town of Indian Shores 3
Town of Kenneth City 1
Town of North Redington Beach 4
Town of Redington Beach Town of Redington Shores 3,4
POLK COUNTY
Berkley Accelerated Middle School Berkley Charter School Board of County Commissioners Clerk of Circuit Court Compass Charter Middle School Dale R. Fair Babson Park Elementary
School Discovery Academy of Lake Alfred Edward W. Bok Academy, Inc. Hillcrest Elementary School Janie Howard Wilson Elementary School Lake Wales Charter School, Inc. Lake Wales Senior High School New Beginnings High School, Inc. Oaks Middle Academy Our Children’s Middle Academy Polk Avenue Elementary School Polk State College Property Appraiser Ridgeview Global Studies Academy School Board Sheriff Supervisor of Elections Tax Collector The Schools of McKeel Academy Town of Polk City 4
Village of Highland Park 4
PUTNAM COUNTY
Board of County Commissioners Clerk of Circuit Court Property Appraiser Putnam Academy of Arts and Sciences Putnam Edge High School Saint Johns River State College Saint Johns River Water Management
District School Board Sheriff Supervisor of Elections Tax Collector
SAINT JOHNS COUNTY
Able School, Inc. Anastasia Mosquito Control District Board of County Commissioners City of Saint Augustine Beach Clerk of Circuit Court Property Appraiser Saint Augustine-Saint Johns County Airport
Authority School Board Sheriff Supervisor of Elections Tax Collector Town of Hastings 4
SAINT LUCIE COUNTY
Board of County Commissioners Children’s Service Council of Saint
Lucie City of Port Saint Lucie 3 Clerk of Circuit Court Indian River State College North Saint Lucie River Water
Management District Property Appraiser School Board Sheriff Supervisor of Elections Tax Collector
SANTA ROSA COUNTY
Avalon Fire Rescue District Board of County Commissioners City of Gulf Breeze
Clerk of Circuit Court Property Appraiser School Board Sheriff Supervisor of Elections Tax Collector Town of Jay 3,4
SARASOTA COUNTY
Board of County Commissioners City of North Port 3,4 City of Venice Clerk of Circuit Court Englewood Area Fire Control District Englewood Water District Goodwill Manasota Academy, Inc. Property Appraiser Sarasota Bay Estuary Program Sarasota-Manatee Metropolitan
Planning Organization Sarasota Military Academy Sarasota Military Academy Prep School Board Sheriff Student Leadership Academy of
Venice, Inc. Supervisor of Elections Tax Collector West Coast Inland Navigation District
SEMINOLE COUNTY
Board of County Commissioners City of Altamonte Springs City of Casselberry City of Longwood City of Sanford 3,4
Clerk of Circuit Court Property Appraiser School Board Seminole State College of Florida Sheriff South Seminole-North Orange
Wastewater Authority Supervisor of Elections Tax Collector
SUMTER COUNTY
Board of County Commissioners City of Bushnell
City of Center Hill 1,4 City of Coleman 1,3,4
City of Webster 1,3,4
City of Wildwood Clerk of Circuit Court Property Appraiser School Board Sheriff Supervisor of Elections Tax Collector
SUWANNEE COUNTY
Board of County Commissioners City of Live Oak Clerk of Circuit Court Property Appraiser School Board Sheriff Supervisor of Elections Suwannee River Water Management
District Suwannee Valley Transit Authority Tax Collector
TAYLOR COUNTY
Big Bend Water Authority Board of County Commissioners City of Perry 3,4
Clerk of Circuit Court Property Appraiser School Board Sheriff Supervisor of Elections Tax Collector Taylor Coastal Water and Sewer District Taylor County Development Authority
UNION COUNTY
Board of County Commissioners City of Lake Butler 3,4
Clerk of Circuit Court New River Library Cooperative Property Appraiser School Board Sheriff Supervisor of Elections Tax Collector Union County Housing Authority
VOLUSIA COUNTY
Board of County Commissioners City of Daytona Beach 3,4 City of Daytona Beach Shores 1 City of Deltona 4
City of Holly Hill 4
City of Lake Helen City of New Smyrna Beach 3
City of Oak Hill 1,4 City of Orange City City of South Daytona 1,2,4
Clerk of Circuit Court Daytona State College New Smyrna Beach Utilities Commission Property Appraiser School Board Sheriff Southeast Volusia Hospital District Supervisor of Elections
153
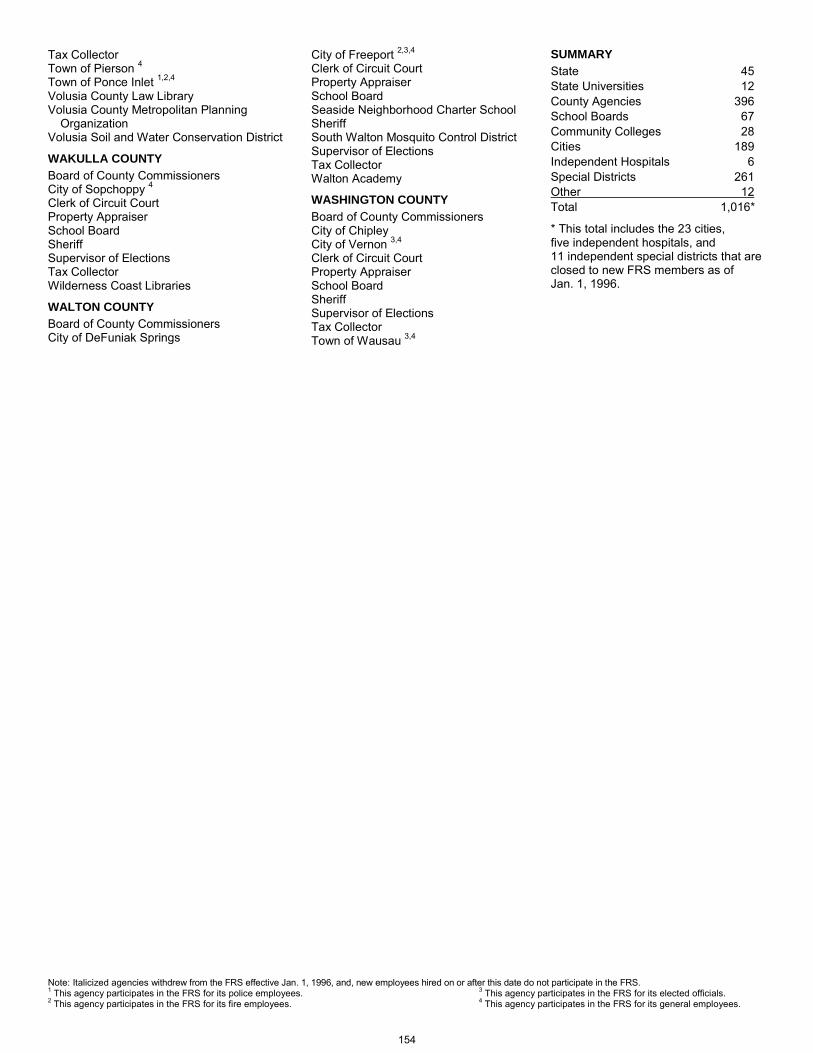
Note: Italicized agencies withdrew from the FRS effective Jan. 1, 1996, and, new employees hired on or after this date do not participate in the FRS. 1 This agency participates in the FRS for its police employees. 3 This agency participates in the FRS for its elected officials. 2 This agency participates in the FRS for its fire employees. 4 This agency participates in the FRS for its general employees.
Tax Collector Town of Pierson 4
Town of Ponce Inlet 1,2,4
Volusia County Law Library Volusia County Metropolitan Planning
Organization Volusia Soil and Water Conservation District
WAKULLA COUNTY
Board of County Commissioners City of Sopchoppy 4
Clerk of Circuit Court Property Appraiser School Board Sheriff Supervisor of Elections Tax Collector Wilderness Coast Libraries
WALTON COUNTY
Board of County Commissioners City of DeFuniak Springs
City of Freeport 2,3,4
Clerk of Circuit Court Property Appraiser School Board Seaside Neighborhood Charter School Sheriff South Walton Mosquito Control District Supervisor of Elections Tax Collector Walton Academy
WASHINGTON COUNTY
Board of County Commissioners City of Chipley City of Vernon 3,4
Clerk of Circuit Court Property Appraiser School Board Sheriff Supervisor of Elections Tax Collector Town of Wausau 3,4
SUMMARY
State 45 State Universities 12 County Agencies 396 School Boards 67 Community Colleges 28 Cities 189 Independent Hospitals 6 Special Districts 261 Other 12 Total 1,016*
* This total includes the 23 cities, five independent hospitals, and 11 independent special districts that are closed to new FRS members as of Jan. 1, 1996.
154

POLICE AND FIREFIGHTERS’ PREMIUM TAX TRUST FUND
The Division of Retirement’s Municipal Police Officers’ and Firefighters’ Retirement Trust Funds’ Office is responsible for the administrative oversight and monitoring of local police and fire pension funds in the State of Florida that participate under Chapters 175 and 185, Florida Statutes. Chapter 175 refers to the firefighters’ plans and Chapter 185 refers to the police officers’ plans.
These statutes require defined benefit plans for police officers and firefighters and establish the minimum benefits and standards that must be provided. Two types of plans operate under these statutes:
Chapter Plans – plans that incorporate by reference the provisions of the chapter to meet the minimum benefits and standards of the Florida Statutes.
Local Law Plans – plans that are created by a special act, local ordinance, or fire district resolution to set forth all the plan provisions. Local Law plans must meet all chapter minimums but may adopt benefits in excess of the chapter provisions.
For both types of plans, the respective boards of trustees created at the local level are responsible for the day-to-day operational control of the individual trust funds and subject to regulatory oversight by the Division of Retirement.
Participating cities and special fire control districts are eligible to receive annual distributions of state premium tax collections on property and casualty insurance policies written within the city limits or special fire district boundaries of the participating plan. The amount of premium taxes collected under Chapter 175 is equal to 1.85 percent of all property insurance written within the city limits or special fire district boundaries of the participating plan. Chapter 185 collects a 0.85 percent tax on all casualty insurance premiums written within the city limits of the participating plan. The Department of Revenue collects these amounts from the state’s property and casualty insurers as reported on the DR-908 tax form and transfers them to the Police and Firefighters’ Premium Tax Trust Fund. These funds are then available for distribution to the participating pension plans on an annual basis, once the plan has demonstrated compliance with all applicable statutory requirements.
Additional sources of funding for these plans are provided by employee contributions, employer contributions, investment returns and other revenue sources. The city or special fire district sponsoring the pension plan is required to meet any contribution funding deficiency shown by the plan’s actuarial valuation.
The Division of Retirement also provides a local government annual report each year to the Legislature which details the activities, findings and recommendations concerning all local government sponsored retirement systems.
155

AUDITOR GENERAL
STATE OF FLORIDA
Claude Denson Pepper Building, Suite G74 111 West Madison Street
Tallahassee, Florida 32399-1450
The President of the Senate, the Speaker of the House of Representatives, and the Legislative Auditing Committee
INDEPENDENT AUDITOR’S REPORT ON INTERNAL CONTROL OVER FINANCIAL REPORTING AND ON COMPLIANCE AND OTHER MATTERS BASED ON AN
AUDIT OF FINANCIAL STATEMENTS PERFORMED IN ACCORDANCE WITH GOVERNMENT AUDITING STANDARDS
We have audited, in accordance with auditing standards generally accepted in the United States of
America and the standards applicable to financial audits contained in Government Auditing Standards
issued by the Comptroller General of the United States, the financial statements of the fiduciary funds,
governmental fund, and governmental activities of the Florida Retirement System Pension Plan and
Other State-Administered Systems (System) administered by the Florida Department of Management
Services, as of and for the fiscal year ended June 30, 2015, and the related notes to the financial
statements, which collectively comprise the System’s basic financial statements, and have issued our
report thereon dated February 25, 2016, included under the heading INDEPENDENT AUDITOR’S
REPORT. Our report includes a reference to other auditors who audited the investment assets and
investment income of the Florida Retirement System Defined Benefit Plan. This report does not
include the results of the other auditors’ testing of internal control over financial reporting or
compliance and other matters that are reported on separately by those auditors.
Internal Control over Financial Reporting
In planning and performing our audit of the financial statements, we considered the System’s internal
control over financial reporting (internal control) to determine the audit procedures that are
appropriate in the circumstances for the purpose of expressing our opinions on the financial
statements, but not for the purpose of expressing an opinion on the effectiveness of the System’s
internal control. Accordingly, we do not express an opinion on the effectiveness of the System’s
internal control.
A deficiency in internal control exists when the design or operation of a control does not allow
management or employees, in the normal course of performing their assigned functions, to prevent,
or detect and correct, misstatements on a timely basis. A material weakness is a deficiency, or
combination of deficiencies, in internal control such that there is a reasonable possibility that a
material misstatement of the entity’s financial statements will not be prevented, or detected and
corrected on a timely basis. A significant deficiency is a deficiency, or a combination of deficiencies,
Phone: (850) 412-2722 Fax: (850) 488-6975
Sherrill F. Norman, CPA Auditor General
156

in internal control that is less severe than a material weakness, yet important enough to merit attention
by those charged with governance.
Our consideration of internal control was for the limited purpose described in the first paragraph of
this section and was not designed to identify all deficiencies in internal control that might be material
weaknesses or significant deficiencies. Given these limitations, during our audit we did not identify
any deficiencies in internal control that we consider to be material weaknesses. However, material
weaknesses may exist that have not been identified.
Compliance and Other Matters
As part of obtaining reasonable assurance about whether the System’s financial statements are free
from material misstatement, we performed tests of its compliance with certain provisions of laws,
administrative rules, regulations, and contracts, noncompliance with which could have a direct and
material effect on the determination of financial statement amounts. However, providing an opinion
on compliance with those provisions was not an objective of our audit, and accordingly, we do not
express such an opinion. The results of our tests disclosed no instances of noncompliance or other
matters that are required to be reported under Government Auditing Standards.
Purpose of this Report
The purpose of the INDEPENDENT AUDITOR’S REPORT ON INTERNAL CONTROL OVER
FINANCIAL REPORTING AND ON COMPLIANCE AND OTHER MATTERS BASED ON AN AUDIT
OF FINANCIAL STATEMENTS PERFORMED IN ACCORDANCE WITH GOVERNMENT
AUDITING STANDARDS is solely to describe the scope of our testing of internal control and
compliance and the results of that testing, and not to provide an opinion on the effectiveness of the
System’s internal control or on compliance. This report is an integral part of an audit performed in
accordance with Government Auditing Standards in considering the System’s internal control and
compliance. Accordingly, this report is not suitable for any other purpose.
Respectfully submitted,
Sherrill F. Norman, CPA Tallahassee, Florida February 25, 2016 Audit Report No. 2016-097
157

NOTES
158

NOTES
159

NOTES
160

[Inside Back Cover]
