florida - flaglerlive · pdf filethe academic achievement ... n a rigorous curriculum that...
TRANSCRIPT

Florida
The CondiTion of
College & Career ReadinessClass of 2010

2 The Condition of College and Career Readiness: Class of 2010
Introduction The Condition of College & Career Readiness: Class of 2010
Our Unique Added Value
aCT is uniquely qualified to help states and school districts prepare more of their students for college and career.
aCT has been measuring the academic achievement of 11th- and 12th-grade students since 1959, their career aspirations since 1969, and their academic preparation in high school since 1985. aCT’s data system includes each of these areas for 8th and 10th graders and has been monitoring student readiness and success for nearly two decades. Moreover, since 1996 and every 3 to 5 years thereafter, most recently in 2009, aCT surveys thousands of high school and college educators to pinpoint the knowledge and skills needed for first-year college coursework. (see page 11.)
aCT is the only organization with decades of empirical data showing exactly what happens to high school graduates once they get to college or to work and how they can maximize success — based on their preparation from kinder -garten through high school.
These unique data sets are an invaluable resource as aCT works closely with states and school districts to transform the nation’s P–16 education system.
Readiness for college and career is the measure of educational excellence at the K–12 level. in an increasingly complex, diverse, and technology-driven world, simply earning a high school diploma is no longer enough. high school graduates must be prepared to succeed at the next level, whether they choose to attend college or begin a career. The goal of a high school education is clear: to prepare graduates for life after high school by teaching them the skills and knowledge that are essential to college and workforce training readiness.
despite encouraging progress, too many american students are not prepared for 21st-century opportunities.
aCT, a mission-driven not-for-profit organization, is helping national, state, and local leaders respond to this challenge. in the process, we are committed to sharing our expertise with policymakers and practitioners.
Working together, we envision a day soon when every american student will benefit from the following six policy recommendations, put forth in aCT’s report Making the Dream a Reality, which have been shown to be critical for college and career success.
n fewer — but essential — high school standards that are valued by colleges and employers;
n Common academic expectations recognizing the reality that students need a comparable level of knowledge and skills whether they’re going to college or work;
n Clear and consistent messages about what level of performance is “good enough” to demonstrate college and career readiness;
n a rigorous curriculum that guarantees both the right number and the right kinds of courses taught by well-qualified teachers;
n an early monitoring and intervention system that ensures younger students are on target to be ready for college and career; and
n a longitudinal data system that helps students stay on target by monitoring their performance from the early years through college.

3 The Condition of College and Career Readiness: Class of 2010
n 113,480 graduates took the aCT.
n 65 percent of graduates took the aCT.
n 39,941 10th-grade students took Plan®.
n 5,404 8th-grade students took eXPloRe®.
n There is no change in the 2010 florida aCT Composite score compared to the class of 2009.
State of college readiness in FloridaPercent of ACT-tested high school graduates meeting College Readiness Benchmarks, 2010
16
5434
43
20
3657
44
68
24
12
10
9
12
All four Benchmarks
Nation—all four
Benchmarks
English Mathematics Reading Science
Met Benchmark Within 2 points of Benchmark
Below Benchmark by 3+ points
Average ACT scores, 2010
19.5
18.6
19.720.1
19.1
21.0
Composite Nation—Composite
English Mathematics Reading Science
Florida Nation
State Facts: Class of 2010florida at a Glance
ACT’s College Readiness Benchmarks
The minimum aCT® test scores that indicate whether high school graduates are likely ready for entry-level college coursework are:
n english = 18
n Mathematics = 22
n Reading = 21
n science = 24
These Benchmarks reflect the level of preparation needed for students to have at least a 50 percent chance of achieving a grade of B or higher, or at least a 75 percent chance of a grade of C or higher, in entry-level credit-bearing college english Composition, algebra, social science, and Biology courses. (The maximum aCT score is 36.)
The results shown in this report reflect student performance based on aCT’s College Readiness Benchmarks, which may or may not be equal to your state’s college readiness indicators. aCT is available to help establish or review your state-set indicators.

4 The Condition of College and Career Readiness: Class of 2010
State Facts (continued)
florida at a Glance
five-year trends show the extent to which student performance has changed and whether more students in your state are getting the access and opportunity they need.
Trends in student performance in FloridaACT Composite scores, 2006–10
20.3
19.9 19.819.5 19.5
21.1 21.2 21.1 21.1 21.0
2006 2007 2008 2009 2010
Florida Nation
Level of participation in FloridaPercent of ACT-tested high school graduates by race/ethnicity, 2006–10
19 20 22 23 24
46 42 44 44
3 3
42
15 16 212119
3 3 3
2006 2007 2008 2009 2010
African American/Black
American Indian/Alaska Native
Caucasian American/White
Hispanic Asian American/Pacific Islander
Insufficient data available

5 The Condition of College and Career Readiness: Class of 2010
State Facts (continued)
florida at a Glance
n 78 percent of the graduates indicated an interest in obtaining a bachelor’s degree or higher.
n The most frequently listed majors are in health sciences & allied health fields.
n Twenty-four florida high school graduates earned a score of 36 on the aCT (perfect score).
n during 2009–10, the school district of Brevard County participated in aCT’s district Choice state Testing (dCsT), a program which allows a district to administer the aCT to all juniors during weekday testing. for 2010–11, Pinellas and Putnam school districts will participate in dCsT and Brevard will continue dCsT for the third year.
n in addition to dCsT, florida districts are increasingly utilizing the Multiple Registration Process for the aCT, which allows group registrations for national aCT test dates. Many are paying registrations for selected students as a part of their efforts to assist with students’ college and career readiness and high school graduation requirements. Miami-dade, Broward, Palm Beach, and sarasota are a few of the participating districts.
n alachua and Brevard school districts have created model academic and career advisement systems using their Plan student data; both participate in Plan under state funding.
n hillsborough school district is using QualityCore® as part of a Bill and Melinda Gates–funded research project. The Measure of effective Teaching Project (MeT) will help educators and policymakers identify and support teaching excellence by improving the quality of information available regarding teacher practice.
n aCT has done an alignment of aCT’s Course standards with florida’s next Generation sunshine state standards in english 10, U.s. history, Biology, Chemistry, Physics, algebra i, algebra ii, Geometry, and Precalculus. This alignment document provides districts and schools guidance toward using QualityCore Core Courses in the implementation of sections of sB 4. additionally, QualityCore aligns with the Common Core standards.
n The florida aCT state organization, consisting of educators from all sectors within florida, hosted two successful regional college and career readiness and success forums this year in the orlando and Tampa areas. additional regions will host these forums during 2010–11.
n The florida graduating class of 2010 sent 193,423 aCT scores to postsecondary institutions.

6 The Condition of College and Career Readiness: Class of 2010
This annual report from aCT provides a snapshot of the aCT-tested graduates in the class of 2010, focusing on their readiness for college and career.
aCT offers this report as a service to inform policymakers and practitioners about selected indicators of effectiveness. it is designed to stimulate discussion, inquiry, and action.
in interpreting and using the results, keep in mind that the number and percentage of students who took the aCT in your state determine how representative these findings are.
The report is organized around six questions that are driving national efforts to strengthen P–16 education.
n are your students prepared for college and career?
n do your standards reflect college and career readiness?
n are enough of your students taking core courses?
n are your core courses rigorous enough?
n are your younger students on target for college and career?
n are you collecting the right data to keep students on target for college and career?
Key Questions
7 The Condition of College and Career Readiness: Class of 2010
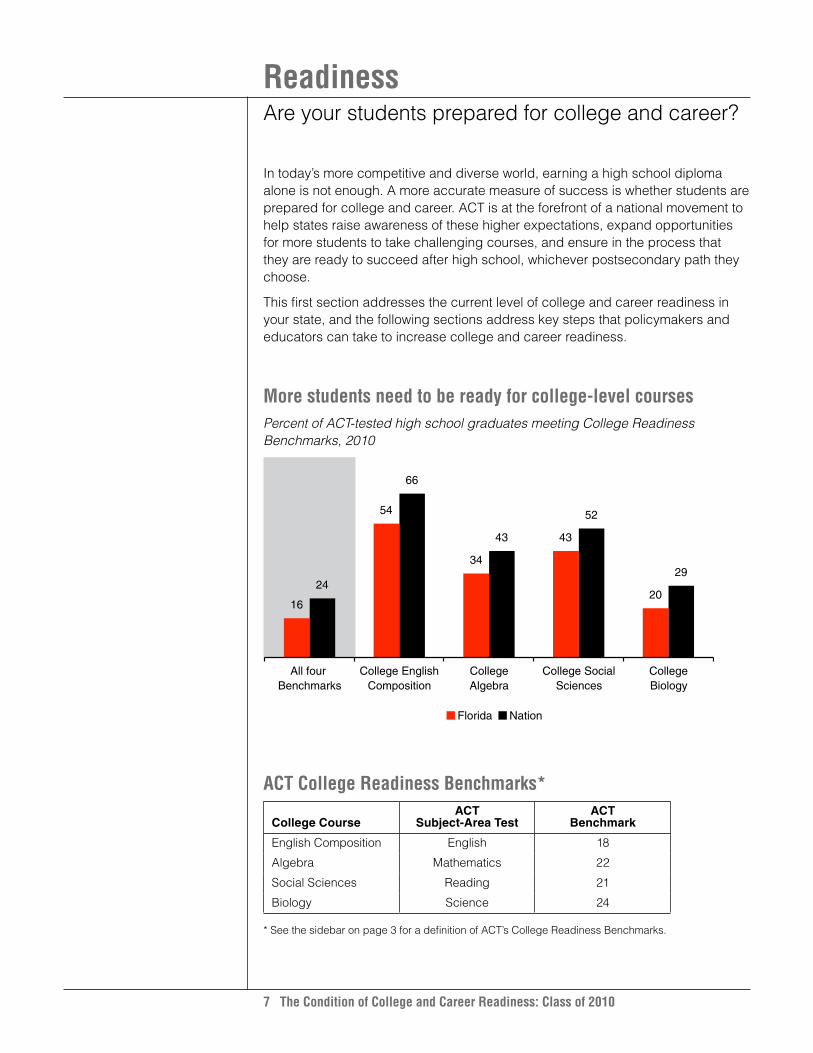
in today’s more competitive and diverse world, earning a high school diploma alone is not enough. a more accurate measure of success is whether students are prepared for college and career. aCT is at the forefront of a national movement to help states raise awareness of these higher expectations, expand opportunities for more students to take challenging courses, and ensure in the process that they are ready to succeed after high school, whichever postsecondary path they choose.
This first section addresses the current level of college and career readiness in your state, and the following sections address key steps that policymakers and educators can take to increase college and career readiness.
More students need to be ready for college-level coursesPercent of ACT-tested high school graduates meeting College Readiness Benchmarks, 2010
16
54
34
43
2024
66
43
52
29
All four Benchmarks
College EnglishComposition
CollegeAlgebra
College SocialSciences
CollegeBiology
Florida Nation
ACT College Readiness Benchmarks* College Course
ACT Subject-Area Test
ACT Benchmark
english Composition english 18
algebra Mathematics 22
social sciences Reading 21
Biology science 24
Readinessare your students prepared for college and career?
* see the sidebar on page 3 for a definition of aCT’s College Readiness Benchmarks.

8 The Condition of College and Career Readiness: Class of 2010
Readiness (continued)
are your students prepared for college and career?
ACT’s Role in the Common Core State Standards Initiative
aCT’s empirical, longitudinal data and commitment to the readiness of all students uniquely qualifies aCT as a valuable partner in — and advocate for — the Common Core state standards initiative.
aCT’s College Readiness standards™ (on which eXPloRe, Plan, and the aCT are based) and the aCT Course standards (on which QualityCore®, aCT’s instructional improvement and end-of-course assessment program, is based) align with the Common Core state standards. aCT data were among data used to develop the Common Core state standards, which are based on empirical research and reflect the goal of preparing students for readiness in credit-bearing college courses and in careers, consistent with international standards that promote high student performance.
Because of this, the alignment between aCT’s College Readiness standards and the Common Core state standards is strong. Visit www.act.org/commoncore for standard-by-standard comparisons, as well as more information regarding aCT’s relationship with the Common Core state standards initiative.
Some student groups are more prepared than others for …Percent of your ACT-tested high school graduates meeting College Readiness Benchmarks, 2010
… College English Composition
54
52
69
47
74
59
26
All students
Other/No response
Asian American/Pacific Islander
Hispanic
CaucasianAmerican/White
American Indian/Alaska Native
AfricanAmerican/Black
… College Algebra
34
34
60
28
49
34
11
All students
Other/No response
Asian American/Pacific Islander
Hispanic
CaucasianAmerican/White
American Indian/Alaska Native
AfricanAmerican/Black
9 The Condition of College and Career Readiness: Class of 2010
Readiness (continued)
are your students prepared for college and career?
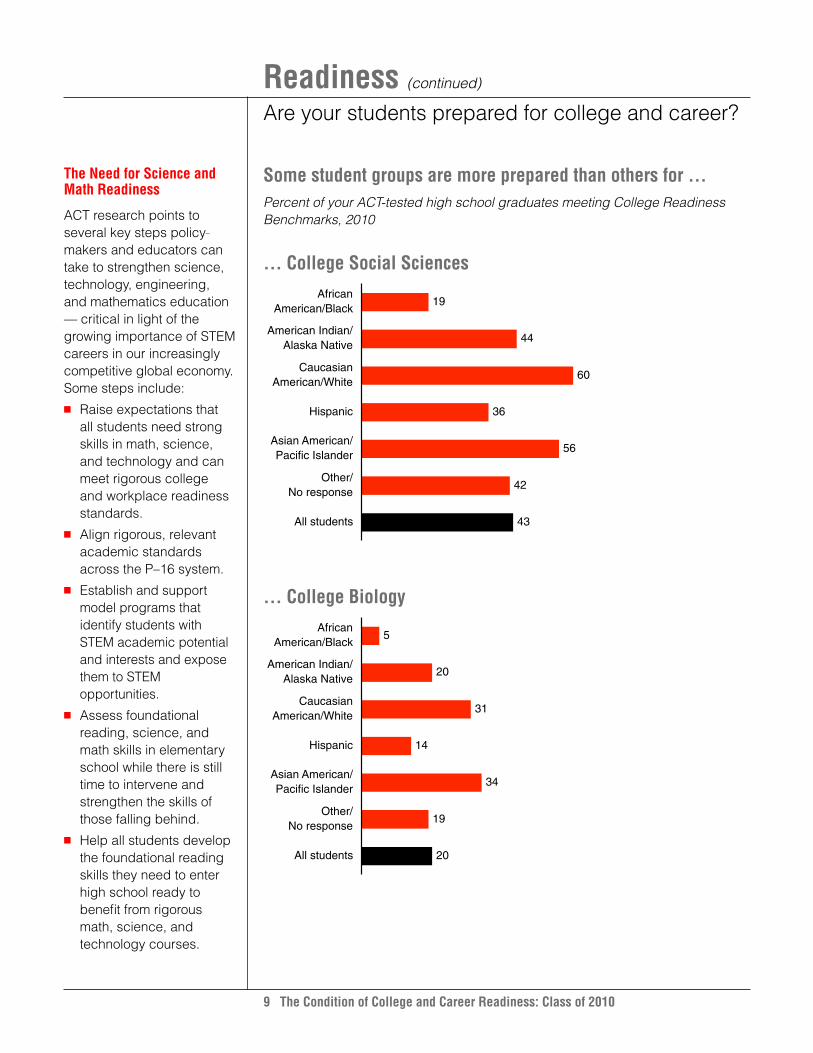
Some student groups are more prepared than others for …Percent of your ACT-tested high school graduates meeting College Readiness Benchmarks, 2010
… College Social Sciences
43
42
56
36
60
44
19
All students
Other/No response
Asian American/Pacific Islander
Hispanic
CaucasianAmerican/White
American Indian/Alaska Native
AfricanAmerican/Black
… College Biology
20
19
34
14
31
20
5
All students
Other/No response
Asian American/Pacific Islander
Hispanic
CaucasianAmerican/White
American Indian/Alaska Native
AfricanAmerican/Black
The Need for Science and Math Readiness
aCT research points to several key steps policy_
makers and educators can take to strengthen science, technology, engineering, and mathematics education — critical in light of the growing importance of sTeM careers in our increasingly competitive global economy. some steps include:
n Raise expectations that all students need strong skills in math, science, and technology and can meet rigorous college and workplace readiness standards.
n align rigorous, relevant academic standards across the P–16 system.
n establish and support model programs that identify students with sTeM academic potential and interests and expose them to sTeM opportunities.
n assess foundational reading, science, and math skills in elementary school while there is still time to intervene and strengthen the skills of those falling behind.
n help all students develop the foundational reading skills they need to enter high school ready to benefit from rigorous math, science, and technology courses.

10 The Condition of College and Career Readiness: Class of 2010
even more to the point from an economic development perspective, are students interested in and prepared for the projected high-growth jobs in your state?
Job openings and students’ interests don’t coincide1
Percent of projected annual job openings in high-growth fields in your state requiring a two-year college degree or more and 2010 ACT-tested graduates interested in those jobs
1211 11
109
2
6
9
34
Marketing/Sales
Education Management Computer/InformationSpecialties
CommunityServices
Job openings Career interest
Many students who are interested in these career areas fall short of meeting aCT’s College Readiness Benchmarks, suggesting that they are not on the right path to take advantage of career opportunities in these high-growth fields.
Preparation varies for careers in high-growth fields2
Percent of your 2010 ACT-tested graduates interested in high-growth careers meeting College Readiness Benchmarks, by subject
47
53
4751
56
3641
3641
47
2926 28
3732
14 14 14
2419
Marketing/Sales
Education Management Computer/InformationSpecialties
CommunityServices
English Reading Mathematics Science
Readiness (continued)
are your students prepared for college and career?

11 The Condition of College and Career Readiness: Class of 2010
Too often, high school students graduate to find that what they learned in high school has not truly prepared them for first-year courses in college or workforce training programs. states should adopt fewer — but essential — college and career readiness standards as their new high school graduation standards.
aCT’s research has identified essential standards — the aCT College Readiness standards — that reflect a range of knowledge and skills. The standards have been “backmapped” to K–8. and an independent, third-party international study has revealed a high degree of alignment and consistency between aCT’s College Readiness standards and the national frameworks and standards of two high-performing countries, singapore and finland.
in addition, aCT has identified the minimum aCT scores in each subject area — the aCT College Readiness Benchmarks — that indicate whether students are prepared for college and career (see page 3). These Benchmarks are based on the actual performance of college students in typical entry-level credit-bearing courses who have taken aCT’s assessments over the past few decades.
High School and College Educators DisagreePercent of high school content and skills considered important by educators
11
7
13
26
43
118
14
26
41
12 12
19
26
31
1Not important
2 3 4 5High importance
Middle school teachers High school teachers Postsecondary instructors
aCT’s 2009 national Curriculum survey shows a misalignment in the content and skills considered important by educators. Postsecondary instructors gave fewer skills the top rating of “high importance” than did middle school or high school teachers. Postsecondary instructors also viewed more content and skills as being of low importance. This pattern was consistent across all content areas, but was most prevalent in science.
Standardshow well do your state standards reflect college and career readiness?
How Does Your State Compare to ACT’s College Readiness Standards?
a full list of aCT’s College Readiness standards is available at www.act.org/standard. find out how your state compares by visiting www.act.org/education/statematch.
ACT National Curriculum Survey®
aCT conducts a one-of- a-kind survey every 3 to 5 years of thousands of secondary and postsecondary educators. The survey compares the knowledge and skills postsecondary institutions require of their entering students to what middle and high school teachers are teaching, and it details the gap between high school preparation and college expectations. states use the survey — which also discusses specific subject-area knowledge and skills — to align their standards and close expectation gaps. Visit www.act.org/research/curricsurvey.html to access results of the latest (2009) survey.

12 The Condition of College and Career Readiness: Class of 2010
Core Coursesare enough of your students taking core courses?
a growing number of states are raising their standards and, just as important, ensuring that their curriculum is aligned with these higher expectations. They are doing this to give more students access to the courses that aCT’s research shows better prepare them for college and career — preparation that results in consistent positive impacts on student performance.
Students who take a core curriculum or more perform better than students who do not Average scores of your ACT-tested high school graduates who took a core curriculum and those who did not, 2010
20.5
16.9
20.6
22.6
19.5
22.5
20.4
17.3
15.2
17.819.2
16.317.2
19.8
All students
AfricanAmerican/
Black
AmericanIndian/AlaskaNative
CaucasianAmerican/
White
Hispanic AsianAmerican/
PacificIslander
Other/No
response
Core or more Noncore
Core Curriculum
high school students should take, at a minimum, the number of courses recommended in A Nation at Risk, the national Commission on excellence in education’s research report. The report recommends four years of english and three years each of mathematics, science, and social studies.
a sample core mathematics course sequence includes algebra i, algebra ii, and Geometry. a sample core science course sequence includes Biology, Chemistry, and Physics. Many other course options and sequences are possible, but the key is whether the courses are based on high standards that prepare students for success after high school.
aCT research validates that college students who take a core curriculum in high school are more likely to meet the aCT College Readiness Benchmarks and, as a result, are more likely to:3
n earn a B or higher in first- year college courses.
n earn a first-year college GPa of 2.5 or higher.
n Persist to a second year at the same postsecondary institution.
n Progress toward a college degree.
n Complete a college degree.

13 The Condition of College and Career Readiness: Class of 2010
Course Rigorare your core courses rigorous enough?
Rigor at Risk
aCT’s 2007 research (Rigor at Risk) found that under current conditions, students do not have a reasonable chance of becoming ready for college unless they take additional higher-level courses beyond the minimum core. and even when students take substantial numbers of additional courses, no more than three-fourths of them are ready for first-year college coursework. This suggests that the quality and intensity — in other words, the rigor — of the high school curriculum need to be improved.
Taking the right kind of courses — rigorous courses — matters as much as, if not more than, taking the right number of courses. students taking high-level mathematics and science courses beyond the core curriculum are more prepared for college and career than those taking only the core curriculum or less.
Students taking math courses beyond the core curriculum are more prepared than their peersPercent of your ACT-tested high school graduates meeting or exceeding College Readiness Benchmarks in Mathematics, 2010
38
47
713
55
Less than core Core More than core
Florida Nation
14 The Condition of College and Career Readiness: Class of 2010
Course Rigor (continued)
are your core courses rigorous enough?
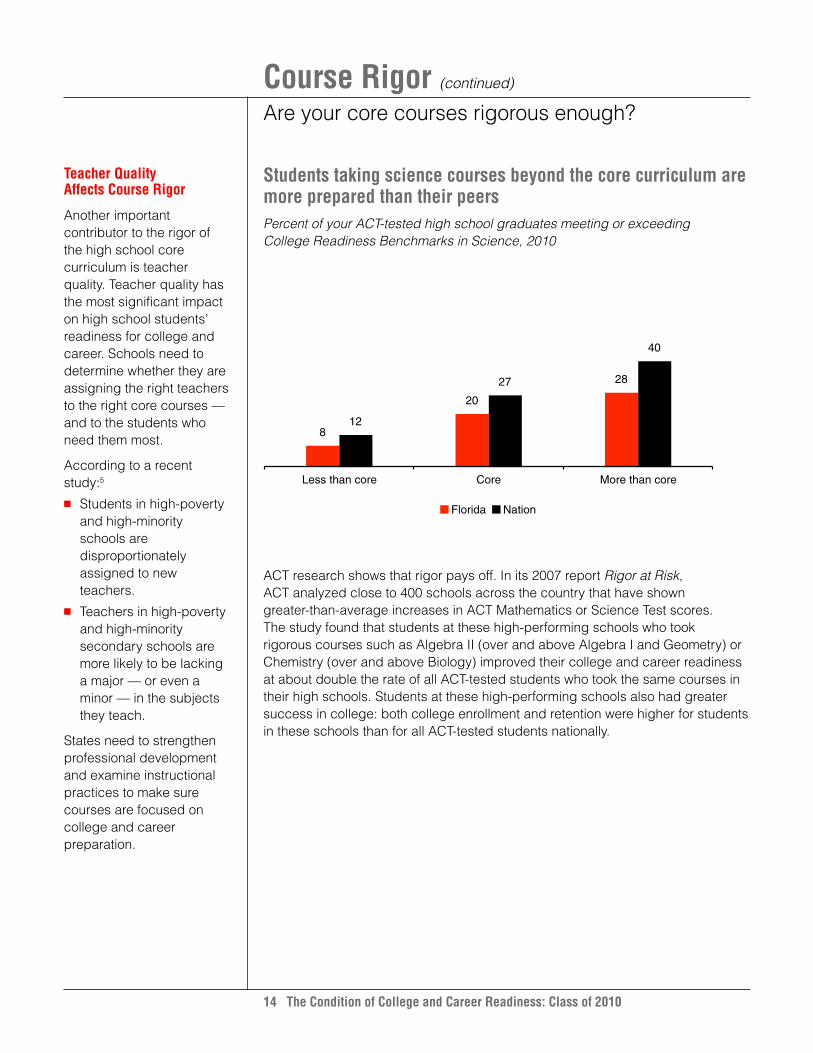
Teacher Quality Affects Course Rigor
another important contributor to the rigor of the high school core curriculum is teacher quality. Teacher quality has the most significant impact on high school students’ readiness for college and career. schools need to determine whether they are assigning the right teachers to the right core courses — and to the students who need them most.
according to a recent study:5
n students in high-poverty and high-minority schools are disproportionately assigned to new teachers.
n Teachers in high-poverty and high-minority secondary schools are more likely to be lacking a major — or even a minor — in the subjects they teach.
states need to strengthen professional development and examine instructional practices to make sure courses are focused on college and career preparation.
Students taking science courses beyond the core curriculum are more prepared than their peersPercent of your ACT-tested high school graduates meeting or exceeding College Readiness Benchmarks in Science, 2010
8
20
28
12
27
40
Less than core Core More than core
Florida Nation
aCT research shows that rigor pays off. in its 2007 report Rigor at Risk, aCT analyzed close to 400 schools across the country that have shown greater-than-average increases in aCT Mathematics or science Test scores. The study found that students at these high-performing schools who took rigorous courses such as algebra ii (over and above algebra i and Geometry) or Chemistry (over and above Biology) improved their college and career readiness at about double the rate of all aCT-tested students who took the same courses in their high schools. students at these high-performing schools also had greater success in college: both college enrollment and retention were higher for students in these schools than for all aCT-tested students nationally.

15 The Condition of College and Career Readiness: Class of 2010
Early Preparationare your younger students on target for college and career?
Early Exposure
early exposure to rigorous core courses can help ensure that students are on target for college and career.
aCT research shows that using solutions such as eXPloRe (for 8th and 9th graders) and Plan (for 10th graders) results in better performance on the aCT and also:6
n increases educational achievement.
n encourages students to take more college-preparatory courses in high school.
n increases students’ readiness for college.
n Promotes educational and career planning.
n Promotes college enrollment, persistence, and achievement.
high school is too late to learn whether your students are on — or off — target for college and career. We know from our research that younger students who take rigorous curricula are much better prepared to graduate from high school ready for college and career. Moreover, recent aCT research (The Forgotten Middle, 2008) found that “the level of academic achievement that students attain by 8th grade has a larger impact on their college and career readiness by the time they graduate from high school than anything that happens academically in high school.”
That’s why aCT is working closely with states to raise parent and student awareness about the importance of the middle grades, to begin monitoring student progress in middle school to make sure younger students are on target for college and career, and to help teachers intervene in more timely ways.
nationally, 13 percent of students met all four eXPloRe Benchmarks in 2009–10 and 17 percent met all four Plan Benchmarks in 2009–10.
Early preparation is essential to college and career readiness and success
17
73
4353
20
17
31 29
6318
26
15
12
All fourBenchmarks
English Mathematics Reading Science
Met Benchmark Within 2 points of Benchmark
Below Benchmark by 3+ points
16
72
3650
21
20
25
14
4329
54
21
14
All fourBenchmarks
English Mathematics Reading Science
Met Benchmark Within 2 points of Benchmark
Below Benchmark by 3+ points
Percent of your 8th graders on target to meet College Readiness Benchmarks, 2009–10
Percent of your 10th graders on target to meet College Readiness Benchmarks, 2009–10

16 The Condition of College and Career Readiness: Class of 2010
Data-Driven Educationare you collecting the right data to keep students on target for college and career?
if states are serious about ensuring that more of their students are prepared for college and career in the 21st century, they must establish longitudinal P–16 data systems to closely monitor student performance at every stage of the learning pipeline from preschool through the elementary, middle, and high school grades and all the way through college and into the workforce.
That’s why aCT supports and is engaged in the data Quality Campaign (dQC), a national collaborative effort to improve the collection, availability, and use of high-quality education data to boost student achievement. in its 2009–10 annual survey, the dQC identified 10 essential elements for building a longitudinal data system (see list at left). it is also working with states to ensure that all policymakers, educators, parents, and others have access to this information and know how to use it (www.dataqualitycampaign.org). in addition, aCT is available to help make the most out of aCT’s state data and explore how to use it as a vehicle for improving students’ college and career readiness.
Florida has 10 of the 10 essential data elements7*
WA
OR
TN
KY
VT ME
FL
AL
KS
OKSC
NC
VAWV
PA
NY
OHIN
MI
WI
IL
MS
LA
AR
MO
IA
HI
AK
TX
NM
GA
ID
MT ND
SD
NE
MN
CO
AZ
WY
UTNV
CA
NHMA
RICT
MDDENJ
DC
1–3 elements4–5 elements6–7 elements8–9 elements 10 elements
PR
10 Essential Elements of a State Longitudinal Data System 1. statewide student
identifier (50 states have this element)*
2. student-level enrollment data (51 states)
3. student-level test data (50 states)
4. information on untested students (47 states)
5. statewide teacher identifier with a teacher-student match (24 states)
6. student-level course completion (transcript) data (23 states)
7. student-level saT, aCT, and aP exam data (36 states)
8. student-level graduation and dropout data (51 states)
9. ability to match student-level P–12 and higher education data (33 states)
10. state data audit system (51 states)
* data include the 50 states, district of Columbia, and Puerto Rico.
17 The Condition of College and Career Readiness: Class of 2010
Notes
n Please visit www.act.org/crr/2010 for additional information, interactive charts, and a listing of other state and national data.
n aCT offers professional development opportunities through aCT’s annual College and Career Readiness Workshops. locations can be found by visiting www.act.org/ccrw.
n eXPloRe® is a curriculum-based educational and career planning program that measures achievement in english, math, reading, and science. as an early indicator of college readiness, eXPloRe gives educators the means to structure high school planning and career exploration for students and parents.
n Plan® is a curriculum-based educational and career planning program that measures achievement in english, math, reading, and science. Plan is designed to help 10th graders build rigorous high school course plans and identify areas of academic need so they can stay on target for college and work success.
n aCT conducted a study to correlate Plan scores with aP® success. The study can be found at www.act.org/research/policymakers/pdf/UsingPlan.pdf.
n QualityCore® is a research-driven solution used to raise the quality and intensity of high school core courses. featuring six components to support academic curriculum — rigorous aCT Course standards, instructional resources, formative item pools, end-of-course assessments, progress monitoring, and professional development — QualityCore allows educators, administrators, and policymakers to focus on fewer, clearer, and higher course standards essential for college and career readiness.
n The aCT® is a curriculum-based educational and career planning tool that assesses mastery of state and college readiness standards. The aCT is accepted by all four-year colleges and universities nationwide.
n CoMPass® is a computer-adaptive assessment program that allows postsecondary educators to evaluate students’ skill levels, place them in appropriate courses, and provide the support needed to achieve academic success. CoMPass features diagnostic and placement tests in reading, writing skills, writing essay, mathematics, and english as a second language (esl).
n aCT has developed College Readiness Benchmarks for the CoMPass program, which is scored on a 1–99 scale, and produces entering student descriptive Reports for the nation and specific states and systems each year. The reports can be found at www.act.org/compass/reports/research.html.
18 The Condition of College and Career Readiness: Class of 2010
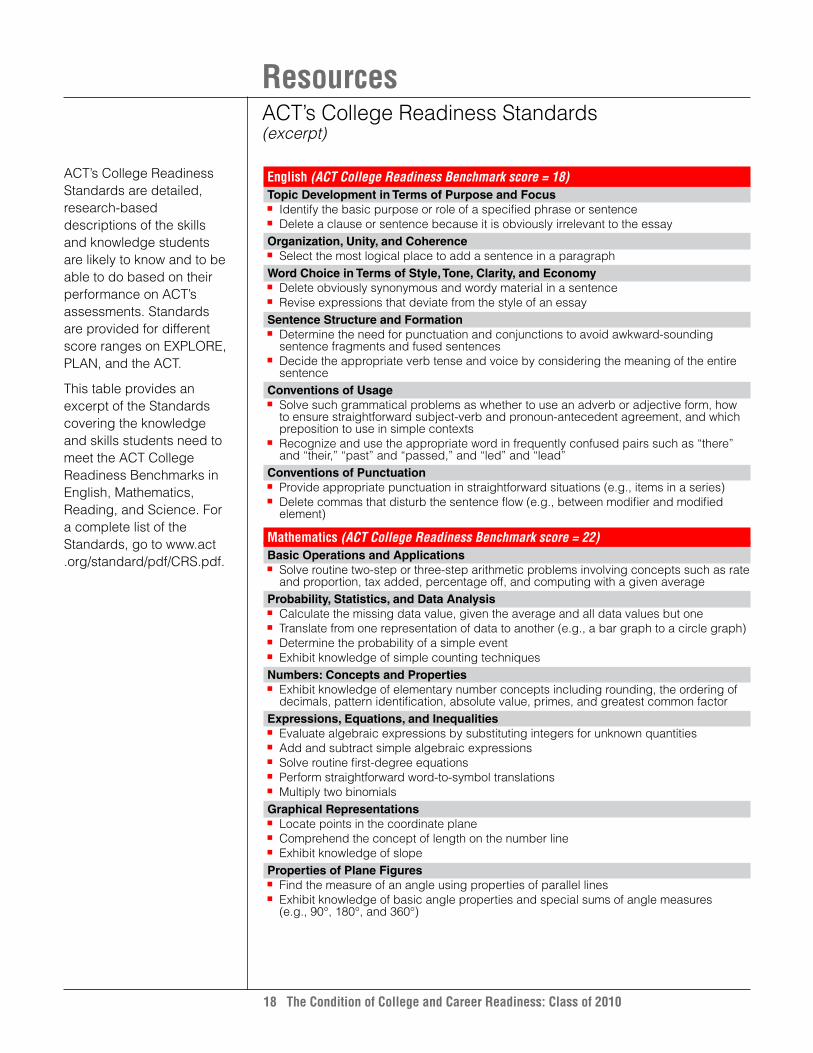
Resources aCT’s College Readiness standards(excerpt)
English (ACT College Readiness Benchmark score = 18)Topic Development in Terms of Purpose and Focusn identify the basic purpose or role of a specified phrase or sentencen delete a clause or sentence because it is obviously irrelevant to the essayOrganization, Unity, and Coherencen select the most logical place to add a sentence in a paragraphWord Choice in Terms of Style, Tone, Clarity, and Economyn delete obviously synonymous and wordy material in a sentencen Revise expressions that deviate from the style of an essaySentence Structure and Formationn determine the need for punctuation and conjunctions to avoid awkward-sounding
sentence fragments and fused sentencesn decide the appropriate verb tense and voice by considering the meaning of the entire
sentenceConventions of Usagen solve such grammatical problems as whether to use an adverb or adjective form, how
to ensure straightforward subject-verb and pronoun-antecedent agreement, and which preposition to use in simple contexts
n Recognize and use the appropriate word in frequently confused pairs such as “there” and “their,” “past” and “passed,” and “led” and “lead”
Conventions of Punctuationn Provide appropriate punctuation in straightforward situations (e.g., items in a series)n delete commas that disturb the sentence flow (e.g., between modifier and modified
element)
Mathematics (ACT College Readiness Benchmark score = 22)Basic Operations and Applicationsn solve routine two-step or three-step arithmetic problems involving concepts such as rate
and proportion, tax added, percentage off, and computing with a given averageProbability, Statistics, and Data Analysisn Calculate the missing data value, given the average and all data values but onen Translate from one representation of data to another (e.g., a bar graph to a circle graph)n determine the probability of a simple eventn exhibit knowledge of simple counting techniquesNumbers: Concepts and Propertiesn exhibit knowledge of elementary number concepts including rounding, the ordering of
decimals, pattern identification, absolute value, primes, and greatest common factorExpressions, Equations, and Inequalitiesn evaluate algebraic expressions by substituting integers for unknown quantitiesn add and subtract simple algebraic expressionsn solve routine first-degree equationsn Perform straightforward word-to-symbol translationsn Multiply two binomialsGraphical Representationsn locate points in the coordinate planen Comprehend the concept of length on the number linen exhibit knowledge of slopeProperties of Plane Figuresn find the measure of an angle using properties of parallel linesn exhibit knowledge of basic angle properties and special sums of angle measures
(e.g., 90°, 180°, and 360°)
aCT’s College Readiness standards are detailed, research-based descriptions of the skills and knowledge students are likely to know and to be able to do based on their performance on aCT’s assessments. standards are provided for different score ranges on eXPloRe, Plan, and the aCT.
This table provides an excerpt of the standards covering the knowledge and skills students need to meet the aCT College Readiness Benchmarks in english, Mathematics, Reading, and science. for a complete list of the standards, go to www.act .org/standard/pdf/CRs.pdf.

19 The Condition of College and Career Readiness: Class of 2010
Resources (continued)
aCT’s College Readiness standards
Measurementn Compute the area and perimeter of triangles and rectangles in simple problemsn Use geometric formulas when all necessary information is givenFunctionsn evaluate quadratic functions, expressed in function notation, at integer values
Reading (ACT College Readiness Benchmark score = 21)Main Ideas and Author’s Approachn infer the main idea or purpose of straightforward paragraphs in uncomplicated literary
narrativesn Understand the overall approach taken by an author or narrator (e.g., point of view,
kinds of evidence used) in uncomplicated passagesSupporting Detailsn locate important details in uncomplicated passagesn Make simple inferences about how details are used in passagesSequential, Comparative, and Cause-Effect Relationshipsn order simple sequences of events in uncomplicated literary narrativesn identify clear relationships between people, ideas, and so on in uncomplicated
passagesn identify clear cause-effect relationships in uncomplicated passagesMeanings of Wordsn Use context to determine the appropriate meaning of some figurative and nonfigurative
words, phrases, and statements in uncomplicated passagesGeneralizations and Conclusionsn draw generalizations and conclusions about people, ideas, and so on in uncomplicated
passagesn draw simple generalizations and conclusions using details that support the main points
of more challenging passages
Science (ACT College Readiness Benchmark score = 24)Interpretation of Datan Compare or combine data from two or more simple data presentations (e.g., categorize
data from a table using a scale from another table)n Compare or combine data from a complex data presentationn interpolate between data points in a table or graphn determine how the value of one variable changes as the value of another variable
changes in a complex data presentationn identify and/or use a simple (e.g., linear) mathematical relationship between datan analyze given information when presented with new, simple informationScientific Investigationn Understand the methods and tools used in a complex experimentn Understand a complex experimental designn Predict the results of an additional trial or measurement in an experimentn determine the experimental conditions that would produce specified resultsEvaluation of Models, Inferences, and Experimental Resultsn select a simple hypothesis, prediction, or conclusion that is supported by two or more
data presentations or modelsn determine whether given information supports or contradicts a simple hypothesis or
conclusion and whyn identify strengths and weaknesses in one or more modelsn identify similarities and differences between modelsn determine which model(s) is(are) supported or weakened by new informationn select a data presentation or a model that supports or contradicts a hypothesis,
prediction, or conclusion

20 The Condition of College and Career Readiness: Class of 2010
Resources (continued) average state aCT scores and Percent of high school Graduates Tested, 2010
This table provides a list by state of the averages and percentages of graduates who took the aCT in 2010. in providing this table, aCT does not advocate ranking the various states’ educational systems. in most states, students who take the aCT are self-selected and do not represent the state’s entire student population.
further, the percentages of students who take the aCT vary significantly by state, as do the backgrounds and characteristics of those students. Many factors — among them, motivation, the desire to learn, parental support, the quality of teaching received, socioeconomic status, and extracurricular experiences — contribute to individual and group student achievement. however, aCT research has shown a core college-preparatory program to be a significant precondition to success both on the aCT and in postsecondary studies.
State
Percent of graduates
tested*
Average Composite
score
Average English score
Average Math score
Average Reading
score
Average Science
score
Alabama 78 20.3 20.4 19.5 20.7 20.2
Alaska 28 21.1 20.3 21.2 21.7 20.9
Arizona 28 20.0 18.9 20.4 20.2 19.9
Arkansas 81 20.3 20.1 19.9 20.6 20.2
California 22 22.2 21.7 22.9 22.3 21.5
Colorado 100 20.6 19.9 20.4 21.1 20.7
Connecticut 24 23.7 23.8 23.5 23.9 22.9
Delaware 13 23.0 22.8 22.7 23.4 22.5
District of Columbia 29 19.8 19.5 19.9 20.2 19.2
Florida 65 19.5 18.6 19.7 20.1 19.1
Georgia 44 20.7 20.1 20.7 20.9 20.5
Hawaii 22 21.6 20.9 22.2 21.5 21.2
Idaho 60 21.8 21.2 21.4 22.4 21.6
Illinois 100 20.7 20.3 20.7 20.8 20.5
Indiana 26 22.3 21.7 22.4 22.6 21.9
Iowa 60 22.2 21.8 21.8 22.6 22.3
Kansas 75 22.0 21.4 21.7 22.3 21.9
Kentucky 100 19.4 18.9 19.1 19.7 19.5
Louisiana 98 20.1 20.1 19.6 20.2 20.2
Maine 10 23.2 23.2 23.0 23.6 22.5
Maryland 18 22.3 22.0 22.3 22.4 21.8
Massachusetts 21 24.0 24.0 24.3 24.2 23.1
Michigan 100 19.7 18.9 19.7 19.7 19.9
Minnesota 70 22.9 22.3 22.9 23.2 22.8
Mississippi 96 18.8 18.6 18.3 18.8 18.8
Missouri 69 21.6 21.5 21.0 22.0 21.6
Montana 58 22.0 21.3 21.7 22.7 21.9
Nebraska 73 22.1 21.8 21.6 22.4 22.0

21 The Condition of College and Career Readiness: Class of 2010
Resources (continued)
average state aCT scores and Percent of high school Graduates Tested, 2010
State
Percent of graduates
tested*
Average Composite
score
Average English score
Average Math score
Average Reading
score
Average Science
score
Nevada 30 21.5 20.8 21.5 22.0 21.3
New Hampshire 17 23.7 23.6 23.5 24.1 22.9
New Jersey 17 23.2 23.1 23.6 23.2 22.4
New Mexico 66 20.1 19.3 19.7 20.5 20.2
New York 27 23.3 22.7 23.6 23.3 23.1
North Carolina 16 21.9 21.1 22.3 22.2 21.6
North Dakota 81 21.5 20.7 21.4 21.7 21.6
Ohio 66 21.8 21.2 21.5 22.1 21.8
Oklahoma 73 20.7 20.4 19.9 21.2 20.6
Oregon 34 21.5 20.5 21.5 22.0 21.3
Pennsylvania 17 21.9 21.3 22.1 22.1 21.4
Rhode Island 11 22.8 22.8 22.4 23.3 22.0
South Carolina 52 20.0 19.2 20.1 20.0 20.0
South Dakota 79 21.8 21.1 21.6 22.0 21.9
Tennessee 100 19.6 19.4 19.0 19.9 19.6
Texas 33 20.8 19.7 21.4 20.8 20.9
Utah 71 21.8 21.4 21.1 22.5 21.7
Vermont 26 23.2 22.8 22.8 23.7 22.8
Virginia 22 22.3 22.0 22.1 22.5 21.9
Washington 19 23.0 22.6 23.1 23.5 22.5
West Virginia 64 20.7 20.7 19.6 21.3 20.6
Wisconsin 69 22.1 21.5 22.0 22.3 22.2
Wyoming 100 20.0 19.0 19.8 20.4 20.1
National 47 21.0 20.5 21.0 21.3 20.9
* Totals for graduating seniors were obtained from Knocking at the College Door: Projections of High School Graduates by State and Race/Ethnicity, 1992 to 2022, 7th edition. © March 2008 by the Western interstate Commission for higher education.
22 The Condition of College and Career Readiness: Class of 2010
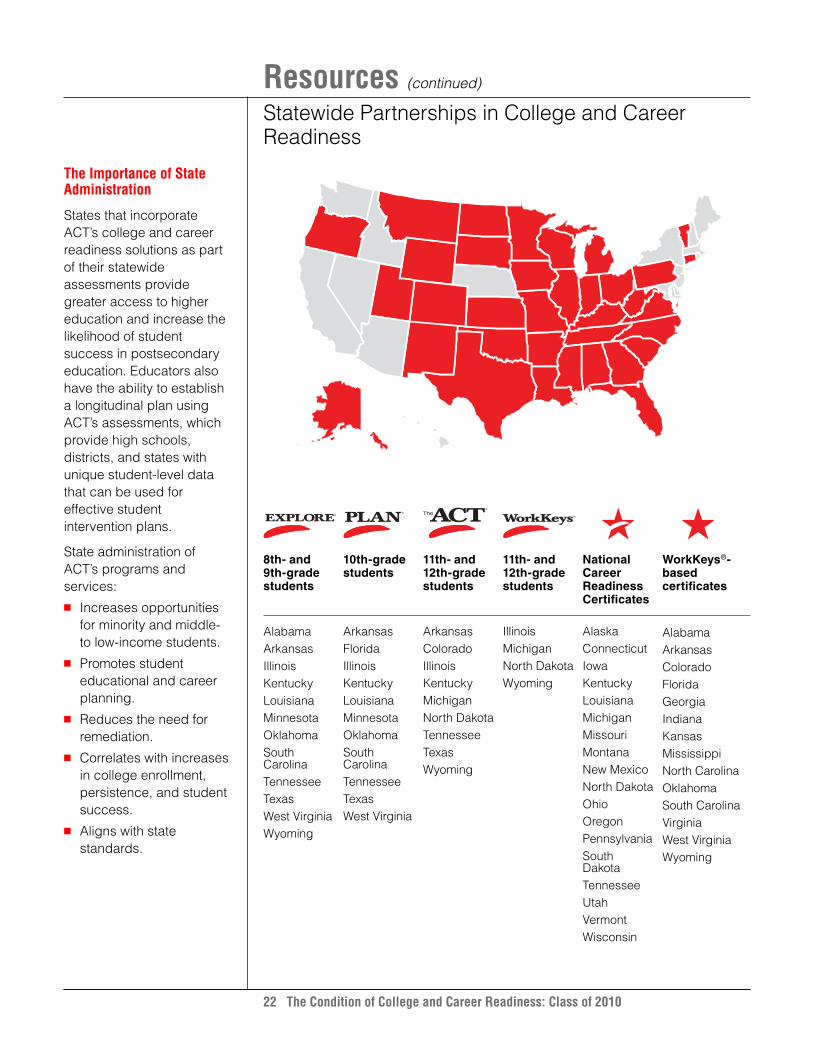
The Importance of State Administration
states that incorporate aCT’s college and career readiness solutions as part of their statewide assessments provide greater access to higher education and increase the likelihood of student success in postsecondary education. educators also have the ability to establish a longitudinal plan using aCT’s assessments, which provide high schools, districts, and states with unique student-level data that can be used for effective student intervention plans.
state administration of aCT’s programs and services:
n increases opportunities for minority and middle- to low-income students.
n Promotes student educational and career planning.
n Reduces the need for remediation.
n Correlates with increases in college enrollment, persistence, and student success.
n aligns with state standards.
8th- and 9th-grade students
10th-grade students
11th- and 12th-grade students
11th- and 12th-grade students
National Career Readiness Certificates
WorkKeys®-based certificates
alabamaarkansasillinoisKentuckylouisianaMinnesotaoklahomasouth CarolinaTennesseeTexasWest VirginiaWyoming
arkansasfloridaillinoisKentuckylouisianaMinnesotaoklahomasouth CarolinaTennesseeTexasWest Virginia
arkansas ColoradoillinoisKentuckyMichigannorth dakotaTennesseeTexasWyoming
illinoisMichigannorth dakotaWyoming
alaskaConnecticutiowaKentuckylouisianaMichiganMissouriMontananew Mexiconorth dakotaohiooregonPennsylvaniasouth dakotaTennesseeUtahVermontWisconsin
alabamaarkansasColoradofloridaGeorgiaindianaKansasMississippinorth Carolina oklahomasouth CarolinaVirginiaWest VirginiaWyoming
Resources (continued) statewide Partnerships in College and Career Readiness
23 The Condition of College and Career Readiness: Class of 2010
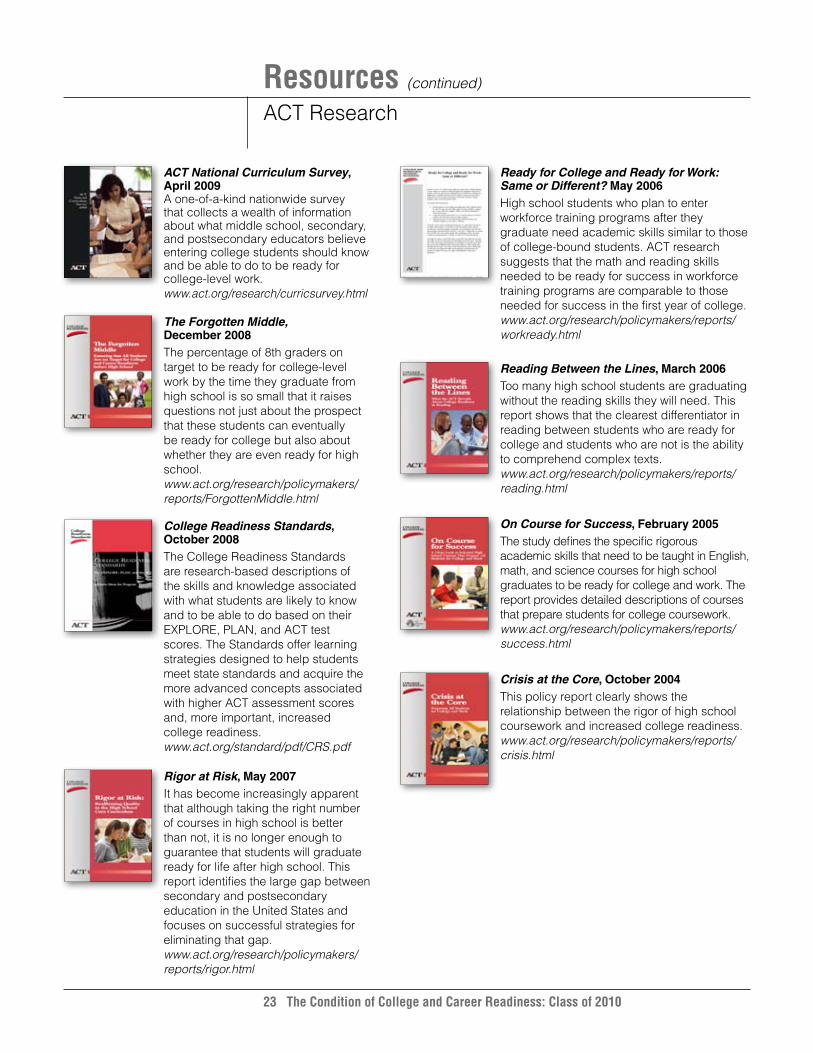
ACT National Curriculum Survey, April 2009 a one-of-a-kind nationwide survey that collects a wealth of information about what middle school, secondary, and postsecondary educators believe entering college students should know and be able to do to be ready for college-level work. www.act.org/research/curricsurvey.html
The Forgotten Middle, December 2008The percentage of 8th graders on target to be ready for college-level work by the time they graduate from high school is so small that it raises questions not just about the prospect that these students can eventually be ready for college but also about whether they are even ready for high school. www.act.org/research/policymakers/reports/ForgottenMiddle.html
College Readiness Standards, October 2008The College Readiness standards are research-based descriptions of the skills and knowledge associated with what students are likely to know and to be able to do based on their eXPloRe, Plan, and aCT test scores. The standards offer learning strategies designed to help students meet state standards and acquire the more advanced concepts associated with higher aCT assessment scores and, more important, increased college readiness. www.act.org/standard/pdf/CRS.pdf
Rigor at Risk, May 2007it has become increasingly apparent that although taking the right number of courses in high school is better than not, it is no longer enough to guarantee that students will graduate ready for life after high school. This report identifies the large gap between secondary and postsecondary education in the United states and focuses on successful strategies for eliminating that gap. www.act.org/research/policymakers/reports/rigor.html
Resources (continued)
aCT Research
Ready for College and Ready for Work: Same or Different? May 2006high school students who plan to enter workforce training programs after they graduate need academic skills similar to those of college-bound students. aCT research suggests that the math and reading skills needed to be ready for success in workforce training programs are comparable to those needed for success in the first year of college. www.act.org/research/policymakers/reports/workready.html
Reading Between the Lines, March 2006Too many high school students are graduating without the reading skills they will need. This report shows that the clearest differentiator in reading between students who are ready for college and students who are not is the ability to comprehend complex texts. www.act.org/research/policymakers/reports/reading.html
On Course for Success, February 2005The study defines the specific rigorous academic skills that need to be taught in english, math, and science courses for high school graduates to be ready for college and work. The report provides detailed descriptions of courses that prepare students for college coursework. www.act.org/research/policymakers/reports/success.html
Crisis at the Core, October 2004This policy report clearly shows the relationship between the rigor of high school coursework and increased college readiness. www.act.org/research/policymakers/reports/crisis.html

24 The Condition of College and Career Readiness: Class of 2010
Endnotes
1. state long-term occupational projections for 2008-2016 (based on job growth and job replacement provided by florida agency for Workforce innovation). Career interests and achievement results based on 2010 aCT-tested florida students (n = 76,700) with valid career information and subject scores. example occupations of state high-growth career fields are Marketing/sales (insurance agents, buyers, etc.); education (secondary teachers, administrators, etc.); Management (convention planners, hotel/restaurant managers, etc.); Computer/information specialties (computer programmers, database administrators, etc.); Community services (social workers, school counselors, etc.).
2. ibid.
3. aCT (2006). ACT’s College Readiness System: Meeting the Challenge of a Changing World. iowa City, ia: author.
4. aCT (2006). Reading Between the Lines: What the ACT Reveals About College Readiness in Reading. iowa City, ia: author.
5. Peske, h. G., & haycock, K. (2006). Teaching Inequality: How Poor and Minority Students Are Shortchanged on Teacher Quality. Washington, dC: The education Trust.
6. aCT (2006). EPAS: A System that Works. iowa City, ia: author.
7. data Quality Campaign, www.dataqualitycampaign.org.

ACT National and Field Offices
ACT National Office500 aCT driveP.o. Box 168iowa City, ia 52243-0168 Telephone: 319/337-1000
West RegionDenver Office3131 s. Vaughn Way, suite 218 aurora, Co 80014-3507Telephone: 303/337-3273
Sacramento Office2880 sunrise Boulevard, suite 214 Rancho Cordova, Ca 95742-6103 Telephone: 916/631-9200
Midwest RegionChicago Office300 Knightsbridge Parkway suite 300 lincolnshire, il 60069-9498 Telephone: 847/634-2560
Columbus Office700 Taylor Road, suite 210 Gahanna, oh 43230-3318Telephone: 614/470-9828
Lansing Office1001 Centennial Way, suite 400 lansing, Mi 48917-8249Telephone: 517/327-5919
Southwest RegionAustin Office8701 n. MoPac expressway suite 200austin, TX 78759-8364 Telephone: 512/345-1949
Northeast RegionBoston Office144 Turnpike Road, suite 370southborough, Ma 01772–2121Telephone: 508/229-0111
Southeast RegionAtlanta Office3355 lenox Rd. n.e., suite 320 atlanta, Ga 30326-1332 Telephone: 404/231-1952
Tallahassee Office1315 e. lafayette st., suite a Tallahassee, fl 32301-4757 Telephone: 850/878-2729
© 2010 by ACT, Inc. All rights reserved.14515