florida department of transportation location hydraulic report malabar road (sr 514) pd&e study...
TRANSCRIPT

www.dot.state.fl.us
Florida Department of
TRANSPORTATION
Location Hydraulic Report Malabar Road (SR 514) PD&E Study
From East of Babcock Street (SR 507) to US 1 Brevard County, Florida
FPID: 430136‐1‐22‐01
ETDM: 13026
The environmental review, consultation, and other actions required by applicable federal environmental laws for this project are being, or have been, carried out by the Florida Department of Transportation (FDOT) pursuant to 23 U.S.C. §327 and a Memorandum of Understanding (MOU) dated December 14, 2016 and executed by the Federal Highway Administration and FDOT.
December 2014
Updated December 2017

www.dot.state.fl.us
Florida Department of
TRANSPORTATION
Location Hydraulic Report Malabar Road (SR 514) PD&E Study
From East of Babcock Street (SR 507) to US 1 Brevard County, Florida
FPID: 430136‐1‐22‐01
ETDM: 13026
December 2014
Updated December 2017
Prepared By
ATKINS 482 South Keller Road
Orlando, Florida 32810

Page i
TABLE OF CONTENTS
Page #
EXECUTIVE SUMMARY ii
1. PROJECT DESCRIPTION 1
2. EXISTING DRAINAGE CONDITIONS 1
2.1.1. CROSSDRAINS 6
2.1.2. FLOODPLAINS 8
3. FUTURE DRAINAGE CONDITIONS 8
4. CONCLUSION 9
Tables
Table 1 – Existing Crossdrains
Table 2 – Existing Crossdrains Parameters
Table 3 – Proposed Crossdrains
Figures
Figure 1 Location Map
Figure 2 Aerial Exhibit
Figure 3 Existing Crossdrains
Figure 4 Offsite Drainage Basins
Figure 5 Detail of Culvert Extensions Constructed in 1998
APPENDIX A FEMA MAPS AND FIS
APPENDIX B PRELIMINARY SIZING OF PROPOSED CROSSDRAINS
APPENDIX C STRAIGHT LINE DIAGRAM & RIGHT-OF-WAY MAP

Page ii
EXECUTIVE SUMMARY
The Florida Department of Transportation (FDOT) District Five is conducting a Project Development and
Environment (PD&E) Study to consider alternatives for widening State Road 514 (Malabar Road). The PD&E
Study considers the social, economic, and environmental impacts of the roadway improvements as required
by Federal Highway Administration (FHWA) and FDOT’s PD&E Manual. SR 514 is an east-west, two-lane
roadway and is classified as an urban minor arterial. The project study limits extend from east of Babcock
Street in the City of Palm Bay to US 1 in the Town of Malabar. The project is 3.7 miles long and is located in
Brevard County within the jurisdiction of St. Johns River Water Management District (SJRWMD).
The purpose of this Location Hydraulic Report (LHR) is to address base floodplain encroachments resulting
from the roadway improvements. The report has been prepared in accordance with FDOT’s PD&E Manual,
Part 2, Chapter 24 including the Minimal Encroachment Checklist for the Federal Emergency Management
Agency (FEMA) Maps. This analysis ensures that all base floodplains are identified and provides
recommendations regarding minimization and elimination of floodplain impacts. As a result of this process, a
preliminary determination of impact is made as to the level of significance of the encroachment.
There are 5 crossdrain locations along the project limits within the 100-year (base) floodplain. The widened
roadway, with extended or replaced cross drains, will result in transverse impacts with minimal floodplain
encroachments. This project will not result in any new or increased adverse environmental impacts. There
will not be a significant change in the potential interruption or termination of emergency service or
emergency evacuation routes. The FDOT drainage design standards as well as the SJRWMD procedures will
be applied during the design phase to prevent increasing flood elevations or changing floodplain limits.
Typical for a roadway that traverses the floodplain, any potential impacts will be mitigated by the increased
capacity of the cross culverts with no rise in the flood stages and with the storage capacity gained by the
construction of new treatment ponds where no storage exists today.
It should be noted that all elevations discussed in this document are in reference to North America
Vertical Datum 1988 (NAVD’88). The conversion between NAVD’88 and National Geodetic Vertical
Datum 1929 (NGVD’29) at this location is NGVD’29 is equal to NAVD’88 plus 1.38 feet. For example,
elevation 20 in this report is equal to elevation 21.38 NGVD’29.

Location Hydraulics Report, SR 514 / Malabar Road Page 1
1.0 PROJECT DESCRIPTION
The PD&E study analyzes alternatives for widening SR 514, Malabar Road from a two-lane to a four-lane
facility from Babcock Street to US 1. This project corridor traverses the City of Palm Bay and the Town of
Malabar. The west end of the project falls within the limits of the City of Palm Bay and within the boundary
of the local water control district, Melbourne-Tillman Water Control District or MTWCD. Palm Bay
Community Hospital and large sections of conservation lands are located along the north side of the road.
Single-family residences, the Florida East Coast Railroad, and light commercial developments can be found in
the Town of Malabar at the east end of the project.
The roadway improvements will include the addition of sidewalks and bike lanes, and water quality
treatment within new project ponds. The roadway typical section is expected to vary along the project
corridor and will include both urban and rural drainage features. The project limits are depicted on the
following location map and aerial exhibit - Figures 1 and 2.
2.0 EXISTING DRAINAGE CONDITIONS
The USGS maps show the project alignment surrounded by a broad, low-lying, partially wooded area
interspersed with irregularly-shaped drainage ways and swamps. The existing topography is comprised of
level terrain with elevations varying from 17 ft to 19 ft NAVD, and slightly higher elevations near the western
end of the alignment and also near a few isolated knolls and ridges on the eastern end.
The offsite area south of the roadway generally drains north. The western two-thirds of the project are
within the drainage basin for Turkey Creek. Five ditches and the MTWCD C-78 Canal cross under the SR 514
alignment and combine as branches of Turkey Creek. The side ditches along the north and south edge of SR
514 drain towards these flowage ways and, in some locations, through smaller sized crossdrains that function
as equalizer pipes. To the west of Marie Street, the drainage pattern is eastward through an FDOT ditch
easement under the railroad and into Indian River. FDOT owns and maintains a section of drainage easement
north of several of the crossdrains.
The C-78 Canal is maintained by MTWCD. The SR 514 ditches are regularly maintained by FDOT. However,
the various branches of Turkey Creek upstream of SR 514 are overgrown and not well maintained. During
major rainfall events like Tropical Storm Fay, the area experiences flooding on the local roads and
surrounding properties. This flooding was most noted at the east side of the conservation lands that drain
through offsite wetlands with ill-defined outfalls. The city and county have recently completed maintenance
upgrades within the roadside ditches and the overall drainage conditions have improved.
Camp Road maintenance yard for FDOT was contacted regarding historic flooding problems for the project
corridor. FDOT reported they have recently cleared the drainage easement downstream of the culvert near
Eva Lane in order to solve a local flooding concern. Based upon interviews, overtopping of portions of the
project corridor was noted during Tropical Storm Fay.
Runoff from SR 514 is collected in roadside swales and conveyed to cross culverts serving the ditches that
pass through the area. The flat terrain of the roadway and surrounding area creates conditions where culvert.

Location Hydraulics Report, SR 514 / Malabar Road Page 2

Location Hydraulics Report, SR 514 / Malabar Road Page 3
flow interconnects with the adjacent cross culvert and the limit of each basin is not distinctively defined. The
offsite basins contributing to the crossdrains are also loosely delineated. There are linear ditches throughout
the offsite areas and interconnecting ditches that follow the local roads. During flood events, flow is
anticipated to overtop basin boundaries interconnecting several of the delineated basins. Figure 3 shows the
location of the existing culverts along the project corridor. Figure 4 presents the drainage basins upstream of
the project for each of the crossdrains and delineates the floodplain boundaries in the vicinity of the project.
It should be noted that the basin divides are based upon limited data available for the PD&E study. In
establishing the basin divides, significant differences were noted when previous studies were compared to
each other. These differences emphasize the preliminary nature of the culvert analysis and the details
needed during the design phase.
Three issues concerning the offsite basins are noted here. Culvert #2 is an 8’x4’ box culvert for the MTWCD
C-78 Canal. On historical basin maps for MTWCD, the upstream basin area is defined by the boundary limits
of the water control district. However, field review south of Malabar Road showed a changed ditch network
near Atz Road and it is possible that a much larger basin area drains to the C-78 Canal. This shifts basin area
that would have otherwise drained to Culvert #3. To account for this situation, Figure 4 lists two drainage
basin acreage values for Culvert #2 and Culvert #3. A conservative approach was suggested by FDOT District
Five. The assumption for this LHR analysis was to use the largest basin area for both culverts. A discussion
was held with MTWCD. They were not aware of the circumstances behind the field conditions and suggested
the system could change in the future. In addition, during a discussion with the City of Palm Bay, they
reported a concern that the flowline of the existing MTWCD culvert is set too high. They request that FDOT
revisit the flowline condition during the design phase of this project. MTWCD also provided a flow estimate
obtained from the regional hydraulic model of their canal system. However, MTWCD limits the allowable
runoff rate from the lands within the district. For example, the 25-yr flow is restricted to 0.08 cfs/acre and
the 100-yr flow is restricted to 0.10 cfs/acre. These allowable rates are significantly less than discharge
values generated from regression or rational formulas and typically would not be used for FDOT design.
A second concern stems from review of the published Flood Insurance Study (FIS) for the Turkey Creek
floodplain. Table 4 of the FIS, titled Summary of Discharges, lists drainage areas for each branch of Turkey
Creek. Several of the drainage areas in the FIS do not match well with the offsite drainage basin map
established for this project. For example, the drainage areas for Channel C and for Channel G are both listed
as 1.1 square miles at the point the branch connects into the main section of Turkey Creek. However, the
size of Culvert #6 (which drains Channel G) is 30-inches and the size of Culvert #7 (which drains Channel C) is
8’x4’. Since the basin areas for these two culverts are different, it appears the FIS oversimplified this
parameter by comingling of the flow for each basin.
The third issue about the ill-defined drainage basins has already been mentioned. The drainage basin divides
are often drawn across linear ditches where the prevailing flow direction is unclear. For example, the
southern basin limits of Turkey Creek have ditches that continue into Goat Creek Basin. The network of
ditches throughout the offsite area continues to change through time. When a section of land is developed,
it is typical to create a small borrow pond to raise the grade on portion of the developed property. It appears
the swales through the area are either improved by the site work for better conveyance or in some cases the
swale was eliminated.

Location Hydraulics Report, SR 514 / Malabar Road Page 4

Location Hydraulics Report, SR 514 / Malabar Road Page 5

Location Hydraulics Report, SR 514 / Malabar Road Page 6
2.1 CROSSDRAINS
Refer to Figure 3. There are fourteen (14) existing crossdrains under SR 514, six (6) of which serve as
crossings for the Turkey Creek Branches or the MTWCD C-78 Canal. Within the project limits, other smaller
culverts act as equalizer pipes for the roadside ditches. Most of the fourteen culverts were extended as part
of a 1998 roadway project that widened the shoulders of SR 514. Given the limited right-of-way, lateral pipe
connections were added to the extended culverts to convey flow from the side ditches. Figure 5 presents the
detail of the culvert extensions and the lateral connections. Information about the existing crossdrains within
the project limits is presented in the two tables that follow.
Table 1 – Existing Crossdrains
Cross
Drain ID
Location
Size
Length
No. Barrels
Type
1 117+44 24 -inch 58’ 1 Conc. Pipe(1)
2 125+05 8’x4’ 62’ 1 Conc. Box Culvert
3 143+20 10’x3’ 96’ 1 Conc. Box Culvert
4 149+80 24 -inch 48’ 1 Conc. pipe
5 165+70 (2) 8’x3’ 62’ 2 Conc. Box Culvert
6 171+65 30 -inch 42’ 1 Conc. pipe
7 178+60 8’x4’ 54’ 1 Conc. Box Culvert
8 190+24 24 -inch 42’ 1 Conc. pipe
9 201+70 10’x5’ 67’ 1 Conc. Box Culvert
10 232+30 24 -inch 42’ 1 Conc. pipe
11 250+92 24 -inch 46’ 1 Conc. pipe
12 256+96 24 -inch 46’ 1 Conc. pipe
13 270+35 24 -inch 36’ 1 Conc. pipe
14 282+05 18 -inch 36’ 1 Conc. Pipe(1) (1) Stormsewer conveyance pipe
Figure 5
Detail of Culvert Extensions Constructed in 1998

Location Hydraulics Report, SR 514 / Malabar Road Page 7
Table 2 – Existing Crossdrain Parameters
Crossdrain
ID
Flowlines
(S. to N.)
FEMA Flood
Stage
(NAVD’88)
Water Mark
Elev.
Comments/Condition
1 20.4 / 20.4 -- --
2 17.08 /17.02 --
19.02 (54-in
from headwall
top)
MTWCD C-78 Canal, connects to
Turkey Creek via C-76
3 15.59 / 15.43 Approx. 19.1
17.93 (42-in
from headwall
top)
Channel E of Turkey Creek
FDOT R/W downstream
4 15.74 / 15.68 -- --
5 12.08 / 12.14 Approx. 16.0 14.4 (39-in from
headwall top) Channel D of Turkey Creek
6 14.55 / 14.36 Approx. 18.1 16.11 (18-in
below crown) Channel G of Turkey Creek
7 14.02 / 14.17 Approx. 17.9 17.5 (6-in below
crown)
Channel C of Turkey Creek
FDOT R/W downstream
8 17.05 / 17.02 -- --
9 12.94 / 12.79 Approx. 17 16.3 (47-in from
headwall top)
Channel B of Turkey Creek
FDOT R/W downstream
10 18.34 / 18.45 -- 19.53 (2-in
above crown)
11 19.94 / 18.77 -- 21.48 (11-in
below crown) FDOT R/W downstream
12 19.33 / 19.36 -- 21.33 (At
crown)
13 16.8 / 16.8 -- --
14 19.0 / 19.0 -- --
Notes:
1- There are several stormsewer pipes that run from the south side of Malabar Road to the north side
that were constructed as part of the intersection improvements at Babcock Street. These pipe
segments continue towards Babcock Street, then north and into the existing FDOT pond in the
northeast corner of the intersection. One of these stormsewer pipes connected to Babcock Street
drainage (Crossdrain #1) is located where the road transitions back to two lanes (east of Enterprise
Road).

Location Hydraulics Report, SR 514 / Malabar Road Page 8
2.2 FLOODPLAINS
Refer to Figure 4. Malabar Road traverses five branches of Turkey Creek, each with established flood profiles
immediately downstream, i.e., north of the roadway. SR 514 also traverses MTWCD C-78 Canal, which
connects to the floodplain at its confluence with the C-76 canal. Flood Insurance Rate Maps (FIRM) for
Brevard County dated August 18, 1992, with Map Numbers 12009C0540F and 12009C0605E, cover the
project limits. These maps show a defined floodway that begins at the mouth of Turkey Creek and ends just
downstream of SR 514. The maps also show “Flood Zone A – No Base Flood Elevations Determined”
generally confined to the area at the creeks. The creek crossings under SR 514 are not in the floodway.
There was a recent update to the FIS for Brevard County. For the Turkey Creek Basin, the notable change
with this revision was the conversion to NAVD’88 datum for the listed flood stages. The update was
considered “Preliminary” at the beginning of this study, but the new maps have recently been adopted with
an effective date of March 17, 2014. Excerpts of the new FIS for Brevard County covering the project area,
along with FIRM Maps (Numbers 12009C0613G, 12009C0614G, 12009C0677G, and 12009C0680G) are
included in Appendix A.
The proposed culverts will not increase flood stages. The FDOT drainage design standards as well as SJRWMD
procedures will be applied during the design phase to prevent increasing flood elevations or changing
floodplain limits. As such, all anticipated floodplain encroachments are expected to be minimal. Floodplain
compensation ponds are not typically required for linear projects that transverse a floodplain. Preliminary
conversation with SJRWMD indicated their agreement; i.e., this project is similar to others, where hydraulic-
equivalent crossdrains and the new treatment ponds for the corridor will suffice for any floodplain impact.
This approach was also discussed with the Brevard County FEMA coordinator, Frank Karvelis, who confirmed
that floodplain compensation would not be required for the proposed conditions along Malabar Road.
3.0 FUTURE DRAINAGE CONDITIONS
The existing drainage boundaries and local drainage patterns will be maintained in the proposed condition.
Water quality treatment will be achieved with new stormwater ponds. The stormwater runoff from SR 514
will be conveyed to the proposed ponds by closed stormsewer systems before discharging to the outfall
points. There are locations where drainage from adjacent properties will be collected along with the
roadway runoff and conveyed through the proposed ponds. However, according to House Bill 599, no
additional treatment is required for these offsite areas. Therefore, the pond size estimates in the Pond Siting
Report only considers water quality and attenuation for the onsite project area.
For the roadway widening, existing crossdrains will need to be replaced with greater or hydraulically
equivalent structures. Backwater surface elevations are not expected to increase when FDOT guidelines are
followed during the design phase. As a result, the project will not affect existing flood stages or floodplain
limits.
Preliminary estimates of the replacement culverts have been established as part of this LHR. These culvert
sizes are based upon limited available information for the offsite drainage basins and their respective runoff
estimates. During the design phase of the project, these crossdrains will require a complete hydrologic and

Location Hydraulics Report, SR 514 / Malabar Road Page 9
hydraulic study. Table 3 presents anticipated crossdrain parameters for the widening project. Backup
calculations are presented within Appendix B.
Table 3 – Proposed Crossdrains
Cross
Drain ID
Location
Size
Length
No.
Barrels
Type
1 117+44 30 -inch 112’ 1 Conc. Pipe(1)
2 125+05 (2) 6’x4’ 126’ 2 Conc. Box Culvert
3 143+20 (2) 8’x4’ 126’ 2 Conc. Box Culvert
4 149+80 30 -inch 112’ 1 Conc. pipe
5 165+70 (2) 8’x4’ 160’ 2 Conc. Box Culvert
6 171+65 (2) 30 -inch 152’ 2 Conc. pipe
7 178+60 (2) 6’x4’ 162’ 2 Conc. Box Culvert
8 190+24 (2) 36 -inch 148’ 2 Conc. pipe
9 201+70 10’x5’ 190’ 1 Conc. Box Culvert
10 232+30 30 -inch 74’ 1 Conc. pipe
11 250+92 24 -inch 70’ 1 Conc. pipe
12 256+96 30 -inch 86’ 1 Conc. pipe
13 270+35 36 -inch 60’ 1 Conc. Pipe(1)
14 282+05 24 -inch 60’ 1 Conc. Pipe(1)
(1) Stormsewer conveyance pipe
4.0 CONCLUSION
There is no change in flood “Risk” associated with this project. The proposed floodplain encroachments are
classified as “minimal”.
The proposed structures will perform hydraulically in a manner equal to or greater than the existing
structures, and backwater surfaces are not expected to increase. The widened roadway, with extended
cross drains, will result in transverse impacts with minimal floodplain encroachments. As a result, the
project will not affect existing flood heights or floodplain limits. This project will not result in any new or
increased adverse environmental impacts. There will not be a significant change in the potential
interruption or termination of emergency service or emergency evacuation routes.
It has been determined, through consultation with local, state, and federal water resources and floodplain
management agencies that there is no regulatory floodway involvement on the proposed project and that
the project will not support base floodplain development that is incompatible with existing floodplain
management programs

APPENDIX A
FEMA MAPS AND FIS
‐ UPDATED EFFECTIVE FIS
MARCH 17, 2014

Project AlignmentSR 514
Begin ProjectSR 514
Culvert 2
Culvert 3
Culvert7
Culvert 5
Culvert6
Culvert4

Project AlignmentSR 514
Culvert 9
Culvert 10


SR 514 - Malabar Road is to the south

BREVARD COUNTY, FLORIDA AND INCORPORATED AREAS
Community Name Community
Number BREVARD COUNTY (UNINCORPORATED AREAS) 125092
CAPE CANAVERAL PORT AUTHORITY 120619
CAPE CANAVERAL, CITY OF 125094
COCOA , CITY OF 120020
COCOA BEACH, CITY OF 125097
GRANT-VALKARIA, TOWN OF 120224
INDIALANTIC, TOWN OF 125115
INDIAN HARBOUR BEACH, CITY OF 125116
MALABAR, TOWN OF 120024
MELBOURNE BEACH, TOWN OF 125128
MELBOURNE VILLAGE, TOWN OF 120329
MELBOURNE, CITY OF 120025
PALM BAY, CITY OF 120404
PALM SHORES, TOWN OF 120612
ROCKLEDGE, CITY OF 120027
SATELLITE BEACH, CITY OF 120028
TITUSVILLE, CITY OF 125152
WEST MELBOURNE, CITY OF 120335
Federal Emergency Management Agency FLOOD INSURANCE STUDY NUMBER
12009CV000A
Brevard County
REVISED:

NOTICE TO FLOOD INSURANCE STUDY USERS
Communities participating in the National Flood Insurance Program have established repositories of flood hazard data for floodplain management and flood insurance purposes. This Flood Insurance Study may not contain all data available within the repository. It is advisable to contact the community repository for any additional data.
This preliminary Flood Insurance Study contains profiles presented at a reduced scale to minimize reproduction costs. All profiles will be included and printed at full scale in the final published report.
Part or all of this Flood Insurance Study may be revised and republished at any time. In addition, part of this Flood Insurance Study may be revised by the Letter of Map Revision process, which does not involve republication or redistribution of the Flood Insurance Study. It is, therefore, the responsibility of the user to consult with community officials and to check the community repository to obtain the most current Flood Insurance Study components. A listing of the Community Map Repositories can be found on the Index Map.
Initial Countywide FIS Effective Date: April 3, 1989
First Countywide FIS Revision Date: August 18, 1992 (Flood Insurance Rate Map Only)
Second Countywide FIS Revision Date: November 19, 1997
Third Countywide FIS Revision Date: <to be determined>

1
FLOOD INSURANCE STUDY
BREVARD COUNTY, FLORIDA AND INCORPORATED AREAS
1.0 INTRODUCTION
1.1 Purpose of Study
This Flood Insurance Study (FIS) revises and updates information on the existence and severity of flood hazards in the geographic area of Brevard County, including the Cities of Cape Canaveral, Cocoa, Cocoa Beach, Indian Harbour Beach, Melbourne, Palm Bay, Rockledge, Satellite Beach, Titusville, and West Melbourne; the Towns of Grant-Valkaria, Indialantic, Malabar, Melbourne Beach, Melbourne Village, and Palm Shores; the Cape Canaveral Port Authority; and the unincorporated areas of Brevard County (referred to collectively herein as Brevard County), and aids in the administration of the National Flood Insurance Act of 1968 and the Flood Disaster Protection Act of 1973. This study has developed flood-risk data for various areas of the community that will be used to establish actuarial flood insurance rates and to assist the community in its efforts to promote sound floodplain management. Minimum floodplain management requirements for participation in the National Flood Insurance Program (NFIP) are set forth in the Code of Federal Regulations at 44 CFR, 60.3.
In some States or communities, floodplain management criteria or regulations may exist that are more restrictive or comprehensive than the minimum Federal requirements. In such cases, the more restrictive criteria take precedence, and the State (or other jurisdictional agency) will be able to explain them.
1.2 Authority and Acknowledgments
The sources of authority for this FIS report are the National Flood Insurance Act of 1968 and the Flood Disaster Protection Act of 1973.
The original April 3, 1989 countywide FIS was prepared to include all jurisdictions within Brevard County into a countywide format FIS. Information on the authority and acknowledgements for each jurisdiction with a previously printed FIS report included in this countywide FIS is shown below.
For the original April 3, 1989, countywide FIS, the coastal analysis for the open coast of the Atlantic Ocean was prepared by Greenhorne & O'Mara, Inc., under contract to FEMA. The analysis included wave setup, wave runup, dune erosion, and wave heights. The hydrologic and hydraulic analyses were performed by Gee & Jenson, Inc., for FEMA, under Contract No. EMW-84-C-1609. That work was completed in December 1986 (Reference 1).
For the November 19, 1997, revision, the floodway for Otter Creek was added from

2
the City of Melbourne FIS (Reference 2) to correct the omission of this data during the preparation of the original countywide FIS for Brevard County. In support of this revision, profiles for Otter Creek and Horse Creek were added (Reference 3).
For this revision of the countywide FIS report, new hydrologic and hydraulic analyses were performed by the Watershed IV Alliance for the Federal Emergency Management Agency (FEMA), under Contract No. EMA-2002-CO-011A, Task Order No. 022B. This study was completed in January 2011. Various ponding areas within the North Merrit Island area of Brevard County were included in these analyses.
The topographic information consisted of 10 meter Digital Elevation Models produced by the U.S. Geological Survey (USGS) (Reference 2). Planimetric base map information shown on all FIRM panels was derived from multiple sources. Road centerlines, stream centerlines and political boundary files were provided by Brevard County and Florida Division of Emergency Management, and St. John’s River Water Management District, and additional stream centerlines were downloaded from the National Hydrography Dataset provided by the USGS (Reference 3). Users of this FIRM should be aware that minor adjustments may have been made to specific base map features.
Base map information shown on this FIRM was provided in digital format by Brevard County and the Florida Division of Emergency management. The ortho photography is dated 2009.
The coordinate system used for the production of this FIRM is Transverse Mercator State Plane Florida East FIPS 0901, North American Datum of 1983 (NAD 83) HARN, GRS 80 spheroid. Differences in the datum and spheroid used in the production of FIRMs for adjacent counties may result in slight positional differences in map features at the county boundaries. These differences do not affect the accuracy of information shown on the FIRM.
1.3 Coordination
An initial Consultation Coordination Officer (CCO) meeting (also occasionally referred to as the Scoping meeting) is held with representatives of the communities, FEMA, and the study contractors to explain the nature and purpose of the FIS and to identify the streams to be studied by detailed methods. A final CCO (often referred to as the Preliminary DFIRM Community Coordination, or PDCC, meeting) is held with representatives of the communities, FEMA, and the study contractors to review the results of the study.
For the original April 3, 1989, FIS report, an initial CCO meeting was held in April 1984 and a final CCO meeting was held on May 9, 1988. Both meetings were attended by representatives of the county, Gee & Jenson, Inc., and FEMA. Coordination with community officials and Federal, state, and regional agencies produced various information pertaining to floodplain regulations, available maps and topography, flood history, and other hydrographic data. Agencies contacted for information included the National Ocean Service, Tide and Water Levels Division and Data Control Section; the Melbourne-Tillman Water Control District; the Florida Institute of Technology; the

3
Florida Department of Natural Resources (FDNR), Division of Beaches and Shores; the Harbor Branch Foundation; the Press Journal and Today Newspapers; the Florida East Coast Railway; the U.S. Army Corps of Engineers (USACE), Jacksonville District; the St. John's River Water Management District; the U.S. Soil Conservation Service (now the Natural Resources Conservation Service); the U.S. Geological Survey (USGS); the Florida Department of Transportation (FDOT); and the Florida Department of Environmental Regulation.
For the November 19, 1997, revision, the county was notified by FEMA in a letter dated August 7, 1995, that flood hazard information from the City of Melbourne FIS was being incorporated into the countywide FIS.
For this revision of the countywide FIS, the initial CCO meeting was held on August 29, 2008, and attended by representatives of FEMA, the Watershed IV Alliance, community officials, Canaveral Port Authority, the State of Florida, and various consulting firms.
The results of the study were reviewed at the final CCO meeting held on __________, and attended by representatives of __________________________________. All problems raised at that meeting have been addressed in this study.
2.0 AREA STUDIED
2.1 Scope of Study
This FIS report covers the geographic area of Brevard County, Florida, including the incorporated communities listed in Section 1.1.
For this revision, 17.5 square miles of new ponding areas within the North Merrit Island area were studied using detailed methods. Floodplain boundaries of Coastal AE areas, streams and ponding areas that had been previously studied by detailed methods were redelineated based on more detailed and up-to-date topographic data. Coastal VE zones were remapped based on the new Primary Frontal Dune (PFD) location, according to FEMA’s 2007 Guidance for Atlantic and Gulf Coasts of the United States. All other coastal zone breaks were digitized from the previous effective maps and remain unchanged due to the datum shift not being at a whole foot interval. Re-running the effective coastal model for overland analysis was not included in the scope of work for this study. In addition, the lack of accurate transect location information would not have resulted in a desirable outcome. Redelineated coastal and ponding areas within the county are now shown to the tenth of a foot on the FIRM panels to reflect the datum conversion from National Geodetic Vertical Datum of 1929 (NGVD29) to North American Vertical Datum of 1988 (NAVD).
For the 1997 revision, a detailed coastal flooding analysis was performed on the complete coastline of Brevard County, where the flooding sources are the Atlantic Ocean, the Indian and Banana Rivers, Mosquito Lagoon, and New Found Harbour. Also, detailed analyses for Horse Creek and Otter Creek within the City of Melbourne were incorporated. The Melbourne-Tillman Canal, Horse Creek, Otter Creek, several lakes and

4
ponds in Cocoa, Channel F in Palm Bay, and Sloughs A, B, and C in Rockledge were not restudied for the 1997 revision but previous information for those streams was used in that study.
For the original 1989 countywide FIS report, the following flooding sources were studied by detailed methods: the Eau Gallie River; Crane Creek, including Channel A and Channel B; Turkey Creek, including the main channel and Channels A, B, C, D, E, and G and C-76; Goat, Kid, Trout, North and South Prong Creeks; and ponding in and around the City of Titusville.
The areas studied by detailed methods were selected with priority given to all known flood hazards and areas of projected development or proposed construction. "Flooding Sources Studied by Detailed Methods" are presented in Table 1.
Table 1: Flooding Sources Studied by Detailed Methods
Flooding Source
Reach Length (miles) Study Area
Atlantic Ocean 70.0 Brevard County Coastline
Channel F 1.4 From approximately 200 feet downstream of Dowse Court to Norwood Street
Crane Creek 4.6 From its confluence with Indian River to Evans Road
Crane Creek Channel A
1.1 From its confluence with Crane Creek to approximately 440 feet upstream of Rialto Place
Crane Creek Channel B
0.9 From its confluence with Crane Creek to approximately 300 feet upstream of Spring Oak Drive
Crane Creek Diversion 2.8 From John Rodes Boulevard to Evans Road
Eau Gallie River 4.1 From confluence with Indian River to a point approximately 240 feet downstream of Aurora Drive
Elbow Creek 0.9 From the confluence with Eau Gallie River to a point approximately 1,400 feet upstream of Laurie Street
Goat Creek 3.5 From the confluence with Indian River to a point approximately 3,450 feet upstream of Leghorn Road
Horse Creek 1.2 From confluence with Indian River to approximately 1,600 feet upstream of Croton Road

Table 1: Flooding Sources Studied by Detailed Methods (continued)
5
Flooding Source
Reach Length (miles) Study Area
Kid Creek 1.0 From the confluence with Indian River to approximately 3,375 feet upstream of William Avenue
Melbourne Tillman Canal
7.2 From the confluence with Melbourne Tillman Canal Tributary 1 to the confluence with Turkey Creek Channel C
North Prong Creek 2.2 From the confluence with Sebastian Creek to a point approximately 50 feet upstream of Wilden Road
Otter Creek 0.7 From approximately 400 feet downstream of Robin Hood Drive to a point approximately 1,450 feet upstream of Sherwood Boulevard
Sebastian Creek 1.4 From the confluence with Sebastian Creek Tributary 3 to the confluence with Sebastian River
South Prong Creek 2.6 From the confluence with Indian River to the County boundary
St. John’s River 83.5 From the Volusia/Seminole County boundary to the Brevard/Indian River County boundary
Trout Creek 1.3 From confluence with Indian River to Grant Road
Turkey Creek 2.8 From the confluence with Indian River to approximately 450 feet upstream of the divergence of the Melbourne Tillman Canal
Turkey Creek Channel A
2.0 From confluence with Turkey Creek to approximately 525 feet downstream of Babcock Street
Turkey Creek Channel B
1.3 From confluence with Turkey Creek to approximately 110 feet downstream of Malabar Road
Turkey Creek Channel C
1.1 From confluence with Turkey Creek to Malabar Road
Turkey Creek Channel C-76
1.9 From confluence with Turkey Creek Channel D to a point approximately 1,400 feet upstream of Charles Boulevard
Turkey Creek Channel D
0.7 From the confluence with Turkey Creek Channel C to Malabar Road
Turkey Creek Channel E
0.3 From confluence with Turkey Creek Channel D to approximately 100 feet downstream of Malabar Road

Table 1: Flooding Sources Studied by Detailed Methods (continued)
6
Flooding Source
Reach Length (miles) Study Area
Turkey Creek Channel G
0.6 From the confluence with Turkey Creek Channel C to a point approximately 150 feet downstream of Malabar Road
Various Zone AE Ponds*
1.4 sq. mi.
North – State Route 528, East –Clearlake Road, South – Pluckebaum Road, West – St. John’s River Basin
Various Zone AE Ponds
3.9 sq. mi.
East of I-95, South of La Flor Drive, North of Wickham Road, and West of US-1
Various Zone AH Ponds
1.5 sq. mi.
Countywide
* Flooding source with new or revised analysis incorporated as part of the current study update
Numerous streams were studied by approximate methods, as indicated in Table 2, “Flooding Sources Studied by Approximate Methods.” Approximate analyses were used to study those areas having a low development potential or minimal flood hazards. The scope and methods of study were proposed to, and agreed upon, by FEMA and the Watershed Alliance IV. All the approximate zones for streams and ponding areas in this table were refined and re-established for this revision to the countywide FIS report.
Table 2: Flooding Sources Studied by Approximate Methods
Addison Creek Jane Green Creek Spoil Bank
Ellis Creek Kid Creek Ten Mile Creek
Eau Gallie River Tributary 5
North Prong Trout Creek
Eau Gallie River Tributary 7
Otter Creek Wolf Creek
Goat Creek Sebastian Creek Various Unnamed Streams
Horse Creek Sixmile Creek Various Unnamed Ponding
Areas
Mapping for Brevard County, Florida, and incorporated areas has been prepared using digital data. Previously published FIRM and Flood Boundary and Floodway Map data produced manually have been converted to vector digital data by a digitizing process.
This countywide FIS also incorporates the determination of letters issued by FEMA, resulting in Letters of Map Revision as shown in Table 3, “Letters of Map Revision.”

Table 3: Letters of Map Revision
Case Number Flooding Source(s) Communities Affected Effective
Date
00-04-277P Ponding Areas 1-5 Brevard County
City of Rockledge 2/16/2001
05-04-3609P N/A Brevard County 9/26/2005
11-04-2906P Atlantic Ocean Brevard County 2/28/2011
2.2 Community Description
Brevard County is located near the middle of the east coast of Florida along the Atlantic Ocean. The county is bordered on the north by Volusia County; on the east by the Atlantic Ocean; on the south by Indian River County, Florida; on the southwest by Osceola County, Florida; on the west by Orange County, Florida; and on the northwest by Seminole County. The county encompasses an area of 1,557 square miles which includes 539 square miles of water (primarily the Atlantic Ocean, the St. John’s River, and the Indian River Lagoon).
Brevard County has a mild, subtropical climate, with average temperatures in the City of Titusville ranging from 60.5 degrees Fahrenheit (°F) in January to 80.2 °F in August (Reference 4). The wet season extends from June through November with September as the wettest month, averaging 7.83 inches of rainfall. Average annual rainfall is approximately 57 inches. Prevailing winds are from the southeast and east in the spring and summer and from the northeast in the fall. Brevard County is less frequently impacted by direct hurricane landfalls than portions of the Panhandle or South Florida because the hurricanes are often steered northwest and offshore or they weaken to a tropical storm.
The topography of Brevard County is divided into three major features: the barrier islands; the coastal ridge, which forms the eastern boundary of the mainland; and the low and marshy St. John's River Valley, which includes all of the area west of the coastal ridge. Elevations along the coastal areas vary from approximately 6 feet North American Vertical Datum of 1988 (NAVD) on Merritt Island to elevations over 20 feet NAVD along the mainland ridge, dropping to approximately 14 feet NAVD at Titusville (Reference 5). Elevations along the barrier island dunes reach 15 to 20 feet NAVD.
The primary north-south transportation arteries serving Brevard County are U.S. Route 1 and Interstate 95. State Roads 3, 5, 9, 46, 50, 192, 402, 515, 520, 524, and 528 serve the inland portions of the county and connect to Florida's Turnpike and Interstate 4. Other transportation arteries include the Florida East Coast Railway, which parallels the mainland coast, and the Intracoastal Waterway within the Indian River and Mosquito Lagoon.
The year 2010 population of Brevard County was reported as 543,376 (Reference 6). The population for the county grew by 107.1% in the last three decades of the 1900s.

8
Residential, commercial, and industrial development in Brevard County occurs mainly along the coastal barrier islands and the western shore of the Indian River, east of Interstate 95. Areas west of Interstate 95 are generally undeveloped or agricultural, although the City of Palm Bay is experiencing significant development. In 2007 retail trade was the largest of 20 major economic sectors in Brevard County.
The county seat of Brevard County is the City of Titusville, which is located along the Indian River on the coastal ridge approximately 40 miles east of the City of Orlando, Florida. The year 2006 population for Titusville was estimated as 44,027 (Reference 6). Population figures for other communities discussed here are based on the year 2000. The communities of Cocoa (population 16,412), Rockledge (population 20,170), Palm Shores (population 794), Melbourne (population 71,382), Melbourne Village (706), West Melbourne (population 9,824), Palm Bay (79,413), and Malabar (population 2,622) are distributed between Interstate 95 and U.S. Route 1 on the coastal ridge south of Titusville. The John F. Kennedy Space Center and the Cape Canaveral Air Force Base are located east of Titusville on Merritt Island and the adjacent barrier islands. The communities of Cape Canaveral (population 8,829), Cocoa Beach (population 12,482), Satellite Beach (population 9,577), Indian Harbour Beach (population 8,152), Indialantic (2,944), and Melbourne Beach (3,335) are located on the barrier islands south of Merritt Island. The Canaveral Port Authority is an independent governmental agency created by the Florida Legislature that has jurisdiction over all fiscal and regulatory policies and operation of the Port, which is in the community of Cape Canaveral.
The northwestern boundary of Brevard County is the St. John’s River. The St. John's River is the largest river in Florida, with a basin of approximately 9,430 square miles measured at its discharge into the Atlantic Ocean near the City of Jacksonville. From its headwaters in Indian River County to the south, the St. John’s River flows northward through Brevard County and into Volusia County. Several small tributaries, including Jane Green Creek, Ten Mile Creek, Wolf Creek, and Sixmile Creek, are included in this study.
The eastern edge of Brevard County contains the waterways of the Indian River Lagoon. This 156-mile long estuary lies between the mainland and barrier islands from Volusia County to the north, through Brevard County, and extending south to Palm Beach County. The Atlantic Intracoastal Waterway runs through the Indian River Lagoon for its length. Five inlets allow for exchange of fresh and saltwater in the lagoon. In Brevard County, the Indian River Lagoon begins as Mosquito Lagoon in the north, picks up the Banana River on the east side of Merritt Island, and continues as the Indian River south of Merritt Island, encountering Sebastian Inlet at the southern boundary of Brevard County. Other small streams, such as the Eau Gallie River and Turkey, Crane, Goat, Kid, Trout, and Sebastian Creeks (and the North and South Prongs) drain the coastal highland areas and discharge into the Indian River.
2.3 Principal Flood Problems
Floods resulting from prolonged, heavy rainfall can occur in streams that drain the coastal highland areas and discharge into the Indian and St. John's Rivers. Flooding from

9
heavy rainfall occurs in lowland areas and streams including the Eau Gallie River, Crane Creek, Crane Creek Channels A and B, Turkey Creek, Turkey Creek Channels A, B, C, D, E, F, G, and C-76, and Goat, Kid, Trout, and North and South Prong Creeks, and their respective tributaries. In the Cocoa West area, new residential and light industrial development has flooded in areas that are shown as outside the Special Flood Hazard Areas. Repeated flooding has also been reported in areas around North Titusville and Mims.
Coastal areas of the county on the Atlantic Ocean are subject to storm surge flooding as a result of hurricane and tropical storm activity. Large tidal surges, combined with wave action and the heavy rainfall that accompanies the storms, have caused flooding. Areas along the Banana and Indian Rivers and Mosquito Lagoon experience flooding from wind tides caused by hurricane winds piling water against shorelines and various causeways and bridges over the rivers. North Merritt Island has had repeated flooding since the last major FIS revision.
There is considerable historical evidence of storms affecting the southeastern coast of the United States before the 20th century (Reference 7). Some of the most significant 20th (Reference 8) and 21st century storms (Reference 9) that have affected the study area are described below.
September 6-22, 1926 - The Cities of Titusville and Melbourne had tide levels in the Indian River estimated at 5 feet NGVD.
September 6-20, 1928 - Hurricane winds of 80 miles per hour (mph) lasted nearly 6 hours along the Indian River. Tide levels in the Indian River were estimated at 3.5 feet NGVD in the Town of Mims, 5 feet NGVD in Titusville, and 7 feet NGVD in Melbourne.
October 13-21, 1944 - A tide level of 3.9 feet NGVD was measured in the Eau Gallie River at the Atlantic Ocean, and the tide level was estimated at 3.4 feet NGVD in the Banana River at the City of Audubon.
September 11-19, 1947 - A hurricane made landfall at the City of Fort Lauderdale, with the Eau Gallie River measuring 4.6 feet NGVD at the Atlantic Ocean. The City of Fort Pierce reported tide levels of 6.8 to 8.8 feet NGVD at the Atlantic Ocean and the river areas near the inlet.
September 19-25, 1948 - The Eau Gallie River had tides at the Atlantic Ocean of 4.9 feet NGVD. The Indian River had a tide level of 4.8 feet NGVD at Melbourne and the Banana River had a tide level of 3.3 feet NGVD at Audubon.
August 24-29, 1949 - The Eau Gallie River had tide levels at the Atlantic Ocean of 4.5 feet NGVD. Melbourne estimated tide levels to be 3.5 feet NGVD in the Indian River, and the City of Sebastian measured tide levels at 1.8 feet NGVD in the Indian River.
October 15-19, 1950 - Hurricane King made landfall at the City of Miami and traveled inland parallel to the coastline. The Eau Gallie River measured 3.4 feet NGVD at the

10
Atlantic Ocean, the Indian River at Titusville was 5.0 feet NGVD, and the Banana River at Audubon was 2.3 feet NGVD.
October 7-12, 1953 - Tropical Storm Hazel exited into the Atlantic Ocean near Vero Beach. Tide levels in the Atlantic Ocean at Eau Caine were measured at 5.0 feet NGVD, and the Indian River at Titusville measured 2.3 feet NGVD.
August 25-September 7, 1979 - Hurricane David - The Kennedy Space Center reported tides of 5 feet above normal at the Atlantic Ocean, the Port Canaveral Coast Guard reported tides 4 feet above normal, and Patrick Air Force Base recorded a total rainfall of 6.28 inches (Reference 10).
August 2, 1995 - Tropical Storm Erin storm dropped 7–10 inches of rain, flooding much of Palm Bay and Melbourne. Most major and secondary roads were impassable and over 100 homes and businesses received some flood damage, while one department had its roof collapse due to the weight of the water (Reference 9).
September 3, 2004 – Hurricane Frances struck neighboring Vero Beach, Indian County directly and caused widespread flooding of roads, residences, and businesses in Brevard County.
September 25-26, 2004 - Hurricane Jeanne struck Vero Beach directly, following nearly the same path as Hurricane Frances. Palm Bay reported flooded streets and roads.
October 24, 2005 – Hurricane Wilma produced 10–13 inches of rain in the northern part of the county, flooding approximately 200 homes in Cocoa.
August 19-20, 2008 - Tropical Storm Fay dropped more than 27 inches of rain in Melbourne. The storm caused flooding or damage to over 1,600 homes and businesses across the county, with a loss of nearly 60 million dollars in private property and an additional 10 million dollars in damage to public infrastructure.
2.4 Flood Protection Measures
A series of levees exist in the eastern portion of the St. John’s River floodplain. Breaks occur in the levees and the elevations are not uniform. In addition, they do not have a consistent 3-foot freeboard above 1-percent-annual-chance frequency levels. It has therefore been ascertained that the levees may not protect the community from rare events such as the 1-percent-annual-chance flood, although they do afford some protection from lower flood stages. Levees and dikes exist along canals in other areas and are generally not considered adequate for flood control for the same reasons.
A water control structure (the Melbourne-Tillman Water Control Structure MS-1) to control water levels in the Melbourne-Tillman canal system is located just above Port Malabar road in Palm Bay. Although not designed as a flood control structure, it provides some protection during low level flood conditions.

11
No other flood protection measures are known to exist within the study area.
3.0 ENGINEERING METHODS
For the flooding sources studied by detailed methods in the county, standard hydrologic and hydraulic study methods were used to determine the flood-hazard data required for this study. Flood events of a magnitude that is expected to be equaled or exceeded once on the average during any 10-, 50-, 100-, or 500-year period (recurrence interval) have been selected as having special significance for floodplain management and for flood insurance rates. These events, commonly termed the 10-, 50-, 100-, and 500-year floods, have a 10-, 2-, 1-, and 0.2-percent chance, respectively, of being equaled or exceeded during any year. Although the recurrence interval represents the long-term, average period between floods of a specific magnitude, rare floods could occur at short intervals or even within the same year. The risk of experiencing a rare flood increases when periods greater than 1 year are considered. For example, the risk of having a flood that equals or exceeds the 1-percent-annual-chance flood in any 50-year period is approximately 40 percent (4 in 10); for any 90-year period, the risk increases to approximately 60 percent (6 in 10). The analyses reported herein reflect flooding potentials based on conditions existing in the community at the time of completion of this study. Maps and flood elevations will be amended periodically to reflect future changes.
3.1 Hydrologic Analyses
Hydrologic analyses were carried out to establish peak discharge-frequency relationships for each flooding source studied by detailed methods affecting Brevard County, including both riverine and coastal sources.
Information on the methods used to determine peak discharge-frequency relationships for the streams studied by detailed methods is shown below.
3.1.1 Methods for Flooding Sources Incorporated from Previous Studies
The 1-percent-annual-chance flood profile for the St. John's River was obtained from the St. John's River Water Management District (Reference 11). The flood profile was completed by conducting statistical frequency analyses on observed or simulated annual peak flow data and then performing backwater computations on flood flows of the desired frequencies, mean annual peak flow, and the 20-, 10-, 4-, 2-, and 1-percent-annual-chance floods. These flood profiles supersede those presented in the USAGE "General Design Memorandum" (Reference 12).
Regionalized regression equations developed by the USGS, in cooperation with the Florida Department of Transportation, were used for determining peak discharge-frequency relationships for the Eau Gallie River, Crane, Goat, Trout, Kid, and North Prong Creeks, and Tributaries of Turkey Creek (Reference 13). The peak discharges for Turkey Creek east of the Melbourne-Tillman Water Control District water control structure MS-1 were adopted from a detailed hydrologic study (Reference 14). Storm water runoff hydrographs were generated for over 380 individual drainage subbasins and then routed hydrodynamically

12
through Turkey Creek and its associated canals and tributaries.
The upstream portion of Crane Creek is a manmade canal that cuts through a land ridge, which formerly divided the natural drainage areas of the St. John's River and the Indian River. During high flood stages, this allows a portion of the flow to go westward into the St. John's River floodplain. The drainage areas shown in Table 4 represent the areas under low flow conditions. During the period of high flood stages, the actual contributing drainage areas may vary due to overflow toward the St. John's River. The rates of overflow westward were computed based on the hydraulic conditions of Crane Creek and the St. John's River. The westerly flow rates were computed with the assumption that the starting water-surface elevations at the west side of John Rodes Boulevard are the same elevations as the St. John's River flood elevations for the 10-, 2-, 1-, and 0.2-percent-annual-chance frequencies.
Some of the flood conditions in the Titusville area were considered as ponding-type flooding. The flood elevations were determined with a volumetric analysis of the stormwater runoff. The study area was divided into five subbasins and stage-storage relationships were computed using topographic maps developed by the City of Titusville (Reference 15).
For Horse Creek and Otter Creek, rainfall-frequency estimates were obtained by statistical analysis of records prepared by the U.S. Weather Bureau, Technical Paper No. 40 (Reference 16). The amount of rainfall that will run off (rainfall excess) from a particular basin is less than the rainfall due to soil permeability, vegetation cover, and other characteristics. To estimate the rainfall excess, the SCS has developed Runoff Curve Numbers which relate rainfall to direct runoff (Reference 17). The Runoff Curve Numbers were used to calculate the infiltration losses based on the soil type and land use.
The hydrology for Horse Creek and Otter Creek were formulated by the TRACOR Method (Reference 18). The TRACOR method of urban hydrology uses mathematical equations derived from field experiments and observations to calculate volume and peak rates of storm runoff at a desired location as a result of recurring storms of 10-, 2-, 1-, and 0.2-percent-annual-chance frequencies. The SCS method was used to check the TRACOR method (Reference 17). The SCS method uses mathematical equations derived from field experiments and observations to calculate peak flows and volumes.
3.1.2 Methods for Flooding Sources with New or Revised Analyses in Current Study
Detailed hydrologic calculations for North Merrit Island area were performed using the ICPR program (Reference 19). The standard Soil Conservation Service (SCS) methodology was utilized, with the exception of using a peaking factor of 256 in lieu of the standard 484 peaking factor (Reference 20). This variation was adopted to account for the difference in terrain between the SCS default terrain and the terrain in Brevard County (gently rolling hills and flat areas with slight

13
slopes, respectively). Land use data was obtained from Saint Johns River Water Management District and soil data was obtained from Natural Resources Conservation Service’s Soil Data Mart. Based on guidance from NRCS TR-55 (Reference 21), a 24 hour event with SCS antecedent moisture type III distribution is used for North Merrit Island area.
A summary of the drainage area-peak discharge relationships for the streams studied by detailed methods is shown in Table 4, “Summary of Discharges.”

14
Tab
le 4
: Su
mm
ary
of D
isch
arge
s
Flo
odin
g S
ourc
e an
d L
ocat
ion
Dra
inag
e A
rea
Pea
k D
isch
arge
s (C
ubic
Fee
t per
Sec
ond)
(S
quar
e m
iles
) 10
-per
cent
- 2-
perc
ent-
1-
perc
ent-
0.
2-pe
rcen
t-
an
nual
-cha
nce
annu
al-c
hanc
e an
nual
-cha
nce
annu
al-c
hanc
e
CR
AN
E C
RE
EK
At m
outh
19
.27
712
1,30
0 1,
488
2,07
7
At a
poi
nt a
ppro
xim
atel
y 2,
200
feet
ups
trea
m
of F
lori
da E
ast C
oast
Rai
lway
18
.21
692
1,26
0 1,
428
1,99
2
At B
abco
ck S
tree
t 13
.81
559
1,02
5 1,
133
1,53
7
At C
ount
ry C
lub
Roa
d 11
.32
467
863
948
1,25
2
At N
ew H
aven
Ave
nue
10.8
4 45
0 83
0 91
1 1,
194
At D
airy
Roa
d 9.
29
387
730
793
1,01
5
At E
vans
Roa
d 8.
17
347
655
708
882
CR
AN
E C
RE
EK
CH
AN
NE
L A
At m
outh
0.
90
130
250
160
220
At a
poi
nt a
ppro
xim
atel
y 1,
500
feet
up
stre
am o
f m
outh
0.
45
90
180
220
340
At A
irpo
rt B
oule
vard
0.
27
70
120
16
0 22
0
CR
AN
E C
RE
EK
CH
AN
NE
L B
At m
outh
0.
44
90
260
400
750
At C
ount
ry C
lub
Roa
d 0.
29
70
210
350
710
At S
outh
Fai
rway
Dri
ve
0.19
60
17
0 30
0 59
0
CR
AN
E C
RE
EK
CH
AN
NE
L B
At m
outh
of
unna
med
trib
utar
y 1.
90
185
355
470
703

Tab
le 4
: Sum
mar
y of
Dis
char
ges (
cont
inue
d)
15
Flo
odin
g S
ourc
e an
d L
ocat
ion
Dra
inag
e A
rea
Pea
k D
isch
arge
s (C
ubic
Fee
t per
Sec
ond)
(S
quar
e m
iles
) 10
-per
cent
- 2-
perc
ent-
1-
perc
ent-
0.
2-pe
rcen
t-
an
nual
-cha
nce
annu
al-c
hanc
e an
nual
-cha
nce
annu
al-c
hanc
e
At a
poi
nt a
ppro
xim
atel
y 1,
600
feet
do
wns
trea
m o
f D
airy
Roa
d 1.
37
155
305
400
610
CR
AN
E C
RE
EK
DIV
ER
SIO
N F
RO
M
ST
. JO
HN
’S R
IVE
R
At D
ayto
n B
oule
vard
6.
85
295
* *
*
At W
ickh
am R
oad
5.47
*
130
272
618
At J
ohn
Rod
es B
oule
vard
3.
44
83
130
272
618
EA
U G
AL
LIE
RIV
ER
At m
outh
8.
25
675
1,22
0 1,
475
2,21
0
At U
.S. R
oute
1
4.79
49
5 88
5 1,
075
1,59
0
At F
lori
da E
ast C
oast
Rai
lway
4.
62
485
870
1,05
5 1,
560
At E
au G
alli
e B
oule
vard
3.
23
390
700
860
1,28
5
At C
roto
n R
oad
2.78
35
0 63
5 78
0 1,
185
At W
ickh
am R
oad
1.37
19
3 36
0 43
5 66
9
GO
AT
CR
EE
K
At U
.S. R
oute
1
9.91
29
8 54
2 68
0 1,
038
At O
ld V
alka
ria
Roa
d 9.
36
285
520
650
995
At H
ende
rson
Dri
ve
8.74
27
3 49
2 62
0 94
7
At H
ighl
and
Roa
d 7.
20
238
428
541
827
At a
poi
nt a
ppro
xim
atel
y 80
0 fe
et
dow
nstr
eam
at L
egho
rn R
oad
6.90
23
0 41
7 52
8 80
5

Tab
le 4
: Sum
mar
y of
Dis
char
ges (
cont
inue
d)
16
Flo
odin
g S
ourc
e an
d L
ocat
ion
Dra
inag
e A
rea
Pea
k D
isch
arge
s (C
ubic
Fee
t per
Sec
ond)
(S
quar
e m
iles
) 10
-per
cent
- 2-
perc
ent-
1-
perc
ent-
0.
2-pe
rcen
t-
an
nual
-cha
nce
annu
al-c
hanc
e an
nual
-cha
nce
annu
al-c
hanc
e
GO
AT
CR
EE
K(c
onti
nued
)
At L
egho
rn R
oad
0.96
75
13
4 18
5 29
8
HO
RS
E C
RE
EK
At m
outh
3.
09
870
1,49
0 1,
800
2,20
0
At C
roto
n R
oad
1.97
53
0 96
0 1,
080
1,40
0
KID
CR
EE
K
At m
outh
1.
77
99
180
240
378
At a
poi
nt a
ppro
xim
atel
y 60
0 fe
et u
pstr
eam
of
Old
Dix
ie H
ighw
ay
1.59
94
17
0 22
9 36
0
At a
poi
nt a
ppro
xim
atel
y 2,
600
feet
ups
trea
m
of O
ld D
ixie
Hig
hway
1.
35
88
157
212
340
At a
poi
nt a
ppro
xim
atel
y 0.
91 m
ile
upst
ream
of
Old
Dix
ie H
ighw
ay
1.26
84
15
0 20
5 33
0
NO
RT
H P
RO
NG
CR
EE
K
At m
outh
20
.79
771
1,38
3 1,
690
2,53
3
At a
poi
nt a
ppro
xim
atel
y 1.
52 m
iles
ups
trea
m
of m
outh
19
.43
749
1,34
4 1,
642
2,45
7
At a
poi
nt a
ppro
xim
atel
y 1.
99 m
iles
ups
trea
m
of m
outh
18
.55
634
1,14
8 1,
408
2,14
5
OT
TE
R C
RE
EK
At m
outh
1.
08
350
650
790
980

Tab
le 4
: Sum
mar
y of
Dis
char
ges (
cont
inue
d)
17
Flo
odin
g S
ourc
e an
d L
ocat
ion
Dra
inag
e A
rea
Pea
k D
isch
arge
s (C
ubic
Fee
t per
Sec
ond)
(S
quar
e m
iles
) 10
-per
cent
- 2-
perc
ent-
1-
perc
ent-
0.
2-pe
rcen
t-
an
nual
-cha
nce
annu
al-c
hanc
e an
nual
-cha
nce
annu
al-c
hanc
e
At R
obin
Hoo
d D
rive
0.
71
220
410
490
610
SO
UT
H P
RO
NG
CR
EE
K
At U
.S. R
oute
1
202.
00
2,80
0 5,
000
6,00
0 9,
000
At a
poi
nt a
ppro
xim
atel
y 2.
08 m
iles
ups
trea
m
of U
.S. R
oute
1
80.8
0 1,
950
3,40
0 4,
150
6,10
0
TR
OU
T C
RE
EK
At m
outh
10
.57
314
570
710
1,08
8
At T
hird
Str
eet
8.35
26
4 47
8 60
0 91
8
TU
RK
EY
CR
EE
K
At m
outh
*
8,50
0 10
,000
10
,700
12
,000
Just
dow
nstr
eam
of
conf
luen
ce o
f
Tur
key
Cre
ek C
hann
el B
*
7,40
0 8,
800
9,45
0 10
,800
At C
ontr
ol S
truc
ture
MS
-1
* 6,
200
7,40
0 8,
000
9,00
0
TU
RK
EY
CR
EE
K C
HA
NN
EL
A
At m
outh
3.
73
258
490
635
955
At C
lear
mon
t Str
eet
2.53
21
0 40
7 53
5 80
0
TU
RK
EY
CR
EE
K C
HA
NN
EL
A
At a
poi
nt a
ppro
xim
atel
y 1,
500
feet
ups
trea
m
of C
lear
mon
t Str
eet
0.81
12
0 24
0 33
7 51
0

Tab
le 4
: Sum
mar
y of
Dis
char
ges (
cont
inue
d)
18
Flo
odin
g S
ourc
e an
d L
ocat
ion
Dra
inag
e A
rea
Pea
k D
isch
arge
s (C
ubic
Fee
t per
Sec
ond)
(S
quar
e m
iles
) 10
-per
cent
- 2-
perc
ent-
1-
perc
ent-
0.
2-pe
rcen
t-
an
nual
-cha
nce
annu
al-c
hanc
e an
nual
-cha
nce
annu
al-c
hanc
e
TU
RK
EY
CR
EE
K C
HA
NN
EL
B
At m
outh
1.
68
173
330
442
668
At M
alab
ar R
oad
1.14
14
0 28
0 38
0 57
5
TU
RK
EY
CR
EE
K C
HA
NN
EL
C
At m
outh
7.
34
395
733
915
1,40
0
Just
ups
trea
m o
f co
nflu
ence
of
T
urke
y C
reek
Cha
nnel
D
1.10
80
15
2 19
0 34
5
TU
RK
EY
CR
EE
K C
HA
NN
EL
C-7
6
At m
outh
1.
49
164
318
427
640
At B
abco
ck S
tree
t 0.
70
110
223
320
490
TU
RK
EY
CR
EE
K C
HA
NN
EL
D
At m
outh
4.
96
305
570
730
1,10
5
TU
RK
EY
CR
EE
K C
HA
NN
EL
D
At a
poi
nt a
ppro
xim
atel
y 40
0 fe
et
dow
nstr
eam
of
conf
luen
ce o
f T
urke
y C
reek
C
hann
el E
3.
40
245
468
610
912
At a
poi
nt a
ppro
xim
atel
y 70
0 fe
et u
pstr
eam
of
conf
luen
ce o
f T
urke
y C
reek
Cha
nnel
E
3.00
21
5 40
0 52
8 79
7
TU
RK
EY
CR
EE
K C
HA
NN
EL
E
At m
outh
3.
03
30
70
82
115

Tab
le 4
: Sum
mar
y of
Dis
char
ges (
cont
inue
d)
19
Flo
odin
g S
ourc
e an
d L
ocat
ion
Dra
inag
e A
rea
Pea
k D
isch
arge
s (C
ubic
Fee
t per
Sec
ond)
(S
quar
e m
iles
) 10
-per
cent
- 2-
perc
ent-
1-
perc
ent-
0.
2-pe
rcen
t-
an
nual
-cha
nce
annu
al-c
hanc
e an
nual
-cha
nce
annu
al-c
hanc
e
TU
RK
EY
CR
EE
K C
HA
NN
EL
G
At m
outh
1.
10
120
230
315
410
* D
ata
Not
Ava
ilab
le

20
Inundation from the Atlantic Ocean, the Indian River, and the Banana River caused by passage of storms (storm surge) was determined by the joint probability method (Reference 22). The storm populations were described by probability distributions of five parameters that influence surge heights. These parameters were central pressure depression (which measures the intensity of the storm), radius to maximum winds, forward speed of the storm, shoreline crossing point, and crossing angle. These characteristics were described statistically based on an analysis of observed storms in the vicinity of Brevard County. Primary sources of data for this analysis were the Tropical Cyclones of the North Atlantic Ocean; Some Climatological Characteristics of Hurricanes and Tropical Storms, Gulf and East Coasts of the United States; and Meteorological Criteria for Standard Project Hurricane and Probable Maximum Hurricane Windfields, Gulf and East Coasts of the United States, all prepared by the U.S. Department of Commerce, National Oceanic and Atmospheric Administration (NOAA) (References 23; 24; 25). A summary of the parameters used for the area is presented in Table 5, "Parameter Values for Surge Elevations."
Table 5: Parameter Values for Surge Elevations
Parameter Assigned Values
Central pressure depression (millibars)
18.9 32.6 46.4 60.1 73.9 87.6 101.4 115.1
Probability1 0.274 0.358 0.181 0.092 0.047 0.024 0.012 0.012
Storm radius to maximum winds (nautical miles)
13.0 28.0
Probability 0.433 0.567
Forward speed (knots) 7.5 16.5 25.5
Probability2 0.533 0.413 0.054
Direction of storm path (degrees from true north)
47.0 111.0 174.0 238.0
Probability2 0.036 0.222 0.353 0.389
Frequency of storm occurrence (storm/nautical mile/year)
0.00455
1 Probabilities for entering, alongshore, and exiting 2 Probabilities for entering
For areas subject to flooding directly from the Atlantic Ocean, the Indian River, and the Banana River, the FEMA standard storm surge model was used to simulate the coastal surge generated by any chosen storm (that is, any combination of the five storm parameters defined previously). By performing such simulations for a large number of

21
storms, each of known total probability, the frequency distribution of surge height can be established as a function of coastal location. These distributions incorporate the large-scale surge behavior, but do not include an analysis of the added effects associated with much finer scale wave phenomena, such as wave height or runup. As the final step in the calculations, the astronomic tide for the region is then statistically combined with the computed storm surge to yield recurrence intervals of total water level (Reference 26).
Wave setup was determined to significantly contribute to the total stillwater flood levels along the Atlantic Ocean coast. The amount of wave setup was calculated using methodology outlined in the USACE "Shore Protection Manual" (Reference 27).
The storm-surge elevations for the 10-, 2-, 1-, and 0.2-percent-annual-chance floods have been determined for the Atlantic Ocean, the Indian and Banana Rivers, Mosquito Lagoon, and New Found Harbour and are shown in Table 6, "Summary of Stillwater Elevations." The analyses reported herein reflect the stillwater elevations due to tidal and wind setup effects and include the contributions from wave action effects.

22
Tab
le 6
: Su
mm
ary
of S
tillw
ater
Ele
vatio
ns
Sti
llw
ater
Ele
vati
on (
Fee
t NA
VD
)
Bas
e F
lood
F
lood
ing
Sou
rce
an
d T
rans
ect
F
IRM
Pan
el
10-p
erce
nt-
annu
al-c
hanc
e 2-
perc
ent-
annu
al-c
hanc
e 1-
perc
ent-
annu
al-c
hanc
e 0.
2-pe
rcen
t-an
nual
-cha
nce
Z
one
Ele
vati
on1,
2 (
Fee
t NA
VD
)
IND
IAN
RIV
ER
1 40
2.
2 4.
4 5.
4 7.
8 A
E
5.7-
6.7
2 40
2.
1 4.
0 5.
2 7.
3 A
E
5.7-
6.7
MO
SQ
UIT
O L
AG
OO
N
3 45
1.
4 2.
9 3.
7 6.
5 A
E
3.7-
5.7
IND
IAN
RIV
ER
4 45
1.
5 4.
1 4.
9 6.
9 V
E
AE
6.
7-7.
7
4.7-
6.7
5 40
1.
6 3.
6 4.
5 6.
3 A
E
4.7-
6.7
AT
LA
NT
IC O
CE
AN
6 65
3.
5 5.
8 8.
83 9.
2 V
E
AE
10
.7-1
3.7
8.
7-10
.7
MO
SQ
UIT
O L
AG
OO
N
7 45
1.
4 2.
9 3.
7 6.
5 A
E
3.7-
5.7
8 45
1.
4 2.
9 3.
7 6.
5 A
E
3.7-
5.7
IND
IAN
RIV
ER
9 45
45
1.
2
1.2
3.2
3.2
4.0
5.1
5.7
5.9
AE
A
E
3.7-
5.7
4.7-
6.7
10
105
1.0
2.6
3.4
4.9
AE
3.
7-5.
7

Tab
le 6
: Su
mm
ary
of S
tillw
ater
Ele
vatio
ns (c
ontin
ued)
23
Sti
llw
ater
Ele
vati
on (
Fee
t NA
VD
)
Bas
e F
lood
F
lood
ing
Sou
rce
an
d T
rans
ect
F
IRM
Pan
el
10-p
erce
nt-
annu
al-c
hanc
e 2-
perc
ent-
annu
al-c
hanc
e 1-
perc
ent-
annu
al-c
hanc
e 0.
2-pe
rcen
t-an
nual
-cha
nce
Z
one
Ele
vati
on1,
2 (
Fee
t NA
VD
)
11
110
0.8
3.0
3.8
5.4
AE
3.
7-5.
7
AT
LA
NT
IC O
CE
AN
12
130
3.4
3.4
5.7
5.7
8.63
6.6
9.0
9.0
VE
A
E
AE
10.7
-13.
7
8.7-
10.7
6.7-
7.7
MO
SQ
UIT
O L
AG
OO
N
13
130
1.4
2.9
3.7
6.5
AE
3.
7-5.
7
14
130
1.4
2.9
3.7
6.5
AE
3.
7-5.
7
IND
IAN
RIV
ER
15
110,
120,
130
1.3
3.5
4.3
6.0
VE
A
E
6.7-
7.7
4.7-
6.7
16
115
0.6
2.0
2.5
3.9
AE
2.
7-3.
7
17
110,
130
11
0, 1
30
110,
130
1.3
1.3
1.3
3.1
2.4
1.6
3.7
3.0
1.9
5.2
4.5
3.1
AE
A
E
AE
3.7-
5.7
2.7-
4.7
1.7-
3.7
AT
LA
NT
IC O
CE
AN
18
13
0,13
5 3.
4 3.
4
5.7
5.7
8.63
6.6
9.0
9.0
VE
A
E
AE
10.7
-13.
7 8.
7-10
.7
6.7-
7.7
MO
SQ
UIT
O L
AG
OO
N
19
130
1.4
2.9
3.7
6.5
AE
3.
7-5.
7

Tab
le 6
: Su
mm
ary
of S
tillw
ater
Ele
vatio
ns (c
ontin
ued)
24
Sti
llw
ater
Ele
vati
on (
Fee
t NA
VD
)
Bas
e F
lood
F
lood
ing
Sou
rce
an
d T
rans
ect
F
IRM
Pan
el
10-p
erce
nt-
annu
al-c
hanc
e 2-
perc
ent-
annu
al-c
hanc
e 1-
perc
ent-
annu
al-c
hanc
e 0.
2-pe
rcen
t-an
nual
-cha
nce
Z
one
Ele
vati
on1,
2 (
Fee
t NA
VD
)
20
130
1.4
2.9
3.7
6.5
AE
3.
7-5.
7
IND
IAN
RIV
ER
21
120,
130,
140
120,
130,
140
0.9
0.9
2.3
1.5
2.8
1.9
4.4
2.9
AE
A
E
2.7-
4.7
1.7-
2.7
22
115
1.0
2.1
2.7
3.8
AE
2.
7-3.
7
23
115,
180
0.7
1.7
2.2
3.3
AE
2.
7-3.
7
24
185
1.0
2.0
2.5
3.6
AE
2.
7-3.
7
25
140,
185,
205
0.6
1.5
1.9
3.1
AE
1.
7-3.
7
26
185
0.5
1.3
1.7
2.5
AE
1.
7-2.
7
AT
LA
NT
IC O
CE
AN
27
145,
230
3.5
3.5
5.7
5.7
8.93
6.9
9.3
9.3
VE
A
E
AE
10.7
-14.
7 8.
7-10
.7
6.7-
7.7
MO
SQ
UIT
O L
AG
OO
N
28
145
1.7
3.6
4.3
6.0
AE
4.
7-5.
7
29
145
2.1
3.8
4.6
6.1
AE
4.
7-5.
7
IND
IAN
RIV
ER
30
205,
210
205,
210
205,
210
0.5
0.5
0.5
1.6
2.0
3.0
2.1
2.3
3.7
2.9
3.3
5.2
AE
A
E
AE
1.7-
3.7
2.7-
3.7
3.7
31
195
-0.1
0.
8 1.
1 2.
1 A
E
0.7-
2.7

Tab
le 6
: Su
mm
ary
of S
tillw
ater
Ele
vatio
ns (c
ontin
ued)
25
Sti
llw
ater
Ele
vati
on (
Fee
t NA
VD
)
Bas
e F
lood
F
lood
ing
Sou
rce
an
d T
rans
ect
F
IRM
Pan
el
10-p
erce
nt-
annu
al-c
hanc
e 2-
perc
ent-
annu
al-c
hanc
e 1-
perc
ent-
annu
al-c
hanc
e 0.
2-pe
rcen
t-an
nual
-cha
nce
Z
one
Ele
vati
on1,
2 (
Fee
t NA
VD
)
AT
LA
NT
IC O
CE
AN
32
145,
230
3.5
5.7
8.93
9.3
VE
A
E
10.7
-14.
7 8.
7-10
.7
IND
IAN
RIV
ER
33
215,
220,
280
215,
220,
280
215,
220,
280
0.2
0.4
0.4
0.9
1.8
1.5
1.1
2.3
1.6
2.7
3.4
2.0
AE
A
E
AE
1.7-
2.7
2.7
1.7-
2.7
34
195,
260
0.1
0.8
1.3
2.1
AE
1.
7-2.
7
AT
LA
NT
IC O
CE
AN
35
240
3.3
5.3
8.53
8.6
VE
A
E
10.7
-13.
7 8.
7-10
.7
IND
IAN
RIV
ER
36
280
0.6
1.7
2.1
3.1
AE
1.
7-3.
7
37
260
0.3
1.1
1.6
2.7
AE
1.
7-2.
7
BA
NA
NA
RIV
ER
38
305
1.3
3.0
3.7
5.1
AE
3.
7-5.
7
39
285
0.6
1.5
1.9
3.0
AE
1.
7-3.
7
AT
LA
NT
IC O
CE
AN
40
310
3.1
5.0
8.03
8.0
VE
A
E
9.7-
12.7
7.
7-9.
7
BA
NA
NA
RIV
ER
41
305
0.9
2.3
2.8
4.1
AE
2.
7-4.
7

Tab
le 6
: Su
mm
ary
of S
tillw
ater
Ele
vatio
ns (c
ontin
ued)
26
Sti
llw
ater
Ele
vati
on (
Fee
t NA
VD
)
Bas
e F
lood
F
lood
ing
Sou
rce
an
d T
rans
ect
F
IRM
Pan
el
10-p
erce
nt-
annu
al-c
hanc
e 2-
perc
ent-
annu
al-c
hanc
e 1-
perc
ent-
annu
al-c
hanc
e 0.
2-pe
rcen
t-an
nual
-cha
nce
Z
one
Ele
vati
on1,
2 (
Fee
t NA
VD
)
42
285
0.3
0.9
1.2
2.0
AE
1.
7-2.
7
IND
IAN
RIV
ER
43
280,
290
0.6
1.7
2.7
3.8
AE
2.
7-3.
7
44
270
0.6
1.6
2.1
3.2
AE
1.
7-3.
7
AT
LA
NT
IC O
CE
AN
45
312
3.0
5.0
7.93
8.1
VE
A
E
9.7-
12.7
7.
7-9.
7
BA
NA
NA
RIV
ER
46
311
1.3
2.6
3.2
4.3
AE
2.
7-4.
7
47
295
0.2
0.9
1.1
1.7
AE
0.
7-2.
7
IND
IAN
RIV
ER
48
290,
295
0.8
1.9
2.5
3.9
AE
2.
7-3.
7
AT
LA
NT
IC O
CE
AN
49
313
3.0
5.0
7.93
8.1
VE
A
E
9.7-
12.7
7.
7-9.
7
BA
NA
NA
RIV
ER
50
313
0.6
1.6
2.1
2.9
AE
1.
7-3.
7
51
295
0.5
1.5
1.9
2.7
AE
1.
7-2.
7
IND
IAN
RIV
ER
52
290,
295
0.8
2.2
2.7
4.4
AE
2.
7-3.
7

Tab
le 6
: Su
mm
ary
of S
tillw
ater
Ele
vatio
ns (c
ontin
ued)
27
Sti
llw
ater
Ele
vati
on (
Fee
t NA
VD
)
Bas
e F
lood
F
lood
ing
Sou
rce
an
d T
rans
ect
F
IRM
Pan
el
10-p
erce
nt-
annu
al-c
hanc
e 2-
perc
ent-
annu
al-c
hanc
e 1-
perc
ent-
annu
al-c
hanc
e 0.
2-pe
rcen
t-an
nual
-cha
nce
Z
one
Ele
vati
on1,
2 (
Fee
t NA
VD
)
53
270,
290
0.7
1.9
2.4
3.8
AE
2.
7-3.
7
AT
LA
NT
IC O
CE
AN
54
313,
376
3.1
5.2
8.13
8.5
VE
A
E
10.7
-13.
7 7.
7-9.
7
BA
NA
NA
RIV
ER
55
313,
376
0.9
2.1
2.5
3.5
AE
2.
7-3.
7
56
295,
360
0.3
1.2
1.5
2.3
AE
1.
7-2.
7
IND
IAN
RIV
ER
57
290,
295
0.7
2.0
2.5
3.8
AE
2.
7-3.
7
58
290
0.7
1.9
2.4
3.6
AE
2.
7-3.
7
AT
LA
NT
IC O
CE
AN
59
376,
378
3.2
5.5
8.43
8.9
VE
A
E
10.7
-12.
7 8.
7-10
.7
BA
NA
NA
RIV
ER
60
360,
378
360,
378
0.5
0.9
1.3
2.1
1.7
2.6
2.5
3.5
AE
A
E
1.7-
2.7
2.7
61
360
0.6
1.4
1.8
2.7
AE
1.
7-3.
7
NE
WF
OU
ND
H
AR
BO
UR
62
360
1.5
3.0
3.6
4.8
AE
3.
7-4.
7
63
360
1.9
1.5
3.5
3.0
4.2
3.5
5.6
4.8
AE
A
E
4.7
4.7

Tab
le 6
: Su
mm
ary
of S
tillw
ater
Ele
vatio
ns (c
ontin
ued)
28
Sti
llw
ater
Ele
vati
on (
Fee
t NA
VD
)
Bas
e F
lood
F
lood
ing
Sou
rce
an
d T
rans
ect
F
IRM
Pan
el
10-p
erce
nt-
annu
al-c
hanc
e 2-
perc
ent-
annu
al-c
hanc
e 1-
perc
ent-
annu
al-c
hanc
e 0.
2-pe
rcen
t-an
nual
-cha
nce
Z
one
Ele
vati
on1,
2 (
Fee
t NA
VD
)
IND
IAN
RIV
ER
64
355
1.1
2.5
3.1
4.6
AE
2.
7-4.
7
65
355
1.2
2.7
3.4
4.9
AE
3.
7-4.
7
BA
NA
NA
RIV
ER
66
360
0.4
0.9
1.1
1.8
AE
0.
7-1.
7
67
360
0.5
1.1
1.3
1.9
AE
1.
7
NE
WF
OU
ND
H
AR
BO
UR
68
360
0.6
1.4
1.7
2.3
AE
1.
7-2.
7
69
360
0.8
1.7
2.2
3.0
AE
2.
7
AT
LA
NT
IC O
CE
AN
70
386,
388
3.4
3.4
5.7
5.7
8.93
6.9
9.4
9.4
VE
A
E
AE
10.7
-14.
7 8.
7-10
.7
6.7-
7.7
BA
NA
NA
RIV
ER
71
386,
388
0.1
1.0
1.1
1.4
AE
0.
7-1.
7
72
370
0.3
1.0
1.4
2.1
AE
1.
7-2.
7
IND
IAN
RIV
ER
73
370
0.5
1.6
2.1
3.2
AE
1.
7-2.
7
74
365
0.6
1.7
2.2
3.5
AE
2.
7
75
370
0.5
1.5
1.9
2.9
AE
1.
7-2.
7

Tab
le 6
: Su
mm
ary
of S
tillw
ater
Ele
vatio
ns (c
ontin
ued)
29
Sti
llw
ater
Ele
vati
on (
Fee
t NA
VD
)
Bas
e F
lood
F
lood
ing
Sou
rce
an
d T
rans
ect
F
IRM
Pan
el
10-p
erce
nt-
annu
al-c
hanc
e 2-
perc
ent-
annu
al-c
hanc
e 1-
perc
ent-
annu
al-c
hanc
e 0.
2-pe
rcen
t-an
nual
-cha
nce
Z
one
Ele
vati
on1,
2 (
Fee
t NA
VD
)
76
365,
370
0.5
1.5
1.9
2.9
AE
1.
7-2.
7
BA
NA
NA
RIV
ER
77
388
0.1
0.6
0.8
1.1
AE
0.
7-1.
7
AT
LA
NT
IC O
CE
AN
78
451
3.3
5.6
8.83
9.2
VE
A
E
10.7
-14.
7 8.
7-10
.7
BA
NA
NA
RIV
ER
79
453
0.4
1.2
1.5
2.3
AE
1.
7-2.
7
80
435
0.3
1.0
1.3
2.1
AE
1.
7-2.
7
IND
IAN
RIV
ER
81
435
0.3
1.3
1.8
2.7
AE
1.
7-2.
7
82
435
0.4
1.4
1.8
2.6
AE
1.
7-2.
7
AT
LA
NT
IC O
CE
AN
83
451,
453
3.3
5.5
8.73
9.0
VE
A
E
10.7
-13.
7 8.
7-10
.7
BA
NA
NA
RIV
ER
84
451,
453
0.7
1.9
2.3
3.3
AE
2.
7-3.
7
85
435
0.6
1.5
1.9
2.9
AE
1.
7-2.
7
IND
IAN
RIV
ER
86
435
0.3
1.3
1.7
2.7
AE
1.
7-2.
7

Tab
le 6
: Su
mm
ary
of S
tillw
ater
Ele
vatio
ns (c
ontin
ued)
30
Sti
llw
ater
Ele
vati
on (
Fee
t NA
VD
)
Bas
e F
lood
F
lood
ing
Sou
rce
an
d T
rans
ect
F
IRM
Pan
el
10-p
erce
nt-
annu
al-c
hanc
e 2-
perc
ent-
annu
al-c
hanc
e 1-
perc
ent-
annu
al-c
hanc
e 0.
2-pe
rcen
t-an
nual
-cha
nce
Z
one
Ele
vati
on1,
2 (
Fee
t NA
VD
)
87
435
0.3
1.3
1.8
2.6
AE
1.
7-2.
7
BA
NA
NA
RIV
ER
88
435
0.1
1.0
1.4
2.3
AE
1.
7
IND
IAN
RIV
ER
89
435
0.5
1.8
2.4
3.8
AE
2.
7-3.
7
AT
LA
NT
IC O
CE
AN
90
453,
462
3.3
5.5
8.73
9.0
VE
A
E
10.7
-13.
7 8.
7-10
.7
BA
NA
NA
RIV
ER
91
461
0.3
1.1
1.4
2.3
AE
1.
7
92
461
0.3
1.1
1.4
2.3
AE
1.
7
IND
IAN
RIV
ER
93
461,
442
0.3
1.4
2.0
3.2
AE
1.
7-2.
7
94
442
0.4
1.6
2.2
3.3
AE
1.
7-3.
7
AT
LA
NT
IC O
CE
AN
95
464
3.3
5.5
8.7
9.0
VE
A
E
10.7
-13.
7 8.
7-10
.7
IND
IAN
RIV
ER
96
463
0.3
1.3
1.7
2.9
AE
1.
7-2.
7
97
444
0.3
1.3
1.8
2.8
AE
1.
7-2.
7

Tab
le 6
: Su
mm
ary
of S
tillw
ater
Ele
vatio
ns (c
ontin
ued)
31
Sti
llw
ater
Ele
vati
on (
Fee
t NA
VD
)
Bas
e F
lood
F
lood
ing
Sou
rce
an
d T
rans
ect
F
IRM
Pan
el
10-p
erce
nt-
annu
al-c
hanc
e 2-
perc
ent-
annu
al-c
hanc
e 1-
perc
ent-
annu
al-c
hanc
e 0.
2-pe
rcen
t-an
nual
-cha
nce
Z
one
Ele
vati
on1,
2 (
Fee
t NA
VD
)
AT
LA
NT
IC O
CE
AN
98
464
3.2
5.4
8.63
8.8
VE
A
E
10.7
-13.
7 8.
7-10
.7
IND
IAN
RIV
ER
99
527
1.1
2.2
2.7
4.0
AE
2.
7-3.
7
100
526
1.1
2.2
2.7
4.0
AE
2.
7-3.
7
AT
LA
NT
IC O
CE
AN
101
527
3.2
5.4
8.63
8.8
VE
A
E
10.7
-13.
7 8.
7-10
.7
IND
IAN
RIV
ER
102
527
1.1
2.2
2.7
4.0
AE
2.
7-3.
7
103
526
1.1
2.2
2.7
4.0
AE
2.
7-3.
7
AT
LA
NT
IC O
CE
AN
104
529,
533
3.2
5.4
8.63
8.8
VE
A
E
10.7
-13.
7 8.
7-10
.7
IND
IAN
RIV
ER
105
529
2.0
3.2
3.7
5.0
AE
3.
7-5.
7
106
528
2.0
3.2
3.7
5.0
AE
3.
7-5.
7
AT
LA
NT
IC O
CE
AN
107
533
3.2
5.4
8.6
8.8
VE
A
E
10.7
-13.
7 8.
7-10
.7

Tab
le 6
: Su
mm
ary
of S
tillw
ater
Ele
vatio
ns (c
ontin
ued)
32
Sti
llw
ater
Ele
vati
on (
Fee
t NA
VD
)
Bas
e F
lood
F
lood
ing
Sou
rce
an
d T
rans
ect
F
IRM
Pan
el
10-p
erce
nt-
annu
al-c
hanc
e 2-
perc
ent-
annu
al-c
hanc
e 1-
perc
ent-
annu
al-c
hanc
e 0.
2-pe
rcen
t-an
nual
-cha
nce
Z
one
Ele
vati
on1,
2 (
Fee
t NA
VD
)
IND
IAN
RIV
ER
108
529
2.0
3.2
3.7
5.0
AE
3.
7-5.
7
109
528,
529
2.0
3.2
3.7
5.0
AE
3.
7-5.
7
AT
LA
NT
IC O
CE
AN
110
541
3.2
5.3
8.43
8.8
VE
A
E
10.7
-13.
7 8.
7-10
.7
IND
IAN
RIV
ER
111
541
2.1
3.3
3.8
5.1
AE
3.
7-5.
7
112
540
2.1
3.3
3.8
5.1
AE
3.
7-5.
7
AT
LA
NT
IC O
CE
AN
113
541,
543
3.2
5.3
8.43
8.8
VE
A
E
10.7
-13.
7 8.
7-10
.7
IND
IAN
RIV
ER
114
543
2.1
3.3
3.8
5.1
AE
3.
7-5.
7
115
540
2.1
3.3
3.8
5.1
AE
3.
7-5.
7
AT
LA
NT
IC O
CE
AN
116
607
3.2
5.3
8.43
8.8
VE
A
E
10.7
-13.
7
8.7-
10.7
IND
IAN
RIV
ER
117
607
2.2
3.4
3.9
5.2
AE
3.
7-5.
7
118
610
2.2
3.4
3.9
5.2
AE
3.
7-5.
7

Tab
le 6
: Su
mm
ary
of S
tillw
ater
Ele
vatio
ns (c
ontin
ued)
33
Sti
llw
ater
Ele
vati
on (
Fee
t NA
VD
)
Bas
e F
lood
F
lood
ing
Sou
rce
an
d T
rans
ect
F
IRM
Pan
el
10-p
erce
nt-
annu
al-c
hanc
e 2-
perc
ent-
annu
al-c
hanc
e 1-
perc
ent-
annu
al-c
hanc
e 0.
2-pe
rcen
t-an
nual
-cha
nce
Z
one
Ele
vati
on1,
2 (
Fee
t NA
VD
)
AT
LA
NT
IC O
CE
AN
119
607,
609
3.2
5.3
8.33
8.8
VE
A
E
10.7
-13.
7 8.
7-10
.7
IND
IAN
RIV
ER
120
607,
609
2.2
3.4
3.9
5.2
AE
3.
7-5.
7
121
610
2.2
3.4
3.9
5.2
AE
3.
7-5.
7
AT
LA
NT
IC O
CE
AN
122
636
3.2
5.3
8.33
8.8
VE
A
E
10.7
-13.
7 8.
7-10
.7
IND
IAN
RIV
ER
123
609,
617
2.3
3.5
4.0
5.3
AE
3.
7-5.
7
124
617
2.3
3.5
4.0
5.3
AE
3.
7-5.
7
AT
LA
NT
IC O
CE
AN
125
636
3.2
5.3
8.33
8.7
VE
A
E
10.7
-13.
7 8.
7-10
.7
IND
IAN
RIV
ER
126
617,
636
2.1
3.3
3.7
4.9
AE
3.
7-4.
7
127
617
2.3
3.4
4.0
5.3
AE
3.
7-5.
7
AT
LA
NT
IC O
CE
AN
128
636,
638
3.1
5.2
8.23
8.5
VE
A
E
10.7
-13.
7 8.
7-10
.7

Tab
le 6
: Su
mm
ary
of S
tillw
ater
Ele
vatio
ns (c
ontin
ued)
34
Sti
llw
ater
Ele
vati
on (
Fee
t NA
VD
)
Bas
e F
lood
F
lood
ing
Sou
rce
an
d T
rans
ect
F
IRM
Pan
el
10-p
erce
nt-
annu
al-c
hanc
e 2-
perc
ent-
annu
al-c
hanc
e 1-
perc
ent-
annu
al-c
hanc
e 0.
2-pe
rcen
t-an
nual
-cha
nce
Z
one
Ele
vati
on1,
2 (
Fee
t NA
VD
)
IND
IAN
RIV
ER
129
636,
638
1.7
2.7
3.3
4.5
AE
3.
7-4.
7
130
619
2.0
3.5
4.0
5.4
AE
3.
7-5.
7
AT
LA
NT
IC O
CE
AN
131
639
3.1
5.2
8.23
8.5
VE
A
E
10.7
-13.
7 8.
7-10
.7
IND
IAN
RIV
ER
132
638,
639,
726,
727
1.8
3.0
3.6
5.0
AE
3.
7-5.
7
133
726
2.1
3.6
4.2
5.6
AE
3.
7-5.
7
AT
LA
NT
IC O
CE
AN
134
727
3.1
5.2
8.23
8.5
VE
A
E
10.7
-13.
7 8.
7-10
.7
IND
IAN
RIV
ER
135
727
1.9
3.2
3.8
5.4
AE
3.
7-5.
7
1 May
incl
ude
effe
cts
of w
ave
acti
on
2 D
ue to
map
sca
le li
mit
atio
ns, b
ase
floo
d el
evat
ions
sho
wn
on m
ap m
ay r
epre
sent
ave
rage
ele
vati
ons
3 In
clud
es th
e ef
fect
s of
wav
e se
tup

35
3.2 Hydraulic Analyses
Analyses of the hydraulic characteristics of flooding from the sources studied were carried out to provide estimates of the elevations of floods of the selected recurrence intervals. Users should be aware that flood elevations shown on the FIRM represent rounded whole-foot elevations and may not exactly reflect the elevations shown on the Flood Profiles or in the Floodway Data tables in the FIS report. Flood elevations shown on the FIRM are primarily intended for flood insurance rating purposes. For construction and/or floodplain management purposes, users are cautioned to use the flood elevation data presented in this FIS in conjunction with the data shown on the FIRM.
Locations of selected cross sections used in the hydraulic analyses are shown on the Flood Profiles (Exhibit 1). For stream segments for which a Floodway was computed, selected cross-section locations are also shown on the FIRM (Exhibit 2).
The hydraulic analyses for this study were based on unobstructed flow. The flood elevations shown on the Flood Profiles (Exhibit 1) are thus considered valid only if hydraulic structures remain unobstructed, operate properly, and do not fail.
3.2.1 Methods for Flooding Sources with New or Revised Analyses in Current Study
The dynamic hydraulic routing for North Merrit Island area with many depression areas was performed using the Interconnected Channel and Pond Routing (ICPR) program, version 3.10 (Reference 28) to determine the 1-percent-annual-chance flood elevation. The dimensions and geometry of drainage structures and interconnected channels were obtained form field survey. Storage volume parameters are calculated using the ArcHydro ESRI toolset (Reference 29) based on digital terrain data and updated with as-built information. The available storage of ponding area was calculated in a half foot increment from the lowest elevation in the sub-basin to the highest.
3.2.2 Methods for Flooding Sources Incorporated from Previous Studies
Water-surface elevations for floods of the selected recurrence intervals were developed using the HEC-2 computer model (Reference 30). Cross sections for the backwater analyses were obtained from field surveys (Reference 31). In some cases, topographic maps were used to extend surveyed cross sections (Reference 32; 33). Some cross sections for Turkey Creek tributaries were obtained from the "Brook Hollow Stormwater Management Master Plan" (Reference 14).
All bridges and culverts were field-checked to obtain elevation data and structural geometry.
Channel roughness factors (Manning's "n" values) used in the hydraulic computations were chosen by engineering judgment on the basis of field observation and aerial photographs of the streams and floodplain areas (Reference 34; 35; 36). The detailed roughness value ranges for each stream are listed in Table 7, “Summary of Roughness Coefficients.”

36
Table 7: Summary of Roughness Coefficients
Flooding Source Roughness Coefficients
Channel Overbanks
Crane Creek 0.030–0.060 0.040–0.100
Crane Creek Channel A 0.030–0.060 0.040–0.100
Crane Creek Channel B 0.030–0.060 0.050–0.100
Crane Creek Diversion from St. John’s River 0.030–0.060 0.040–0.100
Eau Gallie River 0.035–0.050 0.050–0.130
Goat Creek 0.030–0.060 0.040–0.090
Horse Creek 0.060 0.150
Kid Creek 0.035–0.070 0.060–0.120
North Prong Creek 0.030–0.038 0.100
Otter Creek 0.060 0.150
South Prong Creek 0.040–0.050 0.070–0.090
Trout Creek 0.035–0.060 0.060–0.090
Turkey Creek (including Channels A–E, G, and C-76)
0.030–0.100 0.050–0.150
The slope-area method was used to set the HEC-2 starting water-surface elevation for all streams studied in detail other than Horse Creek and Otter Creek; starting water-surface elevations for those two streams were based on the computed water-surface elevation at the confluence with the receiving stream.
The water-surface profiles for the St. John's River were obtained from the USACE (Reference 12). The 0.2-percent-annual-chance frequency profiles were projected from the lower frequency levels of this study.
Hydraulic analyses were carried out to provide estimates of the elevations of floods of the selected recurrence intervals caused by storm surge along each of the shorelines. These analyses considered storm characteristics and the shoreline and bathymetric characteristics of the flooding sources. The FEMA standard coastal storm surge model is a numerical hydrodynamic computer model that calculates the coastal storm surges previously described in Section 3.1.
The FEMA storm surge model was used to simulate the hydrodynamic behavior of the surge generated by the various synthetic storms. This model utilizes a grid pattern approximating the geographical features of the study area and the adjoining areas. Surges were computed using grids of 5 nautical miles.

37
Water depths and land heights for the model grid systems were obtained from topographic maps, bathymetric maps, hydrographic surveys, nautical charts, beach profiles, aerial photographs, and coastal construction control line maps (References 32; 37; 38; 39; 40; 41; 42).
The methodology for analyzing the effects of wave heights associated with coastal storm surge flooding is described in a report prepared by the National Academy of Sciences (NAS) (Reference 43). This method is based on the following major concepts. First, depth-limited waves in shallow water reach a maximum breaking height that is equal to 0.78 times the stillwater depth. The wave crest is 70 percent of the total wave height above the stillwater level. The second major concept is that wave height may be diminished by dissipation of energy due to the presence of obstructions, such as sand dunes, dikes and seawalls, buildings, and vegetation. The amount of energy dissipation is a function of the physical characteristics of the obstruction and is determined by NAS procedures (Reference 43). The third major concept is that wave height can be regenerated in open fetch areas due to the transfer of wind energy to the water. This added energy is related to fetch length and depth.
Transects (cross-section lines) were located along the coastal areas as illustrated in Figure 1, The transects were located with consideration given to the physical and cultural characteristics of the land so that they would closely represent conditions in their locality. Transects were spaced close together in areas of complex topography and dense development. In areas having more uniform characteristics, they were spaced at large intervals. It was also necessary to locate transects in areas where unique flooding existed and in areas where computed wave heights varied significantly between adjacent transects.

--i
7
7
..
~
fL7
/
,,0
i,'i
\./ 'f',
I)
d
"""
.?I
(..)
6
...~\
II
'c")'I}
.,.~~.:"l.
1
\-"
\
(_,JO
~
oo
('
~. "'L,,-'
(
,I C'::>/i ..j
() . )'~J/,) \ '. 1 I ,
~)J )I "i 1/,)
('
~,
I. ••••• :.'~.<::-...'•.....1 .
(~
(
"\~I,
o{,
( ~)
; l,J
+\.', ')
~ '-('.. \~'" ?t(~~ ( ):
", \ ."L')
\'(~L._./\
\
C' {'t,
\
(I""'i'60 I 5
fl\ .~"'0\
7,,1,
_-,8I
")·32
.i.
27
\:v i~ '\"".., .
. '-'\,'. .O~~;"'"""~=_ ';__j,
.Ill
-( ~O, r--'r:-~);. 4
/
INDIAN RIVER CO
'.:
\, .....(j {?
<.~.d ,.. l( ~)'\ \.\ \~
.I)
°R••cit2/
+-
_ _ RBfYORR'Q", ). >1 ,.
;/0
2
20
/6
40
25
"
5'
,\
1\
~1 .
6'
~.t.
11
\1 • , ('"'YAIUSI' f___., :J: I
u
. 6.
au,...y i
o
+
iIId Rr~de;
l !''"''' I"<".", L"
\\<'~,,1.:0
u 9--t
Ii!
1/l
o
-r-'
II
.,'1B I ,'-' IJ)
'~~,\-l'~",\
:~ - ('----
~i
j ORANGE COUNTY- - Iosci"oLA'COu;;ry-:
i
II
:-1,--
TRANSECT LOCATION
FEDERAL EMERGENCY MANAGEMENT AGENCY
BREVARD COUNTY, FLAND INCORPORATED AREAS
4 0t==I t=-=1 .-==t
APPROXIMATE SCALE
4 8
MAP
12 MILES

Table 8: Transect Locations, Stillwater Starting Elevations, and Initial Wave Crest Elevations (continued)
51
Transect Location 1-percent-annual-chance Elevation (Feet NAVD)
Stillwater Wave Crest
134 From the Atlantic coastline, approximately 1.3 miles south of Long Point Road, extending west
8.26 13.71
135 From the Indian River east bank, approximately 1.3 miles south of Long Point Road, extending east
3.8 5.83
FLOODING SOURCE 1Atlantic Ocean 2Mosquito Lagoon 3Indian River
4Banana River 5Banana River/New Found Harbour 6Includes the effects of wave runup
3.3 Vertical Datum
All FIS reports and FIRMs are referenced to a specific vertical datum. The vertical datum provides a starting point against which flood, ground, and structure elevations can be referenced and compared. Until recently, the standard vertical datum used for newly created or revised FIS reports and FIRMs was the National Geodetic Vertical Datum of 1929 (NGVD). With the completion of the North American Vertical Datum of 1988 (NAVD), many FIS reports and FIRMs are now prepared using NAVD as the referenced vertical datum.
Flood elevations shown in this FIS report and on the FIRM are referenced to the NAVD88. These flood elevations must be compared to structure and ground elevations referenced to the same vertical datum. Some of the data used in this revision were taken from the prior effective FIS reports and FIRMs and adjusted to NAVD88. The datum conversion factor from NGVD29 to NAVD88 in Brevard County is negative 1.3 feet.
For information regarding conversion between the NGVD and NAVD, visit the National Geodetic Survey website at Hwww.ngs.noaa.govH, or contact the National Geodetic Survey at the following address:
Vertical Network Branch, N/CG13 National Geodetic Survey, NOAA Silver Spring Metro Center 3 1315 East-West Highway Silver Spring, Maryland 20910 (301) 713-3191
Temporary vertical monuments are often established during the preparation of a flood hazard analysis for the purpose of establishing local vertical control. Although these monuments are not shown on the FIRM, they may be found in the Technical Support Data Notebook associated with the FIS report and FIRM for this community. Interested individuals may contact FEMA to access these data.

52
To obtain current elevation, description, and/or location information for benchmarks shown on this map, please contact the Information Services Branch of the NGS at (301) 713-3242, or visit their Web site at Hwww.ngs.noaa.govH.
4.0 FLOODPLAIN MANAGEMENT APPLICATIONS
The NFIP encourages State and local governments to adopt sound floodplain management programs. To assist in this endeavor, each FIS report provides 1-percent-annual-chance floodplain data, which may include a combination of the following: 10-, 2-, 1-, and 0.2-percent-annual-chance flood elevations; delineations of the 1- and 0.2-percent-annual-chance floodplains; and a 1-percent-annual-chance floodway. This information is presented on the FIRM and in many components of the FIS report, including Flood Profiles, Floodway Data tables, and Summary of Stillwater Elevation tables. Users should reference the data presented in the FIS report as well as additional information that may be available at the local community map repository before making flood elevation and/or floodplain boundary determinations.
4.1 Floodplain Boundaries
To provide a national standard without regional discrimination, the 1-percent-annual-chance flood has been adopted by FEMA as the base flood for floodplain management purposes. The 0.2-percent-annual-chance flood is employed to indicate additional areas of flood risk in the community. For each stream studied by detailed methods, the 1- and 0.2-percent-annual-chance floodplain boundaries have been delineated using the flood elevations determined at each cross section.
For each stream studied by detailed methods, the 1- and 0.2-percent-annual-chance floodplain boundaries have been delineated using the flood elevations determined at each cross section. Between cross sections, the boundaries were interpolated using elevations obtained from 10 meter Digital Elevation Models produced by the U.S. Geological Survey (Reference 2).
The 1- and 0.2-percent-annual-chance floodplain boundaries are shown on the FIRM. On this map, the 1-percent-annual-chance floodplain boundary corresponds to the boundary of the areas of special flood hazards (Zones A and AE), and the 0.2-percent-annual-chance floodplain boundary corresponds to the boundary of areas of moderate flood hazards. In cases where the 1- and 0.2-percent-annual-chance floodplain boundaries are close together, only the 1-percent-annual-chance floodplain boundary has been shown. Small areas within the floodplain boundaries may lie above the flood elevations, but cannot be shown due to limitations of the map scale and/or lack of detailed topographic data.
For the streams studied by approximate methods, only the 1-percent-annual-chance floodplain boundary is shown on the FIRM.
4.2 Floodways
Encroachment on floodplains, such as structures and fill, reduces flood-carrying capacity, increases flood heights and velocities, and increases flood hazards in areas beyond the

53
encroachment itself. One aspect of floodplain management involves balancing the economic gain from floodplain development against the resulting increase in flood hazard. For purposes of the NFIP, a floodway is used as a tool to assist local communities in this aspect of floodplain management. Under this concept, the area of the 1-percent-annual-chance floodplain is divided into a floodway and a floodway fringe. The floodway is the channel of a stream, plus any adjacent floodplain areas, that must be kept free of encroachment so that the base flood can be carried without substantial increases in flood heights. Minimum Federal standards limit such increases to 1 foot, provided that hazardous velocities are not produced. The floodways in this study are presented to local agencies as minimum standards that can be adopted directly or that can be used as a basis for additional floodway studies.
The floodways presented in this study were computed for certain stream segments on the basis of equal-conveyance reduction from each side of the floodplain. Floodway widths were computed at cross sections. Between cross sections, the floodway boundaries were interpolated. The results of the floodway computations are tabulated for selected cross sections (see Table 9, “Floodway Data Table”). In cases where the floodway and 1-percent-annual-chance floodplain boundaries are either close together or collinear, only the floodway boundary is shown.
There are no cross sections located within the City of Melbourne for Otter Creek; therefore, no Floodway Data is provided for this stream. No floodway was computed for Horse Creek. Portions of the floodway width for South Prong Creek extend beyond the county boundary.
Encroachment into areas subject to inundation by floodwaters having hazardous velocities aggravates the risk of flood damage, and heightens potential flood hazards by further increasing velocities. A listing of stream velocities at selected cross sections is provided in Table 9, "Floodway Data Table." In order to reduce the risk of property damage in areas where the stream velocities are high, the community may wish to restrict development in areas outside the floodway.

FL
OO
DIN
G S
OU
RC
E
FL
OO
DW
AY
B
AS
E F
LO
OD
WA
TE
R S
UR
FA
CE
E
LE
VA
TIO
N
CR
OS
S
SE
CT
ION
D
IST
AN
CE
1 W
IDT
H
(FE
ET
)
SE
CT
ION
AR
EA
(S
QU
AR
E
FE
ET
)
ME
AN
V
EL
OC
ITY
(F
EE
T P
ER
S
EC
ON
D)
RE
GU
LA
TO
RY
(N
AV
D)
WIT
HO
UT
F
LO
OD
WA
Y
(NA
VD
)
WIT
H
FL
OO
DW
AY
(N
AV
D)
INC
RE
AS
E
TU
RK
EY
CR
EE
K
A
2,
150
180
1,59
1 6.
7 5.
7 2.
32 3.
1 0.
8 B
2,
481
500
5,44
3 2.
0 3.
9 3.
92 4.
7 0.
8 C
3,
319
520
4,55
5 2.
3 4.
5 4.
5 5.
4 0.
9 D
4,
619
740
5,09
1 2.
1 5.
0 5.
0 5.
7 0.
7 E
6,
119
585
4,36
5 2.
5 5.
5 5.
5 6.
1 0.
6 F
8,
519
449
3,59
6 3.
0 6.
8 6.
8 7.
3 0.
5 G
10
,749
11
4 1,
328
7.1
9.7
9.7
10.7
1.
0 H
12
,649
91
1 9,
004
1.0
12.2
12
.2
13.0
0.
8
1 S
trea
m d
ista
nce
in f
eet a
bove
con
fluen
ce w
ith In
dian
Riv
er
2 E
leva
tions
com
pute
d w
ithou
t con
side
ratio
n of
sto
rm s
urge
eff
ects
fro
m In
dian
Riv
er
TABLE 9
FE
DE
RA
L E
ME
RG
EN
CY
MA
NA
GE
ME
NT
AG
EN
CY
TU
RK
EY
CR
EE
K
BR
EV
AR
D C
OU
NT
Y, F
L
AN
D IN
CO
RP
OR
AT
ED
AR
EA
S
FL
OO
DW
AY
DA
TA

FL
OO
DIN
G S
OU
RC
E
FL
OO
DW
AY
B
AS
E F
LO
OD
WA
TE
R S
UR
FA
CE
E
LE
VA
TIO
N
CR
OS
S
SE
CT
ION
D
IST
AN
CE
1 W
IDT
H
(FE
ET
)
SE
CT
ION
AR
EA
(S
QU
AR
E
FE
ET
)
ME
AN
V
EL
OC
ITY
(F
EE
T P
ER
S
EC
ON
D)
RE
GU
LA
TO
RY
(N
AV
D)
WIT
HO
UT
F
LO
OD
WA
Y
(NA
VD
)
WIT
H
FL
OO
DW
AY
(N
AV
D)
INC
RE
AS
E
TU
RK
EY
CR
EE
K
CH
AN
NE
L A
A
1,
800
47
262
2.4
8.7
4.92
5.5
0.6
B
2,05
0 82
30
6 2.
1 8.
7 5.
42 6.
3 0.
9 C
3,
450
133
367
1.7
8.7
8.42
9.0
0.6
D
4,85
0 21
1 65
7 0.
8 10
.1
10.1
11
.1
1.0
E
6,00
0 12
4 46
2 0.
7 10
.9
10.9
11
.9
1.0
F
8,20
0 78
17
4 1.
9 15
.4
15.4
15
.4
0.0
G
8,36
3 81
33
6 1.
0 17
.4
17.4
17
.4
0.0
H
8,86
3 18
0 35
8 0.
9 17
.5
17.5
17
.5
0.0
I 9,
583
100
287
0.4
17.6
17
.6
17.8
0.
2 J
10,4
63
20
24
4.9
17.9
17
.9
18.1
0.
2
1 S
trea
m d
ista
nce
in f
eet a
bove
con
fluen
ce w
ith T
urke
y C
reek
2 E
leva
tions
com
pute
d w
ithou
t con
side
ratio
n of
bac
kwat
er e
ffec
ts f
rom
Tur
key
Cre
ek
TABLE 9
FE
DE
RA
L E
ME
RG
EN
CY
MA
NA
GE
ME
NT
AG
EN
CY
TU
RK
EY
CR
EE
K C
HA
NN
EL
A
BR
EV
AR
D C
OU
NT
Y, F
L
AN
D IN
CO
RP
OR
AT
ED
AR
EA
S
FL
OO
DW
AY
DA
TA

FL
OO
DIN
G S
OU
RC
E
FL
OO
DW
AY
B
AS
E F
LO
OD
WA
TE
R S
UR
FA
CE
E
LE
VA
TIO
N
CR
OS
S
SE
CT
ION
D
IST
AN
CE
1 W
IDT
H
(FE
ET
)
SE
CT
ION
AR
EA
(S
QU
AR
E
FE
ET
)
ME
AN
V
EL
OC
ITY
(F
EE
T P
ER
S
EC
ON
D)
RE
GU
LA
TO
RY
(N
AV
D)
WIT
HO
UT
F
LO
OD
WA
Y
(NA
VD
)
WIT
H
FL
OO
DW
AY
(N
AV
D)
INC
RE
AS
E
TU
RK
EY
CR
EE
K
CH
AN
NE
L B
A
1,
200
54
154
2.9
12.7
2.
62 3.
6 1.
0 B
3,
050
91
268
1.7
12.7
9.
02 9.
5 0.
5 C
4,
350
38
160
2.8
12.7
11
.72
12.4
0.
7 D
5,
750
55
137
3.2
15.4
15
.4
15.5
0.
1 E
7,
075
64
195
2.0
17.0
17
.0
17.2
0.
2
1 S
trea
m d
ista
nce
in f
eet a
bove
con
fluen
ce w
ith T
urke
y C
reek
2 E
leva
tions
com
pute
d w
ithou
t con
side
ratio
n of
bac
kwat
er e
ffec
ts f
rom
Tur
key
Cre
ek
TABLE 9
FE
DE
RA
L E
ME
RG
EN
CY
MA
NA
GE
ME
NT
AG
EN
CY
TU
RK
EY
CR
EE
K C
HA
NN
EL
B
BR
EV
AR
D C
OU
NT
Y, F
L
AN
D IN
CO
RP
OR
AT
ED
AR
EA
S
FL
OO
DW
AY
DA
TA

FL
OO
DIN
G S
OU
RC
E
FL
OO
DW
AY
B
AS
E F
LO
OD
WA
TE
R S
UR
FA
CE
E
LE
VA
TIO
N
CR
OS
S
SE
CT
ION
D
IST
AN
CE
1 W
IDT
H
(FE
ET
)
SE
CT
ION
AR
EA
(S
QU
AR
E
FE
ET
)
ME
AN
V
EL
OC
ITY
(F
EE
T P
ER
S
EC
ON
D)
RE
GU
LA
TO
RY
(N
AV
D)
WIT
HO
UT
F
LO
OD
WA
Y
(NA
VD
)
WIT
H
FL
OO
DW
AY
(N
AV
D)
INC
RE
AS
E
TU
RK
EY
CR
EE
K
CH
AN
NE
L C
A
40
0 27
0 1,
041
0.9
12.7
5.
72 6.
7 1.
0 B
2,
000
110
244
3.8
12.7
7.
72 8.
7 1.
0 C
3,
700
12
61
3.1
17.2
17
.2
18.0
0.
8 D
4,
800
106
363
0.5
17.7
17
.7
18.7
1.
0 E
5,
800
36
84
2.3
17.9
17
.9
18.9
1.
0
1 S
trea
m d
ista
nce
in f
eet a
bove
con
fluen
ce w
ith T
urke
y C
reek
2 E
leva
tions
com
pute
d w
ithou
t con
side
ratio
n of
bac
kwat
er e
ffec
ts f
rom
Tur
key
Cre
ek
TABLE 9
FE
DE
RA
L E
ME
RG
EN
CY
MA
NA
GE
ME
NT
AG
EN
CY
TU
RK
EY
CR
EE
K C
HA
NN
EL
C
BR
EV
AR
D C
OU
NT
Y, F
L
AN
D IN
CO
RP
OR
AT
ED
AR
EA
S
FL
OO
DW
AY
DA
TA

FL
OO
DIN
G S
OU
RC
E
FL
OO
DW
AY
B
AS
E F
LO
OD
WA
TE
R S
UR
FA
CE
E
LE
VA
TIO
N
CR
OS
S
SE
CT
ION
D
IST
AN
CE
1 W
IDT
H
(FE
ET
)
SE
CT
ION
AR
EA
(S
QU
AR
E
FE
ET
)
ME
AN
V
EL
OC
ITY
(F
EE
T P
ER
S
EC
ON
D)
RE
GU
LA
TO
RY
(N
AV
D)
WIT
HO
UT
F
LO
OD
WA
Y
(NA
VD
)
WIT
H
FL
OO
DW
AY
(N
AV
D)
INC
RE
AS
E
TU
RK
EY
CR
EE
K
CH
AN
NE
L C
-76
A
1,
441
51
170
2.5
13.6
13
.6
14.3
0.
7 B
3,
471
56
204
2.1
16.5
16
.5
16.5
0.
0 C
4,
779
57
299
1.4
19.6
19
.6
19.6
0.
0 D
6,
249
54
255
1.3
24.8
24
.8
25.5
0.
7 E
8,
880
28
184
1.7
26.5
26
.5
27.4
0.
9 F
10
,250
60
22
5 1.
4 27
.2
27.2
28
.2
1.0
1 S
trea
m d
ista
nce
in f
eet a
bove
con
fluen
ce w
ith T
urke
y C
reek
Cha
nnel
D
TABLE 9
FE
DE
RA
L E
ME
RG
EN
CY
MA
NA
GE
ME
NT
AG
EN
CY
TU
RK
EY
CR
EE
K C
HA
NN
EL
C-7
6
BR
EV
AR
D C
OU
NT
Y, F
L
AN
D IN
CO
RP
OR
AT
ED
AR
EA
S
FL
OO
DW
AY
DA
TA

FL
OO
DIN
G S
OU
RC
E
FL
OO
DW
AY
B
AS
E F
LO
OD
WA
TE
R S
UR
FA
CE
E
LE
VA
TIO
N
CR
OS
S
SE
CT
ION
D
IST
AN
CE
1 W
IDT
H
(FE
ET
)
SE
CT
ION
AR
EA
(S
QU
AR
E
FE
ET
)
ME
AN
V
EL
OC
ITY
(F
EE
T P
ER
S
EC
ON
D)
RE
GU
LA
TO
RY
(N
AV
D)
WIT
HO
UT
F
LO
OD
WA
Y
(NA
VD
)
WIT
H
FL
OO
DW
AY
(N
AV
D)
INC
RE
AS
E
TU
RK
EY
CR
EE
K
CH
AN
NE
L D
A
20
0 18
6 82
8 0.
9 12
.7
11.6
2 12
.6
1.0
B
900
142
654
0.9
12.7
11
.92
12.9
1.
0 C
1,
825
71
164
3.7
12.9
12
.9
13.8
0.
9 D
2,
002
190
986
0.6
15.6
15
.6
16.6
1.
0 E
2,
802
169
697
0.9
15.7
15
.7
16.7
1.
0 F
3,
602
76
261
2.3
16.0
16
.0
17.0
1.
0
1 S
trea
m d
ista
nce
in f
eet a
bove
con
fluen
ce w
ith T
urke
y C
reek
Cha
nnel
C
2 E
leva
tions
com
pute
d w
ithou
t con
side
ratio
n of
bac
kwat
er e
ffec
ts f
rom
Tur
key
Cre
ek
TABLE 9
FE
DE
RA
L E
ME
RG
EN
CY
MA
NA
GE
ME
NT
AG
EN
CY
TU
RK
EY
CR
EE
K C
HA
NN
EL
D
BR
EV
AR
D C
OU
NT
Y, F
L
AN
D IN
CO
RP
OR
AT
ED
AR
EA
S
FL
OO
DW
AY
DA
TA

FL
OO
DIN
G S
OU
RC
E
FL
OO
DW
AY
B
AS
E F
LO
OD
WA
TE
R S
UR
FA
CE
E
LE
VA
TIO
N
CR
OS
S
SE
CT
ION
D
IST
AN
CE
1 W
IDT
H
(FE
ET
)
SE
CT
ION
AR
EA
(S
QU
AR
E
FE
ET
)
ME
AN
V
EL
OC
ITY
(F
EE
T P
ER
S
EC
ON
D)
RE
GU
LA
TO
RY
(N
AV
D)
WIT
HO
UT
F
LO
OD
WA
Y
(NA
VD
)
WIT
H
FL
OO
DW
AY
(N
AV
D)
INC
RE
AS
E
TU
RK
EY
CR
EE
K
CH
AN
NE
L E
A
85
0 44
15
3 0.
5 18
.4
18.4
18
.6
0.2
B
1,63
6 28
46
1.
8 19
.1
19.1
19
.4
0.3
1 S
trea
m d
ista
nce
in f
eet a
bove
con
fluen
ce w
ith T
urke
y C
reek
Cha
nnel
D
TABLE 9
FE
DE
RA
L E
ME
RG
EN
CY
MA
NA
GE
ME
NT
AG
EN
CY
TU
RK
EY
CR
EE
K C
HA
NN
EL
E
BR
EV
AR
D C
OU
NT
Y, F
L
AN
D IN
CO
RP
OR
AT
ED
AR
EA
S
FL
OO
DW
AY
DA
TA

FL
OO
DIN
G S
OU
RC
E
FL
OO
DW
AY
B
AS
E F
LO
OD
WA
TE
R S
UR
FA
CE
E
LE
VA
TIO
N
CR
OS
S
SE
CT
ION
D
IST
AN
CE
1 W
IDT
H
(FE
ET
)
SE
CT
ION
AR
EA
(S
QU
AR
E
FE
ET
)
ME
AN
V
EL
OC
ITY
(F
EE
T P
ER
S
EC
ON
D)
RE
GU
LA
TO
RY
(N
AV
D)
WIT
HO
UT
F
LO
OD
WA
Y
(NA
VD
)
WIT
H
FL
OO
DW
AY
(N
AV
D)
INC
RE
AS
E
TU
RK
EY
CR
EE
K
CH
AN
NE
L G
A
20
0 40
18
6 1.
7 12
.7
11.2
2 12
.2
1.0
B
1,07
5 23
42
7.
6 13
.7
13.7
13
.8
0.1
C
2,07
5 43
17
0 1.
9 16
.7
16.7
16
.8
0.1
D
3,07
5 40
76
4.
0 18
.1
18.1
18
.1
0.0
1 S
trea
m d
ista
nce
in f
eet a
bove
con
fluen
ce w
ith T
urke
y C
reek
Cha
nnel
C
2 E
leva
tions
com
pute
d w
ithou
t con
side
ratio
n of
bac
kwat
er e
ffec
ts f
rom
Tur
key
Cre
ek
TABLE 9
FE
DE
RA
L E
ME
RG
EN
CY
MA
NA
GE
ME
NT
AG
EN
CY
TU
RK
EY
CR
EE
K C
HA
NN
EL
G
BR
EV
AR
D C
OU
NT
Y, F
L
AN
D IN
CO
RP
OR
AT
ED
AR
EA
S
FL
OO
DW
AY
DA
TA

72
Near the mouths of streams studied in detail, floodway computations are made without regard to flood elevations on the receiving water body. Therefore, "Without Floodway" elevations presented in Table 9 for certain downstream cross sections of the Eau Gallie River; Turkey Creek; Turkey Creek Channels A, B, C, D, and G; Goat Creek; Kid Creek; Crane Creek; North Prong Creek; and South Prong Creek are lower than the regulatory flood elevations in those areas, which must take into account the 1-percent-annual-chance flooding due to backwater from other sources.
The area between the floodway and 1-percent-annual-chance floodplain boundaries is termed the floodway fringe. The floodway fringe encompasses the portion of the floodplain that could be completely obstructed without increasing the water-surface elevation (WSEL) of the base flood more than 1 foot at any point. Typical relationships between the floodway and the floodway fringe and their significance to floodplain development are shown in Figure 3, “Floodway Schematic.”.
Figure 3: Floodway Schematic

73
5.0 INSURANCE APPLICATIONS
For flood insurance rating purposes, flood insurance zone designations are assigned to a community based on the results of the engineering analyses. These zones are as follows:
Zone A
Zone A is the flood insurance rate zone that corresponds to the 1-percent-annual-chance floodplains that are determined in the FIS report by approximate methods. Because detailed hydraulic analyses are not performed for such areas, no base (1-percent-annual-chance) flood elevations (BFEs) or depths are shown within this zone.
Zone AE
Zone AE is the flood insurance rate zone that corresponds to the 1-percent-annual-chance floodplains that are determined in the FIS report by detailed methods. Whole-foot BFEs derived from the detailed hydraulic analyses are shown at selected intervals within this zone.
Zone AH
Zone AH is the flood insurance rate zone that corresponds to the areas of 1-percent-annual-choice shallow flooding (usually areas of ponding) where average depths are between 1 and 3 feet. Whole-foot base flood elevations derived from the detailed hydraulic analyses are shown at selected intervals within this zone.
Zone AO
Zone AO is the flood insurance rate zone that corresponds to the areas of 1-percent-annual-chance shallow flooding (usually sheet flow on sloping terrain) where average depths are between 1 and 3 feet. Average whole-depths derived from the detailed hydraulic analyses are shown within this zone.
Zone VE
Zone VE is the flood insurance rate zone that corresponds to the 1-percent-annual-chance coastal floodplains that have additional hazards associated with storm waves. Whole-foot base flood elevations derived from the detailed hydraulic analyses are shown at selected intervals within this zone.
Zone X
Zone X is the flood insurance rate zone that corresponds to areas outside the 0.2-percent-annual-chance floodplain, areas within the 0.2-percent-annual-chance floodplain, areas of 1-percent-annual-chance flooding where average depths are less than 1 foot, areas of 1-percent-annual-chance flooding where the contributing drainage area is less than 1 square mile (sq. mi.), and areas protected from the base flood by levees. No BFEs or depths are shown within this zone.

74
6.0 FLOOD INSURANCE RATE MAP
The FIRM is designed for flood insurance and floodplain management applications.
For flood insurance applications, the map designates flood insurance rate zones as described in Section 5.0 and, in the 1-percent-annual-chance floodplains that were studied by detailed methods, shows selected whole-foot BFEs or average depths. Insurance agents use zones and BFEs in conjunction with information on structures and their contents to assign premium rates for flood insurance policies.
For floodplain management applications, the map shows by tints, screens, and symbols, the 1- and 0.2-percent-annual-chance floodplains, floodways, and the locations of selected cross sections used in the hydraulic analyses and floodway computations.
The countywide FIRM presents flooding information for the entire geographic area of Brevard County. Previously, FIRMs were prepared for each incorporated community and the unincorporated areas of the County identified as flood-prone. This countywide FIRM also includes flood-hazard information that was presented separately on Flood Boundary and Floodway Maps (FBFMs), where applicable. Historical data relating to the maps prepared for each community are presented in Table 10, “Community Map History.”

CO
MM
UN
ITY
N
AM
E
INIT
IAL
ID
EN
TIF
ICA
TIO
N
FL
OO
D H
AZ
AR
D
BO
UN
DA
RY
MA
P
RE
VIS
ION
S D
AT
E
FIR
M
EF
FE
CT
IVE
DA
TE
F
IRM
R
EV
ISIO
NS
DA
TE
Bre
vard
Cou
nty,
U
ninc
orpo
rate
d A
reas
S
epte
mbe
r 22
, 197
2 --
- S
epte
mbe
r 22
, 197
2
Aug
ust 6
, 197
6 S
epte
mbe
r 16
, 198
2 O
ctob
er 1
, 198
3 A
pril
3, 1
989
Aug
ust 1
8, 1
992
Nov
embe
r 19
, 199
7
Cap
e C
anav
eral
, Cit
y of
S
epte
mbe
r 20
, 197
2 --
- S
epte
mbe
r 30
, 197
2
July
1, 1
974
Aug
ust 1
5, 1
975
May
20,
197
7 S
epte
mbe
r 16
, 198
2 A
pril
3, 1
989
Cap
e C
anav
eral
P
ort A
utho
rity
O
ctob
er 2
9, 1
979
---
Apr
il 3
, 198
9 A
pril
3, 1
989
Coc
oa, C
ity
of
Feb
ruar
y 15
, 197
4 Ja
nuar
y 9,
197
6 S
epte
mbe
r 28
, 197
9 A
pril
3, 1
989
Coc
oa B
each
, Cit
y of
F
ebru
ary
15, 1
974
Janu
ary
9, 1
976
Sep
tem
ber
28, 1
979
July
1, 1
974
Dec
embe
r 26
, 197
5 M
ay 2
0, 1
977
Sep
tem
ber
16, 1
982
Apr
il 3
, 198
9
TABLE 10
FE
DE
RA
L E
ME
RG
EN
CY
MA
NA
GE
ME
NT
AG
EN
CY
BR
EV
AR
D C
OU
NT
Y, F
L
AN
D IN
CO
RP
OR
AT
ED
AR
EA
S
C
OM
MU
NIT
Y M
AP
HIS
TO
RY

CO
MM
UN
ITY
N
AM
E
INIT
IAL
ID
EN
TIF
ICA
TIO
N
FL
OO
D H
AZ
AR
D
BO
UN
DA
RY
MA
P
RE
VIS
ION
S D
AT
E
FIR
M
EF
FE
CT
IVE
DA
TE
F
IRM
R
EV
ISIO
NS
DA
TE
Indi
alan
tic,
Tow
n of
A
ugus
t 18,
197
2 --
- A
ugus
t 18,
197
2
July
1, 1
974
May
7, 1
976
Sep
tem
ber
16, 1
982
Apr
il 3
, 198
9
Indi
an H
arbo
ur B
each
, Cit
y of
Ju
ne 1
6, 1
972
---
June
16,
197
2
July
1, 1
974
Sep
tem
ber
25, 1
975
Sep
tem
ber
30, 1
982
Apr
il 3
, 198
9
Mal
abar
, Tow
n of
M
arch
1, 1
974
Dec
embe
r 19
, 197
5 S
epte
mbe
r 28
, 198
2
Sep
tem
ber
30, 1
982
Apr
il 3
, 198
9 A
ugus
t 18,
199
2
Mel
bour
ne, C
ity
of
Aug
ust 3
0, 1
974
Oct
ober
1, 1
976
July
1, 1
979
Sep
tem
ber
30, 1
982
Apr
il 3
, 198
9 N
ovem
ber
19, 1
997
Mel
bour
ne B
each
, Tow
n of
N
ovem
ber
25, 1
972
---
Nov
embe
r 25
, 197
2
July
1, 1
974
Oct
ober
3, 1
975
Sep
tem
ber
30, 1
982
Apr
il 3
, 198
9 A
ugus
t 18,
199
2 N
ovem
ber
19, 1
997
TABLE 10
FE
DE
RA
L E
ME
RG
EN
CY
MA
NA
GE
ME
NT
AG
EN
CY
BR
EV
AR
D C
OU
NT
Y, F
L
AN
D IN
CO
RP
OR
AT
ED
AR
EA
S
C
OM
MU
NIT
Y M
AP
HIS
TO
RY

CO
MM
UN
ITY
N
AM
E
INIT
IAL
ID
EN
TIF
ICA
TIO
N
FL
OO
D H
AZ
AR
D
BO
UN
DA
RY
MA
P
RE
VIS
ION
S D
AT
E
FIR
M
EF
FE
CT
IVE
DA
TE
F
IRM
R
EV
ISIO
NS
DA
TE
Mel
bour
ne V
illa
ge, T
own
of
Feb
ruar
y 15
, 197
4 F
ebru
ary
13, 1
976
Sep
tem
ber
24, 1
976
Nov
embe
r 15
, 197
9 A
pril
3, 1
989
Pal
m B
ay, C
ity
of
Sep
tem
ber
3, 1
980
---
Sep
tem
ber
3, 1
980
June
15,
198
4 N
ovem
ber
1, 1
985
Apr
il 3
, 198
9 A
ugus
t 18,
199
2
Pal
m S
hore
s, T
own
of
Aug
ust 3
1, 1
979
---
Apr
il 3
, 198
9 N
ovem
ber
19, 1
997
Roc
kled
ge, C
ity
of
Mar
ch 1
, 197
4 M
ay 7
, 197
6 N
ovem
ber
15, 1
979
Apr
il 3
, 198
9
Sat
elli
te B
each
, City
of
Feb
ruar
y 22
, 197
4 --
- F
ebru
ary
22, 1
974
Apr
il 2
3, 1
976
Sep
tem
ber
30, 1
982
Apr
il 3
, 198
9
TABLE 10
FE
DE
RA
L E
ME
RG
EN
CY
MA
NA
GE
ME
NT
AG
EN
CY
BR
EV
AR
D C
OU
NT
Y, F
L
AN
D IN
CO
RP
OR
AT
ED
AR
EA
S
C
OM
MU
NIT
Y M
AP
HIS
TO
RY

CO
MM
UN
ITY
N
AM
E
INIT
IAL
ID
EN
TIF
ICA
TIO
N
FL
OO
D H
AZ
AR
D
BO
UN
DA
RY
MA
P
RE
VIS
ION
S D
AT
E
FIR
M
EF
FE
CT
IVE
DA
TE
F
IRM
R
EV
ISIO
NS
DA
TE
Tit
usvi
lle,
City
of
June
16,
197
2 --
- Ju
ly 1
, 197
4
Apr
il 3
0, 1
976
Apr
il 3
, 198
9 A
ugus
t 18,
199
2 Ja
nuar
y 5,
199
6
Wes
t Mel
bour
ne, C
ity
of
Mar
ch 8
, 197
4 A
ugus
t 1, 1
975
Mar
ch 1
8, 1
980
Apr
il 3
, 198
9
TABLE 10
FE
DE
RA
L E
ME
RG
EN
CY
MA
NA
GE
ME
NT
AG
EN
CY
BR
EV
AR
D C
OU
NT
Y, F
L
AN
D IN
CO
RP
OR
AT
ED
AR
EA
S
C
OM
MU
NIT
Y M
AP
HIS
TO
RY

79
7.0 OTHER STUDIES
FIS reports were previously prepared for the unincorporated areas of Brevard County (Reference 47) and for the Cities of Melbourne, Palm Bay, and Titusville and the Town of Malabar (References 2; 48; 49; 50).
FIS reports were previously prepared for the unincorporated and incorporated areas of Volusia County, Indian River County, Osceola County, Orange County, and Seminole County (References 51; 52; 53; 54; 55). A flood hazard boundary map was prepared for the Town of Palm Shores (Reference 56)
This FIS report either supersedes or is compatible with all previous studies published on streams studied in this report and should be considered authoritative for the purposes of the NFIP.
8.0 LOCATION OF DATA
Information concerning the pertinent data used in the preparation of this study can be obtained by contacting Federal Insurance and Mitigation Division, FEMA Region IV, Koger-Center — Rutgers Building, 3003 Chamblee Tucker Road, Atlanta, GA 30341.
9.0 BIBLIOGRAPHY AND REFERENCES
1. Federal Emergency Management Agency. Flood Insurance Study, Brevard County, Florida, and Incorporated Areas. Washington, D.C., April 3, 1989.
2. —. Flood Insurance Study, City of Melbourne, Brevard County, Florida. Washington, D.C., FIS report dated March 30, 1982; FIRM dated September 30, 1982.
3. —. Flood Insurance Study, Brevard County, Florida, and Incorporated Areas. Washington, D.C., November 19, 1997.
4. Southeast Regional Climate Center. Historical Climate Summaries for Florida: City of Titusville, City of Melbourne. [Online] [Cited: January 21, 2009.] http://www.sercc.com/climateinfo/historical/historical_fl.html.
5. Brevard County Planning Department. Brevard County Data Abstract. Viera, Florida, 1984.
6. U.S. Department of Commerce, Bureau of the Census. "State & County Quickfacts, Florida Quicklinks". [Online] [Cited: June 17, 2011.] Available http://www.census.gov/ census2000/states/fl.html.
7. American Meteorological Society. Early American Hurricanes 1492-1870. David M. Ludlum, 1963.
8. U.S. Department of the Army, Corps of Engineers, Jacksonville District. Analysis of Hurricane Problems in Coastal Areas of Florida. Washington, D.C., September 1961.
9. U.S. Department of Commerce, National Oceanic and Atmospheric Administration,

80
National Climate Data Center. "Storm Events". [Online] [Cited: January 21, 2009.] http://www4.ncdc.noaa.gov.
10. American Meterological Society. The Monthly Weather Review. Volume 108, No. 7, July 1980.
11. St. John's River Water Management District, Department of Water Resources. Technical Publication SJ85-3: Mean Annual 10-Year, 25-Year, and 100-Year Flood Profiles for the Upper St. John's River under the Existing Conditions. Donthamsetti V. Rao, March 1985.
12. U.S. Department of the Army, Corps of Engineers, Jacksonville District. Central and Southern Florida Project, Part III, Upper St. John's River Basin and Related Areas, Supplement 2: General Design Memorandum, Upper St. John's River Basin, Addendum 3 with Draft Environmental Impact Statement. Jacksonville, Florida, June 1985.
13. U.S. Department of the Interior, Geological Survey, in cooperation with the Florida Department of Transportation. Water Resources Investigations 82-4012: Technique for Estimating Magnitude and Frequency of Floods on Natural-Flow Streams in Florida, 1982.
14. Ghioto, Singhofen & Associates, Inc. Brook Hollow Stormwater Management Master Plan. Prepared for DCB Investment Company, September 1986.
15. Kucera, Inc. Photogrammetric Topographical Maps, Titusville, Florida, Scale 1:2,400, Contour Interval 2 Feet. January 1974.
16. U.S. Department of Commerce, National Oceanic and Atmospheric Administration, Weather Bureau. Technical Paper No. 40: Rainfall Frequency Atlas of the United States for Durations from 30 Minutes to 24 Hours and Return Periods from 1 to 100 Years. Washington, D.C., 1961.
17. U.S. Department of Agriculture, Soil Conservation Service. National Engineering Handbook, Section 4, Hydrology. Washington, D.C., 1964, Revised 1969.
18. TRACOR, Inc. TRACOR Method: The Effects of Urbanization on Unit Hydrographs for Small Watersheds, Houston, Texas, 1964-67. Austin, Texas, September 25, 1968.
19. Singhofen, Peter J. P.E. Inter-Connected Pond Routing Program, version 3.10. 2002.
20. U.S. Department of Commerce, National Oceanic and Atmospheric Administration. Unit Hydrograph Technical Manual. National Weather Service, National Operational Hydrologic Remote Sensing Center. [Online] October 12, 2008. [Cited: June 1, 2009.] http://www.nohrsc.noaa.gov/technology/gis/uhg_manual.html.
21. U.S. Department of Agriculture, Soil Conservation Service. Technical Release No. 55: Urban Hydrology for Small Watersheds. Washington, D.C., June 1986.
22. U.S. Department of Commerce, Environmental Science Services Administration. Technical Memorandum WBTM Hydro II: Joint Probability Method of Tide Frequency Analysis Applied to Atlantic City and Long Beach Island, New Jersey. Vance A. Myers, April 1970.

81
23. U.S. Department of Commerce, National Oceanic and Atmospheric Administration, National Weather Service. Tropical Cyclones of the North Atlantic Ocean, 1871-1984. July 1985.
24. U.S. Department of Commerce, National Oceanic and Atmospheric Administration. Technical Report NWS 15: Some Climatological Characteristics of Hurricanes and Tropical Storms, Gulf and East Coasts of the United States. Frances P. Ho, Richard W. Schwerdt, and Hugo V. Goodyear, May 1975.
25. —. Technical Report NWS 23: Meterological Criteria for Standard Project Hurricane and Probable Maximum Hurricane Windfields, Gulf and East Coasts of the United States. September 1979.
26. Federal Emergency Management Agency. Coastal Flooding Storm Surge Model, Part 1: Methodology, and Part II: Code and Users Guide. Washington, D.C., February 1981.
27. U.S. Department of the Army, Corps of Engineers, Coastal Engineering Research Center. Shore Protection Manual. Vicksburg, Mississippi, 1984.
28. Streamline Technologies, Inc. ICPR 3.1.0. April 2008.
29. Maidment, David R. Arc Hydro: GIS for Water Resources. ESRI, Inc., 2002.
30. U.S. Department of the Army, Corps of Engineers, Hydrologic Engineering Center. HEC-2 Water Surface Profiles, Generalized Computer Program. Davis, California, September 1982.
31. Vislay, Cantelou & Herrera, Inc. Ground and Bathymetric Surveys for Gee & Jenson. 1985.
32. U.S. Department of the Interior, Geological Survey. 7.5 Minute Series Topographic Maps, Scale 1:24,000, Contour Interval 5 Feet. Oak Hill, FL, 1949, photorevised 1970; Pardon Island, Florida, 1949, photorevised 1970; Mims, FL, 1949, photorevised 1970; Wilson, FL, 1949, photorevised 1977; Sebastian, Florida, 1949, photorevised 1970; Titusville, FL, 1949, photorevised, 1970; Orsino, FL, 1976; False Cape, FL, 1976; Sharpes, FL, 1949, photorevised, 1970; Courtenay, FL, 1976; Cape Canaveral, FL, 1976; Cocoa, FL, 1976; Cocoa Beach, FL, 1976; Eau Gallie, FL, 1949, photorevised 1970;, Tropic, FL, 1949, photorevised 1970; Melbourn West, FL, 1949, photorevised 1970; Melbourne East, FL, 1949, photorevised, 1970; Grant, FL, 1949, photorevised 1970; Sebastian NW, FL, 1949, photorevised, 1970; Fellsmere, FL, 1949, photorevised 1970.
33. Briley Wild & Associates. Stormwater Management Master Plan: Aerial Topographic Maps, Palm Bay, Florida, Scale 1:200, Contour Interval 1 Foot. 1978.
34. U.S. Department of Agriculture, Soil Conservation Service. Guide for Selecting Roughness Coefficient "n" Values for Channels. December 1963.
35. Chow, Ven Te. Open Channel Hydraulics. New York : McGraw-Hill, 1959.

82
36. U.S. Department of Transportation, Federal Highway Administration. Guide for Selecting Manning's Roughness Coefficients for Natural Channels and Flood Plains. , April 1984.
37. U.S. Department of Commerce, National Oceanic and Atmospheric Administration, National Ocean Survey. Bathymetric Maps at a Scale of 1:25,000, Datum Mean Low Water. Fort Pierce, Orlando, Florida, 1972.
38. —. Selected NOS Hydrographic Surveys.
39. —. Nautical Charts: No. 11460, February 1982; No. 11472, August 1976; No. 11474, March 1980; No. 11476, May 1982; No. 11480, November 1981; No. 11484, April 1983; No. 11485, July 1982; No. 11486, October 1980; No. 11488, January 1982.
40. Florida Department of Natural Resources, Bureau of Beaches and Shores. Brevard County Beach Profiles. 1985.
41. Florida Department of Transportation, Topographic Bureau. Stereoscopic Aerial Photography, Brevard County, Florida, Scale 1: 2,400 on November 1983; Scale 1:1,200 on May 1980.
42. Florida Department of Natural Resources. Brevard County Coastal Construction Control Line Maps, Brevard County, Scale 1:1,200, Contour Interval 2 Feet. October 1985.
43. National Academy of Sciences. Methodology for Calculating Wave Action Effects with Storm Surges. 1977.
44. Federal Emergency Management Agency, Federal Insurance Administration. User's Manual for Wave Action Effects Associated with Storm Surges.April 1980.
45. Herchenroder, J. Hill and B. Computational Model for Computing Dune Erosion. Orlando, Florida : Proceedings of the ASCE Hydraulics Specialty Conference, August 1985.
46. Federal Emergency Management Agency. Manual for Wave Runup Analysis Coastal Flood Insurance Studies. November 1981.
47. —. Flood Insurance Study, Brevard County, Florida, Unincorporated Areas. Washington, D.C., September 16, 1982.
48. —. Flood Insurance Study, City of Palm Bay, Brevard County, Florida. Washington, D.C., June 15, 1984.
49. —. Flood Insurance Study, City of Titusville, Brevard County, Florida. Washington, D.C., April 30, 1976.
50. —. Flood Insurance Study, Town of Malabar, Brevard County, Florida. Washington, D.C., September 30, 1982.
51. —. Flood Insurance Study, Volusia County, Florida, and Incorporated Areas. Washington, D.C., February 19, 2003.

83
52. —. Flood Insurance Study, Indian River County, Florida, and Incorporated Areas. Washington, D.C., May 4, 1989.
53. —. Flood Insurance Study, Osceola County, Florida, and Incorporated Areas. Washington, D.C., May 7, 2001.
54. —. Flood Insurance Study, Orange County, Florida, and Incorporated Areas. Washington, D.C., December 6, 2000.
55. —. Flood Insurance Study, Seminole County, Florida, and Incorporated Areas. Washington, D.C., September 28, 2007.
56. U.S. Department of Housing and Urban Development, Federal Insurance Administration. Flood Hazard Boundary Map, Town of Palm Shores, Brevard County, Florida. Washington, D.C., August 31, 1979.
10.0 REVISION DESCRIPTIONS
This section has been added to provide information regarding significant revisions made since the original FIS was printed. Future revisions may be made that do not result in the republishing of the FIS report. To assure that the user is aware of all revisions, it is advisable to contact the community repository of flood-hazard data located at:
• Brevard County Public Works Department Brevard County Government Center 2725 Judge Fran Jamieson Way Vierra, Florida 32940
• Cape Canaveral City Hall 105 Polk Avenue Cap Canaveral, Florida 32920
• Cocoa City Hall 603 Brevard Avenue Cocoa, Florida 32922
• Cocoa Beach City Hall Building Department 2 South Orlando Avenue Cocoa Beach, Florida 32931
• Indialantic Town Hall 216 Fifth Avenue Indialantic, Florida 32903
• Indian Harbour Beach City Hall 2055 South Patrick Drive Indian Harbour Beach, Florida 32937

84
• Malabar Town Hall 2725 Malabar Road Malabar, Florida 32950
• Melbourne City Hall 900 East Strawbridge Avenue Melbourne, Florida 32901
• Melbourne Village Town Hall 555 Hammock Road Melbourne Village, Florida 32904
• Melbourne Beach Town Hall 507 Ocean Avenue Melbourne Beach, Florida 32951
• Palm Bay City Hall 120 Malabar Road, S.E. Palm Bay, Florida 32907
• Palm Shores Town Clerk’s Office 151 Palm Circle Palm Shores, Florida 32940
• Rockledge City Hall Building Department 1600 Huntington Lane Rockledge, Florida 32956
• Satellite Beach City Hall Building and Zoning Department 565 Cassia Boulevard Satellite Beach, Florida 32937
• Titusville City Hall Department of Planning and Zoning 555 South Washington Avenue Titusville, Florida 32796
• West Melbourne City Hall 2285 Minton Road West Melbourne, Florida 32904
10.1 First Revision (Revised August 19, 1992)
The August 19, 1992 revision was initiated by a Physical Map Revision (PMR) request submitted to FEMA. That revision involved changes to the FIRM only.

85
10.2 Second Revision (Revised November 19, 1997)
For the November 19, 1997 revision, detailed analyses for Horse Creek and Otter Creek, within the City of Melbourne, were incorporated into the countywide FIS.
10.3 Third Revision (Revised Month Day, Year)
This Month, Day, year revision was initiated in support of the FEMA Risk MAP Program.
This revision involved updating the mapping for the entire area of Brevard County, Florida. The revision includes new detailed hydrologic and hydraulic analyses for various ponding areas within the North Merrit Island area of Brevard County. Coastal AE zones, streams, and ponding areas that had been previously studied by detailed methods were redelineated based on more detailed and up-to-date topographic data. In addition to the coastal redelineation, the location of the zone break between the AE and VE zones was revised based on the location of the Primary Frontal Dune.


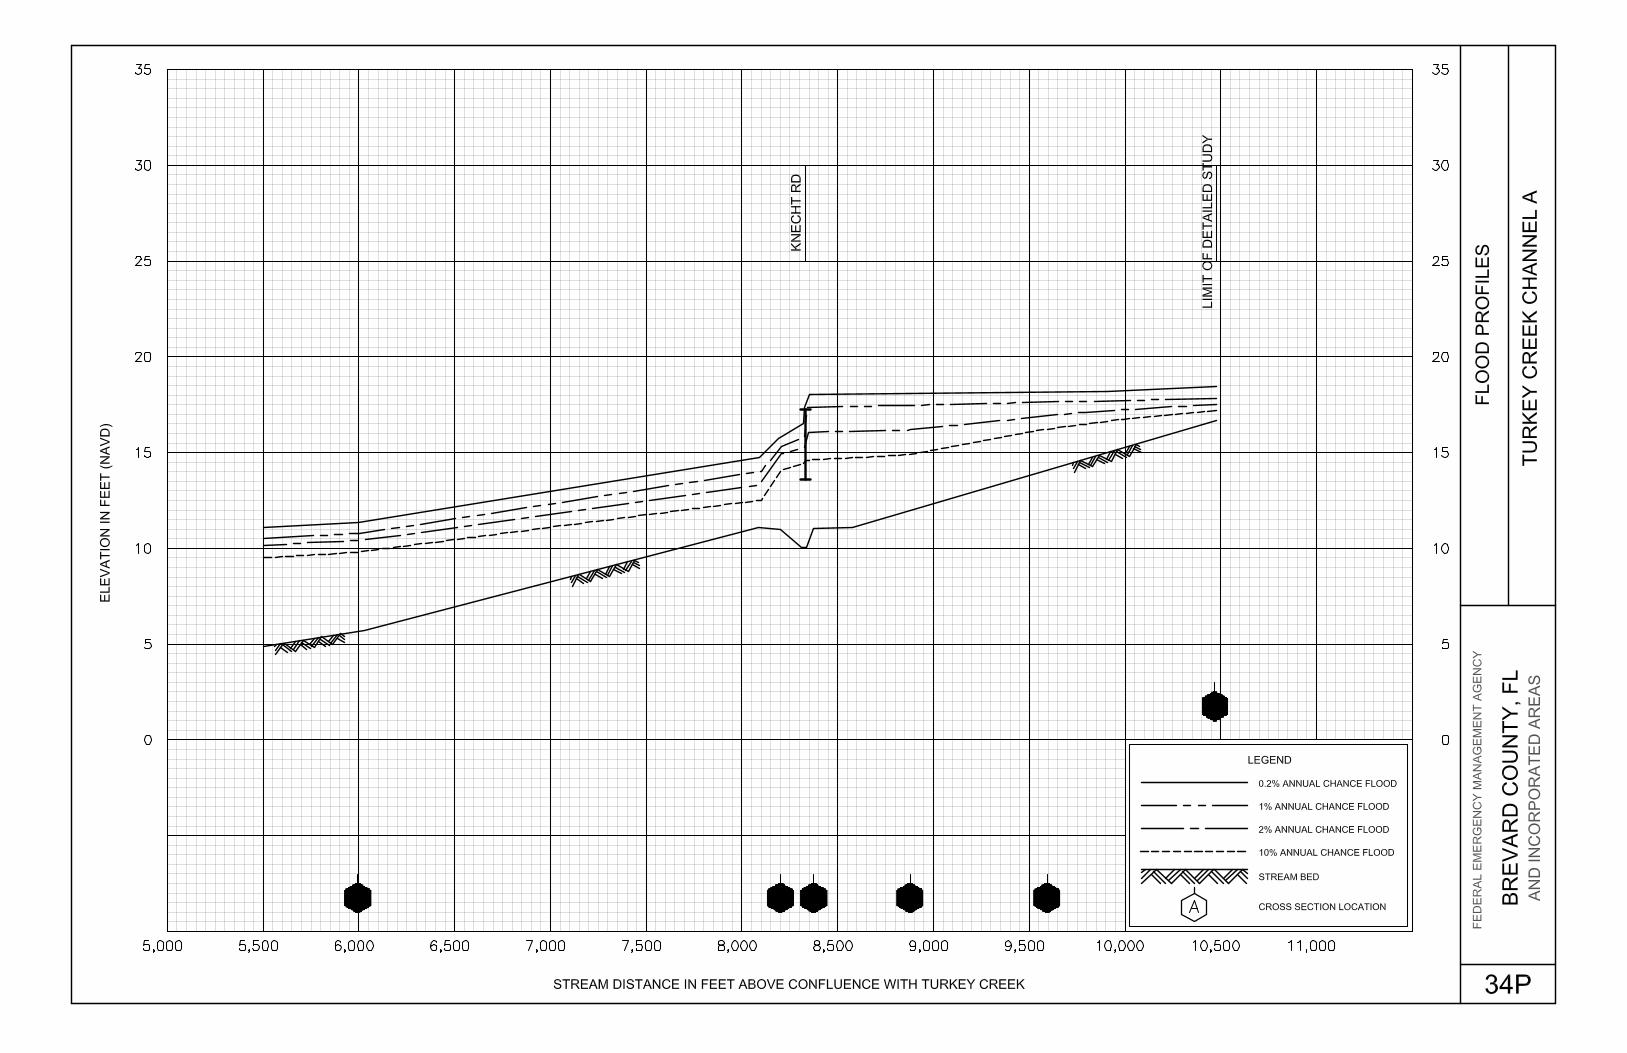


APPENDIX B
PRELIMINARY SIZING OF
PROPOSED CROSSDRAINS
‐ HYDROLOGIC CALCS
‐ EXISTING CULVERTS
‐ PROPOSED CULVERTS

PRELIMINARY SIZING OF
PROPOSED CROSSDRAINS
‐ HYDROLOGIC CALCS

THOSE CULVERTS WITHTWO POSSIBLE DRAINAGEBASIN AREAS HAVE BEENANALYZED TWICE:1) USING THE SMALLERAREA AND FLOW VALUESFROM RATIONAL METHODCALCS, AND2) USING THE LARGER AREAWITH FLOW VALUES FROMREGRESSION ANALYSES.

Project: SR 514Basin: 1-14Designer: CA Estrella Checked by:Date: 6/24/2014 Date:
Basin Structure Tc Storm C I A (ac) Q (cfs)2 Culvert 2 127.7 2 0.38 1.38 286.00 149.38 Intensity = A + BX + CX^2 + DX^3 X=ln Tc
10 0.38 1.91 286.00 206.54 (from Table T-19, FDOT Hydrology Handbook, Feb. 2012 )25 0.42 2.20 286.00 262.1650 0.45 2.43 286.00 316.03
(1.) 100 0.47 2.67 286.00 362.38 Zone 7 2 Yr 10 Yr 25 Yr 50 Yr 100 Yr CAE est(2.) 500 470.00 A 12.10821 12.49556 12.92209 13.2955 14.671
3 ALT Culvert 3 93.0 2 0.25 1.77 236.00 104.69 B -2.79255 -1.67116 -1.11084 -0.70432 -1.071710 0.25 2.42 236.00 142.98 C 0.02002 -0.34901 -0.55019 -0.70152 -0.660625 0.28 2.79 236.00 181.21 D 0.02053 0.05017 0.06666 0.07933 0.076650 0.30 3.08 236.00 218.00
(1.) 100 0.31 3.37 236.00 248.99(2.) 500 320.93
5 Culvert 5 56.9 2 0.35 2.51 220.00 190.4710 0.35 3.35 220.00 254.9825 0.38 3.85 220.00 321.7750 0.41 4.23 220.00 385.78
(1.) 100 0.43 4.61 220.00 437.87(2.) 500 558.82
6 Culvert 6 24.7 2 0.27 4.04 29.00 31.8910 0.27 5.20 29.00 41.1025 0.30 5.90 29.00 51.2850 0.33 6.44 29.00 61.05
(1.) 100 0.34 6.97 29.00 68.81(2.) 500 86.84
8 Culvert 8 21.1 2 0.30 4.36 40.00 52.3710 0.30 5.58 40.00 66.9625 0.33 6.31 40.00 83.3250 0.36 6.88 40.00 99.04
(1.) 100 0.38 7.44 40.00 111.54(2.) 500 140.57
10 Culvert 10 19.5 2 0.70 4.53 4.30 13.6310 0.70 5.77 4.30 17.3625 0.77 6.52 4.30 21.5850 0.84 7.09 4.30 25.63
(1.) 100 0.88 7.67 4.30 28.85(2.) 500 36.34
13 Culvert 13 31.3 2 0.40 3.57 30.00 42.8210 0.40 4.65 30.00 55.8225 0.44 5.30 30.00 69.9050 0.48 5.79 30.00 83.41
(1.) 100 0.50 6.28 30.00 94.14(2.) 500 119.08
Notes:3. Intensitites for the 100-yr storm have been estimated from the Zone 7, 100-year IDF curve.2. Please refer to attached Frequency vs. Discharge Curves
Rational Method Flow Calculations
1. Using the Rational Method calculate the flows for the following basins:
T:\PROJECTS\FDOT_D5\SR514 PD&E\Drainage\HY8\Hydrology_RationalMethod.xlsxRational

Method and Date Formulat for tc (min) Remarks
Kirpich (1940) tc=0.0078 L0.77S‐0.385
Variables
Basin Basin Area (ac) L (ft) EL1 EL2 S (ft/ft) tc (min) ft/min fps Woodlands Residential C2,10 C25 C50 C100
12 286 7350 26 21.5 0.0006 128 58 1.0 29.9 256.1 0.38 0.42 0.45 0.47
2 Alt. 8523 802
3 Alt. 236 6150 26 20 0.0010 93 66 1.1 176.8 59.2 0.25 0.28 0.30 0.3145 220 4760 26 16 0.0021 57 84 1.4 60 160 0.35 0.38 0.41 0.436 29 1950 23.5 17.5 0.0031 25 79 1.3 18.5 10.5 0.27 0.30 0.33 0.347 13768 40 1600 24 19 0.0031 21 76 1.3 20 20 0.30 0.33 0.36 0.389 63810 4.3 1500 23.5 18.45 0.0034 19 77 1.3 0.7 0.77 0.84 0.88111213 30 2000 23 19.5 0.0018 31 64 1.1 30 0.40 0.44 0.48 0.5014
Notes:1. Basin 10 is only composed of road right of way; C=0.72. Woodlands, pasturs, and grass; C =0.23. Single family residential, 1/2 acre lots or larger; C =0.44. Runoff coefficients have been multiplied by frequency factors for each storm based on Table T-5 of the FDOT Hydrology Handbook, Feb. 2012
Developed from SCS data for several rural basins in Tennessee with well-defined channel and steep slopes (3% to 10%); for overland flow on concrete or asphalt surfaces multiply tc by 0.4; for concrete channels multiply by 0.2; no adjustments for overland flow on bare soil or flow in roadside ditches.
Equilizer Pipe. Refer to Hydraulic Calcs.
Pond emergency flow. Refer to Hydraulic Calcs.
Landuse
L= length of flow path, ftS= slope of flow path, ft/ft
Average velocity
Equilizer Pipe. Refer to Hydraulic Calcs.
See Note 1 below
SEE REGRESSION CALCSSEE REGRESSION CALCS
SEE REGRESSION CALCS
Equilizer Pipe. Refer to Hydraulic Calcs.
SEE REGRESSION CALCS
Equilizer Pipe. Refer to Hydraulic Calcs.
C Values

Project: SR 514 PDEBasins: 2, 3 Alt., 5, 6, 8, 10, 13Designer: CA EstrellaDate: 6/24/2014
Culvert 2
Year Frequency (%) Discharge (cfs)
50 2 316.03100 1 362.38500 0.2 470.00 Use equation generated by charting to obtain Q
Culvert 3 Alt.
Year Frequency (%) Discharge (cfs)
50 2 218.00100 1 248.99500 0 2 320 93
Frequency vs. Discharge Curves
y = -66.87ln(x) + 362.38R² = 1
0.00
50.00
100.00
150.00
200.00
250.00
300.00
350.00
400.00
450.00
500.00
0.1 1 10
Dis
char
ge
(cfs
)
Frequency (%)
Frequency vs. Discharge
Basin 2
Log. (Basin 2)
500 0.2 320.93 Use equation generated by charting to obtain Q
y = -44.7ln(x) + 248.99R² = 1
0.00
50.00
100.00
150.00
200.00
250.00
300.00
350.00
0.1 1 10
Dis
char
ge
(cfs
)
Frequency (%)
Frequency vs. Discharge
Basin 3
Log. (Basin 3)
T:\PROJECTS\FDOT_D5\SR514 PD&E\Drainage\HY8\Hydrology_RationalMethod.xlsxF vs. D curves

Project: SR 514 PDEBasins: 2, 3 Alt., 5, 6, 8, 10, 13Designer: CA EstrellaDate: 6/24/2014
Frequency vs. Discharge Curves
Culvert 5
Year Frequency (%) Discharge (cfs)
50 2 385.78100 1 437.87500 0.2 558.82 Use equation generated by charting to obtain Q
Culvert 6
Year Frequency (%) Discharge (cfs)
50 2 61.05100 1 68.81500 0 2 86 84
y = -75.15ln(x) + 437.87R² = 1
0.00
100.00
200.00
300.00
400.00
500.00
600.00
0.1 1 10
Dis
char
ge
(cfs
)
Frequency (%)
Frequency vs. Discharge
Basin 4
Log. (Basin 4)
500 0.2 86.84 Use equation generated by charting to obtain Q
y = -11.2ln(x) + 68.813R² = 1
0.00
10.00
20.00
30.00
40.00
50.00
60.00
70.00
80.00
90.00
100.00
0.1 1 10
Dis
char
ge
(cfs
)
Frequency (%)
Frequency vs. Discharge
Culvert 6
Log. (Culvert 6)
T:\PROJECTS\FDOT_D5\SR514 PD&E\Drainage\HY8\Hydrology_RationalMethod.xlsxF vs. D curves

Project: SR 514 PDEBasins: 2, 3 Alt., 5, 6, 8, 10, 13Designer: CA EstrellaDate: 6/24/2014
Frequency vs. Discharge Curves
Culvert 8
Year Frequency (%) Discharge (cfs)
50 2 99.04100 1 111.54500 0.2 140.57 Use equation generated by charting to obtain Q
Culvert 10
Year Frequency (%) Discharge (cfs)
50 2 25.63100 1 28 85
y = -18.04ln(x) + 111.54R² = 1
0.0020.0040.0060.0080.00
100.00120.00140.00160.00
0.1 1 10
Dis
char
ge
(cfs
)
Frequency (%)
Frequency vs. Discharge
Culvert 8
Log. (Culvert 8)
100 1 28.85500 0.2 36.34 Use equation generated by charting to obtain Q
y = -4.656ln(x) + 28.854R² = 1
0.005.00
10.0015.0020.0025.0030.0035.0040.00
0.1 1 10
Dis
char
ge
(cfs
)
Frequency (%)
Frequency vs. Discharge
Culvert 10
Log. (Culvert 10)
T:\PROJECTS\FDOT_D5\SR514 PD&E\Drainage\HY8\Hydrology_RationalMethod.xlsxF vs. D curves

Project: SR 514 PDEBasins: 2, 3 Alt., 5, 6, 8, 10, 13Designer: CA EstrellaDate: 6/24/2014
Frequency vs. Discharge Curves
Culvert 13
Year Frequency (%) Discharge (cfs)
50 2 83.41100 1 94.14500 0.2 119.08 Use equation generated by charting to obtain Q
y = -15.49ln(x) + 94.145R² = 1
0.00
20.00
40.00
60.00
80.00
100.00
120.00
140.00
0.1 1 10
Dis
char
ge
(cfs
)
Frequency (%)
Frequency vs. Discharge
Culvert 13
Log. (Culvert 13)
T:\PROJECTS\FDOT_D5\SR514 PD&E\Drainage\HY8\Hydrology_RationalMethod.xlsxF vs. D curves

1
23
456789
1011121314151617181920212223242526
A B C F G
Variable Description
DA Drainage AreaST Basin Storage
Culvert # Basin Area (ac) Basin Area (miles2) Basin Storage (ac) Basin Storage (%)1 0.002 286 0.45 22.17 7.75
2 Alt. 852 1.33 44.08 5.173 802 1.25 31.68 3.95
3 Alt 236 0.37 9.77 4.144 0.005 17.136 0.007 1376 2.15 146.46 10.648 4.409 638 1.00 34.03 5.33
10 0.0011 0.0012 0.0013 0.0014 0.00N/A 7.26
TOTAL 3,102 4.85 263.13
SEE RATIONAL METHOD CALCSSEE RATIONAL METHOD CALCS
EQUILIZER PIPE. SEE HYDRAULIC CALCS.EQUILIZER PIPE. SEE HYDRAULIC CALCS.
POND EMERGENCY FLOW. SEE HYDRAULIC CALCS
SEE RATIONAL METHOD CALCS
SEE RATIONAL METHOD CALCS
SEE RATIONAL METHOD CALCS
Regression Equation Input Values
EQUILIZER PIPE. SEE HYDRAULIC CALCS.
Range of Applicability
0.2 miles2 (120 acres) 120 acres to 2,833 miles2
0 to 34.12%
EQUILIZER PIPE. SEE HYDRAULIC CALCS.
T:\PROJECTS\FDOT_D5\SR514 PD&E\Drainage\HY8\Hydrology_RegressionAnalysis.xlsxInput

USGS REGRESSION EQUATIONS FOR NATURAL FLOWCONDITIONS IN FLORIDA: REGION 4
Project: SR514 PDEBasin: Culvert 2Location: Brevard CountyComputed by: C. Estrella Checked by:Date: 6/24/2014 Date:
Required Basin Data:
Drainage Area (DA) 0.45 miles2
Basin Storage (ST) 7.75 % of total area
Range of Applicability of Basin Characteristics:
DA 120 acres to 2,833 miles2
ST 0 to 34.12 %
Peak Runoff Equation Standard QT (ft3/s)
Error (%)
Q2 = 171 DA0.628 (ST+ 1)-0.40136.0 442
Q5 = 321 DA0.618 (ST + 1)-0.39539.0 84
Q10 = 447 DA0.614 (ST + 1)-0.39643.0 115
Q25 = 636 DA0.610 (ST + 1)-0.40148.0 163
Q50 = 797 DA0.609 (ST + 1)-0.40653.0 202
Q100 = 975 DA0.608 (ST + 1)-0.41157.0 245
Q200 = 1171 DA0.608 (ST + 1)-0.41662.0 291
Q500 = 1461 DA0.609 (ST + 1)-0.42469.0 357
Calculations and Documentation Location1. Drainage Map showing basin area. Figure 42. Calculation of Basin Storage Attached
Reference: FDOT Hydrology Handbook, Feb. 2012, Table T-13
T:\PROJECTS\FDOT_D5\SR514 PD&E\Drainage\HY8\Hydrology_RegressionAnalysis.xlsxCulvert 2

USGS REGRESSION EQUATIONS FOR NATURAL FLOWCONDITIONS IN FLORIDA: REGION 4
Project: SR514 PDEBasin: Culvert 2 Alt.Location: Brevard CountyComputed by: C. Estrella Checked by:Date: 6/24/2014 Date:
Required Basin Data:
Drainage Area (DA) 1.33 miles2
Basin Storage (ST) 5.17 % of total area
Range of Applicability of Basin Characteristics:
DA 120 acres to 2,833 miles2
ST 0 to 34.12 %
Peak Runoff Equation Standard QT (ft3/s)
Error (%)
Q2 = 171 DA0.628 (ST+ 1)-0.40136.0 1002
Q5 = 321 DA0.618 (ST + 1)-0.39539.0 189
Q10 = 447 DA0.614 (ST + 1)-0.39643.0 259
Q25 = 636 DA0.610 (ST + 1)-0.40148.0 365
Q50 = 797 DA0.609 (ST + 1)-0.40653.0 453
Q100 = 975 DA0.608 (ST + 1)-0.41157.0 549
Q200 = 1171 DA0.608 (ST + 1)-0.41662.0 653
Q500 = 1461 DA0.609 (ST + 1)-0.42469.0 804
Calculations and Documentation Location1. Drainage Map showing basin area. Figure 42. Calculation of Basin Storage Attached
Reference: FDOT Hydrology Handbook, Feb. 2012, Table T-13
T:\PROJECTS\FDOT_D5\SR514 PD&E\Drainage\HY8\Hydrology_RegressionAnalysis.xlsxCulvert 2 Alt.

USGS REGRESSION EQUATIONS FOR NATURAL FLOWCONDITIONS IN FLORIDA: REGION 4
Project: SR514 PDEBasin: Culvert 3Location: Brevard CountyComputed by: C. Estrella Checked by:Date: 6/24/2014 Date:
Required Basin Data:
Drainage Area (DA) 1.25 miles2
Basin Storage (ST) 3.95 % of total area
Range of Applicability of Basin Characteristics:
DA 120 acres to 2,833 miles2
ST 0 to 34.12 %
Peak Runoff Equation Standard QT (ft3/s)
Error (%)
Q2 = 171 DA0.628 (ST+ 1)-0.40136.0 1052
Q5 = 321 DA0.618 (ST + 1)-0.39539.0 198
Q10 = 447 DA0.614 (ST + 1)-0.39643.0 273
Q25 = 636 DA0.610 (ST + 1)-0.40148.0 384
Q50 = 797 DA0.609 (ST + 1)-0.40653.0 478
Q100 = 975 DA0.608 (ST + 1)-0.41157.0 580
Q200 = 1171 DA0.608 (ST + 1)-0.41662.0 691
Q500 = 1461 DA0.609 (ST + 1)-0.42469.0 851
Calculations and Documentation Location1. Drainage Map showing basin area. Figure 42. Calculation of Basin Storage Attached
Reference: FDOT Hydrology Handbook, Feb. 2012, Table T-13
T:\PROJECTS\FDOT_D5\SR514 PD&E\Drainage\HY8\Hydrology_RegressionAnalysis.xlsxCulvert 3

USGS REGRESSION EQUATIONS FOR NATURAL FLOWCONDITIONS IN FLORIDA: REGION 4
Project: SR514 PDEBasin: Culvert 3 Alt. Location: Brevard CountyComputed by: C. Estrella Checked by:Date: 6/24/2014 Date:
Required Basin Data:
Drainage Area (DA) 0.37 miles2
Basin Storage (ST) 4.14 % of total area
Range of Applicability of Basin Characteristics:
DA 120 acres to 2,833 miles2
ST 0 to 34.12 %
Peak Runoff Equation Standard QT (ft3/s)
Error (%)
Q2 = 171 DA0.628 (ST+ 1)-0.40136.0 482
Q5 = 321 DA0.618 (ST + 1)-0.39539.0 92
Q10 = 447 DA0.614 (ST + 1)-0.39643.0 127
Q25 = 636 DA0.610 (ST + 1)-0.40148.0 180
Q50 = 797 DA0.609 (ST + 1)-0.40653.0 223
Q100 = 975 DA0.608 (ST + 1)-0.41157.0 271
Q200 = 1171 DA0.608 (ST + 1)-0.41662.0 323
Q500 = 1461 DA0.609 (ST + 1)-0.42469.0 398
Calculations and Documentation Location1. Drainage Map showing basin area. Figure 42. Calculation of Basin Storage Attached
Reference: FDOT Hydrology Handbook, Feb. 2012, Table T-13
T:\PROJECTS\FDOT_D5\SR514 PD&E\Drainage\HY8\Hydrology_RegressionAnalysis.xlsxCulvert 3 Alt.

USGS REGRESSION EQUATIONS FOR NATURAL FLOWCONDITIONS IN FLORIDA: REGION 4
Project: SR514 PDEBasin: Culvert 7Location: Brevard CountyComputed by: C. Estrella Checked by:Date: 6/24/2014 Date:
Required Basin Data:
Drainage Area (DA) 2.15 miles2
Basin Storage (ST) 10.64 % of total area
Range of Applicability of Basin Characteristics:
DA 120 acres to 2,833 miles2
ST 0 to 34.12 %
Peak Runoff Equation Standard QT (ft3/s)
Error (%)
Q2 = 171 DA0.628 (ST+ 1)-0.40136.0 1052
Q5 = 321 DA0.618 (ST + 1)-0.39539.0 197
Q10 = 447 DA0.614 (ST + 1)-0.39643.0 271
Q25 = 636 DA0.610 (ST + 1)-0.40148.0 379
Q50 = 797 DA0.609 (ST + 1)-0.40653.0 469
Q100 = 975 DA0.608 (ST + 1)-0.41157.0 566
Q200 = 1171 DA0.608 (ST + 1)-0.41662.0 672
Q500 = 1461 DA0.609 (ST + 1)-0.42469.0 822
Calculations and Documentation Location1. Drainage Map showing basin area. Figure 42. Calculation of Basin Storage Attached
Reference: FDOT Hydrology Handbook, Feb. 2012, Table T-13
T:\PROJECTS\FDOT_D5\SR514 PD&E\Drainage\HY8\Hydrology_RegressionAnalysis.xlsxCulvert 7

USGS REGRESSION EQUATIONS FOR NATURAL FLOWCONDITIONS IN FLORIDA: REGION 4
Project: SR514 PDEBasin: Culvert 9Location: Brevard CountyComputed by: C. Estrella Checked by:Date: 6/24/2014 Date:
Required Basin Data:
Drainage Area (DA) 1.00 miles2
Basin Storage (ST) 5.33 % of total area
Range of Applicability of Basin Characteristics:
DA 120 acres to 2,833 miles2
ST 0 to 34.12 %
Peak Runoff Equation Standard QT (ft3/s)
Error (%)
Q2 = 171 DA0.628 (ST+ 1)-0.40136.0 822
Q5 = 321 DA0.618 (ST + 1)-0.39539.0 156
Q10 = 447 DA0.614 (ST + 1)-0.39643.0 215
Q25 = 636 DA0.610 (ST + 1)-0.40148.0 303
Q50 = 797 DA0.609 (ST + 1)-0.40653.0 376
Q100 = 975 DA0.608 (ST + 1)-0.41157.0 456
Q200 = 1171 DA0.608 (ST + 1)-0.41662.0 542
Q500 = 1461 DA0.609 (ST + 1)-0.42469.0 667
Calculations and Documentation Location1. Drainage Map showing basin area. Figure 42. Calculation of Basin Storage Attached
Reference: FDOT Hydrology Handbook, Feb. 2012, Table T-13
T:\PROJECTS\FDOT_D5\SR514 PD&E\Drainage\HY8\Hydrology_RegressionAnalysis.xlsxCulvert 9

EACH GREENPOLYGON DEPICTSA STORAGE AREAFOR REGRESSIONANALYSIS

Hydrology Handbook February 2012
B-7
Table T-4 Runoff Coefficients for a Design Storm Return
Period of 10 Years or Lessa
Sandy Soils Clay Soils
Slope Land Use Min. Max. Min. Max. Flat Woodlands 0.10 0.15 0.15 0.20 (0-2%) Pasture, grass, and farmland b 0.15 0.20 0.20 0.25
Bare Earth 0.30 0.50 0.50 0.60 Rooftops and pavement 0.95 0.95 0.95 0.95 Pervious pavements c 0.75 0.95 0.90 0.95 SFR: 1/2-acre lots and larger 0.30 0.35 0.35 0.45
Smaller lots 0.35 0.45 0.40 0.50 Duplexes 0.35 0.45 0.40 0.50
MFR: Apartments, townhouses, and condominiums 0.45 0.60 0.50 0.70
Commercial and Industrial 0.50 0.95 0.50 0.95 Rolling Woodlands 0.15 0.20 0.20 0.25 (2-7%) Pasture, grass, and farmland b 0.20 0.25 0.25 0.30
Bare Earth 0.40 0.60 0.60 0.70 Rooftops and pavement 0.95 0.95 0.95 0.95 Pervious pavements c 0.80 0.95 0.90 0.95 SFR: 1/2-acre lots and larger 0.35 0.50 0.40 0.55
Smaller lots 0.40 0.55 0.45 0.60 Duplexes 0.40 0.55 0.45 0.60
MFR: Apartments, townhouses, and condominiums 0.50 0.70 0.60 0.80
Commercial and Industrial 0.50 0.95 0.50 0.95 Steep Woodlands 0.20 0.25 0.25 0.30 (7%+) Pasture, grass, and farmland b 0.25 0.35 0.30 0.40
Bare Earth 0.50 0.70 0.70 0.80 Rooftops and pavement 0.95 0.95 0.95 0.95 Pervious pavements c 0.85 0.95 0.90 0.95 SFR: 1/2-acre lots and larger 0.40 0.55 0.50 0.65
Smaller lots 0.45 0.60 0.55 0.70 Duplexes 0.45 0.60 0.55 0.70
MFR: Apartments, townhouses, and condominiums 0.60 0.75 0.65 0.85
Commercial and Industrial 0.60 0.95 0.65 0.95 a Weighted coefficient based on percentage of impervious surfaces and green areas must be selected for each site. b Coefficients assume good ground cover and conservation treatment. c Depends on depth and degree of permeability of underlying strata. Note: SFR = Single Family Residential
MFR = Multi-Family Residential


tc intensity ln tcminutes in/hr
8 10.3 2.0810 9.6 2.3015 8.5 2.7120 7.5 3.0030 6.4 3.4040 5.6 3.6950 5 3.9160 4.5 4.0990 3.4 4.50
120 2.75 4.79150 2.35 5.01180 2.05 5.19
y = 0.0766x3 ‐ 0.6606x2 ‐ 1.0717x + 14.671
0
2
4
6
8
10
12
0.00 2.00 4.00 6.00
intensity vs. ln (tc)
intensity vs. ln (tc)
Poly. (intensity vs. ln (tc))

Hydrology Handbook February 2012
B-8
Table T-5 Design Storm Frequency Factors for Pervious Area
Runoff Coefficients *
Design Storm Return Period (years) Frequency Factor, XT
2 to 10 1.0 25 1.1 50 1.2 100 1.25 _____________ Reference: Wright-McLaughlin Engineers (1969). * DUE TO THE INCREASE IN THE DURATION TIME THAT THE PEAK OR NEAR PEAK
DISCHARGE RATE IS RELEASED FROM STORMWATER MANAGEMENT SYSTEMS, THE USE OF THESE SHORT DURATION PEAK RATE DISCHARGE ADJUSTMENT FACTORS IS NOT APPROPRIATE FOR FLOOD ROUTING COMPUTATIONS.

Hydrology Handbook February 2012
B-23
(Page 2 of 3)
Polynomial Coefficients
for a Third Degree Polynomial Rainfall Zone
Storm Frequency in Years A B C D
6 2 14.09519 -4.17207 0.31773 0.00029 6 3 14.98331 -4.44963 0.35683 -0.00224 6 5 14.54762 -3.89935 0.22564 0.00674 6 10 14.35386 -3.10140 -0.01003 0.02525 6 25 16.15961 -3.48135 -0.00160 0.02677 6 50 15.67671 -2.52635 -0.26055 0.04609 7 2 12.10821 -2.79255 0.02002 0.02053 7 3 12.43560 -2.56458 -0.06903 0.02787 7 5 12.51872 -2.17764 -0.19805 0.03849 7 10 12.49556 -1.67116 -0.34901 0.05017 7 25 12.92209 -1.11084 -0.55019 0.06666 7 50 13.29550 -0.70432 -0.70152 0.07933 8 2 11.51282 -2.10568 -0.16578 0.03515 8 3 11.13440 -1.44999 -0.34027 0.04808 8 5 11.41155 -1.34465 -0.38409 0.05149 8 10 11.54908 -0.89694 -0.53000 0.06319 8 25 10.92111 0.51710 -0.93480 0.09473 8 50 11.58787 0.73605 -1.04111 0.10384 9 2 11.08062 -1.66022 -0.28464 0.04453 9 3 11.54667 -1.49353 -0.35960 0.05071 9 5 11.76664 -1.38391 -0.39880 0.05352 9 10 12.08400 -1.00328 -0.53661 0.06491 9 25 12.38592 -0.27352 -0.77352 0.08370 9 50 14.16172 -0.73486 -0.75377 0.08518
10 2 11.33384 -1.86569 -0.22813 0.04005 10 3 11.32916 -1.38557 -0.36672 0.05012 10 5 11.19083 -0.93165 -0.48526 0.05836 10 10 10.84265 -0.18976 -0.69575 0.07495 10 25 11.83969 0.09353 -0.84451 0.08783 10 50 11.59208 1.00204 -1.10384 0.10762

1
23
4567
89101112131415161718192021222324252627282930313233343536373839404142434445
K L M N O P Q R S T U
Area ID Area (ac) Main Culvert Alt. Culvert9962 4.73 2 29963 0.80 2 2
9964 1.92 2 29965 11.62 2 29966 0.57 3 29967 2.20 3 29968 0.80 3 29969 6.12 3 29970 1.00 2 29971 2.10 2 29972 4.52 3 29973 1.34 3 39974 3.69 3 39975 2.59 3 39976 6.32 5 59977 3.70 5 59978 4.61 5 59979 2.50 5 59980 3.98 7 79981 2.15 3 39982 1.30 3 29983 1.03 3 29984 2.47 3 29985 2.90 3 29986 3.48 7 79987 0.97 7 79988 1.76 7 79989 4.08 7 79990 0.77 7 79991 2.40 7 79992 18.55 7 79993 1.78 7 79994 3.33 7 79995 10.73 7 79996 0.57 7 79997 1.54 7 79998 1.34 7 79999 0.54 7 7
10000 1.34 7 710001 1 86 7 7
Storage Area Table
The USGS Quadrangle Map has been used to estimate the surface area of "Storage" in each basin by delineating swamps and lakes in pre-developlment conditions.
The regression equations for natural flow conditions are being used to estimate the Q at some of the culverts across SR514.
45464748495051525354555657585960616263646566676869707172737475767778
10001 1.86 7 710002 3.51 7 710003 1.85 7 710004 9.38 7 710005 0.46 7 710006 4.98 7 710007 22.37 7 710008 0.86 7 710009 12.30 7 710010 5.46 7 710011 1.28 7 710012 13.25 7 710013 3.24 7 710014 8.50 7 710015 3.15 9 910016 5.73 9 910017 2.37 9 910018 12.34 9 910019 1.43 9 910020 0.87 8 810021 0.00 N/A NA10022 1.25 8 810023 0.87 8 810024 1.41 8 810025 3.32 9 910026 0.59 9 910027 1.01 9 910028 4.09 9 910029 2.22 N/A N/A10030 1.29 N/A N/A10031 0.65 N/A N/A10032 3.10 N/A N/A
TOTAL 263.13
T:\PROJECTS\FDOT_D5\SR514 PD&E\Drainage\HY8\RegressionAnalysis.xlsxInput

Hydrology Handbook January 2012
B-29
F-4 Regions for USGS Regression Equations for Natural Flow Conditions in Florida

Hydrology Handbook February 2012
B-16
Table T-13 USGS Regression Equations for Natural Flow
Conditions in Florida - Region 4
Standard Error of Prediction
Peak Runoff Equation (%) Q2 = 171 A0.628 (ST+1)-0.401 36 Q5 = 321 A0.618 (ST+1)-0.395 39 Q10 = 447 A0.614 (ST+1)-0.396 43 Q25 = 636 A0.610 (ST+1)-0.401 48 Q50 = 797 A0.609 (ST+1)-0.406 53 Q100 = 975 A0.608 (ST+1)-0.411 57 Q200 = 1171 A0.608 (ST+1)-0.416 62 Q500 = 1461 A0.609 (ST+1)-0.424 69
QT = Peak runoff rate for return period of T-years, in cfs
A = Drainage area, in miles2
ST = Basin storage, the percentage of the drainage basin occupied by lakes, reservoirs, swamps, and wetland. In-channel storage of a temporary nature, resulting from detention ponds or roadway embankments, is not included in the computation of ST
Basin Characteristic Range of Applicability
Drainage Area (A) 0.20 miles2 (120 acres) to 2,833 miles2
Storage Area (ST) 0% to 34.12% _____________ Reference: Verdi (2006) See Figure F-4 for zone delineation.

Existing ~ Proposed
Ex. Size Prop. Size Q (cfs) Pre HW Post HW Road CL EL Road CL EL
24" 30" 1 23 24.16 23.31 24.34 25.25
8x4 8x4 2 316 24.12 24.12 24.31 25.58
8x4 (2) 6x4 2 Alt 453 24.64 23.78 24.31 25.58
10x3 (2) 8x4 3 478 21.23 20.93 20.84 24.02
10x3 10x3 3 Alt 218 20.40 20.49 20.84 24.02
24" 30" 4 20 19.86 19.21 20.46 24.66
(2) 8x3 (2) 8x4 5 386 17.24 16.86 18.3 22.98
30" (2) 30" 6 61 19.56 19.11 19.4 23.06
8x4 (2) 6x4 7 469 21.42 21.46 21.08 23.62
24" (2) 36" 8 99 22.13 21.42 21.76 25.65
10x5 10x5 9 376 19.06 19.06 21.07 25.01
24" 30" 10 25.6 22.41 21.43 22.9 22.9
24" 24" 11 10 22.31 22.35 24.07 24.07
24" 30" 12 10 21.64 21.51 23.97 23.97
24" 36" 13 83 24.08 24.48 23.8 24.5
18" 24" 14 10 23.62 22.94 25 25
Culvert
50 yr
Existing conditions for the project's culverts have been analyzed to help determine a
preliminary culvert size for Proposed Conditions. Based upon available data, the
proposed pipe is sized to match or reduce the estimated 50-year headwater at each
crossing. Table below summaries the results of the calculations for Existing and
Proposed Conditions.
Culvert #13 is part of the storm sewer system east of Marie Street. Results for existing
conditions indicate overtopping of roadway where no problems are reported. Either
runoff shifts to nearby inlet or basin area is different than assumed. Large pipe for
proposed condition assumes downstream portion of storm sewer system is upsized to
handle. Roadway profile affects peak stage if overtopping is present.

PRELIMINARY SIZING OF
PROPOSED CROSSDRAINS
EXISTING CULVERTS
EXISTING CULVERTS HAVE BEEN PRELIMINARILY ANALYZED USINGBEST AVAILABLE DATA:A) SURVEY OF INVERTS AND PIPE SIZES WERE OBTAINED FORCULVERTS 2,3,5,6,7,8,9,10,11,12B) FLOWLINES FOR OTHER CULVERTS (1,4,13, AND 14) WEREOBTAINED FROM VARIOUS CONSTRUCTION PLANS (SPN 7080-3506 ANDSJRWMD ERP DATA)

HY-8 Culvert Analysis Report

Table 1 - Summary of Culvert Flows at Crossing: Culvert 1 - 24" RCP
Headwater Elevation (ft) Total Discharge (cfs)
Culvert 01 Discharge (cfs)
Roadway Discharge (cfs) Iterations
23.48 18.00 18.00 0.00 1 23.57 18.80 18.80 0.00 1 23.68 19.60 19.60 0.00 1 23.78 20.40 20.40 0.00 1 23.89 21.20 21.20 0.00 1 24.01 22.00 22.00 0.00 1 24.13 22.80 22.80 0.00 1 24.16 23.00 23.00 0.00 1 24.34 24.40 24.20 0.09 34 24.36 25.20 24.29 0.78 5 24.37 26.00 24.36 1.52 4 24.34 24.17 24.17 0.00 Overtopping

Rating Curve Plot for Crossing: Culvert 1 - 24" RCP

Table 2 - Culvert Summary Table: Culvert 01
********************************************************************************
Inlet Elevation (invert): 20.52 ft, Outlet Elevation (invert): 20.40 ft
Culvert Length: 58.00 ft, Culvert Slope: 0.0021
********************************************************************************
Total Discharge
(cfs) Culvert
Discharge (cfs)
Headwater Elevation
(ft) Inlet Control
Depth (ft) Outlet Control
Depth (ft) Flow Type
Normal Depth (ft)
Critical Depth (ft)
Outlet Depth (ft)
Tailwater Depth (ft)
Outlet Velocity
(ft/s) Tailwater Velocity
(ft/s) 18.00 18.00 23.48 2.645 2.956 4-FFf 2.000 1.523 2.000 2.000 5.730 0.000
18.80 18.80 23.57 2.760 3.053 4-FFf 2.000 1.556 2.000 2.000 5.984 0.000
19.60 19.60 23.68 2.880 3.155 4-FFf 2.000 1.590 2.000 2.000 6.239 0.000
20.40 20.40 23.78 3.005 3.262 4-FFf 2.000 1.617 2.000 2.000 6.494 0.000
21.20 21.20 23.89 3.136 3.372 4-FFf 2.000 1.640 2.000 2.000 6.748 0.000
22.00 22.00 24.01 3.272 3.487 4-FFf 2.000 1.664 2.000 2.000 7.003 0.000
22.80 22.80 24.13 3.414 3.606 4-FFf 2.000 1.687 2.000 2.000 7.257 0.000
23.00 23.00 24.16 3.451 3.636 4-FFf 2.000 1.693 2.000 2.000 7.321 0.000
24.40 24.20 24.34 3.677 3.824 4-FFf 2.000 1.728 2.000 2.000 7.702 0.000
25.20 24.29 24.36 3.695 3.839 4-FFf 2.000 1.731 2.000 2.000 7.732 0.000
26.00 24.36 24.37 3.708 3.850 4-FFf 2.000 1.733 2.000 2.000 7.754 0.000

Culvert Performance Curve Plot: Culvert 01

Water Surface Profile Plot for Culvert: Culvert 01
Site Data - Culvert 01
Site Data Option: Culvert Invert Data
Inlet Station: 0.00 ft
Inlet Elevation: 20.52 ft
Outlet Station: 58.00 ft
Outlet Elevation: 20.40 ft
Number of Barrels: 1
Culvert Data Summary - Culvert 01
Barrel Shape: Circular
Barrel Diameter: 2.00 ft
Barrel Material: Concrete
Embedment: 0.00 in
Barrel Manning's n: 0.0120
Inlet Type: Conventional
Inlet Edge Condition: Square Edge with Headwall
Inlet Depression: NONE

Table 3 - Downstream Channel Rating Curve (Crossing: Culvert 1 - 24" RCP)
Tailwater Channel Data - Culvert 1 - 24" RCP
Tailwater Channel Option: Enter Constant Tailwater Elevation
Constant Tailwater Elevation: 22.40 ft
Roadway Data for Crossing: Culvert 1 - 24" RCP
Roadway Profile Shape: Constant Roadway Elevation
Crest Length: 100.00 ft
Crest Elevation: 24.34 ft
Roadway Surface: Paved
Roadway Top Width: 36.00 ft
Flow (cfs) Water Surface Elev (ft) Depth (ft)
18.00 22.40 2.00 18.80 22.40 2.00 19.60 22.40 2.00 20.40 22.40 2.00 21.20 22.40 2.00 22.00 22.40 2.00 22.80 22.40 2.00 23.00 22.40 2.00 24.40 22.40 2.00 25.20 22.40 2.00 26.00 22.40 2.00

HY-8 Culvert Analysis Report

Table 1 - Summary of Culvert Flows at Crossing: Culvert 02
Headwater Elevation (ft) Total Discharge (cfs)
Culvert 02 Discharge (cfs)
Roadway Discharge (cfs) Iterations
21.83 207.00 207.00 0.00 1 22.32 233.30 233.30 0.00 1 22.84 259.60 259.60 0.00 1 23.41 285.90 285.90 0.00 1 24.03 312.20 312.20 0.00 1 24.12 316.00 316.00 0.00 1 24.46 364.80 329.35 35.00 9 24.52 391.10 331.75 58.91 5 24.58 417.40 333.85 83.35 5 24.63 443.70 335.71 107.58 4 24.67 470.00 337.45 132.29 4 24.31 323.41 323.41 0.00 Overtopping

Rating Curve Plot for Crossing: Culvert 02

Table 2 - Culvert Summary Table: Culvert 02
********************************************************************************
Inlet Elevation (invert): 17.08 ft, Outlet Elevation (invert): 17.03 ft
Culvert Length: 62.00 ft, Culvert Slope: 0.0008
********************************************************************************
Total Discharge
(cfs) Culvert
Discharge (cfs)
Headwater Elevation
(ft) Inlet Control
Depth (ft) Outlet Control
Depth (ft) Flow Type
Normal Depth (ft)
Critical Depth (ft)
Outlet Depth (ft)
Tailwater Depth (ft)
Outlet Velocity
(ft/s) Tailwater Velocity
(ft/s) 207.00 207.00 21.83 4.746 4.723 2-M2c 4.000 2.756 2.748 2.160 9.414 0.000
233.30 233.30 22.32 5.236 5.114 2-M2c 4.000 2.984 2.976 2.370 9.799 0.000
259.60 259.60 22.84 5.761 5.491 2-M2c 4.000 3.205 3.195 2.570 10.157 0.000
285.90 285.90 23.41 6.330 5.856 2-M2c 4.000 3.418 3.409 2.770 10.482 0.000
312.20 312.20 24.03 6.949 6.331 7-M2c 4.000 3.624 3.615 2.970 10.795 0.000
316.00 316.00 24.12 7.043 6.406 7-M2c 4.000 3.653 3.644 2.990 10.838 0.000
364.80 329.35 24.46 7.382 6.738 4-FFf 4.000 3.756 4.000 4.030 10.292 0.000
391.10 331.75 24.52 7.444 6.778 4-FFf 4.000 3.774 4.000 4.030 10.367 0.000
417.40 333.85 24.58 7.499 6.813 4-FFf 4.000 3.790 4.000 4.030 10.433 0.000
443.70 335.71 24.63 7.548 6.845 4-FFf 4.000 3.804 4.000 4.030 10.491 0.000
470.00 337.45 24.67 7.595 6.875 4-FFf 4.000 3.817 4.000 4.030 10.545 0.000

Culvert Performance Curve Plot: Culvert 02

Water Surface Profile Plot for Culvert: Culvert 02
Site Data - Culvert 02
Site Data Option: Culvert Invert Data
Inlet Station: 0.00 ft
Inlet Elevation: 17.08 ft
Outlet Station: 62.00 ft
Outlet Elevation: 17.03 ft
Number of Barrels: 1
Culvert Data Summary - Culvert 02
Barrel Shape: Concrete Box
Barrel Span: 8.00 ft
Barrel Rise: 4.00 ft
Barrel Material: Concrete
Embedment: 0.00 in
Barrel Manning's n: 0.0120
Inlet Type: Conventional
Inlet Edge Condition: Square Edge (90º) Headwall
Inlet Depression: NONE

Table 3 - Downstream Channel Rating Curve (Crossing: Culvert 02)
Tailwater Channel Data - Culvert 02
Tailwater Channel Option: Enter Rating Curve
Roadway Data for Crossing: Culvert 02
Roadway Profile Shape: Constant Roadway Elevation
Crest Length: 200.00 ft
Crest Elevation: 24.31 ft
Roadway Surface: Paved
Roadway Top Width: 32.00 ft
Flow (cfs) Water Surface Elev (ft) Depth (ft)
207.00 19.19 2.16 233.30 19.40 2.37 259.60 19.60 2.57 285.90 19.80 2.77 312.20 20.00 2.97 316.00 20.02 2.99 364.80 21.06 4.03 391.10 21.06 4.03 417.40 21.06 4.03 443.70 21.06 4.03 470.00 21.06 4.03

HY-8 Culvert Analysis Report

Table 1 - Summary of Culvert Flows at Crossing: Culvert 02 Alt.
Headwater Elevation (ft) Total Discharge (cfs)
Culvert 02 Discharge (cfs)
Roadway Discharge (cfs) Iterations
20.01 100.00 100.00 0.00 1 21.23 170.40 170.40 0.00 1 22.46 240.80 240.80 0.00 1 24.00 311.20 311.20 0.00 1 24.50 381.60 330.93 50.26 8 24.64 452.00 336.27 115.45 6 24.64 453.00 336.32 116.09 2 24.86 592.80 344.41 248.14 5 24.96 663.20 347.88 315.06 4 25.05 733.60 351.10 382.36 4 25.13 804.00 354.09 449.22 3 24.31 323.43 323.43 0.00 Overtopping

Rating Curve Plot for Crossing: Culvert 02 Alt.

Table 2 - Culvert Summary Table: Culvert 02
********************************************************************************
Inlet Elevation (invert): 17.08 ft, Outlet Elevation (invert): 17.03 ft
Culvert Length: 62.00 ft, Culvert Slope: 0.0008
********************************************************************************
Total Discharge
(cfs) Culvert
Discharge (cfs)
Headwater Elevation
(ft) Inlet Control
Depth (ft) Outlet Control
Depth (ft) Flow Type
Normal Depth (ft)
Critical Depth (ft)
Outlet Depth (ft)
Tailwater Depth (ft)
Outlet Velocity
(ft/s) Tailwater Velocity
(ft/s) 100.00 100.00 20.01 2.871 2.926 3-M2t 2.612 1.697 1.990 1.990 6.281 0.000
170.40 170.40 21.23 4.104 4.149 2-M2c 4.000 2.420 2.413 2.170 8.827 0.000
240.80 240.80 22.46 5.382 5.223 2-M2c 4.000 3.048 3.039 2.370 9.904 0.000
311.20 311.20 24.00 6.925 6.312 7-M2c 4.000 3.616 3.607 2.570 10.783 0.000
381.60 330.93 24.50 7.423 6.695 7-M2c 4.000 3.768 3.758 2.770 11.007 0.000
452.00 336.27 24.64 7.563 6.797 7-M2c 4.000 3.808 3.798 2.990 11.066 0.000
453.00 336.32 24.64 7.565 6.798 7-M2c 4.000 3.808 3.799 2.990 11.067 0.000
592.80 344.41 24.86 7.782 6.996 4-FFf 4.000 3.869 4.000 4.030 10.763 0.000
663.20 347.88 24.96 7.876 7.056 4-FFf 4.000 3.895 4.000 4.030 10.871 0.000
733.60 351.10 25.05 7.965 7.114 4-FFf 4.000 3.919 4.000 4.030 10.972 0.000
804.00 354.09 25.13 8.049 7.167 4-FFf 4.000 3.942 4.000 4.030 11.065 0.000

Culvert Performance Curve Plot: Culvert 02

Water Surface Profile Plot for Culvert: Culvert 02
Site Data - Culvert 02
Site Data Option: Culvert Invert Data
Inlet Station: 0.00 ft
Inlet Elevation: 17.08 ft
Outlet Station: 62.00 ft
Outlet Elevation: 17.03 ft
Number of Barrels: 1
Culvert Data Summary - Culvert 02
Barrel Shape: Concrete Box
Barrel Span: 8.00 ft
Barrel Rise: 4.00 ft
Barrel Material: Concrete
Embedment: 0.00 in
Barrel Manning's n: 0.0120
Inlet Type: Conventional
Inlet Edge Condition: Square Edge (90º) Headwall
Inlet Depression: NONE

Table 3 - Downstream Channel Rating Curve (Crossing: Culvert 02 Alt.)
Tailwater Channel Data - Culvert 02 Alt.
Tailwater Channel Option: Enter Rating Curve
Roadway Data for Crossing: Culvert 02 Alt.
Roadway Profile Shape: Constant Roadway Elevation
Crest Length: 200.00 ft
Crest Elevation: 24.31 ft
Roadway Surface: Paved
Roadway Top Width: 32.00 ft
Flow (cfs) Water Surface Elev (ft) Depth (ft)
100.00 19.02 1.99 170.40 19.20 2.17 240.80 19.40 2.37 311.20 19.60 2.57 381.60 19.80 2.77 452.00 20.02 2.99 453.00 20.02 2.99 592.80 21.06 4.03 663.20 21.06 4.03 733.60 21.06 4.03 804.00 21.06 4.03

HY-8 Culvert Analysis Report

Table 1 - Summary of Culvert Flows at Crossing: Culvert 03
Headwater Elevation (ft) Total Discharge (cfs)
Culvert 03 Discharge (cfs)
Roadway Discharge (cfs) Iterations
18.46 105.00 105.00 0.00 1 19.34 179.60 179.60 0.00 1 20.80 254.20 253.64 0.00 41 21.01 328.80 262.47 65.58 7 21.13 403.40 267.56 135.04 5 21.23 478.00 271.56 205.50 4 21.33 552.60 265.89 285.90 4 21.42 627.20 265.19 361.70 4 21.50 701.80 264.14 437.50 4 21.58 776.40 262.78 512.68 3 21.66 851.00 261.26 589.15 3 20.81 253.89 253.89 0.00 Overtopping

Rating Curve Plot for Crossing: Culvert 03

Table 2 - Culvert Summary Table: Culvert 03
********************************************************************************
Inlet Elevation (invert): 15.59 ft, Outlet Elevation (invert): 15.43 ft
Culvert Length: 96.00 ft, Culvert Slope: 0.0017
********************************************************************************
Total Discharge
(cfs) Culvert
Discharge (cfs)
Headwater Elevation
(ft) Inlet Control
Depth (ft) Outlet Control
Depth (ft) Flow Type
Normal Depth (ft)
Critical Depth (ft)
Outlet Depth (ft)
Tailwater Depth (ft)
Outlet Velocity
(ft/s) Tailwater Velocity
(ft/s) 105.00 105.00 18.46 2.548 2.870 3-M1t 1.744 1.510 2.570 2.570 4.086 0.000
179.60 179.60 19.34 3.754 3.706 7-M1t 2.514 2.160 2.570 2.570 6.988 0.000
254.20 253.64 20.80 5.214 4.709 7-M2c 3.000 2.719 2.713 2.570 9.351 0.000
328.80 262.47 21.01 5.418 4.938 7-M2t 3.000 2.782 2.870 2.870 9.145 0.000
403.40 267.56 21.13 5.539 5.272 4-FFf 3.000 2.818 3.000 3.170 8.919 0.000
478.00 271.56 21.23 5.636 5.640 4-FFf 3.000 2.846 3.000 3.470 9.052 0.000
552.60 265.89 21.33 5.499 5.744 4-FFf 3.000 2.806 3.000 3.670 8.863 0.000
627.20 265.19 21.42 5.483 5.832 4-FFf 3.000 2.801 3.000 3.770 8.840 0.000
701.80 264.14 21.50 5.458 5.914 4-FFf 3.000 2.794 3.000 3.870 8.805 0.000
776.40 262.78 21.58 5.425 5.992 4-FFf 3.000 2.784 3.000 3.970 8.759 0.000
851.00 261.26 21.66 5.390 6.167 4-FFf 3.000 2.773 3.000 4.170 8.709 0.000

Culvert Performance Curve Plot: Culvert 03

Water Surface Profile Plot for Culvert: Culvert 03
Site Data - Culvert 03
Site Data Option: Culvert Invert Data
Inlet Station: 0.00 ft
Inlet Elevation: 15.59 ft
Outlet Station: 96.00 ft
Outlet Elevation: 15.43 ft
Number of Barrels: 1
Culvert Data Summary - Culvert 03
Barrel Shape: Concrete Box
Barrel Span: 10.00 ft
Barrel Rise: 3.00 ft
Barrel Material: Concrete
Embedment: 0.00 in
Barrel Manning's n: 0.0120
Inlet Type: Conventional
Inlet Edge Condition: Square Edge (90º) Headwall
Inlet Depression: NONE

Table 3 - Downstream Channel Rating Curve (Crossing: Culvert 03)
Tailwater Channel Data - Culvert 03
Tailwater Channel Option: Enter Rating Curve
Roadway Data for Crossing: Culvert 03
Roadway Profile Shape: Constant Roadway Elevation
Crest Length: 250.00 ft
Crest Elevation: 20.81 ft
Roadway Surface: Paved
Roadway Top Width: 57.00 ft
Flow (cfs) Water Surface Elev (ft) Depth (ft)
105.00 18.00 2.57 179.60 18.00 2.57 254.20 18.00 2.57 328.80 18.30 2.87 403.40 18.60 3.17 478.00 18.90 3.47 552.60 19.10 3.67 627.20 19.20 3.77 701.80 19.30 3.87 776.40 19.40 3.97 851.00 19.60 4.17

HY-8 Culvert Analysis Report

Table 1 - Summary of Culvert Flows at Crossing: Culvert 03 Alt
Headwater Elevation (ft) Total Discharge (cfs)
Culvert 03 Discharge (cfs)
Roadway Discharge (cfs) Iterations
18.42 105.00 105.00 0.00 1 18.64 126.60 126.60 0.00 1 18.90 148.20 148.20 0.00 1 19.24 169.80 169.80 0.00 1 19.76 191.40 191.40 0.00 1 20.23 213.00 213.00 0.00 1 20.40 218.00 218.00 0.00 1 20.91 256.20 232.69 23.07 11 20.97 277.80 229.98 47.36 5 21.02 299.40 226.67 72.56 5 21.07 321.00 222.80 97.78 4 20.81 238.45 238.45 0.00 Overtopping

Rating Curve Plot for Crossing: Culvert 03 Alt

Table 2 - Culvert Summary Table: Culvert 03
********************************************************************************
Inlet Elevation (invert): 15.59 ft, Outlet Elevation (invert): 15.43 ft
Culvert Length: 96.00 ft, Culvert Slope: 0.0017
********************************************************************************
Total Discharge
(cfs) Culvert
Discharge (cfs)
Headwater Elevation
(ft) Inlet Control
Depth (ft) Outlet Control
Depth (ft) Flow Type
Normal Depth (ft)
Critical Depth (ft)
Outlet Depth (ft)
Tailwater Depth (ft)
Outlet Velocity
(ft/s) Tailwater Velocity
(ft/s) 105.00 105.00 18.42 2.548 2.833 3-M1t 1.744 1.510 2.500 2.500 4.200 0.000
126.60 126.60 18.64 2.891 3.052 7-M1t 1.978 1.711 2.520 2.520 5.024 0.000
148.20 148.20 18.90 3.234 3.312 7-M1t 2.202 1.901 2.570 2.570 5.767 0.000
169.80 169.80 19.24 3.587 3.648 7-M1t 2.419 2.081 2.870 2.870 5.916 0.000
191.40 191.40 19.76 3.961 4.167 4-FFf 2.628 2.254 3.000 3.170 6.380 0.000
213.00 213.00 20.23 4.363 4.643 4-FFf 3.000 2.420 3.000 3.370 7.100 0.000
218.00 218.00 20.40 4.460 4.812 4-FFf 3.000 2.458 3.000 3.470 7.267 0.000
256.20 232.69 20.91 4.758 5.321 4-FFf 3.000 2.567 3.000 3.770 7.756 0.000
277.80 229.98 20.97 4.702 5.381 4-FFf 3.000 2.547 3.000 3.870 7.666 0.000
299.40 226.67 21.02 4.634 5.433 4-FFf 3.000 2.523 3.000 3.970 7.556 0.000
321.00 222.80 21.07 4.556 5.578 4-FFf 3.000 2.494 3.000 4.170 7.427 0.000

Culvert Performance Curve Plot: Culvert 03

Water Surface Profile Plot for Culvert: Culvert 03
Site Data - Culvert 03
Site Data Option: Culvert Invert Data
Inlet Station: 0.00 ft
Inlet Elevation: 15.59 ft
Outlet Station: 96.00 ft
Outlet Elevation: 15.43 ft
Number of Barrels: 1
Culvert Data Summary - Culvert 03
Barrel Shape: Concrete Box
Barrel Span: 10.00 ft
Barrel Rise: 3.00 ft
Barrel Material: Concrete
Embedment: 0.00 in
Barrel Manning's n: 0.0120
Inlet Type: Conventional
Inlet Edge Condition: Square Edge (90º) Headwall
Inlet Depression: NONE

Table 3 - Downstream Channel Rating Curve (Crossing: Culvert 03 Alt)
Tailwater Channel Data - Culvert 03 Alt
Tailwater Channel Option: Enter Rating Curve
Roadway Data for Crossing: Culvert 03 Alt
Roadway Profile Shape: Constant Roadway Elevation
Crest Length: 250.00 ft
Crest Elevation: 20.81 ft
Roadway Surface: Paved
Roadway Top Width: 57.00 ft
Flow (cfs) Water Surface Elev (ft) Depth (ft)
105.00 17.93 2.50 126.60 17.95 2.52 148.20 18.00 2.57 169.80 18.30 2.87 191.40 18.60 3.17 213.00 18.80 3.37 218.00 18.90 3.47 256.20 19.20 3.77 277.80 19.30 3.87 299.40 19.40 3.97 321.00 19.60 4.17

HY-8 Culvert Analysis Report

Table 1 - Summary of Culvert Flows at Crossing: Culvert 04
Headwater Elevation (ft) Total Discharge (cfs)
Culvert 04 Discharge (cfs)
Roadway Discharge (cfs) Iterations
18.71 15.00 15.00 0.00 1 18.86 16.50 16.50 0.00 1 19.02 18.00 18.00 0.00 1 19.50 19.50 19.50 0.00 1 19.86 20.00 20.00 0.00 1 20.46 22.50 22.28 0.10 40 20.51 24.00 21.13 2.78 6 20.52 25.50 20.62 4.74 4 20.54 27.00 19.92 6.98 4 20.56 28.50 19.20 9.24 4 20.57 30.00 18.46 11.35 3 20.46 22.44 22.44 0.00 Overtopping

Rating Curve Plot for Crossing: Culvert 04

Table 2 - Culvert Summary Table: Culvert 04
********************************************************************************
Inlet Elevation (invert): 15.72 ft, Outlet Elevation (invert): 15.71 ft
Culvert Length: 48.00 ft, Culvert Slope: 0.0002
********************************************************************************
Total Discharge
(cfs) Culvert
Discharge (cfs)
Headwater Elevation
(ft) Inlet Control
Depth (ft) Outlet Control
Depth (ft) Flow Type
Normal Depth (ft)
Critical Depth (ft)
Outlet Depth (ft)
Tailwater Depth (ft)
Outlet Velocity
(ft/s) Tailwater Velocity
(ft/s) 15.00 15.00 18.71 2.259 2.990 4-FFf 2.000 1.395 2.000 2.570 4.775 0.000
16.50 16.50 18.86 2.445 3.139 4-FFf 2.000 1.459 2.000 2.570 5.252 0.000
18.00 18.00 19.02 2.647 3.302 4-FFf 2.000 1.523 2.000 2.570 5.730 0.000
19.50 19.50 19.50 2.866 3.780 4-FFf 2.000 1.586 2.000 2.870 6.207 0.000
20.00 20.00 19.86 2.943 4.142 4-FFf 2.000 1.605 2.000 3.170 6.366 0.000
22.50 22.28 20.46 3.323 4.745 4-FFf 2.000 1.672 2.000 3.470 7.091 0.000
24.00 21.13 20.51 3.126 4.789 4-FFf 2.000 1.638 2.000 3.670 6.727 0.000
25.50 20.62 20.52 3.042 4.822 4-FFf 2.000 1.623 2.000 3.770 6.564 0.000
27.00 19.92 20.54 2.930 4.831 4-FFf 2.000 1.602 2.000 3.870 6.340 0.000
28.50 19.20 20.56 2.821 4.843 4-FFf 2.000 1.573 2.000 3.970 6.111 0.000
30.00 18.46 20.57 2.713 4.955 4-FFf 2.000 1.542 2.000 4.170 5.877 0.000

Culvert Performance Curve Plot: Culvert 04

Water Surface Profile Plot for Culvert: Culvert 04
Site Data - Culvert 04
Site Data Option: Culvert Invert Data
Inlet Station: 0.00 ft
Inlet Elevation: 15.72 ft
Outlet Station: 48.00 ft
Outlet Elevation: 15.71 ft
Number of Barrels: 1
Culvert Data Summary - Culvert 04
Barrel Shape: Circular
Barrel Diameter: 2.00 ft
Barrel Material: Concrete
Embedment: 0.00 in
Barrel Manning's n: 0.0120
Inlet Type: Conventional
Inlet Edge Condition: Square Edge with Headwall
Inlet Depression: NONE

Table 3 - Downstream Channel Rating Curve (Crossing: Culvert 04)
Tailwater Channel Data - Culvert 04
Tailwater Channel Option: Enter Rating Curve
Roadway Data for Crossing: Culvert 04
Roadway Profile Shape: Constant Roadway Elevation
Crest Length: 100.00 ft
Crest Elevation: 20.46 ft
Roadway Surface: Paved
Roadway Top Width: 32.00 ft
Flow (cfs) Water Surface Elev (ft) Depth (ft)
15.00 18.00 2.57 16.50 18.00 2.57 18.00 18.00 2.57 19.50 18.30 2.87 20.00 18.60 3.17 22.50 18.90 3.47 24.00 19.10 3.67 25.50 19.20 3.77 27.00 19.30 3.87 28.50 19.40 3.97 30.00 19.60 4.17

HY-8 Culvert Analysis Report

Table 1 - Summary of Culvert Flows at Crossing: Culvert 05
Headwater Elevation (ft) Total Discharge (cfs)
Culvert 05 Discharge (cfs)
Roadway Discharge (cfs) Iterations
15.10 190.00 190.00 0.00 1 15.44 227.00 227.00 0.00 1 15.76 264.00 264.00 0.00 1 16.08 301.00 301.00 0.00 1 16.53 338.00 338.00 0.00 1 17.04 375.00 375.00 0.00 1 17.24 386.00 386.00 0.00 1 18.32 449.00 446.38 2.03 13 18.48 486.00 441.87 43.76 7 18.58 523.00 432.68 89.61 5 18.67 560.00 421.87 137.87 5 18.30 447.58 447.58 0.00 Overtopping

Rating Curve Plot for Crossing: Culvert 05

Table 2 - Culvert Summary Table: Culvert 05
********************************************************************************
Inlet Elevation (invert): 12.18 ft, Outlet Elevation (invert): 12.14 ft
Culvert Length: 62.00 ft, Culvert Slope: 0.0006
********************************************************************************
Total Discharge
(cfs) Culvert
Discharge (cfs)
Headwater Elevation
(ft) Inlet Control
Depth (ft) Outlet Control
Depth (ft) Flow Type
Normal Depth (ft)
Critical Depth (ft)
Outlet Depth (ft)
Tailwater Depth (ft)
Outlet Velocity
(ft/s) Tailwater Velocity
(ft/s) 190.00 190.00 15.10 2.768 2.921 3-M2t 3.000 1.640 2.260 2.260 5.254 0.000
227.00 227.00 15.44 3.134 3.257 3-M2t 3.000 1.846 2.460 2.460 5.767 0.000
264.00 264.00 15.76 3.509 3.581 3-M2t 3.000 2.042 2.660 2.660 6.203 0.000
301.00 301.00 16.08 3.904 3.894 3-M2t 3.000 2.228 2.860 2.860 6.578 0.000
338.00 338.00 16.53 4.331 4.352 4-FFf 3.000 2.407 3.000 3.060 7.042 0.000
375.00 375.00 17.04 4.795 4.860 4-FFf 3.000 2.580 3.000 3.260 7.813 0.000
386.00 386.00 17.24 4.942 5.058 4-FFf 3.000 2.630 3.000 3.360 8.042 0.000
449.00 446.38 18.32 5.820 6.144 4-FFf 3.000 2.898 3.000 3.860 9.300 0.000
486.00 441.87 18.48 5.750 6.297 4-FFf 3.000 2.878 3.000 4.060 9.206 0.000
523.00 432.68 18.58 5.610 6.403 4-FFf 3.000 2.838 3.000 4.260 9.014 0.000
560.00 421.87 18.67 5.448 6.396 4-FFf 3.000 2.791 3.000 4.360 8.789 0.000

Culvert Performance Curve Plot: Culvert 05

Water Surface Profile Plot for Culvert: Culvert 05
Site Data - Culvert 05
Site Data Option: Culvert Invert Data
Inlet Station: 0.00 ft
Inlet Elevation: 12.18 ft
Outlet Station: 62.00 ft
Outlet Elevation: 12.14 ft
Number of Barrels: 2
Culvert Data Summary - Culvert 05
Barrel Shape: Concrete Box
Barrel Span: 8.00 ft
Barrel Rise: 3.00 ft
Barrel Material: Concrete
Embedment: 0.00 in
Barrel Manning's n: 0.0120
Inlet Type: Conventional
Inlet Edge Condition: Square Edge (90º) Headwall
Inlet Depression: NONE

Table 3 - Downstream Channel Rating Curve (Crossing: Culvert 05)
Tailwater Channel Data - Culvert 05
Tailwater Channel Option: Enter Rating Curve
Roadway Data for Crossing: Culvert 05
Roadway Profile Shape: Constant Roadway Elevation
Crest Length: 200.00 ft
Crest Elevation: 18.30 ft
Roadway Surface: Paved
Roadway Top Width: 32.00 ft
Flow (cfs) Water Surface Elev (ft) Depth (ft)
190.00 14.40 2.26 227.00 14.60 2.46 264.00 14.80 2.66 301.00 15.00 2.86 338.00 15.20 3.06 375.00 15.40 3.26 386.00 15.50 3.36 449.00 16.00 3.86 486.00 16.20 4.06 523.00 16.40 4.26 560.00 16.50 4.36

HY-8 Culvert Analysis Report

Table 1 - Summary of Culvert Flows at Crossing: Culvert 06
Headwater Elevation (ft) Total Discharge (cfs)
Culvert 06 Discharge (cfs)
Roadway Discharge (cfs) Iterations
16.87 20.00 20.00 0.00 1 17.50 26.70 26.70 0.00 1 18.06 33.40 33.40 0.00 1 18.85 40.10 40.10 0.00 1 19.44 46.80 44.34 2.24 24 19.50 53.50 44.73 8.67 6 19.54 60.20 44.58 15.55 5 19.56 61.00 41.83 18.94 4 19.65 73.60 36.28 37.13 4 19.68 80.30 35.47 44.59 3 19.71 87.00 34.64 52.21 3 19.40 44.07 44.07 0.00 Overtopping

Rating Curve Plot for Crossing: Culvert 06

Table 2 - Culvert Summary Table: Culvert 06
Total Discharge
(cfs) Culvert
Discharge (cfs)
Headwater Elevation
(ft) Inlet Control
Depth (ft) Outlet Control
Depth (ft) Flow Type
Normal Depth (ft)
Critical Depth (ft)
Outlet Depth (ft)
Tailwater Depth (ft)
Outlet Velocity
(ft/s) Tailwater Velocity
(ft/s) 20.00 20.00 16.87 2.320 0.0* 1-S2n 1.494 1.516 1.495 1.740 6.528 0.000
26.70 26.70 17.50 2.861 2.954 2-M2c 1.847 1.760 1.761 1.740 7.224 0.000
33.40 33.40 18.06 3.506 3.447 2-M2c 2.500 1.962 1.966 1.740 8.073 0.000
40.10 40.10 18.85 4.300 4.046 2-M2c 2.500 2.115 2.130 2.040 9.031 0.000
46.80 44.34 19.44 4.889 4.550 7-M2t 2.500 2.204 2.340 2.340 9.344 0.000
53.50 44.73 19.50 4.945 4.807 4-FFf 2.500 2.212 2.500 2.640 9.112 0.000
60.20 44.58 19.54 4.923 4.991 4-FFf 2.500 2.209 2.500 2.840 9.081 0.000
61.00 41.83 19.56 4.532 5.011 4-FFf 2.500 2.151 2.500 3.140 8.521 0.000
73.60 36.28 19.65 3.827 5.100 4-FFf 2.500 2.034 2.500 3.740 7.390 0.000
80.30 35.47 19.68 3.734 5.132 4-FFf 2.500 2.017 2.500 3.840 7.226 0.000
87.00 34.64 19.71 3.640 5.263 4-FFf 2.500 1.999 2.500 4.040 7.056 0.000

* theoretical depth is impractical. Depth reported is corrected.
********************************************************************************
Inlet Elevation (invert): 14.55 ft, Outlet Elevation (invert): 14.36 ft
Culvert Length: 42.00 ft, Culvert Slope: 0.0045
********************************************************************************

Culvert Performance Curve Plot: Culvert 06

Water Surface Profile Plot for Culvert: Culvert 06
Site Data - Culvert 06
Site Data Option: Culvert Invert Data
Inlet Station: 0.00 ft
Inlet Elevation: 14.55 ft
Outlet Station: 42.00 ft
Outlet Elevation: 14.36 ft
Number of Barrels: 1
Culvert Data Summary - Culvert 06
Barrel Shape: Circular
Barrel Diameter: 2.50 ft
Barrel Material: Concrete
Embedment: 0.00 in
Barrel Manning's n: 0.0120
Inlet Type: Conventional
Inlet Edge Condition: Square Edge with Headwall
Inlet Depression: NONE

Table 3 - Downstream Channel Rating Curve (Crossing: Culvert 06)
Tailwater Channel Data - Culvert 06
Tailwater Channel Option: Enter Rating Curve
Roadway Data for Crossing: Culvert 06
Roadway Profile Shape: Constant Roadway Elevation
Crest Length: 100.00 ft
Crest Elevation: 19.40 ft
Roadway Surface: Paved
Roadway Top Width: 32.00 ft
Flow (cfs) Water Surface Elev (ft) Depth (ft)
20.00 16.10 1.74 26.70 16.10 1.74 33.40 16.10 1.74 40.10 16.40 2.04 46.80 16.70 2.34 53.50 17.00 2.64 60.20 17.20 2.84 61.00 17.50 3.14 73.60 18.10 3.74 80.30 18.20 3.84 87.00 18.40 4.04

HY-8 Culvert Analysis Report

Table 1 - Summary of Culvert Flows at Crossing: Culvert 07
Headwater Elevation (ft) Total Discharge (cfs)
Culvert 07 Discharge (cfs)
Roadway Discharge (cfs) Iterations
19.77 250.00 250.00 0.00 1 21.03 307.20 307.20 0.00 1 21.24 364.40 315.91 47.85 8 21.34 421.60 320.03 101.20 6 21.42 469.00 322.85 145.80 5 21.50 536.00 326.35 208.83 4 21.58 593.20 329.09 263.68 4 21.64 650.40 331.63 318.53 4 21.70 707.60 333.98 372.63 3 21.76 764.80 336.25 427.78 3 21.82 822.00 335.60 485.72 3 21.08 309.33 309.33 0.00 Overtopping

Rating Curve Plot for Crossing: Culvert 07

Table 2 - Culvert Summary Table: Culvert 07
********************************************************************************
Inlet Elevation (invert): 14.20 ft, Outlet Elevation (invert): 14.17 ft
Culvert Length: 54.00 ft, Culvert Slope: 0.0006
********************************************************************************
Total Discharge
(cfs) Culvert
Discharge (cfs)
Headwater Elevation
(ft) Inlet Control
Depth (ft) Outlet Control
Depth (ft) Flow Type
Normal Depth (ft)
Critical Depth (ft)
Outlet Depth (ft)
Tailwater Depth (ft)
Outlet Velocity
(ft/s) Tailwater Velocity
(ft/s) 250.00 250.00 19.77 5.565 5.357 3-M2t 4.000 3.125 3.330 3.330 9.384 0.000
307.20 307.20 21.03 6.828 6.227 7-M2c 4.000 3.585 3.577 3.350 10.737 0.000
364.40 315.91 21.24 7.041 6.394 7-M2c 4.000 3.653 3.644 3.380 10.837 0.000
421.60 320.03 21.34 7.144 6.472 7-M2c 4.000 3.684 3.675 3.410 10.884 0.000
469.00 322.85 21.42 7.216 6.526 7-M2c 4.000 3.706 3.697 3.430 10.916 0.000
536.00 326.35 21.50 7.305 6.592 7-M2c 4.000 3.733 3.723 3.530 10.956 0.000
593.20 329.09 21.58 7.376 6.644 7-M2c 4.000 3.754 3.744 3.730 10.986 0.000
650.40 331.63 21.64 7.442 6.711 7-M2t 4.000 3.773 3.930 3.930 10.548 0.000
707.60 333.98 21.70 7.503 6.997 4-FFf 4.000 3.791 4.000 4.230 10.437 0.000
764.80 336.25 21.76 7.563 7.335 4-FFf 4.000 3.808 4.000 4.530 10.508 0.000
822.00 335.60 21.82 7.546 7.524 4-FFf 4.000 3.803 4.000 4.730 10.487 0.000

Culvert Performance Curve Plot: Culvert 07

Water Surface Profile Plot for Culvert: Culvert 07
Site Data - Culvert 07
Site Data Option: Culvert Invert Data
Inlet Station: 0.00 ft
Inlet Elevation: 14.20 ft
Outlet Station: 54.00 ft
Outlet Elevation: 14.17 ft
Number of Barrels: 1
Culvert Data Summary - Culvert 07
Barrel Shape: Concrete Box
Barrel Span: 8.00 ft
Barrel Rise: 4.00 ft
Barrel Material: Concrete
Embedment: 0.00 in
Barrel Manning's n: 0.0120
Inlet Type: Conventional
Inlet Edge Condition: Square Edge (90º) Headwall
Inlet Depression: NONE

Table 3 - Downstream Channel Rating Curve (Crossing: Culvert 07)
Tailwater Channel Data - Culvert 07
Tailwater Channel Option: Enter Rating Curve
Roadway Data for Crossing: Culvert 07
Roadway Profile Shape: Constant Roadway Elevation
Crest Length: 250.00 ft
Crest Elevation: 21.08 ft
Roadway Surface: Paved
Roadway Top Width: 32.00 ft
Flow (cfs) Water Surface Elev (ft) Depth (ft)
250.00 17.50 3.33 307.20 17.52 3.35 364.40 17.55 3.38 421.60 17.58 3.41 469.00 17.60 3.43 536.00 17.70 3.53 593.20 17.90 3.73 650.40 18.10 3.93 707.60 18.40 4.23 764.80 18.70 4.53 822.00 18.90 4.73

HY-8 Culvert Analysis Report

Table 1 - Summary of Culvert Flows at Crossing: Culvert 08
Headwater Elevation (ft) Total Discharge (cfs)
Culvert 08 Discharge (cfs)
Roadway Discharge (cfs) Iterations
20.06 20.00 20.00 0.00 1 21.81 32.10 29.18 2.79 21 21.89 44.20 29.55 14.47 6 21.96 56.30 29.82 26.37 5 22.01 68.40 30.04 38.19 4 22.06 80.50 30.25 50.17 4 22.11 92.60 30.43 61.91 3 22.13 99.00 30.52 68.35 3 22.19 116.80 30.77 85.91 3 22.23 128.90 30.92 97.93 3 22.27 141.00 31.07 109.91 3 21.76 28.99 28.99 0.00 Overtopping

Rating Curve Plot for Crossing: Culvert 08

Table 2 - Culvert Summary Table: Culvert 08
********************************************************************************
Inlet Elevation (invert): 17.05 ft, Outlet Elevation (invert): 17.02 ft
Culvert Length: 42.00 ft, Culvert Slope: 0.0007
********************************************************************************
Total Discharge
(cfs) Culvert
Discharge (cfs)
Headwater Elevation
(ft) Inlet Control
Depth (ft) Outlet Control
Depth (ft) Flow Type
Normal Depth (ft)
Critical Depth (ft)
Outlet Depth (ft)
Tailwater Depth (ft)
Outlet Velocity
(ft/s) Tailwater Velocity
(ft/s) 20.00 20.00 20.06 2.943 3.006 7-M2c 2.000 1.605 1.606 3.330 7.395 0.000
32.10 29.18 21.81 4.755 4.536 7-M2c 2.000 1.875 1.845 3.340 9.594 0.000
44.20 29.55 21.89 4.844 4.608 7-M2c 2.000 1.886 1.850 3.350 9.787 0.000
56.30 29.82 21.96 4.909 4.660 7-M2c 2.000 1.894 1.879 3.360 9.800 0.000
68.40 30.04 22.01 4.964 4.704 7-M2c 2.000 1.901 1.915 3.370 9.779 0.000
80.50 30.25 22.06 5.014 4.744 7-M2c 2.000 1.907 1.931 3.380 9.803 0.000
92.60 30.43 22.11 5.059 4.780 7-M2c 2.000 1.912 1.941 3.410 9.837 0.000
99.00 30.52 22.13 5.083 4.798 7-M2c 2.000 1.915 1.945 3.430 9.857 0.000
116.80 30.77 22.19 5.143 4.846 7-M2c 2.000 1.922 1.953 3.730 9.914 0.000
128.90 30.92 22.23 5.182 4.877 7-M2c 2.000 1.927 1.957 4.230 9.953 0.000
141.00 31.07 22.27 5.219 4.906 7-M2c 2.000 1.931 1.961 4.730 9.992 0.000

Culvert Performance Curve Plot: Culvert 08

Water Surface Profile Plot for Culvert: Culvert 08
Site Data - Culvert 08
Site Data Option: Culvert Invert Data
Inlet Station: 0.00 ft
Inlet Elevation: 17.05 ft
Outlet Station: 42.00 ft
Outlet Elevation: 17.02 ft
Number of Barrels: 1
Culvert Data Summary - Culvert 08
Barrel Shape: Circular
Barrel Diameter: 2.00 ft
Barrel Material: Concrete
Embedment: 0.00 in
Barrel Manning's n: 0.0120
Inlet Type: Conventional
Inlet Edge Condition: Square Edge with Headwall
Inlet Depression: NONE

Table 3 - Downstream Channel Rating Curve (Crossing: Culvert 08)
Tailwater Channel Data - Culvert 08
Tailwater Channel Option: Enter Rating Curve
Roadway Data for Crossing: Culvert 08
Roadway Profile Shape: Constant Roadway Elevation
Crest Length: 100.00 ft
Crest Elevation: 21.76 ft
Roadway Surface: Paved
Roadway Top Width: 32.00 ft
Flow (cfs) Water Surface Elev (ft) Depth (ft)
20.00 17.50 3.33 32.10 17.51 3.34 44.20 17.52 3.35 56.30 17.53 3.36 68.40 17.54 3.37 80.50 17.55 3.38 92.60 17.58 3.41 99.00 17.60 3.43 116.80 17.90 3.73 128.90 18.40 4.23 141.00 18.90 4.73

HY-8 Culvert Analysis Report

Table 1 - Summary of Culvert Flows at Crossing: Culvert 09
Headwater Elevation (ft) Total Discharge (cfs)
Culvert 09 Discharge (cfs)
Roadway Discharge (cfs) Iterations
17.26 215.00 215.00 0.00 1 17.72 260.20 260.20 0.00 1 18.21 305.40 305.40 0.00 1 18.74 350.60 350.60 0.00 1 19.06 376.00 376.00 0.00 1 19.95 441.00 441.00 0.00 1 20.64 486.20 486.20 0.00 1 21.15 531.40 517.83 13.19 12 21.27 576.60 524.71 51.19 6 21.36 621.80 529.97 91.21 5 21.43 667.00 534.61 132.16 5 21.07 513.01 513.01 0.00 Overtopping

Rating Curve Plot for Crossing: Culvert 09

Table 2 - Culvert Summary Table: Culvert 09
********************************************************************************
Inlet Elevation (invert): 12.94 ft, Outlet Elevation (invert): 12.76 ft
Culvert Length: 67.00 ft, Culvert Slope: 0.0027
********************************************************************************
Total Discharge
(cfs) Culvert
Discharge (cfs)
Headwater Elevation
(ft) Inlet Control
Depth (ft) Outlet Control
Depth (ft) Flow Type
Normal Depth (ft)
Critical Depth (ft)
Outlet Depth (ft)
Tailwater Depth (ft)
Outlet Velocity
(ft/s) Tailwater Velocity
(ft/s) 215.00 215.00 17.26 4.106 4.316 1-S1t 2.412 2.436 3.540 3.540 6.073 0.000
260.20 260.20 17.72 4.666 4.780 1-S1t 2.754 2.766 3.640 3.640 7.148 0.000
305.40 305.40 18.21 5.220 5.275 7-M1t 3.085 3.078 3.740 3.740 8.166 0.000
350.60 350.60 18.74 5.786 5.800 7-M1t 3.403 3.374 3.790 3.790 9.251 0.000
376.00 376.00 19.06 6.116 6.102 7-M1t 3.579 3.535 3.840 3.840 9.792 0.000
441.00 441.00 19.95 7.013 6.820 7-M1t 4.019 3.932 4.040 4.040 10.916 0.000
486.20 486.20 20.64 7.697 7.275 3-M2t 4.316 4.196 4.240 4.240 11.467 0.000
531.40 517.83 21.15 8.210 7.582 3-M2t 5.000 4.376 4.440 4.440 11.663 0.000
576.60 524.71 21.27 8.325 7.619 3-M2t 5.000 4.415 4.640 4.640 11.308 0.000
621.80 529.97 21.36 8.415 7.652 3-M2t 5.000 4.444 4.740 4.740 11.181 0.000
667.00 534.61 21.43 8.494 7.682 3-M2t 5.000 4.470 4.840 4.840 11.046 0.000

Culvert Performance Curve Plot: Culvert 09

Water Surface Profile Plot for Culvert: Culvert 09
Site Data - Culvert 09
Site Data Option: Culvert Invert Data
Inlet Station: 0.00 ft
Inlet Elevation: 12.94 ft
Outlet Station: 67.00 ft
Outlet Elevation: 12.76 ft
Number of Barrels: 1
Culvert Data Summary - Culvert 09
Barrel Shape: Concrete Box
Barrel Span: 10.00 ft
Barrel Rise: 5.00 ft
Barrel Material: Concrete
Embedment: 0.00 in
Barrel Manning's n: 0.0120
Inlet Type: Conventional
Inlet Edge Condition: Square Edge (90º) Headwall
Inlet Depression: NONE

Table 3 - Downstream Channel Rating Curve (Crossing: Culvert 09)
Tailwater Channel Data - Culvert 09
Tailwater Channel Option: Enter Rating Curve
Roadway Data for Crossing: Culvert 09
Roadway Profile Shape: Constant Roadway Elevation
Crest Length: 200.00 ft
Crest Elevation: 21.07 ft
Roadway Surface: Paved
Roadway Top Width: 32.00 ft
Flow (cfs) Water Surface Elev (ft) Depth (ft)
215.00 16.30 3.54 260.20 16.40 3.64 305.40 16.50 3.74 350.60 16.55 3.79 376.00 16.60 3.84 441.00 16.80 4.04 486.20 17.00 4.24 531.40 17.20 4.44 576.60 17.40 4.64 621.80 17.50 4.74 667.00 17.60 4.84

HY-8 Culvert Analysis Report

Table 1 - Summary of Culvert Flows at Crossing: Culvert 10
Headwater Elevation (ft) Total Discharge (cfs)
Culvert 10 Discharge (cfs)
Roadway Discharge (cfs) Iterations
20.25 10.00 10.00 0.00 1 20.53 12.60 12.60 0.00 1 20.80 15.20 15.20 0.00 1 21.09 17.80 17.80 0.00 1 21.45 20.40 20.40 0.00 1 21.90 23.00 23.00 0.00 1 22.41 25.60 25.60 0.00 1 22.49 26.00 26.00 0.00 1 22.94 30.80 28.06 2.58 15 22.97 33.40 28.17 5.09 4 22.99 36.00 28.26 7.67 4 22.90 27.87 27.87 0.00 Overtopping

Rating Curve Plot for Crossing: Culvert 10

Table 2 - Culvert Summary Table: Culvert 10
********************************************************************************
Inlet Elevation (invert): 18.45 ft, Outlet Elevation (invert): 18.34 ft
Culvert Length: 42.00 ft, Culvert Slope: 0.0026
********************************************************************************
Total Discharge
(cfs) Culvert
Discharge (cfs)
Headwater Elevation
(ft) Inlet Control
Depth (ft) Outlet Control
Depth (ft) Flow Type
Normal Depth (ft)
Critical Depth (ft)
Outlet Depth (ft)
Tailwater Depth (ft)
Outlet Velocity
(ft/s) Tailwater Velocity
(ft/s) 10.00 10.00 20.25 1.704 1.798 3-M2t 1.350 1.128 1.160 1.160 5.293 0.000
12.60 12.60 20.53 1.983 2.077 2-M2c 1.657 1.272 1.276 1.260 5.955 0.000
15.20 15.20 20.80 2.280 2.346 2-M2c 2.000 1.405 1.405 1.360 6.445 0.000
17.80 17.80 21.09 2.617 2.639 2-M2c 2.000 1.514 1.520 1.460 6.948 0.000
20.40 20.40 21.45 3.004 2.987 7-M2t 2.000 1.617 1.660 1.660 7.340 0.000
23.00 23.00 21.90 3.450 3.425 7-M2t 2.000 1.693 1.860 1.860 7.598 0.000
25.60 25.60 22.41 3.957 3.892 4-FFf 2.000 1.770 2.000 2.000 8.149 0.000
26.00 26.00 22.49 4.041 3.955 4-FFf 2.000 1.782 2.000 2.000 8.276 0.000
30.80 28.06 22.94 4.493 4.296 4-FFf 2.000 1.842 2.000 2.000 8.932 0.000
33.40 28.17 22.97 4.517 4.314 4-FFf 2.000 1.846 2.000 2.000 8.966 0.000
36.00 28.26 22.99 4.538 4.330 4-FFf 2.000 1.848 2.000 2.000 8.995 0.000

Culvert Performance Curve Plot: Culvert 10

Water Surface Profile Plot for Culvert: Culvert 10
Site Data - Culvert 10
Site Data Option: Culvert Invert Data
Inlet Station: 0.00 ft
Inlet Elevation: 18.45 ft
Outlet Station: 42.00 ft
Outlet Elevation: 18.34 ft
Number of Barrels: 1
Culvert Data Summary - Culvert 10
Barrel Shape: Circular
Barrel Diameter: 2.00 ft
Barrel Material: Concrete
Embedment: 0.00 in
Barrel Manning's n: 0.0120
Inlet Type: Conventional
Inlet Edge Condition: Square Edge with Headwall
Inlet Depression: NONE

Table 3 - Downstream Channel Rating Curve (Crossing: Culvert 10)
Tailwater Channel Data - Culvert 10
Tailwater Channel Option: Enter Rating Curve
Roadway Data for Crossing: Culvert 10
Roadway Profile Shape: Constant Roadway Elevation
Crest Length: 100.00 ft
Crest Elevation: 22.90 ft
Roadway Surface: Paved
Roadway Top Width: 32.00 ft
Flow (cfs) Water Surface Elev (ft) Depth (ft)
10.00 19.50 1.16 12.60 19.60 1.26 15.20 19.70 1.36 17.80 19.80 1.46 20.40 20.00 1.66 23.00 20.20 1.86 25.60 20.34 2.00 26.00 20.34 2.00 30.80 20.34 2.00 33.40 20.34 2.00 36.00 20.34 2.00

HY-8 Culvert Analysis Report

Table 1 - Summary of Culvert Flows at Crossing: Culvert 11
Headwater Elevation (ft) Total Discharge (cfs)
Culvert 11 Discharge (cfs)
Roadway Discharge (cfs) Iterations
22.08 5.00 5.00 0.00 1 22.11 6.00 6.00 0.00 1 22.15 7.00 7.00 0.00 1 22.20 8.00 8.00 0.00 1 22.25 9.00 9.00 0.00 1 22.31 10.00 10.00 0.00 1 22.38 11.00 11.00 0.00 1 22.45 12.00 12.00 0.00 1 22.53 13.00 13.00 0.00 1 22.61 14.00 14.00 0.00 1 22.70 15.00 15.00 0.00 1 24.07 25.75 25.75 0.00 Overtopping

Rating Curve Plot for Crossing: Culvert 11

Table 2 - Culvert Summary Table: Culvert 11
********************************************************************************
Inlet Elevation (invert): 19.94 ft, Outlet Elevation (invert): 18.77 ft
Culvert Length: 46.01 ft, Culvert Slope: 0.0254
********************************************************************************
Total Discharge
(cfs) Culvert
Discharge (cfs)
Headwater Elevation
(ft) Inlet Control
Depth (ft) Outlet Control
Depth (ft) Flow Type
Normal Depth (ft)
Critical Depth (ft)
Outlet Depth (ft)
Tailwater Depth (ft)
Outlet Velocity
(ft/s) Tailwater Velocity
(ft/s) 5.00 5.00 22.08 1.087 2.138 4-FFf 0.474 0.786 2.000 3.230 1.592 0.000
6.00 6.00 22.11 1.222 2.172 4-FFf 0.521 0.862 2.000 3.230 1.910 0.000
7.00 7.00 22.15 1.346 2.213 4-FFf 0.568 0.935 2.000 3.230 2.228 0.000
8.00 8.00 22.20 1.462 2.259 4-FFf 0.612 1.006 2.000 3.230 2.546 0.000
9.00 9.00 22.25 1.573 2.312 4-FFf 0.648 1.067 2.000 3.230 2.865 0.000
10.00 10.00 22.31 1.681 2.372 4-FFf 0.684 1.128 2.000 3.230 3.183 0.000
11.00 11.00 22.38 1.788 2.437 4-FFf 0.720 1.188 2.000 3.230 3.501 0.000
12.00 12.00 22.45 1.895 2.509 4-FFf 0.757 1.241 2.000 3.230 3.820 0.000
13.00 13.00 22.53 2.004 2.587 4-FFf 0.793 1.293 2.000 3.230 4.138 0.000
14.00 14.00 22.61 2.116 2.671 4-FFf 0.825 1.344 2.000 3.230 4.456 0.000
15.00 15.00 22.70 2.233 2.762 4-FFf 0.856 1.395 2.000 3.230 4.775 0.000

Culvert Performance Curve Plot: Culvert 11

Water Surface Profile Plot for Culvert: Culvert 11
Site Data - Culvert 11
Site Data Option: Culvert Invert Data
Inlet Station: 0.00 ft
Inlet Elevation: 19.94 ft
Outlet Station: 46.00 ft
Outlet Elevation: 18.77 ft
Number of Barrels: 1
Culvert Data Summary - Culvert 11
Barrel Shape: Circular
Barrel Diameter: 2.00 ft
Barrel Material: Concrete
Embedment: 0.00 in
Barrel Manning's n: 0.0120
Inlet Type: Conventional
Inlet Edge Condition: Square Edge with Headwall
Inlet Depression: NONE

Table 3 - Downstream Channel Rating Curve (Crossing: Culvert 11)
Tailwater Channel Data - Culvert 11
Tailwater Channel Option: Enter Constant Tailwater Elevation
Constant Tailwater Elevation: 22.00 ft
Roadway Data for Crossing: Culvert 11
Roadway Profile Shape: Constant Roadway Elevation
Crest Length: 100.00 ft
Crest Elevation: 24.07 ft
Roadway Surface: Paved
Roadway Top Width: 32.00 ft
Flow (cfs) Water Surface Elev (ft) Depth (ft)
5.00 22.00 3.23 6.00 22.00 3.23 7.00 22.00 3.23 8.00 22.00 3.23 9.00 22.00 3.23 10.00 22.00 3.23 11.00 22.00 3.23 12.00 22.00 3.23 13.00 22.00 3.23 14.00 22.00 3.23 15.00 22.00 3.23

HY-8 Culvert Analysis Report

Table 1 - Summary of Culvert Flows at Crossing: Culvert 12
Headwater Elevation (ft) Total Discharge (cfs)
Culvert 12 Discharge (cfs)
Roadway Discharge (cfs) Iterations
21.41 5.00 5.00 0.00 1 21.44 6.00 6.00 0.00 1 21.48 7.00 7.00 0.00 1 21.53 8.00 8.00 0.00 1 21.58 9.00 9.00 0.00 1 21.64 10.00 10.00 0.00 1 21.71 11.00 11.00 0.00 1 21.78 12.00 12.00 0.00 1 21.86 13.00 13.00 0.00 1 21.94 14.00 14.00 0.00 1 22.03 15.00 15.00 0.00 1 23.97 28.56 28.56 0.00 Overtopping

Rating Curve Plot for Crossing: Culvert 12

Table 2 - Culvert Summary Table: Culvert 12
********************************************************************************
Inlet Elevation (invert): 19.36 ft, Outlet Elevation (invert): 19.33 ft
Culvert Length: 46.00 ft, Culvert Slope: 0.0007
********************************************************************************
Total Discharge
(cfs) Culvert
Discharge (cfs)
Headwater Elevation
(ft) Inlet Control
Depth (ft) Outlet Control
Depth (ft) Flow Type
Normal Depth (ft)
Critical Depth (ft)
Outlet Depth (ft)
Tailwater Depth (ft)
Outlet Velocity
(ft/s) Tailwater Velocity
(ft/s) 5.00 5.00 21.41 1.112 2.048 4-FFf 1.352 0.786 2.000 2.000 1.592 0.000
6.00 6.00 21.44 1.246 2.082 4-FFf 1.570 0.862 2.000 2.000 1.910 0.000
7.00 7.00 21.48 1.370 2.123 4-FFf 2.000 0.935 2.000 2.000 2.228 0.000
8.00 8.00 21.53 1.487 2.170 4-FFf 2.000 1.006 2.000 2.000 2.546 0.000
9.00 9.00 21.58 1.598 2.223 4-FFf 2.000 1.067 2.000 2.000 2.865 0.000
10.00 10.00 21.64 1.706 2.282 4-FFf 2.000 1.128 2.000 2.000 3.183 0.000
11.00 11.00 21.71 1.812 2.348 4-FFf 2.000 1.188 2.000 2.000 3.501 0.000
12.00 12.00 21.78 1.919 2.420 4-FFf 2.000 1.241 2.000 2.000 3.820 0.000
13.00 13.00 21.86 2.029 2.498 4-FFf 2.000 1.293 2.000 2.000 4.138 0.000
14.00 14.00 21.94 2.141 2.582 4-FFf 2.000 1.344 2.000 2.000 4.456 0.000
15.00 15.00 22.03 2.258 2.672 4-FFf 2.000 1.395 2.000 2.000 4.775 0.000

Culvert Performance Curve Plot: Culvert 12

Water Surface Profile Plot for Culvert: Culvert 12
Site Data - Culvert 12
Site Data Option: Culvert Invert Data
Inlet Station: 0.00 ft
Inlet Elevation: 19.36 ft
Outlet Station: 46.00 ft
Outlet Elevation: 19.33 ft
Number of Barrels: 1
Culvert Data Summary - Culvert 12
Barrel Shape: Circular
Barrel Diameter: 2.00 ft
Barrel Material: Concrete
Embedment: 0.00 in
Barrel Manning's n: 0.0120
Inlet Type: Conventional
Inlet Edge Condition: Square Edge with Headwall
Inlet Depression: NONE

Table 3 - Downstream Channel Rating Curve (Crossing: Culvert 12)
Tailwater Channel Data - Culvert 12
Tailwater Channel Option: Enter Constant Tailwater Elevation
Constant Tailwater Elevation: 21.33 ft
Roadway Data for Crossing: Culvert 12
Roadway Profile Shape: Constant Roadway Elevation
Crest Length: 100.00 ft
Crest Elevation: 23.97 ft
Roadway Surface: Paved
Roadway Top Width: 32.00 ft
Flow (cfs) Water Surface Elev (ft) Depth (ft)
5.00 21.33 2.00 6.00 21.33 2.00 7.00 21.33 2.00 8.00 21.33 2.00 9.00 21.33 2.00 10.00 21.33 2.00 11.00 21.33 2.00 12.00 21.33 2.00 13.00 21.33 2.00 14.00 21.33 2.00 15.00 21.33 2.00

HY-8 Culvert Analysis Report

Table 1 - Summary of Culvert Flows at Crossing: Culvert 13
Headwater Elevation (ft) Total Discharge (cfs)
Culvert 13 Discharge (cfs)
Roadway Discharge (cfs) Iterations
23.85 40.00 36.87 3.00 19 23.91 48.00 37.07 10.78 6 23.96 56.00 37.22 18.67 5 24.00 64.00 37.35 26.47 4 24.04 72.00 37.47 34.43 4 24.07 80.00 37.57 42.37 4 24.08 83.00 37.61 45.30 3 24.13 96.00 37.76 58.01 3 24.16 104.00 37.85 66.04 3 24.19 112.00 37.94 74.00 3 24.22 120.00 38.02 81.95 3 23.80 36.72 36.72 0.00 Overtopping

Rating Curve Plot for Crossing: Culvert 13

Table 2 - Culvert Summary Table: Culvert 13
********************************************************************************
Inlet Elevation (invert): 16.98 ft, Outlet Elevation (invert): 16.88 ft
Culvert Length: 36.00 ft, Culvert Slope: 0.0028
********************************************************************************
Total Discharge
(cfs) Culvert
Discharge (cfs)
Headwater Elevation
(ft) Inlet Control
Depth (ft) Outlet Control
Depth (ft) Flow Type
Normal Depth (ft)
Critical Depth (ft)
Outlet Depth (ft)
Tailwater Depth (ft)
Outlet Velocity
(ft/s) Tailwater Velocity
(ft/s) 40.00 36.87 23.85 6.867 6.039 4-FFf 2.000 2.000 2.000 2.020 11.737 0.000
48.00 37.07 23.91 6.931 6.082 4-FFf 2.000 2.000 2.000 2.020 11.800 0.000
56.00 37.22 23.96 6.979 6.115 4-FFf 2.000 2.000 2.000 2.020 11.848 0.000
64.00 37.35 24.00 7.020 6.143 4-FFf 2.000 2.000 2.000 2.020 11.888 0.000
72.00 37.47 24.04 7.058 6.169 4-FFf 2.000 2.000 2.000 2.020 11.925 0.000
80.00 37.57 24.07 7.092 6.193 4-FFf 2.000 2.000 2.000 2.020 11.960 0.000
83.00 37.61 24.08 7.104 6.201 4-FFf 2.000 2.000 2.000 2.020 11.971 0.000
96.00 37.76 24.13 7.154 6.235 4-FFf 2.000 2.000 2.000 2.020 12.020 0.000
104.00 37.85 24.16 7.184 6.255 4-FFf 2.000 2.000 2.000 2.020 12.049 0.000
112.00 37.94 24.19 7.212 6.275 4-FFf 2.000 2.000 2.000 2.020 12.076 0.000
120.00 38.02 24.22 7.239 6.293 4-FFf 2.000 2.000 2.000 2.020 12.103 0.000

Culvert Performance Curve Plot: Culvert 13

Water Surface Profile Plot for Culvert: Culvert 13
Site Data - Culvert 13
Site Data Option: Culvert Invert Data
Inlet Station: 0.00 ft
Inlet Elevation: 16.98 ft
Outlet Station: 36.00 ft
Outlet Elevation: 16.88 ft
Number of Barrels: 1
Culvert Data Summary - Culvert 13
Barrel Shape: Circular
Barrel Diameter: 2.00 ft
Barrel Material: Concrete
Embedment: 0.00 in
Barrel Manning's n: 0.0120
Inlet Type: Conventional
Inlet Edge Condition: Square Edge with Headwall
Inlet Depression: NONE

Table 3 - Downstream Channel Rating Curve (Crossing: Culvert 13)
Tailwater Channel Data - Culvert 13
Tailwater Channel Option: Enter Constant Tailwater Elevation
Constant Tailwater Elevation: 19.00 ft
Roadway Data for Crossing: Culvert 13
Roadway Profile Shape: Constant Roadway Elevation
Crest Length: 100.00 ft
Crest Elevation: 23.80 ft
Roadway Surface: Paved
Roadway Top Width: 32.00 ft
Flow (cfs) Water Surface Elev (ft) Depth (ft)
40.00 19.00 2.02 48.00 19.00 2.02 56.00 19.00 2.02 64.00 19.00 2.02 72.00 19.00 2.02 80.00 19.00 2.02 83.00 19.00 2.02 96.00 19.00 2.02 104.00 19.00 2.02 112.00 19.00 2.02 120.00 19.00 2.02

HY-8 Culvert Analysis Report

Table 1 - Summary of Culvert Flows at Crossing: Culvert 14
Headwater Elevation (ft) Total Discharge (cfs)
Culvert 14 Discharge (cfs)
Roadway Discharge (cfs) Iterations
22.69 3.00 3.00 0.00 1 22.79 4.30 4.30 0.00 1 22.92 5.60 5.60 0.00 1 23.09 6.90 6.90 0.00 1 23.29 8.20 8.20 0.00 1 23.52 9.50 9.50 0.00 1 23.62 10.00 10.00 0.00 1 24.10 12.10 12.10 0.00 1 24.44 13.40 13.40 0.00 1 24.81 14.70 14.70 0.00 1 25.02 16.00 15.37 0.54 20 25.00 15.32 15.32 0.00 Overtopping

Rating Curve Plot for Crossing: Culvert 14

Table 2 - Culvert Summary Table: Culvert 14
********************************************************************************
Inlet Elevation (invert): 20.67 ft, Outlet Elevation (invert): 20.61 ft
Culvert Length: 36.00 ft, Culvert Slope: 0.0017
********************************************************************************
Total Discharge
(cfs) Culvert
Discharge (cfs)
Headwater Elevation
(ft) Inlet Control
Depth (ft) Outlet Control
Depth (ft) Flow Type
Normal Depth (ft)
Critical Depth (ft)
Outlet Depth (ft)
Tailwater Depth (ft)
Outlet Velocity
(ft/s) Tailwater Velocity
(ft/s) 3.00 3.00 22.69 0.949 2.022 4-FFf 0.876 0.655 1.500 2.000 1.698 0.000
4.30 4.30 22.79 1.183 2.119 4-FFf 1.143 0.792 1.500 2.000 2.433 0.000
5.60 5.60 22.92 1.398 2.251 4-FFf 1.500 0.912 1.500 2.000 3.169 0.000
6.90 6.90 23.09 1.619 2.417 4-FFf 1.500 1.014 1.500 2.000 3.905 0.000
8.20 8.20 23.29 1.865 2.617 4-FFf 1.500 1.105 1.500 2.000 4.640 0.000
9.50 9.50 23.52 2.149 2.853 4-FFf 1.500 1.189 1.500 2.000 5.376 0.000
10.00 10.00 23.62 2.269 2.952 4-FFf 1.500 1.215 1.500 2.000 5.659 0.000
12.10 12.10 24.10 2.853 3.427 4-FFf 1.500 1.311 1.500 2.000 6.847 0.000
13.40 13.40 24.44 3.277 3.766 4-FFf 1.500 1.370 1.500 2.000 7.583 0.000
14.70 14.70 24.81 3.747 4.139 4-FFf 1.500 1.429 1.500 2.000 8.318 0.000
16.00 15.37 25.02 4.006 4.345 4-FFf 1.500 1.459 1.500 2.000 8.698 0.000

Culvert Performance Curve Plot: Culvert 14

Water Surface Profile Plot for Culvert: Culvert 14
Site Data - Culvert 14
Site Data Option: Culvert Invert Data
Inlet Station: 0.00 ft
Inlet Elevation: 20.67 ft
Outlet Station: 36.00 ft
Outlet Elevation: 20.61 ft
Number of Barrels: 1
Culvert Data Summary - Culvert 14
Barrel Shape: Circular
Barrel Diameter: 1.50 ft
Barrel Material: Concrete
Embedment: 0.00 in
Barrel Manning's n: 0.0120
Inlet Type: Conventional
Inlet Edge Condition: Square Edge with Headwall
Inlet Depression: NONE

Table 3 - Downstream Channel Rating Curve (Crossing: Culvert 14)
Tailwater Channel Data - Culvert 14
Tailwater Channel Option: Enter Constant Tailwater Elevation
Constant Tailwater Elevation: 22.60 ft
Roadway Data for Crossing: Culvert 14
Roadway Profile Shape: Constant Roadway Elevation
Crest Length: 100.00 ft
Crest Elevation: 25.00 ft
Roadway Surface: Paved
Roadway Top Width: 32.00 ft
Flow (cfs) Water Surface Elev (ft) Depth (ft)
3.00 22.60 2.00 4.30 22.60 2.00 5.60 22.60 2.00 6.90 22.60 2.00 8.20 22.60 2.00 9.50 22.60 2.00 10.00 22.60 2.00 12.10 22.60 2.00 13.40 22.60 2.00 14.70 22.60 2.00 16.00 22.60 2.00

PRELIMINARY SIZING OF
PROPOSED CROSSDRAINS
PROPOSED CULVERTS
.PROPOSED CULVERTS HAVE BEEN PRELIMINARILY SIZED BYMATCHING OR REDUCING THE ESTIMATED 50-YR HEADWATER ATEACH CROSSING. THE TABLE BELOW SUMMARIZES THE RESULTS.

HY-8 Culvert Analysis Report

Table 1 - Summary of Culvert Flows at Crossing: P_Culvert 1 - 30" RCP
Headwater Elevation (ft) Total Discharge (cfs)
Culvert 01 Discharge (cfs)
Roadway Discharge (cfs) Iterations
22.98 18.00 18.00 0.00 1 23.03 18.80 18.80 0.00 1 23.08 19.60 19.60 0.00 1 23.13 20.40 20.40 0.00 1 23.18 21.20 21.20 0.00 1 23.24 22.00 22.00 0.00 1 23.29 22.80 22.80 0.00 1 23.31 23.00 23.00 0.00 1 23.41 24.40 24.40 0.00 1 23.46 25.20 25.20 0.00 1 23.52 26.00 26.00 0.00 1 25.25 41.13 41.13 0.00 Overtopping

Rating Curve Plot for Crossing: P_Culvert 1 - 30" RCP

Table 2 - Culvert Summary Table: Culvert 01
********************************************************************************
Inlet Elevation (invert): 20.52 ft, Outlet Elevation (invert): 20.30 ft
Culvert Length: 112.00 ft, Culvert Slope: 0.0020
********************************************************************************
Total Discharge
(cfs) Culvert
Discharge (cfs)
Headwater Elevation
(ft) Inlet Control
Depth (ft) Outlet Control
Depth (ft) Flow Type
Normal Depth (ft)
Critical Depth (ft)
Outlet Depth (ft)
Tailwater Depth (ft)
Outlet Velocity
(ft/s) Tailwater Velocity
(ft/s) 18.00 18.00 22.98 2.171 2.460 3-M1t 1.884 1.433 2.100 2.100 4.089 0.000
18.80 18.80 23.03 2.232 2.509 7-M1t 1.956 1.467 2.100 2.100 4.271 0.000
19.60 19.60 23.08 2.293 2.559 7-M1t 2.045 1.502 2.100 2.100 4.453 0.000
20.40 20.40 23.13 2.354 2.610 3-M2t 2.159 1.531 2.100 2.100 4.634 0.000
21.20 21.20 23.18 2.416 2.663 3-M2t 2.500 1.561 2.100 2.100 4.816 0.000
22.00 22.00 23.24 2.478 2.718 3-M2t 2.500 1.590 2.100 2.100 4.998 0.000
22.80 22.80 23.29 2.541 2.773 3-M2t 2.500 1.619 2.100 2.100 5.180 0.000
23.00 23.00 23.31 2.557 2.787 3-M2t 2.500 1.627 2.100 2.100 5.225 0.000
24.40 24.40 23.41 2.670 2.886 3-M2t 2.500 1.678 2.100 2.100 5.543 0.000
25.20 25.20 23.46 2.736 2.944 3-M2t 2.500 1.707 2.100 2.100 5.725 0.000
26.00 26.00 23.52 2.804 3.000 3-M2t 2.500 1.737 2.100 2.100 5.907 0.000

Culvert Performance Curve Plot: Culvert 01

Water Surface Profile Plot for Culvert: Culvert 01
Site Data - Culvert 01
Site Data Option: Culvert Invert Data
Inlet Station: 0.00 ft
Inlet Elevation: 20.52 ft
Outlet Station: 112.00 ft
Outlet Elevation: 20.30 ft
Number of Barrels: 1
Culvert Data Summary - Culvert 01
Barrel Shape: Circular
Barrel Diameter: 2.50 ft
Barrel Material: Concrete
Embedment: 0.00 in
Barrel Manning's n: 0.0120
Inlet Type: Conventional
Inlet Edge Condition: Square Edge with Headwall
Inlet Depression: NONE

Table 3 - Downstream Channel Rating Curve (Crossing: P_Culvert 1 - 30" RCP)
Tailwater Channel Data - P_Culvert 1 - 30" RCP
Tailwater Channel Option: Enter Constant Tailwater Elevation
Constant Tailwater Elevation: 22.40 ft
Roadway Data for Crossing: P_Culvert 1 - 30" RCP
Roadway Profile Shape: Constant Roadway Elevation
Crest Length: 100.00 ft
Crest Elevation: 25.25 ft
Roadway Surface: Paved
Roadway Top Width: 102.00 ft
Flow (cfs) Water Surface Elev (ft) Depth (ft)
18.00 22.40 2.10 18.80 22.40 2.10 19.60 22.40 2.10 20.40 22.40 2.10 21.20 22.40 2.10 22.00 22.40 2.10 22.80 22.40 2.10 23.00 22.40 2.10 24.40 22.40 2.10 25.20 22.40 2.10 26.00 22.40 2.10

HY-8 Culvert Analysis Report

Table 1 - Summary of Culvert Flows at Crossing: Culvert 02
Headwater Elevation (ft) Total Discharge (cfs)
Culvert 02 Discharge (cfs)
Roadway Discharge (cfs) Iterations
21.83 207.00 207.00 0.00 1 22.32 233.30 233.30 0.00 1 22.84 259.60 259.60 0.00 1 23.41 285.90 285.90 0.00 1 24.03 312.20 312.20 0.00 1 24.12 316.00 316.00 0.00 1 25.43 364.80 364.80 0.00 1 25.68 391.10 373.09 17.51 11 25.75 417.40 375.57 41.48 6 25.81 443.70 377.58 65.76 5 25.86 470.00 379.34 90.04 4 25.58 369.82 369.82 0.00 Overtopping

Rating Curve Plot for Crossing: Culvert 02

Table 2 - Culvert Summary Table: Culvert 02
********************************************************************************
Inlet Elevation (invert): 17.08 ft, Outlet Elevation (invert): 16.98 ft
Culvert Length: 126.00 ft, Culvert Slope: 0.0008
********************************************************************************
Total Discharge
(cfs) Culvert
Discharge (cfs)
Headwater Elevation
(ft) Inlet Control
Depth (ft) Outlet Control
Depth (ft) Flow Type
Normal Depth (ft)
Critical Depth (ft)
Outlet Depth (ft)
Tailwater Depth (ft)
Outlet Velocity
(ft/s) Tailwater Velocity
(ft/s) 207.00 207.00 21.83 4.746 4.741 2-M2c 4.000 2.756 2.748 2.210 9.414 0.000
233.30 233.30 22.32 5.236 5.133 2-M2c 4.000 2.984 2.976 2.420 9.799 0.000
259.60 259.60 22.84 5.761 5.508 2-M2c 4.000 3.205 3.195 2.620 10.157 0.000
285.90 285.90 23.41 6.330 5.988 7-M2c 4.000 3.418 3.409 2.820 10.482 0.000
312.20 312.20 24.03 6.949 6.551 7-M2c 4.000 3.624 3.615 3.020 10.795 0.000
316.00 316.00 24.12 7.043 6.632 7-M2c 4.000 3.653 3.644 3.040 10.838 0.000
364.80 364.80 25.43 8.354 7.731 4-FFf 4.000 4.000 4.000 4.080 11.400 0.000
391.10 373.09 25.68 8.596 7.903 4-FFf 4.000 4.000 4.000 4.080 11.659 0.000
417.40 375.57 25.75 8.670 7.955 4-FFf 4.000 4.000 4.000 4.080 11.736 0.000
443.70 377.58 25.81 8.730 7.998 4-FFf 4.000 4.000 4.000 4.080 11.800 0.000
470.00 379.34 25.86 8.783 8.036 4-FFf 4.000 4.000 4.000 4.080 11.854 0.000

Culvert Performance Curve Plot: Culvert 02

Water Surface Profile Plot for Culvert: Culvert 02
Site Data - Culvert 02
Site Data Option: Culvert Invert Data
Inlet Station: 0.00 ft
Inlet Elevation: 17.08 ft
Outlet Station: 126.00 ft
Outlet Elevation: 16.98 ft
Number of Barrels: 1
Culvert Data Summary - Culvert 02
Barrel Shape: Concrete Box
Barrel Span: 8.00 ft
Barrel Rise: 4.00 ft
Barrel Material: Concrete
Embedment: 0.00 in
Barrel Manning's n: 0.0120
Inlet Type: Conventional
Inlet Edge Condition: Square Edge (90º) Headwall
Inlet Depression: NONE

Table 3 - Downstream Channel Rating Curve (Crossing: Culvert 02)
Tailwater Channel Data - Culvert 02
Tailwater Channel Option: Enter Rating Curve
Roadway Data for Crossing: Culvert 02
Roadway Profile Shape: Constant Roadway Elevation
Crest Length: 200.00 ft
Crest Elevation: 25.58 ft
Roadway Surface: Paved
Roadway Top Width: 102.00 ft
Flow (cfs) Water Surface Elev (ft) Depth (ft)
207.00 19.19 2.21 233.30 19.40 2.42 259.60 19.60 2.62 285.90 19.80 2.82 312.20 20.00 3.02 316.00 20.02 3.04 364.80 21.06 4.08 391.10 21.06 4.08 417.40 21.06 4.08 443.70 21.06 4.08 470.00 21.06 4.08

HY-8 Culvert Analysis Report

Table 1 - Summary of Culvert Flows at Crossing: Culvert 02 Alt. - (2) 6x4
Headwater Elevation (ft) Total Discharge (cfs)
Culvert 02 Discharge (cfs)
Roadway Discharge (cfs) Iterations
19.51 100.00 100.00 0.00 1 20.31 170.40 170.40 0.00 1 21.10 240.80 240.80 0.00 1 21.84 311.20 311.20 0.00 1 22.73 381.60 381.60 0.00 1 23.77 452.00 452.00 0.00 1 23.78 453.00 453.00 0.00 1 25.72 592.80 561.84 30.86 6 25.87 663.20 569.36 93.44 6 25.99 733.60 575.22 158.00 5 26.09 804.00 580.34 222.95 4 25.58 554.73 554.73 0.00 Overtopping

Rating Curve Plot for Crossing: Culvert 02 Alt. - (2) 6x4

Table 2 - Culvert Summary Table: Culvert 02
********************************************************************************
Inlet Elevation (invert): 17.08 ft, Outlet Elevation (invert): 16.98 ft
Culvert Length: 126.00 ft, Culvert Slope: 0.0008
********************************************************************************
Total Discharge
(cfs) Culvert
Discharge (cfs)
Headwater Elevation
(ft) Inlet Control
Depth (ft) Outlet Control
Depth (ft) Flow Type
Normal Depth (ft)
Critical Depth (ft)
Outlet Depth (ft)
Tailwater Depth (ft)
Outlet Velocity
(ft/s) Tailwater Velocity
(ft/s) 100.00 100.00 19.51 2.209 2.432 3-M2t 2.077 1.295 2.040 2.040 4.085 0.000
170.40 170.40 20.31 3.120 3.228 3-M2t 3.074 1.847 2.220 2.220 6.396 0.000
240.80 240.80 21.10 3.935 4.023 3-M2t 4.000 2.326 2.420 2.420 8.292 0.000
311.20 311.20 21.84 4.755 4.764 2-M2c 4.000 2.760 2.753 2.620 9.422 0.000
381.60 381.60 22.73 5.654 5.453 2-M2c 4.000 3.162 3.152 2.820 10.088 0.000
452.00 452.00 23.77 6.687 6.408 7-M2c 4.000 3.540 3.531 3.040 10.668 0.000
453.00 453.00 23.78 6.703 6.422 7-M2c 4.000 3.545 3.536 3.040 10.676 0.000
592.80 561.84 25.72 8.640 8.049 4-FFf 4.000 4.000 4.000 4.080 11.705 0.000
663.20 569.36 25.87 8.790 8.159 4-FFf 4.000 4.000 4.000 4.080 11.862 0.000
733.60 575.22 25.99 8.909 8.245 4-FFf 4.000 4.000 4.000 4.080 11.984 0.000
804.00 580.34 26.09 9.014 8.321 4-FFf 4.000 4.000 4.000 4.080 12.091 0.000

Culvert Performance Curve Plot: Culvert 02

Water Surface Profile Plot for Culvert: Culvert 02
Site Data - Culvert 02
Site Data Option: Culvert Invert Data
Inlet Station: 0.00 ft
Inlet Elevation: 17.08 ft
Outlet Station: 126.00 ft
Outlet Elevation: 16.98 ft
Number of Barrels: 2
Culvert Data Summary - Culvert 02
Barrel Shape: Concrete Box
Barrel Span: 6.00 ft
Barrel Rise: 4.00 ft
Barrel Material: Concrete
Embedment: 0.00 in
Barrel Manning's n: 0.0120
Inlet Type: Conventional
Inlet Edge Condition: Square Edge (90º) Headwall
Inlet Depression: NONE

Table 3 - Downstream Channel Rating Curve (Crossing: Culvert 02 Alt. - (2) 6x4)
Tailwater Channel Data - Culvert 02 Alt. - (2) 6x4
Tailwater Channel Option: Enter Rating Curve
Roadway Data for Crossing: Culvert 02 Alt. - (2) 6x4
Roadway Profile Shape: Constant Roadway Elevation
Crest Length: 200.00 ft
Crest Elevation: 25.58 ft
Roadway Surface: Paved
Roadway Top Width: 32.00 ft
Flow (cfs) Water Surface Elev (ft) Depth (ft)
100.00 19.02 2.04 170.40 19.20 2.22 240.80 19.40 2.42 311.20 19.60 2.62 381.60 19.80 2.82 452.00 20.02 3.04 453.00 20.02 3.04 592.80 21.06 4.08 663.20 21.06 4.08 733.60 21.06 4.08 804.00 21.06 4.08

HY-8 Culvert Analysis Report

Table 1 - Summary of Culvert Flows at Crossing: Culvert 03 - (2) 8x4
Headwater Elevation (ft) Total Discharge (cfs)
Culvert 03 Discharge (cfs)
Roadway Discharge (cfs) Iterations
18.19 105.00 105.00 0.00 1 18.54 179.60 179.60 0.00 1 19.04 254.20 254.20 0.00 1 19.66 328.80 328.80 0.00 1 20.24 403.40 403.40 0.00 1 20.93 478.00 478.00 0.00 1 21.71 552.60 552.60 0.00 1 22.57 627.20 627.20 0.00 1 23.55 701.80 701.80 0.00 1 24.14 776.40 743.45 32.29 9 24.28 851.00 752.49 97.98 6 24.02 734.95 734.95 0.00 Overtopping

Rating Curve Plot for Crossing: Culvert 03 - (2) 8x4

Table 2 - Culvert Summary Table: Culvert 03
********************************************************************************
Inlet Elevation (invert): 15.59 ft, Outlet Elevation (invert): 15.38 ft
Culvert Length: 126.00 ft, Culvert Slope: 0.0017
********************************************************************************
Total Discharge
(cfs) Culvert
Discharge (cfs)
Headwater Elevation
(ft) Inlet Control
Depth (ft) Outlet Control
Depth (ft) Flow Type
Normal Depth (ft)
Critical Depth (ft)
Outlet Depth (ft)
Tailwater Depth (ft)
Outlet Velocity
(ft/s) Tailwater Velocity
(ft/s) 105.00 105.00 18.19 1.893 2.596 3-M1t 1.303 1.104 2.620 2.620 2.505 0.000
179.60 179.60 18.54 2.676 2.947 3-M1t 1.877 1.579 2.620 2.620 4.284 0.000
254.20 254.20 19.04 3.358 3.454 3-M1t 2.395 1.991 2.620 2.620 6.064 0.000
328.80 328.80 19.66 3.999 4.071 7-M1t 2.877 2.363 2.920 2.920 7.038 0.000
403.40 403.40 20.24 4.649 4.653 3-M2t 3.338 2.708 3.220 3.220 7.830 0.000
478.00 478.00 20.93 5.345 5.206 3-M2t 4.000 3.033 3.520 3.520 8.487 0.000
552.60 552.60 21.71 6.115 5.727 3-M2t 4.000 3.341 3.720 3.720 9.284 0.000
627.20 627.20 22.57 6.982 6.464 7-M2t 4.000 3.635 3.820 3.820 10.262 0.000
701.80 701.80 23.55 7.958 7.253 7-M2t 4.000 3.918 3.920 3.920 11.189 0.000
776.40 743.45 24.14 8.554 7.704 4-FFf 4.000 4.000 4.000 4.020 11.616 0.000
851.00 752.49 24.28 8.689 8.000 4-FFf 4.000 4.000 4.000 4.220 11.758 0.000

Culvert Performance Curve Plot: Culvert 03

Water Surface Profile Plot for Culvert: Culvert 03
Site Data - Culvert 03
Site Data Option: Culvert Invert Data
Inlet Station: 0.00 ft
Inlet Elevation: 15.59 ft
Outlet Station: 126.00 ft
Outlet Elevation: 15.38 ft
Number of Barrels: 2
Culvert Data Summary - Culvert 03
Barrel Shape: Concrete Box
Barrel Span: 8.00 ft
Barrel Rise: 4.00 ft
Barrel Material: Concrete
Embedment: 0.00 in
Barrel Manning's n: 0.0120
Inlet Type: Conventional
Inlet Edge Condition: Square Edge (90º) Headwall
Inlet Depression: NONE

Table 3 - Downstream Channel Rating Curve (Crossing: Culvert 03 - (2) 8x4)
Tailwater Channel Data - Culvert 03 - (2) 8x4
Tailwater Channel Option: Enter Rating Curve
Roadway Data for Crossing: Culvert 03 - (2) 8x4
Roadway Profile Shape: Constant Roadway Elevation
Crest Length: 250.00 ft
Crest Elevation: 24.02 ft
Roadway Surface: Paved
Roadway Top Width: 102.00 ft
Flow (cfs) Water Surface Elev (ft) Depth (ft)
105.00 18.00 2.62 179.60 18.00 2.62 254.20 18.00 2.62 328.80 18.30 2.92 403.40 18.60 3.22 478.00 18.90 3.52 552.60 19.10 3.72 627.20 19.20 3.82 701.80 19.30 3.92 776.40 19.40 4.02 851.00 19.60 4.22

HY-8 Culvert Analysis Report

Table 1 - Summary of Culvert Flows at Crossing: Culvert 03 Alt - 10x3
Headwater Elevation (ft) Total Discharge (cfs)
Culvert 03 Discharge (cfs)
Roadway Discharge (cfs) Iterations
18.42 105.00 105.00 0.00 1 18.65 126.60 126.60 0.00 1 18.91 148.20 148.20 0.00 1 19.24 169.80 169.80 0.00 1 19.82 191.40 191.40 0.00 1 20.31 213.00 213.00 0.00 1 20.49 218.00 218.00 0.00 1 21.39 256.20 256.20 0.00 1 21.88 277.80 277.80 0.00 1 22.39 299.40 299.40 0.00 1 23.04 321.00 321.00 0.00 1 24.02 360.43 360.43 0.00 Overtopping

Rating Curve Plot for Crossing: Culvert 03 Alt - 10x3

Table 2 - Culvert Summary Table: Culvert 03
********************************************************************************
Inlet Elevation (invert): 15.59 ft, Outlet Elevation (invert): 15.38 ft
Culvert Length: 126.00 ft, Culvert Slope: 0.0017
********************************************************************************
Total Discharge
(cfs) Culvert
Discharge (cfs)
Headwater Elevation
(ft) Inlet Control
Depth (ft) Outlet Control
Depth (ft) Flow Type
Normal Depth (ft)
Critical Depth (ft)
Outlet Depth (ft)
Tailwater Depth (ft)
Outlet Velocity
(ft/s) Tailwater Velocity
(ft/s) 105.00 105.00 18.42 2.548 2.832 3-M1t 1.744 1.510 2.550 2.500 4.118 0.000
126.60 126.60 18.65 2.891 3.057 7-M1t 1.978 1.711 2.570 2.520 4.926 0.000
148.20 148.20 18.91 3.234 3.318 7-M1t 2.202 1.901 2.620 2.570 5.656 0.000
169.80 169.80 19.24 3.587 3.654 7-M1t 2.419 2.081 2.920 2.870 5.815 0.000
191.40 191.40 19.82 3.961 4.233 4-FFf 2.628 2.254 3.000 3.170 6.380 0.000
213.00 213.00 20.31 4.363 4.724 4-FFf 3.000 2.420 3.000 3.370 7.100 0.000
218.00 218.00 20.49 4.460 4.896 4-FFf 3.000 2.458 3.000 3.470 7.267 0.000
256.20 256.20 21.39 5.273 5.801 4-FFf 3.000 2.738 3.000 3.770 8.540 0.000
277.80 277.80 21.88 5.789 6.286 4-FFf 3.000 2.889 3.000 3.870 9.260 0.000
299.40 299.40 22.39 6.350 6.802 4-FFf 3.000 3.000 3.000 3.970 9.980 0.000
321.00 321.00 23.04 6.957 7.450 4-FFf 3.000 3.000 3.000 4.170 10.700 0.000

Culvert Performance Curve Plot: Culvert 03

Water Surface Profile Plot for Culvert: Culvert 03
Site Data - Culvert 03
Site Data Option: Culvert Invert Data
Inlet Station: 0.00 ft
Inlet Elevation: 15.59 ft
Outlet Station: 126.00 ft
Outlet Elevation: 15.38 ft
Number of Barrels: 1
Culvert Data Summary - Culvert 03
Barrel Shape: Concrete Box
Barrel Span: 10.00 ft
Barrel Rise: 3.00 ft
Barrel Material: Concrete
Embedment: 0.00 in
Barrel Manning's n: 0.0120
Inlet Type: Conventional
Inlet Edge Condition: Square Edge (90º) Headwall
Inlet Depression: NONE

Table 3 - Downstream Channel Rating Curve (Crossing: Culvert 03 Alt - 10x3)
Tailwater Channel Data - Culvert 03 Alt - 10x3
Tailwater Channel Option: Enter Rating Curve
Roadway Data for Crossing: Culvert 03 Alt - 10x3
Roadway Profile Shape: Constant Roadway Elevation
Crest Length: 250.00 ft
Crest Elevation: 24.02 ft
Roadway Surface: Paved
Roadway Top Width: 57.00 ft
Flow (cfs) Water Surface Elev (ft) Depth (ft)
105.00 17.93 2.50 126.60 17.95 2.52 148.20 18.00 2.57 169.80 18.30 2.87 191.40 18.60 3.17 213.00 18.80 3.37 218.00 18.90 3.47 256.20 19.20 3.77 277.80 19.30 3.87 299.40 19.40 3.97 321.00 19.60 4.17

HY-8 Culvert Analysis Report

Table 1 - Summary of Culvert Flows at Crossing: Culvert 04 - 30" RCP
Headwater Elevation (ft) Total Discharge (cfs)
Culvert 04 Discharge (cfs)
Roadway Discharge (cfs) Iterations
18.34 15.00 15.00 0.00 1 18.42 16.50 16.50 0.00 1 18.50 18.00 18.00 0.00 1 18.88 19.50 19.50 0.00 1 19.21 20.00 20.00 0.00 1 19.67 22.50 22.50 0.00 1 19.98 24.00 24.00 0.00 1 20.20 25.50 25.50 0.00 1 20.42 27.00 27.00 0.00 1 20.64 28.50 28.50 0.00 1 20.98 30.00 30.00 0.00 1 24.66 50.00 50.00 0.00 Overtopping

Rating Curve Plot for Crossing: Culvert 04 - 30" RCP

Table 2 - Culvert Summary Table: Culvert 04
********************************************************************************
Inlet Elevation (invert): 15.72 ft, Outlet Elevation (invert): 15.50 ft
Culvert Length: 112.00 ft, Culvert Slope: 0.0020
********************************************************************************
Total Discharge
(cfs) Culvert
Discharge (cfs)
Headwater Elevation
(ft) Inlet Control
Depth (ft) Outlet Control
Depth (ft) Flow Type
Normal Depth (ft)
Critical Depth (ft)
Outlet Depth (ft)
Tailwater Depth (ft)
Outlet Velocity
(ft/s) Tailwater Velocity
(ft/s) 15.00 15.00 18.34 1.939 2.624 4-FFf 1.633 1.302 2.500 2.570 3.056 0.000
16.50 16.50 18.42 2.056 2.697 4-FFf 1.748 1.367 2.500 2.570 3.361 0.000
18.00 18.00 18.50 2.171 2.776 4-FFf 1.884 1.433 2.500 2.570 3.667 0.000
19.50 19.50 18.88 2.285 3.162 4-FFf 2.030 1.498 2.500 2.870 3.973 0.000
20.00 20.00 19.21 2.324 3.492 4-FFf 2.102 1.516 2.500 3.170 4.074 0.000
22.50 22.50 19.67 2.517 3.955 4-FFf 2.500 1.608 2.500 3.470 4.584 0.000
24.00 24.00 19.98 2.637 4.262 4-FFf 2.500 1.663 2.500 3.670 4.889 0.000
25.50 25.50 20.20 2.761 4.475 4-FFf 2.500 1.718 2.500 3.770 5.195 0.000
27.00 27.00 20.42 2.890 4.696 4-FFf 2.500 1.769 2.500 3.870 5.500 0.000
28.50 28.50 20.64 3.024 4.923 4-FFf 2.500 1.815 2.500 3.970 5.806 0.000
30.00 30.00 20.98 3.165 5.258 4-FFf 2.500 1.860 2.500 4.170 6.112 0.000

Culvert Performance Curve Plot: Culvert 04

Water Surface Profile Plot for Culvert: Culvert 04
Site Data - Culvert 04
Site Data Option: Culvert Invert Data
Inlet Station: 0.00 ft
Inlet Elevation: 15.72 ft
Outlet Station: 112.00 ft
Outlet Elevation: 15.50 ft
Number of Barrels: 1
Culvert Data Summary - Culvert 04
Barrel Shape: Circular
Barrel Diameter: 2.50 ft
Barrel Material: Concrete
Embedment: 0.00 in
Barrel Manning's n: 0.0120
Inlet Type: Conventional
Inlet Edge Condition: Square Edge with Headwall
Inlet Depression: NONE

Table 3 - Downstream Channel Rating Curve (Crossing: Culvert 04 - 30" RCP)
Tailwater Channel Data - Culvert 04 - 30" RCP
Tailwater Channel Option: Enter Rating Curve
Roadway Data for Crossing: Culvert 04 - 30" RCP
Roadway Profile Shape: Constant Roadway Elevation
Crest Length: 100.00 ft
Crest Elevation: 24.66 ft
Roadway Surface: Paved
Roadway Top Width: 102.00 ft
Flow (cfs) Water Surface Elev (ft) Depth (ft)
15.00 18.00 2.57 16.50 18.00 2.57 18.00 18.00 2.57 19.50 18.30 2.87 20.00 18.60 3.17 22.50 18.90 3.47 24.00 19.10 3.67 25.50 19.20 3.77 27.00 19.30 3.87 28.50 19.40 3.97 30.00 19.60 4.17

HY-8 Culvert Analysis Report

Table 1 - Summary of Culvert Flows at Crossing: Culvert 05 - (2) 8x4
Headwater Elevation (ft) Total Discharge (cfs)
Culvert 05 Discharge (cfs)
Roadway Discharge (cfs) Iterations
15.18 190.00 190.00 0.00 1 15.52 227.00 227.00 0.00 1 15.84 264.00 264.00 0.00 1 16.16 301.00 301.00 0.00 1 16.46 338.00 338.00 0.00 1 16.76 375.00 375.00 0.00 1 16.86 386.00 386.00 0.00 1 17.48 449.00 449.00 0.00 1 17.95 486.00 486.00 0.00 1 18.43 523.00 523.00 0.00 1 18.82 560.00 560.00 0.00 1 22.98 819.44 819.44 0.00 Overtopping

Rating Curve Plot for Crossing: Culvert 05 - (2) 8x4

Table 2 - Culvert Summary Table: Culvert 05
********************************************************************************
Inlet Elevation (invert): 12.20 ft, Outlet Elevation (invert): 12.14 ft
Culvert Length: 160.00 ft, Culvert Slope: 0.0004
********************************************************************************
Total Discharge
(cfs) Culvert
Discharge (cfs)
Headwater Elevation
(ft) Inlet Control
Depth (ft) Outlet Control
Depth (ft) Flow Type
Normal Depth (ft)
Critical Depth (ft)
Outlet Depth (ft)
Tailwater Depth (ft)
Outlet Velocity
(ft/s) Tailwater Velocity
(ft/s) 190.00 190.00 15.18 2.778 2.976 3-M2t 3.321 1.640 2.260 2.260 5.254 0.000
227.00 227.00 15.52 3.119 3.316 3-M2t 4.000 1.846 2.460 2.460 5.767 0.000
264.00 264.00 15.84 3.446 3.643 3-M2t 4.000 2.042 2.660 2.660 6.203 0.000
301.00 301.00 16.16 3.764 3.958 3-M2t 4.000 2.228 2.860 2.860 6.578 0.000
338.00 338.00 16.46 4.081 4.263 3-M2t 4.000 2.407 3.060 3.060 6.904 0.000
375.00 375.00 16.76 4.401 4.557 3-M2t 4.000 2.580 3.260 3.260 7.189 0.000
386.00 386.00 16.86 4.497 4.657 3-M2t 4.000 2.630 3.360 3.360 7.180 0.000
449.00 449.00 17.48 5.069 5.277 7-M2t 4.000 2.909 3.860 3.860 7.270 0.000
486.00 486.00 17.95 5.426 5.751 4-FFf 4.000 3.067 4.000 4.060 7.594 0.000
523.00 523.00 18.43 5.802 6.228 4-FFf 4.000 3.220 4.000 4.260 8.172 0.000
560.00 560.00 18.82 6.199 6.625 4-FFf 4.000 3.370 4.000 4.360 8.750 0.000

Culvert Performance Curve Plot: Culvert 05

Water Surface Profile Plot for Culvert: Culvert 05
Site Data - Culvert 05
Site Data Option: Culvert Invert Data
Inlet Station: 0.00 ft
Inlet Elevation: 12.20 ft
Outlet Station: 160.00 ft
Outlet Elevation: 12.14 ft
Number of Barrels: 2
Culvert Data Summary - Culvert 05
Barrel Shape: Concrete Box
Barrel Span: 8.00 ft
Barrel Rise: 4.00 ft
Barrel Material: Concrete
Embedment: 0.00 in
Barrel Manning's n: 0.0120
Inlet Type: Conventional
Inlet Edge Condition: Square Edge (90º) Headwall
Inlet Depression: NONE

Table 3 - Downstream Channel Rating Curve (Crossing: Culvert 05 - (2) 8x4)
Tailwater Channel Data - Culvert 05 - (2) 8x4
Tailwater Channel Option: Enter Rating Curve
Roadway Data for Crossing: Culvert 05 - (2) 8x4
Roadway Profile Shape: Constant Roadway Elevation
Crest Length: 200.00 ft
Crest Elevation: 22.98 ft
Roadway Surface: Paved
Roadway Top Width: 32.00 ft
Flow (cfs) Water Surface Elev (ft) Depth (ft)
190.00 14.40 2.26 227.00 14.60 2.46 264.00 14.80 2.66 301.00 15.00 2.86 338.00 15.20 3.06 375.00 15.40 3.26 386.00 15.50 3.36 449.00 16.00 3.86 486.00 16.20 4.06 523.00 16.40 4.26 560.00 16.50 4.36

HY-8 Culvert Analysis Report

Table 1 - Summary of Culvert Flows at Crossing: Culvert 06 - (2) 30" RCP
Headwater Elevation (ft) Total Discharge (cfs)
Culvert 06 Discharge (cfs)
Roadway Discharge (cfs) Iterations
16.56 20.00 20.00 0.00 1 16.85 26.70 26.70 0.00 1 17.12 33.40 33.40 0.00 1 17.37 40.10 40.10 0.00 1 17.75 46.80 46.80 0.00 1 18.24 53.50 53.50 0.00 1 18.77 60.20 60.20 0.00 1 19.11 61.00 61.00 0.00 1 20.45 73.60 73.60 0.00 1 20.99 80.30 80.30 0.00 1 21.68 87.00 87.00 0.00 1 23.06 102.29 102.29 0.00 Overtopping

Rating Curve Plot for Crossing: Culvert 06 - (2) 30" RCP

Table 2 - Culvert Summary Table: Culvert 06
Total Discharge
(cfs) Culvert
Discharge (cfs)
Headwater Elevation
(ft) Inlet Control
Depth (ft) Outlet Control
Depth (ft) Flow Type
Normal Depth (ft)
Critical Depth (ft)
Outlet Depth (ft)
Tailwater Depth (ft)
Outlet Velocity
(ft/s) Tailwater Velocity
(ft/s) 20.00 20.00 16.56 1.508 0.0* 1-S2n 0.994 1.052 0.994 1.740 5.497 0.000
26.70 26.70 16.85 1.803 0.0* 1-S2n 1.166 1.227 1.166 1.740 5.941 0.000
33.40 33.40 17.12 2.068 0.0* 1-S2n 1.332 1.376 1.335 1.740 6.265 0.000
40.10 40.10 17.37 2.324 0.0* 1-S2n 1.495 1.518 1.497 2.040 6.534 0.000
46.80 46.80 17.75 2.586 2.703 7-M1t 1.664 1.641 2.340 2.340 4.899 0.000
53.50 53.50 18.24 2.865 3.189 4-FFf 1.847 1.762 2.500 2.640 5.449 0.000
60.20 60.20 18.77 3.171 3.719 4-FFf 2.073 1.863 2.500 2.840 6.132 0.000
61.00 61.00 19.11 3.210 4.061 4-FFf 2.111 1.875 2.500 3.140 6.213 0.000
73.60 73.60 20.45 3.889 5.396 4-FFf 2.500 2.045 2.500 3.740 7.497 0.000
80.30 80.30 20.99 4.307 5.942 4-FFf 2.500 2.116 2.500 3.840 8.179 0.000
87.00 87.00 21.68 4.766 6.628 4-FFf 2.500 2.187 2.500 4.040 8.862 0.000

* theoretical depth is impractical. Depth reported is corrected.
********************************************************************************
Inlet Elevation (invert): 15.05 ft, Outlet Elevation (invert): 14.36 ft
Culvert Length: 152.00 ft, Culvert Slope: 0.0045
********************************************************************************

Culvert Performance Curve Plot: Culvert 06

Water Surface Profile Plot for Culvert: Culvert 06
Site Data - Culvert 06
Site Data Option: Culvert Invert Data
Inlet Station: 0.00 ft
Inlet Elevation: 15.05 ft
Outlet Station: 152.00 ft
Outlet Elevation: 14.36 ft
Number of Barrels: 2
Culvert Data Summary - Culvert 06
Barrel Shape: Circular
Barrel Diameter: 2.50 ft
Barrel Material: Concrete
Embedment: 0.00 in
Barrel Manning's n: 0.0120
Inlet Type: Conventional
Inlet Edge Condition: Square Edge with Headwall
Inlet Depression: NONE

Table 3 - Downstream Channel Rating Curve (Crossing: Culvert 06 - (2) 30" RCP)
Tailwater Channel Data - Culvert 06 - (2) 30" RCP
Tailwater Channel Option: Enter Rating Curve
Roadway Data for Crossing: Culvert 06 - (2) 30" RCP
Roadway Profile Shape: Constant Roadway Elevation
Crest Length: 100.00 ft
Crest Elevation: 23.06 ft
Roadway Surface: Paved
Roadway Top Width: 32.00 ft
Flow (cfs) Water Surface Elev (ft) Depth (ft)
20.00 16.10 1.74 26.70 16.10 1.74 33.40 16.10 1.74 40.10 16.40 2.04 46.80 16.70 2.34 53.50 17.00 2.64 60.20 17.20 2.84 61.00 17.50 3.14 73.60 18.10 3.74 80.30 18.20 3.84 87.00 18.40 4.04

HY-8 Culvert Analysis Report

Table 1 - Summary of Culvert Flows at Crossing: Culvert 07 - (2) 6x4
Headwater Elevation (ft) Total Discharge (cfs)
Culvert 07 Discharge (cfs)
Roadway Discharge (cfs) Iterations
18.68 250.00 250.00 0.00 1 19.21 307.20 307.20 0.00 1 19.92 364.40 364.40 0.00 1 20.72 421.60 421.60 0.00 1 21.46 469.00 469.00 0.00 1 22.64 536.00 536.00 0.00 1 23.66 593.20 587.38 5.15 8 23.80 650.40 594.08 55.66 7 23.90 707.60 598.72 108.00 5 23.98 764.80 602.63 161.83 5 24.05 822.00 606.07 215.31 4 23.62 585.60 585.60 0.00 Overtopping

Rating Curve Plot for Crossing: Culvert 07 - (2) 6x4

Table 2 - Culvert Summary Table: Culvert 07
********************************************************************************
Inlet Elevation (invert): 14.50 ft, Outlet Elevation (invert): 14.17 ft
Culvert Length: 162.00 ft, Culvert Slope: 0.0020
********************************************************************************
Total Discharge
(cfs) Culvert
Discharge (cfs)
Headwater Elevation
(ft) Inlet Control
Depth (ft) Outlet Control
Depth (ft) Flow Type
Normal Depth (ft)
Critical Depth (ft)
Outlet Depth (ft)
Tailwater Depth (ft)
Outlet Velocity
(ft/s) Tailwater Velocity
(ft/s) 250.00 250.00 18.68 4.037 4.180 7-M1t 2.878 2.385 3.330 3.330 6.256 0.000
307.20 307.20 19.21 4.704 4.711 3-M2t 3.361 2.736 3.350 3.350 7.642 0.000
364.40 364.40 19.92 5.421 5.259 3-M2t 4.000 3.066 3.380 3.380 8.984 0.000
421.60 421.60 20.72 6.220 5.794 3-M2t 4.000 3.379 3.410 3.410 10.303 0.000
469.00 469.00 21.46 6.958 6.562 7-M2c 4.000 3.628 3.619 3.430 10.800 0.000
536.00 536.00 22.64 8.138 7.600 7-M2c 4.000 3.966 3.955 3.530 11.293 0.000
593.20 587.38 23.66 9.157 8.391 6-FFc 4.000 4.000 4.000 3.730 12.237 0.000
650.40 594.08 23.80 9.297 8.500 6-FFc 4.000 4.000 4.000 3.930 12.377 0.000
707.60 598.72 23.90 9.396 8.805 4-FFf 4.000 4.000 4.000 4.230 12.473 0.000
764.80 602.63 23.98 9.479 9.170 4-FFf 4.000 4.000 4.000 4.530 12.555 0.000
822.00 606.07 24.05 9.553 9.427 4-FFf 4.000 4.000 4.000 4.730 12.626 0.000

Culvert Performance Curve Plot: Culvert 07

Water Surface Profile Plot for Culvert: Culvert 07
Site Data - Culvert 07
Site Data Option: Culvert Invert Data
Inlet Station: 0.00 ft
Inlet Elevation: 14.50 ft
Outlet Station: 162.00 ft
Outlet Elevation: 14.17 ft
Number of Barrels: 2
Culvert Data Summary - Culvert 07
Barrel Shape: Concrete Box
Barrel Span: 6.00 ft
Barrel Rise: 4.00 ft
Barrel Material: Concrete
Embedment: 0.00 in
Barrel Manning's n: 0.0120
Inlet Type: Conventional
Inlet Edge Condition: Square Edge (90º) Headwall
Inlet Depression: NONE

Table 3 - Downstream Channel Rating Curve (Crossing: Culvert 07 - (2) 6x4)
Tailwater Channel Data - Culvert 07 - (2) 6x4
Tailwater Channel Option: Enter Rating Curve
Roadway Data for Crossing: Culvert 07 - (2) 6x4
Roadway Profile Shape: Constant Roadway Elevation
Crest Length: 250.00 ft
Crest Elevation: 23.62 ft
Roadway Surface: Paved
Roadway Top Width: 32.00 ft
Flow (cfs) Water Surface Elev (ft) Depth (ft)
250.00 17.50 3.33 307.20 17.52 3.35 364.40 17.55 3.38 421.60 17.58 3.41 469.00 17.60 3.43 536.00 17.70 3.53 593.20 17.90 3.73 650.40 18.10 3.93 707.60 18.40 4.23 764.80 18.70 4.53 822.00 18.90 4.73

HY-8 Culvert Analysis Report

Table 1 - Summary of Culvert Flows at Crossing: Culvert 08 - (2) 36" RCP
Headwater Elevation (ft) Total Discharge (cfs)
Culvert 08 Discharge (cfs)
Roadway Discharge (cfs) Iterations
18.72 20.00 20.00 0.00 1 19.18 32.10 32.10 0.00 1 19.58 44.20 44.20 0.00 1 19.96 56.30 56.30 0.00 1 20.33 68.40 68.40 0.00 1 20.70 80.50 80.50 0.00 1 21.14 92.60 92.60 0.00 1 21.42 99.00 99.00 0.00 1 22.26 116.80 116.80 0.00 1 22.89 128.90 128.90 0.00 1 23.54 141.00 141.00 0.00 1 25.65 171.39 171.39 0.00 Overtopping

Rating Curve Plot for Crossing: Culvert 08 - (2) 36" RCP

Table 2 - Culvert Summary Table: Culvert 08
********************************************************************************
Inlet Elevation (invert): 17.19 ft, Outlet Elevation (invert): 16.95 ft
Culvert Length: 148.00 ft, Culvert Slope: 0.0016
********************************************************************************
Total Discharge
(cfs) Culvert
Discharge (cfs)
Headwater Elevation
(ft) Inlet Control
Depth (ft) Outlet Control
Depth (ft) Flow Type
Normal Depth (ft)
Critical Depth (ft)
Outlet Depth (ft)
Tailwater Depth (ft)
Outlet Velocity
(ft/s) Tailwater Velocity
(ft/s) 20.00 20.00 18.72 1.380 1.533 2-M2c 1.211 0.992 1.000 3.330 4.847 0.000
32.10 32.10 19.18 1.834 1.988 2-M2c 1.588 1.273 1.279 3.340 5.586 0.000
44.20 44.20 19.58 2.232 2.390 2-M2c 1.956 1.511 1.512 3.350 6.190 0.000
56.30 56.30 19.96 2.592 2.766 2-M2c 2.374 1.711 1.716 3.360 6.734 0.000
68.40 68.40 20.33 2.944 3.137 2-M2c 3.000 1.894 1.899 3.370 7.249 0.000
80.50 80.50 20.70 3.316 3.515 2-M2c 3.000 2.063 2.065 3.380 7.756 0.000
92.60 92.60 21.14 3.724 3.953 2-M2c 3.000 2.208 2.216 3.410 8.270 0.000
99.00 99.00 21.42 3.960 4.233 7-M2c 3.000 2.281 2.290 3.430 8.549 0.000
116.80 116.80 22.26 4.702 5.075 7-M2c 3.000 2.460 2.473 3.730 9.370 0.000
128.90 128.90 22.89 5.285 5.697 7-M2c 3.000 2.557 2.574 4.230 9.984 0.000
141.00 141.00 23.54 5.933 6.349 7-M2c 3.000 2.654 2.662 4.730 10.634 0.000

Culvert Performance Curve Plot: Culvert 08

Water Surface Profile Plot for Culvert: Culvert 08
Site Data - Culvert 08
Site Data Option: Culvert Invert Data
Inlet Station: 0.00 ft
Inlet Elevation: 17.19 ft
Outlet Station: 148.00 ft
Outlet Elevation: 16.95 ft
Number of Barrels: 2
Culvert Data Summary - Culvert 08
Barrel Shape: Circular
Barrel Diameter: 3.00 ft
Barrel Material: Concrete
Embedment: 0.00 in
Barrel Manning's n: 0.0120
Inlet Type: Conventional
Inlet Edge Condition: Square Edge with Headwall
Inlet Depression: NONE

Table 3 - Downstream Channel Rating Curve (Crossing: Culvert 08 - (2) 36" RCP)
Tailwater Channel Data - Culvert 08 - (2) 36" RCP
Tailwater Channel Option: Enter Rating Curve
Roadway Data for Crossing: Culvert 08 - (2) 36" RCP
Roadway Profile Shape: Constant Roadway Elevation
Crest Length: 100.00 ft
Crest Elevation: 25.65 ft
Roadway Surface: Paved
Roadway Top Width: 32.00 ft
Flow (cfs) Water Surface Elev (ft) Depth (ft)
20.00 17.50 3.33 32.10 17.51 3.34 44.20 17.52 3.35 56.30 17.53 3.36 68.40 17.54 3.37 80.50 17.55 3.38 92.60 17.58 3.41 99.00 17.60 3.43 116.80 17.90 3.73 128.90 18.40 4.23 141.00 18.90 4.73

HY-8 Culvert Analysis Report

Table 1 - Summary of Culvert Flows at Crossing: Culvert 09 - 10x5
Headwater Elevation (ft) Total Discharge (cfs)
Culvert 09 Discharge (cfs)
Roadway Discharge (cfs) Iterations
17.26 215.00 215.00 0.00 1 17.72 260.20 260.20 0.00 1 18.22 305.40 305.40 0.00 1 18.73 350.60 350.60 0.00 1 19.06 376.00 376.00 0.00 1 19.95 441.00 441.00 0.00 1 20.64 486.20 486.20 0.00 1 21.38 531.40 531.40 0.00 1 22.19 576.60 576.60 0.00 1 23.06 621.80 621.80 0.00 1 24.01 667.00 667.00 0.00 1 25.01 711.43 711.43 0.00 Overtopping

Rating Curve Plot for Crossing: Culvert 09 - 10x5

Table 2 - Culvert Summary Table: Culvert 09
********************************************************************************
Inlet Elevation (invert): 12.94 ft, Outlet Elevation (invert): 12.43 ft
Culvert Length: 190.00 ft, Culvert Slope: 0.0027
********************************************************************************
Total Discharge
(cfs) Culvert
Discharge (cfs)
Headwater Elevation
(ft) Inlet Control
Depth (ft) Outlet Control
Depth (ft) Flow Type
Normal Depth (ft)
Critical Depth (ft)
Outlet Depth (ft)
Tailwater Depth (ft)
Outlet Velocity
(ft/s) Tailwater Velocity
(ft/s) 215.00 215.00 17.26 4.106 4.321 1-S1t 2.413 2.436 3.870 3.540 5.556 0.000
260.20 260.20 17.72 4.666 4.784 1-S1t 2.755 2.766 3.970 3.640 6.554 0.000
305.40 305.40 18.22 5.220 5.276 7-M1t 3.086 3.078 4.070 3.740 7.504 0.000
350.60 350.60 18.73 5.786 5.793 7-M1t 3.404 3.374 4.120 3.790 8.510 0.000
376.00 376.00 19.06 6.116 6.087 7-M1t 3.580 3.535 4.170 3.840 9.017 0.000
441.00 441.00 19.95 7.013 6.798 7-M1t 4.020 3.932 4.370 4.040 10.092 0.000
486.20 486.20 20.64 7.697 7.257 7-M1t 4.317 4.196 4.570 4.240 10.639 0.000
531.40 531.40 21.38 8.439 7.661 3-M2t 5.000 4.452 4.770 4.440 11.140 0.000
576.60 576.60 22.19 9.246 8.105 3-M2t 5.000 4.701 4.970 4.640 11.602 0.000
621.80 621.80 23.06 10.121 9.126 4-FFf 5.000 4.944 5.000 4.740 12.436 0.000
667.00 667.00 24.01 11.068 9.914 4-FFf 5.000 5.000 5.000 4.840 13.340 0.000

Culvert Performance Curve Plot: Culvert 09

Water Surface Profile Plot for Culvert: Culvert 09
Site Data - Culvert 09
Site Data Option: Culvert Invert Data
Inlet Station: 0.00 ft
Inlet Elevation: 12.94 ft
Outlet Station: 190.00 ft
Outlet Elevation: 12.43 ft
Number of Barrels: 1
Culvert Data Summary - Culvert 09
Barrel Shape: Concrete Box
Barrel Span: 10.00 ft
Barrel Rise: 5.00 ft
Barrel Material: Concrete
Embedment: 0.00 in
Barrel Manning's n: 0.0120
Inlet Type: Conventional
Inlet Edge Condition: Square Edge (90º) Headwall
Inlet Depression: NONE

Table 3 - Downstream Channel Rating Curve (Crossing: Culvert 09 - 10x5 )
Tailwater Channel Data - Culvert 09 - 10x5
Tailwater Channel Option: Enter Rating Curve
Roadway Data for Crossing: Culvert 09 - 10x5
Roadway Profile Shape: Constant Roadway Elevation
Crest Length: 200.00 ft
Crest Elevation: 25.01 ft
Roadway Surface: Paved
Roadway Top Width: 32.00 ft
Flow (cfs) Water Surface Elev (ft) Depth (ft)
215.00 16.30 3.54 260.20 16.40 3.64 305.40 16.50 3.74 350.60 16.55 3.79 376.00 16.60 3.84 441.00 16.80 4.04 486.20 17.00 4.24 531.40 17.20 4.44 576.60 17.40 4.64 621.80 17.50 4.74 667.00 17.60 4.84

HY-8 Culvert Analysis Report

Table 1 - Summary of Culvert Flows at Crossing: Culvert 10 - 30" RCP
Headwater Elevation (ft) Total Discharge (cfs)
Culvert 10 Discharge (cfs)
Roadway Discharge (cfs) Iterations
20.17 10.00 10.00 0.00 1 20.34 12.00 12.00 0.00 1 20.51 14.00 14.00 0.00 1 20.59 15.00 15.00 0.00 1 20.83 18.00 18.00 0.00 1 20.98 20.00 20.00 0.00 1 21.13 22.00 22.00 0.00 1 21.29 24.00 24.00 0.00 1 21.43 26.00 26.00 0.00 1 21.60 28.00 28.00 0.00 1 21.76 30.00 30.00 0.00 1 22.90 40.53 40.53 0.00 Overtopping

Rating Curve Plot for Crossing: Culvert 10 - 30" RCP

Table 2 - Culvert Summary Table: Culvert 10
********************************************************************************
Inlet Elevation (invert): 18.54 ft, Outlet Elevation (invert): 18.34 ft
Culvert Length: 74.00 ft, Culvert Slope: 0.0027
********************************************************************************
Total Discharge
(cfs) Culvert
Discharge (cfs)
Headwater Elevation
(ft) Inlet Control
Depth (ft) Outlet Control
Depth (ft) Flow Type
Normal Depth (ft)
Critical Depth (ft)
Outlet Depth (ft)
Tailwater Depth (ft)
Outlet Velocity
(ft/s) Tailwater Velocity
(ft/s) 10.00 10.00 20.17 1.511 1.628 3-M1t 1.146 1.052 1.160 1.160 4.485 0.000
12.00 12.00 20.34 1.691 1.805 3-M2t 1.277 1.156 1.160 1.160 5.382 0.000
14.00 14.00 20.51 1.858 1.971 2-M2c 1.402 1.259 1.259 1.160 5.652 0.000
15.00 15.00 20.59 1.938 2.052 2-M2c 1.465 1.302 1.306 1.160 5.784 0.000
18.00 18.00 20.83 2.170 2.288 2-M2c 1.660 1.433 1.437 1.160 6.167 0.000
20.00 20.00 20.98 2.323 2.440 2-M2c 1.798 1.516 1.518 1.160 6.413 0.000
22.00 22.00 21.13 2.477 2.593 2-M2c 1.952 1.590 1.595 1.160 6.656 0.000
24.00 24.00 21.29 2.636 2.745 2-M2c 2.168 1.663 1.668 1.160 6.897 0.000
26.00 26.00 21.43 2.803 2.894 2-M2c 2.500 1.737 1.738 1.160 7.139 0.000
28.00 28.00 21.60 2.978 3.056 2-M2c 2.500 1.799 1.804 1.160 7.382 0.000
30.00 30.00 21.76 3.164 3.219 2-M2c 2.500 1.860 1.867 1.160 7.630 0.000
50 yr flow 26.0 cfslower stage comparedto existing

Culvert Performance Curve Plot: Culvert 10

Water Surface Profile Plot for Culvert: Culvert 10
Site Data - Culvert 10
Site Data Option: Culvert Invert Data
Inlet Station: 0.00 ft
Inlet Elevation: 18.54 ft
Outlet Station: 74.00 ft
Outlet Elevation: 18.34 ft
Number of Barrels: 1
Culvert Data Summary - Culvert 10
Barrel Shape: Circular
Barrel Diameter: 2.50 ft
Barrel Material: Concrete
Embedment: 0.00 in
Barrel Manning's n: 0.0120
Inlet Type: Conventional
Inlet Edge Condition: Square Edge with Headwall
Inlet Depression: NONE
See previous page forElevation 21.43 for 50 yrflow of 26.0 cfs

Table 3 - Downstream Channel Rating Curve (Crossing: Culvert 10 - 30" RCP)
Tailwater Channel Data - Culvert 10 - 30" RCP
Tailwater Channel Option: Enter Constant Tailwater Elevation
Constant Tailwater Elevation: 19.50 ft
Roadway Data for Crossing: Culvert 10 - 30" RCP
Roadway Profile Shape: Constant Roadway Elevation
Crest Length: 100.00 ft
Crest Elevation: 22.90 ft
Roadway Surface: Paved
Roadway Top Width: 32.00 ft
Flow (cfs) Water Surface Elev (ft) Depth (ft)
10.00 19.50 1.16 12.00 19.50 1.16 14.00 19.50 1.16 15.00 19.50 1.16 18.00 19.50 1.16 20.00 19.50 1.16 22.00 19.50 1.16 24.00 19.50 1.16 26.00 19.50 1.16 28.00 19.50 1.16 30.00 19.50 1.16

HY-8 Culvert Analysis Report

Table 1 - Summary of Culvert Flows at Crossing: Culvert 11 - 24" RCP
Headwater Elevation (ft) Total Discharge (cfs)
Culvert 11 Discharge (cfs)
Roadway Discharge (cfs) Iterations
22.09 5.00 5.00 0.00 1 22.13 6.00 6.00 0.00 1 22.17 7.00 7.00 0.00 1 22.22 8.00 8.00 0.00 1 22.28 9.00 9.00 0.00 1 22.35 10.00 10.00 0.00 1 22.43 11.00 11.00 0.00 1 22.51 12.00 12.00 0.00 1 22.59 13.00 13.00 0.00 1 22.69 14.00 14.00 0.00 1 22.79 15.00 15.00 0.00 1 24.07 24.26 24.26 0.00 Overtopping

Rating Curve Plot for Crossing: Culvert 11 - 24" RCP

Table 2 - Culvert Summary Table: Culvert 11
********************************************************************************
Inlet Elevation (invert): 19.94 ft, Outlet Elevation (invert): 18.16 ft
Culvert Length: 70.02 ft, Culvert Slope: 0.0254
********************************************************************************
Total Discharge
(cfs) Culvert
Discharge (cfs)
Headwater Elevation
(ft) Inlet Control
Depth (ft) Outlet Control
Depth (ft) Flow Type
Normal Depth (ft)
Critical Depth (ft)
Outlet Depth (ft)
Tailwater Depth (ft)
Outlet Velocity
(ft/s) Tailwater Velocity
(ft/s) 5.00 5.00 22.09 1.087 2.147 4-FFf 0.474 0.786 2.000 3.840 1.592 0.000
6.00 6.00 22.13 1.222 2.186 4-FFf 0.521 0.862 2.000 3.840 1.910 0.000
7.00 7.00 22.17 1.346 2.232 4-FFf 0.568 0.935 2.000 3.840 2.228 0.000
8.00 8.00 22.22 1.462 2.285 4-FFf 0.612 1.006 2.000 3.840 2.546 0.000
9.00 9.00 22.28 1.573 2.344 4-FFf 0.648 1.067 2.000 3.840 2.865 0.000
10.00 10.00 22.35 1.681 2.411 4-FFf 0.684 1.128 2.000 3.840 3.183 0.000
11.00 11.00 22.43 1.788 2.485 4-FFf 0.721 1.188 2.000 3.840 3.501 0.000
12.00 12.00 22.51 1.895 2.566 4-FFf 0.757 1.241 2.000 3.840 3.820 0.000
13.00 13.00 22.59 2.004 2.654 4-FFf 0.793 1.293 2.000 3.840 4.138 0.000
14.00 14.00 22.69 2.116 2.749 4-FFf 0.825 1.344 2.000 3.840 4.456 0.000
15.00 15.00 22.79 2.233 2.851 4-FFf 0.857 1.395 2.000 3.840 4.775 0.000

Culvert Performance Curve Plot: Culvert 11

Water Surface Profile Plot for Culvert: Culvert 11
Site Data - Culvert 11
Site Data Option: Culvert Invert Data
Inlet Station: 0.00 ft
Inlet Elevation: 19.94 ft
Outlet Station: 70.00 ft
Outlet Elevation: 18.16 ft
Number of Barrels: 1
Culvert Data Summary - Culvert 11
Barrel Shape: Circular
Barrel Diameter: 2.00 ft
Barrel Material: Concrete
Embedment: 0.00 in
Barrel Manning's n: 0.0120
Inlet Type: Conventional
Inlet Edge Condition: Square Edge with Headwall
Inlet Depression: NONE

Table 3 - Downstream Channel Rating Curve (Crossing: Culvert 11 - 24" RCP)
Tailwater Channel Data - Culvert 11 - 24" RCP
Tailwater Channel Option: Enter Constant Tailwater Elevation
Constant Tailwater Elevation: 22.00 ft
Roadway Data for Crossing: Culvert 11 - 24" RCP
Roadway Profile Shape: Constant Roadway Elevation
Crest Length: 100.00 ft
Crest Elevation: 24.07 ft
Roadway Surface: Paved
Roadway Top Width: 32.00 ft
Flow (cfs) Water Surface Elev (ft) Depth (ft)
5.00 22.00 3.84 6.00 22.00 3.84 7.00 22.00 3.84 8.00 22.00 3.84 9.00 22.00 3.84 10.00 22.00 3.84 11.00 22.00 3.84 12.00 22.00 3.84 13.00 22.00 3.84 14.00 22.00 3.84 15.00 22.00 3.84

HY-8 Culvert Analysis Report

Table 1 - Summary of Culvert Flows at Crossing: Culvert 12 - 30" RCP
Headwater Elevation (ft) Total Discharge (cfs)
Culvert 12 Discharge (cfs)
Roadway Discharge (cfs) Iterations
21.37 5.00 5.00 0.00 1 21.39 6.00 6.00 0.00 1 21.42 7.00 7.00 0.00 1 21.44 8.00 8.00 0.00 1 21.47 9.00 9.00 0.00 1 21.51 10.00 10.00 0.00 1 21.54 11.00 11.00 0.00 1 21.58 12.00 12.00 0.00 1 21.62 13.00 13.00 0.00 1 21.67 14.00 14.00 0.00 1 21.71 15.00 15.00 0.00 1 23.97 40.73 40.73 0.00 Overtopping

Rating Curve Plot for Crossing: Culvert 12 - 30" RCP

Table 2 - Culvert Summary Table: Culvert 12
********************************************************************************
Inlet Elevation (invert): 19.40 ft, Outlet Elevation (invert): 19.29 ft
Culvert Length: 86.00 ft, Culvert Slope: 0.0013
********************************************************************************
Total Discharge
(cfs) Culvert
Discharge (cfs)
Headwater Elevation
(ft) Inlet Control
Depth (ft) Outlet Control
Depth (ft) Flow Type
Normal Depth (ft)
Critical Depth (ft)
Outlet Depth (ft)
Tailwater Depth (ft)
Outlet Velocity
(ft/s) Tailwater Velocity
(ft/s) 5.00 5.00 21.37 1.014 1.975 3-M1t 0.959 0.735 2.040 2.000 1.166 0.000
6.00 6.00 21.39 1.117 1.994 3-M1t 1.061 0.804 2.040 2.000 1.399 0.000
7.00 7.00 21.42 1.213 2.017 3-M1t 1.157 0.869 2.040 2.000 1.632 0.000
8.00 8.00 21.44 1.314 2.043 3-M1t 1.253 0.935 2.040 2.000 1.865 0.000
9.00 9.00 21.47 1.416 2.073 3-M1t 1.345 1.000 2.040 2.000 2.099 0.000
10.00 10.00 21.51 1.512 2.106 3-M1t 1.436 1.052 2.040 2.000 2.332 0.000
11.00 11.00 21.54 1.604 2.142 3-M1t 1.529 1.104 2.040 2.000 2.565 0.000
12.00 12.00 21.58 1.693 2.180 3-M1t 1.624 1.156 2.040 2.000 2.798 0.000
13.00 13.00 21.62 1.778 2.222 3-M1t 1.718 1.208 2.040 2.000 3.031 0.000
14.00 14.00 21.67 1.860 2.267 3-M1t 1.825 1.259 2.040 2.000 3.264 0.000
15.00 15.00 21.71 1.940 2.315 3-M1t 1.937 1.302 2.040 2.000 3.498 0.000

Culvert Performance Curve Plot: Culvert 12

Water Surface Profile Plot for Culvert: Culvert 12
Site Data - Culvert 12
Site Data Option: Culvert Invert Data
Inlet Station: 0.00 ft
Inlet Elevation: 19.40 ft
Outlet Station: 86.00 ft
Outlet Elevation: 19.29 ft
Number of Barrels: 1
Culvert Data Summary - Culvert 12
Barrel Shape: Circular
Barrel Diameter: 2.50 ft
Barrel Material: Concrete
Embedment: 0.00 in
Barrel Manning's n: 0.0120
Inlet Type: Conventional
Inlet Edge Condition: Square Edge with Headwall
Inlet Depression: NONE

Table 3 - Downstream Channel Rating Curve (Crossing: Culvert 12 - 30" RCP)
Tailwater Channel Data - Culvert 12 - 30" RCP
Tailwater Channel Option: Enter Constant Tailwater Elevation
Constant Tailwater Elevation: 21.33 ft
Roadway Data for Crossing: Culvert 12 - 30" RCP
Roadway Profile Shape: Constant Roadway Elevation
Crest Length: 100.00 ft
Crest Elevation: 23.97 ft
Roadway Surface: Paved
Roadway Top Width: 32.00 ft
Flow (cfs) Water Surface Elev (ft) Depth (ft)
5.00 21.33 2.00 6.00 21.33 2.00 7.00 21.33 2.00 8.00 21.33 2.00 9.00 21.33 2.00 10.00 21.33 2.00 11.00 21.33 2.00 12.00 21.33 2.00 13.00 21.33 2.00 14.00 21.33 2.00 15.00 21.33 2.00

HY-8 Culvert Analysis Report

Table 1 - Summary of Culvert Flows at Crossing: Culvert 13 - 36" RCP
Headwater Elevation (ft) Total Discharge (cfs)
Culvert 13 Discharge (cfs)
Roadway Discharge (cfs) Iterations
20.46 40.00 40.00 0.00 1 20.94 48.00 48.00 0.00 1 21.50 56.00 56.00 0.00 1 22.25 64.00 64.00 0.00 1 23.11 72.00 72.00 0.00 1 24.09 80.00 80.00 0.00 1 24.48 83.00 83.00 0.00 1 24.62 96.00 83.99 11.86 7 24.66 104.00 84.33 19.57 5 24.70 112.00 84.63 27.21 4 24.74 120.00 84.90 35.01 4 24.50 83.12 83.12 0.00 Overtopping

Rating Curve Plot for Crossing: Culvert 13 - 36" RCP

Table 2 - Culvert Summary Table: Culvert 13
********************************************************************************
Inlet Elevation (invert): 17.01 ft, Outlet Elevation (invert): 16.95 ft
Culvert Length: 60.00 ft, Culvert Slope: 0.0010
********************************************************************************
Total Discharge
(cfs) Culvert
Discharge (cfs)
Headwater Elevation
(ft) Inlet Control
Depth (ft) Outlet Control
Depth (ft) Flow Type
Normal Depth (ft)
Critical Depth (ft)
Outlet Depth (ft)
Tailwater Depth (ft)
Outlet Velocity
(ft/s) Tailwater Velocity
(ft/s) 40.00 40.00 20.46 3.301 3.447 2-M2c 3.000 2.056 2.059 2.020 7.735 0.000
48.00 48.00 20.94 3.849 3.935 2-M2c 3.000 2.247 2.256 2.020 8.417 0.000
56.00 56.00 21.50 4.490 4.488 7-M2c 3.000 2.421 2.427 2.020 9.132 0.000
64.00 64.00 22.25 5.240 5.143 7-M2c 3.000 2.550 2.568 2.020 9.971 0.000
72.00 72.00 23.11 6.104 5.826 7-M2c 3.000 2.678 2.685 2.020 10.795 0.000
80.00 80.00 24.09 7.080 6.600 7-M2c 3.000 2.807 2.775 2.020 11.778 0.000
83.00 83.00 24.48 7.474 6.904 7-M2c 3.000 2.855 2.883 2.020 11.985 0.000
96.00 83.99 24.62 7.607 7.007 7-M2c 3.000 2.871 2.915 2.020 12.061 0.000
104.00 84.33 24.66 7.653 7.042 7-M2c 3.000 2.876 2.922 2.020 12.094 0.000
112.00 84.63 24.70 7.693 7.072 7-M2c 3.000 2.881 2.927 2.020 12.126 0.000
120.00 84.90 24.74 7.730 7.100 7-M2c 3.000 2.885 2.932 2.020 12.155 0.000

Culvert Performance Curve Plot: Culvert 13

Water Surface Profile Plot for Culvert: Culvert 13
Site Data - Culvert 13
Site Data Option: Culvert Invert Data
Inlet Station: 0.00 ft
Inlet Elevation: 17.01 ft
Outlet Station: 60.00 ft
Outlet Elevation: 16.95 ft
Number of Barrels: 1
Culvert Data Summary - Culvert 13
Barrel Shape: Circular
Barrel Diameter: 3.00 ft
Barrel Material: Concrete
Embedment: 0.00 in
Barrel Manning's n: 0.0120
Inlet Type: Conventional
Inlet Edge Condition: Square Edge with Headwall
Inlet Depression: NONE

Table 3 - Downstream Channel Rating Curve (Crossing: Culvert 13 - 36" RCP)
Tailwater Channel Data - Culvert 13 - 36" RCP
Tailwater Channel Option: Enter Constant Tailwater Elevation
Constant Tailwater Elevation: 19.00 ft
Roadway Data for Crossing: Culvert 13 - 36" RCP
Roadway Profile Shape: Constant Roadway Elevation
Crest Length: 100.00 ft
Crest Elevation: 24.50 ft
Roadway Surface: Paved
Roadway Top Width: 32.00 ft
Flow (cfs) Water Surface Elev (ft) Depth (ft)
40.00 19.00 2.02 48.00 19.00 2.02 56.00 19.00 2.02 64.00 19.00 2.02 72.00 19.00 2.02 80.00 19.00 2.02 83.00 19.00 2.02 96.00 19.00 2.02 104.00 19.00 2.02 112.00 19.00 2.02 120.00 19.00 2.02

HY-8 Culvert Analysis Report

Table 1 - Summary of Culvert Flows at Crossing: Culvert 14 - 24" RCP
Headwater Elevation (ft) Total Discharge (cfs)
Culvert 14 Discharge (cfs)
Roadway Discharge (cfs) Iterations
22.64 3.00 3.00 0.00 1 22.68 4.30 4.30 0.00 1 22.75 5.60 5.60 0.00 1 22.76 6.90 6.90 0.00 1 22.83 8.20 8.20 0.00 1 22.90 9.50 9.50 0.00 1 22.94 10.00 10.00 0.00 1 23.09 12.10 12.10 0.00 1 23.20 13.40 13.40 0.00 1 23.32 14.70 14.70 0.00 1 23.46 16.00 16.00 0.00 1 25.00 26.75 26.75 0.00 Overtopping
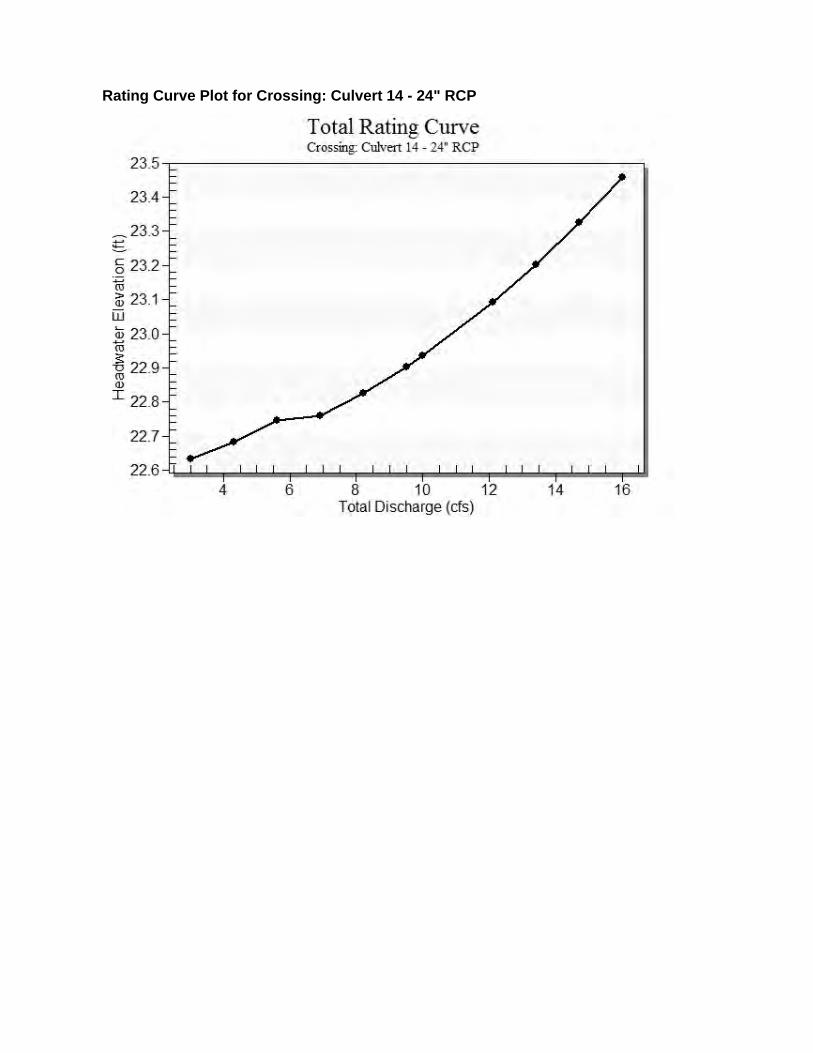
Rating Curve Plot for Crossing: Culvert 14 - 24" RCP

Table 2 - Culvert Summary Table: Culvert 14
********************************************************************************
Inlet Elevation (invert): 20.70 ft, Outlet Elevation (invert): 20.59 ft
Culvert Length: 60.00 ft, Culvert Slope: 0.0018
********************************************************************************
Total Discharge
(cfs) Culvert
Discharge (cfs)
Headwater Elevation
(ft) Inlet Control
Depth (ft) Outlet Control
Depth (ft) Flow Type
Normal Depth (ft)
Critical Depth (ft)
Outlet Depth (ft)
Tailwater Depth (ft)
Outlet Velocity
(ft/s) Tailwater Velocity
(ft/s) 3.00 3.00 22.64 0.832 1.935 3-M1f 0.727 0.604 2.000 2.000 0.955 0.000
4.30 4.30 22.68 1.009 1.982 3-M1f 0.888 0.722 2.000 2.000 1.369 0.000
5.60 5.60 22.75 1.193 2.045 3-M1f 1.038 0.833 2.000 2.000 1.783 0.000
6.90 6.90 22.76 1.357 2.060 4-FFf 1.182 0.927 2.000 2.000 2.196 0.000
8.20 8.20 22.83 1.508 2.125 4-FFf 1.331 1.018 2.000 2.000 2.610 0.000
9.50 9.50 22.90 1.651 2.203 4-FFf 1.495 1.097 2.000 2.000 3.024 0.000
10.00 10.00 22.94 1.705 2.235 4-FFf 1.562 1.128 2.000 2.000 3.183 0.000
12.10 12.10 23.09 1.929 2.391 4-FFf 2.000 1.247 2.000 2.000 3.852 0.000
13.40 13.40 23.20 2.072 2.502 4-FFf 2.000 1.313 2.000 2.000 4.265 0.000
14.70 14.70 23.32 2.221 2.625 4-FFf 2.000 1.380 2.000 2.000 4.679 0.000
16.00 16.00 23.46 2.380 2.758 4-FFf 2.000 1.438 2.000 2.000 5.093 0.000

Culvert Performance Curve Plot: Culvert 14

Water Surface Profile Plot for Culvert: Culvert 14
Site Data - Culvert 14
Site Data Option: Culvert Invert Data
Inlet Station: 0.00 ft
Inlet Elevation: 20.70 ft
Outlet Station: 60.00 ft
Outlet Elevation: 20.59 ft
Number of Barrels: 1
Culvert Data Summary - Culvert 14
Barrel Shape: Circular
Barrel Diameter: 2.00 ft
Barrel Material: Concrete
Embedment: 0.00 in
Barrel Manning's n: 0.0120
Inlet Type: Conventional
Inlet Edge Condition: Square Edge with Headwall
Inlet Depression: NONE

Table 3 - Downstream Channel Rating Curve (Crossing: Culvert 14 - 24" RCP)
Tailwater Channel Data - Culvert 14 - 24" RCP
Tailwater Channel Option: Enter Constant Tailwater Elevation
Constant Tailwater Elevation: 22.60 ft
Roadway Data for Crossing: Culvert 14 - 24" RCP
Roadway Profile Shape: Constant Roadway Elevation
Crest Length: 100.00 ft
Crest Elevation: 25.00 ft
Roadway Surface: Paved
Roadway Top Width: 32.00 ft
Flow (cfs) Water Surface Elev (ft) Depth (ft)
3.00 22.60 2.00 4.30 22.60 2.00 5.60 22.60 2.00 6.90 22.60 2.00 8.20 22.60 2.00 9.50 22.60 2.00 10.00 22.60 2.00 12.10 22.60 2.00 13.40 22.60 2.00 14.70 22.60 2.00 16.00 22.60 2.00

APPENDIX C
STRAIGHT LINE DIAGRAMS

INTERIM REVISIONS
5 YR INV SLD REV BMP EMP INV SLD REV
DATE
BY
0 1 2 3 4
ROADWAY
FEATURES
ROADWAY
COMPOSITION
HORIZONTAL
ALIGNMENT
STRUCTURE
DESCRIPTION
DISTRICT USE
SIS
FUN CLASS
2.4
57
28/FC-3
28/FC-3
2.4
57 URBAN MINOR ARTERIAL
2.4
57
x
x
x
x
x
x
EN
D O
F RIG
HT O
F W
AY
2.4
57
A
2.472
A
2.4
78
A
2.4
78
2.5
22
2.5
48
137’
UP
Diamond
A
2.585
A
A
A
2.6
95
A
2.6
95
A
2.7
96
2.8
66
PIG
EO
N A
VE A
3.0
30
3.0
52
28/FC-2
28/FC-2
BA
BC
OC
K S
T
A
3.0
60
A
3.0
60
3.0
60
3.2
18
28/FC-3
28/FC-3
EN
TE
RP
RIS
E A
VE
A
3.2
58
3.3
90
1-2
4"
X 4
5’ C
C
A
3.4
24
A
3.4
84
3.5
23
UN
SIG
NE
D
A
3.5
24
3.5
34
1-8’ X 4’ X 4
6’ C
BC
3.5
44
x
x
x
x
x
x
3.5
65
28/FC-3
28/FC-3
ME
DP
LE
X P
KW
Y A
3.6
47
HO
SPIT
AL E
NT A
3.8
03
28/FC-3
28/FC-3
3.8
90
1-1
0’ X 3’ X 4
6’ C
BC
A
3.9
76
4 5 6 7 8
ROADWAY
FEATURES
ROADWAY
COMPOSITION
HORIZONTAL
ALIGNMENT
STRUCTURE
DESCRIPTION
DISTRICT USE
SIS
FUN CLASS
28/FC-3
28/FC-3
URBAN MINOR ARTERIAL
4.0
40
1-2
4"
X 4
5’ C
C
WE
BB
ER R
D
A
4.0
44
4.3
10
2-8’ X 3’ X 4
6’ C
BC
4.4
20
1-3
0"
X 4
5’ C
C
EV
A L
N
4.5
42
4.5
47
1-8’ X 4’ X 4
6’ C
BC
SA
ND
Y C
RE
EK L
N
4.6
69
4.7
74
1-2
4"
X 4
5’ C
C
ALE
XA
ND
ER L
N
4.9
12
4.9
93
1-1
0’ X 5’ X 4
6’ C
BC
A
A
5.0
43
WEIR S
T
O
5.1
06
GIL
MO
RE S
T A
5.1
66
SHIF
LE
TT L
N
5.3
30
A
5.3
84
GL
ATTE
R R
DA
5.5
11
5.5
69
1-2
4"
X 4
5’ C
C5.6
01
5.9
22
1-2
4"
X 4
5’ C
C
6.0
34
1-2
4"
X 4
5’ C
C
A
A
6.087
A
6.145
FL
OR
EN
CE S
TA
6.2
02
6.3
63
1-2
4"
X 4
5’ C
C6.372
PIN
E S
T6.430
O6.5
32
A
272149
N
6.5
41
6.5
79
A
A
6.6
98
End MP: 6.698
NET ROADWAY ID LENGTH: 4.241
106.0’ - 72.0’
6 - 12.0’ RDWY
22.0’ CB<6/LWN MED
2 - 2.0’ C&G INSHLD1
2 - 4.0’ PVD SHLD1
2 - 2.0’ C&G SHLD2
76.0’ - 52.0’
4 - 13.0’ RDWY
20.0’ CB<6/LWN MED
2 - 2.0’ C&G INSHLD1
2 - 2.0’ C&G SHLD1
INSIDE CITY & URBAN
Malabar, Palm Bay-Melbourne507
CO
RE
Y
RD
MARIE
ST
RAIL
RO
AD
AV
E
5
5
S DIXIE
HW
Y
DISTRICT
5
3:30:00
PM
H:\
DeLand\
User
Data\
MT
510
RM\
DG
N’s\7018
0-
2010.dgn
6/15/2010
PRIN
TE
D:
STRAIGHT LINE DIAGRAM OF ROAD INVENTORYFLORIDA DEPARTMENT OF TRANSPORTATION
INT. or US ROUTE NO STATE ROAD NO.COUNTY
SR 514 1 1 OF
SHEET NO.:
70 180 000 BREVARD
ROADWAY ID
514
514
9
INTERSTATE
95
B=N89^24’50"E B=N89^26’50"E
=0^02’00"
PI=3.034
B=N89^07’50"E
=0^19’00"
PI=5.039
=22^22’00"D=4^00’00 00
PT=5.555PI=5.519PC=5.465
B=N66^45’50"E
=0^48’00"
PI=6.580
MALABAR
PALMBAY
RC
SR 5 / S DIXIE H
WY
INVENTORY
DIRECTIONE
LA
NE WI
DT
HS A
RE A
VE
RA
GE
D
CURVE DATA IS NOT FIELD VERIFIED
INVENTORY
DIRECTIONE
LA
NE WI
DT
HS A
RE A
VE
RA
GE
D
CURVE DATA IS NOT FIELD VERIFIED
UN
SIG
NE
D
TA
NG
O A
VE
INTE
RS
TA
TE C
T
RA
MP
70220114
LE
G
RA
MP 7
0220071
RA
MP
70220015
I-95 / S
R 9
2.5
85
LE
G
0427
INSIDE CITY & URBAN
Palm Bay, Palm Bay-Melbourne
|<=MALABAR RD
|<SR 514
BA
BC
OC
K S
T
VIL
LA N
UE
VA A
VE
0379
CA
NO
VA S
T
3.7
63
EN
CH
AN
TE
D L
AK
ES
3.9
46
36.0’ - 24.0’
2 - 12.0’ RDWY
2 - 4.0’ PVD SHLD1
2 - 2.0’ LWN SHLD2
48.0’ - 24.0’
2 - 12.0’ RDWY
12.0’ PTD MED
2 - 4.0’ PVD SHLD1
2 - 2.0’ LWN SHLD2
3.2
18
A
A
A
A
EN
T M
AL
AB
AR P
AR
K
0127 1001
BLA
NC
HE
ST
MA
RS
HAL D
R A
A
05/11/10 06/15/10
MR
3.0
44
2-7’ X 5’ X 1
18’ C
BC
0202
2.5
90
RA
MP 7
0220072
2.4
57
