flooding report (final) - valleywater.org flood report.pdfflooding report (final) coyote creek, uvas...
TRANSCRIPT
DISTRICT BOARD OF DIRECTORS John L. Varela, Chair District 1 Nai Hsueh District 5 Barbara F. Keegan District 2 Tony Estremera District 6 Richard P. Santos, Vice Chair District 3 Gary Kremen District 7 Linda J. LeZotte District 4
FLOODING REPORT (FINAL)
COYOTE CREEK, UVAS CREEK, SAN FRANCISQUITO CREEK, AND WEST LITTLE LLAGAS CREEK
JANAURY AND FEBRUARY OF 2017
Prepared by the Hydraulics, Hydrology, and Geomorphology Unit November 2017
CONTENTS WINTER SEASON SUMMARY ......................................................................................................................... 1
JANUARY 6TH THRU 9TH STORM ..................................................................................................................... 2
OVERVIEW & WEATHER ................................................................................................................................ 2
FLOODING – JANUARY 8th ............................................................................................................................. 4
UVAS CREEK .............................................................................................................................................. 4
WEST LITTLE LLAGAS CREEK ...................................................................................................................... 6
FEBRUARY 6th AND 7th STORM ...................................................................................................................... 9
OVERVIEW & WEATHER ................................................................................................................................ 9
FLOODING – FEBRUARY 7th ......................................................................................................................... 10
SAN FRANCISQUITO CREEK ..................................................................................................................... 10
FEBRUARY 20th AND 21st STORM ................................................................................................................ 12
OVERVIEW & WEATHER .............................................................................................................................. 12
FLOODING – FEBRUARY 21ST (PRESIDENT’S DAY FLOOD) ........................................................................... 16
COYOTE CREEK ........................................................................................................................................ 16
UPPER PENITENCIA CREEK ...................................................................................................................... 30
POST FLOOD DAMAGES .......................................................................................................................... 31
IMPACTS TO DISTRICT WATER UTILITY FACILITIES ...................................................................................... 32
JANUARY 2017 ........................................................................................................................................ 32
FEBRUARY 2017 ...................................................................................................................................... 32
APPENDIX A: PRELIMINARY FLOOD INUNDATION MAPS ........................................................................... 33
APPENDIX B: PRESIDENT’S DAY FLOOD PUBLIC OUTREACH MEETING ....................................................... 34
APPENDIX C: DAMAGE ASSESSMENT .......................................................................................................... 35

Table 1: Notable Storm Systems in 2017 ...................................................................................................... 1 Table 2: Uvas Canyon Park Rain Gauge Stats (1/7 - 1/9) .............................................................................. 2 Table 3: West Little Llagas Rain Gauge Stats (1/7 - 1/9) ............................................................................... 2 Table 4: District Rain Gauge Stats (1/6 - 1/9) ............................................................................................... 1 Table 5: Peak Flow - Uvas Creek @ Luchessa Avenue .................................................................................. 4 Table 6: Peak Flow - West Little Llagas Creek @ Edmundson Avenue ......................................................... 6 Table 7: Wunderlich Rain Gauge Stats (2/6 - 2/7) ........................................................................................ 9 Table 9: Peak Flow - USGS Gauge @ Stanford ............................................................................................ 10 Table 10: Coe Park Rain Gauge Stats (2/20 - 2/21) ..................................................................................... 12 Table 11: District Rain Gauge Stats (2/20 - 2/21) ....................................................................................... 13 Table 12: Peak Flow - Coyote Creek Stream Gauges .................................................................................. 16
Figure 1: Uvas Canyon County Park Rainfall (1/7 - 1/9) ................................................................................ 3 Figure 2: West Little Llagas Rainfall (1/7 - 1/9) ............................................................................................. 3 Figure 3: County Rainfall Totals (1/6 - 1/9) ................................................................................................... 3 Figure 4: Picture - Flooding from Uvas Creek at Monterey Frontage Road near US-101 ............................. 4 Figure 5: Preliminary Uvas Creek @ Luchessa Hydrograph. Note Bad Data above 7,000cfs. ...................... 5 Figure 6: Picture - Llagas Road, looking North along Carriage Drive in Morgan Hill..................................... 6 Figure 7: Picture - Main Street and Hale Avenue in Morgan Hill .................................................................. 7 Figure 8: Preliminary West Little Llagas Creek @ Edmundson Avenue Hydrograph .................................... 8 Figure 9: Wunderlich (San Francisquito) Rainfall (2/6 - 2/7) ........................................................................ 9 Figure 10: Picture - San Francisquito Creek overflowing into Yeaman's Auto Body Shop ......................... 10 Figure 11: Preliminary San Francisquito USGS Gauge @ Stanford Hydrograph ......................................... 11 Figure 12: Coe Park (Coyote) Rainfall (2/20 - 2/21) .................................................................................... 12 Figure 13: County Precipitation Totals (2/20 - 2/21) .................................................................................. 15 Figure 14: Preliminary Reservoir Inflow and Outflow Hydrographs ........................................................... 17 Figure 15: Preminary Coyote Creek Hydrographs ...................................................................................... 18 Figure 16: Picture - Coyote Creek Flooding at Malaguerra and Sycamore Avenue ...... Error! Bookmark not defined. Figure 17: Picture - Coyote Creek Overflow into Abandoned Coyote Canal .............................................. 20 Figure 18: Coyote Canal Flooding on US-101 Northbound ......................................................................... 20 Figure 19: Picture - Coyote Creek overtopping Coyote Creek Drive Bridge (Looking East) ........................ 21 Figure 20: Picture - Flooding @ Needles Drive and Welch Avenue in the Rock Springs Neighborhood .... 22 Figure 21: Picture - Flooding @ Senter Road and Nordale Avenue in the Rock Springs Neighborhood .... 22 Figure 22: Picture - Flooding @ the Intersection of East Williams and South 16th Street ......................... 24 Figure 23: Picture - Residents near East Williams Street ............................................................................ 25 Figure 24: Commercial Buildings Flooded downstream Berryessa Road ................................................... 26 Figure 25: Coyote Creek spilling into South Bay Mobile Home Park .......................................................... 29

1
WINTER SEASON SUMMARY Overall, the 2016-2017 winter rainy season experienced very high rainfall amounts compared with the seasonal average. Much of the state experienced heavy rainfall, with many places in the Sierra Nevada reporting in record snowfall. At the end of February 2017, the California State Meteorologist reported1 that statewide:
- Precipitation is 190% of average - Snow Water Content is 185% of average - Runoff is 270% of average - Reservoir Storage is 120% of average
The fall of 2016 started wet, with several small storms and a couple of medium sized storms. Going into 2017, most rain gauges already were recording total rainfall depths well over average amounts. Uvas Reservoir was full going into the new year.
January and February of 2017 were extremely wet, with storm systems constantly moving through the San Francisco Bay Area. These storm systems kept the soil saturated, and frequently consisted of several discrete rainfall events over the course of a week. Four notable storm systems are listed below in Table 1, along with significant flooding events and reservoir spill events. Many of these reservoirs spilled on several or all these storm events. This report focuses on two of the major flood events in 2017.
Table 1: Notable Storm Systems in 2017
Dates Major Flood Events Reservoir Spills 1/7 – 1/11 Uvas, West Little Llagas Stevens Creek, Lexington, Almaden, Chesbro, Uvas, Coyote 1/17 – 1/23 Lexington, Almaden, Uvas, Coyote 2/1 – 2/10 San Francisquito Stevens Creek, Lexington, Almaden, Chesbro, Uvas, Coyote 2/15 – 2/21 Coyote, West Little
Llagas Stevens Creek, Lexington, Almaden, Uvas, Coyote, Anderson
1 California Department of Water Resources. California Monthly Climate Summary, February 2017. http://www.water.ca.gov/floodmgmt/hafoo/csc/docs/California_Climate_Summary_022017.pdf.
2
JANUARY 6TH THRU 9TH STORM
OVERVIEW & WEATHER A slow moving atmospheric river delivered heavy rainfall to Northern California, resulting in localized flooding and the opening of the Santa Clara Valley Water District’s Emergency Operational Center (EOC) on Sunday January 8th, 2017 and again on January 10th, 2017. Precipitation started falling on Santa Clara County roughly 2 days prior to the January 8th, 2017 opening of the District’s EOC.
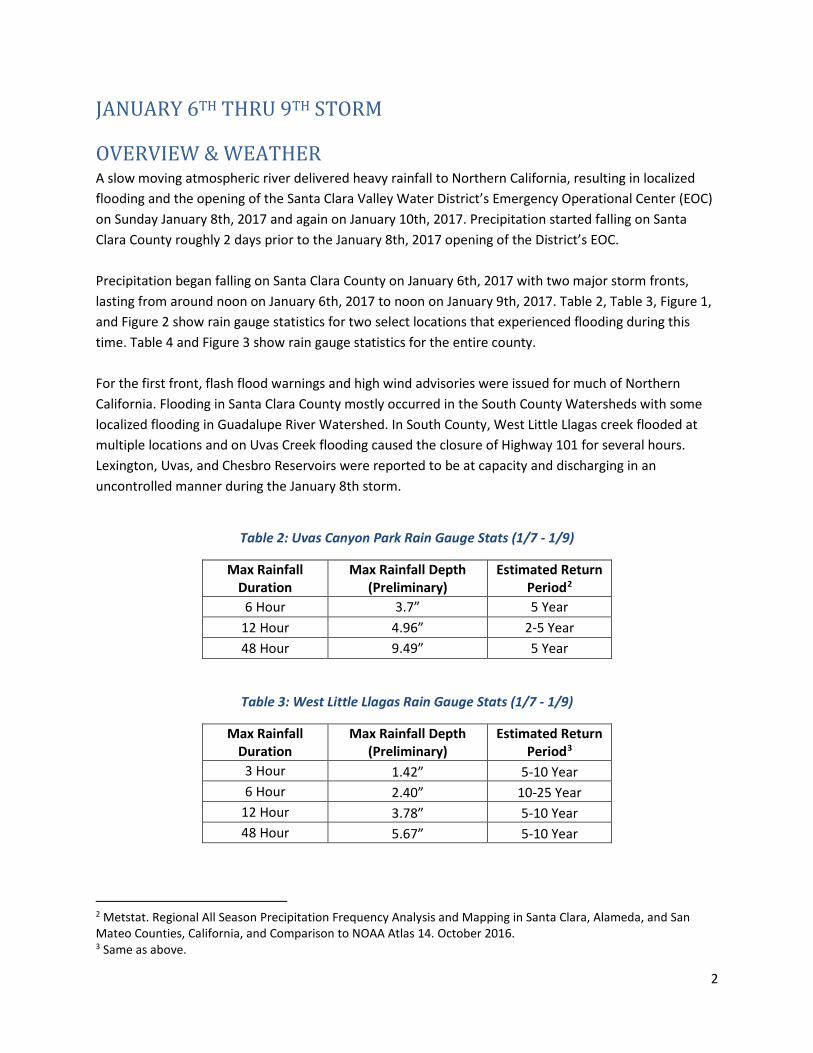
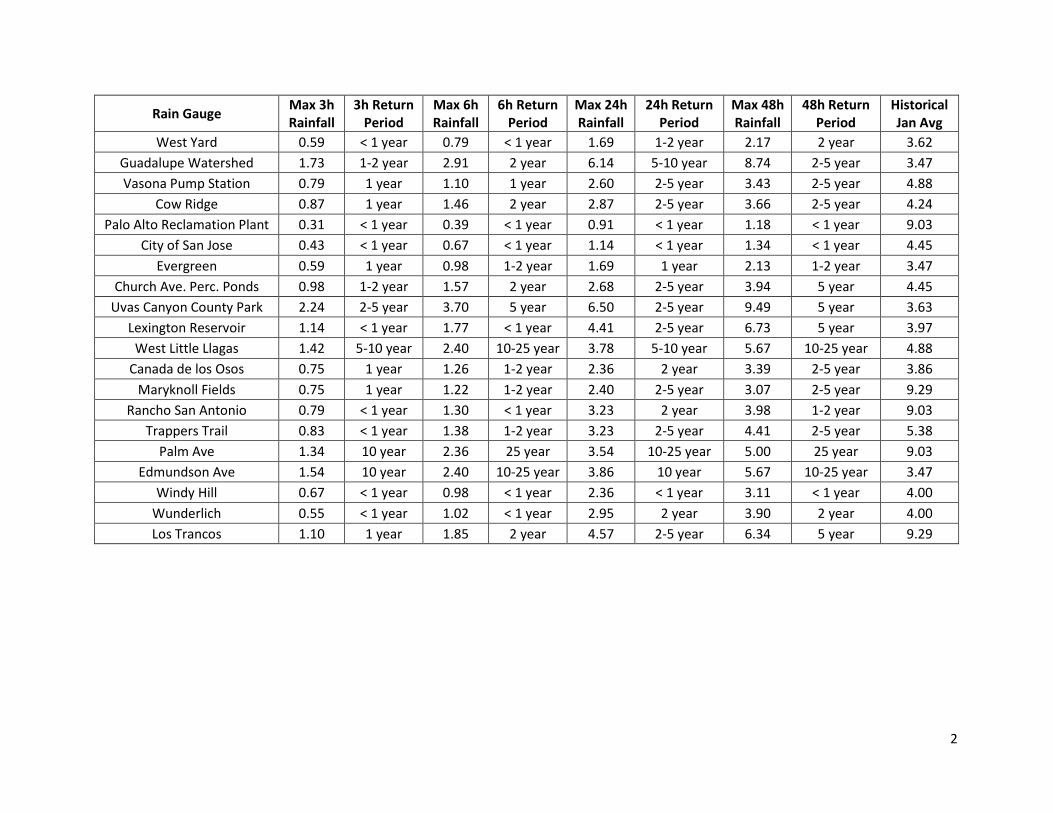
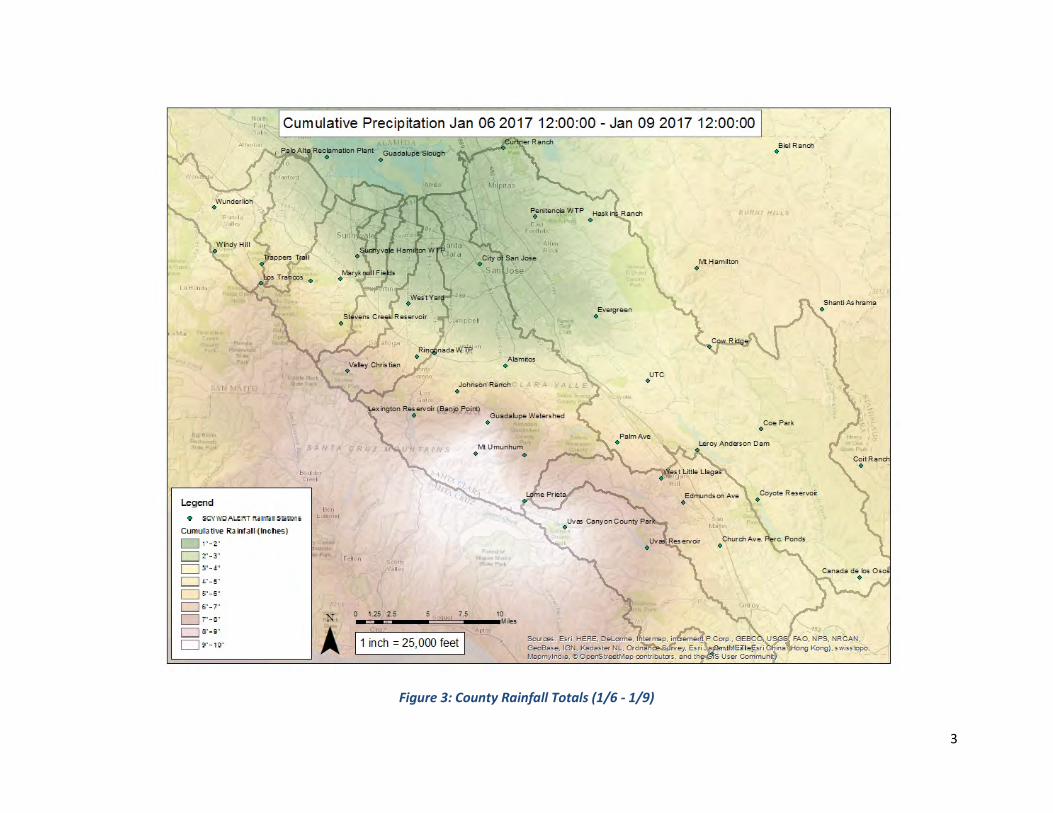
Precipitation began falling on Santa Clara County on January 6th, 2017 with two major storm fronts, lasting from around noon on January 6th, 2017 to noon on January 9th, 2017. Table 2, Table 3, Figure 1, and Figure 2 show rain gauge statistics for two select locations that experienced flooding during this time. Table 4 and Figure 3 show rain gauge statistics for the entire county. For the first front, flash flood warnings and high wind advisories were issued for much of Northern California. Flooding in Santa Clara County mostly occurred in the South County Watersheds with some localized flooding in Guadalupe River Watershed. In South County, West Little Llagas creek flooded at multiple locations and on Uvas Creek flooding caused the closure of Highway 101 for several hours. Lexington, Uvas, and Chesbro Reservoirs were reported to be at capacity and discharging in an uncontrolled manner during the January 8th storm.
Table 2: Uvas Canyon Park Rain Gauge Stats (1/7 - 1/9)
Max Rainfall Duration
Max Rainfall Depth (Preliminary)
Estimated Return Period2
6 Hour 3.7” 5 Year 12 Hour 4.96” 2-5 Year 48 Hour 9.49” 5 Year
Table 3: West Little Llagas Rain Gauge Stats (1/7 - 1/9)
Max Rainfall Duration
Max Rainfall Depth (Preliminary)
Estimated Return Period3
3 Hour 1.42” 5-10 Year 6 Hour 2.40” 10-25 Year
12 Hour 3.78” 5-10 Year 48 Hour 5.67” 5-10 Year
2 Metstat. Regional All Season Precipitation Frequency Analysis and Mapping in Santa Clara, Alameda, and San Mateo Counties, California, and Comparison to NOAA Atlas 14. October 2016. 3 Same as above.

3
Figure 1: Uvas Canyon County Park Rainfall (1/7 - 1/9)
Figure 2: West Little Llagas Rainfall (1/7 - 1/9)
0
0.1
0.2
0.3
0.4
0.5
0.6
0.7
0.8
0.9
1
Incr
emen
tal R
anifa
ll (In
ches
)
0
0.1
0.2
0.3
0.4
0.5
0.6
Incr
emen
tal R
anifa
ll (In
ches
)

1
Table 4: District Rain Gauge Stats (1/6 - 1/9)
Rain Gauge Max 3h Rainfall
3h Return Period4
Max 6h Rainfall
6h Return Period
Max 24h Rainfall
24h Return Period
Max 48h Rainfall
48h Return Period
Historical Jan Avg5
Alamitos 0.83 1-2 year 1.18 1-2 year 1.93 2 year 2.60 2-5 year 4.05 Almaden Watershed 1.57 2-5 year 2.60 2-5 year 4.88 2-5 year 6.85 5 year 6.86
Biel Ranch 0.91 2-5 year 1.30 2-5 year 2.32 2 year 3.35 5 year 3.86 Castro Valley 1.02 1-2 year 1.34 1 year 2.40 1-2 year 3.90 2-5 year 4.45
Guadalupe Slough 0.31 < 1 year 0.43 < 1 year 0.87 < 1 year 1.22 < 1 year 3.47 Coe Park 0.79 < 1 year 1.42 1 year 2.44 1 year 3.54 1-2 year 4.47
Coit Ranch 0.91 1 year 1.54 1-2 year 2.68 2 year 4.49 5 year 4.24 Coyote Reservoir 1.06 2 year 1.61 2-5 year 2.44 2 year 3.78 2-5 year 4.34
Curtner Ranch 0.35 < 1 year 0.51 < 1 year 1.06 < 1 year 1.50 < 1 year 3.47 Haskins Ranch 0.47 < 1 year 0.75 < 1 year 1.54 < 1 year 2.17 1 year 4.03 Johnson Ranch 1.02 1-2 year 1.54 1-2 year 3.23 2-5 year 4.45 2-5 year 5.37
Leroy Anderson Dam 1.06 2 year 1.77 5 year 2.83 2-5 year 4.02 5 year 3.97 Lome Prieta 2.01 5-10 year 3.19 5-10 year 6.18 5 year 8.82 10 year 9.29
Sunnyvale Hamilton WTP 0.55 < 1 year 0.87 < 1 year 1.54 1 year 1.93 1 year 5.38 Mt Hamilton 0.98 1 year 1.46 1-2 year 2.99 2 year 4.06 2-5 year 4.12
Mt Umunhum 1.89 2-5 year 2.95 2-5 year 6.34 2-5 year 9.96 10-25 year 9.03 Valley Christian 1.38 1 year 2.20 1 year 5.08 2-5 year 7.64 2-5 year 4.88 Rinconada WTP 0.87 1 year 1.30 1 year 3.19 2-5 year 4.17 2-5 year 4.36 Shanti Ashrama 1.02 2 year 1.65 2-5 year 2.87 2-5 year 4.29 5 year 3.58 Penitencia WTP 0.51 < 1 year 0.67 < 1 year 1.34 1 year 1.73 1-2 year 9.03
Stevens Creek Reservoir 0.87 < 1 year 1.46 < 1 year 3.15 1-2 year 4.41 2 year 5.38 UTC 0.75 1 year 1.22 2 year 2.28 2-5 year 3.03 2-5 year 3.63
Uvas Reservoir 1.85 5-10 year 2.91 5-10 year 4.72 5 year 7.05 5-10 year 4.88
4 Metstat. Regional All Season Precipitation Frequency Analysis and Mapping in Santa Clara, Alameda, and San Mateo Counties, California, and Comparison to NOAA Atlas 14. October 2016. 5 Based off Oregon State University PRISM Mean Annual Precipitation Data.
2
Rain Gauge Max 3h Rainfall
3h Return Period
Max 6h Rainfall
6h Return Period
Max 24h Rainfall
24h Return Period
Max 48h Rainfall
48h Return Period
Historical Jan Avg
West Yard 0.59 < 1 year 0.79 < 1 year 1.69 1-2 year 2.17 2 year 3.62 Guadalupe Watershed 1.73 1-2 year 2.91 2 year 6.14 5-10 year 8.74 2-5 year 3.47 Vasona Pump Station 0.79 1 year 1.10 1 year 2.60 2-5 year 3.43 2-5 year 4.88
Cow Ridge 0.87 1 year 1.46 2 year 2.87 2-5 year 3.66 2-5 year 4.24 Palo Alto Reclamation Plant 0.31 < 1 year 0.39 < 1 year 0.91 < 1 year 1.18 < 1 year 9.03
City of San Jose 0.43 < 1 year 0.67 < 1 year 1.14 < 1 year 1.34 < 1 year 4.45 Evergreen 0.59 1 year 0.98 1-2 year 1.69 1 year 2.13 1-2 year 3.47
Church Ave. Perc. Ponds 0.98 1-2 year 1.57 2 year 2.68 2-5 year 3.94 5 year 4.45 Uvas Canyon County Park 2.24 2-5 year 3.70 5 year 6.50 2-5 year 9.49 5 year 3.63
Lexington Reservoir 1.14 < 1 year 1.77 < 1 year 4.41 2-5 year 6.73 5 year 3.97 West Little Llagas 1.42 5-10 year 2.40 10-25 year 3.78 5-10 year 5.67 10-25 year 4.88
Canada de los Osos 0.75 1 year 1.26 1-2 year 2.36 2 year 3.39 2-5 year 3.86 Maryknoll Fields 0.75 1 year 1.22 1-2 year 2.40 2-5 year 3.07 2-5 year 9.29
Rancho San Antonio 0.79 < 1 year 1.30 < 1 year 3.23 2 year 3.98 1-2 year 9.03 Trappers Trail 0.83 < 1 year 1.38 1-2 year 3.23 2-5 year 4.41 2-5 year 5.38
Palm Ave 1.34 10 year 2.36 25 year 3.54 10-25 year 5.00 25 year 9.03 Edmundson Ave 1.54 10 year 2.40 10-25 year 3.86 10 year 5.67 10-25 year 3.47
Windy Hill 0.67 < 1 year 0.98 < 1 year 2.36 < 1 year 3.11 < 1 year 4.00 Wunderlich 0.55 < 1 year 1.02 < 1 year 2.95 2 year 3.90 2 year 4.00 Los Trancos 1.10 1 year 1.85 2 year 4.57 2-5 year 6.34 5 year 9.29
3
Figure 3: County Rainfall Totals (1/6 - 1/9)
4
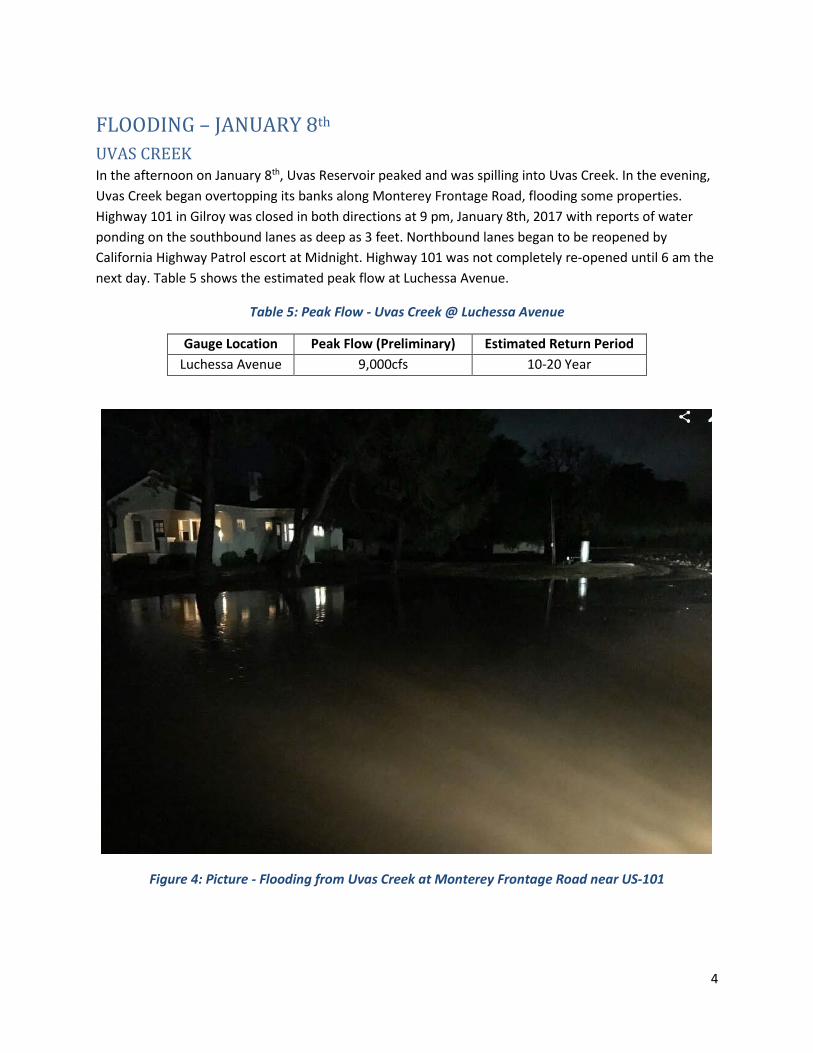
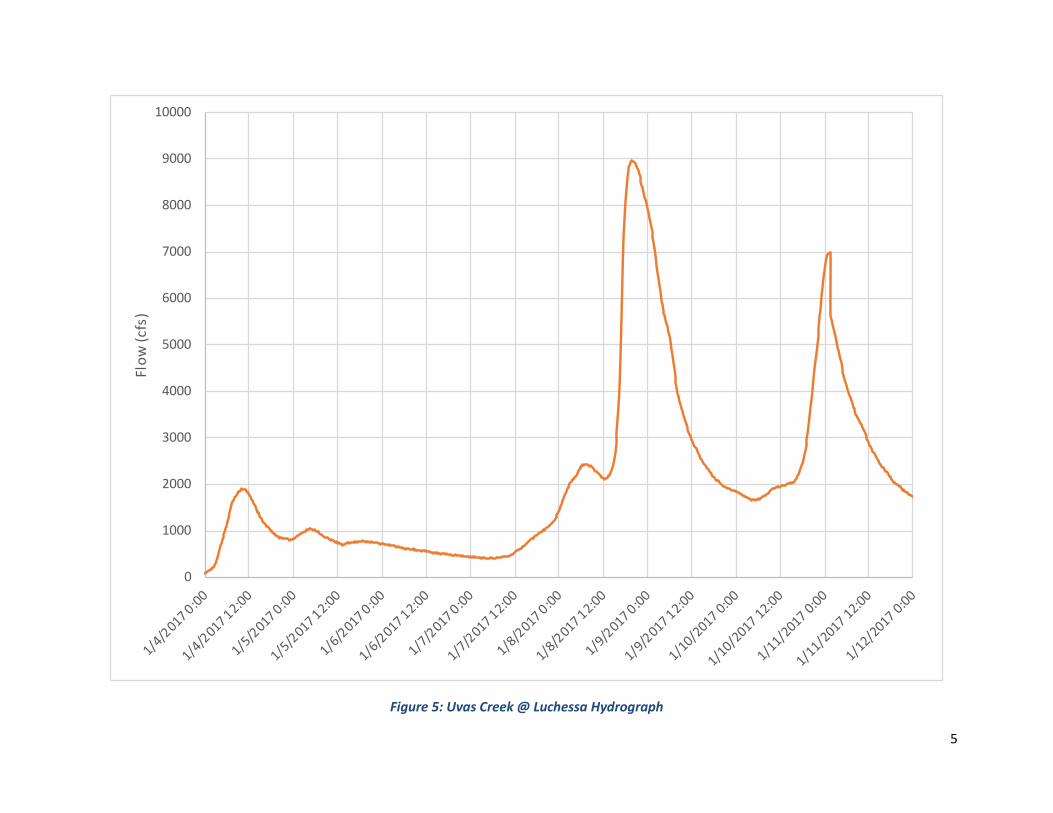
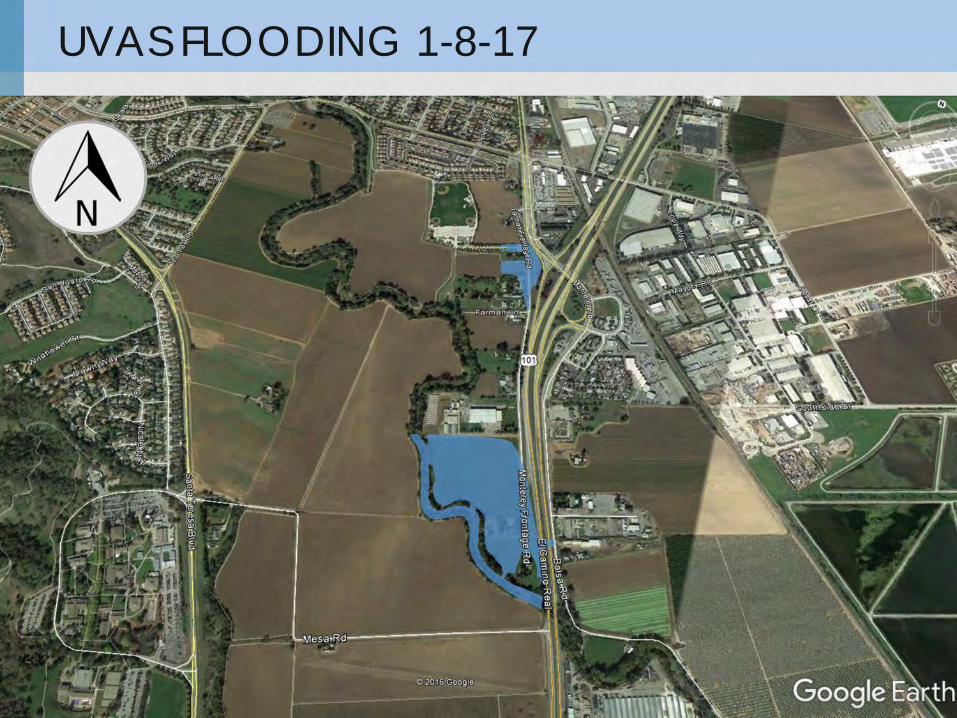
FLOODING – JANUARY 8th UVAS CREEK In the afternoon on January 8th, Uvas Reservoir peaked and was spilling into Uvas Creek. In the evening, Uvas Creek began overtopping its banks along Monterey Frontage Road, flooding some properties. Highway 101 in Gilroy was closed in both directions at 9 pm, January 8th, 2017 with reports of water ponding on the southbound lanes as deep as 3 feet. Northbound lanes began to be reopened by California Highway Patrol escort at Midnight. Highway 101 was not completely re-opened until 6 am the next day. Table 5 shows the estimated peak flow at Luchessa Avenue.
Table 5: Peak Flow - Uvas Creek @ Luchessa Avenue
Gauge Location Peak Flow (Preliminary) Estimated Return Period Luchessa Avenue 9,000cfs 10-20 Year
Figure 4: Picture - Flooding from Uvas Creek at Monterey Frontage Road near US-101
5
Figure 5: Uvas Creek @ Luchessa Hydrograph
0
1000
2000
3000
4000
5000
6000
7000
8000
9000
10000
Flow
(cfs
)

6
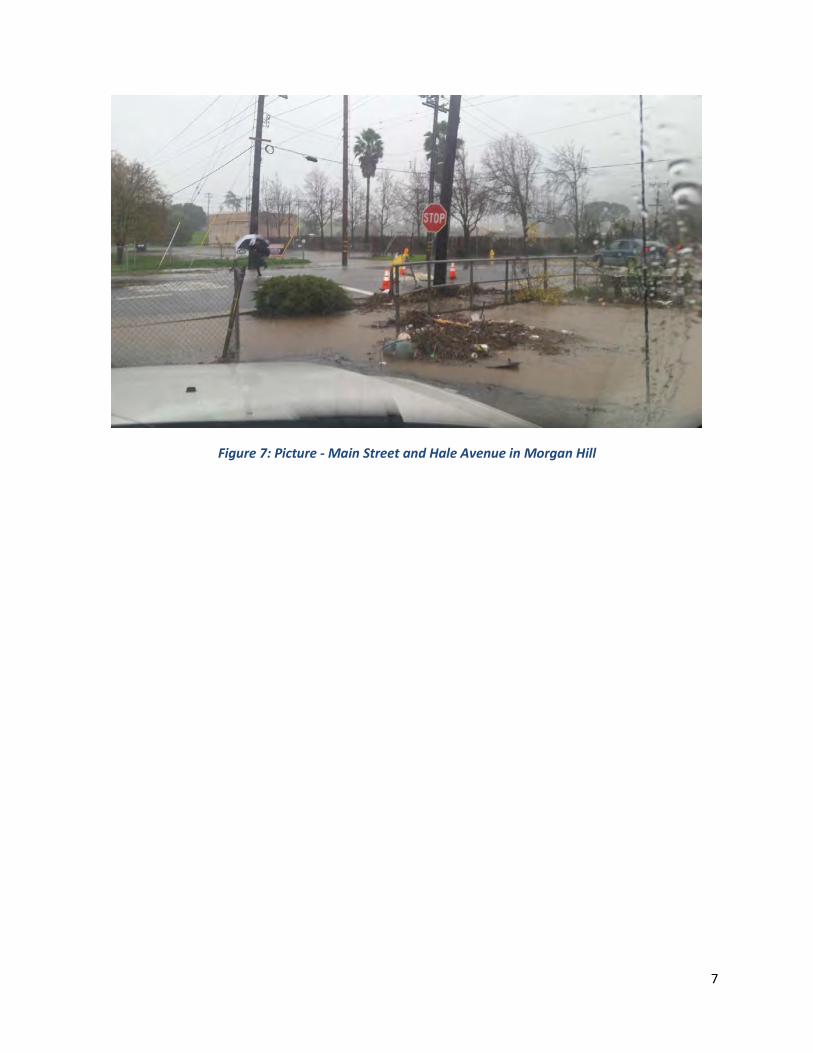
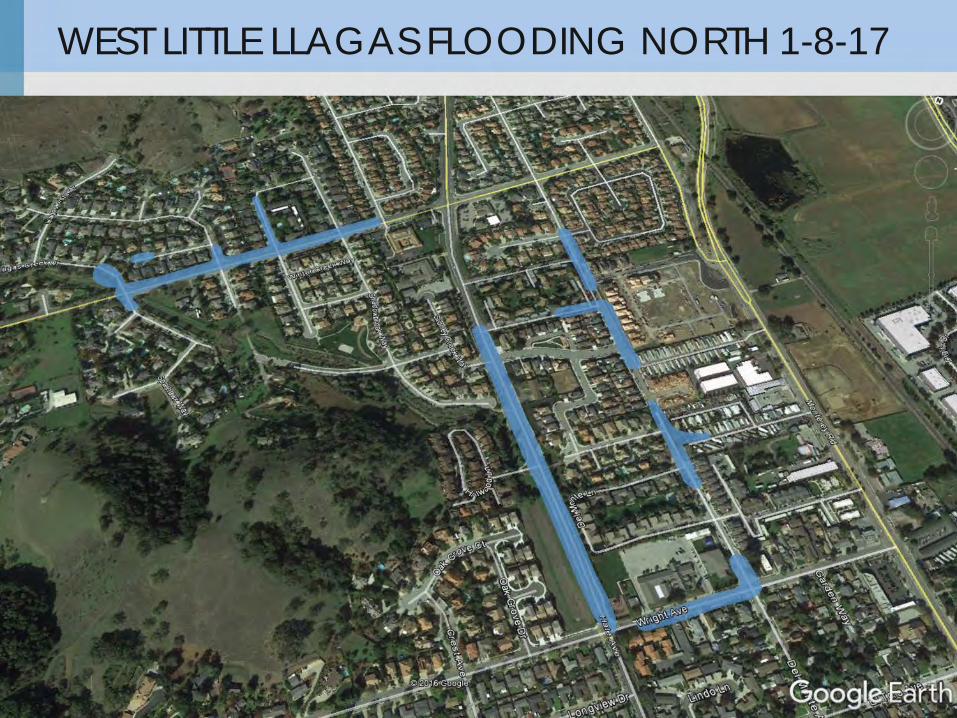
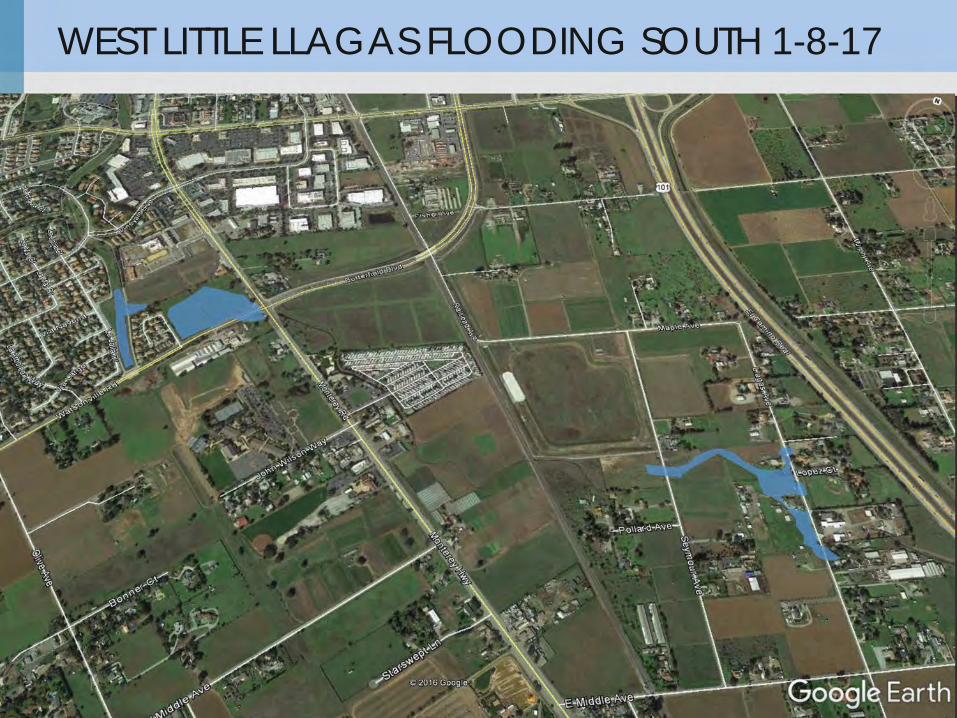
WEST LITTLE LLAGAS CREEK West Little Llagas began flooding upstream of the box culvert that crosses under Llagas Road. Floodwaters were observed to be traveling down Llagas Road (North bound) flooding and disconnecting Llagas Creek Drive, Christeph Drive, Carriage Drive, Shadowbrook Way, and Murphy Springs Drive. Flooding was also observed along Main Street in Morgan Hill, California, between Hale Avenue and Monterey Road. Considerable surcharging was noticed on a manhole cover on Main Street and Hale Avenue in Morgan Hill, California. Watsonville Road was also observed to be flooded at its intersection with Monterey Road on Sunday January 8th, 2017, city crews where present on Watsonville Road, closing it to all traffic due to deep water ponding on the both sides of traffic.
Table 6: Peak Flow - West Little Llagas Creek @ Edmundson Avenue
Gauge Location Peak Flow (Preliminary) Estimated Return Period Edmundson Avenue 350cfs 10 Year6
Figure 6: Picture - Llagas Road, looking North along Carriage Drive in Morgan Hill
6 Very rough estimate. Stream gauge record is short and represents many drought years.
7
Figure 7: Picture - Main Street and Hale Avenue in Morgan Hill

8
Figure 8: Preliminary West Little Llagas Creek @ Edmundson Avenue Hydrograph
0
50
100
150
200
250
300
350
400
Flow
(cfs
)
PRELIMINARY
9
FEBRUARY 6th AND 7th STORM
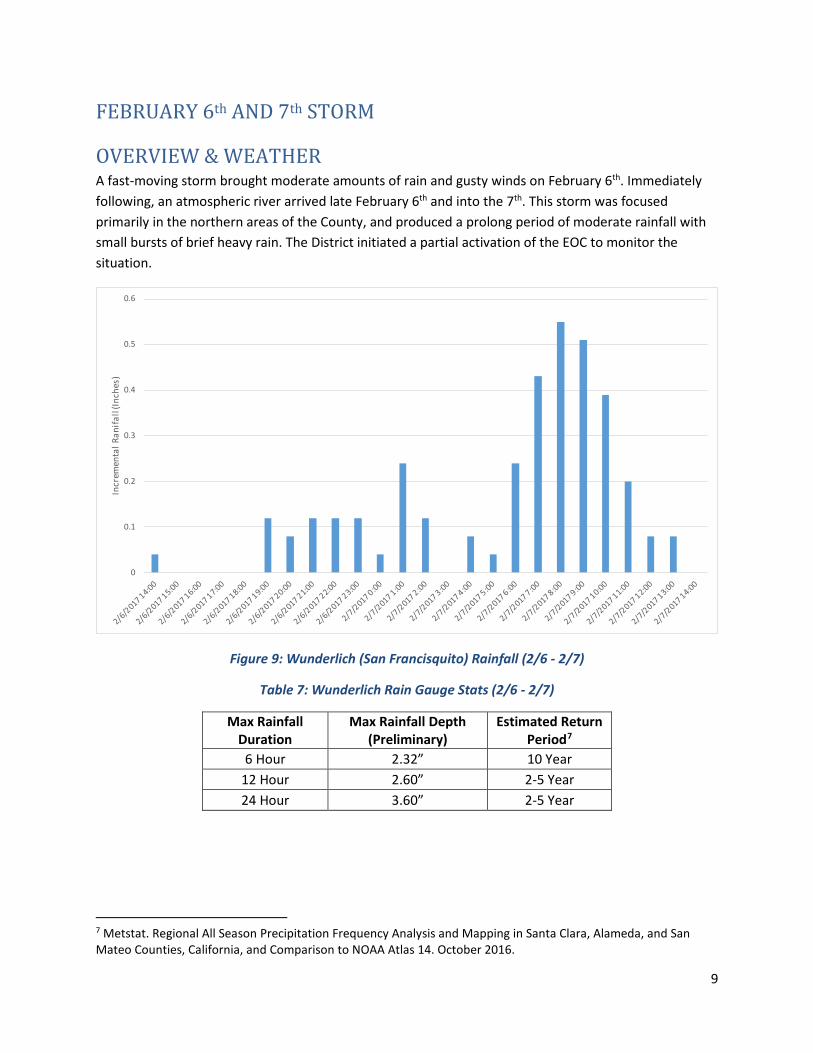
OVERVIEW & WEATHER A fast-moving storm brought moderate amounts of rain and gusty winds on February 6th. Immediately following, an atmospheric river arrived late February 6th and into the 7th. This storm was focused primarily in the northern areas of the County, and produced a prolong period of moderate rainfall with small bursts of brief heavy rain. The District initiated a partial activation of the EOC to monitor the situation.
Figure 9: Wunderlich (San Francisquito) Rainfall (2/6 - 2/7)
Table 7: Wunderlich Rain Gauge Stats (2/6 - 2/7)
Max Rainfall Duration
Max Rainfall Depth (Preliminary)
Estimated Return Period7
6 Hour 2.32” 10 Year 12 Hour 2.60” 2-5 Year 24 Hour 3.60” 2-5 Year
7 Metstat. Regional All Season Precipitation Frequency Analysis and Mapping in Santa Clara, Alameda, and San Mateo Counties, California, and Comparison to NOAA Atlas 14. October 2016.
0
0.1
0.2
0.3
0.4
0.5
0.6
Incr
emen
tal R
anifa
ll (In
ches
)
10
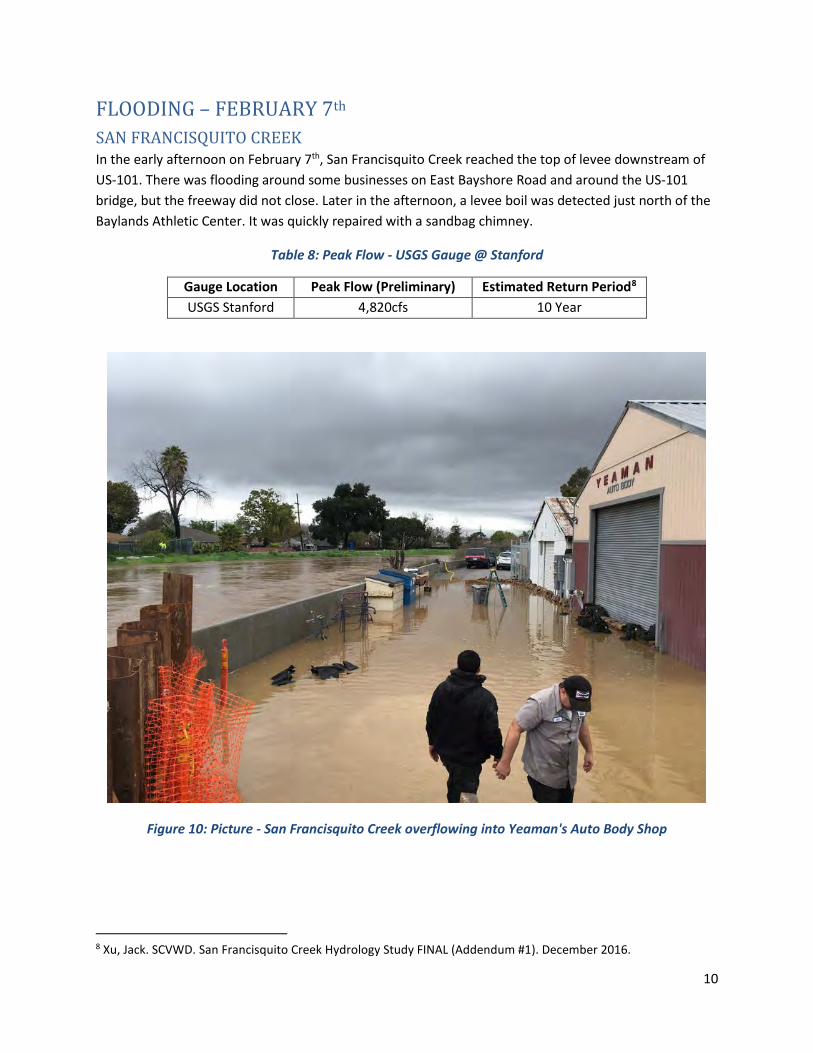
FLOODING – FEBRUARY 7th SAN FRANCISQUITO CREEK In the early afternoon on February 7th, San Francisquito Creek reached the top of levee downstream of US-101. There was flooding around some businesses on East Bayshore Road and around the US-101 bridge, but the freeway did not close. Later in the afternoon, a levee boil was detected just north of the Baylands Athletic Center. It was quickly repaired with a sandbag chimney.
Table 8: Peak Flow - USGS Gauge @ Stanford
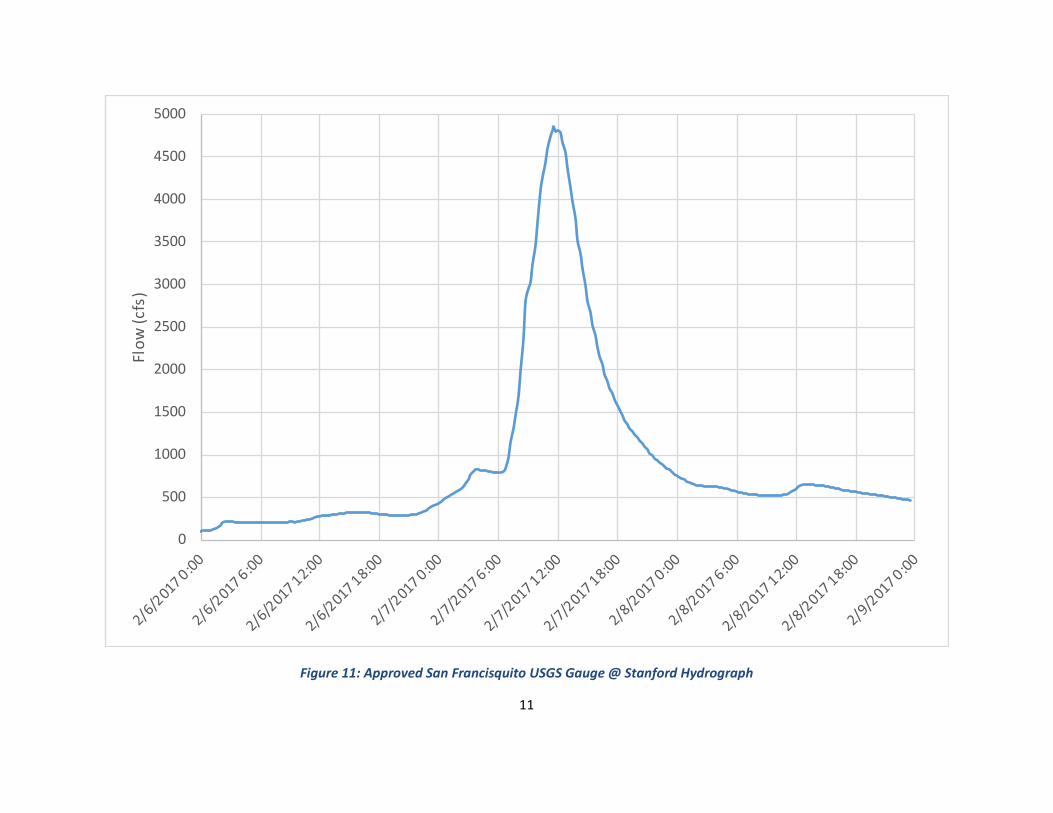
Gauge Location Peak Flow (Preliminary) Estimated Return Period8 USGS Stanford 4,820cfs 10 Year
Figure 10: Picture - San Francisquito Creek overflowing into Yeaman's Auto Body Shop
8 Xu, Jack. SCVWD. San Francisquito Creek Hydrology Study FINAL (Addendum #1). December 2016.
11
Figure 11: Approved San Francisquito USGS Gauge @ Stanford Hydrograph
0
500
1000
1500
2000
2500
3000
3500
4000
4500
5000Fl
ow (c
fs)

12
FEBRUARY 20th AND 21st STORM
OVERVIEW & WEATHER Two small to moderate frontal passage storms brought rain on February 15th and 17th, saturating soils and setting the stage for heavier runoff. Coyote Reservoir, which had just stopped spilling a few days before, began to spill again. Anderson Reservoir, at the cusp of spilling, reached full capacity with these two storms and began spilling on February 18th. During this time, the District performed an activation of the Emergency Operations Center (EOC) to monitor the situation and coordinate with other agencies.
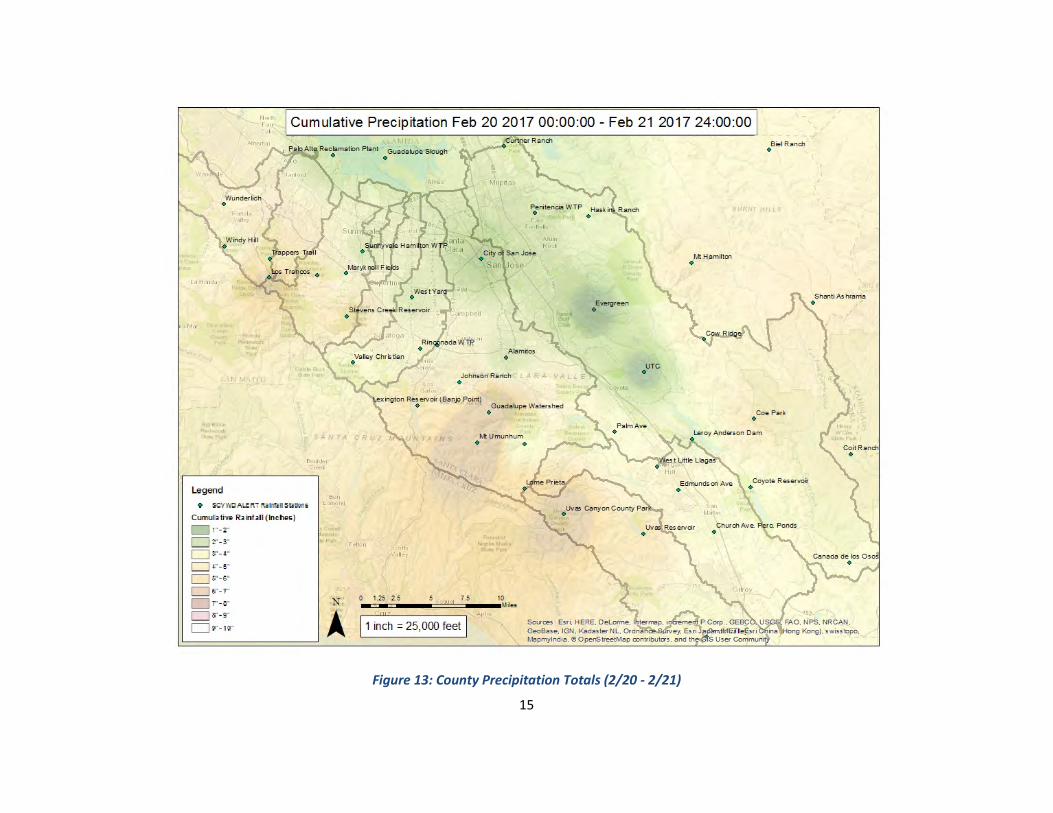
A couple of days later on February 20th, a larger storm system and atmospheric river brought gusty winds and heavy rain that lasted throughout the day. This system caused many District reservoirs to spill again, and many creeks experienced large flows. The District (EOC) was fully activated at 8am on February 20th. The storm moved rapidly and had high amounts of precipitation.
Figure 12: Coe Park (Coyote) Rainfall (2/20 - 2/21)
Table 9: Coe Park Rain Gauge Stats (2/20 - 2/21)
Max Rainfall Duration
Max Rainfall Depth (Preliminary)
Estimated Return Period9
24 Hour 3.74” 5 Year
9 Metstat. Regional All Season Precipitation Frequency Analysis and Mapping in Santa Clara, Alameda, and San Mateo Counties, California, and Comparison to NOAA Atlas 14. October 2016.
0
0.05
0.1
0.15
0.2
0.25
0.3
0.35
0.4
0.45
Incr
emen
tal R
anifa
ll (In
ches
)

13
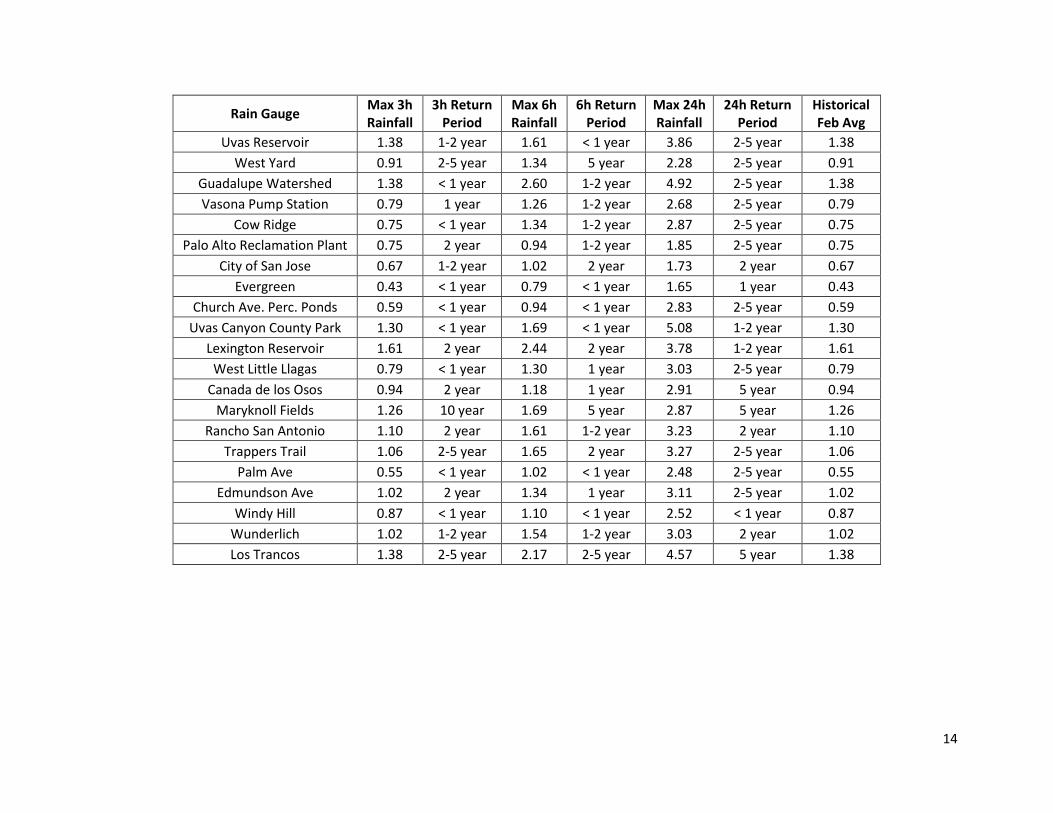
Table 10: District Rain Gauge Stats (2/20 - 2/21)
Rain Gauge Max 3h Rainfall
3h Return Period10
Max 6h Rainfall
6h Return Period
Max 24h Rainfall
24h Return Period
Historical Feb Avg11
Alamitos 0.83 1-2 year 1.14 1-2 year 2.28 2 year 4.64 Almaden Watershed 0.98 < 1 year 1.65 < 1 year 3.70 1-2 year 7.95
Biel Ranch 0.71 1-2 year 1.10 1-2 year 2.95 5 year 4.98 Castro Valley 0.71 < 1 year 0.91 < 1 year 2.91 2 year 4.88
Guadalupe Slough 0.75 2-5 year 1.02 2-5 year 1.85 5 year 4.00 Coe Park 0.91 1 year 1.42 1-2 year 3.74 5 year 6.32
Coit Ranch 1.14 2 year 1.61 1-2 year 3.43 2-5 year 5.51 Coyote Reservoir 0.79 < 1 year 1.22 1 year 2.80 2-5 year 5.34
Curtner Ranch 0.63 < 1 year 0.98 1-2 year 2.17 5 year 4.00 Haskins Ranch 0.51 < 1 year 0.91 < 1 year 2.01 1-2 year 4.64 Johnson Ranch 1.14 2 year 1.77 2 year 3.27 2-5 year 6.13
Leroy Anderson Dam 0.59 < 1 year 0.98 < 1 year 2.64 2-5 year 4.97 Lome Prieta 1.10 < 1 year 1.54 < 1 year 4.29 1-2 year 10.74
Sunnyvale Hamilton WTP 0.94 2-5 year 1.30 2-5 year 2.17 2-5 year 6.11 Mt Hamilton 0.71 < 1 year 1.14 < 1 year 3.39 2-5 year 5.02
Mt Umunhum 1.30 < 1 year 2.28 1 year 5.71 2-5 year 10.52 Valley Christian 1.77 2-5 year 2.72 2 year 5.28 2-5 year 5.77 Rinconada WTP 0.83 1 year 1.34 1-2 year 2.76 2 year 5.03 Shanti Ashrama 0.98 2 year 1.38 1-2 year 3.35 5-10 year 4.33 Penitencia WTP 0.63 < 1 year 1.06 2 year 1.97 2-5 year 10.52
Stevens Creek Reservoir 1.42 2-5 year 2.13 2-5 year 3.74 2-5 year 6.11 UTC 0.35 < 1 year 0.71 < 1 year 1.57 1 year 4.37
10 Metstat. Regional All Season Precipitation Frequency Analysis and Mapping in Santa Clara, Alameda, and San Mateo Counties, California, and Comparison to NOAA Atlas 14. October 2016. 11 Based off Oregon State University PRISM Mean Annual Precipitation Data.
14
Rain Gauge Max 3h Rainfall
3h Return Period
Max 6h Rainfall
6h Return Period
Max 24h Rainfall
24h Return Period
Historical Feb Avg
Uvas Reservoir 1.38 1-2 year 1.61 < 1 year 3.86 2-5 year 1.38 West Yard 0.91 2-5 year 1.34 5 year 2.28 2-5 year 0.91
Guadalupe Watershed 1.38 < 1 year 2.60 1-2 year 4.92 2-5 year 1.38 Vasona Pump Station 0.79 1 year 1.26 1-2 year 2.68 2-5 year 0.79
Cow Ridge 0.75 < 1 year 1.34 1-2 year 2.87 2-5 year 0.75 Palo Alto Reclamation Plant 0.75 2 year 0.94 1-2 year 1.85 2-5 year 0.75
City of San Jose 0.67 1-2 year 1.02 2 year 1.73 2 year 0.67 Evergreen 0.43 < 1 year 0.79 < 1 year 1.65 1 year 0.43
Church Ave. Perc. Ponds 0.59 < 1 year 0.94 < 1 year 2.83 2-5 year 0.59 Uvas Canyon County Park 1.30 < 1 year 1.69 < 1 year 5.08 1-2 year 1.30
Lexington Reservoir 1.61 2 year 2.44 2 year 3.78 1-2 year 1.61 West Little Llagas 0.79 < 1 year 1.30 1 year 3.03 2-5 year 0.79
Canada de los Osos 0.94 2 year 1.18 1 year 2.91 5 year 0.94 Maryknoll Fields 1.26 10 year 1.69 5 year 2.87 5 year 1.26
Rancho San Antonio 1.10 2 year 1.61 1-2 year 3.23 2 year 1.10 Trappers Trail 1.06 2-5 year 1.65 2 year 3.27 2-5 year 1.06
Palm Ave 0.55 < 1 year 1.02 < 1 year 2.48 2-5 year 0.55 Edmundson Ave 1.02 2 year 1.34 1 year 3.11 2-5 year 1.02
Windy Hill 0.87 < 1 year 1.10 < 1 year 2.52 < 1 year 0.87 Wunderlich 1.02 1-2 year 1.54 1-2 year 3.03 2 year 1.02 Los Trancos 1.38 2-5 year 2.17 2-5 year 4.57 5 year 1.38
15
Figure 13: County Precipitation Totals (2/20 - 2/21)
16
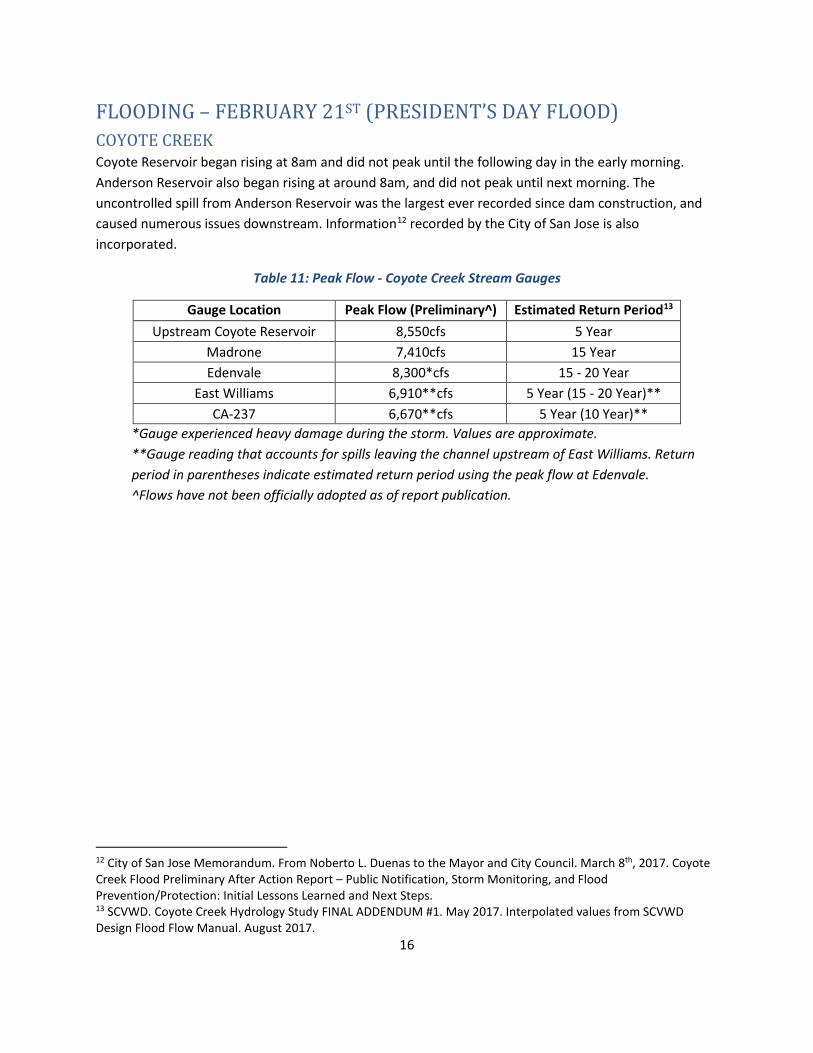
FLOODING – FEBRUARY 21ST (PRESIDENT’S DAY FLOOD) COYOTE CREEK Coyote Reservoir began rising at 8am and did not peak until the following day in the early morning. Anderson Reservoir also began rising at around 8am, and did not peak until next morning. The uncontrolled spill from Anderson Reservoir was the largest ever recorded since dam construction, and caused numerous issues downstream. Information12 recorded by the City of San Jose is also incorporated.
Table 11: Peak Flow - Coyote Creek Stream Gauges
Gauge Location Peak Flow (Preliminary^) Estimated Return Period13 Upstream Coyote Reservoir 8,550cfs 5 Year
Madrone 7,410cfs 15 Year Edenvale 8,300*cfs 15 - 20 Year
East Williams 6,910**cfs 5 Year (15 - 20 Year)** CA-237 6,670**cfs 5 Year (10 Year)**
*Gauge experienced heavy damage during the storm. Values are approximate. **Gauge reading that accounts for spills leaving the channel upstream of East Williams. Return period in parentheses indicate estimated return period using the peak flow at Edenvale. ^Flows have not been officially adopted as of report publication.
12 City of San Jose Memorandum. From Noberto L. Duenas to the Mayor and City Council. March 8th, 2017. Coyote Creek Flood Preliminary After Action Report – Public Notification, Storm Monitoring, and Flood Prevention/Protection: Initial Lessons Learned and Next Steps. 13 SCVWD. Coyote Creek Hydrology Study FINAL ADDENDUM #1. May 2017. Interpolated values from SCVWD Design Flood Flow Manual. August 2017.

17
Figure 14: Preliminary Reservoir Inflow and Outflow Hydrographs
0
1,000
2,000
3,000
4,000
5,000
6,000
7,000
8,000
9,000Fl
ow (c
fs)
Coyote Inflow @ USGS Gauge Anderson Outflow @ Madrone Gauge
PRELIMINARY
18
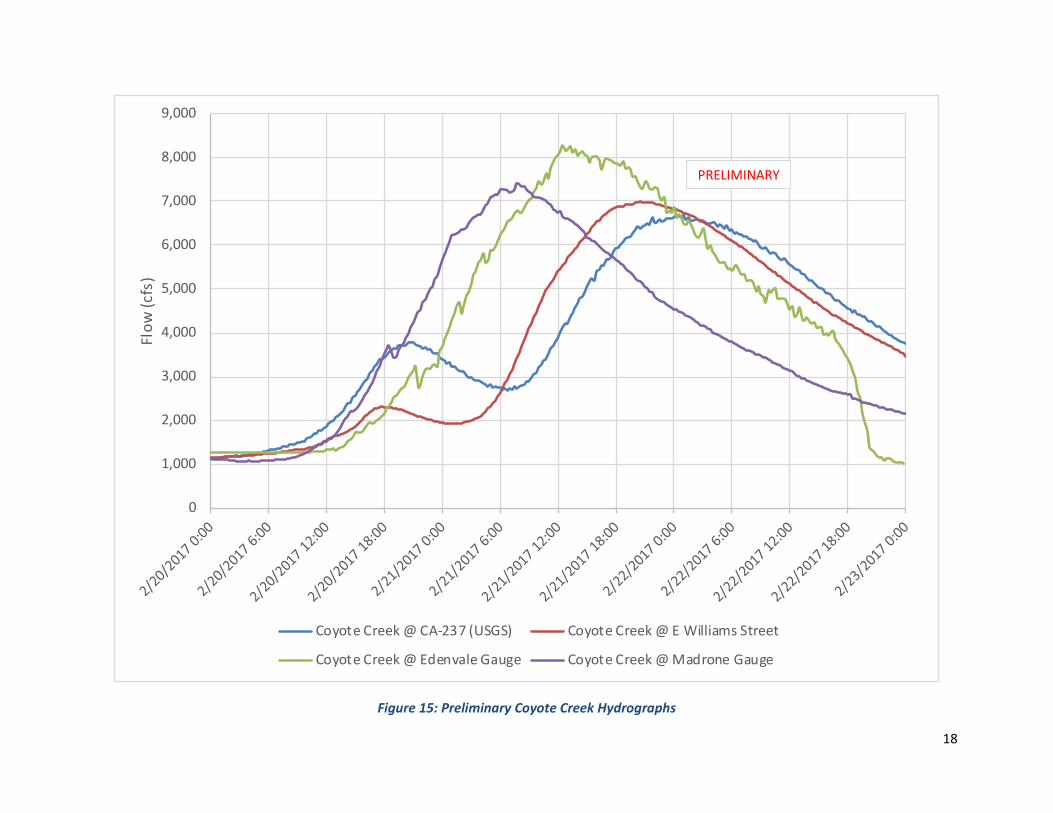
Figure 15: Preliminary Coyote Creek Hydrographs
0
1,000
2,000
3,000
4,000
5,000
6,000
7,000
8,000
9,000
Flow
(cfs
)
Coyote Creek @ CA-237 (USGS) Coyote Creek @ E Williams Street
Coyote Creek @ Edenvale Gauge Coyote Creek @ Madrone Gauge
PRELIMINARY

19
- Sycamore Avenue bridge leading towards the William F. James Boys Ranch juvenile corrections facility was overtopped. The creek overtopped and ponded the roadway along Malaguerra Avenue, inundating the Morning Star Drive and Silverwings Court intersections.
Figure 16: Picture - Coyote Creek Flooding at Malaguerra and Sycamore Avenue
Figure 17: Picture - Coyote Creek Flooding at Malaguerra Avenue
20
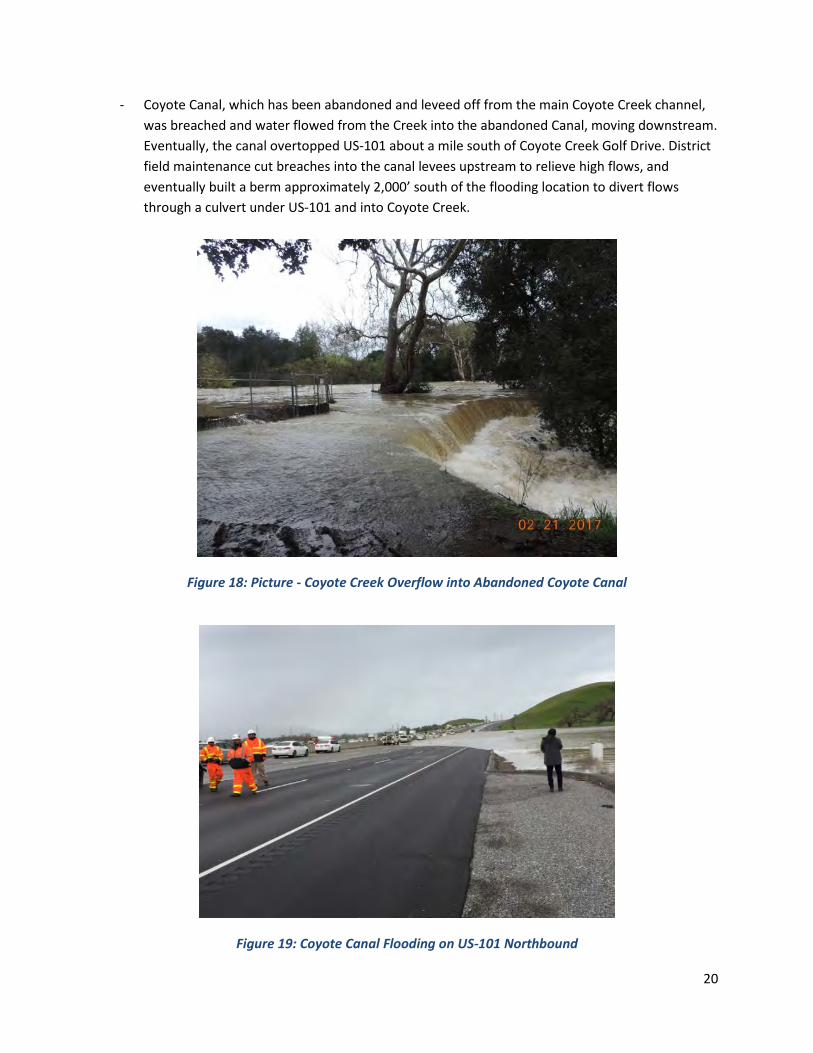
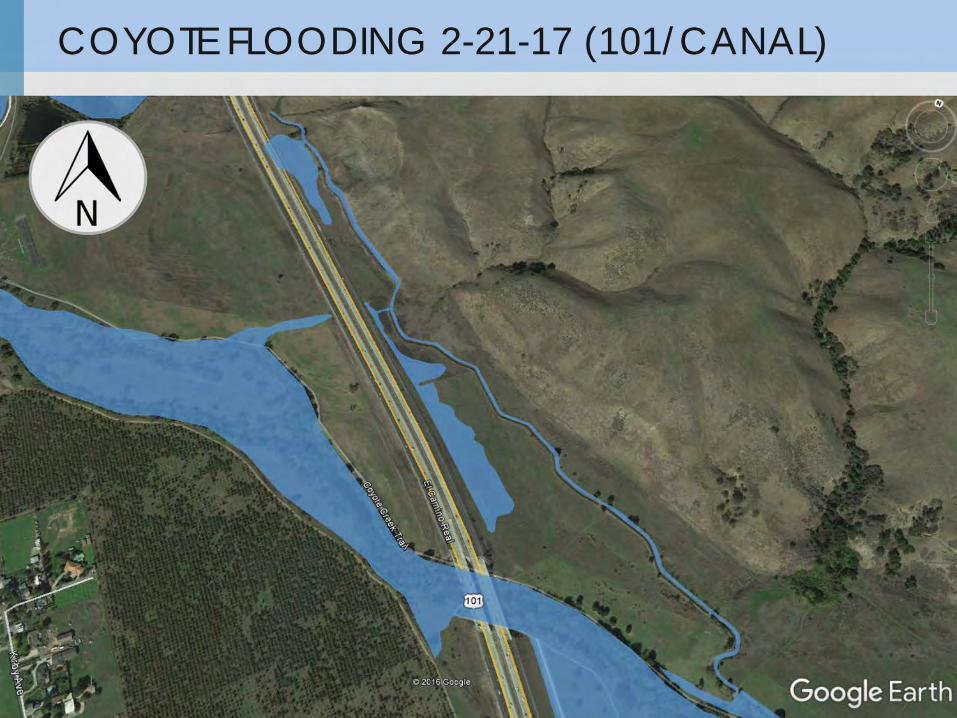
- Coyote Canal, which has been abandoned and leveed off from the main Coyote Creek channel, was breached and water flowed from the Creek into the abandoned Canal, moving downstream. Eventually, the canal overtopped US-101 about a mile south of Coyote Creek Golf Drive. District field maintenance cut breaches into the canal levees upstream to relieve high flows, and eventually built a berm approximately 2,000’ south of the flooding location to divert flows through a culvert under US-101 and into Coyote Creek.
Figure 18: Picture - Coyote Creek Overflow into Abandoned Coyote Canal
Figure 19: Coyote Canal Flooding on US-101 Northbound
21
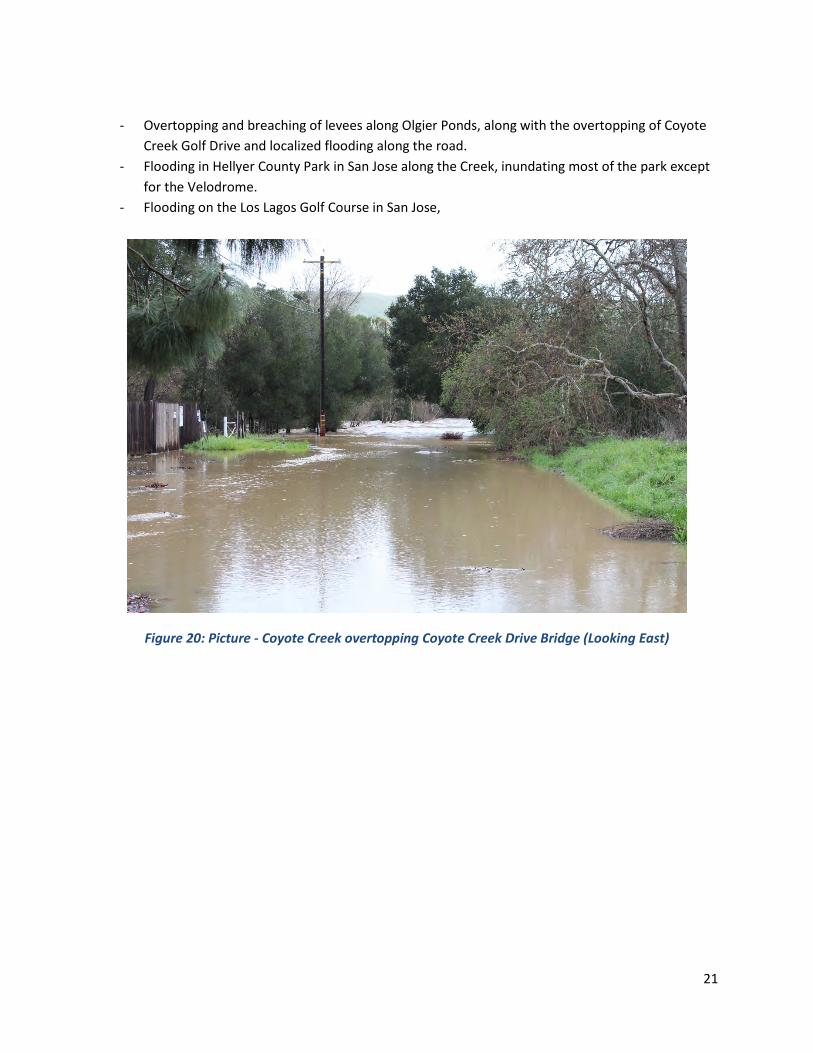
- Overtopping and breaching of levees along Olgier Ponds, along with the overtopping of Coyote
Creek Golf Drive and localized flooding along the road. - Flooding in Hellyer County Park in San Jose along the Creek, inundating most of the park except
for the Velodrome. - Flooding on the Los Lagos Golf Course in San Jose,
Figure 20: Picture - Coyote Creek overtopping Coyote Creek Drive Bridge (Looking East)
22
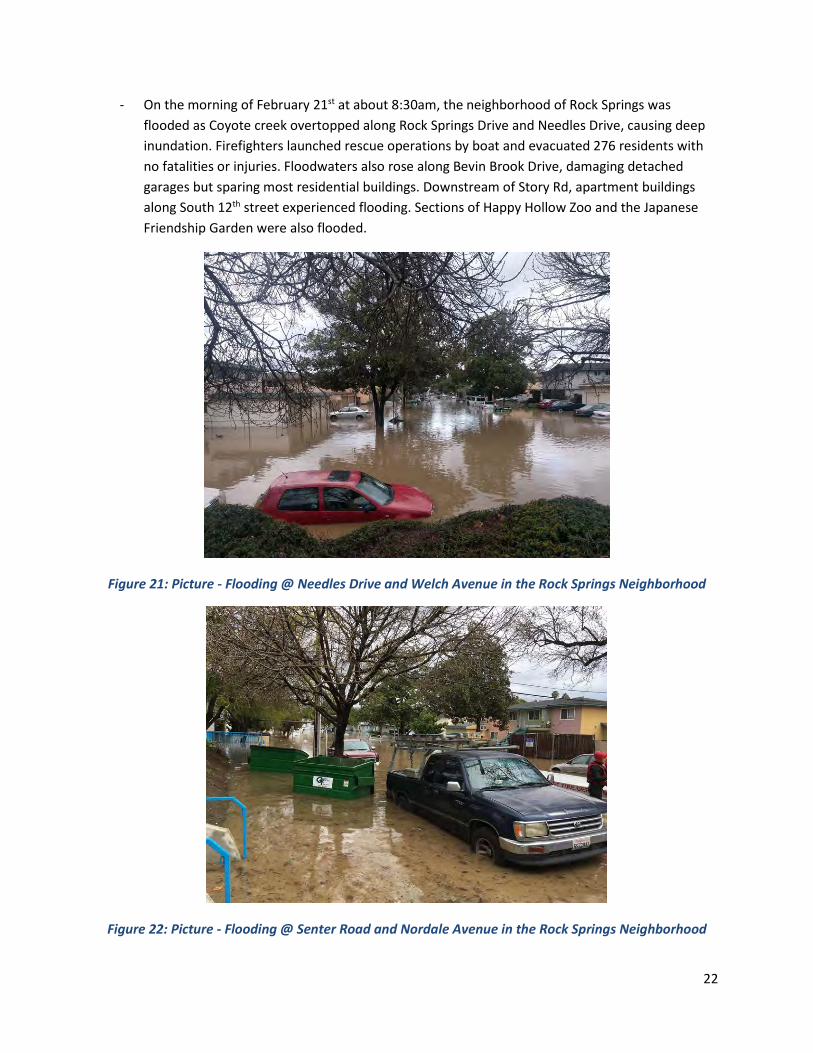
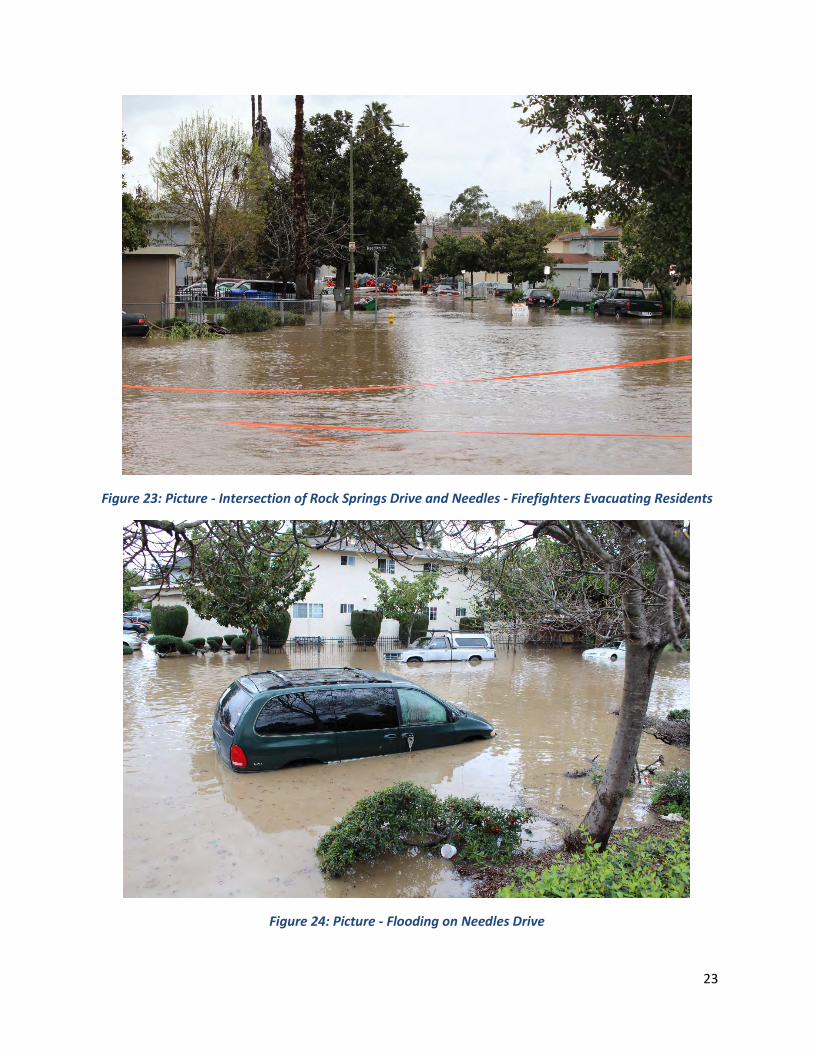
- On the morning of February 21st at about 8:30am, the neighborhood of Rock Springs was flooded as Coyote creek overtopped along Rock Springs Drive and Needles Drive, causing deep inundation. Firefighters launched rescue operations by boat and evacuated 276 residents with no fatalities or injuries. Floodwaters also rose along Bevin Brook Drive, damaging detached garages but sparing most residential buildings. Downstream of Story Rd, apartment buildings along South 12th street experienced flooding. Sections of Happy Hollow Zoo and the Japanese Friendship Garden were also flooded.
Figure 21: Picture - Flooding @ Needles Drive and Welch Avenue in the Rock Springs Neighborhood
Figure 22: Picture - Flooding @ Senter Road and Nordale Avenue in the Rock Springs Neighborhood
23
Figure 23: Picture - Intersection of Rock Springs Drive and Needles - Firefighters Evacuating Residents
Figure 24: Picture - Flooding on Needles Drive
24
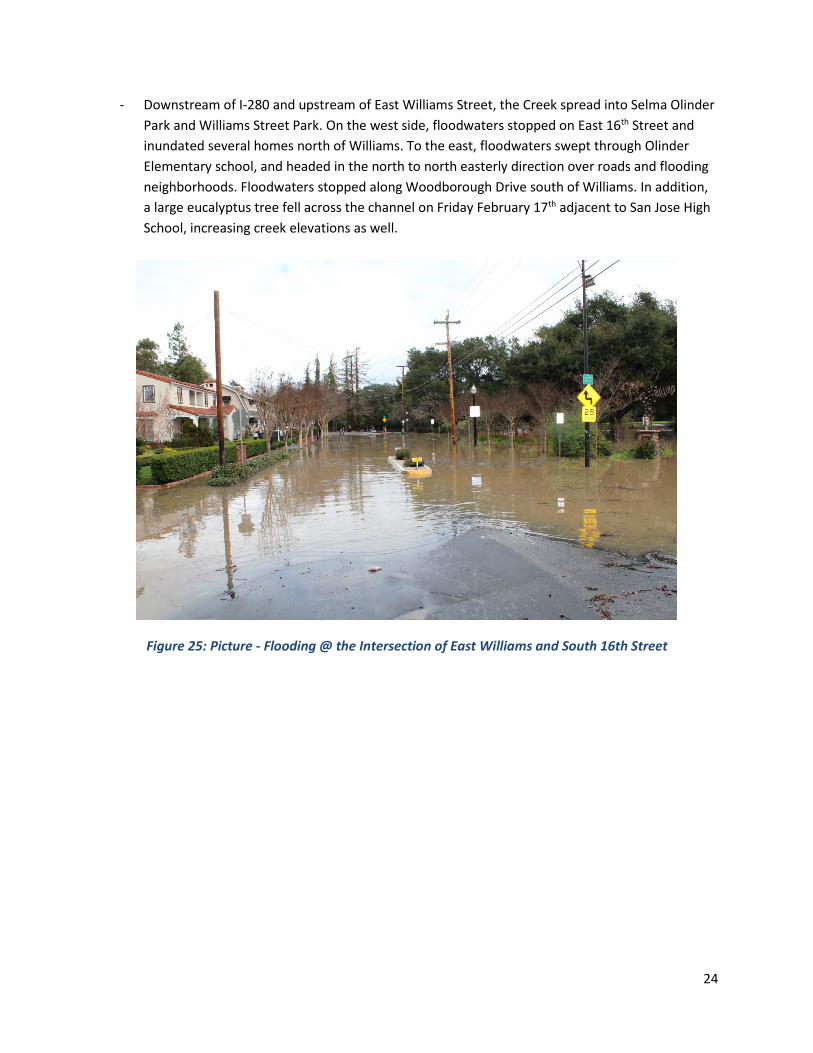
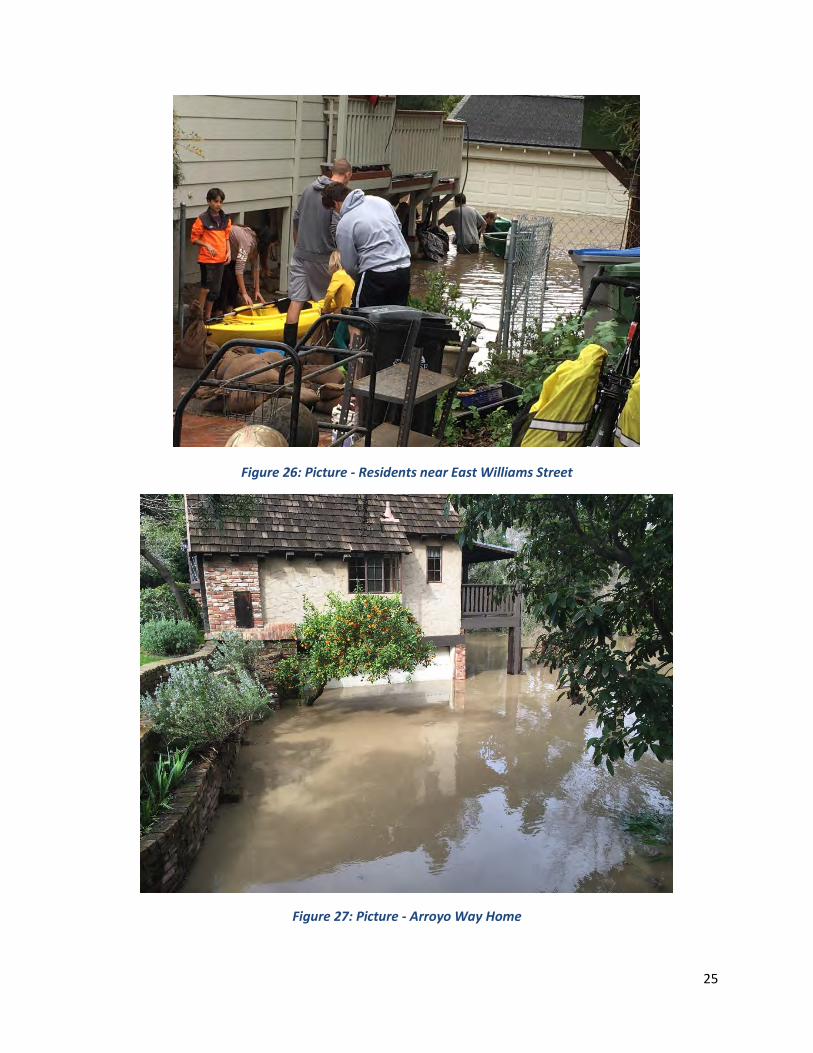
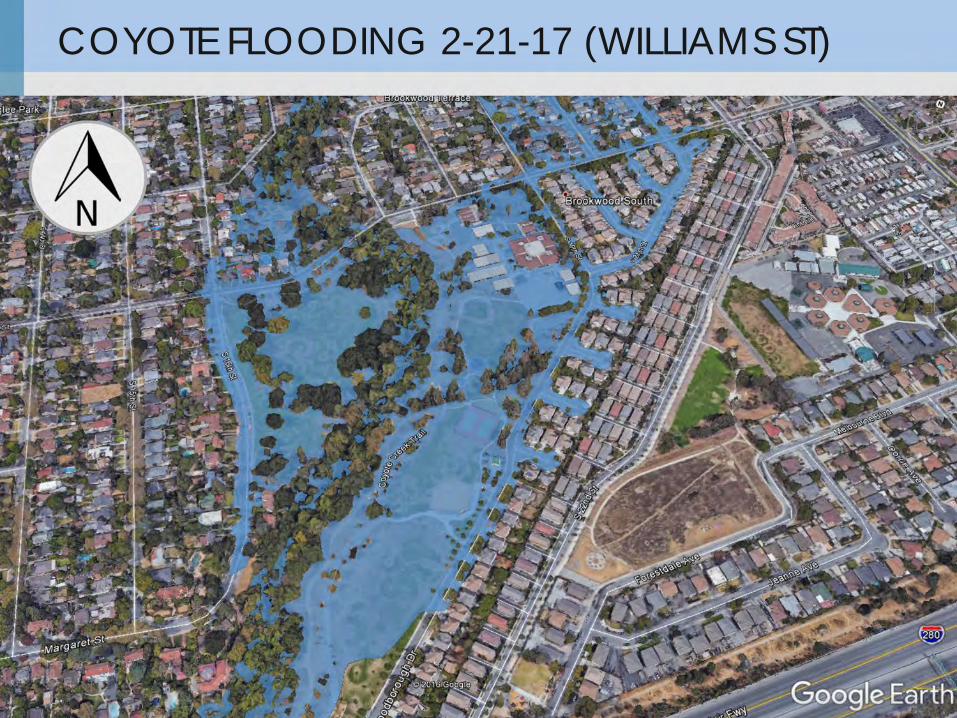
- Downstream of I-280 and upstream of East Williams Street, the Creek spread into Selma Olinder Park and Williams Street Park. On the west side, floodwaters stopped on East 16th Street and inundated several homes north of Williams. To the east, floodwaters swept through Olinder Elementary school, and headed in the north to north easterly direction over roads and flooding neighborhoods. Floodwaters stopped along Woodborough Drive south of Williams. In addition, a large eucalyptus tree fell across the channel on Friday February 17th adjacent to San Jose High School, increasing creek elevations as well.
Figure 25: Picture - Flooding @ the Intersection of East Williams and South 16th Street
25
Figure 26: Picture - Residents near East Williams Street
Figure 27: Picture - Arroyo Way Home
26
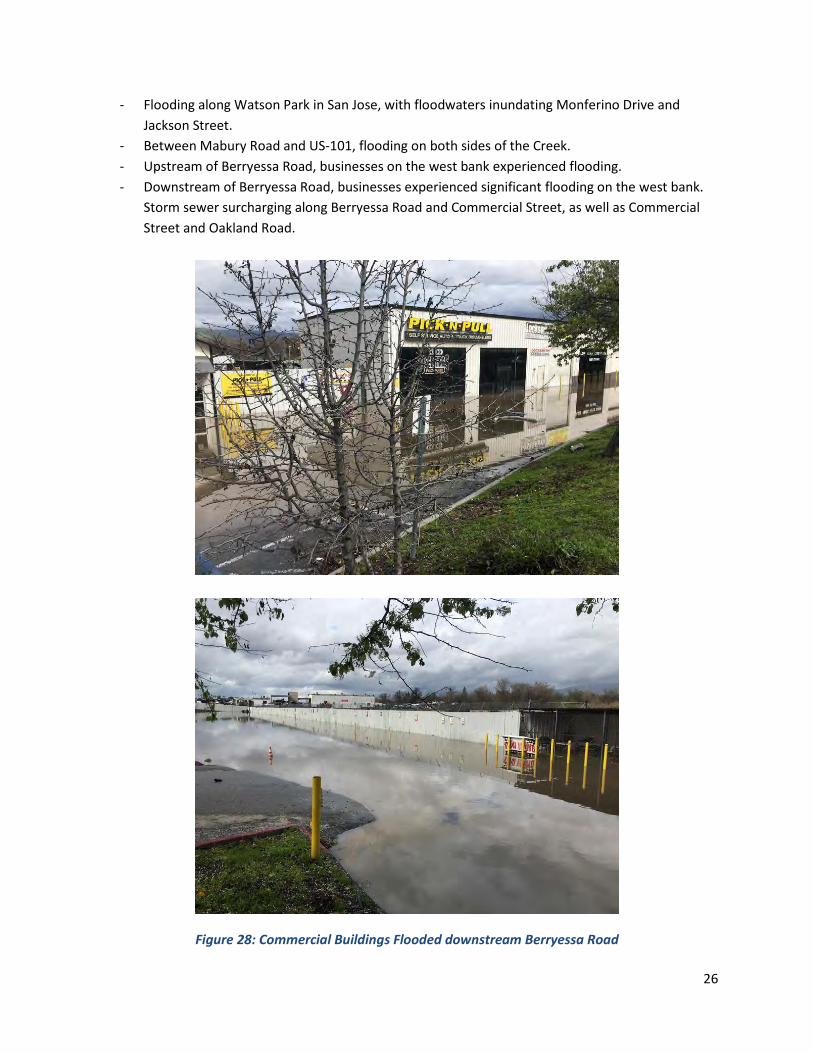
- Flooding along Watson Park in San Jose, with floodwaters inundating Monferino Drive and Jackson Street.
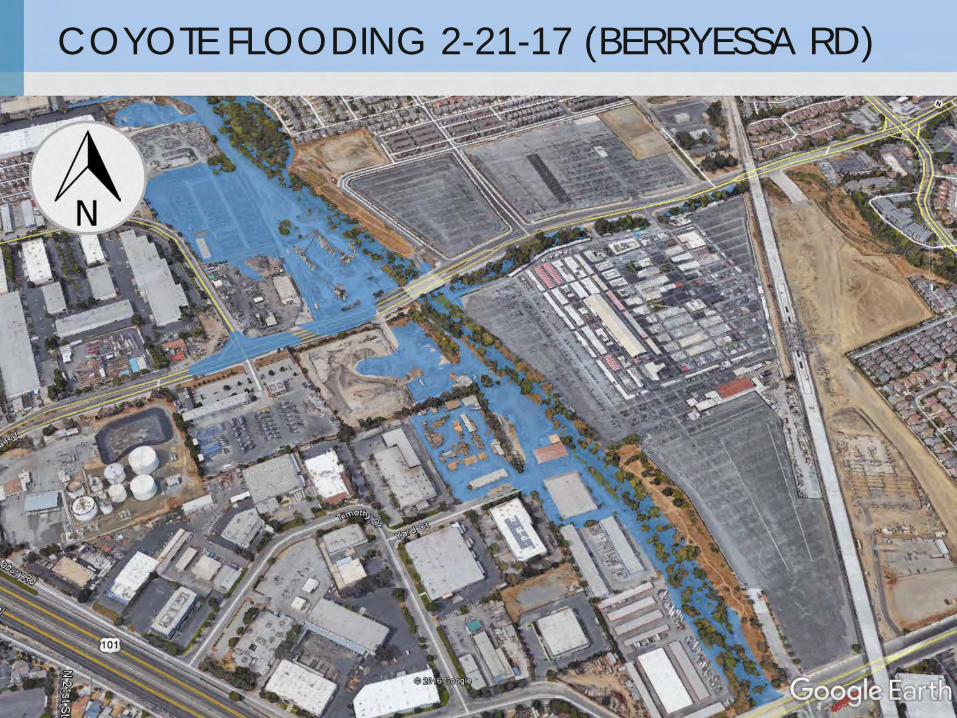
- Between Mabury Road and US-101, flooding on both sides of the Creek. - Upstream of Berryessa Road, businesses on the west bank experienced flooding. - Downstream of Berryessa Road, businesses experienced significant flooding on the west bank.
Storm sewer surcharging along Berryessa Road and Commercial Street, as well as Commercial Street and Oakland Road.
Figure 28: Commercial Buildings Flooded downstream Berryessa Road

27
Figure 29: Picture - Street Flooding @ Oakland and Commercial Road
Figure 30: Picture - Street Flooding @ Berryessa Road
28
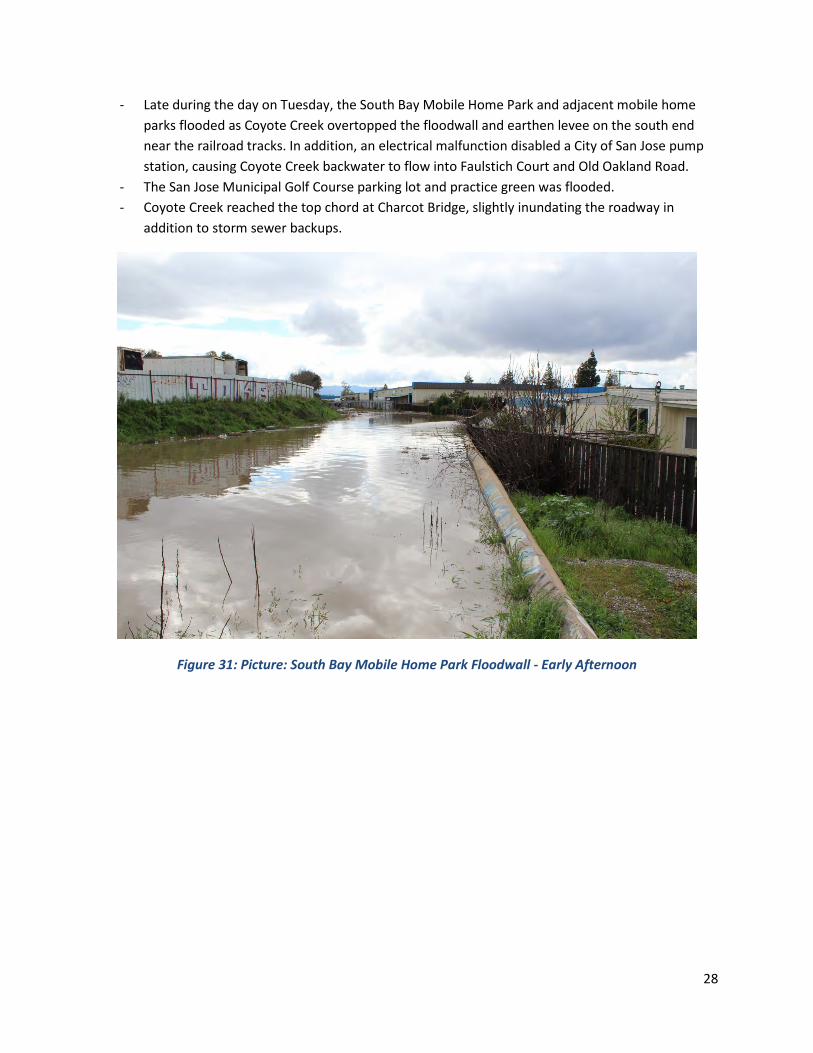
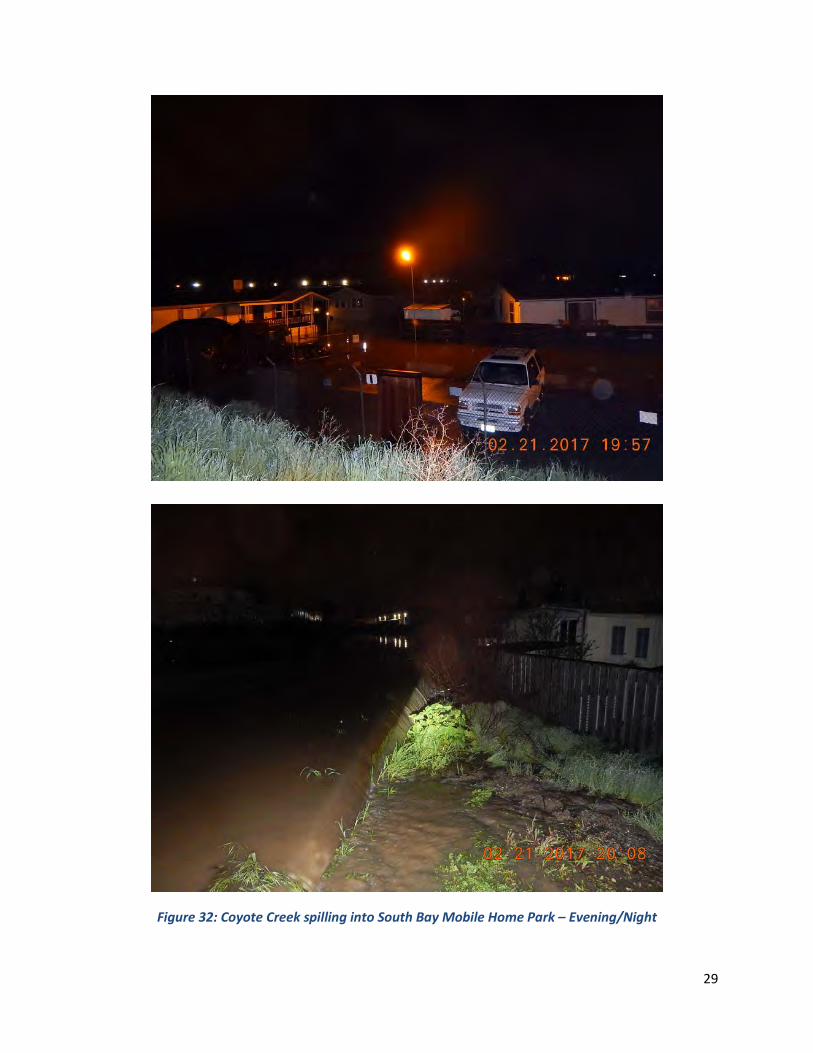
- Late during the day on Tuesday, the South Bay Mobile Home Park and adjacent mobile home parks flooded as Coyote Creek overtopped the floodwall and earthen levee on the south end near the railroad tracks. In addition, an electrical malfunction disabled a City of San Jose pump station, causing Coyote Creek backwater to flow into Faulstich Court and Old Oakland Road.
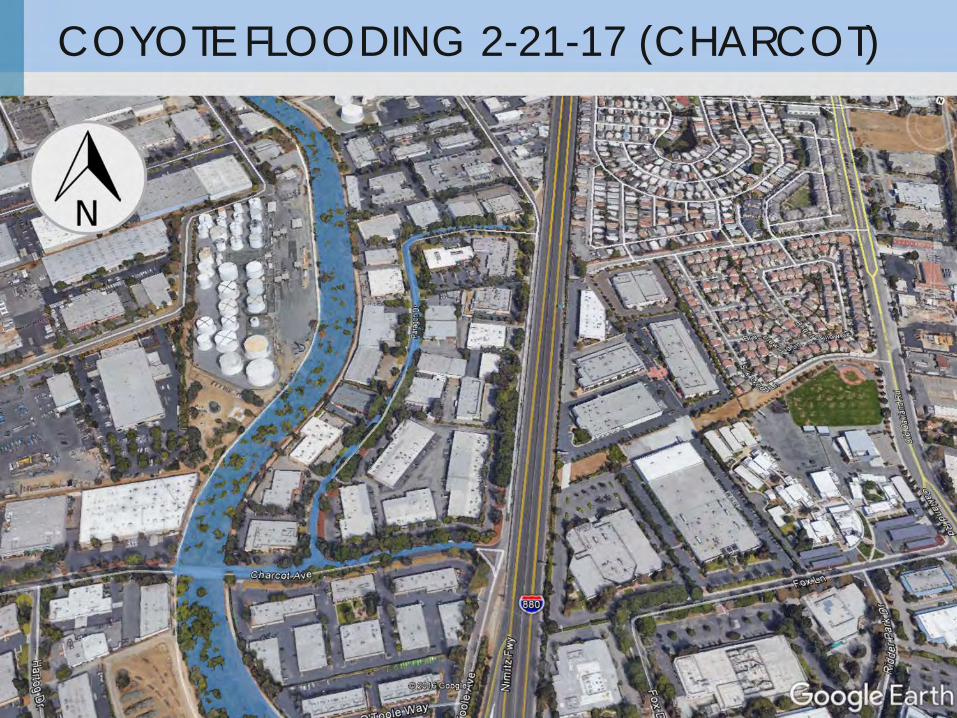
- The San Jose Municipal Golf Course parking lot and practice green was flooded. - Coyote Creek reached the top chord at Charcot Bridge, slightly inundating the roadway in
addition to storm sewer backups.
Figure 31: Picture: South Bay Mobile Home Park Floodwall - Early Afternoon
29
Figure 32: Coyote Creek spilling into South Bay Mobile Home Park – Evening/Night

30
UPPER PENITENCIA CREEK Runoff from Upper Penitencia Creek was minor, but a severely limited channel brought nuisance flooding along the creek. An estimated peak flow of around 400cfs occurred during the President’s Day flood.
Upper Penitencia Creek experienced a few minor spills during the storm event. Spills were mainly experienced along the Mabury bypass, bounded along the east and west by Jackson Avenue and King Road respectively. Overtopping occurred along both the left and right banks, immediately downstream of the Jackson Avenue culvert.
Spills over the left bank resulted in sheet flow draining into the County Parks pond. There was also a downed tree along the left bank, obstructing the trail through the park and not the creek itself. Greater amounts of spill took place further downstream over the two concrete lateral weirs situated along the right bank, activating the Mabury bypass. The city of San Jose sandbagged areas along Mabury Road to prevent street flooding. Despite these measures, some ponding occurred at a low spot along Mabury Road. Minor flooding may have occurred along Cape Horn Drive (residential street north of the Mabury bypass). Ponding was not seen at this location, but there were some debris, indicating that the lip of the street curb may have been overtopped.
Figure 33: Upper Penitencia Bypass Channel - Educational Park Drive

31
POST FLOOD DAMAGES The City of San Jose compiled an initial damage estimate14 that identifies roughly $50 million in damages to private property and $23 million in costs and damages associated with public property for the President’s Day Flood. Approximately 14,000 people were evacuated. No loss of life or injuries were reported during rescue operations of evacuations.
14 City of San Jose Memorandum. From Noberto L. Duenas to the Mayor and City Council. March 8th, 2017. Coyote Creek Flood Preliminary After Action Report: Recovery Update.

32
IMPACTS TO DISTRICT WATER UTILITY FACILITIES The following is a list of maintenance and repair activities during the January and February months of 2017 performed by our Water Utility field maintenance staff.
JANUARY 2017 - Coyote Canal Sediment Removal at Coyote Creek Branch D - Coyote Canal Blow-Out Repair North of Bailey Avenue (Temporary Repair) - Coyote Canal Blow-Out Repair North of Bailey Avenue (Permanent Repair) - Coyote Canal Near Diversion at Coyote Creek - Coyote Canal at Coyote Creek Golf Course - Coyote Canal Vegetation Removal (Various Locations) - Alamden-Calero Canal Sediment and Debris Removal (Multiple Locations) - Vasona Dam – Replacement of Radial Gate Cables - Masson Diversion – Emergency Removal of Steel Diversion Dam to Pass Flood Flows - Anderson Reservoir Pump-Over - Uvas Reservoir Surface Debris Removal - Uvas Reservoir Sediment Removal - Chesbro Reservoir Debris Removal - Chesbro Reservoir Sediment Removal
FEBRUARY 2017 - Coyote-Alamitos Canal Sediment and Debris Removal - Remove Coyote Perc Dam - Emergency Removal of Steel Dam to Pass Flood Flows - Create berm to alleviate flooding of Northbound 101 between Cochrane and Coyote Golf and
Future Removal of Berm and Repair of Canal - Removal of Sediment and Debris in the Almaden-Calero Canal from Storms - Breaches Cut into Coyote Canal to blow off high flows - Repair Flood damage to beginning of Coyote Canal - Uvas Reservoir Surface Debris Removal - Uvas Reservoir Sediment Removal - Chesbro Reservoir Surface Debris Removal - Chesbro Reservoir Sediment Removal - Repair Coyote Perc Dam and Debris Removal - Flood Damage to Water Supply Transmission System

APPENDIX A: PRELIMINARY FLOOD INUNDATION MAPS
|
WEST LITTLE LLAGAS FLOODING NORTH 1-8-17
|
WEST LITTLE LLAGAS FLOODING SOUTH 1-8-17
|
UVAS FLOODING 1-8-17

|
SAN FRANCISQUITO FLOODING 2-7-17
|
COYOTE FLOODING 2-21-17 (101/CANAL)

|
COYOTE FLOODING 2-21-17 (ROCK SPRINGS)
|
COYOTE FLOODING 2-21-17 (WILLIAMS ST)

|
COYOTE FLOODING 2-21-17 (FIVE WOUNDS)

|
COYOTE FLOODING 2-21-17 (WATSON PARK)
|
COYOTE FLOODING 2-21-17 (BERRYESSA RD)

|
COYOTE FLOODING 2-21-17 (MOBILE HOME)
|
COYOTE FLOODING 2-21-17 (CHARCOT)

APPENDIX B: PRESIDENT’S DAY FLOOD PUBLIC OUTREACH MEETING
Page 1
Presidents’ Day Weekend Storm
Responses to Community Questions
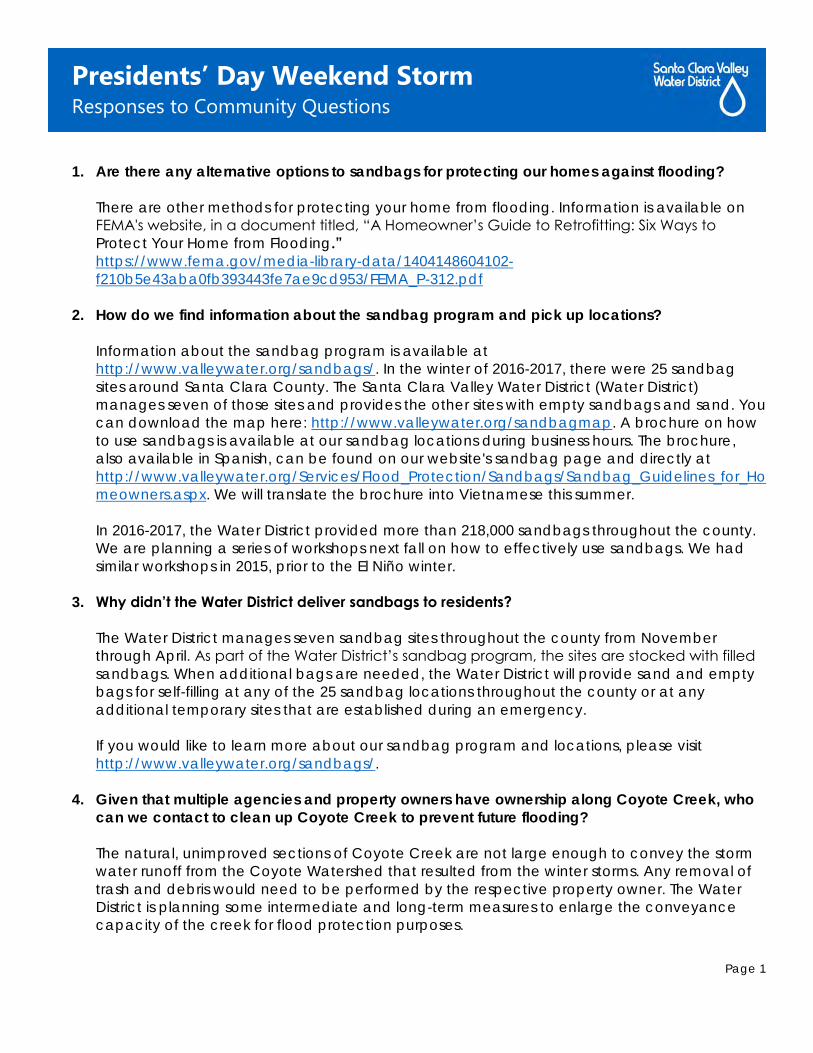
1. Are there any alternative options to sandbags for protecting our homes against flooding?
There are other methods for protecting your home from flooding. Information is available on FEMA's website, in a document titled, “A Homeowner’s Guide to Retrofitting: Six Ways to
Protect Your Home from Flooding.”
https://www.fema.gov/media-library-data/1404148604102-f210b5e43aba0fb393443fe7ae9cd953/FEMA_P-312.pdf
2. How do we find information about the sandbag program and pick up locations?
Information about the sandbag program is available at http://www.valleywater.org/sandbags/. In the winter of 2016-2017, there were 25 sandbag sites around Santa Clara County. The Santa Clara Valley Water District (Water District) manages seven of those sites and provides the other sites with empty sandbags and sand. You can download the map here: http://www.valleywater.org/sandbagmap. A brochure on how to use sandbags is available at our sandbag locations during business hours. The brochure, also available in Spanish, can be found on our website's sandbag page and directly at http://www.valleywater.org/Services/Flood_Protection/Sandbags/Sandbag_Guidelines_for_Homeowners.aspx. We will translate the brochure into Vietnamese this summer. In 2016-2017, the Water District provided more than 218,000 sandbags throughout the county. We are planning a series of workshops next fall on how to effectively use sandbags. We had similar workshops in 2015, prior to the El Niño winter.
3. Why didn’t the Water District deliver sandbags to residents?
The Water District manages seven sandbag sites throughout the county from November through April. As part of the Water District’s sandbag program, the sites are stocked with filled
sandbags. When additional bags are needed, the Water District will provide sand and empty bags for self-filling at any of the 25 sandbag locations throughout the county or at any additional temporary sites that are established during an emergency. If you would like to learn more about our sandbag program and locations, please visit http://www.valleywater.org/sandbags/.
4. Given that multiple agencies and property owners have ownership along Coyote Creek, who
can we contact to clean up Coyote Creek to prevent future flooding?
The natural, unimproved sections of Coyote Creek are not large enough to convey the storm water runoff from the Coyote Watershed that resulted from the winter storms. Any removal of trash and debris would need to be performed by the respective property owner. The Water District is planning some intermediate and long-term measures to enlarge the conveyance capacity of the creek for flood protection purposes.
Page 2
Presidents’ Day Weekend Storm
Responses to Community Questions
Please report any trash or downed trees on Water District property in or near the creek at Access Valley Water from our website at www.valleywater.org, or call our Watersheds Hotline at 408-630-2378. If you’re not sure who the property owner is, report it to us anyway. We’ll
check and if it’s not Water District property, we will refer the report to the responsible party.
5. When will the Water District clean out Coyote Creek? Can the Water District work with the
community to clean the debris and trees in the creek to prevent future flooding?
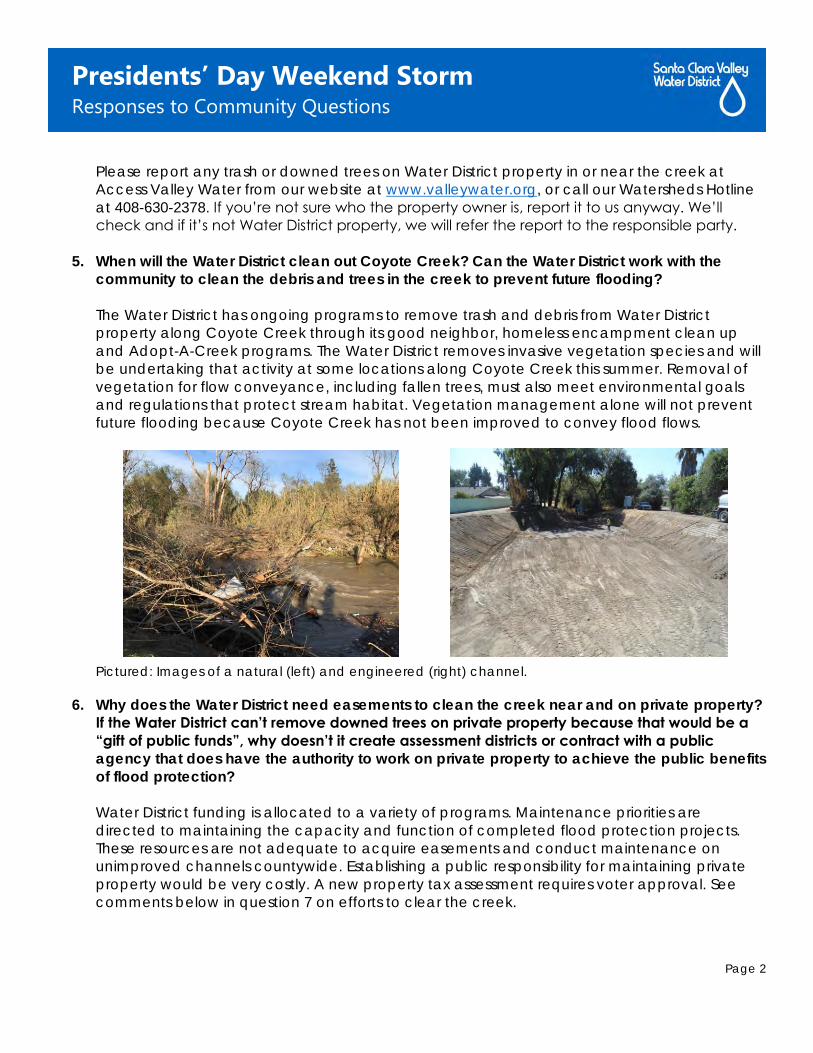
The Water District has ongoing programs to remove trash and debris from Water District property along Coyote Creek through its good neighbor, homeless encampment clean up and Adopt-A-Creek programs. The Water District removes invasive vegetation species and will be undertaking that activity at some locations along Coyote Creek this summer. Removal of vegetation for flow conveyance, including fallen trees, must also meet environmental goals and regulations that protect stream habitat. Vegetation management alone will not prevent future flooding because Coyote Creek has not been improved to convey flood flows.
Pictured: Images of a natural (left) and engineered (right) channel.
6. Why does the Water District need easements to clean the creek near and on private property?
If the Water District can’t remove downed trees on private property because that would be a
“gift of public funds”, why doesn’t it create assessment districts or contract with a public
agency that does have the authority to work on private property to achieve the public benefits
of flood protection?
Water District funding is allocated to a variety of programs. Maintenance priorities are directed to maintaining the capacity and function of completed flood protection projects. These resources are not adequate to acquire easements and conduct maintenance on unimproved channels countywide. Establishing a public responsibility for maintaining private property would be very costly. A new property tax assessment requires voter approval. See comments below in question 7 on efforts to clear the creek.

Page 3
Presidents’ Day Weekend Storm
Responses to Community Questions
7. When and where is the creek being cleared? Is there a standard maintenance schedule and
what maintenance is being performed to clear the creek?
The Water District removed sediment and vegetation on Coyote Creek last summer in improved sections between the bay and Highway 880. The section between Highway 880 and Tully Road is a natural, unimproved area where sediment accumulation and vegetative growth are variables that can impact flow conveyance. We are currently evaluating our options to remove invasive plants at additional locations between Highway 880 and Tully Road this summer. Inspections of improved sections of the creek are both event-driven and conducted at least annually. Maintenance activities to retain the structural integrity of the channel or restore capacity to previously improved section is prioritized with other work within the county. Work to “clear" the creek has limitations as it must be balanced with other public
goals for stream stewardship such as habitat preservation.
8. Why did Coyote Creek flood at cubic feet per second(cfs) rates that were below the capacity
Coyote Creek was able to handle?
The Water District believes that the Rock Springs neighborhood experienced flooding from Coyote Creek at a flow of between 5,600 cubic feet per second (cfs) and 6,300 cfs. The differences between the projections and measured or calculated storm flows are not out of line with industry standards. United States Army Corps of Engineers technical literature cites that a key hydraulic factor can vary by 25%-30% for a natural, unimproved channel like Coyote Creek, which has vegetation growth and accumulated debris that can affect estimates. Stream flows are analyzed based on flow measurements and high water marks collected by staff.
9. Why are the Water District’s system of alert gauges notification difficult to navigate? Does the
Water District need to update its creek flow data? What is the Water District doing to fix any
inaccuracies?
The Water District is working with the City of San Jose to have dedicated flood warning webpages for Coyote Creek. The flood warning webpages will show water level along the creek and flood watch/flood warning level for flood prone areas. The Water District is working on new features for the ALERT website, with the addition of a Google Maps based interface, to help the public navigate the web of sensors. The Water District will review Coyote Creek and other creeks that are at flood risk to ensure that the flow capacity estimates encompass different ranges of uncertainties. This may include field inspection, model calibration, and uncertainty analyses for many at risk creeks.

Page 4
Presidents’ Day Weekend Storm
Responses to Community Questions
10. How did the Water District monitor flood levels and what creek locations did it inspect before
the flood?
Water District staff were at various locations along Coyote Creek. On February 16, 17 and 20, staff performed inspections of downstream levees, and monitored other various locations between the dam and the bay. On February 18 and 19, field staff were on call and serviced areas throughout the county removing tree blockages and at Coyote Canal. On February 20 and 21, the Water District’s Flood Inspection Teams continued to inspect locations at the
Madrone gauge, Rock Springs, E. William Street, Berryessa Road, South Bay Mobile Home Park, Charcot, Montague Expressway, and Highway 237. Staff advised police officers at the South Bay Mobile Home Park on February 21 that peak flow was likely to overtop the levee, whereupon officers announced mandatory evacuations. The Water District’s Emergency
Operation Center (EOC) was advised by Water District staff of the pending overtopping and staff proceeded to install measures to protect the levee. Water District hydrographers obtained real time flow measurements to calibrate stream gauges at Madrone, Edenvale, and E. William Street and communicated to EOC staff. On February 20 and 21, the Water District’s Flood Information Teams were at Coyote Creek to
monitor flow conditions and communicate to EOC staff about the flood risk of the creek. Water District staff also responded to a City request through the EOC to clear debris from Metcalf Road. On February 21 and 22, Water District staff responded to a break in the Coyote Canal and communicated that activity through the EOC.
11. What is the Water District doing about environmental impact directly related to residents’
homes, gardens, pets, and children? What is the toxicity of the water? Is the Water District
going to test the silt on the street and the fruit trees?
The health and wellbeing of the communities we serve are important to the Water District. Many of the Water District’s projects enhance and/or protect the environment. During the
flooding, the Water District received questions about the contamination of tap water. The Water District reached out to the area’s water retailer, the San Jose Water Company, and
shared their information with the public on the safety of drinking water stating that “tap water
supply was not impacted by floods. Absolutely safe to use.” The Water District does not test silt on streets or fruit trees. We conduct testing inside a stream corridor or on selected properties to be acquired by the Water District in preparation for a project such as with the Stream Maintenance Program (SMP) or a capital project. At the last public meeting held in response to the flooding, City of San Jose staff informed attendees to contact the City or visit the Coyote Creek flood and information webpage for assistance on soil testing: http://www.sanjoseca.gov/stormupdate.

Page 5
Presidents’ Day Weekend Storm
Responses to Community Questions
12. How are the parcel taxes (2012 Measure B funds) being spent? Are funds for capital
improvements and maintenance of Coyote Creek included? Can we replicate what we did at
Guadalupe with Coyote?
The Water District is responsible for implementing the Safe, Clean Water and Natural Flood Protection Program (SCW Program) funded by the 2012 Measure B funds under the direction of the Water District’s elected Board of Directors (Board). The Board approves implementation strategies and authorizes any changes during the course of the program. The Board performs a detailed review of the performance, financial analyses, and strategies of the SCW Program each year using annual budget documents and annual reports prepared by Water District staff. The Board will also initiate at least two professional, independent audits during the first 15-year program to ensure accountability. To ensure transparency and accountability, the Water District Board appoints an Independent Monitoring Committee (IMC) of volunteers external to the Water District who provide an independent voice in tracking progress during the duration of the SCW Program. The IMC analyzes annual reports prepared by Water District staff and conducts annual audits of the program. The IMC produces its owns annual report to track Program implementation results, and the Board may direct staff to make necessary adjustments based on IMC findings.
A PDF copy of the Year 3 (Fiscal Year 2015-2016) Annual Report for the Safe, Clean Water Program can be obtained from the Water District webpage using the following link: http://www.valleywater.org/SafeCleanWater.aspx.
The Water District publication reports annual expenditures and progress made toward key performance indicators in each of the priority areas (i.e. outcomes) under the SCW Program. Here is a quick summary of flood protection related work under the SCW Program:
Project E1 Vegetation Control and Sediment Removal for Flood Protection: page 88 of the Year 3 SCW Program Annual Report provides information about the vegetation control and sediment removal for flood protection in the SCW Program. The report provides quantities of vegetation removed and locations and quantities of sediment removal in various creeks where flood protection improvements have been constructed. There is $24.6 million and $9.8 million allocated for vegetation control and sediment removal for improved flood protection channels in the county.
Project E2 Emergency Response Planning: page 93 of the Year 3 SCW Program Annual
Report provides the status of preparing emergency action plans for five watersheds. Preparing the Emergency Action Plan for Coyote Creek is considered a part of Project E2. There is $2.5 million allocated for preparing Emergency Action Plan for five watersheds.

Page 6
Presidents’ Day Weekend Storm
Responses to Community Questions
Project E3 Flood Risks Reduction Studies: page 96 of Year 3 SCW Program Annual Report provides the status of preparing flood risk evaluation for various four areas along four creeks in the county including the Rock Springs area along Coyote Creek. There is $9.4 million allocated for this work.
Coyote Creek Flood Protection Project (from Montague Expressway to Hwy 280): Page 144 of the Year 3 SCW Program Annual Report provides the status of the current Coyote Creek Flood Protection Project. There is approximately $22.6 million to be allocated to this project. As discussed in the three community meetings hosted by the Water District in April, Water District staff is proposing a public hearing by the Board to consider extending the upstream limit of the Coyote Creek Flood Protection Project from Hwy 280 to Tully Road to include the Rock Springs area. The public hearing is anticipated in June 2017.
13. Are the temporary dams in compliance and being taken down appropriately?
The Water District is complying with all regulatory requirements, per the Lake and Streambed Alteration Agreement (LSAA), in regards to the removal and placement of all temporary dams. For instance, the Coyote Percolation Dam near Metcalf Road allows for impoundment of water for groundwater recharge. It is removed to allow for unimpeded passage of flood water when Anderson Dam is spilling.
14. Why does Guadalupe River still reach flood stage? Why hasn't construction finished, including
the trails and bike paths on Guadalupe River?
The Upper Guadalupe River Project is being constructed in reaches or sections (reaches 6 to 12 from approximately Hwy 280 to Blossom Hill Road). However, construction is dependent on the availability of federal funding. Reach 7 is scheduled to begin construction in summer 2018 and extends approximately from the Southern Pacific Railroad (downstream of Willow Street) to the Union Pacific Railroad (upstream of Alma Avenue). The water level in Guadalupe River was reported near flood stage during the February 2017 storm in the vicinity upstream of Alma Avenue. While flood risk can be reduced, precipitation is ultimately the cause of flooding. Climate scientists predict that the intensity of storms is increasing along with global temperatures. No agency of government can guarantee that flooding will not occur; however, the Water District's goal is to reduce flood risk as much as possible with the resources available.
15. What communication did the Water District use to inform individuals of flooding?
Every year in November the Water District mails a floodplain mailer to all property parcels and residents living in a flood zone. The mailer has information for families on what to do prior,
Page 7
Presidents’ Day Weekend Storm
Responses to Community Questions
during, and after a flood, and information on flood insurance. Similar flood preparedness information is available on our website, along with current creek, reservoir and precipitation gauge measurements. The website also has a map of all sandbag locations as well as information on how to use them properly. In addition, our annual flood preparedness media campaign was launched in January. On the week leading up to the storm, the Water District began issuing information on how the public should prepare for a potential flood. The Water District issued information via Nextdoor and other social media, such as Facebook and Twitter. As Anderson Reservoir was nearing capacity, the Water District participated in numerous media interviews and discussed increased flood risks on Coyote Creek. Although the Water District was issuing information on the storms, sandbags, and flooding, the responsibility to initiate an evacuation rests with the City of San Jose. The joint Emergency Action Plan (EAP) being developed by the Water District and City of San Jose will include additional and all available communications tools to inform the public of impending floods. Communications will be in different languages and include various methods that are both technology and nontechnology based. The suggestions received at the three public meetings held by the Water District will be useful in helping to identify the various methods and tools.
16. What are the immediate plans to notify the public in the event that another flood occurs?
When notifying residents, make it the worst-case situation and notify early (Oroville as
example).
The Water District is working closely with the City of San Jose to develop a joint Emergency Action Plan. The Emergency Action Plan will identify earlier response triggers and notification procedures, using information from the most recent events. Notification and evacuation orders are issued by the City.
17. How can the community contact the Water District?
For non-emergencies, the public can contact the Water District via email at [email protected] or by calling 408-265-2600. The public can also utilize the Water District’s
customer response system “Access Valley Water (AVW)” or its mobile app. Individuals can
submit requests, questions, complaints and compliments directly to a Water District staff person to assist them in addressing their inquiry.
18. How will the Water District, City of San Jose, and any other agencies collaborate with each
other?
The Water District and the City of San Jose, in collaboration with the National Weather Service, are already working together to develop a joint Emergency Action Plan. The two agencies are

Page 8
Presidents’ Day Weekend Storm
Responses to Community Questions
also planning joint training exercises to further improve inter-agency coordination.
19. What happened to the action plan 20 years ago? Why wasn’t an action plan in place prior to
the storm? How do we ensure residents are included to review any joint action plan?
After the Rock Springs neighborhood was flooded in 1997, the Water District and the U.S. Army Corps of Engineers conducted a study, beginning in 2000, of the proposed project area to determine whether the Water District and Army Corps of Engineers (the Corps) could partner for the design and construction of a flood protection project. On February 2002, the Corps notified the Water District that the preliminary analysis from the feasibility study did not meet the minimum requirements to be of federal interest. The project was not further developed due to lack of federal funding. The Water District allocated approximately $32M to a Coyote Creek Flood Protection Project in the voter-approved Clean, Safe Creeks Program (2000) and later in the Safe, Clean Water Program (2015). Details about the Safe, Clean Water Program can be found in question 13. Without the additional federal funding, only a limited project could be developed that would provide minimal flood protection benefits to the community. The Water District had followed its action plan and provided the necessary information and data to the City of San Jose to notify residents. As our two agencies prepare for the next rain season, we are working together to develop a joint Emergency Action Plan. The two agencies are also planning joint training exercises to further improve inter-agency coordination. In October 2017 the Santa Clara Valley Water District Board of Directors and the San Jose City Council will hold a joint meeting on the joint Emergency Action Plan.
20. What flood prevention actions are the Water District taking to prevent another flooding incident
on Coyote Creek? To help prevent future flooding, is the Water District evaluating how climate
change is impacting the weather and natural flood solutions?
The Water District is asking for federal assistance to address, reduce and prevent future flooding of vulnerable areas along Coyote Creek. The District is also seeking to expand state grant programs to local agencies for flood protection, including the Coyote Creek Flood Protection Project.
With the funds allocated to a Coyote Creek project in the Safe, Clean Water, and Natural Flood Protection Program, staff will propose options to the Board of Directors to provide some degree of flood protection to the impacted areas along Coyote Creek, while pursuing a federal project with the U.S. Army Corps of Engineers. The Water District is actively working with the City of San Jose to develop a thorough joint Emergency Action Plan and to ensure improved emergency communications. We expect to have the plan in place prior to the next rainy season.
Page 9
Presidents’ Day Weekend Storm
Responses to Community Questions
Any actions and plans concerning future flood protection will be released through the Water District's Natural Flood Protection planning process, which also addresses anticipated climate change impacts.
21. Why is the City of San Jose not using the Water District’s information to give emergency
warning to residents to evacuate early?
The Water District cannot speak for the City. However, the City and Water District are working closely to develop a joint Emergency Action Plan and to conduct joint training exercises to further improve inter-agency coordination and communication.
22. Who is responsible? Is there a third or independent party doing an evaluation of what
happened? If not, why not?
Weather events overtook Coyote Creek’s current capacity to safely move water downstream
to the San Francisco Bay. Beginning on Friday, February 17, a series of “atmospheric river”
storms brought more rain to the Coyote Watershed than the Anderson Reservoir and Coyote Creek could handle. Even though the Water District had been releasing water through the outlet at the base of Anderson Dam since early January 9, the amount of water flowing into the reservoir brought the level to 100% capacity on Saturday, February 18. When capacity exceeded 100%, flows began over the spillway, (as designed), and into Coyote Creek. As a significant storm was forecast for Sunday evening, February 19, the Water District’s Emergency
Operations Center was officially elevated from monitoring to full activation at 8 a.m. on Monday, February 20. The City of San Jose and other regional emergency staff had been notified of the predictions during regularly scheduled conference calls that were held as early as February 15 for a smaller storm system, and February 17 for the heavier storm arriving Sunday and lasting through Tuesday, February 21. The City also had an emergency staff person present in our EOC who was receiving the same information as our staff. The steadily increasing flows into Anderson Dam (and over the spillway) were being closely monitored and communicated to EOC personnel. The Division of Safety of Dams (DSOD), which regulates dam safety, does not have oversight of Coyote Creek and is not investigating the flooding event. The Water District is not aware of any efforts by an independent party to perform an evaluation of what happened. The Water District is finalizing its After Action Report, which assesses the actions in our Emergency Operations Center (EOC) during its activation. The report will be completed by the end of May and submitted to Santa Clara County’s Office of Emergency Services and Governor’s Office
of Emergency Services (Cal OES). A copy of the report will be available on the Water District’s
website.
Water District staff has assessed and reported to the Board of Directors at a March 29 Special Meeting its findings of the events that occurred over the Presidents’ Day weekend. This report

Page 10
Presidents’ Day Weekend Storm
Responses to Community Questions
along with all of information associated with this meeting can be found on Water District’s
agenda page provided here: https://scvwd.legistar.com/Calendar.aspx. A special joint Santa Clara Valley Water District Board of Directors and San Jose City Council and Mayor meeting occurred on April 28. For information on the jointly agreed actions and next steps, please visit the Water District’s agenda page at: https://scvwd.legistar.com/Calendar.aspx.
23. What are the Water District’s efforts to help communities in need? Can residents file a claim?
What is the Water District's process to distribute information to the community?
Details on how to file a claim against the Water District can be found on our website at: www.valleywater.org/FilingAClaim/. Individuals can also request a claim form from the Water District’s risk manager David Cahen at [email protected]. The claim forms were also available to attendees at each of the three public meetings. Through the distribution of the community question responses, information on how to file a claim will be available to the impacted communities. Soon after the flooding, the Water District’s Board of Directors acted and approved
repurposing up to $450,000 in a current contract with San Jose Conservation Corps to assist the City of San Jose’s response to health and safety efforts in the impacted neighborhoods.
Through the Water District’s internal employee communications, the Interim CEO sent
information on how and where employees can volunteer and/or assist flood victims or with recovery efforts. This information is also on the Water District’s website. The Water District also has joined with state legislators representing San Jose in advocating for a $10.4 million state appropriation to provide financial assistance to residents impacted by the Coyote Creek flood. That budget request is currently under consideration by the Legislature and the Governor.
24. The Water District imports water and doesn’t need the reservoirs.
About 55% of Santa Clara County’s annual water demand is met with imported water from
Northern California, which the District obtains through water contracts from State Water Project and federal Central Valley Project. About 30% of the County’s annual demand is met by capturing local runoff in the District’s reservoirs. Water stored in these reservoirs is used to replenish the groundwater basin and is also conveyed to the District’s water treatment plants
to supply drinking water. If the Water District were to rely entirely on imported water, much more water would have to be brought into the county through the complex infrastructure of State and federal projects and San Francisco’s Hetch Hetchy system. Increasing our share of imported water is unlikely to occur due to the environmental impacts and political challenges associated with diverting more water from the Bay Delta. Local reservoirs will continue to play an important role in the county’s annual water supply.
Page 11
Presidents’ Day Weekend Storm
Responses to Community Questions
25. What can the Water District do to limit overtopping of Anderson and Coyote reservoirs from
causing floods?
Anderson and Coyote reservoirs were built to serve the water supply needs of Santa Clara County and were not designed to provide downstream flood protection. The water captured in these reservoirs during the rainy season is vital to the water supply of the county. The reservoirs are operated for water supply purposes by a set of rules consistent with the Federal Energy Regulatory Commission and the California Division of Safety of Dams. The reservoir operating criteria provide incidental flood protection by buffering the effects of significant watershed runoff after large storms. Flood protection projects in creeks or rivers below all of the Water District’s reservoirs are designed with the assumption that the reservoirs are full.
26. When did Coyote Reservoir begin overflowing?
Coyote Reservoir began to overflow on January 10, 2017.
27. If a major earthquake were to happen in the vicinity of Anderson Dam, what direction would
flooding occur if the dam was damaged?
As the dam operator, the Water District creates inundation maps to show areas of potential flooding in the event of dam failure, as required by the Federal Dam Safety and Security Act. The Water District provides these maps to local governments, which in turn adopt emergency procedures for the evacuation and control of areas in the event of a dam failure. The inundation maps for Anderson Dam are available here: http://www.valleywater.org/Services/AndersonDamAndReservoir.aspx. Users of these maps are advised that because of the method, procedures, and assumptions used to develop the flood areas, the limits of flooding shown and flood wave travel times are approximate and should be used only as a guideline for establishing evacuation zones. The extent of flooding will depend on actual failure conditions and may differ from areas shown on the maps.
28. When does the Water District expect to have Anderson Dam seismically retrofitted?
Project planning for the Anderson Dam Seismic Retrofit Project began in 2011 based on the results of a seismic stability evaluation. During the design phase, which began in 2013, additional evaluations and explorations revealed previously unidentified seismic deficiencies, which extended the length of time necessary to complete the project. Construction is anticipated to begin in Spring 2020 and completed by 2024. The construction duration is a function of the large amount of earthwork that must be done at the site and the limited length of the summer construction season. Wet winter weather generally prevents earthwork from being performed from October 15 through April 15,
Page 12
Presidents’ Day Weekend Storm
Responses to Community Questions
therefore most of the earthwork and construction on the reservoir side of the dam must be completed in the dry summer months. This constraint results in a longer construction schedule.
29. How accurate is the Anderson Dam outflow? What is being done to fix outflow issues?
The stream gauge downstream of Anderson Dam is accurate for measuring the outflow from the dam outlet and spillway during the flood event. The new dam design for the Anderson Dam Seismic Retrofit Project has two outlet pipes which will improve capacity and reliability at full capacity. Though scarce and difficult to obtain, field measurements of stream flows assist in calibrating the stream gauge for accuracy. However, natural creek characteristics often change. A natural stream like Coyote Creek is especially challenging due to the lack of high flow data and changing conditions between large flood events. From this event, the Water District has obtained many observation points to improve flow ratings for gauges along Coyote Creek.
The following are responses to the questions asked at the April 6th community meeting and workshop.
30. Why didn’t people know there will be flooding when dam is full?
The Water District believes it provided sufficient information and context to convey the flood risks for vulnerable areas along Coyote Creek. The Water District followed the procedures and protocols and provided the necessary information and data to the City of San Jose for it to notify residents that flooding was imminent in the Presidents’ Day storm event. The Water District provided the most accurate information available. The information on creek flow estimates from our hydrologists include both actual data from gauges along our waterways, and modeling estimates based on past events. Monday night, Feb. 20, as the gauges indicated the flows coming over the Anderson spillway were rising and could reach flood levels faster than initially expected, District staff adjusted the flow estimates at the various downstream locations. That information was shared with the City and city staff embedded in the Water District’s Emergency Operation Center (EOC).
31. Heavy rain was forecasted 10 days before. Why not consider pumps to decrease water levels
in preparation at Anderson and Coyote Reservoir?
Since before the flooding, The Water District has been evaluating the possibility of pumping water out of the reservoir to lower it to the Division of Safety of Dams (DSOD) restricted level. The Water District has not considered pump-over for flood management. The preliminary pumping scheme is currently being reviewed by DSOD and Federal Energy Regulatory Commission (FERC). If required, The Water District may implement the pumps once DSOD and
Page 13
Presidents’ Day Weekend Storm
Responses to Community Questions
FERC approves the pump-over design and necessary environmental permits have been obtained.
32. Reference to question 18 on the FAQ – No assurance the dam will never exceed 68%. Doesn’t
feel safe as a standard.
Anderson Reservoir has operated well for the last 67 years and through several major earthquakes. It wasn’t until 2011 that Anderson Reservoir was restricted to 68% of its capacity. This restriction is an interim risk reduction measure, while the retrofit project is constructed, to prevent the uncontrolled release of reservoir water in case the dam slumped and cracked during a large earthquake near the dam. The restriction has been imposed with the understanding that it could be exceeded during very wet winters and the reservoir could remain above the restricted level for unpredictable time periods. The seismic analyses and recommended restrictions are based on extremely conservative assumptions of a Maximum Credible Earthquake (MCE) and that such an event would occur at the closest proximity to the dam. The probability of a large earthquake occurring near the dam during these time periods and the risk associated with it are relatively low. This restriction was reviewed and approved by DSOD and FERC. The Water District is currently re-evaluating the restriction based on the new findings discovered during the development of Anderson Dam Seismic Retrofit Project.
33. 67 years of Anderson dam not being fixed, why?
Seismic behavior of dams was not well understood in 1950s, when Anderson Dam was constructed. The Water District undertook the seismic evaluation of Anderson Dam in 2009 with the goal of verifying the performance of the dam during a large earthquake, based on the latest seismic standards. The evaluation was approved by the Division of Safety of Dams (DSOD) and Federal Energy Regulatory Commission (FERC). The Water District initiated the Anderson Dam Seismic Retrofit Project in 2011 once it was concluded by the seismic evaluation that the dam foundation could liquefy and lose strength during a large earthquake occurring near the dam.
34. Why not keep reservoirs lower than mandated? The Water District manages the Anderson and Coyote reservoirs in accordance with existing operating procedures and requirements based on known and forecast information available at the time. The Water District has been evaluating the possibility of pumping water out of the reservoir to lower it to the Division of Safety of Dams (DSOD) restricted level. The Water District has not considered pump-over for flood management. The preliminary pumping scheme is currently
Page 14
Presidents’ Day Weekend Storm
Responses to Community Questions
being reviewed by DSOD and Federal Energy Regulatory Commission (FERC). If required, The Water District may implement the pumps once DSOD and FERC approves the pump-over design and necessary environmental permits have been obtained.
35. If the Water District knew about the flooding, why wasn’t the EOC open? (Feb. 19-20)
The Water District had staff in the Water District’s Emergency Operations Center (EOC) during
the weekend on both Saturday and Sunday leading up to the storm to monitor weather conditions. Additionally, District staff were in the field assessing conditions and supplying the sand bag locations. Staff was monitoring weather forecasts, held a Water District storm assessment team conference call and also participated in inter-agency conference calls to convey estimated flow rates projected to come over the spillway from Anderson Reservoir as well as other locations countywide. District staff also participated in the National Weather Service’s webinar on the storm forecast on Sunday, February 19, 2017. From these calls, it was
decided to activate the Emergency Operations Center (EOC) at 8 am on Monday Feb. 20. The EOC remained open until the evening of Wednesday February 22.
36. Why were animals moved from the zoo ahead of time, but not people?
Happy Hollow Park and Zoo is owned and operated by the City of San Jose. The decision to evacuate animals was made by city staff. This question must be referred to the city for a response.
37. When and where is the creek being cleared?
The Water District removed sediment and vegetation on Coyote Creek last summer in improved sections. We are currently evaluating our options to remove invasive plants at some additional locations this summer.
38. Are there unimproved sections of Coyote Creek?
Most of Coyote Creek upstream(south) of Montague Expressway is unimproved.
39. Why are the capacity projections off by a surprising amount?
Much like weather predictions, creek capacity estimates for a natural creek are variable. Creek capacity estimates also can change over time. Coyote Creek capacity estimates are based on best available historic data and are within industry range.

Page 15
Presidents’ Day Weekend Storm
Responses to Community Questions
40. Why was Guadalupe Creek successful and Coyote Creek not?
The Lower Guadalupe River Project and Downtown Guadalupe River Project from the Marina County Park in Alviso to Interstate 280 were completed in 2004. The Lower Guadalupe River Flood Protection Project was completed with local funds and the Downtown Guadalupe River Flood Protection Project was a joint project with the U.S. Army Corps of Engineers. The Lower Coyote Creek Flood Protection Project, from South San Francisco Bay to Montague Expressway, was another joint project with the U.S. Army Corps of Engineers completed in 1995. Due to limited federal funding and the competitive nature of the benefit-to-cost ratio for federal participation, the mid-Coyote Creek Project has not received federal funding to proceed with a flood risk reduction study upstream of Montague Expressway. With the recent flooding along Coyote Creek from the Presidents’ Day storm, The Water District sent a letter to the U.S. Army Corps of Engineers requesting federal funding to proceed with the flood risk reduction study for Coyote Creek upstream of Montague Expressway. The Water District is focusing on the following flood protection projects based on the flood damage benefits in the Coyote Watershed: design and construction of the Lower Penitencia Creek Project, design and construction of the Lower Berryessa Creek Project, design and construction of the Upper Berryessa Creek Project, design and construction of the Lower Silver Creek Project, design and construction of the Cunningham Detention Certification Project, and planning and partial construction of the Coyote Creek Project (from Montague Expressway to Interstate 280). Additional funding sources are needed to complete flood protection work along Coyote Creek.
41. When is the Water District going to clean Coyote Creek to prevent future flooding?
The Water District has ongoing programs that remove trash and debris from District property along Coyote Creek through its good neighbor, homeless encampment clean ups and Adopt A Creek programs. The Water District removes invasive vegetation species and will be undertaking that activity at some locations along Coyote Creek this summer. This work alone will not prevent future flooding because Coyote Creek has not been improved to convey flood flows.
42. Is the Water District considering installing a floodwall along the creek?
The Water District is currently evaluating potential options to provide limited flood protection in the Rock Springs area. However, we must ensure that any proposed concepts do not shift or exacerbate the flood risk elsewhere that could impact other neighborhoods. Flood protection projects should be completed downstream first. Completing projects along upstream stretches of the creek can increase flows downstream and induce flooding in other areas.
Page 16
Presidents’ Day Weekend Storm
Responses to Community Questions
43. Communication about this meeting was not sufficient.
The Water District notified residents about these meetings via postal mail, electronically, and through other public agencies. Our initial outreach included mailers to all homes in impacted areas, a countywide posting on the Nextdoor social media website, and by electronic notification from city council offices and a school district in impacted areas. The Franklin McKinley School District is helping the Water District coordinate and notify impacted families through use of their community liaison. We also coordinated flyer distributions with the mobile home park managers at the Golden Wheel Park and the South Bay Mobile Home Park. Lastly, a press advisory was issued resulting in various news stories announcing the meetings on air. Mailed notices were sent out in English, Spanish, Vietnamese.
44. Is the Division of Safety and Dams investigating the flooding events?
The Division of Safety of Dams (DSOD) regulates safety aspects related to dams. Anderson Reservoir is operated by The Water District as a water supply facility. The DSOD does not have jurisdiction on Coyote Creek and is not investigating the flooding event.
45. How was the recent bond money spent (Safe, Clean Water and Natural Flood Protection)?
In November 2012, the voters of Santa Clara County overwhelmingly supported Measure B, the Safe, Clean Water and Natural Flood Protection Program. The Independent Monitoring Committee annually reviews the implementation of the intended results of the program and reports its findings to the Santa Clara Valley Water District Board of Directors, which makes the Committee report available to the residents and voters of Santa Clara County. The Fiscal year 2015/2016 report along with financial information is available online at www.valleywater.org/SafeCleanWater.aspx.
46. Sandbag locations were closed, why?
Water District staff attempted to deliver sandbags to the city corporation yard, but the facility was closed and locked. This occurred on Monday, February 20, 2017 at 8:53am and the site was unstaffed due to the holiday. The Water District contacted the City of San Jose Park Service and was finally able to gain access to Kelly Park, an alternative pick up site, by 11:15 am. It should be noted that this site is yards from the Rock Springs area and under 2 miles from the William Street area. Sandbags are delivered to a variety of locations; there are 7 filled sandbag sites throughout Santa Clara County, 4 of which are located on City of San Jose owned yards. The Sandbag sites are generally located in areas that are not subject to flooding to allow access during an
Page 17
Presidents’ Day Weekend Storm
Responses to Community Questions
event. The sites are identified on the Water District’s web site so that the community can be
informed of their availability.
47. Hotspots map: Where was lower Silver Creek on the map of hotspots? Silver Creek floods as
well.
Several historic hotspots on Lower Silver Creek have been eliminated due to construction of the Lower Silver Creek Flood Protection Project improvements, currently in final phases of completion.
48. What is the Santa Clara District Fee Area?
This refers to property owned by the Water District. The Water District owns property and holds easements at various locations throughout the county.
49. Saw City deliver sandbags to residents, but where was the Water District or County?
The Water District provides sand and sandbags to 7 locations throughout the county. These deliveries are made by a contractor. District staff along with San Jose Conservation Corps crews were filling sandbags as quickly as possible to ensure availability of bags.
50. Evacuation orders happened after water was receding.
The Water District is not responsible for calling evacuations. Local municipalities are charged with calling evacuations as they direct their respective emergency response departments (police and fire).
51. Why is Santa Clara Valley Water District not giving information clearly, properly to the City of
San Jose about flood on Feb. 22?
The Water District believes it provided sufficient information and context to convey the flood risks for vulnerable areas along Coyote Creek. The Water District followed the procedures and protocols and provided the necessary information and data to the city for it to notify residents that flooding was imminent in the Presidents’ Day storm event.
The Water District provided the most accurate information available. The information on creek flow estimates from our hydrologists include both actual data from gauges along our waterways, and modeling estimates based on past events. Monday night, Feb. 20, as the gauges indicated the flows coming over the Anderson spillway were rising and could reach
flood levels faster than initially expected, District staff adjusted the estimates as to how high the flows may get at the various downstream locations. That information was shared with the
Page 18
Presidents’ Day Weekend Storm
Responses to Community Questions
city and city staff embedded in the Water District’s Emergency Operations Center. The Water District is not responsible for calling for evacuations, however a period of 24 to 48 hours is likely appropriate to facilitate a timely and orderly evacuation. It's unclear what trigger the City of San Jose was using for its evacuation decision. If it was the flow rates from Coyote Creek that only would have provided for a maximum of 4-6 hours of notice. The Water District is working with the City of San Jose to jointly establish an emergency action plan which will provide for adequate notice in the future.
Frequently Asked Questions shared at the public meetings
52. What is the Santa Clara Valley Water District (Water District) doing to develop an emergency
action plan for Coyote Creek?
The Water District is working with the City of San Jose to prepare an Emergency Action Plan for Coyote Creek. Since this plan will not be complete until after this rainy season is over, the Water District will be coordinating and communicating with the City in the near term to provide technical expertise to advise the City on hydrologic conditions. The Water District will also be coordinating field resources and equipment with the City during any potential flood events. The City has expressed a desire to have at least a 12-24 hour notice to begin planning for emergency flood conditions. To provide the City the best available information, the Water District is updating current channel capacities based on the recent flooding and available hydraulic models, will be monitoring actual creek flows, and will be forecasting creek flows based on National Weather Service forecasts. The Water District has recommended that close communication and coordination be initiated at each trigger point in addition to normal Emergency Operation Center (EOC) protocols.
Our recommendations to the City are:
a. Establish time-bound decision points for certain protective action decisions that allow enough time to execute the field operations necessary to implement the decision: for example, how much time is necessary to provide advance notification of possible evacuations to the public, and how much time is necessary to evacuate populations with English-as-a-second language and with access and functional needs.
b. Gain authorization to use communication systems such as IPAWS, Alert SCC, Reverse 911, etc.
c. Install flood evacuation routes signage.
The Water District believes that the Rock Springs neighborhood experienced flooding from Coyote Creek at a flow of between 5,600 cubic feet per second (cfs) and 6,300 cfs. Based on that information and the inherent uncertainty of an unimproved, natural creek with additional drainage area below the stream gauge, The Water District has recommended that the City adopt a warning tier system.
Page 19
Presidents’ Day Weekend Storm
Responses to Community Questions
53. Did the Water District provide wrong information to the city?
The Water District believes it provided sufficient information and context to convey the flood risks for vulnerable areas along Coyote Creek. The Water District followed the procedures and protocols and provided the necessary information and data to the City for it to notify residents that flooding was imminent in the Presidents’ Day storm event.
The Water District provided the most accurate information available. The information on creek flow estimates from our hydrologists include both actual data from gauges along our waterways, and modeling estimates based on past events. Monday night, Feb. 20, as the gauges indicated the flows coming over the Anderson spillway were rising and could reach flood levels faster than initially expected, Water District staff adjusted the estimates as to how high the flows may get at the various downstream locations. That information was shared with the city and city staff embedded in the Water District’s EOC. The Water District is not responsible for calling for evacuations, however a period of 24 to 48 hours is likely appropriate to facilitate a timely and orderly evacuation. It's unclear what trigger the City of San Jose was using for its evacuation decision. If it was the flow rates from Coyote Creek, that would have only provided for a maximum of 4-6 hour notice. The Water District is working with the City of San Jose to jointly establish an emergency action plan which will provide for adequate notice in the future.
54. How are stream gauges used?
Existing upstream gauges are useful in providing stream flow information in advance of a “hot
spot” area such as Rock Springs. It is also important to note that gauges are mechanical
devices and are susceptible to damage and interference when subject to debris and impacts of high flows. Radio signals also have reliability issues during adverse weather. We continue to recommend that local jurisdictions augment Water District forecasts and gauge data with field staff observations.
55. Did the Water District monitor conditions along the Coyote Creek corridor prior and during the
storm event?
Water District staff were at various locations along Coyote Creek. On February 16, 17 and 20 staff performed inspections of downstream levees, and monitored other various locations between the dam and the bay. On Feb 20 and 21, Flood Inspection Teams continued to inspect locations at the Madrone gauge, Rock Springs, E. William Street, Berryessa Road, South Bay Mobile Home Park and Charcot, Montague Expressway, and Highway 237. Staff advised police officers at the South Bay Mobile Home Park on Feb 21 that peak flow was likely to overtop the levee whereupon officers announced mandatory evacuations. The Water District’s EOC was advised by Water District staff of the pending overtopping and staff proceeded to install measures to protect the levee.

Page 20
Presidents’ Day Weekend Storm
Responses to Community Questions
Water District hydrographers obtained real time flow measurements to calibrate stream gauges at Madrone, Edenvale, and E. William and communicate to EOC staff.
On Feb 20 and 21, the District’s Flood Information Teams were at Coyote creek to monitor flow
conditions and communicate to EOC staff about flood risk of the creek.
On Feb 21 and 22, Water District staff responded to a break in the Coyote Canal and communicated that activity through the EOC. Staff also responded to a City request through the EOC to clear debris from Metcalf Road on Feb 20 and 21.
56. Are there technological improvements that can be implemented with the Water District's
sensors at key locations (e.g., Edenvale, William Street) that will provide a clearer indication of
flood risk?
While technology such as telemetry sensors is a useful tool for obtaining some field information, night time visibility and reliability limits its potential. Storm monitoring should rely on multiple lines of information including field reports.
57. Could the Water District have prevented the flooding?
No. Weather events overtook the Coyote Creek’s current capacity to safely move water
downstream to the San Francisco Bay. Channel obstructions and vegetative growth can contribute to increases in water level of a stream. The degree to which obstructions may have contributed to the flooding is difficult to determine after the fact because obstructions and vegetation may have been cleared out as the floodwaters moved through. The upstream area of Coyote Creek that recently flooded is not an improved flood protection channel. It is a natural, unimproved creek that has not been analyzed, designed, permitted, and constructed to convey a specific flood event. Sediment accumulation and vegetative growth are variables that can impact flow conveyance as such the creek cannot be “maintained.” The Water District has communicated with the city and adjacent Coyote Creek
property owners about flood risk.
The Water District maintains property where it has built projects and possesses land rights. Maintenance can include vegetation management, erosion control and sediment removal, which are conducted to maintain the existing capacity of a stream. The type and level of maintenance depends on a variety of factors, most significantly whether there has been a capital project that has constructed flood protection modifications to convey flood flows. The Water District owns or has access to maintain 275 miles of the 800 miles of the creeks and rivers in Santa Clara County.
Page 21
Presidents’ Day Weekend Storm
Responses to Community Questions
58. Was the channel capacity data provided to the City of San Jose by the Water District
accurate?
The Water District believes that the Rock Springs neighborhood experienced flooding from Coyote Creek at a flow of between 5,600 cubic feet per second (cfs) and 6,300 cfs.
The differences between the projections and measured or calculated storm flows are not out of line with the industry standards. United States Army Corps of Engineers technical literature cites that a key hydraulic factor can vary by 25%-30% for a natural, unimproved channel like Coyote Creek, which has vegetation growth and accumulated debris that can affect
estimates. Stream flows are analyzed based on flow measurements and high water marks collected by staff.
The City was aware of the forecasts predicting flooding from the National Weather Service and from a technical and professional standpoint should have been relying on all the data presented rather than basing its actions on one single piece of data.
59. Does the Water District monitor sediment accumulation and vegetation growth in the creeks?
The Water District monitors sediment and vegetation growth for flow conveyance capacity on improved flood protection channels that have been analyzed, designed and constructed to ensure they can carry a specific flood event (i.e 1% event). Extensive hydraulics analysis, civil engineering design, environmental work, land rights acquisition and regulatory permitting must take place prior to building an improved channel.
Coyote Creek in the areas that recently flooded is not an improved flood protection channel. It is a natural, unimproved creek that has not been analyzed, designed, permitted, and constructed to convey a specific flood event. Sediment accumulation and vegetative growth are variables that can impact flow conveyance. The Water District has communicated with the city and adjacent Coyote Creek property owners about flood risk.
60. In addition to the channel capacity estimates provided by the Water District, what other
information was available leading up to the flooding?
In addition to all the information--both written and verbal provided by the Water District--the City had additional warnings and information from other agencies on which to consider and act: The National Weather Service held a webinar on Friday, Feb. 17, at 2:30 pm with the operational area, which includes invitations to the City of San Jose, the Water District and others, to collectively discuss the anticipated storm. On Sunday, Feb. 19 at 2:30 pm the National Weather Service (NWS) held a subsequent webinar and shared that the stream forecast at the Edenvale gauge was predicted to reach flood stage between Monday and Tuesday.

Page 22
Presidents’ Day Weekend Storm
Responses to Community Questions
On Monday, Feb. 20 at 3:53 am, NWS issued a Flood Warning for Coyote Creek near Edenvale. The Flood Warning indicated that Coyote Creek at Edenvale was forecasted to rise above flood stage by Monday evening and continue to rise through the night. California Nevada River Forecast Center website showed that Coyote Creek at Edenvale would exceed the flood stage by mid-day on Monday, Feb 20, and peak at more than 7,600 cfs on Tuesday, Feb. 21 in the morning. These warnings gave the City time to inform, alert and notify residents that evacuation was necessary prior to the flooding. The City gave every indication that it was taking this action (opening shelters), but did not issue an evacuation notice.
61. What is the degree of accuracy of the hydrologic model used by the Water District?
A hydrologic model is only as accurate as the weather forecast is accurate. Rainfall is one of the primary factors affecting the prediction of flow amount and timing from a storm. The Water District typically updates its stream forecast when the National Weather Service updates its weather forecast.
62. How has the Water District utilized funds from the 2012 voter approved Measure B to support
creek maintenance and flood safety measures along Coyote Creek?
A. Creek Maintenance
Priority E1 of the Safe Clean Water Program supports the Water District’s ongoing sediment
removal and vegetation management activities that reduce flood risk by maintaining design conveyance capacity of flood protection projects. There are 800 miles of creeks and streams in Santa Clara County and the Water District only has access or owns 275 miles. The remaining stretches of creeks are owned by Santa Clara County, private entities, cities in which the creeks are located, and other public agencies.
B. Coyote Creek Flood Protection Project Planning
The Water District study provided valuable understanding of the flooding problem and potential solutions. However, the study also concluded that the cost of a project far exceeded the funds allocated from Measure B. The Water District even pursued federal funding for a project, but was unable to gain traction for that funding from the federal government. Without additional funding, only a limited project could be developed that would provide minimal flood protection benefits to the community.
C. Automated flood forecast and warning system
The Water District has been working on the Coyote Creek flood warning system and has completed both hydrologic and some hydraulic models. It is one of the most difficult forecast points because of dual reservoir influence (both Coyote Reservoir and Anderson Reservoir feed into it) and the abundance of tributaries throughout the creek length. With the work in its current state, we can develop forecasts of the Anderson spillway during this year’s storm events.

Page 23
Presidents’ Day Weekend Storm
Responses to Community Questions
Expenditure of funds is overseen by an independent monitoring committee and status reports are provided on the Water District’s web site. The program does not identify making funds
available to individual property owners or cities for vegetation control or sediment removal.
63. Why hasn’t there been a project on Coyote Creek since the floods in 1997?
After the Rock Springs neighborhood was flooded in 1997, the Water District and the U.S. Army Corps of Engineers conducted a study, beginning in 2000, of the proposed project area to determine whether the Water District and Corps could partner for the design and construction of a flood protection project. On February 2002, the Corps notified the Water District that the preliminary analysis from the feasibility study did not meet the minimum requirements to be of federal interest. The project was not further developed due to lack of federal funding. The Water District allocated approximately $32M to a Coyote Creek Flood Protection Project in the voter-approved Clean, Safe Creeks Program (2000) and subsequently the Safe, Clean Water Program (2012). Funding from those programs was used for project planning, which identified a need for $500 million to $1 billion. The project was placed on hold in Fiscal Year 2016 due to the need for additional funding sources.
64. What is the Water District doing now?
The Water District is asking for federal assistance to address, reduce and prevent future flooding of vulnerable areas along Coyote Creek. With the funds allocated to a Coyote Creek project in Safe, Clean Water, staff will propose options to the board of directors in efforts to provide some degree of flood protection to the impacted areas along Coyote Creek while pursuing a federal project with the U.S. Army Corps of Engineers. The Water District is actively working with the City of San Jose to develop a thorough joint emergency action plan and to ensure improved emergency communications. We expect to have the plan in place prior to the next rainy season.
65. Is the Water District considering options for a temporary floodwall between Needles Drive and
Bevin Brook?
The Water District is currently evaluating potential options to provide limited flood protection in the Rock Springs area. However, we must ensure that any proposed concepts do not shift or exacerbate the flood risk elsewhere that could impact other neighborhoods. Flood protection projects should be completed downstream first. Completing projects along upstream stretches of the creek can increase flows downstream and induce flooding in other areas.
Page 24
Presidents’ Day Weekend Storm
Responses to Community Questions
66. What is the Anderson Dam Seismic Retrofit project?
Anderson Reservoir is the largest of the 10 Water District reservoirs and provides a reliable supply of water to Santa Clara County. It has a total storage capacity of 89,073 acre-feet (one acre-foot is 325,851 gallons of water, enough to serve two households of five for one year). The Water District initiated the Anderson Dam Seismic Retrofit Project in 2012 as a permanent fix to the risks identified by a seismic study. In addition to seismically retrofitting the dam embankment, the planning phase of the project identified the need to:
Replace the existing outlet pipe that runs below the dam to improve capacity and reliability
Increase the wall height of the concrete spillway to approximately 9 ft. and the height of the dam crest to 7 ft. to provide more freeboard required to pass the revised Probable Maximum Flood (PMF)
A storage restriction of about 55 feet below the dam crest or about 25 feet below the spillway height has been put in place to protect the public, reducing the allowed storage capacity to 61,810 acre-feet. The Water District and regulatory agencies believe that this restriction will prevent the uncontrolled release of water in case the dam is structurally damaged after a major earthquake. This project is currently in the design phase.
67. Did the Water District release too much water from Anderson Reservoir to cause the flooding?
No, the water that flowed into Coyote Creek from Anderson reservoir was entirely due to the amount of rainfall and watershed runoff. The Water District began releasing water from Anderson Reservoir through the outlet at the base of the dam on Jan. 9, after the first atmospheric river of the season hit our region. At that time the county’s largest reservoir was less than half full at 48%. The outlet stayed open almost continuously as the subsequent storms dropped unprecedented amounts of rain in the watershed until the reservoir level reached the spillway on Feb.18. At that point the outlet was closed and the excess water flowing into the reservoir continued over the spillway and into Coyote Creek. There is no way to control that flow spilling from the reservoir.
68. What does the Water District do when the water level exceeds the reservoir’s restriction? Isn’t it
at a higher risk of failure?
Since Anderson Dam was built in 1950, the reservoir has reached its capacity 11 times, including this past February. The regulatory agencies that work with the Water District to set the storage restriction understand that the reservoir water surface elevation cannot always be maintained at or below a restricted level. For example, they understand that storms produce rainfall runoff into reservoirs that will temporarily increase the amount of water stored, such as
Page 25
Presidents’ Day Weekend Storm
Responses to Community Questions
what occurred in early 2017. The Water District makes every effort to restore the reservoir to its restricted level to stay in compliance with the regulatory requirements. Efforts include fully opening the outlet and exploring pump over systems to increase discharge rate. When the reservoir exceeds the restricted level the dam is at greater risk of seismic deformations during a large seismic event. While earthquakes cannot be predicted with any precision, the chance of a large earthquake occurring and the epicenter being located at the nearest point to the dam during the limited time the reservoir is above the restricted level is extremely remote. Keep in mind that since its construction in 1950, this dam has performed well in numerous earthquakes, including the 1984 Morgan Hill Earthquake and the 1989 Loma Prieta Earthquake.
69. What are the risks of dam failure before construction?
The Water District has limited the amount of water that can be stored in the reservoir to reduce the likelihood of water overtopping the dam should damage occur during a large earthquake prior to construction of the retrofit project.
The dam’s two regulatory agencies, the Federal Energy Regulatory Commission (FERC) and the California Division of Safety of Dams (DSOD) have approved the restriction as a temporary and reasonable solution to protect the public.
70. Will the spillway improvements increase the risk of flooding for downstream properties?
The spillway modifications will not increase the amount of water that will spill. Instead, it will increase the volume of storm runoff that can be safely passed without overtopping the dam. Because Anderson Reservoir absorbs and stores runoff from the surrounding watershed, it provides a measure of flood protection to downstream property owners even when full, despite the fact that it was not constructed as a flood protection project.
For additional information or to sign up to receive updates on the Anderson Dam Seismic Retrofit Project, please go to: www.valleywater.org/Services/AndersonDamAndReservoir.aspx

APPENDIX C: DAMAGE ASSESSMENT

Category City of Morgan Hill FAF RDA
County Labor
County Parks SCVWD Sunnyvale Milpitas
City of Santa Clara SCVOSA
San Jose SJUSD VTA Cupertino County Fire
Town of LosGatos
City of Saratoga TOTAL COUNTY Only
IA Primary Residence Damages 30,000.00 50,000,000.00 50,030,000.00 ‐
PA Category A: Debris Removal & Disposal 8,023.00 454,203.00 1,815,000.00 27,028.00 1,152,553.00 2,000.00 14,500.00 32,399.00 2,546.00 75,000.00 3,583,252.00 454,203.00 PA Category B: Emergency Protective Measures 4,167.00 38,706.00 53,834.93 908,748.00 8,901.00 2,131.00 5,000.00 261,043.00 500.00 35,096.53 1,399.00 1,319,526.46 92,540.93 PA Category C: Road & Bridge Systems (non-Federal) 11,000.00 20,350,000.00 8,200.98 120,000.00 500,000.00 2,520,000.00 450,000.00 23,959,200.98 20,369,200.98 PA Category D: Water Control Facilities (levees, dams, & channels) 5,655,500.00 12,358.00 250,000.00 5,917,858.00 ‐ PA Category E: Public Buildings & Equipment 315,000.00 5,898.48 5,108.00 4,422,000.00 537,000.00 5,285,006.48 320,898.48 PA Category F: Public Utilities (water & power, etc.) 48,831.00 3,898.00 17,070.00 75,000.00 144,799.00 ‐
PA Category G: Park/Recreational/Other 5,086.26 1,121,458.00 66,699.00 48,840.00 50,000.00 10,328,179.00 72,559.00 11,692,821.26 1,126,544.26
Agricultural Damage 100,000.00 100,000.00 ‐
Total 91,021.00 326,000.00 20,842,909.00 73,020.65 1,121,458.00 8,499,248.00 75,705.00 557,741.00 58,587.00 55,000.00 68,858,775.00 539,500.00 14,500.00 804,958.00 35,096.53 3,945.00 75,000.00 102,032,464.18 22,363,387.65