flood-risk assessment of the dense downtown in fukuoka ... · flood-risk assessment of the dense...
TRANSCRIPT

Flood-risk assessment of the dense downtown in Fukuoka City, Japan
H. Hashimoto1 & Y. Nonaka2
1Department of Civil Engineering, Kyushu University, Japan 2Osaka hdqrs., CTI Engineering Co. Ltd., Osaka, Japan
Abstract
The flood risk of the Naka River is much higher than the other rivers in the Fukuoka Metropolitan area. The Naka River watershed has the dense downtown along the lower river reach. If the Naka River and its tributaries would overflow in the lower river reach, significant economic loss would be caused. The urban flood simulation detects areas of higher flood-risk in the downtown. The urban flood simulation is divided into two parts; one is one-dimensional flood flow simulation along the lower Naka River reach and the other is two-dimensional flood flow simulation on the downtown area. Furthermore, the latter is subdivided into two sub-parts; one is two-dimensional flood flow simulation for the ground level and the other is that for the underground space. The land use in the downtown is complicated. The land use in the downtown is incorporated into the simulation. Keywords: urban flood, flood risk, urban flood simulation, underground space.
1 Introduction
On June 29, 1999 and July 19, 2003, short-time heavy rains occurred in the Mikasa River watershed of the Fukuoka metropolitan area and caused the river to overflow at some sections. Since these events, Fukuoka Prefecture Government has renovated the Mikasa River. As a result, the flood risk of the Mikasa River becomes very low. On the other hand, that of the other rivers such as the Naka River becomes much higher. If the rainfall of same magnitude as that on June 29, 1999 or July 19, 2003 would occur in the Naka River watershed, the Naka River and its tributaries would overflow. The Naka River watershed has the densest downtown along the lower river reach (fig. 1). In this downtown
Flood Recovery Innovation and Response III 41
www.witpress.com, ISSN 1743-3541 (on-line) WIT Transactions on Ecology and The Environment, Vol 159, © 201 WIT Press2
doi:10.2495/FRIAR120041

there are many office buildings, some department stores, a few hospitals, City Government office buildings and the underground spaces utilized for the shopping mall, subway stations and parking garages. If the Naka River and its tributaries would overflow along the lower river reach, significant economic loss would be caused. Hashimoto et al. [1] made research on the flood-risk assessment of the lower Naka River reach. They presented the one-dimensional flood simulation for the lower Naka River reach and assessed the flood risk of the downtown along the lower river reach. However, the flood risk of the underground spaces was not assessed.
Figure 1: Plan view of the lower Naka River reach and its tributaries.
The purpose of the present study is to simulate flood flow and detect inundation areas in the dense downtown of the Naka River watershed under the same rainfall condition as that on June 29, 1999. The simulation of flood flow is divided into two parts; one is one-dimensional flood flow simulation in the lower Naka River reach and the other is two-dimensional flood flow simulation on the downtown area. Furthermore, the latter is subdivided into two sub-parts; one is two-dimensional flood flow simulation on the ground level and the other is that on the subway station concourse (the 1st basement). The present study is an extension of the previous work [1]. There are several urban flood simulation models (e.g. Fukuoka et al. [2], Toda et al. [3]; Haider et al. [4]; Hashimoto et al. [5]; Hashimoto and Park [6]). The urban flood simulation model of Hashimoto et al. [5] and Hashimoto and Park [6] is used in this study. This model considers area density of buildings and houses as the effect of their high density on flood flow. The land use in the downtown is incorporated into the simulation by using the concept of the area density.
42 Flood Recovery Innovation and Response XI
www.witpress.com, ISSN 1743-3541 (on-line) WIT Transactions on Ecology and The Environment, Vol 159, © 201 WIT Press2

2 Studied rivers and areas
The Naka River is 35km long and its watershed is 124km2 wide. The upstream area is mountainous region with two dams, and the downstream area is a centre of business, shopping and amusement in the Fukuoka Metropolitan area. Urbanization is significant in the whole watershed except the mountainous areas. Therefore, flood control and measure is important in this river. Studied reach of the Naka River is 3.7km long from Minami-Ohashi bridge to the river mouth (fig. 1). This reach has two tributaries. The Yakuin-shinkawa River enters the main river from the left-hand side at the place 0.88km distant from the river mouth. The Hakata River separates from the main river to the right-hand side at the place 1.72km distant from the river mouth. Moreover it enters the main river at the place 0.5km distant from the river mouth. The left-hand side area of the Yakuin-shinkawa River, called ‘Tenjin district’, has Fukuoka City Government office, an underground shopping mall, subway stations, department stores, hospitals etc.
3 Scenario of rainfall and sea level change
Rainfall scenario adopted in the present simulation is the measurement of rainfall at the Fukuoka Meterological Observatory Station on June 29, 1999. The same rainfall condition as the measurement is assumed in the whole Naka River watershed. Fig. 2 shows hourly rainfall situation on June 29, 1999 and runoff analysis at Minami-Ohashi bridge from the upstream Naka River watershed. Intermittent rainfall continued from June 28. Afterwards, continuous and heavy rainfall hit the Fukuoka Metropolitan area from 6 to 11 o’clock on June 29. The hourly rainfall rapidly increased at 7 o’clock, and then reached the peak value of 77 mm/hour from 8 to 9 o’clock. Cumulative rainfall was 164mm from 6 to 11 o’clock. This rainfall was typical short-time heavy rainfall.
Figure 2: Rainfall scenario and flood discharge.
The boundary condition at the downstream end of the studied river reach is sea level change at the river mouth i.e. Hakata Bay. On the other hand, the boundary condition at the upstream end of the studied river reach is flood discharge Qo at Minami-Ohashi bridge. The flood discharge hydrograph at Minami-Ohashi bridge has been already obtained with runoff analysis of the upper watershed by CTI Engineering Co. Ltd (fig. 2).
0
100
r(mm/hr)
6/290:00
6/296:00
6/2912:00
6/2918:00
6/300:00
Qo
(m3/s)600
400
200
0
hourly rainfall
Qo
Time
Flood Recovery Innovation and Response III 43
www.witpress.com, ISSN 1743-3541 (on-line) WIT Transactions on Ecology and The Environment, Vol 159, © 201 WIT Press2
4 Review on the one-dimensional flood simulation model for the lower Naka River reach proposed by Hashimoto et al. [1]
Hashimoto et al. [1] proposed the one-dimensional flood simulation model for the lower Naka River reach. In this section we describe the basic equations and the boundary conditions for the simulation. The studied river reach is the lower Naka River reach and its tributaries, i.e. the Yakuin-shinkawa and the Hakata River.
4.1 Basic equations
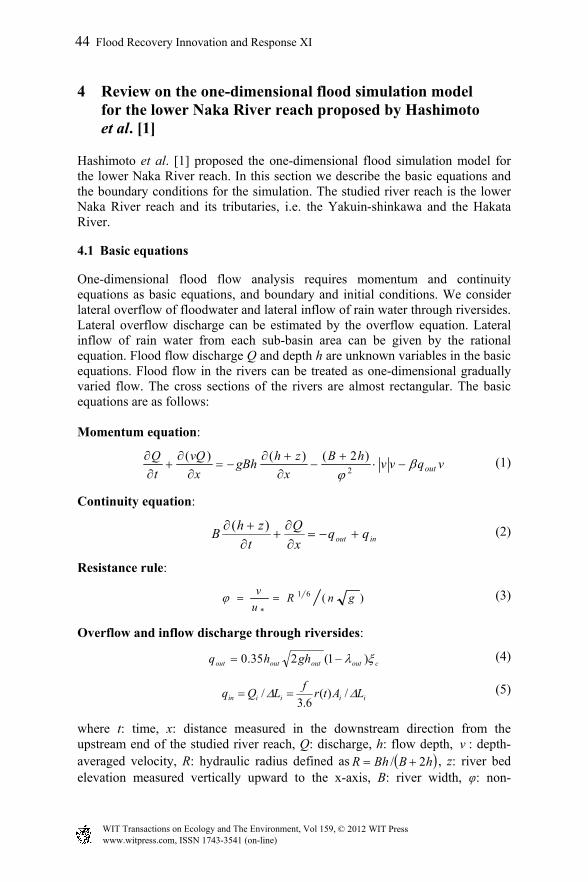
One-dimensional flood flow analysis requires momentum and continuity equations as basic equations, and boundary and initial conditions. We consider lateral overflow of floodwater and lateral inflow of rain water through riversides. Lateral overflow discharge can be estimated by the overflow equation. Lateral inflow of rain water from each sub-basin area can be given by the rational equation. Flood flow discharge Q and depth h are unknown variables in the basic equations. Flood flow in the rivers can be treated as one-dimensional gradually varied flow. The cross sections of the rivers are almost rectangular. The basic equations are as follows: Momentum equation:
vqvv
hB
x
zhgBh
x
vQ
t
Qout
2
)2()()(
(1)
Continuity equation:
inout qq
x
Q
t
zhB
)(
(2)
Resistance rule:
)(61
*
gnRu
v
(3)
Overflow and inflow discharge through riversides:
coutoutoutout ghhq )1(235.0
(4)
iiiiin LAtr
fLQq /)(
6.3/
(5)
where t: time, x: distance measured in the downstream direction from the upstream end of the studied river reach, Q: discharge, h: flow depth, v : depth-averaged velocity, R: hydraulic radius defined as hBBhR 2/ , z: river bed elevation measured vertically upward to the x-axis, B: river width, φ: non-
44 Flood Recovery Innovation and Response XI
www.witpress.com, ISSN 1743-3541 (on-line) WIT Transactions on Ecology and The Environment, Vol 159, © 201 WIT Press2

dimensional average velocity, n: Manning’s roughness coefficient, qout: overflow (i.e. outflow) discharge per unit riverside length, hout: overflow depth on riverside bank, λout: area density of buildings on riverside bank, β=1.5: coefficient related to momentum transfer due to overflow (Hashimoto et al. [5]), ξc: correction factor related to energy loss, Ai: sub-basin area (km2) from which rain water flows into river, Qi: lateral inflow discharge from sub-basin of Ai, r(t): rainfall intensity (mm/hour), Li: distance between neighbouring river sections into which rain water flows from each sub-basin area and f: runoff coefficient of rain water from each sub-basin area. Overflow discharge eqn. (4) considers dense houses and buildings along riversides by using the concept of their area density.
4.2 Flood flow in the Naka River
We consider lateral overflow (i.e. outflow) qout of floodwater from the river but neglect lateral inflow qin of rain water from each sub-basin area because of its minor value compared with river flow discharge Q. The boundary conditions of the computation are flood flow discharge Qo(t) at the upstream end (Minami-Ohashi bridge) and water level Hm(t) at the downstream end (the river mouth). Flood flow discharge has been already evaluated by the runoff analysis under the initial wet land condition. Since the case of initial dry land condition yields smaller runoff discharge, we discuss the case of the initial wet land condition as the more dangerous one. Water level at the river mouth can be approximated by the measurement of sea level change at Hakata Bay.
)(tQQ o at x =0 km (Minami-Ohashi bridge) (6)
)(tHH m at x =3.7 km (River mouth) (7)
Initial time of the computation is 0:00 on June 29, 1999. Therefore, the initial conditions are the values of flood flow discharge Qo(t) and sea level Hm(t) at 0:00 on June 29, 1999. These values are obtained from eqns. (6) and (7). Using these boundary conditions of flood flow discharge and sea level, we can obtain initial flow depth at any positions along the rivers with non-uniform flow analysis.
4.3 Confluence of the Yakuin-Shinkawa and the Naka River
Yakuin-shinkawa River flows into the Naka River at the confluence place (x = xc
= 2.82km). The inflow of the tributary to the main river can be regarded as lateral inflow for the main river. Indicating flow discharge of the Yakuin-shinkawa River by Qy, we can express the flow of the Yakuin-shinkawa River as the lateral inflow discharge Qy from the left-hand side of c cx x x . Qy becomes negative when reverse flow occurs from the Naka to the Yakuin-Shinkawa River. Therefore, the continuity equation for the river reach ~c cx x x x can be rewritten as
Flood Recovery Innovation and Response III 45
www.witpress.com, ISSN 1743-3541 (on-line) WIT Transactions on Ecology and The Environment, Vol 159, © 201 WIT Press2

xQqx
Q
t
zhB yout /
)(
for ~c cx x x x (8)
Here we consider qout through its right-hand side but neglect qout through its left-hand side, because the Yakuin-shinkawa River flows into the Naka River from its left-hand side.
4.4 Separation of the Naka and the Hakata River and their confluence
The Hakata River separates from the Naka River at x=xd and returns to the Naka River at x=xch.. Denoting flow discharge of the Hakata River by Qh, we can obtain the continuity equations in the same way as the above discussion.
4.5 Flood flow in the Yakuin-shinkawa River
We consider lateral overflow of floodwater and lateral inflow of rain water through riversides. Here, simultaneous overflow and inflow through same riverside never occurs. The watershed of the river can be divided into several sub-basins. As the boundary conditions, flow discharge can be given at the upstream end of the Yakuin-shinkawa River and water level at the confluence of the Yakuin-shinkawa and the Naka River. Therefore, we have Qy = 0 at the upstream end of the Yakuin-shinkawa River, and Hy = Hn at its downstream end, where Hy: water level of the Yakuin-shinkawa River and Hn: water level of the Naka River. There is usually no flow in the upper river reach and initially less rainfall. Therefore, initial flow discharge is Qy =0. On the other hand, initial flow depth of the Yakuin-shinkawa River is given by ncyy Hzh 0 , where hy0: initial flow depth of the Yakuin-shinkawa River, zy: bed elevation of the Yakuin-shinkawa River, and Hnc: water level of the Naka River at the confluence of the Yakuin-shinkawa and the Naka River.
4.6 Flood flow in the Hakata River
Basic equations are eqns. (1) to (5). As the boundary conditions, flow depth and discharge can be given at the upstream and downstream end of the Hakata River in the same way as that described in the former sections.
4.7 Conditions for the simulation
Under the conditions shown in table 1, we compute the flood flow discharge and depth in the Naka, Yakuin-shinkawa and Hakata River.
5 Simulation results of flood flow in the Naka and the Yakuin-shinkawa River
The calculated floodwater level is shown in figs. 3 and 4. Corresponding to the beginning of heavy rainfall at 7:40, the Naka and the Yakuin-shinkawa River increases in water level.
46 Flood Recovery Innovation and Response XI
www.witpress.com, ISSN 1743-3541 (on-line) WIT Transactions on Ecology and The Environment, Vol 159, © 201 WIT Press2

Table 1: Simulation conditions for flood flow in the rivers.
Calculation period 0:00 to 24:00, June 29, 1999 Calculation distance (The Naka River) 3.7km (from Minami-Ohashi bridge to the river mouth) Time step t = 1 sec Distance step x = 20m Manning’s roughness coefficient n = 0.03 Correction factor related to energy loss c = 1.0 Runoff coefficient of the Yakuin-shinkawa River watershed
f = 0.7
Figure 3: Time-varying water level at Haruyoshi bridge of the Naka River.
Figure 4: Time-varying water level at Shinkawa bridge of the Yakuin-
shinkawa River.
The Naka River begins to overflow near Haruyoshi bridge at 8:30. The peak of overflow depth is at 9:00. The overflow lasts until 15:11. The Naka River also begins to overflow near Sumiyoshi Bridge at 8:45, and end the overflow at
-2
0
2
4
6
9:00 12:00 15:00 18:00Time (h)
6:00
H (m)
Initiation of overflow8: 30
Peak9:00
River bed
H
Right-hand side
Left-hand side
-1
0
1
2
3
0
10
20
Time (hour)6:00 9:00 12:00 15:00 18:00
H (m)
r (mm/10min)
Right-hand side
Left-hand side
8:43Initiation of overflow
River bed
10-minutes rainfall7:40Heavy rainfall
Flood Recovery Innovation and Response III 47
www.witpress.com, ISSN 1743-3541 (on-line) WIT Transactions on Ecology and The Environment, Vol 159, © 201 WIT Press2
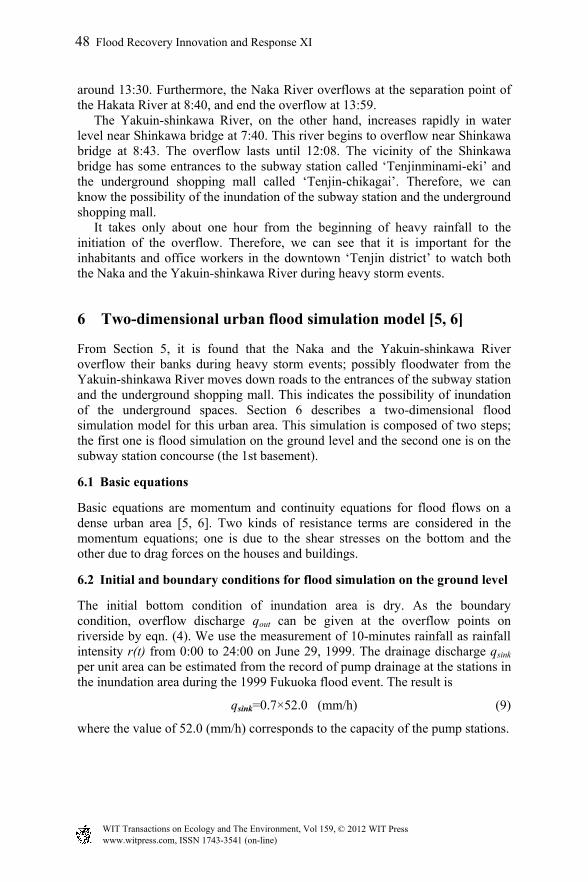
around 13:30. Furthermore, the Naka River overflows at the separation point of the Hakata River at 8:40, and end the overflow at 13:59. The Yakuin-shinkawa River, on the other hand, increases rapidly in water level near Shinkawa bridge at 7:40. This river begins to overflow near Shinkawa bridge at 8:43. The overflow lasts until 12:08. The vicinity of the Shinkawa bridge has some entrances to the subway station called ‘Tenjinminami-eki’ and the underground shopping mall called ‘Tenjin-chikagai’. Therefore, we can know the possibility of the inundation of the subway station and the underground shopping mall. It takes only about one hour from the beginning of heavy rainfall to the initiation of the overflow. Therefore, we can see that it is important for the inhabitants and office workers in the downtown ‘Tenjin district’ to watch both the Naka and the Yakuin-shinkawa River during heavy storm events.
6 Two-dimensional urban flood simulation model [5, 6]
From Section 5, it is found that the Naka and the Yakuin-shinkawa River overflow their banks during heavy storm events; possibly floodwater from the Yakuin-shinkawa River moves down roads to the entrances of the subway station and the underground shopping mall. This indicates the possibility of inundation of the underground spaces. Section 6 describes a two-dimensional flood simulation model for this urban area. This simulation is composed of two steps; the first one is flood simulation on the ground level and the second one is on the subway station concourse (the 1st basement).
6.1 Basic equations
Basic equations are momentum and continuity equations for flood flows on a dense urban area [5, 6]. Two kinds of resistance terms are considered in the momentum equations; one is due to the shear stresses on the bottom and the other due to drag forces on the houses and buildings.
6.2 Initial and boundary conditions for flood simulation on the ground level
The initial bottom condition of inundation area is dry. As the boundary condition, overflow discharge qout can be given at the overflow points on riverside by eqn. (4). We use the measurement of 10-minutes rainfall as rainfall intensity r(t) from 0:00 to 24:00 on June 29, 1999. The drainage discharge qsink per unit area can be estimated from the record of pump drainage at the stations in the inundation area during the 1999 Fukuoka flood event. The result is
qsink=0.7×52.0 (mm/h) (9)
where the value of 52.0 (mm/h) corresponds to the capacity of the pump stations.
(
48 Flood Recovery Innovation and Response XI
www.witpress.com, ISSN 1743-3541 (on-line) WIT Transactions on Ecology and The Environment, Vol 159, © 201 WIT Press2

6.3 Initial and boundary conditions for flood simulation on the subway station concourse (the 1st basement)
The simulation estimates floodwater level at every calculation mesh on the ground level and at the entrances to the underground spaces. Since there are steps of steep slope at the entrances, hydraulically critical flow depth occurs at the entrances and determines inflow discharge of the underground spaces. This becomes the boundary condition for the flood simulation on the subway station concourse (the 1st basement).
6.4 Simulation conditions
Tables 2 and 3 show the conditions for the flood simulation on the ground level and on the subway station concourse (the 1st basement), respectively.
Table 2: Conditions for the flood simulation on the ground level.
Calculation period 0:00 to 24:00 on June 29, 1999. Calculation area 6,000m×5,000m Time step Δt = 1 sec Distance step (mesh size) Δx = Δy =100m. Manning’s roughness coefficient n = 0.043 Drag coefficient CD CD = 2.05 qsink=0.7×52.0 (mm/h)
Table 3: Conditions for the flood simulation on the subway station concourse (the 1st basement).
Calculation period 7:30 to 17:30 on June 29, 1999. Calculation area 60m×180m Time step Δt = 0.005 sec Distance step (mesh size) Δx = Δy =1m Manning’s roughness coefficient n = 0.013 for the passage Manning’s roughness coefficient n = 0.05 for stairs qsink=0.0 (mm/h)
7 Results and discussion of flood flow simulation in the downtown area
7.1 Inundation on the ground level
Figure 5 shows inundation depth and flux vector estimated at 9:00 from the two-dimensional flood simulation on the ground level. The heavy rainfall from 7:40 results in inundation due to rain water on the downtown at around 8:00. For example, Imaizumi district becomes inundated because of its lower ground level. Afterwards the Yakuin-shinkawa River overflows to the left-hand side near Shinkawa bridge at 8:43. Floodwater spreads
Flood Recovery Innovation and Response III 49
www.witpress.com, ISSN 1743-3541 (on-line) WIT Transactions on Ecology and The Environment, Vol 159, © 201 WIT Press2

to the entrances of the subway station and the shopping mall. The peak of inundation occurs at 9:00 at these entrances (fig. 6). At this time, these entrances have inundation depth of 39cm–49cm. The water stop of the entrance to the subway station is 3.19m high (80cm deep). This is provided to prevent floodwater from entering the underground space. We can see that the water stop installed at the entrances is effective for preventing inundation of the underground space. However, it takes only about one hour and twenty minutes from the beginning of heavy rainfall to the peak of the inundation at the
Figure 5: Inundation depth and flood flow velocity vector in the downtown at 9:00.
Figure 6: Time-varying inundation depth at the entrance to the subway station.
2.2
2.4
2.6
2.8
3
0
10
20
30
Level at the entrance
Innundation depth
Water stop height
10-minutes rainfall
Time (h)6:00
H (m)
r (mm/10min)
9:00 12:00 15:00 18:00
Heavy rainfall7 : 40
Beginning of flow into the underground 7 : 58
Peak of innundation depth 9 : 00
50 Flood Recovery Innovation and Response XI
www.witpress.com, ISSN 1743-3541 (on-line) WIT Transactions on Ecology and The Environment, Vol 159, © 201 WIT Press2

Figure 7: Inundation depth of the subway station concourse at 9:00.
entrances. It is possible for the administrators of the underground space to miss installation of the water stop before floodwater reaches the entrances. Therefore, inundation of the underground space is possible. In particular, inundation becomes deeper at the entrances 5 and 6 (fig. 7).
7.2 Inundation on the subway station concourse (the 1st basement)
Figure 7 depicts inundation depth at 9:00 determined by the flood simulation on the subway station concourse (the 1st basement). Floodwater begins to flow from the entrance 6 to the concourse at 7:58 and from the concourse to the platform (the 2nd basement) at 8:02. The whole concourse becomes inundated at 8:25 and the peak is at 9:01. The peak flow depth is 48cm. Table 4 shows the amount of flooding water on each area of the subway station.
Table 4: Amount of floodwater on each area in the subway station and its vicinity.
Platform 23.8×10³ m3 Underground shopping mall 2.9×10³ m3 Shop 8.9×10³ m3
67% of inflow water moves down to the platform and 8% to the underground shopping mall (the 1st basement). We can see that the platform plays a role of drainage system for the underground space.
8 Conclusions
We have simulated the flood flow behaviour under the same rainfall condition as that on June 29, 1999. We have assessed flood risk of the Naka River watershed with the flood simulation.
Flood Recovery Innovation and Response III 51
www.witpress.com, ISSN 1743-3541 (on-line) WIT Transactions on Ecology and The Environment, Vol 159, © 201 WIT Press2

The results obtained in this study are as follows: 1. The urban flood simulation shows that the heavy rainfall cause two different
floods; one is due to overflowing water from the Naka and the Yakuin-shinkawa River and the other is due to the rain water on the downtown area.
2. The downtown called ‘Tenjin district’ is inundated by their superimposed floods; the result yields inflow of floodwater from the entrances to the subway station and the underground shopping mall.
3. Floodwater from the entrances 5 and 6 to the station concourse causes the inundation of the shopping mall (the 1st basement) and the platform (the 2nd basement). 67% of floodwater moves into the platform and 8% into the shopping mall. It is found that the platform plays a role of drainage system for the underground space.
Acknowledgements
This research has been supported by Foundation of River and Basin Integrated Communications, Japan and Grant-in Aid for Scientific Research, Japan Society for the Promotion of Science. The cross-sections of each river have been supplied by Fukuoka City Government. The result of runoff analysis at the Minami-Ohashi bridge has been given by Kyushu Branch, CTI Engineering Co., Ltd. The authors would like to appreciate their grant in aid and supply of the river data on this research.
References
[1] Hashimoto, H., Nonaka, Y. and Saito, M., Flood-risk Assessment of the Naka River in Fukuoka City, Japan, Proceedings of the 8th International Conference on Urban Drainage Modelling, Tokyo, Japan, CD-Rom, September, 2009.
[2] Fukuoka, S., Kawashima, M., Matsunaga, N. and Maeuchi, H., Flooding water over a crowded urban district, Journal of Hydraulic, Coastal and Environmental Engineering, JSCE, No.491/II-27, pp. 51-60, 1994 (in Japanese).
[3] Toda, K., Inoue, K., Murase, S. and Ichigawa, Y., Modeling of overland flood flow due to heavy rainfall in urban area, Annuals, Disaster Prevention Research Institute, Kyoto University, No.42, B-2, pp. 355-367, 1999 (in Japanese).
[4] Haider, S., Paquier, A., Morel, R. and Champagne, J.-Y., Urban flood modelling using computational fluid dynamics, Water & Maritime Engineering, 156, pp. 129-135, 2003.
[5] Hashimoto, H., Park, K. and Watanabe, M., Overland flood flow around the JR Hakata-eki station from the Mikasa and Sanno-Channel river in Fukuoka city on June 29, 1999, Journal of Japan Society for Natural Disaster Science. 21-4, pp. 369-384, 2003 (in Japanese).
[6] Hashimoto, H. and Park, K., Two-dimensional urban flood simulation: Fukuoka flood disaster in 1999, Proceedings of the First International Conference on Flood Recovery, Innovation and Response, pp. 59-67, 2008.
52 Flood Recovery Innovation and Response XI
www.witpress.com, ISSN 1743-3541 (on-line) WIT Transactions on Ecology and The Environment, Vol 159, © 201 WIT Press2