flood of april 2007 in new hampshire - usgs of april 2007 in new hampshire by robert h. flynn ....
TRANSCRIPT

Flood of April 2007 in New Hampshire
By Robert H. Flynn
Prepared in cooperation with the Federal Emergency Management Agency
Scientific Investigations Report 2008–5120
U.S. Department of the Interior U.S. Geological Survey

U.S. Department of the Interior DIRK KEMPTHORNE, Secretary
U.S. Geological Survey Mark D. Myers, Director
U.S. Geological Survey, Reston, Virginia: 2008
For product and ordering information: World Wide Web: http://www.usgs.gov/pubprod Telephone: 1-888-ASK-USGS
For more information on the USGS—the Federal source for science about the Earth, its natural and living resources, natural hazards, and the environment: World Wide Web: http://www.usgs.gov Telephone: 1-888-ASK-USGS
Any use of trade, product, or firm names is for descriptive purposes only and does not imply endorsement by the U.S. Government.
Although this report is in the public domain, permission must be secured from the individual copyright owners to reproduce any copyrighted materials contained within this report.
Suggested citation: Flynn, R.H., 2008, Flood of April 2007 in New Hampshire: U.S. Geological Survey Scientific Investigations Report 2008–5120, 53 p.

iii
Acknowledgments
The author would like to thank Stephen Doyon from the New Hampshire Department of Environmental Services (NHDES) for providing peak-stage and peak-discharge data from the streamgages that NHDES operates, and David Knowles from the Federal Emergency Management Agency for providing review comments on this report. The author would like to express appreciation to U.S. Geological Survey staff—Kenneth Toppin, Scott Olson, Chandlee Keirstead, Richard Kiah, Sanborn Ward, Heather Sirotnak and Glenn Berwick— who assisted with collection and analysis of the data in this report; and to Scott Olson and Gene Parker, who provided technical reviews of this report.


v
ContentsAbstract ...........................................................................................................................................................1Introduction.....................................................................................................................................................1
Description of Study Area ...................................................................................................................3Storm Characteristics ..........................................................................................................................3
Peak-Stage Data ............................................................................................................................................6Peak-Discharge Data ..................................................................................................................................17Flow-Frequency Analyses of the April 2007 Flooding ............................................................................18Determination of the April 2007 Flood Discharge by Indirect Methods at Ungaged Sites ..............24Comparison of the April 2007 Flood Data to Flood-Insurance Studies ...............................................26Summary........................................................................................................................................................30Selected References ...................................................................................................................................30Appendix 1. HEC-RAS Model Calibrations to Estimate the April 2007 Flood-Peak Discharge from
High-Water-Mark Data Collected for the Lamprey, Souhegan, and Suncook Rivers .........39
Figures 1. Map showing counties included in the Presidential Disaster Declarations of
April 27 and May 10, 2007 ............................................................................................................2 2A–3. Screenshots showing— 2A. The 1-day observed precipitation totals ending on April 16, 2007, New Hampshire
and Vermont ..........................................................................................................................4 2B. The 1-day observed precipitation totals ending on April 17, 2007, New Hampshire
and Vermont ..........................................................................................................................4 2C. The 1-day observed precipitation totals ending on April 18, 2007, New Hampshire
and Vermont ..........................................................................................................................5 3. The April 2007 monthly observed precipitation, New Hampshire and Vermont ........5 4A–5. Maps showing— 4A. Location of U.S. Geological Survey streamgage sites and indirect discharge-
measurement sites having peak stage and discharge data for the April 2007 flood in Hillsborough County, New Hampshire .............................................................10
4B. Location of U.S. Geological Survey streamgage sites and indirect discharge-measurement sites having peak stage and discharge data for the April 2007 flood in Rockingham County, New Hampshire..............................................................11
4C. Location of U.S. Geological Survey streamgage sites and indirect discharge-measurement sites having peak stage and discharge data for the April 2007 flood in Merrimack County, New Hampshire ................................................................12
4D. Location of U.S. Geological Survey streamgage sites having peak stage and discharge data for the April 2007 flood in Belknap County, New Hampshire ..........13
4E. Location of U.S. Geological Survey streamgage sites having peak stage and discharge data for the April 2007 flood in Strafford County, New Hampshire ........14
4F. Location of U.S. Geological Survey streamgage sites having peak stage and discharge data for the April 2007 flood in Grafton County, New Hampshire ...........15
4G. Location of U.S. Geological Survey streamgage sites having peak stage and discharge data for the April 2007 flood in Carroll County, New Hampshire ............16

vi
Conversion Factors and Datum
Multiply By To obtain
Length
inch (in.) 2.54 centimeter (cm)
inch (in.) 25.4 millimeter (mm)
foot (ft) 0.3048 meter (m)
mile (mi) 1.609 kilometer (km)
Area
square mile (mi2) 2.590 square kilometer (km2)
Flow rate
cubic foot per second (ft3/s) 0.02832 cubic meter per second (m3/s)
Horizontal coordinate information is referenced to the North American Datum of 1927 (NAD 27).
Vertical coordinate information is referenced to the National Geodetic Vertical Datum of 1929 (NGVD 29) and North American Vertical Datum of 1988 (NAVD 88).
Tables 1. Description of streamgages used in the April 2007 flood investigation, central and
southern New Hampshire .........................................................................................................33 2. Peak-stage data and peak-discharge data during the April 2007 flood at
57 streamgage sites in central and southern New Hampshire .............................................7 3. Flow-frequency data and recurrence-interval estimates for 57 streamgages
during the April 2007 flood in central and southern New Hampshire ................................19 4. Flow-frequency data and recurrence-interval estimates by indirect methods for four
ungaged sites during the April 2007 flood in central and southern New Hampshire ......25 5. Flood-insurance study data for selected streamgage sites in central and
southern New Hampshire .........................................................................................................27 6. High-water-mark data used in the determination of April 2007 flood discharge by
indirect methods for four ungaged sites in central and southern New Hampshire ........29
5. Recurrence intervals for the April 2007 flood at streamgages in Hillsborough, Rockingham, Merrimack, Belknap, Strafford, Grafton, and Carroll Counties in New Hampshire .............................................................................................................23

AbstractDuring April 16–18, 2007, central and southeastern
New Hampshire experienced severe flooding as a result of up to 7 inches of rainfall from a storm that stalled off the New England coast. As a result of the flooding, a Presidential Disaster Declaration was issued on April 27, 2007. On that day, disaster declarations were announced for Grafton, Hillsborough, Merrimack, Rockingham, and Strafford Counties. On May 10, 2007, Belknap County was added to the disaster declaration.
Following the flooding, the U.S. Geological Survey, in a cooperative investigation with the Federal Emergency Management Agency, determined the peak stages, peak discharges, and recurrence-interval estimates of the April 2007 flood at 57 streamgages and 4 ungaged sites in and adjacent to the counties named in the disaster declaration. Data from flood-insurance studies published by the Federal Emergency Management Agency also were compiled for each streamgage site for comparison purposes.
The peak discharges during the April 2007 flood were the highest ever recorded at five long-term (more than 10 years of record) streamgage sites on the New Hampshire-Salmon Falls River at Milton, Cocheco River near Rochester, Oyster River near Durham, Contoocook River at Peterbor-ough, and South Branch Piscataquog River near Goffstown. In addition, peak discharges equaled or exceeded a 100-year recurrence interval at 10 streamgages and a 50-year recur-rence interval at 16 streamgages. The most severe flooding occurred in Rockingham, Strafford, Merrimack, and Hillsborough Counties.
IntroductionMajor flooding in central and southern New Hampshire
(fig. 1) from April 16 to 18, 2007, resulted in substantial damage to public and personal property. Homes and roads were damaged, and numerous residential areas were evacuated for several days. As a result of the widespread damage caused by the flooding, President George W. Bush issued a Presidential Disaster Declaration on April 27, 2007, for the counties of Grafton, Hillsborough, Merrimack, Rockingham,
and Strafford in New Hampshire (fig. 1; Federal Emergency Management Agency, 2007). Belknap County in New Hampshire was added to the disaster declaration on May 10, 2007 (Federal Emergency Management Agency, 2007). In response to the disaster declaration, the U.S. Geological Survey (USGS), in cooperation with the Federal Emergency Management Agency (FEMA), measured or computed flood characteristics at 57 streamgages and 4 ungaged locations within and adjacent to the disaster areas.
The April 2007 flood is documented in this report through the presentation of flood data collected at 46 active and 11 discontinued streamgages and 4 ungaged locations in central and southern New Hampshire. The flood data include peak-stage data, peak-discharge data, flow-frequency curves, and estimates of flood-recurrence intervals at each streamgage. In addition, data were compiled from 20 town/city-wide and 3 county-wide FEMA flood-insurance studies for compari-son purposes. The active streamgages include 37 operated by the USGS, 7 operated by the New Hampshire Department of Environmental Services (NHDES), and 2 operated by the U.S. Army Corps of Engineers (USACE). All 11 discontinued streamgages previously had been operated by the USGS. A description of each streamgage site included in this investiga-tion is provided in table 1 (in back of report).
Although the April 16–18, 2007, storm produced less precipitation than either the October 1996 or May 2006 storm events, some streams in New Hampshire had higher discharges in the 2007 event. For example, on April 16, 2007, a peak discharge of 1,320 ft3/s occurred at the Oyster River stream-gage near Durham, N.H. Prior to this peak, the peak discharge of record at that station was 1,160 ft3/s on October 21, 1996. The April 16–18, 2007, precipitation resulted in discharges that were the maximum for the period of record at 5 long-term (more than 10 years of record) streamgage sites in central and southern New Hampshire.
The primary difference between the flooding events of May 2006 and October 1996 was the antecedent ground condi-tions in May 2006 (National Oceanic and Atmospheric Admin-istration, 2006b) that resulted in greater discharges during the May 2006 event at many streamgages. The primary difference between the April 2007 flooding event and the May 2006 and October 1996 events was the precipitation on top of snowpack that resulted in greater discharges during the April 2007 event at many streamgages.
Flood of April 2007 in New Hampshire
By Robert H. Flynn

2 Flood of April 2007 in New Hampshire
Figure 1. Counties included in the Presidential Disaster Declarations of April 27 and May 10, 2007. (FEMA-1695-DR, Federal Emergency Management Agency, 2007)
EXPLANATION
Designated counties
Public assistance
Disaster area
COOS
GRAFTON
MERRIMACK
CARROLL
BELKNAP
CHESHIRE
SULLIVAN
HILLSBOROUGH ROCKINGHAM
STRAFFORD
0 10 20 MILES5
0 10 20 KILOMETERS5
72°
71°
43°
44°
45°
Base from U.S. Geological Survey Digital Line Graphs, 1:24,000, 1990−94 and National Hydrography Dataset, 1:24,000, 1999
LakeWinnipesaukee
Atla
ntic
Oce
an
NEWHAMPSHIRE
MASSACHUSETTS
MAINE
VERMONT
NEWYORK
CANADA
0 50 MILES
0 50 KILOMETERS
Mt. Washington
Durham
Epping
Concord
Greenville

Introduction 3
The higher than normal precipitation from the April 2007 storm, which included precipitation on top of snowpack at higher elevations, downed trees, and wood debris in some rivers all contributed to the high flows and flooding in southern and central New Hampshire. In addition, an abnormally high spring tide along with a storm surge of nearly 3 ft caused tidal flooding along portions of the seacoast (National Oceanic and Atmospheric Administration, 2007b), and the prolonged period of strong northeast winds caused a prolonged storm surge along the coastline (National Climate Data Center, 2007).
Description of Study Area
The six New Hampshire counties included in the disaster declaration (fig. 1) compose a land area of 5,245 mi2 in the northeastern United States. Land elevations range from zero feet above the North American Vertical Datum of 1988 (NAVD 88) at Mean Lower Low Water (MLLW) at the seacoast to greater than 4,000 ft above the NAVD 88 in the north-central part of New Hampshire. The climate of New Hampshire is humid. Precipitation is distributed fairly evenly across the state and averages about 43 in. per year except in regions that can receive additional precipitation due to elevation and snowfall. From 1971 to 2000, Mount Washington received an average of 101.9 in. of precipitation per year, while Concord received an average of 37.6 in. of precipitation (National Climate Data Center, 2008). The average (1971–2000) precipitation for April in Concord, N.H., was approximately 3.07 in. (National Climate Data Center, 2008).
Storm Characteristics
The precipitation that occurred from April 15 to 19, 2007, produced 6.54 in. of rainfall in the southeastern New Hampshire towns of Durham and Epping and 7.25 in. of rainfall in Greenville, N.H.—a town in the south-central part of the state (National Oceanic and Atmospheric Administration, 2007a). Because April 16, 2007, was the Patriot’s Day holiday, the storm has since been referred to as the Patriot’s Day storm. The rainfall began on Sunday, April 15, 2007; snow accumulated in many areas and changed to rain, at first along the coast then eventually inland and northward. In Concord, snow accumulated to a total melted precipitation of 1.26 in. (National Oceanic and Atmospheric Administration, 2007b) on April 15. The rainfall became heavy on Sunday, April 15, during the afternoon and overnight. By the morning of Monday, April 16, 3 to 5 in. of rain had fallen over much of southeastern New Hampshire (fig. 2A; Northeast River Forecast Center, 2007a), and 1 to 3 in. had fallen across much of the remainder of the state. In the mountains of New Hampshire, 3 to 11 in. of snow had fallen. Although the heaviest precipitation fell from Sunday afternoon into Monday afternoon, precipitation persisted
through Tuesday, April 17 (fig. 2B; Northeast River Forecast Center, 2007a) and into Wednesday, April 18 (fig. 2C; Northeast River Forecast Center, 2007a). The heaviest rain fell on Monday, April 16 with 5.46 in. of rain recorded in Durham (National Oceanic and Atmospheric Administration, 2007a). The heavy rain combined with snow melt caused small rivers and streams in much of New Hampshire to flood. As with the May 2006 flood in New Hampshire (Olson, 2007), the most severe flooding occurred in Rockingham, Strafford, Merrimack, and Hillsborough Counties, although the smaller rivers in Rockingham County were the most severely affected (National Climate Data Center, 2007).
In addition to the rainfall, downed trees exacerbated flooding conditions in many rivers and streams. A barometric-pressure gradient associated with the storm brought high winds to the region with a peak wind of 45 mph recorded in Concord on April 16, 2007 (National Oceanic and Atmo-spheric Administration, 2007b). The damage observed in the hardest-hit areas was typical for wind gusts of 60 to 80 mph (National Climate Data Center, 2007). Strong winds late on Sunday, April 15, and through most of Monday, April 16, were reported to have downed many trees, branches, and power lines. Damage from the wind was magnified because of the heavy rain that accompanied the wind and the soft, wet ground caused by the spring thaw. Due to high winds and antecedent wet-ground conditions, many trees were reported to have had their entire root systems lifted out of the ground (National Oceanic and Atmospheric Administration, 2007b).
As a result of the Patriot’s Day storm of April 16–18, 2007, the month of April 2007 is the second wettest April (fig. 3) ever recorded in Concord, N.H. (National Oceanic and Atmospheric Administration, 2007b). A total of 7.22 in. of precipitation was recorded for Concord, which is just shy of the April record precipitation of 7.44 in. set in 1904. Snowfall also was abundant in April 2007 with 12 in. measured in Concord. This measurement tied the 1876 and 1879 levels as the 9th-snowiest April for Concord in the past 140 years of snowfall records (National Oceanic and Atmospheric Administration, 2007b). The largest snowfall in April 2007 for Concord totaled nearly 7.7 in. and fell during April 4–5 (National Oceanic and Atmospheric Administration, 2007b). All of the April snow for Concord fell over the first 15 days of the month (National Oceanic and Atmospheric Administration, 2007b). In March and April 2007, Concord received 29.2 in. of rainfall.
The total precipitation that occurred during April 15–19, 2007, in southeastern New Hampshire (6.54 in. in Durham) was approximately one-half of the 13 in. of precipitation that fell during October 20–22, 1996, across southeastern New Hampshire (National Oceanic and Atmospheric Adminis-tration, 1996). The total April 15–19, 2007, precipitation in southeastern New Hampshire was less than one-half of the up to 14 in. of precipitation that fell during May 11–15, 2006, across the coastal regions of New Hampshire (National Oceanic and Atmospheric Administration, 2006a) and approxi-mately 60 percent of the up to 11 in. of precipitation that fell

4 Flood of April 2007 in New Hampshire
Figure 2A. The 1-day observed precipitation totals ending on April 16, 2007, New Hampshire and Vermont. (From Northeast River Forecast Center, 2007a)
Figure 2B. The 1-day observed precipitation totals ending on April 17, 2007, New Hampshire and Vermont. (From Northeast River Forecast Center, 2007a)
New York Vermont
Massachusetts
New Hampshire
Maine
0.01
6.0
4.0
2.5
1.5
0.75
0.25
10
5.0
3.0
2.0
1.0
0.50
0.10
8.0
Missing
Inches
New Hampshire & Vermont1-Day Observed Precipitation - Valid 4/16/2007 1200 UTC
New York Vermont
Massachusetts
New Hampshire
Maine
0.01
6.0
4.0
2.5
1.5
0.75
0.25
10
5.0
3.0
2.0
1.0
0.50
0.10
8.0
Missing
Inches
New Hampshire & Vermont1-Day Observed Precipitation - Valid 4/17/2007 1200 UTC

Introduction 5
Figure 2C. The 1-day observed precipitation totals ending on April 18, 2007, New Hampshire and Vermont. (From Northeast River Forecast Center, 2007a)
Figure 3. The April 2007 monthly observed precipitation, New Hampshire and Vermont. (From Northeast River Forecast Center, 2007b)
New York Vermont
Massachusetts
New Hampshire
Maine
0.01
6.0
4.0
2.5
1.5
0.75
0.25
10
5.0
3.0
2.0
1.0
0.50
0.10
8.0
Missing
Inches
New Hampshire & Vermont1-Day Observed Precipitation - Valid 4/18/2007 1200 UTC
New York Vermont
Massachusetts
New Hampshire
Maine
0.01
10
6.0
4.0
2.0
1.0
0.25
20
8.0
5.0
3.0
1.5
0.50
0.10
15
Missing
Inches
New Hampshire & VermontApril 2007 Monthly Observed Precipitation

6 Flood of April 2007 in New Hampshire
during May 11–15, 2006, in the south-central part of the state (National Oceanic and Atmospheric Administration, 2006b). The October 20–22, 1996, May 11–15, 2006, and April 15–19, 2007, precipitation events all resulted in stream-flow discharges that were the maximum for the periods of record at several streamgages in southern and southeastern New Hampshire.
Peak-Stage DataPeak-stage data at active streamgages operated by the
USGS were retrieved directly from the stage data recorded at the streamgages, along with the precise date and time of the peak stage. At active streamgages not operated by the USGS, the peak stage with date and time was provided by the station operators. All peak-stage data from active streamgages were rated excellent, which means that measurements are consid-ered to be within 0.05 ft of the actual water surface.
For discontinued streamgages, USGS personnel identified and flagged the April 2007 high-water marks near the streamgage. The high-water marks typically consisted of debris lines, wash lines, or mud lines left behind by the peak water elevation during the flood. The flagged high-water marks were rated for accuracy. This accuracy rating is subjective and is based on the type of high-water mark and the abundance of other confirming marks in the immediate vicinity (Benson and Dalrymple, 1967). The accuracies of the marks are defined as follows. A high-water mark with (1) an excellent rating is thought to be within 0.05 ft of the actual water surface; (2) a good rating, within 0.1 ft; (3) a fair rating, within 0.2 ft; and (4) a poor rating, greater than 0.2 ft from the true water surface.
The flagged high-water marks at the discontinued streamgages were referenced to the datum of the streamgage by using closed level-loop surveying techniques (elevations were determined at the high-water marks by differential leveling from a known elevation datum). The streamgage datum is the local base elevation that was used in developing the stage-discharge relationship when the streamgage was active. Because the high-water marks were referenced to the streamgage datum, the marks represented the peak stages of the flooding at the discontinued streamgage. The date of the peak stages at discontinued streamgages was estimated from peak-stage hydrographs for active streamgages in the same or adjacent watersheds.
At active streamgages as well as at discontinued stream-gages where high-water marks had been flagged, the peak stage was referenced to the National Geodetic Vertical Datum of 1929 (NGVD 29) and the NAVD 88 by using closed level-loop surveying techniques from either a known refer-ence datum or from a reference datum established using Leica System 1200 Global Positioning System (GPS) with 3-mm (0.01-ft) horizontal accuracy and 10-mm (0.03-ft) vertical accuracy in static mode (Leica Geosystems, 2008). Referenc-ing the peak stage to NGVD 29 and NAVD 88 allows the high-water mark to be compared to the existing FEMA Flood-Insurance Study data for the streamgage location.
The peak-stage data for all sites included in this investi-gation are shown in table 2. The location of each streamgage is shown, by county, in figures 4A–G. Although a disaster declaration was not made in Carroll County (fig. 4G), flows at four streamgages in that county were investigated because of their close proximity to Belknap and Grafton Counties, which were declared disaster areas (table 1, in back of report).

Peak-Stage Data 7Ta
ble
2.
Peak
-sta
ge d
ata
and
peak
-dis
char
ge d
ata
durin
g th
e Ap
ril 2
007
flood
at 5
7 st
ream
gage
site
s in
cen
tral a
nd s
outh
ern
New
Ham
pshi
re.—
Cont
inue
d
[Loc
atio
n of
stre
amga
ges i
n fig
ure
4. U
SGS,
U.S
. Geo
logi
cal S
urve
y; S
R, S
tate
Rou
te; f
t, fe
et; N
AVD
88,
Nor
th A
mer
ican
Ver
tical
Dat
um o
f 198
8; N
GV
D 2
9, N
atio
nal G
eode
tic V
ertic
al D
atum
of 1
929;
ft3 /s
, cub
ic fe
et p
er se
cond
; na,
not
ava
ilabl
e. P
erio
ds o
f rec
ord
with
out a
n en
d da
te a
re a
ctiv
e st
ream
gage
s]
USG
S st
ream
-ga
ge
num
ber
Stre
amga
ge n
ame
Apr
il 20
07 fl
ood
Peri
od o
f rec
ord
Max
imum
pre
viou
sly
reco
rded
floo
dPe
ak
stag
e,
loca
l da
tum
(ft
)
Peak
st
age,
N
GVD
29
(ft)
Peak
st
age,
N
AVD
88
(ft)
Qua
lity
rank
ing
of s
tage
Peak
di
s-ch
arge
(ft
3 /s)
Day
Tim
ePe
ak
disc
harg
e (ft
3 /s)
Dat
e
0106
4500
Saco
Riv
er n
ear C
onw
ay8.
3042
6.49
426.
05Ex
celle
nt9,
750n
Apr
il 24
1:30
am
1904
–10,
192
9–47
,200
3-27
-195
301
0648
01B
earc
amp
Riv
er a
t Sou
th T
amw
orth
8.12
501
.49
501.
03Ex
celle
nt3,
720n
Apr
il 17
12:3
0 am
1993
–6,
150
6-14
-199
801
0650
00O
ssip
ee R
iver
at E
ffing
ham
Fal
ls9.
25a
nana
Exce
llent
5,37
0aA
pril
19na
1942
–90,
199
8–11
,700
3-28
-195
301
0721
00Sa
lmon
Fal
ls R
iver
at M
ilton
7.32
a40
4.46
403.
90Ex
celle
nt5,
500a,
b,c
Apr
il 17
9:30
am
1968
–5,
450
5-14
-200
601
0728
00C
oche
co R
iver
nea
r Roc
hest
er20
.82
140.
2013
9.59
Exce
llent
7,24
0cA
pril
1611
:15
pm19
95–
5,55
05-
14-2
006
0107
2870
Isin
glas
s Riv
er a
t Roc
hest
er N
eck
Roa
d, n
ear D
over
21.8
1na
naEx
celle
nt6,
160
Apr
il 17
12:3
0 pm
2003
–4,
370
5-14
-200
6
0107
3000
Oys
ter R
iver
nea
r Dur
ham
10.2
075
.49
74.7
8Ex
celle
nt1,
320c
Apr
il 16
5:45
pm
1934
–1,
160
10-2
1-19
9601
0735
00La
mpr
ey R
iver
nea
r New
mar
ket
17.4
955
.77
55.0
4Ex
celle
nt8,
450
Apr
il 18
2:00
pm
1934
–8,
970
5-14
-200
601
0735
87Ex
eter
Riv
er a
t Hai
gh R
oad,
ne
ar B
rent
woo
d11
.19
71.4
670
.71
Exce
llent
2,84
0A
pril
175:
30 a
m19
96–
3,52
05-
15-2
006
0107
3600
Dud
ley
Bro
ok n
ear E
xete
r8.
3594
.40
93.6
5Fa
ir47
0b,o
Apr
il 17
na19
62–8
566
05-
14-2
006
0107
3750
Mill
Bro
ok n
ear S
R 1
08, a
t Stra
tham
11.0
649
6.19
495.
44Ex
celle
nt32
5b,o
Apr
il 18
na19
73–7
9, 2
003–
0439
04-
2-19
7301
0737
85W
inni
cut R
iver
at G
reen
land
, ne
ar P
orts
mou
th5.
9314
.19
13.4
4Ex
celle
nt1,
030
Apr
il 16
8:15
am
2002
–1,
450
5-14
-200
6
0107
3810
Ber
rys B
rook
at S
agam
ore
Roa
d,
near
Por
tsm
outh
4.95
22.0
721
.30
Exce
llent
278b,
oA
pril
17na
2003
–04
505
5-14
-200
6
0107
3838
Tayl
or R
iver
at O
ld S
tage
Roa
d
near
Ham
pton
6.84
18.9
218
.14
Fair
436o
Apr
il 17
na20
04na
na
0107
4520
East
Bra
nch
Pem
igew
asse
t Riv
er
at L
inco
ln8.
8682
9.89
829.
58Ex
celle
nt2,
730n
Apr
il 24
9:45
am
1993
–16
,900
4-14
-200
2
0107
5000
Pem
igew
asse
t Riv
er a
t Woo
dsto
ck6.
8362
3.27
622.
93Ex
celle
nt4,
460n
Apr
il 23
10:3
0 pm
1939
–77,
200
2–47
,000
10-2
4-19
5901
0760
00B
aker
Riv
er n
ear R
umne
y5.
6550
2.99
502.
59Ex
celle
nt3,
040n
Apr
il 16
7:00
pm
1929
–77,
200
1–21
,400
6-15
-194
201
0765
00Pe
mig
ewas
set R
iver
at P
lym
outh
10.7
146
7.78
467.
37Ex
celle
nt13
,900
nA
pril
1712
:15
am19
04–
65,4
003-
19-1
936
0107
7000
Squa
m R
iver
at A
shla
nd12
.06a
nana
Exce
llent
543a
Apr
il 18
5:15
pm
1939
–1,
090
7-4-
1973
0107
7510
New
foun
d R
iver
bel
ow N
ewfo
und
Lake
nea
r Bris
tol
8.81
ana
naEx
celle
nt1,
690a
Apr
il 19
4:15
am
1994
–3,
500
5-16
-200
6
0107
8000
Smith
Riv
er n
ear B
risto
l8.
6545
8.45
458.
07Ex
celle
nt2,
770
Apr
il 17
10:0
0 pm
1918
–8,
100
3-19
-193
601
0796
02Po
orfa
rm B
rook
nea
r Gilf
ord
5.74
e51
2.30
e 51
1.86
eG
ood
505o
Apr
il 17
na19
98–2
004
1,05
05-
14-2
006
0107
9900
Shan
non
Bro
ok n
ear M
oulto
nbor
ough
8.37
nana
Exce
llent
570b,
oA
pril
17na
1999
–200
456
55-
14-2
006
0108
0000
Lake
Win
nipe
sauk
ee a
t Wei
rs B
each
5.00
a50
5.00
504.
57Ex
celle
ntna
Apr
il 22
11:0
0 pm
1934
–50
5.86
6-4-
1984
0108
0500
Lake
Win
nipe
sauk
ee O
utle
t at
Lak
epor
tna
nana
Exce
llent
2,43
0aA
pril
258:
00 a
m19
33–8
3, 1
988–
2,89
0f3-
31-1
936

8 Flood of April 2007 in New HampshireTa
ble
2.
Peak
-sta
ge d
ata
and
peak
-dis
char
ge d
ata
durin
g th
e Ap
ril 2
007
flood
at 5
7 st
ream
gage
site
s in
cen
tral a
nd s
outh
ern
New
Ham
pshi
re.—
Cont
inue
d
[Loc
atio
n of
stre
amga
ges i
n fig
ure
4. U
SGS,
U.S
. Geo
logi
cal S
urve
y; S
R, S
tate
Rou
te; f
t, fe
et; N
AVD
88,
Nor
th A
mer
ican
Ver
tical
Dat
um o
f 198
8; N
GV
D 2
9, N
atio
nal G
eode
tic V
ertic
al D
atum
of 1
929;
ft3 /s
, cub
ic fe
et p
er se
cond
; na,
not
ava
ilabl
e. P
erio
ds o
f rec
ord
with
out a
n en
d da
te a
re a
ctiv
e st
ream
gage
s]
USG
S st
ream
-ga
ge
num
ber
Stre
amga
ge n
ame
Apr
il 20
07 fl
ood
Peri
od o
f rec
ord
Max
imum
pre
viou
sly
reco
rded
floo
dPe
ak
stag
e,
loca
l da
tum
(ft
)
Peak
st
age,
N
GVD
29
(ft)
Peak
st
age,
N
AVD
88
(ft)
Qua
lity
rank
ing
of s
tage
Peak
di
s-ch
arge
(ft
3 /s)
Day
Tim
ePe
ak
disc
harg
e (ft
3 /s)
Dat
e
0108
1000
Win
nipe
sauk
ee R
iver
at T
ilton
7.61
449.
4844
9.01
Exce
llent
3,55
0A
pril
171:
30 a
m19
37–
4,58
03-
31-1
984
0108
1500
Mer
rimac
k R
iver
at F
rank
lin Ju
nctio
n13
.62
264.
7026
4.20
Exce
llent
17,3
00A
pril
175:
15 a
m19
05–7
8, 1
983–
83,0
003-
19-1
936
0108
2000
Con
tooc
ook
Riv
er a
t Pet
erbo
roug
h7.
2173
9.18
738.
46Ex
celle
nt4,
110c
Apr
il 16
1:00
pm
1946
–32
104-
2-20
0401
0830
00N
uban
usit
Bro
ok b
elow
Mac
Dow
ell
Dam
nea
r Pet
erbo
roug
h5.
7193
6.74
936.
07Ex
celle
nt
637g
Apr
il 24
4:
00 p
m
1921
–31,
194
6–1,
130
4-11
-193
1
0108
4500
Bea
rds B
rook
nea
r Hill
sbor
ough
8.69
602.
3360
1.72
Goo
d3,
550b,
oA
pril
17na
1946
–76
4,80
0b,h
10-9
-200
501
0850
00C
onto
ocoo
k R
iver
nea
r Hen
nike
r14
.49
484.
8148
4.19
Exce
llent
13,0
00A
pril
176:
00 p
m19
38, 1
940–
77,
1989
–22
,200
9-21
-193
8
0108
5500
Con
tooc
ook
Riv
er b
elow
Hop
kint
on
Dam
at W
est H
opki
nton
8.51
364.
34 3
63.6
6Ex
celle
nt5,
370
Apr
il 30
5:45
pm
1964
–7,
530
4-8-
1987
0108
6000
War
ner R
iver
at D
avis
ville
11.8
7i39
1.90
391.
31Ex
celle
nt7,
730
Apr
il 16
10:4
5 pm
1940
–78,
199
9–8,
640
5-15
-200
601
0870
00B
lack
wat
er R
iver
nea
r Web
ster
6.87
438.
6043
8.04
Exce
llent
1,95
0A
pril
2512
:30
pm19
19–2
0, 1
927–
11,0
00j
3-19
-193
601
0878
50C
onto
ocoo
k R
iver
at R
iver
Hill
, ne
ar P
enac
ook
15.9
0g34
7.87
347.
27Ex
celle
nt7,
780g,
oA
pril
174:
15 a
mna
nana
0108
8400
Mer
rimac
k R
iver
at C
onco
rd14
.35
231.
5223
0.91
Exce
llent
32,8
00o
Apr
il 21
2:00
pm
nana
na01
0890
00So
ucoo
k R
iver
nea
r Con
cord
na30
5.79
305.
21Ex
celle
nt3,
500k,
oA
pril
17na
1952
–198
74,
790k
5-14
-200
601
0891
00So
ucoo
k R
iver
at P
embr
oke
Roa
d,
near
Con
cord
13.3
726
9.26
268.
66Ex
celle
nt3,
730
Apr
il 17
4:15
pm
1989
–5,
110b
5-14
-200
6
0108
9500
Sunc
ook
Riv
er a
t Nor
th C
hich
este
r15
.97a
345.
3234
4.75
Exce
llent
10,6
00l
Apr
il 17
na19
19–2
0, 1
922–
27,
1929
–70,
200
7–12
,900
3-19
-193
6
0109
0800
Pisc
ataq
uog
Riv
er b
elow
Eve
rett
Dam
, nea
r Eas
t Wea
re8.
7132
8.37
327.
71Ex
celle
nt1,
600
Apr
il 25
3:00
am
1963
–1,
770
6-12
-198
4
0109
1000
Sout
h B
ranc
h Pi
scat
aquo
g R
iver
ne
ar G
offs
tow
nna
322.
9732
2.28
Goo
d8,
880c,
o,p
Apr
il 16
na19
41–7
87,
180
5-14
-200
6
0109
1500
Pisc
ataq
uog
Riv
er n
ear G
offs
tow
n13
.05
187.
7018
7.03
Exce
llent
11,2
00A
pril
165:
00 p
m19
36, 1
938,
19
40–7
8, 1
983–
21,9
009-
21-1
938
0109
2000
Mer
rimac
k R
iver
nea
r Gof
fs F
alls
, be
low
Man
ches
ter
16.7
912
6.06
125.
37Ex
celle
nt59
,700
Apr
il 17
12:4
5 pm
1936
–15
0,00
0j3-
20-1
936
0109
3000
Suck
er B
rook
at A
ubur
n4.
1225
6.84
256.
14Ex
celle
ntna
d,o
Apr
il 17
na19
38–7
060
2m9-
12-1
954
0109
4000
Souh
egan
Riv
er a
t Mer
rimac
k12
.71
173.
2917
2.59
Exce
llent
10,5
00A
pril
175:
45 a
m19
10–7
6, 1
980,
19
82–
16,9
003-
19-1
936
0109
6581
7B
eave
r Bro
ok a
t For
dway
Ext
ensi
on
at D
erry
6.00
nana
Exce
llent
1,10
0A
pril
167:
00 p
m20
06–
nana

Peak-Stage Data 9Ta
ble
2.
Peak
-sta
ge d
ata
and
peak
-dis
char
ge d
ata
durin
g th
e Ap
ril 2
007
flood
at 5
7 st
ream
gage
site
s in
cen
tral a
nd s
outh
ern
New
Ham
pshi
re.—
Cont
inue
d
[Loc
atio
n of
stre
amga
ges i
n fig
ure
4. U
SGS,
U.S
. Geo
logi
cal S
urve
y; S
R, S
tate
Rou
te; f
t, fe
et; N
AVD
88,
Nor
th A
mer
ican
Ver
tical
Dat
um o
f 198
8; N
GV
D 2
9, N
atio
nal G
eode
tic V
ertic
al D
atum
of 1
929;
ft3 /s
, cub
ic fe
et p
er se
cond
; na,
not
ava
ilabl
e. P
erio
ds o
f rec
ord
with
out a
n en
d da
te a
re a
ctiv
e st
ream
gage
s]
USG
S st
ream
-ga
ge
num
ber
Stre
amga
ge n
ame
Apr
il 20
07 fl
ood
Peri
od o
f rec
ord
Max
imum
pre
viou
sly
reco
rded
floo
dPe
ak
stag
e,
loca
l da
tum
(ft
)
Peak
st
age,
N
GVD
29
(ft)
Peak
st
age,
N
AVD
88
(ft)
Qua
lity
rank
ing
of s
tage
Peak
di
s-ch
arge
(ft
3 /s)
Day
Tim
ePe
ak
disc
harg
e (ft
3 /s)
Dat
e
0109
6584
4B
eave
r Bro
ok a
t Sou
th R
oad,
ne
ar D
erry
5.69
219.
4521
8.76
Exce
llent
1,47
0A
pril
167:
15 p
m20
06–
2,23
05-
15-2
006
0109
6585
2B
eave
r Bro
ok a
t Nor
th P
elha
m13
.52
162.
7816
2.07
Exce
llent
1,90
0A
pril
1610
:45
pm19
87–
2,94
05-
15-2
006
0109
6587
Trib
utar
y to
Cob
betts
Pon
d at
I-93
so
uth
exit
ram
p ne
ar W
indh
am3.
67na
naEx
celle
nt59
Apr
il 16
7:00
am
2006
–72
5-14
-200
6
0110
0505
Spic
ket R
iver
at N
orth
Sal
em6.
04na
naEx
celle
nt43
4A
pril
183:
45 a
m20
01–
801
5-15
-200
601
1005
49Po
licy
Bro
ok a
t Roc
king
ham
Par
k B
oule
vard
at S
alem
3.17
nana
Exce
llent
95A
pril
166:
45 p
m20
06–
nana
0110
0560
5Po
licy
Bro
ok a
t I-9
3 no
rth re
st st
op
entra
nce
ram
p, n
ear S
alem
6.10
111.
8011
1.04
Exce
llent
338
Apr
il 16
9:30
pm
2006
–51
55-
15-2
006
0110
0561
Spic
ket R
iver
nea
r Met
huen
, Mas
s.9.
0110
9.91
109.
14Ex
celle
nt1,
130
Apr
il 18
1:45
pm
2001
–2,
480
5-15
-200
601
1375
00A
mm
onoo
suc
Riv
er a
t B
ethl
ehem
Junc
tion
7.15
1,18
7.89
1,18
7.63
Exce
llent
3,37
0A
pril
164:
45 p
m19
40–
11,3
0011
-12-
1995
0113
8500
Con
nect
icut
Riv
er a
t Wel
ls R
iver
, Vt.
9.25
409.
0040
8.62
Exce
llent
27,3
00A
pril
245:
00 p
m19
50–
57,1
007-
1-19
7301
1445
00C
onne
ctic
ut R
iver
at W
est L
eban
on16
.41
337.
9333
7.52
Exce
llent
38,8
00A
pril
2411
:30
am19
12–7
6, 1
979–
136,
000
11-4
-192
701
1505
00M
asco
ma
Riv
er a
t Mas
com
a8.
33a
749.
0174
8.71
Exce
llent
2,99
0aA
pril
187:
00 a
m19
24–
5,09
03-
19-1
936
a D
ata
prov
ided
by
New
Ham
pshi
re D
epar
tmen
t of E
nviro
nmen
tal S
ervi
ces.
b D
isch
arge
est
imat
ed b
y gr
aphi
cally
ext
endi
ng st
age-
disc
harg
e re
latio
nshi
p.c
Dis
char
ge is
max
imum
for t
he p
erio
d of
reco
rd w
hich
is g
reat
er th
an 1
0 ye
ars.
d B
ackw
ater
from
dow
nstre
am c
ondi
tions
inva
lidat
ed th
e st
age-
disc
harg
e re
latio
nshi
p.e
Peak
stag
es d
eter
min
ed a
t ups
tream
and
dow
nstre
am c
ontro
l loc
atio
ns a
s con
trol f
or th
e st
ream
gage
was
mov
ed d
urin
g pe
riod
of re
cord
. Rep
orte
d el
evat
ions
are
at a
poi
nt a
ppro
xim
atel
y 10
0 ft
dow
nstre
am
from
the
stre
amga
ge h
ouse
.f
Max
imum
dai
ly m
ean
disc
harg
e.g
Stre
amga
ge d
ata
obta
ined
from
the
U.S
. Arm
y C
orps
of E
ngin
eer’s
Web
site
(U.S
. Arm
y C
orps
of E
ngin
eers
, 200
7).
h D
isch
arge
est
imat
e fr
om fl
agge
d hi
gh-w
ater
mar
ks fo
llow
ing
the
Oct
ober
8 a
nd 9
, 200
5, fl
ood
(Ols
on, 2
007)
.i
Stag
e of
Sep
tem
ber 1
938
flood
was
12.
80 ft
.j
Prio
r to
cons
truct
ion
of fl
ood-
cont
rol s
truct
ures
.k
Dis
char
ge e
stim
ated
by
adju
stin
g th
e pe
ak d
isch
arge
det
erm
ined
at t
he d
owns
tream
stre
amga
ge 0
1089
100
by u
sing
the
ratio
of t
he d
rain
age
area
s.l
Mea
sure
men
t of p
eak
disc
harg
e at
wid
th c
ontra
ctio
n by
indi
rect
met
hods
at l
ocat
ions
ups
tream
and
dow
nstre
am fr
om th
e st
ream
gage
(Mat
thai
, 196
7; U
.S. A
rmy
Cor
ps o
f Eng
inee
rs, 2
005)
.m
Max
imum
stag
e on
May
14,
200
6, w
as 4
.36
ft, a
nd o
n Se
ptem
ber 1
2, 1
954,
it w
as 2
.55
ft.n
Not
the
peak
dis
char
ge fo
r 200
7 w
ater
yea
r.o
Not
kno
wn
if lis
ted
valu
e is
pea
k fo
r 200
7 w
ater
yea
r bec
ause
gag
e is
inac
tive.
p D
isch
arge
est
imat
ed b
y ad
just
ing
the
peak
dis
char
ge d
eter
min
ed a
t the
dow
nstre
am st
ream
gage
010
9150
0 by
usi
ng th
e ra
tio o
f the
dra
inag
e ar
eas.
The
drai
nage
are
a of
stre
amga
ge 0
1091
500
was
adj
uste
d to
139
mi2 t
o ac
coun
t for
neg
ligib
le fl
ow (2
0–50
ft3 /s
) bel
ow u
pstre
am g
age
0109
0800
dur
ing
the A
pril
16, 2
007,
pea
k flo
w a
t dow
nstre
am g
age
0109
1500
.

10 Flood of April 2007 in New Hampshire
Figure 4A. Location of U.S. Geological Survey (USGS) streamgage sites and indirect discharge-measurement sites having peak stage and discharge data for the April 2007 flood in Hillsborough County, New Hampshire.
Beards Brook
Souhegan Riverat Merrimack
Beaver Brookat North Pelham
Beards Brooknear Hillsborough
Piscataquog Rivernear Goffstown
Contoocook Riverat Peterborough
South BranchPiscataquog River
near Goffstown
Merrimack River
near Goffs Falls,below Manchester
Piscataquog Riverbelow Everett Dam,near East Weare
Nubanusit Brookbelow MacDowell Dam
near Peterborough
Souhegan Riverat Wilton Road bridge, nearWilton/Milford town line
HILLSBOROUGHCOUNTY
NEW HAMPSHIREMASSACHUSETTS
Souh
egan
River
Warner River
Con
tooc
ook
Riv
er
Piscataquog River
North Branch
Sunc
ook
Riv
er
Souc
ook
Riv
er
Merrim
ack River
Beaver Br ook
Blackwater Ri ve r
Merrim
ack River
0 5 102.5 MILES
0 5 102.5 KILOMETERS
EXPLANATION
Active or discontinued USGS streamgage site (see table 1)
County boundary
72° 71°30'
42°45'
43°
43°15'
Base from U.S. Geological Survey Digital Line Graphs, 1:24,000, 1990−94 and National Hydrography Dataset, 1:24,000, 1999
71°45' 71°15'
Indirect discharge-measurement site (see table 4)

Peak-Stage Data 11
Figure 4B. Location of U.S. Geological Survey (USGS) streamgage sites and indirect discharge-measurement sites having peak stage and discharge data for the April 2007 flood in Rockingham County, New Hampshire.
Policy Brookat Rockingham Park Boulevard at Salem
Winnicut Riverat Greenland,near Portsmouth
Berrys Brookat Sagamore Road,near Portsmouth
NE
W H
AMPSHIRE
Sucker Brookat Auburn
Dudley Brooknear Exeter
Spicket Riverat North Salem
Spicket Rivernear Methuen, Mass.
Mill Brooknear StateRoute 108,at Stratham
Beaver Brookat South Road,near Derry
Policy Brookat I-93 rest stop,near Salem
Exeter Riverat Haigh Road,near Brentwood Taylor River
at Old Stage Road,near Hampton
Tributary toCobbetts Pondat I-93 exit ramp,near WindhamBeaver Brook
at Fordway Extension,at Derry
Lamprey Riverat Epping Roadrailroad bridge,Raymond
Atlantic Ocean
Salmon Falls River
ROCKINGHAMCOUNTY
NEW HAM
PSHIRE
MAINE
Sunc
ook
Riv
er
Lamprey River
North River
Exeter River
Isinglass River
Merrim
ack River
MA
SS
ACHUSETTS
Beaver Br ook
Spicket River
Souc
ook
Riv
er
Oyster River
Cocheco River
71°30' 71°
42°45'
43°
43°15'
EXPLANATION
Base from U.S. Geological Survey Digital Line Graphs, 1:24,000, 1990−94 and National Hydrography Dataset, 1:24,000, 1999
0 5 102.5 MILES
0 5 102.5 KILOMETERS
Great Bay
71°15' 70°45'
Active or discontinued USGS streamgage site (see table 1)
County boundary
Indirect discharge-measurement site (see table 4)

12 Flood of April 2007 in New Hampshire
Figure 4C. Location of U.S. Geological Survey (USGS) streamgage sites and indirect discharge-measurement sites having peak stage and discharge data for the April 2007 flood in Merrimack County, New Hampshire.
Winnipesaukee Ri
ver
LakeWinnipesaukee
Smith Rivernear Bristol
Merrimack Riverat Concord
Warner Riverat Davisville
SoucookRiver nearConcord
BlackwaterRiver nearWebster
ContoocookRiver nearHenniker
SuncookRiver at NorthChichester
Merrimack Riverat Franklin Junction
Soucook River atPembroke Road,near Concord
Contoocook Riverat River Hill,near Penacook
Contoocook Riverbelow Hopkinton Damat West Hopkinton
Suncook River atWebsters Mill Road,Chichester/Pittsfield
SuncookRiver at Short Falls Road, Epsom
MERRIMACK COUNTY
Warner River
Merrimack R
iver
Blackw
at er River
Smith Rive
r
North Branch
Con
tooc
ook River
Pemigewasset River
Souc
ook
Riv
er
Piscataquog River
Sunc
ook
Rive
r
72° 71°30'
43°
43°30'
EXPLANATION
Base from U.S. Geological Survey Digital Line Graphs, 1:24,000, 1990−94 and National Hydrography Dataset, 1:24,000, 1999
0 5 102.5 MILES
0 5 102.5 KILOMETERS
71°45' 71°15'
43°15'
Active or discontinued USGS streamgage site (see table 1)
County boundary
Indirect discharge-measurement site (see table 4)

Peak-Stage Data 13
Figure 4D. Location of U.S. Geological Survey (USGS) streamgage sites having peak stage and discharge data for the April 2007 flood in Belknap County, New Hampshire.
Ossipee River
OssipeeLake
Winnipesaukee Riv
er
LakeWinnipesaukee
WinnipesaukeeRiver at Tilton
Pem
ige w
asse
t Riv
er
Cocheco River
Salmon Falls River
MA
INE
NE
W H
AM
PSHIR
ESquamLake
PoorfarmBrook nearGilford
LakeWinnipesaukeeat Weirs Beach
Lake WinnipesaukeeOutlet at Lakeport
Active or discontinued USGS streamgage site (see table 1)
BELKNAP COUNTY
Souc
ook
Riv
er
71°30' 71°
43°30'
43°45'
0 5 102.5 MILES
0 5 102.5 KILOMETERS
EXPLANATION
County boundary
Sunc
ook
Rive
r
Bearcamp River
Merrim
ack River
Base from U.S. Geological Survey Digital Line Graphs, 1:24,000, 1990−94 and National Hydrography Dataset, 1:24,000, 1999
71°15'

14 Flood of April 2007 in New Hampshire
Figure 4E. Location of U.S. Geological Survey (USGS) streamgage sites having peak stage and discharge data for the April 2007 flood in Strafford County, New Hampshire.
Cocheco River
Oyster Rivernear Durham
Cocheco Rivernear Rochester
Lamprey Rivernear Newmarket
Salmon Falls Riverat Milton
Isinglass Riverat Rochester Neck Road,near Dover
STRAFFORDCOUNTY
NEW HAM
PSHIRE
MAINE
Sunc
ook
Riv
er
Lamprey River
North River
Isinglass River
Oyster River
Salmon Falls R
iv er
Souc
ook
Riv
er
Lake Winnipesaukee
GreatBay
71°15' 71° 70°45'
43°15'
43°30'
0 5 102.5 MILES
0 5 102.5 KILOMETERS
EXPLANATIONCounty boundary
Base from U.S. Geological Survey Digital Line Graphs, 1:24,000, 1990−94 and National Hydrography Dataset, 1:24,000, 1999
Active or discontinued USGS streamgage site (see table 1)

Peak-Stage Data 15
Figure 4F. Location of U.S. Geological Survey (USGS) streamgage sites having peak stage and discharge data for the April 2007 flood in Grafton County, New Hampshire.
Connecticut Riverat West Lebanon
Squam Lake
NEW
HA
MPS
HIR
E
VER
MO
NT
Squam River at Ashland
Baker River near Rumney
Mascoma Riverat Mascoma
Pemigewasset Riverat Plymouth
Pemigewasset River at Woodstock
Connecticut River at Wells River
Ammonoosuc Riverat Bethlehem Junction
East Branch Pemigewasset Riverat Lincoln
Newfound Riverbelow Newfound Lakenear Bristol
GRAFTON COUNTY
Con
nect
icut
Riv
er
Pem
ige w
asse
t Riv
er
Ammon
oosuc River
Mas
com
a R
iver
Lake
Winnipesaukee
0 5 102.5 MILES
0 5 102.5 KILOMETERS
Smith
River
EXPLANATIONCounty boundary
Baker River
72° 71°30'
43°45'
44°
44°15'
Base from U.S. Geological Survey Digital Line Graphs, 1:24,000, 1990−94 and National Hydrography Dataset, 1:24,000, 1999
Active or discontinued USGS streamgage site (see table 1)
71°15'

16 Flood of April 2007 in New Hampshire
Figure 4G. Location of U.S. Geological Survey (USGS) streamgage sites having peak stage and discharge data for the April 2007 flood in Carroll County, New Hampshire.
Lake Winnipesaukee
Pem
igew
asse
t Riv
er
Ammonoosuc River
SquamLake
Saco Rivernear Conway
Bearcamp Riverat South Tamworth
Ossipee Riverat Effingham FallsShannon Brook
near Moultonborough
CARROLL COUNTY
MA
INE
NE
W H
AM
PSHIR
ESaco River
Ossipee River
71°30' 71°
43°30'
44°
Bearcamp River
0 5 102.5 MILES
0 5 102.5 KILOMETERS
EXPLANATIONCounty boundary
Base from U.S. Geological Survey Digital Line Graphs, 1:24,000, 1990−94 and National Hydrography Dataset, 1:24,000, 1999
Active or discontinued USGS streamgage site (see table 1)
OssipeeLake

Peak-Discharge Data 17
Peak-Discharge DataPeak discharges for most streamgages were deter-
mined by applying the peak stage to the most current stage-discharge relation developed for that streamgage (table 2). At discontinued streamgages, there is the possibility that the stage-discharge relation has changed during the years that the site has been inactive. Each of the discontinued streamgages, however, is at a site having a stable channel or control, and the most recent stage-discharge relationship available for the site provides reasonable results.
There were four exceptions to using the stage- discharge relation for determining the peak-discharge of the April 2007 flood:
At six streamgages (01072100, 01073600, 01073750, 1. 01073810, 01079900, and 01084500; table 2, footnote b), the current stage-discharge relation was undeveloped for the unusually large peak stage. In such cases, the stage-discharge relation was graphically extended to the peak stage by using the trend of the upper end of the stage-discharge relation. The error introduced to the peak-dis-charge value is unknown when the stage-discharge rela-tion is extended without manually measured discharges.
At discontinued streamgage 01093000, Sucker Brook 2. at Auburn (fig. 4B; table 2, footnote d), Rockingham County, backwater resulting from hydraulic conditions in the channel downstream from the streamgage prevented the use of the stage-discharge relation to determine the peak discharge from the peak stage. The peak discharge at this streamgage is therefore unknown.
At discontinued streamgage 01091000 (drainage 3. area of 104 mi2), South Branch Piscataquog River near Goffstown, N.H. (fig. 4A; table 2, footnote p), Hillsborough County, the USGS streamgage house was removed and datum reference marks were destroyed during the construction of a new bridge in 2003. Because the reference marks were destroyed, it was not possible to tie the surveyed high-water marks at this site to the streamgage datum. Without this information, the stage-discharge relation for the streamgage could not be used. Although enough high-water marks were available upstream and downstream from the bridge to allow a discharge estimate to be made at the bridge by using indirect techniques (Matthai, 1967), the area upstream from the bridge experienced backwater effects during the April 2007 flood. This invalidated the use of indirect techniques to determine the April 2007 flood discharge at this location.
High-water-mark elevation data were collected upstream and downstream from discontinued streamgage 01091000 at the Route 13 (Mount Vernon Road) bridge (drainage area of 54 mi2) over the South Branch Piscataquog River in New Boston. These data were collected to determine
the peak flow for the April 2007 flood at the Route 13 bridge as well as at discontinued streamgage 01091000 by using the ratio of the drainage areas between the Route 13 bridge and the discontinued streamgage. Although the bridge provides sufficient river constric-tion to allow a discharge estimate to be made by using indirect methods (Matthai, 1967), subsequent information provided by two residents living near the Route 13 bridge indicated that the main channel of the South Branch Piscataquog River overtopped the banks upstream from the Route 13 bridge, and water flowed down a road 500 ft south of the bridge, along the downstream side of Route 13, and back into the South Branch Piscataquog River downstream from the Route 13 bridge. This road overflow invalidated a discharge determination made by indirect methods at the Route 13 bridge in New Boston.
Peak discharge at discontinued streamgage 01091000, South Branch Piscataquog River near Goffstown, N.H., could not be determined by indirect methods due to backwater effects, nor could it be determined at the Route 13 bridge over the South Branch Piscataquog River in New Boston due to flow on the upstream right overbank. It was decided, however, that the April 2007 peak discharge at streamgage 01091000, could be determined by using the ratio of the drainage area for this streamgage to the area for streamgage 01091500 (drainage area of 202 mi2), Piscataquog River near Goffstown (fig. 4A), downstream from discontinued streamgage 01091000. The South Branch Piscataquog River flows into the Piscataquog River downstream from streamgage 01090800 (drainage area of 63 mi2) at Piscataquog River below Everett Dam, near East Weare and upstream from streamgage 01091500 at Piscataquog River near Goffstown. Determination of the April 2007 peak discharge by ratio of drainage areas between the South Branch Piscataquog River near Goffstown and Piscataquog River near Goffstown streamgages was deemed acceptable because there was negligible contribution to flow downstream from the Hopkinton-Everett Lake Dam (as recorded at streamgage 01090800, Piscataquog River below Everett Dam, near East Weare) to the peak flood flow at the Piscataquog River near Goffstown, N.H. streamgage. The 202-mi2 drainage area of the Piscataquog River near Goffstown, N.H. streamgage was adjusted to 139 mi2 to reflect the negligible contribution of 20–50 ft3/s (U.S. Army Corps of Engineers, 2007) for April 16–17, 2007, below the Hopkinton-Everett Lake Dam in Contoocook as measured at the Piscataquog River below Everett Dam, near East Weare. The peak discharge at streamgage 01091000, South Branch Piscataquog River near Goffstown, was 11,200 ft3/s on April 16 at 5 pm. The flood-peak discharge for the April 2007 flood at the discontinued South Branch Piscataquog River near Goffstown streamgage was estimated to be 8,880 ft3/s by adjusting the peak

18 Flood of April 2007 in New Hampshire
discharge (using equation 1—explained in the section “Determination of the April 2007 Flood Discharge by Indirect Methods at Ungaged Sites”) determined for the downstream Piscataquog River near Goffstown streamgage by the ratio of the drainage areas for streamgages at South Branch Piscataquog River near Goffstown and Piscataquog River near Goffstown.
USGS streamgage 01089500 (drainage area of 155 mi4. 2), Suncook River at Depot Road in North Chichester (fig. 4C; table 2, footnote l), Merrimack County, was active during 1919 to 1920, 1922 to 1927, and 1929 to 1970. In November of 2007, it was again activated. After the April 16–18, 2007, flood, high-water mark information was collected at the former streamgage site. By using the streamgage rating (stage/discharge relation) established for the period of record prior to 1970, a peak discharge of 15,000 ft3/s was determined for the former location of the Suncook River at Depot Road in North Chichester streamgage for the April 16–18, 2007, flood. Subsequently, indirect discharge determinations were made at locations upstream and downstream from the discontinued streamgage. These locations are at the Websters Mill Road bridge in Chichester/Pittsfield and Short Falls Road bridge in Epsom, with drainage areas of 137 and 210 mi2, respectively. The high-water marks upstream and downstream from each bridge, the bridge-opening geometry, and channel and floodplain cross sections upstream and downstream from the bridge were surveyed and the values were input to the USACE Hydrologic Engineering Center River Analysis System (HEC-RAS) program (2005). Discharges were selected iteratively and input to the HEC-RAS program so that the resulting water-surface-elevation output from the program matched the high-water marks surveyed upstream from the bridge. A flood-peak discharge of 10,600 ft3/s was determined for the former Suncook River at Depot Road in North Chichester streamgage site on the basis of the discharge/drainage-area relation between the two indirectly determined (Matthai, 1967; U.S. Army Corps of Engineers, 2005) April 2007 flood-peak discharges at the Short Falls and Websters Mill Road bridges on the Suncook River. The upper end of the rating (stage/discharge relation) at the former streamgage has shifted since it was determined from the March 19, 1936, flood data, when a discharge of 12,900 ft3/s at a gage height of 15.27 ft was ascertained by slope-area and contracted-opening methods. The shift in the upper end of the rating likely is due to a greater amount of vegetation on the right overbank in 2007 than in 1936 (as seen in USGS photographs on file at the New Hampshire-Vermont Water Science Center) and the construction of a weir control along with the removal of a channel island below the streamgage in the summer of 1937. For this reason, the discharge of 10,600 ft3/s was determined to be the
peak discharge for the April 16–18, 2007, flood at the former streamgage.
The peak-discharge data for all of the sites included in this investigation are shown in table 2. At five long-term (more than 10 years of record) streamgages, the peak discharge from the April 2007 flood was the maximum discharge for the period of record. The discharges for these five streamgages are listed in table 2 in footnote c. Four of these streamgages have very long periods of record: streamgage 01091000, South Branch Piscataquog River near Goffstown, 1941–78; streamgage 01082000, Contoocook River at Peterborough, 1946–present (2007); streamgage 01073000, Oyster River near Durham, 1934–present (2007); and streamgage 01072100, Salmon Falls River at Milton, 1968–present (2007).
Flow-Frequency Analyses of the April 2007 Flooding
Flow-frequency curves were determined for all 57 streamgages included in this investigation. For 39 of the 57 streamgages, the guidelines in Bulletin 17B (U.S. Interagency Advisory Committee on Water Data, 1982) were used to determine flow-frequency curves. Bulletin 17B recommends the use of a log-Pearson Type III distribution for estimating flow frequency and provides procedures for weighting sta-tion skews, determining historical peaks, and detecting and treating outliers and trends. Bulletin 17B also recommends at least 10 years of streamgage record for a flow-frequency analysis. Software developed by the USGS to analyze peak-flow frequency (PeakFQ) was used for these computations (U.S. Geological Survey, 2007a). The peak-flow data used as input to the PeakFQ program were retrieved from the National Water Information System (NWIS) (U.S. Geological Survey, 2007b). When the flow-frequency curves were computed, if peak discharges at a streamgage were affected by regulation, the station skew—without weighting from the generalized skew as described in Bulletin 17B—was used for computing the frequency curve. If the April 2007 peak discharge was the annual peak for the 2007 water year, it was added to the peak-flow data prior to computing the frequency curves.
For 11 of the 57 streamgages, flood-control structures operated by the USACE are in the basin. Flow-frequency data for 3 of these 11 streamgages were obtained from frequency curves developed by the USACE and published in FEMA Flood-Insurance Studies (table 3, footnote a). At 8 of the 11 streamgages, the flow-frequency curve published in the FEMA Flood-Insurance Study was not developed by the USACE and was recomputed for this study by following the Bulletin 17B guidelines and incorporating peak-flow data collected since the flood-control structures were built.
At 10 of the 57 streamgages in this investigation, a record length of 10 or fewer years was considered insufficient for a

Flow-Frequency Analyses of the April 2007 Flooding 19Ta
ble
3.
Flow
-freq
uenc
y da
ta a
nd re
curr
ence
-inte
rval
est
imat
es fo
r 57
stre
amga
ges
durin
g th
e Ap
ril 2
007
flood
in c
entra
l and
sou
ther
n N
ew H
amps
hire
.—Co
ntin
ued
[Loc
atio
n of
stre
amga
ges i
n fig
ure
4. U
SGS,
U.S
. Geo
logi
cal S
urve
y; ft
3 /s, c
ubic
feet
per
seco
nd; y
r, ye
ar; <
, les
s tha
n; >
, gre
ater
than
; na,
not
ava
ilabl
e. F
requ
ency
cur
ve d
eter
min
atio
n m
etho
d: L
eBla
nc,
freq
uenc
y cu
rve
estim
ated
with
regr
essi
on e
quat
ion
(LeB
lanc
, 197
8); L
P3, l
og-P
ears
on ty
pe-3
freq
uenc
y an
alys
is; F
IS, f
low
-fre
quen
cy c
urve
from
Fed
eral
Em
erge
ncy
Man
agem
ent A
genc
y flo
od-in
sura
nce
stud
y; R
atio
, fre
quen
cy c
urve
bas
ed o
n a
dow
nstre
am st
ream
gage
with
freq
uenc
y cu
rve
adju
sted
by
the
ratio
of d
rain
age
area
s of t
he st
ream
gage
s]
USG
S st
ream
-ga
ge
num
ber
Stre
amga
ge n
ame
Peak
di
scha
rge
of
Apr
il (1
6–18
) 20
07 fl
ood
(ft
3 /s)
Estim
ated
dis
char
ges
for s
elec
ted
recu
rren
ce in
terv
als
(ft
3 /s)
Freq
uen-
cy c
urve
de
term
i-na
tion
met
hod
Recu
rren
ce
inte
rval
of
Apr
il 20
07
flood
(y
r)2-
yr5-
yr10
-yr
25-y
r50
-yr
100-
yr50
0-yr
0106
4500
Saco
Riv
er n
ear C
onw
ay9,
750
17,0
0026
,200
32,7
0041
,200
47,7
0054
,400
70,7
00LP
3<2
0106
4801
Bea
rcam
p R
iver
at S
outh
Tam
wor
th3,
720
3,64
05,
070
6,00
07,
140
7,97
08,
790
10,6
50LP
32–
501
0650
00O
ssip
ee R
iver
at E
ffing
ham
Fal
ls5,
370
3,55
04,
970
5,93
07,
190
8,16
09,
140
11,5
00LP
35–
1001
0721
00Sa
lmon
Fal
ls R
iver
at M
ilton
5,50
01,
440
2,38
03,
190
4,45
05,
590
6,92
010
,900
LP3
25–5
001
0728
00C
oche
co R
iver
nea
r Roc
hest
er7,
240
2,14
03,
850
5,35
07,
740
9,92
012
,500
20,3
00LP
310
–25
0107
2800
Coc
heco
Riv
er n
ear R
oche
ster
—re
cord
ex
tens
ion
with
Lam
prey
Riv
er st
ream
gage
01
0735
00
7,24
01,
640
2,65
03,
460
4,66
05,
680
6,82
010
,000
LP3c
100–
500
0107
2870
Isin
glas
s Riv
er a
t Roc
hest
er N
eck
Roa
d,
near
Dov
er6,
160
1,56
02,
380
2,92
03,
940
4,68
05,
620
8,23
0Le
Bla
ncb
100–
500
0107
3000
Oys
ter R
iver
nea
r Dur
ham
1,32
030
448
863
384
31,
020
1,22
01,
750
LP3
100–
500
0107
3500
Lam
prey
Riv
er n
ear N
ewm
arke
t8,
450
2,19
03,
550
4,66
06,
320
7,76
09,
400
14,1
00LP
350
–100
0107
3587
Exet
er R
iver
at H
aigh
Roa
d, n
ear B
rent
woo
d2,
840
1,25
02,
410
3,45
05,
140
6,69
08,
530
14,1
00LP
35–
1001
0735
87Ex
eter
Riv
er a
t Hai
gh R
oad,
nea
r B
rent
woo
d—re
cord
ext
ensi
on w
ith
Lam
prey
Riv
er st
ream
gage
010
7350
0
2,84
088
21,
420
1,84
02,
450
2,96
03,
530
5,06
0LP
3c25
–50
0107
3600
Dud
ley
Bro
ok n
ear E
xete
r47
016
424
230
037
844
050
667
5LP
350
–100
0107
3750
Mill
Bro
ok n
ear N
H10
8, a
t Stra
tham
325
157
312
450
667
863
1,08
91,
755
LP3
5–10
0107
3785
Win
nicu
t Riv
er a
t Gre
enla
nd,
near
Por
tsm
outh
1,03
022
733
440
654
263
775
81,
100
LeB
lanc
b10
0–50
0
0107
3810
Ber
rys B
rook
at S
agam
ore
Roa
d,
near
Por
tsm
outh
278
77.4
112
136
182
213
253
368
LeB
lanc
b10
0–50
0
0107
3838
Tayl
or R
iver
at O
ld S
tage
Roa
d
near
Ham
pton
436
102
143
172
222
257
302
424
LeB
lanc
b>5
00
0107
4520
East
Bra
nch
Pem
igew
asse
t Riv
er a
t Lin
coln
2,73
010
,700
14,3
0016
,600
19,4
0021
,400
23,4
0027
,900
LP3
<201
0750
00Pe
mig
ewas
set R
iver
at W
oods
tock
4,46
0 11
,800
19,0
0024
,600
32,3
0038
,700
45,5
0063
,600
LP3
<201
0760
00B
aker
Riv
er n
ear R
umne
y3,
040
5,13
08,
620
11,6
0016
,300
20,5
0025
,500
40,5
00LP
3<2
0107
6500
Pem
igew
asse
t Riv
er a
t Ply
mou
th13
,900
21,2
0030
,100
36,4
0044
,700
51,2
0058
,000
74,9
00LP
3<2
0107
7000
Squa
m R
iver
at A
shla
nd54
324
444
561
687
71,
110
1,37
02,
130
LP3
5–10
0107
7510
New
foun
d R
iver
bel
ow N
ewfo
und
Lake
ne
ar B
risto
l1,
690
1,59
02,
300
2,72
03,
190
3,50
03,
780
4,35
0LP
32–
5

20 Flood of April 2007 in New HampshireTa
ble
3.
Flow
-freq
uenc
y da
ta a
nd re
curr
ence
-inte
rval
est
imat
es fo
r 57
stre
amga
ges
durin
g th
e Ap
ril 2
007
flood
in c
entra
l and
sou
ther
n N
ew H
amps
hire
.—Co
ntin
ued
[Loc
atio
n of
stre
amga
ges i
n fig
ure
4. U
SGS,
U.S
. Geo
logi
cal S
urve
y; ft
3 /s, c
ubic
feet
per
seco
nd; y
r, ye
ar; <
, les
s tha
n; >
, gre
ater
than
; na,
not
ava
ilabl
e. F
requ
ency
cur
ve d
eter
min
atio
n m
etho
d: L
eBla
nc,
freq
uenc
y cu
rve
estim
ated
with
regr
essi
on e
quat
ion
(LeB
lanc
, 197
8); L
P3, l
og-P
ears
on ty
pe-3
freq
uenc
y an
alys
is; F
IS, f
low
-fre
quen
cy c
urve
from
Fed
eral
Em
erge
ncy
Man
agem
ent A
genc
y flo
od-in
sura
nce
stud
y; R
atio
, fre
quen
cy c
urve
bas
ed o
n a
dow
nstre
am st
ream
gage
with
freq
uenc
y cu
rve
adju
sted
by
the
ratio
of d
rain
age
area
s of t
he st
ream
gage
s]
USG
S st
ream
-ga
ge
num
ber
Stre
amga
ge n
ame
Peak
di
scha
rge
of
Apr
il (1
6–18
) 20
07 fl
ood
(ft
3 /s)
Estim
ated
dis
char
ges
for s
elec
ted
recu
rren
ce in
terv
als
(ft
3 /s)
Freq
uen-
cy c
urve
de
term
i-na
tion
met
hod
Recu
rren
ce
inte
rval
of
Apr
il 20
07
flood
(y
r)2-
yr5-
yr10
-yr
25-y
r50
-yr
100-
yr50
0-yr
0107
8000
Smith
Riv
er n
ear B
risto
l2,
770
1,75
02,
610
3,27
04,
220
5,02
05,
900
8,30
0LP
35–
1001
0796
02Po
orfa
rm B
rook
nea
r Gilf
ord
505
220
374
472
722
882
1,09
01,
780
LeB
lanc
b10
–25
0107
9900
Shan
non
Bro
ok n
ear M
oulto
nbor
ough
570
325
592
770
1,24
01,
560
1,97
03,
420
LeB
lanc
b2–
501
0800
00La
ke W
inni
pesa
ukee
at W
eirs
Bea
chna
na
na50
5.4
ftna
505.
9 ft
506.
2 ft
506.
7 ft
FIS
<10
0108
0500
Lake
Win
nipe
sauk
ee O
utle
t at L
akep
ort
2,4
301,
650
2,14
02,
350
2,52
02,
610
2,67
02,
750
LP3
10–2
501
0810
00W
inni
pesa
ukee
Riv
er a
t Tilt
on3,
550
2,26
03,
000
3,44
03,
940
4,29
04,
610
5,28
0LP
310
–25
0108
1500
Mer
rimac
k R
iver
at F
rank
lin Ju
nctio
n17
,300
17,7
0020
,000
20,9
0021
,600
21,9
0022
,100
22,3
00LP
3<2
0108
2000
Con
tooc
ook
Riv
er a
t Pet
erbo
roug
h4,
110
1,31
01,
920
2,37
02,
990
3,48
03,
990
5,33
0LP
310
0–50
001
0830
00N
uban
usit
Bro
ok b
elow
Mac
Dow
ell D
am
near
Pet
erbo
roug
h63
7na
na65
0na
700
800
900
FISa
<10
0108
4500
Bea
rds B
rook
nea
r Hill
sbor
ough
3,55
01,
200
1,64
01,
930
2,30
02,
580
2,85
03,
510
LP3
>500
0108
5000
Con
tooc
ook
Riv
er n
ear H
enni
ker
13,0
004,
960
7,36
09,
240
12,0
0014
,300
16,8
0023
,900
LP3
25–5
001
0855
00C
onto
ocoo
k R
iver
bel
ow H
opki
nton
Dam
at
Wes
t Hop
kint
on5,
370
4,58
05,
570
6,07
06,
570
6,88
07,
150
7,63
0LP
32–
5
0108
6000
War
ner R
iver
at D
avis
ville
7,73
02,
200
3,39
04,
310
5,63
06,
730
7,93
011
,200
LP3
50–1
0001
0870
00B
lack
wat
er R
iver
nea
r Web
ster
1,95
01,
790
2,10
02,
200
2,27
02,
300
2,32
02,
340
LP3
2–5
0108
7850
Con
tooc
ook
Riv
er a
t Riv
er H
ill,
near
Pen
acoo
k7,
780
nana
8,00
0na
15,0
0023
,300
33,0
00FI
Sa<1
0
0108
8400
Mer
rimac
k R
iver
at C
onco
rd32
,800
nana
19,3
00na
33,7
5044
,000
86,2
50FI
Sa10
–50
0108
9000
Souc
ook
Riv
er n
ear C
onco
rd3,
500
1,27
02,
000
2,56
03,
370
4,03
04,
760
6,75
0R
atio
25–5
001
0891
00So
ucoo
k R
iver
at P
embr
oke
Roa
d,
near
Con
cord
3,73
01,
360
2,13
02,
730
3,59
04,
300
5,08
07,
200
LP3
25–5
0
0108
9500
Sunc
ook
Riv
er a
t Nor
th C
hich
este
r10
,600
2,23
03,
550
4,68
06,
430
7,99
09,
820
15,3
00LP
310
0–50
001
0908
00Pi
scat
aquo
g R
iver
bel
ow E
vere
tt D
am,
near
Eas
t Wea
re1,
600
1,03
01,
380
1,58
01,
780
1,91
02,
010
2,22
0LP
310
–25
0109
1000
Sout
h B
ranc
h Pi
scat
aquo
g R
iver
ne
ar G
offs
tow
n8,
880
2,04
03,
000
3,65
04,
460
5,07
05,
680
7,11
0LP
3>5
00
0109
1500
Pisc
ataq
uog
Riv
er n
ear G
offs
tow
n11
,200
3,20
05,
100
6,50
08,
420
9,95
011
,600
15,7
00LP
350
–100
0109
2000
Mer
rimac
k R
iver
nea
r Gof
fs F
alls
, be
low
Man
ches
ter
59,7
0030
,200
39,2
0045
,000
52,4
0057
,800
63,2
0075
,900
LP3
50–1
00

Flow-Frequency Analyses of the April 2007 Flooding 21Ta
ble
3.
Flow
-freq
uenc
y da
ta a
nd re
curr
ence
-inte
rval
est
imat
es fo
r 57
stre
amga
ges
durin
g th
e Ap
ril 2
007
flood
in c
entra
l and
sou
ther
n N
ew H
amps
hire
.—Co
ntin
ued
[Loc
atio
n of
stre
amga
ges i
n fig
ure
4. U
SGS,
U.S
. Geo
logi
cal S
urve
y; ft
3 /s, c
ubic
feet
per
seco
nd; y
r, ye
ar; <
, les
s tha
n; >
, gre
ater
than
; na,
not
ava
ilabl
e. F
requ
ency
cur
ve d
eter
min
atio
n m
etho
d: L
eBla
nc,
freq
uenc
y cu
rve
estim
ated
with
regr
essi
on e
quat
ion
(LeB
lanc
, 197
8); L
P3, l
og-P
ears
on ty
pe-3
freq
uenc
y an
alys
is; F
IS, f
low
-fre
quen
cy c
urve
from
Fed
eral
Em
erge
ncy
Man
agem
ent A
genc
y flo
od-in
sura
nce
stud
y; R
atio
, fre
quen
cy c
urve
bas
ed o
n a
dow
nstre
am st
ream
gage
with
freq
uenc
y cu
rve
adju
sted
by
the
ratio
of d
rain
age
area
s of t
he st
ream
gage
s]
USG
S st
ream
-ga
ge
num
ber
Stre
amga
ge n
ame
Peak
di
scha
rge
of
Apr
il (1
6–18
) 20
07 fl
ood
(ft
3 /s)
Estim
ated
dis
char
ges
for s
elec
ted
recu
rren
ce in
terv
als
(ft
3 /s)
Freq
uen-
cy c
urve
de
term
i-na
tion
met
hod
Recu
rren
ce
inte
rval
of
Apr
il 20
07
flood
(y
r)2-
yr5-
yr10
-yr
25-y
r50
-yr
100-
yr50
0-yr
0109
3000
Suck
er B
rook
at A
ubur
nna
256
379
459
556
626
693
843
LP3
na01
0940
00So
uheg
an R
iver
at M
errim
ack
10,5
003,
170
4,93
06,
370
8,53
010
,400
12,6
0018
,800
LP3
50–1
0001
0965
817
Bea
ver B
rook
at F
ordw
ay E
xten
sion
at D
erry
1,10
046
381
11,
110
1,59
02,
020
2,52
04,
060
Rat
io5–
1001
0965
844
Bea
ver B
rook
at S
outh
Roa
d, n
ear D
erry
1,47
061
81,
080
1,49
02,
120
2,70
03,
370
5,43
0R
atio
5–10
0109
6585
2B
eave
r Bro
ok a
t Nor
th P
elha
m1,
900
799
1,40
01,
920
2,74
03,
490
4,36
07,
020
LP3
5–10
0109
6587
Trib
utar
y to
Cob
betts
Pon
d at
I-93
sout
h ex
it ra
mp
near
Win
dham
5920
.837
.548
.379
.398
.712
421
8Le
Bla
ncb
10–2
5
0110
0505
Spic
ket R
iver
at N
orth
Sal
em43
433
851
963
988
41,
050
1,27
01,
900
LeB
lanc
b2–
501
1005
49Po
licy
Bro
ok a
t Roc
king
ham
Par
k B
oule
vard
at
Sal
em95
57.3
88.3
109
151
180
217
326
Rat
io5–
10
0110
0560
5Po
licy
Bro
ok a
t I-9
3 no
rth re
st st
op e
ntra
nce
ram
p, n
ear S
alem
338
204
314
387
538
640
772
1,16
0Le
Bla
ncb
5–10
0110
0561
Spic
ket R
iver
nea
r Met
huen
, Mas
s.1,
130
854
1,20
01,
440
1,82
02,
110
2,47
03,
410
LeB
lanc
b2–
501
1375
00A
mm
onoo
suc
Riv
er a
t Bet
hleh
em Ju
nctio
n3,
370
4,36
06,
290
7,70
09,
620
11,1
0012
,800
16,9
30LP
3<2
0113
8500
Con
nect
icut
Riv
er a
t Wel
ls R
iver
, Vt.
27,3
0032
,700
41,1
0046
,000
51,5
0055
,100
58,5
0065
,600
LP3
<201
1445
00C
onne
ctic
ut R
iver
at W
est L
eban
on38
,800
47,1
0062
,800
73,9
0088
,900
101,
000
113,
000
145,
000
LP3
<201
1505
00M
asco
ma
Riv
er a
t Mas
com
a2,
990
2,02
02,
980
3,58
04,
290
4,78
05,
250
6,23
0LP
35–
10a
Com
pute
d by
the
U.S
. Arm
y C
orps
of E
ngin
eers
for t
he fl
ood-
insu
ranc
e st
udy.
b R
esul
ts fr
om th
e Le
Bla
nc (1
978)
regr
essi
on e
quat
ions
may
be
unre
liabl
e in
bas
ins w
ith u
rban
izat
ion
or re
gula
tion.
c B
ulle
tin 1
7B “
two-
stat
ion
com
paris
on”
tech
niqu
e ap
plie
d to
ext
end
the
stre
amga
ge re
cord
by
usin
g lo
ng-te
rm st
ream
gage
010
7350
0, L
ampr
ey R
iver
nea
r New
mar
ket.

22 Flood of April 2007 in New Hampshire
flow-frequency analysis. At these sites, the flow-frequency curves were computed by Olson (2007) by using the regres-sion equations for estimating flow frequency developed by LeBlanc (1978). The resulting frequency curves were not adjusted for urbanization or regulation.
At two streamgages, the flow record was sufficient for flow-frequency analysis; however, both of these sites have a short period of record, and within that short record period, these streamgage sites have experienced severe flooding. The streamgage Cocheco River near Rochester (01072800) (fig. 4E) has 13 years of record, and the streamgage Exeter River at Haigh Road near Brentwood (01073587) (fig. 4B) has 12 years of record. A log-Pearson Type III analysis was performed on the flow record at the streamgages and resulted in a recurrence interval for the April 2007 flood peak of 10 to 25 years for the Cocheco River near the Rochester stream-gage and 5–10 years for the Exeter River at Haigh Road near Brentwood streamgage. The two-station-comparison technique in Bulletin 17B was applied to extend the records of these streamgages (S.A. Olson, U.S. Geological Survey, written commun., 2008) by using the long-term streamgage Lam-prey River near Newmarket (01073500) (fig. 4E), which has 73 years of record. The records of the streamgages Cocheco River near Rochester and Exeter River at Haigh Road near Brentwood have correlation coefficients with the record of the streamgage at Lamprey River near Newmarket of 0.84 and 0.97, respectively. The two-station comparison record-extension technique resulted in a recurrence interval for the April 2007 flood peak of 100 to 500 years for the streamgage Cocheco River near Rochester and 25 to 50 years for the streamgage Exeter River at Haigh Road near Brentwood. These data are listed in table 3 and shown in figure 5.
For the streamgage Lake Winnipesaukee at Weirs Beach (01080000), only stage data are available. The frequency data for this site were obtained from the Flood-Insurance Study for the city of Laconia (Federal Emergency Management Agency, 1980a).
Results of the flow-frequency analyses are shown in table 3. The recurrence interval of the April 2007 peak flow at each streamgage was determined by using the results of frequency analysis. Peak discharge equaled or exceeded a 50-year flood at 16 streamgages. Peak discharge equaled or exceeded a 100-year flood at the 10 streamgages listed below:
Cocheco River near Rochester (01072800—with 1. streamgage-record extension);
Isinglass River at Rochester Neck Road, near Dover 2. (01072870);
Oyster River near Durham (01073000);3.
Winnicut River at Greenland, near Portsmouth 4. (01073785);
Berrys Brook at Sagamore Road, near Portsmouth 5. (01073810);
Taylor River at Old Stage Road, near Hampton 6. (01073838);
Contoocook River at Peterborough (01082000);7.
Beards Brook near Hillsborough (01084500);8.
Suncook River at North Chichester (01089500); and9.
South Branch Piscataquog River near Goffstown 10. (01091000).

Flow-Frequency Analyses of the April 2007 Flooding 23
Figure 5. Recurrence intervals for the April 2007 flood at streamgages in Hillsborough, Rockingham, Merrimack, Belknap, Strafford, Grafton, and Carroll Counties in New Hampshire.
COOS
GRAFTON
MERRIMACK
CARROLL
BELKNAP
CHESHIRE
SULLIVAN
HILLSBOROUGH ROCKINGHAM
STRAFFORD
0 10 205 MILES
0 10 205 KILOMETERS
EXPLANATION
Lake
County boundary
River
Recurrence interval of peak dischargeat streamgages, April 2007 (see table 3).
Less than 10-year flood
10- to less than 50-year flood
50- to less than 100-year flood
Equal to or greater than 100-year flood
Recurrence interval unknown
72°
71°
43°
44°
45°
Base from U.S. Geological Survey Digital Line Graphs, 1:24,000, 1990−94 and National Hydrography Dataset, 1:24,000, 1999

24 Flood of April 2007 in New Hampshire
Determination of the April 2007 Flood Discharge by Indirect Methods at Ungaged Sites
Four bridge sites were chosen for the determination of the April 2007 peak discharge by indirect methods (Matthai, 1967; table 4):
Lamprey River at Epping Road railroad bridge in 1. Raymond, N.H. (drainage area of 70 mi2);
Souhegan River at Wilton Road (Elm Street) bridge 2. in Milford, N.H., approximately 2,000 ft east of the Wilton/Milford, N.H. town line (drainage area of 102 mi2);
Suncook River at Short Falls Road bridge in 3. Epsom, N.H. (drainage area of 210 mi2); and
Suncook River at Websters Mill Road bridge at the 4. Chichester/Pittsfield, N.H. town line (drainage area of 137 mi2).
The four locations chosen for the indirect determination of the April 2007 peak-flood discharge have never been streamgage sites. High-water-mark information (table 6), the bridge-opening geometry, and channel and floodplain cross sections upstream and downstream from the bridge were surveyed at each of these sites and input into the USACE HEC-RAS program (2005). The discharges were iteratively selected and input into the HEC-RAS program to match the surface-elevation output and surveyed high-water marks (appendix 1, tables 1–1 to 1–4).
All four of these sites are located on rivers that have streamgage records. On the basis of the indirectly determined April 2007 flood-peak discharge at the ungaged location (by using high-water-mark data and the USACE HEC-RAS program) and the April 2007 flood-peak discharge determined for the streamgage site, a flow-frequency curve was gener-ated for each of the four ungaged sites (table 4). To determine the flow-frequency curve at the ungaged site, the relation between the April 2007 peaks and drainage areas at the gaged and ungaged sites was determined. After this relation was determined, it was applied to the log-Pearson Type III flow-
frequency curve determined at the streamgage site to ascertain the flow-frequency curve at the ungaged site. For comparison purposes, flow-frequency curves at all four sites also were computed by using the regression equations for estimating flow frequency developed by LeBlanc (1978) (table 4).
The coefficient n in the equation below was determined through a drainage-area relation between the April 2007 flood peak discharge at the streamgage site and the indirectly deter-mined April 2007 peak discharge at the ungaged site on each of the rivers of interest by using the drainage-area relation:
Q Q A Ag g
n= ( ) , (1)
where Q is the discharge at the ungaged site, Qg is the discharge at the USGS streamgage site, A is the drainage area at the ungaged site, Ag is the drainage area at the USGS streamgage
site, and n is the drainage-area adjustment value.
The drainage areas are shown in table 1 (in back of report) for the streamgages and in table 4 for the indirect dis-charge-measurement sites. April 2007 peak flood discharges are shown in table 2 for the streamgage sites and in table 4 for the indirect discharge-measurement sites. The calculated-coefficient n values for each indirect discharge-measurement location and related streamgage are shown below:
Lamprey River between Epping Road railroad 1. bridge in Raymond, N.H., and streamgage 01073500 near Newmarket (n = 0.79);
Souhegan River between Wilton Road bridge near 2. the Wilton/Milford, N.H. town line and streamgage 01094000 at Merrimack (n = 0.80);
Suncook River between Short Falls Road bridge in 3. Epsom, N.H., and streamgage 01089500 at North Chichester (n = 0.94); and
Suncook River between Websters Mill Road bridge 4. in Chichester/Pittsfield, N.H., and streamgage 01089500 at North Chichester (n = 0.94).

Determination of the April 2007 Flood Discharge by Indirect Methods at Ungaged Sites 25Ta
ble
4.
Flow
-freq
uenc
y da
ta a
nd re
curr
ence
-inte
rval
est
imat
es b
y in
dire
ct m
etho
ds fo
r fou
r ung
aged
site
s du
ring
the
April
200
7 flo
od in
cen
tral a
nd s
outh
ern
N
ew H
amps
hire
.
[Loc
atio
n of
indi
rect
dis
char
ge-d
eter
min
atio
n si
tes i
n fig
ures
4A
–C. f
t3 /s, c
ubic
feet
per
seco
nd; y
r, ye
ar; >
, gre
ater
than
. Fre
quen
cy c
urve
det
erm
inat
ion
met
hod:
LeB
lanc
, fre
quen
cy c
urve
est
imat
ed w
ith
regr
essi
on e
quat
ion
(LeB
lanc
, 197
8); L
P3, l
og-P
ears
on ty
pe-3
freq
uenc
y an
alys
is; R
atio
, fre
quen
cy c
urve
bas
ed o
n a
dow
nstre
am st
ream
gage
with
freq
uenc
y cu
rve
adju
sted
by
the
ratio
of d
rain
age
area
s of
the
stre
amga
ges]
Indi
rect
dis
char
ge-
dete
rmin
atio
n lo
catio
n
Indi
rect
pea
k di
scha
rge
of
Apr
il (1
6–18
) 20
07 fl
ood
(ft
3 /s)
Estim
ated
dis
char
ges
for s
elec
ted
recu
rren
ce in
terv
als
(ft
3 /s)
Freq
uenc
y-cu
rve
dete
rmin
atio
n m
etho
d
Recu
rren
ce
inte
rval
of
Apr
il 20
07
flood
(y
r)2-
yr5-
yr10
-yr
25-y
r50
-yr
100-
yr50
0-yr
1a) L
ampr
ey R
iver
at E
ppin
g R
oad
railr
oad
b
ridge
in R
aym
ond,
N.H
. (
drai
nage
are
a =
70 m
i2 )
3,99
089
11,
230
1,47
01,
830
2,11
02,
470
3,35
0Le
Bla
nca
>500
1b) L
ampr
ey R
iver
at E
ppin
g R
oad
railr
oad
b
ridge
in R
aym
ond,
N.H
. (
drai
nage
are
a =
70 m
i2 )
3,99
01,
030
1,66
0 2,
180
2,96
0 3,
630
4,40
0 6,
600
Rat
io w
ith L
P3
at st
ream
gage
01
0735
00
50–1
00
2a) S
ouhe
gan
Riv
er a
t Wilt
on R
oad
brid
ge
nea
r the
Wilt
on/M
ilfor
d, N
.H. t
own
line
(
drai
nage
are
a =
102
mi2 )
6,95
01,
910
2,83
03,
450
4,54
05,
340
6,37
09,
090
LeB
lanc
a 10
0–50
0
2b) S
ouhe
gan
Riv
er a
t Wilt
on R
oad
brid
ge
nea
r the
Wilt
on/M
ilfor
d, N
.H. t
own
line
(
drai
nage
are
a =
102
mi2 )
6,95
02,
100
3,26
04,
210
5,64
06,
880
8,33
012
,400
Rat
io w
ith L
P3
at st
ream
gage
01
0940
00
50–1
00
3a) S
unco
ok R
iver
at S
hort
Falls
Roa
d
in
Epso
m, N
.H.
(dr
aina
ge a
rea
= 21
0 m
i2 )
14,1
002,
140
2,79
03,
280
3,85
04,
380
5,04
06,
480
LeB
lanc
a >5
00
3b) S
unco
ok R
iver
at S
hort
Falls
Roa
d
in
Epso
m, N
.H.
(dr
aina
ge a
rea
= 21
0 m
i2 )
14,1
002,
980
4,74
06,
250
8,59
010
,700
13,1
0020
,400
Rat
io w
ith L
P3
at st
ream
gage
01
0895
00
100–
500
4a) S
unco
ok R
iver
at W
ebst
ers M
ill R
oad
i
n C
hich
este
r/Pitt
sfie
ld, N
.H.
(dr
aina
ge a
rea
= 13
7 m
i2 )
9,40
03,
260
5,03
06,
200
8,43
010
,100
12,1
0017
,900
LeB
lanc
a25
–50
4b) S
unco
ok R
iver
at W
ebst
ers M
ill R
oad
i
n C
hich
este
r/Pitt
sfie
ld, N
.H.
(dr
aina
ge a
rea
= 13
7 m
i2 )
9,40
01,
990
3,16
04,
170
5,73
07,
120
8,75
013
,600
Rat
io w
ith L
P3
at st
ream
gage
01
0895
00
100–
500
a Res
ults
from
the
LeB
lanc
(197
8) re
gres
sion
equ
atio
ns m
ay b
e un
relia
ble
in b
asin
s with
urb
aniz
atio
n or
regu
latio
n.

26 Flood of April 2007 in New Hampshire
Comparison of the April 2007 Flood Data to Flood-Insurance Studies
FEMA Flood-Insurance Studies provide communi-ties with information on the severity of flood hazards. This information includes estimated discharges and water-surface-elevation profiles for the 10-, 50-, 100-, and 500-year floods for selected potential surface-water bodies around which development has occurred or is expected to occur. The 10-, 50-, 100-, and 500-year floods have a 10-, 2-, 1-, and 0.2-per-cent chance, respectively, of being equaled or exceeded in any given year. These data are used for planning purposes and for setting flood-insurance rates for structures within communities participating in the National Flood-Insurance Program.
For the streamgage and indirect-discharge sites in this study that were included in a Flood-Insurance Study, discharges and peak water-surface elevations (stage) were compiled from the appropriate study and are given in table 5. Flood-Insurance Study recurrence-interval discharges were obtained from the “Summary of Discharges” table for the reach that incorporated the streamgage site, and the peak water-surface elevations were extracted from the water-surface-elevation profiles. In cases where the streamgage site was not identified on the water-surface-elevation profiles, interpretation of the streamgage location was required to obtain the water-surface-elevation for the corresponding recurrence interval.
The compiled Flood-Insurance Study data are shown in table 5 along with the peak-stage and peak-discharge data for the April 2007 flood. The flow-frequency data obtained from the Flood-Insurance Studies (table 5) often differ from the flow-frequency data determined for this investigation (table 3) because the methods used for determining the frequency curves may be different, and (or) more data are cur-rently available for the development of the frequency curves.
The data contained in this report may aid in the updat-ing of future Flood-Insurance Study water-surface-elevation profiles for some communities through FEMA’s Map Mod-ernization program. For instance, at the Piscataquog River near Goffstown streamgage (01091500), the peak discharge in April 2007 was 11,200 ft3/s. The recurrence interval for this discharge, as reported in the Goffstown Flood-Insurance Study (Federal Emergency Management Agency, 1978b), is 50 to 100 years. It would be expected that the peak stage in April 2007 also would fall between the 50- and 100-year water-surface-elevation profiles at this location. However, the peak stage for the April 2007 flood was 187.70 ft (NGVD 29), which is greater than the 100-year water-surface elevation reported in the Goffstown Flood-Insurance Study. There are 16 streamgage sites and 1 indirect discharge site for which the observed peak discharge of the April 2007 flood is bracketed by a recurrence interval different than the Flood-Insurance Study recurrence interval that brackets the observed peak April 2007 flood stage or water-surface elevation (table 5). The reasons for these discrepancies are beyond the scope of this study.

Comparison of the April 2007 Flood Data to Flood-Insurance Studies 27Ta
ble
5.
Floo
d-in
sura
nce
stud
y da
ta fo
r sel
ecte
d st
ream
gage
site
s in
cen
tral a
nd s
outh
ern
New
Ham
pshi
re.—
Cont
inue
d
[Loc
atio
n of
stre
amga
ges i
n fig
ure
4. n
a, n
ot a
vaila
ble;
ft3 /s
, cub
ic fe
et p
er se
cond
; yr,
year
; NAV
D 8
8, N
orth
Am
eric
an D
atum
of 1
988;
NG
VD
29,
Nat
iona
l Geo
detic
Ver
tical
Dat
um o
f 192
9]
USG
S st
ream
-ga
ge
num
ber
Stre
amga
ge n
ame
and
un
gage
d si
te lo
catio
n
Peak
dis
-ch
arge
of
Apr
il 20
07
flood
(ft3 /s
)
Mag
nitu
de o
f dis
char
ge fo
r X-y
r rec
ur-
renc
e in
terv
al a
t str
eam
gage
loca
tion
from
floo
d-in
sura
nce
stud
y (ft
3 /s)
Peak
sta
ge
of A
pril
2007
flo
od,
NG
VD 2
9 (ft
)
Wat
er-s
urfa
ce e
leva
tion
for X
-yr
recu
rren
ce in
terv
al a
t str
eam
gage
lo
catio
n fr
om fl
ood-
insu
ranc
e st
udy,
N
GVD
29
(ft)
Valu
e to
su
btra
ct
from
N
GVD
29
elev
atio
n to
ob
tain
N
AVD
88
(ft)
10-y
r50
-yr
100-
yr50
0-yr
10-y
r50
-yr
100-
yr50
0-yr
0106
4500
Saco
Riv
er n
ear C
onw
ay9,
750
29,7
5045
,840
53,6
4072
,180
426.
4943
1.9
435.
443
7.1
440.
50.
4401
0648
01B
earc
amp
Riv
er a
t Sou
th T
amw
orth
3,72
0na
na14
,900
na50
1.49
nana
510
na0.
4601
0721
00Sa
lmon
Fal
ls R
iver
at M
ilton
a5,
500
2,93
04,
500
5,29
07,
490
404.
4640
8.1
409.
240
9.8
411.
00.
5601
0728
00C
oche
co R
iver
nea
r Roc
hest
era
7,24
03,
160
5,10
06,
120
9,58
014
0.20
135.
013
6.6
137.
513
9.8
0.61
0107
3500
Lam
prey
Riv
er n
ear N
ewm
arke
t8,
450
4,12
06,
270
7,30
010
,000
55.7
748
.152
.053
.558
.00.
7301
0735
87Ex
eter
Riv
er a
t Hai
gh R
oad,
ne
ar B
rent
woo
da2,
840
1,81
02,
640
3,01
03,
900
71.4
669
.070
.170
.471
.20.
75
0107
3600
Dud
ley
Bro
ok n
ear E
xete
ra47
0na
na50
6na
94.4
0na
na94
.1na
0.75
0107
4520
East
Bra
nch
Pem
igew
asse
t Riv
er
at L
inco
ln2,
730
13,0
0024
,000
30,3
0050
,000
829.
8983
4.0
836.
583
8.0
842.
00.
31
0107
5000
Pem
igew
asse
t Riv
er a
t Woo
dsto
ck4,
460
nana
47,7
00na
623.
27na
na63
2.0
na0.
3401
0760
00B
aker
Riv
er n
ear R
umne
y3,
040
8,20
012
,800
14,4
0019
,000
502.
9950
6.4
509.
150
9.7
511.
40.
4001
0765
00Pe
mig
ewas
set R
iver
at P
lym
outh
13,9
0035
,000
53,5
0062
,000
82,7
0046
7.78
482.
048
2.5
483.
449
4.0
0.41
0108
0000
Lake
Win
nipe
sauk
ee a
t Wei
rs B
each
nana
nana
na50
5.00
505.
450
5.9
506.
250
6.7
0.43
0108
0500
Lake
Win
nipe
sauk
ee O
utle
t at L
akep
ort
2,43
02,
600
2,60
03,
500
4,30
0na
504.
050
4.3
504.
350
4.3
0.44
0108
1000
Win
nipe
sauk
ee R
iver
at T
ilton
a3,
550
3,46
54,
965
5,71
57,
670
449.
4844
9.8
451.
445
2.2
454.
10.
4701
0815
00M
errim
ack
Riv
er a
t Fra
nklin
Junc
tion
17,3
0014
,800
25,0
0030
,000
62,0
0026
4.70
263.
126
8.4
270.
428
1.1
0.50
0108
2000
Con
tooc
ook
Riv
er a
t Pet
erbo
roug
h4,
110
2,30
04,
310
5,70
09,
890
739.
1873
6.7
739.
474
0.5
742.
60.
7201
0830
00N
uban
usit
Bro
ok b
elow
Mac
Dow
ell
Dam
nea
r Pet
erbo
roug
h63
765
070
080
090
093
6.74
nana
nana
0.67
0108
4500
Bea
rds B
rook
nea
r Hill
sbor
ough
a3,
550
2,30
03,
900
4,80
07,
100
602.
3359
8.4
601.
860
3.7
610.
00.
6101
0850
00C
onto
ocoo
k R
iver
nea
r Hen
nike
r13
,000
9,10
017
,000
21,6
0034
,000
484.
8148
4.4
489.
249
1.6
496.
00.
6201
0855
00C
onto
ocoo
k R
iver
bel
ow H
opki
nton
D
am a
t Wes
t Hop
kint
on5,
370
7,20
07,
300
9,50
013
,000
364.
3436
5.7
365.
836
7.5
370.
00.
68
0108
6000
War
ner R
iver
at D
avis
ville
a7,
730
4,60
07,
800
9,50
014
,550
391.
9038
6.0
388.
038
9.0
391.
50.
5901
0870
00B
lack
wat
er R
iver
nea
r Web
ster
1,95
0na
na2,
600
na43
8.60
nana
440.
0na
0.56
0108
7850
Con
tooc
ook
Riv
er a
t Riv
er H
ill,
near
Pen
acoo
k7,
780
8,00
015
,000
23,3
0033
,000
347.
8734
8.2
352.
335
6.1
359.
50.
60
0108
8400
Mer
rimac
k R
iver
at C
onco
rda
32,8
0019
,300
33,7
5044
,000
86,2
5023
1.52
226.
423
0.1
232.
423
8.8
0.61
0108
9000
Souc
ook
Riv
er n
ear C
onco
rda
3,50
02,
410
4,10
05,
045
7,60
530
5.79
301.
430
4.0
305.
230
7.0
0.58

28 Flood of April 2007 in New HampshireTa
ble
5.
Floo
d-in
sura
nce
stud
y da
ta fo
r sel
ecte
d st
ream
gage
site
s in
cen
tral a
nd s
outh
ern
New
Ham
pshi
re.—
Cont
inue
d
[Loc
atio
n of
stre
amga
ges i
n fig
ure
4. n
a, n
ot a
vaila
ble;
ft3 /s
, cub
ic fe
et p
er se
cond
; yr,
year
; NAV
D 8
8, N
orth
Am
eric
an D
atum
of 1
988;
NG
VD
29,
Nat
iona
l Geo
detic
Ver
tical
Dat
um o
f 192
9]
USG
S st
ream
-ga
ge
num
ber
Stre
amga
ge n
ame
and
un
gage
d si
te lo
catio
n
Peak
dis
-ch
arge
of
Apr
il 20
07
flood
(ft3 /s
)
Mag
nitu
de o
f dis
char
ge fo
r X-y
r rec
ur-
renc
e in
terv
al a
t str
eam
gage
loca
tion
from
floo
d-in
sura
nce
stud
y (ft
3 /s)
Peak
sta
ge
of A
pril
2007
flo
od,
NG
VD 2
9 (ft
)
Wat
er-s
urfa
ce e
leva
tion
for X
-yr
recu
rren
ce in
terv
al a
t str
eam
gage
lo
catio
n fr
om fl
ood-
insu
ranc
e st
udy,
N
GVD
29
(ft)
Valu
e to
su
btra
ct
from
N
GVD
29
elev
atio
n to
ob
tain
N
AVD
88
(ft)
10-y
r50
-yr
100-
yr50
0-yr
10-y
r50
-yr
100-
yr50
0-yr
0108
9100
Souc
ook
Riv
er a
t Pem
brok
e R
oad,
ne
ar C
onco
rda
3,73
02,
620
4,45
05,
475
8,25
529
6.26
268.
027
1.2
272.
027
4.0
0.60
0108
9500
Sunc
ook
Riv
er a
t Nor
th C
hich
este
r10
,600
4,77
58,
335
10,3
3015
,970
345.
3234
1.3
344.
034
5.2
347.
90.
57U
ngag
ed
loca
tion
Sunc
ook
Riv
er a
t Sho
rt Fa
lls R
oad
brid
ge in
Eps
om14
,100
6,04
010
,540
13,0
6520
,195
308.
5730
2.5
306.
830
8.2
312.
00.
59
Ung
aged
lo
catio
nSu
ncoo
k R
iver
at W
ebst
ers M
ill R
oad
brid
ge in
Chi
ches
ter/P
ittsf
ield
9,40
04,
510
7,87
09,
750
15,0
7039
3.21
391.
039
2.5
393.
539
5.0
0.56
0109
0800
Pisc
ataq
uog
Riv
er b
elow
Eve
rett
Dam
, ne
ar E
ast W
eare
1,60
0na
na2,
200
na32
8.37
nana
329.
6na
0.66
0109
1000
Sout
h B
ranc
h Pi
scat
aquo
g R
iver
ne
ar G
offs
tow
n8,
880
3,69
05,
910
6,99
010
,220
322.
9731
7.8
320.
032
1.0
323.
80.
67
0109
1500
Pisc
ataq
uog
Riv
er n
ear G
offs
tow
na11
,200
5,30
09,
700
12,5
0021
,000
187.
7018
2.9
185.
818
6.9
189.
40.
6701
0920
00M
errim
ack
Riv
er n
ear G
offs
Fal
ls,
belo
w M
anch
este
ra59
,700
44,0
0056
,000
69,0
0012
7,00
012
6.06
122.
112
6.0
128.
014
0.0
0.69
0109
4000
Souh
egan
Riv
er a
t Mer
rimac
k10
,500
6,92
011
,900
12,5
0022
,000
173.
2917
1.1
174.
217
4.7
179.
00.
70U
ngag
ed
loca
tion
Souh
egan
Riv
er a
t Wilt
on R
oad
brid
ge
in M
ilfor
da6,
950
3,74
06,
360
7,55
011
,000
297.
8829
7.2
299.
530
0.2
302.
80.
68
0109
6581
7B
eave
r Bro
ok a
t For
dway
Ext
ensi
on
at D
erry
1,10
075
01,
520
1,86
03,
300
na23
9.5
240.
624
1.0
242.
60.
69
0109
6584
4B
eave
r Bro
ok a
t Sou
th R
oad,
nea
r Der
rya
1,47
086
01,
760
2,16
03,
600
219.
4521
7.5
218.
821
9.2
220.
40.
6901
0965
852
Bea
ver B
rook
at N
orth
Pel
ham
a1,
900
1,45
02,
470
3,07
04,
750
162.
7816
1.3
162.
916
3.5
165.
30.
7101
1005
61Sp
icke
t Riv
er n
ear M
ethu
en, M
ass.
1,13
090
01,
600
1,90
02,
900
109.
9110
9.0
111.
311
1.6
114.
30.
7701
1385
00C
onne
ctic
ut R
iver
at W
ells
Riv
er, V
t.27
,300
nana
80,3
00na
409.
00na
na42
0.0
na0.
3801
1445
00C
onne
ctic
ut R
iver
at W
est L
eban
on38
,800
72,0
0010
8,00
012
5,00
015
7,00
033
7.93
345.
435
1.0
353.
935
8.0
0.41
0115
0500
Mas
com
a R
iver
at M
asco
maa
2,99
03,
500
5,75
07,
000
10,0
0074
9.01
748.
875
0.8
752.
875
4.0
0.30
a The
FIS
recu
rren
ce in
terv
al th
at b
rack
ets t
he o
bser
ved
peak
dis
char
ge o
f the
Apr
il 20
07 fl
ood
diffe
rs fr
om th
e FI
S re
curr
ence
inte
rval
that
bra
cket
s the
obs
erve
d pe
ak A
pril
2007
floo
d st
age
or w
ater
-su
rfac
e el
evat
ion.

Comparison of the April 2007 Flood Data to Flood-Insurance Studies 29Ta
ble
6.
High
-wat
er-m
ark
data
use
d in
the
dete
rmin
atio
n of
Apr
il 20
07 fl
ood
disc
harg
e by
indi
rect
met
hods
for f
our u
ngag
ed s
ites
in c
entra
l and
sou
ther
n N
ew H
amps
hire
.
[ft,
feet
; NAV
D 8
8, N
orth
Am
eric
an V
ertic
al D
atum
of 1
988;
NG
VD
29,
Nat
iona
l Geo
detic
Ver
tical
Dat
um o
f 192
9]
Hig
h-w
ater
-m
ark
nam
e
Elev
atio
n N
AVD
88
(ft)
Elev
atio
n N
GVD
29
(ft)
Latit
ude
(dec
imal
de
gree
)
Long
itude
(d
ecim
al
degr
ee)
Rive
r na
me
Loca
tion/
road
Tow
nM
ark
ratin
gM
ark
type
M
ark
desc
ript
ion
Ray
1018
7.9
188.
625
43.0
3811
-71.
1719
4La
mpr
eyA
band
oned
railr
oad
brid
ge b
ehin
d I.C
. Ree
d an
d So
n’s (
Eppi
ng S
treet
)R
aym
ond
Goo
dSe
ed li
neN
ail i
n 1.
5-ft-
diam
eter
pi
ne tr
eeR
ay11
187.
7918
8.51
543
.038
01-7
1.17
255
Lam
prey
Ups
tream
from
aba
ndon
ed ra
ilroa
d br
idge
be
hind
I.C
. Ree
d an
d So
n’s (
Eppi
ng S
treet
)R
aym
ond
Goo
dSe
ed li
neN
ail i
n 1.
0-ft-
diam
eter
ha
rdw
ood
Ray
1218
7.68
518
8.41
43.0
3798
-71.
1726
6La
mpr
ey30
ft u
pstre
am fr
om R
ay11
beh
ind
I.C. R
eed
and
Son’
s (Ep
ping
Stre
et)
Ray
mon
dG
ood
Seed
line
Nai
l in
2.0-
ft-di
amet
er
dead
pin
e tre
eR
ay13
186.
675
187.
443
.037
61-7
1.17
160
Lam
prey
Dow
nstre
am fr
om a
band
oned
railr
oad
brid
ge
behi
nd I.
C. R
eed
and
Son’
s (Ep
ping
Stre
et)
Ray
mon
dG
ood
Seed
line
Nai
l in
2.0-
ft-di
amet
er
pine
tree
Ray
1418
6.67
187.
395
43.0
3738
-71.
1730
9La
mpr
ey55
ft d
owns
tream
from
mon
itorin
g w
ell
behi
nd I.
C. R
eed
and
Son’
s (Ep
ping
Stre
et)
Ray
mon
dG
ood
Seed
line
Nai
l in
0.5-
ft-di
amet
er
pine
tree
Sunh
wm
3330
8.05
530
8.64
543
.202
07-7
1.38
300
Sunc
ook
100
ft do
wns
tream
and
80
ft ba
nkw
ard
at
Shor
t Fal
ls R
oad
brid
geEp
som
Goo
dSe
ed li
neN
ail i
n ba
se o
f pi
ne tr
eeSu
nhw
m34
308.
905
309.
495
43.2
0224
-71.
3823
3Su
ncoo
kTo
p do
wns
tream
cor
ner o
f old
abu
tmen
t at
Shor
t Fal
ls R
oad
brid
geEp
som
Fair
Was
h lin
eSt
ake
with
line
Sunh
wm
3530
9.22
530
9.81
543
.202
35-7
1.38
183
Sunc
ook
Top
of le
ft ba
nk a
t Sho
rt Fa
lls R
oad
brid
geEp
som
Goo
dW
eed
line
Nai
l in
pine
tree
Souh
829
4.76
295.
4442
.842
12-7
1.71
996
Souh
egan
R
iver
200
ft do
wns
tream
of W
ilton
Roa
d br
idge
Milf
ord
Fair
Was
h lin
eN
ail i
n tre
e
Souh
929
8.77
299.
4542
.840
86-7
1.72
031
Souh
egan
R
iver
100
ft up
stre
am o
f Wilt
on R
oad
brid
geM
ilfor
dG
ood
Was
h lin
eN
ail i
n tre
e
Souh
1029
6.07
529
6.75
542
.841
85-7
1.72
022
Souh
egan
R
iver
20 ft
dow
nstre
am fr
om m
ill a
nd 1
50 ft
do
wns
tream
from
Wilt
on R
oad
brid
geM
ilfor
dFa
irSa
sh li
neN
ail i
n tre
e
Sunc
ookW
MB
139
4.44
539
5.00
543
.278
38-7
1.34
515
Sunc
ook
100
ft up
stre
am fr
om W
ebst
ers M
ill b
ridge
on
left
bank
Pitts
field
Poor
Sash
line
Stak
e w
ith m
ark
Sunc
ookW
MB
238
9.04
538
9.60
543
.278
88-7
1.34
735
Sunc
ook
300
ft do
wns
tream
from
brid
ge o
n rig
ht b
ank
and
15 ft
stre
amw
ard
from
mai
lbox
#18
6Pi
ttsfie
ldPo
orSa
sh li
neSt
ake
with
mar
k
Sunc
ookW
MB
339
5.29
539
5.85
543
.279
16-7
1.34
491
Sunc
ook
300
ft up
stre
am fr
om la
st h
ouse
on
upst
ream
rig
ht b
ank
and
400
ft up
stre
am fr
om b
ridge
on
righ
t ban
k
Pitts
field
Poor
Sash
line
Stak
e w
ith m
ark
Sunc
ookW
MB
439
5.49
396.
0543
.278
90-7
1.34
451
Sunc
ook
600
ft up
stre
am fr
om b
ridge
on
right
ban
kPi
ttsfie
ldFa
irD
ebris
line
Nai
l in
base
of 1
.0-f
t-di
amet
er m
aple
tree
Sunc
ookW
MB
638
3.36
538
3.92
543
.277
73-7
1.34
895
Sunc
ook
Left
edge
of w
ater
at W
ebst
ers M
illPi
ttsfie
ldFa
irSe
ed li
neN
ail i
n ba
se o
f sp
ruce
tree

30 Flood of April 2007 in New Hampshire
Summary
During April 16–18, 2007, central and southern New Hampshire experienced severe flooding caused by as much as 7 in. of rainfall in the region. A Presidential Disaster Declaration was issued on April 27, 2007, for five counties (Grafton, Hillsborough, Merrimack, Rockingham, and Strafford) in New Hampshire. On May 10, 2007, a sixth county (Belknap) was added to the disaster declaration. The U.S. Geological Survey, in a cooperative investigation with the Federal Emergency Management Agency (FEMA), measured or computed flood data at 57 streamgages and 4 ungaged sites in and adjacent to the counties declared disaster areas. These data include peak stages, peak discharges, and recurrence-interval estimates for the April 2007 flooding, and data compiled from FEMA Flood-Insurance Studies for comparison purposes.
The total precipitation that occurred during April 15–19, 2007, in southeastern New Hampshire (6.54 in. in Durham) is approximately one-half of the 13 in. of precipitation that fell during October 20–22, 1996, in the same area (National Oceanic and Atmospheric Administration, 1996). The total April 15–19, 2007, precipitation in southeastern New Hampshire is less than one-half of the up to 14 in. of precipi-tation that fell during May 11–15, 2006, across the coastal regions of New Hampshire (National Oceanic and Atmo-spheric Administration, 2006a) and approximately 60 percent of the up to 11 in. of precipitation that fell during May 11–15, 2006, in the south-central part of the state (National Oceanic and Atmospheric Administration, 2006b). Although the April 2007 storm produced less precipitation than either the October 1996 or May 2006 storm events, some streams in New Hampshire had higher discharges in the 2007 event. The higher than normal precipitation from the April 2007 storm, including precipitation on top of snowpack at higher eleva-tions, downed trees, and wood debris in some rivers contrib-uted to the high flows and flooding in southern and central New Hampshire. In addition, an abnormally high spring tide along with a storm surge of nearly 3 ft caused tidal flooding along portions of the seacoast (National Oceanic and Atmo-spheric Administration, 2007b), and the prolonged period of strong northeast winds caused a prolonged storm surge along the coastline (National Climate Data Center, 2007).
At 5 long-term (more than 10 years of record) stream-gage sites, the peak discharge in April 2007 was the maximum discharge for the period of record. These streamgages include South Branch Piscataquog River near Goffstown (1941–78), Contoocook River at Peterborough, 1946–present (2008); Oyster River near Durham, 1934–present (2008); Cocheco River near Rochester, 1995–present (2008); and Salmon Falls River at Milton, 1968–present (2008).
Peak discharges equaled or exceeded a 100-year recur-rence interval at 10 streamgages and equaled or exceeded a 50-year recurrence interval at 16 streamgages. The most
severe flooding was in Rockingham, Strafford, Merrimack, and Hillsborough Counties.
Peak-flood discharge and stage data from the April 2007 flood event at streamgage and indirect-discharge sites were compared to recurrence-interval discharges and peak water-surface elevations (stage) determined by Flood-Insurance Studies, where available. Flood-Insurance Study recurrence-interval discharges were obtained from the “Summary of Discharges” table for the reach that incorporated the streamgage site, and the peak water-surface elevations were extracted from the water-surface-elevation profiles. In cases where the streamgage site was not identified on the water-surface-elevation profiles, interpretation of the streamgage location was required to obtain the water-surface-elevation for the corresponding recurrence interval.
Selected References
Benson, M.A., and Dalrymple, Tate, 1967, General field and office procedures for indirect discharge measurements: U.S. Geological Survey Techniques of Water-Resources Investigations, book 3, chap. A1, 30 p.
Federal Emergency Management Agency, 1977, Flood- insurance study, Town of Henniker, Merrimack County, New Hampshire: Washington, D.C., 15 p.
Federal Emergency Management Agency, 1978a, Flood- insurance study, Town of Chichester, Merrimack County, New Hampshire: Washington, D.C., 15 p.
Federal Emergency Management Agency, 1978b, Flood- insurance study, Town of Goffstown, Hillsborough County, New Hampshire: Washington, D.C., 18 p.
Federal Emergency Management Agency, 1978c, Flood- insurance study, Town of Hillsborough, Hillsborough County, New Hampshire: Washington, D.C., 20 p.
Federal Emergency Management Agency, 1979a, Flood- insurance study, City of Franklin, Merrimack County, New Hampshire: Washington, D.C., 20 p.
Federal Emergency Management Agency, 1979b, Flood- insurance study, Town of Merrimack, Hillsborough County, New Hampshire: Washington, D.C., 27 p.
Federal Emergency Management Agency, 1979c, Flood- insurance study, Town of Pelham, Hillsborough County, New Hampshire: Washington, D.C., 22 p.
Federal Emergency Management Agency, 1979d, Flood- insurance study, Town of Peterborough, Hillsborough County, New Hampshire: Washington, D.C., 21 p.

Selected References 31
Federal Emergency Management Agency, 1979e, Flood- insurance study, Town of Milford, Hillsborough County, New Hampshire: Washington, D.C., 22 p.
Federal Emergency Management Agency, 1980a, Flood- insurance study, City of Laconia, Belknap County, New Hampshire: Washington, D.C., 24 p.
Federal Emergency Management Agency, 1980b, Flood- insurance study, City of Manchester, Hillsborough County, New Hampshire: Washington, D.C., 24 p.
Federal Emergency Management Agency, 1987, Flood- insurance study, Town of Warner, Merrimack County, New Hampshire: Washington, D.C., 18 p.
Federal Emergency Management Agency, 1988, Flood- insurance study, Town of Hopkinton, Merrimack County, New Hampshire: Washington, D.C., 16 p.
Federal Emergency Management Agency, 1991, Flood- insurance study, Town of Tamworth, Carroll County, New Hampshire: Washington, D.C., 12 p.
Federal Emergency Management Agency, 1993a, Flood- insurance study, Town of Weare, Hillsborough County, New Hampshire: Washington, D.C., 16 p.
Federal Emergency Management Agency, 1993b, Flood- insurance study, Town of Webster, Merrimack County, New Hampshire: Washington, D.C., 10 p.
Federal Emergency Management Agency, 1997, Flood- insurance study, Town of Tilton, Belknap County, New Hampshire: Washington, D.C., 20 p.
Federal Emergency Management Agency, 1999, Flood- insurance study, City of Concord, Merrimack County, New Hampshire: Washington, D.C., 20 p.
Federal Emergency Management Agency, 2001, Flood- insurance study, Town of New Boston, Hillsborough County, New Hampshire: Washington, D.C., 18 p.
Federal Emergency Management Agency, 2002, Flood- insurance study, Town of Conway, Carroll County, New Hampshire: Washington, D.C., 21 p.
Federal Emergency Management Agency, 2005a, Flood- Insurance Study, Rockingham County, New Hampshire, all jurisdictions: Washington, D.C., 87 p.
Federal Emergency Management Agency, 2005b, Flood- insurance study, Strafford County, New Hampshire, all jurisdictions: Washington, D.C., 41 p.
Federal Emergency Management Agency, 2007, Initial notices and amendments, New Hampshire severe storms and flood-ing: Initial Notice and Amendments No. 1 and 2, accessed December 27, 2007, at http://www.fema.gov/news/eventd-frns.fema?id=7906
Federal Emergency Management Agency, 2008, Flood- insurance study, Grafton County, New Hampshire, all jurisdictions: Washington, D.C., 79 p.
LeBlanc, D.R., 1978, Progress report on hydrologic inves-tigations of small drainage areas in New Hampshire—Preliminary relations for estimating peak discharge on rural, unregulated streams: U.S. Geological Survey Water-Resources Investigations Report 78–47, 9 p.
Leica Geosystems, 2008, Leica GPS1200, GPS1200 survey-ing systems, accessed November 9, 2007, at http://www.leica-geosystems.com/corporate/en/products/total_stations/lgs_4521.htm
Matthai, H.F., 1967, Measurement of peak discharge at width contractions by indirect methods: Techniques of Water-Resources Investigations, book 3, chap. A4, 44 p.
National Climate Data Center, 2007, Storm events data base, accessed December 27, 2007, at http://www4.ncdc.noaa.gov/cgi-win/wwcgi.dll?wwEvent~Storms
National Climate Data Center, 2008, Normal precipitation, inches, accessed February 19, 2008, at http://www.ncdc.noaa.gov/oa/climate/online/ccd/nrmpcp.txt
National Oceanic and Atmospheric Administration, 1996, Climatological data—New England, October 1996: Clima-tological Data, v. 108, no. 10, 46 p.
National Oceanic and Atmospheric Administration, 2006a, Record of climatological observations (COOP), accessed November 17, 2006, at http://www7.ncdc.noaa.gov/IPS/coopgetpublications.html
National Oceanic and Atmospheric Administration, 2006b, Public information statement, accessed November 17, 2006, at http://www.ncdc.noaa.gov/oa/climate/research/2006/may/boxpns.txt
National Oceanic and Atmospheric Administration, 2007a, Record of climatological observations (COOP), accessed December 27, 2007, at http://www1.ncdc.noaa.gov/pub/orders/7A7D76FF-CE3F-4DDD-0A85-6A86CFEDA9E8.PDF
National Oceanic and Atmospheric Administration, 2007b, Public information statement, accessed Decem-ber 27, 2007, at http://www.srh.noaa.gov/productview.php?pil=CLMCON&version=7&max=61
Northeast River Forecast Center, 2007a, 1-day observed precipitation—Valid April 16–18, 2006, 1200 UTC, accessed December 27, 2007, at http://www.erh.noaa.gov/nerfc/obsprecip.shtml

32 Flood of April 2007 in New Hampshire
Northeast River Forecast Center, 2007b, New Hampshire: April 2007 monthly observed precipitation, accessed December 27, 2007, at http://www.srh.noaa.gov/rfcshare/precip_analysis_new.php?location=tar&overlay=1100101
Olson, S.A., 2007, Flood of May 2006 in New Hampshire: U.S. Geological Survey Open-File Report 2007–1122, 32 p.
U.S. Army Corps of Engineers, May 2005, HEC-RAS river analysis system, Version 3.1.3: Hydrologic Engineering Center, accessed September 2, 2007, at http://www.hec.usace.army.mil
U.S. Army Corps of Engineers, 2007, New England District Corp of Engineers reservoir regulation team, accessed September 8, 2007, at https://rsgis.crrel.usace.army.mil/nae/pls/nae/nae_web.nae_webmenu.displaymenu?menu=hydro
U.S. Geological Survey, 2007a, Water resources application software, PeakFQ, accessed October 12, 2007, at http://water.usgs.gov/software/peakfq.html
U.S. Geological Survey, 2007b, Peak streamflow for New Hampshire: National Water Information System, accessed October 12, 2007, at http://nwis.waterdata.usgs.gov/nh/nwis/peak
U.S. Interagency Advisory Committee on Water Data, 1982, Guidelines for determining flood flow frequency, Bulletin 17-B of the Hydrology Subcommittee: Reston, Va., U.S. Geological Survey, Office of Water Data Coordi-nation, 183 p.

Table 1 33Ta
ble
1.
Desc
riptio
n of
stre
amga
ges
used
in th
e Ap
ril 2
007
flood
inve
stig
atio
n, c
entra
l and
sou
ther
n N
ew H
amps
hire
.—Co
ntin
ued
[Loc
atio
n of
stre
amga
ges i
n fig
ure
4. U
SGS,
U.S
. Geo
logi
cal S
urve
y; S
R, S
tate
Rou
te, m
i2 , sq
uare
mile
s; la
t, la
titud
e; lo
ng, l
ongi
tude
; NH
DES
, New
Ham
pshi
re D
epar
tmen
t of E
nviro
nmen
tal S
ervi
ces;
ft,
feet
; USA
CE,
U.S
. Arm
y C
orps
of E
ngin
eers
]
USG
S st
ream
-ga
ge
num
ber
Stre
amga
ge n
ame
Stat
usO
pera
tor
Dra
inag
e ar
ea
(mi2 )
Stre
amga
ge lo
catio
n
0106
4500
Saco
Riv
er n
ear C
onw
ayA
ctiv
eU
SGS
385
Lat 4
3°59
'27"
, lon
g 71
°05'
29",
Car
roll
Cou
nty,
on
left
bank
, at O
dell
Falls
, 0.4
mi u
pstre
am fr
om
US
302,
1.5
mi n
orth
east
of t
he in
ters
ectio
n of
SR
16
and
113
in C
onw
ay, a
nd 1
.8 m
i dow
nstre
am
from
mou
th o
f Sw
ift R
iver
.01
0648
01B
earc
amp
Riv
er a
t So
uth
Tam
wor
thA
ctiv
eU
SGS
67.6
Lat 4
3°49
'48"
, lon
g 71
°17'
18",
Car
roll
Cou
nty,
on
right
ban
k, a
t dow
nstre
am si
de o
f aba
ndon
ed st
one
abut
men
ts, 0
.7 m
i ups
tream
from
San
ger B
rook
, 0.8
mi e
ast o
f Bem
is M
ount
ain
Roa
d an
d SR
25
in
ters
ectio
n at
Sou
th T
amw
orth
, 1.0
mi d
owns
tream
from
Col
d B
rook
, and
1.1
mi w
est o
f SR
25
and
SR
113
inte
rsec
tion
at W
hitti
er.
0106
5000
Oss
ipee
Riv
er a
t Ef
fingh
am F
alls
Act
ive
NH
DES
a33
0La
t 43°
47'4
2", l
ong
71°0
3'35
", C
arro
ll C
ount
y, o
n le
ft ba
nk, 8
50 ft
ups
tream
from
SR
153
brid
ge,
1,40
0 ft
dow
nstre
am fr
om d
am a
t out
let o
f Oss
ipee
Lak
e, a
nd 0
.2 m
i wes
t of t
he in
ters
ectio
n of
SR
153
and
25
at E
ffing
ham
Fal
ls.
0107
2100
Salm
on F
alls
Riv
er a
t M
ilton
Act
ive
NH
DES
a10
8La
t 43°
24'4
8", l
ong
70°5
9'15
", S
traffo
rd C
ount
y, o
n rig
ht b
ank,
just
dow
nstre
am fr
om M
ilton
Pon
d D
am a
nd 3
00 ft
sout
heas
t of S
R 1
25 a
nd P
rosp
ect H
ill R
oad
inte
rsec
tion
in M
ilton
.01
0728
00C
oche
co R
iver
nea
r R
oche
ster
Act
ive
USG
S85
.7La
t 43°
16'0
6", l
ong
70°5
8'27
", S
traffo
rd C
ount
y, o
n rig
ht b
ank,
dire
ctly
beh
ind
Roc
hest
er C
ount
ry
Clu
b, 2
,200
ft u
pstre
am fr
om tr
eatm
ent l
agoo
ns, a
nd 0
.5 m
i sou
thea
st o
f Mai
n St
reet
and
Chu
rch
Stre
et in
ters
ectio
n in
Gon
ic.
0107
2870
Isin
glas
s Riv
er a
t Roc
hest
er
Nec
k R
oad,
nea
r Dov
erA
ctiv
eU
SGS
73.6
Lat 4
3°14
'05"
, lon
g 70
°57'
25",
Stra
fford
Cou
nty,
600
ft u
pstre
am fr
om R
oche
ster
Nec
k R
oad
brid
ge,
and
0.7
mi u
pstre
am fr
om m
outh
on
Coc
heco
Riv
er.
0107
3000
Oys
ter R
iver
nea
r Dur
ham
Act
ive
USG
S12
.1La
t 43°
08'5
5", l
ong
70°5
7'56
", S
traffo
rd C
ount
y, o
n le
ft ba
nk, 5
0 ft
upst
ream
from
Old
Con
cord
Roa
d br
idge
, and
0.6
mi e
ast o
f US
4 an
d SR
155
inte
rsec
tion.
0107
3500
Lam
prey
Riv
er n
ear
New
mar
ket
Act
ive
USG
S18
3La
t 43°
06'0
9", l
ong
70°5
7'11
", S
traffo
rd C
ount
y, o
n rig
ht b
ank,
200
ft u
pstre
am fr
om P
acke
rs F
alls
and
Pa
cker
s Fal
ls R
oad
brid
ge.
0107
3587
Exet
er R
iver
at H
aigh
R
oad,
nea
r Bre
ntw
ood
Act
ive
USG
S63
.5La
t 42°
59'0
4", l
ong
71°0
2'20
", R
ocki
ngha
m C
ount
y, o
n rig
ht b
ank,
10
ft do
wns
tream
from
Hai
gh
Roa
d br
idge
.01
0736
00D
udle
y B
rook
nea
r Exe
ter
Dis
con-
tinue
dU
SGS
4.97
Lat 4
2°59
'35"
, lon
g 71
°01'
20",
Roc
king
ham
Cou
nty,
on
right
ban
k, u
pstre
am si
de o
f bre
ache
d da
m,
100
ft up
stre
am fr
om S
R 1
11A
cul
vert,
and
180
ft w
est o
f SR
111
A a
nd D
eer H
ill R
oad
inte
rsec
tion.
0107
3750
Mill
Bro
ok n
ear S
R 1
08,
at S
trath
amD
isco
n-tin
ued
USG
S2.
3La
t 43°
01'2
4", l
ong
70°5
5'04
", R
ocki
ngha
m C
ount
y, o
n rig
ht b
ank,
at m
ost d
owns
tream
cul
vert
of th
e St
rath
am tr
affic
circ
le a
t the
inte
rsec
tion
of S
R 1
08 a
nd 3
3 in
Stra
tham
.01
0737
85W
inni
cut R
iver
at G
reen
-la
nd, n
ear P
orts
mou
thA
ctiv
eU
SGS
14.1
Lat 4
3°02
'12"
, lon
g 70
°50'
55",
Roc
king
ham
Cou
nty,
on
left
bank
, 20
ft up
stre
am fr
om S
tate
Fis
h an
d G
ame
Dep
artm
ent D
am, 1
50 ft
dow
nstre
am fr
om S
R 3
3 br
idge
, and
1.1
mi w
est o
f the
inte
rsec
tion
of S
R 3
3 an
d 15
1 in
Gre
enla
nd.
0107
3810
Ber
rys B
rook
at S
agam
ore
Roa
d, n
ear P
orts
mou
thD
isco
n-tin
ued
USG
S5.
38La
t 43°
02'1
0", l
ong
70°4
4'59
", R
ocki
ngha
m C
ount
y, o
n rig
ht b
ank,
at u
pstre
am si
de o
f Sag
amor
e R
oad,
an
d 0.
7 m
i sou
th o
f SR
1A
and
Sag
amor
e R
oad
inte
rsec
tion
at F
oyer
s Cor
ner i
n Ry
e.01
0738
38Ta
ylor
Riv
er a
t Old
Sta
ge
Roa
d ne
ar H
ampt
onD
isco
n-tin
ued
USG
S8.
41La
t 42°
56'3
3", l
ong
70°5
2'40
", R
ocki
ngha
m C
ount
y, o
n le
ft ba
nk, a
t ups
tream
side
of d
am, 1
00 ft
up
stre
am fr
om O
ld S
tage
Roa
d br
idge
, and
650
ft so
uthw
est o
f Old
Sta
ge R
oad
and
Tim
ber S
wam
p R
oad
inte
rsec
tion
at C
offin
s Mill
in H
ampt
on.

34 Flood of April 2007 in New HampshireTa
ble
1.
Desc
riptio
n of
stre
amga
ges
used
in th
e Ap
ril 2
007
flood
inve
stig
atio
n, c
entra
l and
sou
ther
n N
ew H
amps
hire
.—Co
ntin
ued
[Loc
atio
n of
stre
amga
ges i
n fig
ure
4. U
SGS,
U.S
. Geo
logi
cal S
urve
y; S
R, S
tate
Rou
te, m
i2 , sq
uare
mile
s; la
t, la
titud
e; lo
ng, l
ongi
tude
; NH
DES
, New
Ham
pshi
re D
epar
tmen
t of E
nviro
nmen
tal S
ervi
ces;
ft,
feet
; USA
CE,
U.S
. Arm
y C
orps
of E
ngin
eers
]
USG
S st
ream
-ga
ge
num
ber
Stre
amga
ge n
ame
Stat
usO
pera
tor
Dra
inag
e ar
ea
(mi2 )
Stre
amga
ge lo
catio
n
0107
4520
East
Bra
nch
Pem
igew
asse
t R
iver
at L
inco
lnA
ctiv
eU
SGS
115
Lat 4
4°02
'51"
, lon
g 71
°39'
37",
Gra
fton
Cou
nty,
on
right
ban
k, a
t ups
tream
side
of O
ld C
rib D
am,
loca
lly k
now
n as
“th
e ol
d ho
le,”
800
ft u
pstre
am fr
om C
oope
r Mem
oria
l Driv
e br
idge
, 1,9
00 ft
do
wns
tream
from
Pol
lard
Bro
ok, 1
.8 m
i abo
ve m
outh
, and
0.8
mi e
ast o
f Con
nect
or R
oad
and
SR
112
inte
rsec
tion
in L
inco
ln.
0107
5000
Pem
igew
asse
t Riv
er a
t W
oods
tock
Act
ive
USG
S19
3La
t 43°
58'3
4", l
ong
71°4
0'48
", G
rafto
n C
ount
y, o
n rig
ht b
ank
at d
owns
tream
side
of a
band
oned
brid
ge
abut
men
ts, i
mm
edia
tely
eas
t of W
oods
tock
Fire
Sta
tion,
300
ft u
pstre
am fr
om so
uthe
rnm
ost S
R 1
75
brid
ge, a
nd 3
00 ft
eas
t of N
orth
Sta
tion
Roa
d an
d SR
175
inte
rsec
tion
in W
oods
tock
.01
0760
00B
aker
Riv
er n
ear R
umne
yA
ctiv
eU
SGS
143
Lat 4
3°47
'44"
, lon
g 71
°50'
45",
Gra
fton
Cou
nty,
on
right
ban
k, 2
00 ft
ups
tream
from
smal
l rig
ht b
ank
tribu
tary
, 1,9
00 ft
ups
tream
from
mou
th o
f Hal
ls B
rook
, 1,4
00 ft
wes
t of H
alls
Bro
ok R
oad
and
SR
25
inte
rsec
tion,
and
1.7
mi s
outh
east
of S
and
Hill
Roa
d an
d SR
25
inte
rsec
tion
in W
est R
umne
y.01
0765
00Pe
mig
ewas
set R
iver
at
Plym
outh
Act
ive
USG
S62
2La
t 43°
45'3
3", l
ong
71°4
1'10
", G
rafto
n C
ount
y, o
n rig
ht b
ank,
150
ft d
owns
tream
from
Hol
dern
ess
Roa
d br
idge
in P
lym
outh
, 1,7
00 ft
dow
nstre
am fr
om B
aker
Riv
er, a
nd 0
.8 m
i sou
th o
f SR
3A
and
U
S 3
inte
rsec
tion.
0107
7000
Squa
m R
iver
at A
shla
ndA
ctiv
eN
HD
ESa
57.6
Lat 4
3°42
'19"
, lon
g 71
°37'
49",
Gra
fton
Cou
nty,
on
right
ban
k, 2
50 ft
dow
nstre
am fr
om th
e Li
ttle
Squa
m L
ake
Dam
, 300
ft u
pstre
am fr
om R
iver
Stre
et b
ridge
, and
300
ft n
orth
of R
iver
Stre
et a
nd
US
3 in
ters
ectio
n.01
0775
10N
ewfo
und
Riv
er b
elow
N
ewfo
und
Lake
nea
r B
risto
l
Act
ive
NH
DES
98La
t 43°
37'0
2", l
ong
71°4
4'28
", G
rafto
n C
ount
y, a
t out
let o
f New
foun
d La
ke, 7
5 ft
dow
nstre
am fr
om
New
foun
d La
ke D
am, 5
00 ft
dow
nstre
am fr
om W
est S
hore
Roa
d, a
nd 8
00 ft
wes
t of W
est S
hore
R
oad
and
SR 3
A in
ters
ectio
n in
Bris
tol.
0107
8000
Smith
Riv
er n
ear B
risto
lA
ctiv
eU
SGS
85.8
Lat 4
3°33
'59"
, lon
g 71
°44'
54",
Mer
rimac
k C
ount
y, o
n rig
ht b
ank,
2,2
00 ft
nor
th o
f Bor
ough
Roa
d an
d A
xtel
l Roa
d in
ters
ectio
n, a
nd 4
,700
ft u
pstre
am fr
om B
orou
gh R
oad
brid
ge in
Bris
tol.
0107
9602
Poor
farm
Bro
ok n
ear
Gilf
ord
Dis
con-
tinue
dU
SGS
6.38
Lat 4
3°34
'22"
, lon
g 71
°21'
20",
Bel
knap
Cou
nty,
on
right
ban
k, a
t dow
nstre
am si
de o
f Sce
nic
Driv
e br
idge
, 250
ft d
owns
tream
from
SR
11,
500
ft w
est o
f Sce
nic
Driv
e an
d SR
11
inte
rsec
tion,
950
ft
upst
ream
from
mou
th o
n La
ke W
inni
pesa
ukee
.01
0799
00Sh
anno
n B
rook
nea
r M
oulto
nbor
ough
Dis
con-
tinue
dU
SGS
6.99
Lat 4
3°43
'49"
, lon
g 71
°21'
28",
Car
roll
Cou
nty,
on
left
bank
, im
med
iate
ly u
pstre
am fr
om S
R 1
09 b
ridge
(g
age
hous
e is
20
ft do
wns
tream
from
brid
ge),
3,80
0 ft
sout
h of
the
inte
rsec
tion
of S
R 1
09 a
nd 1
71 in
M
oulto
nbor
ough
, and
1.4
mi u
pstre
am fr
om m
outh
on
Lake
Win
nipe
sauk
ee.
0108
0000
Lake
Win
nipe
sauk
ee a
t W
eirs
Bea
chA
ctiv
eN
HD
ESa
363
Lat 4
3°36
'27"
, lon
g 71
°27'
34",
Bel
knap
Cou
nty,
600
ft e
ast o
f Wei
rs B
each
Pos
t Offi
ce, a
nd 0
.3 m
i no
rthw
est o
f US
3 br
idge
acr
oss P
augu
s Bay
at W
eirs
Bea
ch.
0108
0500
Lake
Win
nipe
sauk
ee O
utle
t at
Lak
epor
tA
ctiv
eN
HD
ESa
363
Lat 4
3°32
'57"
, lon
g 71
°27'
54",
Bel
knap
Cou
nty,
100
ft u
pstre
am fr
om E
lm S
treet
brid
ge a
cros
s Pau
gus
Bay
, 150
ft u
pstre
am fr
om d
am a
cros
s Pau
gus B
ay, a
nd 0
.2 m
i nor
thw
est o
f Elm
Stre
et a
nd U
nion
Av
enue
inte
rsec
tion
in L
akep
ort.
0108
1000
Win
nipe
sauk
ee R
iver
at
Tilto
nA
ctiv
eU
SGS
471
Lat 4
3°26
'30"
, lon
g 71
°35'
17",
Bel
knap
Cou
nty,
on
right
ban
k, 1
50 ft
ups
tream
from
Brid
ge/S
choo
l St
reet
brid
ge, 3
00 ft
sout
h of
Tow
n H
all i
n Ti
lton,
and
0.3
mi s
outh
east
of U
S 3
and
SR 1
32 in
ters
ec-
tion
in T
ilton
.

Table 1 35Ta
ble
1.
Desc
riptio
n of
stre
amga
ges
used
in th
e Ap
ril 2
007
flood
inve
stig
atio
n, c
entra
l and
sou
ther
n N
ew H
amps
hire
.—Co
ntin
ued
[Loc
atio
n of
stre
amga
ges i
n fig
ure
4. U
SGS,
U.S
. Geo
logi
cal S
urve
y; S
R, S
tate
Rou
te, m
i2 , sq
uare
mile
s; la
t, la
titud
e; lo
ng, l
ongi
tude
; NH
DES
, New
Ham
pshi
re D
epar
tmen
t of E
nviro
nmen
tal S
ervi
ces;
ft,
feet
; USA
CE,
U.S
. Arm
y C
orps
of E
ngin
eers
]
USG
S st
ream
-ga
ge
num
ber
Stre
amga
ge n
ame
Stat
usO
pera
tor
Dra
inag
e ar
ea
(mi2 )
Stre
amga
ge lo
catio
n
0108
1500
Mer
rimac
k R
iver
at
Fran
klin
Junc
tion
Act
ive
USG
S1,
507
Lat 4
3°25
'22"
, lon
g 71
°39'
12",
Mer
rimac
k C
ount
y, o
n rig
ht b
ank,
at F
rank
lin Ju
nctio
n, 4
,000
ft so
uth
of
SR 1
27 a
nd U
S 3
inte
rsec
tion,
5,3
00 ft
dow
nstre
am fr
om c
onflu
ence
of P
emig
ewas
set a
nd W
inni
pe-
sauk
ee R
iver
s, an
d 1.
5 m
i sou
th o
f US
3 an
d C
hurc
h St
reet
inte
rsec
tion
in F
rank
lin.
0108
2000
Con
tooc
ook
Riv
er a
t Pe
terb
orou
ghA
ctiv
eU
SGS
68.1
Lat 4
2°51
'45"
, lon
g 71
°57'
35",
Hill
sbor
ough
Cou
nty,
on
left
bank
, 750
ft u
pstre
am fr
om M
orris
on R
oad
brid
ge, 1
,300
ft d
owns
tream
from
mill
dam
in N
oone
, and
0.6
mi s
outh
wes
t of U
S 20
2 an
d SR
101
in
ters
ectio
n in
Pet
erbo
roug
h.01
0830
00N
uban
usit
Bro
ok b
elow
M
acD
owel
l Dam
nea
r Pe
terb
orou
gh
Act
ive
USG
S44
Lat 4
2°53
'34"
, lon
g 71
°59'
14",
Hill
sbor
ough
Cou
nty,
on
left
bank
, 300
ft d
owns
tream
from
Edw
ard
Mac
Dow
ell D
am, 6
00 ft
ups
tream
from
aba
ndon
ed m
ill d
am, a
nd 0
.4 m
i nor
th o
f Wild
er S
treet
and
U
nion
Stre
et in
Wes
t Pet
erbo
roug
h.01
0845
00B
eard
s Bro
ok n
ear
Hill
sbor
ough
Dis
con-
tinue
dU
SGS
55.4
Lat 4
3°06
'51"
, lon
g 71
°55'
36",
Hill
sbor
ough
Cou
nty,
on
right
ban
k, 3
00 ft
ups
tream
from
Wes
t Mai
n St
reet
brid
ge, 5
60 ft
ups
tream
from
mou
th o
n N
orth
Bra
nch,
and
1,8
00 ft
wes
t of U
S 20
2 an
d W
est
Mai
n St
reet
inte
rsec
tion
in H
illsb
orou
gh.
0108
5000
Con
tooc
ook
Riv
er n
ear
Hen
nike
rA
ctiv
eU
SGS
368
Lat 4
3°09
'07"
, lon
g 71
°51'
28",
Mer
rimac
k C
ount
y, o
n rig
ht b
ank,
900
ft w
est o
f Wes
tern
Ave
nue
and
Cot
e H
ill R
oad
inte
rsec
tion,
1.6
mi d
owns
tream
from
San
d B
rook
, and
1.7
mi u
pstre
am fr
om W
est-
ern
Aven
ue b
ridge
in H
enni
ker.
0108
5500
Con
tooc
ook
Riv
er b
elow
H
opki
nton
Dam
at
Wes
t Hop
kint
on
Act
ive
USG
S42
7La
t 43°
11'3
3", l
ong
71°4
4'43
", M
errim
ack
Cou
nty,
on
right
ban
k 75
0 ft
dow
nstre
am fr
om c
over
ed
brid
ge a
t Wes
t Hop
kint
on, 2
,200
ft d
owns
tream
from
Hop
kint
on D
am, a
nd 1
.2 m
i nor
th o
f the
inte
r-se
ctio
n of
SR
127
and
9 in
Hop
kint
on.
0108
6000
War
ner R
iver
at D
avis
ville
Act
ive
USG
S14
6La
t 43°
15'0
3", l
ong
71°4
3'58
", M
errim
ack
Cou
nty,
on
left
bank
, 60
ft do
wns
tream
from
SR
127
brid
ge
at D
avis
ville
, and
0.9
mi e
ast o
f I-8
9 an
d SR
103
inte
rcha
nge
in W
arne
r.01
0870
00B
lack
wat
er R
iver
nea
r W
ebst
erA
ctiv
eU
SGS
129
Lat 4
3°17
'49"
, lon
g 71
°41'
42",
Mer
rimac
k C
ount
y, o
n le
ft ba
nk, 1
,200
ft w
est o
f Clo
thes
pin
Brid
ge
Roa
d an
d Pl
easa
nt S
treet
inte
rsec
tion
at D
ingi
t Cor
ner,
2,30
0 ft
dow
nstre
am fr
om C
loth
espi
n B
ridge
R
oad
brid
ge, a
nd 2
.4 m
i dow
nstre
am fr
om B
lack
wat
er D
am.
0108
7850
Con
tooc
ook
Riv
er a
t Riv
er
Hill
, nea
r Pen
acoo
kA
ctiv
eU
SAC
E76
0La
t 43°
14'5
9", l
ong
71°3
7'12
", M
errim
ack
Cou
nty,
at H
orse
Hill
Roa
d br
idge
, 200
ft w
est o
f Riv
er
Roa
d, H
orse
Hill
Roa
d, a
nd B
og R
oad
inte
rsec
tion
at R
iver
Hill
, and
2.4
mi s
outh
wes
t of U
S 3
and
Was
hing
ton
Stre
et in
ters
ectio
n in
Pen
acoo
k.01
0884
00M
errim
ack
Riv
er a
t C
onco
rdA
ctiv
eU
SAC
E2,
300
Lat 4
3°12
'32"
, lon
g 71
°31'
51",
Mer
rimac
k C
ount
y, a
t dow
nstre
am si
de o
f Brid
ge S
treet
(SR
9) b
ridge
ov
er th
e M
errim
ack
Riv
er, a
nd 1
,600
ft e
ast o
f Brid
ge S
treet
(SR
9) a
nd M
ain
Stre
et (U
S 3)
inte
rsec
-tio
n in
Con
cord
.01
0890
00So
ucoo
k R
iver
nea
r C
onco
rdD
isco
n-tin
ued
USG
S76
.8La
t 43°
14'1
9", l
ong
71°2
7'45
", M
errim
ack
Cou
nty,
on
left
bank
, 500
ft u
pstre
am fr
om S
R 9
brid
ge,
4,30
0 ft
upst
ream
from
Cem
eter
y B
rook
, and
0.4
mi n
orth
east
of t
he in
ters
ectio
n of
SR
106
and
9.
0108
9100
Souc
ook
Riv
er a
t Pem
brok
e R
oad,
nea
r Con
cord
Act
ive
USG
S81
.9La
t 43°
12'4
9", l
ong
71°2
8'51
", M
errim
ack
Cou
nty,
on
left
bank
, 100
ft u
pstre
am fr
om P
embr
oke
Roa
d br
idge
, 550
ft u
pstre
am fr
om F
renc
hs B
rook
, and
770
ft e
ast o
f SR
106
and
Pem
brok
e R
oad
inte
rsec
-tio
n in
Con
cord
.01
0895
00Su
ncoo
k R
iver
at
Nor
th C
hich
este
rD
isco
n-tin
uedb
USG
S15
5La
t 43°
15'2
4", l
ong
71°2
2'12
", M
errim
ack
Cou
nty,
on
left
bank
, 100
ft d
owns
tream
from
Dep
ot R
oad,
80
0 ft
east
of D
epot
Roa
d an
d SR
28
inte
rsec
tion,
and
2,0
00 ft
ups
tream
from
San
ders
Bro
ok.
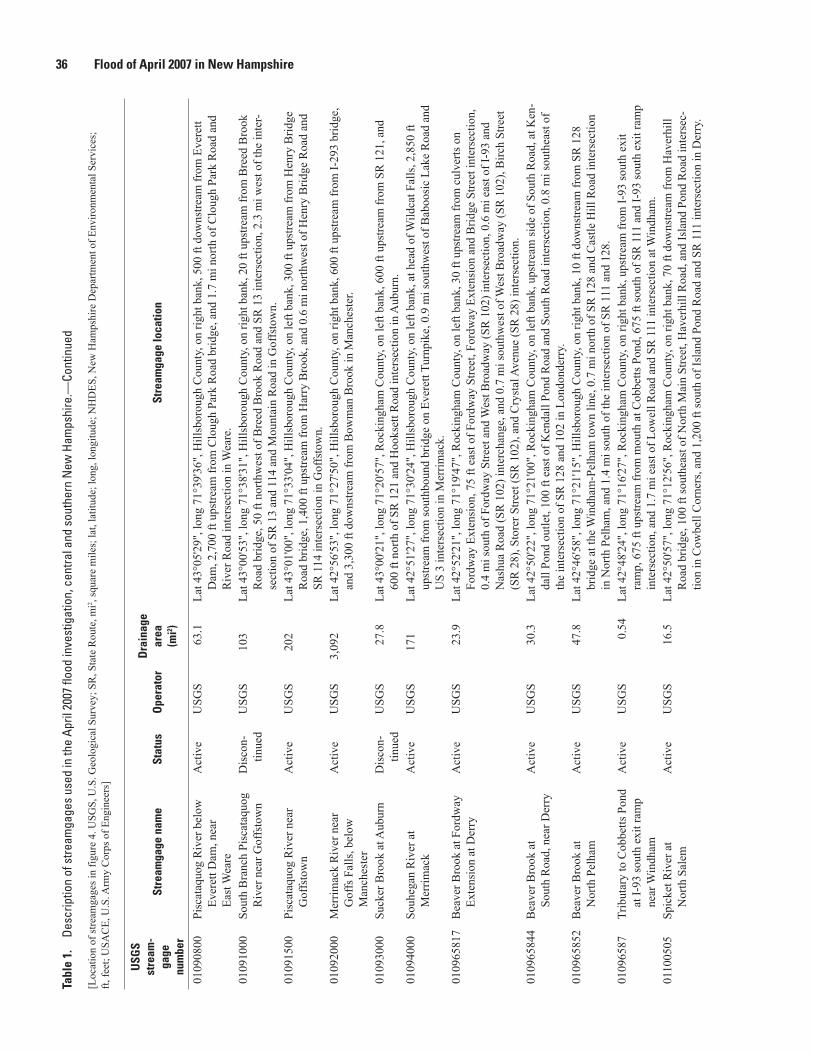
36 Flood of April 2007 in New HampshireTa
ble
1.
Desc
riptio
n of
stre
amga
ges
used
in th
e Ap
ril 2
007
flood
inve
stig
atio
n, c
entra
l and
sou
ther
n N
ew H
amps
hire
.—Co
ntin
ued
[Loc
atio
n of
stre
amga
ges i
n fig
ure
4. U
SGS,
U.S
. Geo
logi
cal S
urve
y; S
R, S
tate
Rou
te, m
i2 , sq
uare
mile
s; la
t, la
titud
e; lo
ng, l
ongi
tude
; NH
DES
, New
Ham
pshi
re D
epar
tmen
t of E
nviro
nmen
tal S
ervi
ces;
ft,
feet
; USA
CE,
U.S
. Arm
y C
orps
of E
ngin
eers
]
USG
S st
ream
-ga
ge
num
ber
Stre
amga
ge n
ame
Stat
usO
pera
tor
Dra
inag
e ar
ea
(mi2 )
Stre
amga
ge lo
catio
n
0109
0800
Pisc
ataq
uog
Riv
er b
elow
Ev
eret
t Dam
, nea
r Ea
st W
eare
Act
ive
USG
S63
.1La
t 43°
05'2
9", l
ong
71°3
9'36
", H
illsb
orou
gh C
ount
y, o
n rig
ht b
ank,
500
ft d
owns
tream
from
Eve
rett
Dam
, 2,7
00 ft
ups
tream
from
Clo
ugh
Park
Roa
d br
idge
, and
1.7
mi n
orth
of C
loug
h Pa
rk R
oad
and
Riv
er R
oad
inte
rsec
tion
in W
eare
.01
0910
00So
uth
Bra
nch
Pisc
ataq
uog
Riv
er n
ear G
offs
tow
nD
isco
n-tin
ued
USG
S10
3La
t 43°
00'5
3", l
ong
71°3
8'31
", H
illsb
orou
gh C
ount
y, o
n rig
ht b
ank,
20
ft up
stre
am fr
om B
reed
Bro
ok
Roa
d br
idge
, 50
ft no
rthw
est o
f Bre
ed B
rook
Roa
d an
d SR
13
inte
rsec
tion,
2.3
mi w
est o
f the
inte
r-se
ctio
n of
SR
13
and
114
and
Mou
ntai
n R
oad
in G
offs
tow
n.01
0915
00Pi
scat
aquo
g R
iver
nea
r G
offs
tow
nA
ctiv
eU
SGS
202
Lat 4
3°01
'00"
, lon
g 71
°33'
04",
Hill
sbor
ough
Cou
nty,
on
left
bank
, 300
ft u
pstre
am fr
om H
enry
Brid
ge
Roa
d br
idge
, 1,4
00 ft
ups
tream
from
Har
ry B
rook
, and
0.6
mi n
orth
wes
t of H
enry
Brid
ge R
oad
and
SR 1
14 in
ters
ectio
n in
Gof
fsto
wn.
0109
2000
Mer
rimac
k R
iver
nea
r G
offs
Fal
ls, b
elow
M
anch
este
r
Act
ive
USG
S3,
092
Lat 4
2°56
'53"
, lon
g 71
°27'
50",
Hill
sbor
ough
Cou
nty,
on
right
ban
k, 6
00 ft
ups
tream
from
I-29
3 br
idge
, an
d 3,
300
ft do
wns
tream
from
Bow
man
Bro
ok in
Man
ches
ter.
0109
3000
Suck
er B
rook
at A
ubur
nD
isco
n-tin
ued
USG
S27
.8La
t 43°
00'2
1", l
ong
71°2
0'57
", R
ocki
ngha
m C
ount
y, o
n le
ft ba
nk, 6
00 ft
ups
tream
from
SR
121
, and
60
0 ft
north
of S
R 1
21 a
nd H
ooks
ett R
oad
inte
rsec
tion
in A
ubur
n.01
0940
00So
uheg
an R
iver
at
Mer
rimac
kA
ctiv
eU
SGS
171
Lat 4
2°51
'27"
, lon
g 71
°30'
24",
Hill
sbor
ough
Cou
nty,
on
left
bank
, at h
ead
of W
ildca
t Fal
ls, 2
,850
ft
upst
ream
from
sout
hbou
nd b
ridge
on
Ever
ett T
urnp
ike,
0.9
mi s
outh
wes
t of B
aboo
sic
Lake
Roa
d an
d U
S 3
inte
rsec
tion
in M
errim
ack.
0109
6581
7B
eave
r Bro
ok a
t For
dway
Ex
tens
ion
at D
erry
Act
ive
USG
S23
.9La
t 42°
52'2
1", l
ong
71°1
9'47
", R
ocki
ngha
m C
ount
y, o
n le
ft ba
nk, 3
0 ft
upst
ream
from
cul
verts
on
Ford
way
Ext
ensi
on, 7
5 ft
east
of F
ordw
ay S
treet
, For
dway
Ext
ensi
on a
nd B
ridge
Stre
et in
ters
ectio
n,
0.4
mi s
outh
of F
ordw
ay S
treet
and
Wes
t Bro
adw
ay (S
R 1
02) i
nter
sect
ion,
0.6
mi e
ast o
f I-9
3 an
d N
ashu
a R
oad
(SR
102
) int
erch
ange
, and
0.7
mi s
outh
wes
t of W
est B
road
way
(SR
102
), B
irch
Stre
et
(SR
28)
, Sto
rer S
treet
(SR
102
), an
d C
ryst
al A
venu
e (S
R 2
8) in
ters
ectio
n.01
0965
844
Bea
ver B
rook
at
Sout
h R
oad,
nea
r Der
ryA
ctiv
eU
SGS
30.3
Lat 4
2°50
'22"
, lon
g 71
°21'
00",
Roc
king
ham
Cou
nty,
on
left
bank
, ups
tream
side
of S
outh
Roa
d, a
t Ken
-da
ll Po
nd o
utle
t, 10
0 ft
east
of K
enda
ll Po
nd R
oad
and
Sout
h R
oad
inte
rsec
tion,
0.8
mi s
outh
east
of
the
inte
rsec
tion
of S
R 1
28 a
nd 1
02 in
Lon
dond
erry
.01
0965
852
Bea
ver B
rook
at
Nor
th P
elha
mA
ctiv
eU
SGS
47.8
Lat 4
2°46
'58"
, lon
g 71
°21'
15",
Hill
sbor
ough
Cou
nty,
on
right
ban
k, 1
0 ft
dow
nstre
am fr
om S
R 1
28
brid
ge a
t the
Win
dham
-Pel
ham
tow
n lin
e, 0
.7 m
i nor
th o
f SR
128
and
Cas
tle H
ill R
oad
inte
rsec
tion
in N
orth
Pel
ham
, and
1.4
mi s
outh
of t
he in
ters
ectio
n of
SR
111
and
128
.01
0965
87Tr
ibut
ary
to C
obbe
tts P
ond
at I-
93 so
uth
exit
ram
p ne
ar W
indh
am
Act
ive
USG
S0.
54La
t 42°
48'2
4", l
ong
71°1
6'27
", R
ocki
ngha
m C
ount
y, o
n rig
ht b
ank,
ups
tream
from
I-93
sout
h ex
it ra
mp,
675
ft u
pstre
am fr
om m
outh
at C
obbe
tts P
ond,
675
ft so
uth
of S
R 1
11 a
nd I-
93 so
uth
exit
ram
p in
ters
ectio
n, a
nd 1
.7 m
i eas
t of L
owel
l Roa
d an
d SR
111
inte
rsec
tion
at W
indh
am.
0110
0505
Spic
ket R
iver
at
Nor
th S
alem
Act
ive
USG
S16
.5La
t 42°
50'5
7", l
ong
71°1
2'56
", R
ocki
ngha
m C
ount
y, o
n rig
ht b
ank,
70
ft do
wns
tream
from
Hav
erhi
ll R
oad
brid
ge, 1
00 ft
sout
heas
t of N
orth
Mai
n St
reet
, Hav
erhi
ll R
oad,
and
Isla
nd P
ond
Roa
d in
ters
ec-
tion
in C
owbe
ll C
orne
rs, a
nd 1
,200
ft so
uth
of Is
land
Pon
d R
oad
and
SR 1
11 in
ters
ectio
n in
Der
ry.

Table 1 37Ta
ble
1.
Desc
riptio
n of
stre
amga
ges
used
in th
e Ap
ril 2
007
flood
inve
stig
atio
n, c
entra
l and
sou
ther
n N
ew H
amps
hire
.—Co
ntin
ued
[Loc
atio
n of
stre
amga
ges i
n fig
ure
4. U
SGS,
U.S
. Geo
logi
cal S
urve
y; S
R, S
tate
Rou
te, m
i2 , sq
uare
mile
s; la
t, la
titud
e; lo
ng, l
ongi
tude
; NH
DES
, New
Ham
pshi
re D
epar
tmen
t of E
nviro
nmen
tal S
ervi
ces;
ft,
feet
; USA
CE,
U.S
. Arm
y C
orps
of E
ngin
eers
]
USG
S st
ream
-ga
ge
num
ber
Stre
amga
ge n
ame
Stat
usO
pera
tor
Dra
inag
e ar
ea
(mi2 )
Stre
amga
ge lo
catio
n
0110
0549
Polic
y B
rook
at R
ocki
ng-
ham
Par
k B
oule
vard
at
Sal
em
Act
ive
USG
S5.
1La
t 42°
46'0
4", l
ong
71°1
3'23
", R
ocki
ngha
m C
ount
y, o
n le
ft ba
nk, 3
00 ft
dow
nstre
am fr
om R
ocki
ng-
ham
Par
k B
oule
vard
, 0.2
mi s
outh
wes
t of R
ocki
ngha
m P
ark
Bou
leva
rd a
nd S
outh
Bro
adw
ay (S
R 2
8)
inte
rsec
tion,
0.2
mi u
pstre
am fr
om m
outh
of P
orcu
pine
Bro
ok, 1
.0 m
i sou
th o
f Bro
adw
ay (S
R 2
8)
and
Mai
n St
reet
(SR
97)
inte
rsec
tion
in S
alem
Dep
ot, a
nd 1
.8 m
i sou
thw
est o
f Mai
n St
reet
(SR
97)
, B
ridge
Stre
et, a
nd S
choo
l Stre
et in
ters
ectio
n in
Sal
em.
0110
0560
5Po
licy
Bro
ok a
t I-9
3 no
rth
rest
stop
ent
ranc
e ra
mp,
ne
ar S
alem
Act
ive
USG
S10
.2La
t 42°
45'1
3", l
ong
71°1
3'15
", R
ocki
ngha
m C
ount
y, o
n le
ft ba
nk, u
pstre
am fr
om I-
93 n
orth
boun
d re
st-
stop
ent
ranc
e ra
mp,
and
2,1
00 ft
sout
heas
t of t
he C
ross
Stre
et b
ridge
ove
r I-9
3 in
Sal
em.
0110
0561
Spic
ket R
iver
nea
r M
ethu
en, M
ass.
Act
ive
USG
S62
.1La
t 42°
44'3
5", l
ong
71°1
2'32
", R
ocki
ngha
m C
ount
y, o
n le
ft ba
nk, a
t ups
tream
side
of H
amps
hire
Roa
d br
idge
at t
he N
ew H
amps
hire
-Mas
sach
uset
ts b
orde
r, 80
0 ft
dow
nstre
am fr
om m
outh
of P
olic
y B
rook
, an
d 0.
5 m
i wes
t of S
R 2
8 an
d La
wre
nce
Roa
d in
ters
ectio
n.01
1375
00A
mm
onoo
suc
Riv
er a
t B
ethl
ehem
Junc
tion
Act
ive
USG
S87
.6La
t 44°
16'0
7", l
ong
71°3
7'51
", G
rafto
n C
ount
y, o
n le
ft ba
nk, 1
,200
ft u
pstre
am fr
om U
S 30
2 br
idge
at
Pier
ce B
ridge
, 1,3
00 ft
sout
h of
US
302
and
Muc
hmor
e R
oad
inte
rsec
tion
and
3.0
mi e
ast o
f US
302
and
SR 1
42 in
ters
ectio
n in
Bet
hleh
em.
0113
8500
Con
nect
icut
Riv
er a
t W
ells
Riv
er, V
t.A
ctiv
eU
SGS
2,64
4La
t 44°
09'1
2", l
ong
72°0
2'32
", O
rang
e C
ount
y, o
n rig
ht b
ank,
at v
illag
e of
Wel
ls R
iver
, 200
ft d
own-
stre
am fr
om U
S 30
2 br
idge
, 400
ft u
pstre
am fr
om W
ells
Riv
er, 1
,200
ft d
owns
tream
from
Am
mo-
noos
uc R
iver
, and
0.2
mi w
est o
f US
302
and
SR 1
35 in
Woo
dsvi
lle, N
.H.
0114
4500
Con
nect
icut
Riv
er a
t W
est L
eban
onA
ctiv
eU
SGS
4,09
2La
t 43°
38'4
6", l
ong
72°1
8'46
", G
rafto
n C
ount
y, o
n le
ft ba
nk, 5
0 ft
dow
nstre
am fr
om B
osto
n &
Mai
ne
railr
oad
brid
ge, 5
00 ft
dow
nstre
am fr
om W
hite
Riv
er, a
nd 1
,100
ft n
orth
wes
t of U
S 4
and
SR 1
2A
inte
rsec
tion
in W
est L
eban
on.
0115
0500
Mas
com
a R
iver
at
Mas
com
aA
ctiv
eN
HD
ESa
153
Lat 4
3°38
'56"
, lon
g 72
°10'
57",
Gra
fton
Cou
nty,
on
left
bank
, 100
ft u
pstre
am fr
om P
ayne
Roa
d br
idge
, 10
0 ft
dow
nstre
am fr
om M
asco
ma
Lake
Dam
, and
0.2
mi s
outh
of U
S 4
and
Payn
e R
oad
inte
rsec
tion
in M
asco
ma.
a St
ream
gage
form
erly
ope
rate
d by
the
U.S
. Geo
logi
cal S
urve
y.b S
tream
gage
010
8950
0 ac
tive
as o
f Nov
embe
r 14,
200
7.


Appendix 1. HEC-RAS Model Calibrations to Estimate the April 2007 Flood-Peak Discharge from High-Water-Mark Data Collected for the Lamprey, Souhegan, and Suncook Rivers
Tables 1-1. HEC-RAS model calibration to estimate the April 2007 Lamprey River flood-peak
discharge from high-water-mark data collected at the railroad bridge upstream of Epping Road in Raymond, New Hampshire ............................................................................40
1-2. HEC-RAS model calibration to estimate the April 2007 Souhegan River flood-peak discharge from high-water-mark data collected at the Wilton Road (Elm Street) bridge in Milford, New Hampshire ...........................................................................................42
1-3. HEC-RAS model calibration to estimate the April 2007 Suncook River flood-peak discharge from high-water-mark data collected at the Short Falls Road bridge in Epsom, New Hampshire ............................................................................................................44
1-4. HEC-RAS model calibration to estimate the April 2007 Suncook River flood-peak discharge from high-water-mark data collected at the Websters Mill Road bridge in Chichester/Pittsfield, New Hampshire ................................................................................47

40 Flood of April 2007 in New Hampshire
Table 1-1. HEC-RAS model calibration to estimate the April 2007 Lamprey River flood-peak discharge from high-water-mark data collected at the railroad bridge upstream of Epping Road in Raymond, New Hampshire.—Continued
[River station locations are indicated by an arbitrary cross-section numbering system and are not shown on any figure. ft, feet; ft3/s, cubic feet per second]
River stationQ, total
discharge(ft3/s)
Minimum channel
elevation(ft)
Water-surface elevation
(ft)
Energy grade slope (ft/ft)
Flow area (ft2)
Top width (ft)
Channel Froudenumber
4 4,000 169.90 187.79 0.00011 2,728.74 233.30 0.084 3,990 169.90 187.79 0.00011 2,727.37 233.27 0.084 3,980 169.90 187.78 0.00011 2,726.00 233.25 0.084 3,970 169.90 187.77 0.00011 2,724.63 233.22 0.084 3,960 169.90 187.77 0.00010 2,723.26 233.20 0.084 3,950 169.90 187.76 0.00010 2,721.90 233.17 0.084 3,940 169.90 187.76 0.00010 2,720.54 233.15 0.084 3,930 169.90 187.75 0.00010 2,719.19 233.12 0.084 3,920 169.90 187.74 0.00010 2,717.84 233.10 0.084 3,910 169.90 187.74 0.00010 2,716.49 233.08 0.084 3,900 169.90 187.73 0.00010 2,715.16 233.05 0.08
3 4,000 168.91 187.58 0.00061 1,148.02 134.55 0.183 3,990 168.91 187.58 0.00061 1,147.33 134.53 0.183 3,980 168.91 187.57 0.00061 1,146.66 134.52 0.183 3,970 168.91 187.57 0.00061 1,145.98 134.50 0.183 3,960 168.91 187.56 0.00060 1,145.30 134.48 0.183 3,950 168.91 187.56 0.00060 1,144.63 134.47 0.183 3,940 168.91 187.55 0.00060 1,143.96 134.45 0.183 3,930 168.91 187.55 0.00060 1,143.29 134.44 0.183 3,920 168.91 187.54 0.00059 1,142.63 134.42 0.183 3,910 168.91 187.54 0.00059 1,141.96 134.41 0.183 3,900 168.91 187.53 0.00059 1,141.30 134.39 0.18
2.7 4,000 169.20 186.80 0.00186 571.85 38.79 0.322.7 3,990 169.20 186.80 0.00185 571.80 38.79 0.322.7 3,980 169.20 186.80 0.00184 571.76 38.79 0.322.7 3,970 169.20 186.80 0.00183 571.72 38.79 0.322.7 3,960 169.20 186.80 0.00183 571.68 38.79 0.322.7 3,950 169.20 186.80 0.00182 571.63 38.79 0.322.7 3,940 169.20 186.79 0.00181 571.59 38.79 0.322.7 3,930 169.20 186.79 0.00180 571.55 38.79 0.322.7 3,920 169.20 186.79 0.00179 571.51 38.79 0.312.7 3,910 169.20 186.79 0.00178 571.47 38.79 0.312.7 3,900 169.20 186.79 0.00177 571.43 38.79 0.31
2.5 Bridge
2.3 4,000 169.78 186.22 0.00270 502.80 37.90 0.382.3 3,990 169.78 186.23 0.00268 502.89 37.90 0.382.3 3,980 169.78 186.23 0.00267 502.98 37.90 0.382.3 3,970 169.78 186.23 0.00266 503.07 37.90 0.382.3 3,960 169.78 186.23 0.00264 503.16 37.90 0.382.3 3,950 169.78 186.24 0.00263 503.24 37.90 0.382.3 3,940 169.78 186.24 0.00261 503.33 37.90 0.382.3 3,930 169.78 186.24 0.00260 503.42 37.90 0.382.3 3,920 169.78 186.24 0.00258 503.50 37.91 0.382.3 3,910 169.78 186.25 0.00257 503.59 37.91 0.382.3 3,900 169.78 186.25 0.00255 503.68 37.91 0.37

Appendix 1 41
Table 1-1. HEC-RAS model calibration to estimate the April 2007 Lamprey River flood-peak discharge from high-water-mark data collected at the railroad bridge upstream of Epping Road in Raymond, New Hampshire.—Continued
[River station locations are indicated by an arbitrary cross-section numbering system and are not shown on any figure. ft, feet; ft3/s, cubic feet per second]
River stationQ, total
discharge(ft3/s)
Minimum channel
elevation(ft)
Water-surface elevation
(ft)
Energy grade slope (ft/ft)
Flow area (ft2)
Top width (ft)
Channel Froudenumber
2 4,000 165.71 186.67 0.00006 3,064.42 280.06 0.082 3,990 165.71 186.67 0.00006 3,064.41 280.06 0.082 3,980 165.71 186.67 0.00006 3,064.40 280.06 0.082 3,970 165.71 186.67 0.00006 3,064.39 280.06 0.082 3,960 165.71 186.67 0.00006 3,064.38 280.06 0.082 3,950 165.71 186.67 0.00006 3,064.37 280.06 0.082 3,940 165.71 186.67 0.00006 3,064.36 280.06 0.082 3,930 165.71 186.67 0.00006 3,064.35 280.06 0.082 3,920 165.71 186.67 0.00006 3,064.34 280.05 0.082 3,910 165.71 186.67 0.00006 3,064.33 280.05 0.082 3,900 165.71 186.67 0.00006 3,064.32 280.05 0.07
1 4,000 171.11 186.66 0.00029 3,115.09 362.46 0.101 3,990 171.11 186.66 0.00028 3,115.09 362.46 0.101 3,980 171.11 186.66 0.00028 3,115.09 362.46 0.101 3,970 171.11 186.66 0.00028 3,115.09 362.46 0.101 3,960 171.11 186.66 0.00028 3,115.09 362.46 0.101 3,950 171.11 186.66 0.00028 3,115.09 362.46 0.101 3,940 171.11 186.66 0.00028 3,115.09 362.46 0.101 3,930 171.11 186.66 0.00028 3,115.09 362.46 0.101 3,920 171.11 186.66 0.00027 3,115.09 362.46 0.101 3,910 171.11 186.66 0.00027 3,115.09 362.46 0.101 3,900 171.11 186.66 0.00027 3,115.09 362.46 0.10

42 Flood of April 2007 in New Hampshire
Table 1-2. HEC-RAS model calibration to estimate the April 2007 Souhegan River flood-peak discharge from high-water-mark data collected at the Wilton Road (Elm Street) bridge in Milford, New Hampshire.—Continued
[River station locations are indicated by an arbitrary cross-section numbering system and are not shown on any figure. ft, feet; ft3/s, cubic feet per second]
River stationQ, total
discharge(ft3/s)
Minimum channel
elevation(ft)
Water-surface elevation
(ft)
Energy grade slope (ft/ft)
Flow area (ft2)
Top width (ft)
Channel Froudenumber
6 7,000 288.52 299.45 0.00463 1,093.40 135.79 0.426 6,990 288.52 299.44 0.00463 1,092.31 135.77 0.426 6,980 288.52 299.43 0.00462 1,091.41 135.75 0.426 6,970 288.52 299.42 0.00462 1,090.33 135.72 0.426 6,960 288.52 299.42 0.00462 1,089.42 135.70 0.426 6,950 288.52 299.41 0.00462 1,088.33 135.68 0.426 6,940 288.52 299.40 0.00462 1,087.24 135.66 0.426 6,930 288.52 299.40 0.00462 1,086.35 135.64 0.426 6,920 288.52 299.39 0.00462 1,085.26 135.61 0.426 6,910 288.52 299.38 0.00462 1,084.36 135.59 0.426 6,900 288.52 299.37 0.00462 1,083.28 135.57 0.42
5 7,000 288.28 298.81 0.00839 1,119.23 136.23 0.385 6,990 288.28 298.81 0.00839 1,118.11 136.21 0.385 6,980 288.28 298.80 0.00838 1,117.22 136.20 0.385 6,970 288.28 298.79 0.00838 1,116.10 136.18 0.385 6,960 288.28 298.78 0.00838 1,115.22 136.16 0.385 6,950 288.28 298.78 0.00838 1,114.10 136.14 0.385 6,940 288.28 298.77 0.00838 1,112.98 136.12 0.385 6,930 288.28 298.76 0.00838 1,112.10 136.11 0.385 6,920 288.28 298.75 0.00838 1,110.98 136.09 0.385 6,910 288.28 298.75 0.00837 1,110.10 136.07 0.385 6,900 288.28 298.74 0.00837 1,108.98 136.05 0.38
4.7 7,000 284.76 297.21 0.00564 968.32 104.05 0.424.7 6,990 284.76 297.20 0.00563 967.54 104.03 0.424.7 6,980 284.76 297.19 0.00563 967.09 104.02 0.424.7 6,970 284.76 297.19 0.00562 966.31 104.00 0.424.7 6,960 284.76 297.18 0.00562 965.87 103.99 0.424.7 6,950 284.76 297.17 0.00561 965.09 103.98 0.424.7 6,940 284.76 297.17 0.00561 964.31 103.96 0.424.7 6,930 284.76 297.16 0.00560 963.88 103.95 0.424.7 6,920 284.76 297.16 0.00560 963.10 103.93 0.424.7 6,910 284.76 297.15 0.00559 962.67 103.92 0.424.7 6,900 284.76 297.14 0.00559 961.90 103.91 0.42
4.5 Bridge
4.3 7,000 283.70 297.03 0.00484 1,025.16 119.93 0.414.3 6,990 283.70 297.02 0.00484 1,024.29 119.92 0.414.3 6,980 283.70 297.02 0.00483 1,023.81 119.91 0.414.3 6,970 283.70 297.01 0.00483 1,022.94 119.89 0.414.3 6,960 283.70 297.01 0.00482 1,022.48 119.88 0.414.3 6,950 283.70 297.00 0.00482 1,021.60 119.86 0.414.3 6,940 283.70 296.99 0.00482 1,020.72 119.84 0.414.3 6,930 283.70 296.99 0.00481 1,020.26 119.84 0.414.3 6,920 283.70 296.98 0.00481 1,019.39 119.82 0.414.3 6,910 283.70 296.98 0.00481 1,018.94 119.81 0.414.3 6,900 283.70 296.97 0.00480 1,018.07 119.79 0.41

Appendix 1 43
Table 1-2. HEC-RAS model calibration to estimate the April 2007 Souhegan River flood-peak discharge from high-water-mark data collected at the Wilton Road (Elm Street) bridge in Milford, New Hampshire.—Continued
[River station locations are indicated by an arbitrary cross-section numbering system and are not shown on any figure. ft, feet; ft3/s, cubic feet per second]
River stationQ, total
discharge(ft3/s)
Minimum channel
elevation(ft)
Water-surface elevation
(ft)
Energy grade slope (ft/ft)
Flow area (ft2)
Top width (ft)
Channel Froudenumber
4 7,000 282.64 296.09 0.00642 950.43 94.97 0.414 6,990 282.64 296.09 0.00641 949.86 94.96 0.414 6,980 282.64 296.09 0.00640 949.71 94.95 0.414 6,970 282.64 296.08 0.00639 949.14 94.93 0.414 6,960 282.64 296.08 0.00637 948.99 94.93 0.414 6,950 282.64 296.07 0.00636 948.42 94.91 0.414 6,940 282.64 296.07 0.00635 947.85 94.89 0.414 6,930 282.64 296.06 0.00634 947.71 94.89 0.414 6,920 282.64 296.06 0.00633 947.14 94.87 0.414 6,910 282.64 296.06 0.00631 947.01 94.86 0.414 6,900 282.64 296.05 0.00630 946.45 94.84 0.41
3 7,000 282.21 294.36 0.01649 673.14 74.79 0.613 6,980 282.21 294.37 0.01641 673.66 74.81 0.613 6,970 282.21 294.37 0.01637 673.55 74.80 0.613 6,960 282.21 294.37 0.01629 674.07 74.82 0.613 6,950 282.21 294.37 0.01625 673.97 74.82 0.613 6,940 282.21 294.37 0.01621 673.86 74.81 0.603 6,930 282.21 294.38 0.01613 674.38 74.83 0.603 6,920 282.21 294.38 0.01609 674.28 74.83 0.603 6,910 282.21 294.38 0.01601 674.80 74.84 0.603 6,900 282.21 294.38 0.01597 674.70 74.84 0.60
2 7,000 278.67 294.76 0.00400 1,043.55 103.02 0.362 6,990 278.67 294.76 0.00400 1,043.29 103.01 0.362 6,980 278.67 294.76 0.00398 1,043.79 103.03 0.362 6,970 278.67 294.76 0.00397 1,043.53 103.02 0.362 6,960 278.67 294.76 0.00395 1,044.04 103.04 0.362 6,950 278.67 294.76 0.00395 1,043.78 103.03 0.362 6,940 278.67 294.76 0.00394 1,043.51 103.02 0.362 6,930 278.67 294.76 0.00392 1,044.02 103.04 0.362 6,920 278.67 294.76 0.00391 1,043.77 103.03 0.362 6,910 278.67 294.76 0.00390 1,044.28 103.05 0.362 6,900 278.67 294.76 0.00389 1,044.02 103.04 0.36
1 7,000 280.46 293.83 0.00442 1,104.17 113.64 0.361 6,990 280.46 293.83 0.00441 1,104.17 113.64 0.361 6,980 280.46 293.84 0.00438 1,105.31 113.65 0.361 6,970 280.46 293.84 0.00437 1,105.31 113.65 0.361 6,960 280.46 293.85 0.00434 1,106.45 113.66 0.361 6,950 280.46 293.85 0.00433 1,106.45 113.66 0.351 6,940 280.46 293.85 0.00432 1,106.45 113.66 0.351 6,930 280.46 293.86 0.00429 1,107.58 113.68 0.351 6,920 280.46 293.86 0.00428 1,107.58 113.68 0.351 6,910 280.46 293.87 0.00426 1,108.72 113.69 0.351 6,900 280.46 293.87 0.00424 1,108.72 113.69 0.35

44 Flood of April 2007 in New Hampshire
Table 1-3. HEC-RAS model calibration to estimate the April 2007 Suncook River flood-peak discharge from high-water-mark data collected at the Short Falls Road bridge in Epsom, New Hampshire.—Continued
[River station locations are indicated by an arbitrary cross-section numbering system and are not shown on any figure. ft, feet; ft3/s, cubic feet per second]
River stationQ, total
discharge(ft3/s)
Minimum channel
elevation(ft)
Water-surface elevation
(ft)
Energy grade slope (ft/ft)
Flow area (ft2)
Top width (ft)
Channel Froudenumber
6 14,500 289.88 309.33 0.00163 2,016.51 158.58 0.356 14,400 289.88 309.30 0.00161 2,012.63 158.37 0.356 14,300 289.88 309.28 0.00160 2,008.81 158.17 0.356 14,200 289.88 309.25 0.00159 2,005.08 157.97 0.356 14,100 289.88 309.23 0.00157 2,001.38 157.77 0.356 14,000 289.88 309.21 0.00156 1,997.76 157.58 0.356 13,900 289.88 309.19 0.00154 1,994.20 157.39 0.346 13,800 289.88 309.16 0.00153 1,990.69 157.20 0.346 13,700 289.88 309.14 0.00152 1,987.22 157.02 0.346 13,600 289.88 309.12 0.00150 1,983.84 156.84 0.346 13,500 289.88 309.10 0.00149 1,980.50 156.66 0.34
5.5 14,500 288.33 309.11 0.00295 1,906.97 145.14 0.375.5 14,400 288.33 309.09 0.00292 1,903.78 145.04 0.375.5 14,300 288.33 309.07 0.00290 1,900.64 144.94 0.375.5 14,200 288.33 309.05 0.00287 1,897.57 144.84 0.365.5 14,100 288.33 309.03 0.00284 1,894.53 144.74 0.365.5 14,000 288.33 309.01 0.00281 1,891.57 144.64 0.365.5 13,900 288.33 308.99 0.00278 1,888.65 144.55 0.365.5 13,800 288.33 308.97 0.00275 1,885.79 144.46 0.365.5 13,700 288.33 308.95 0.00272 1,882.96 144.36 0.365.5 13,600 288.33 308.93 0.00269 1,880.21 144.27 0.355.5 13,500 288.33 308.91 0.00266 1,877.49 144.19 0.35
5 14,500 288.33 308.43 0.00252 1,505.33 111.13 0.435 14,400 288.33 308.42 0.00249 1,504.00 110.93 0.435 14,300 288.33 308.41 0.00246 1,502.71 110.74 0.425 14,200 288.33 308.40 0.00243 1,501.45 110.56 0.425 14,100 288.33 308.39 0.00241 1,500.23 110.38 0.425 14,000 288.33 308.38 0.00238 1,499.04 110.20 0.425 13,900 288.33 308.36 0.00235 1,497.89 110.03 0.415 13,800 288.33 308.35 0.00232 1,496.77 109.87 0.415 13,700 288.33 308.34 0.00229 1,495.67 109.70 0.415 13,600 288.33 308.33 0.00226 1,494.61 109.55 0.415 13,500 288.33 308.33 0.00223 1,493.58 109.39 0.40
4.7 14,500 287.48 308.49 0.00172 1,725.49 124.84 0.404.7 14,400 287.48 308.48 0.00170 1,723.86 124.79 0.404.7 14,300 287.48 308.47 0.00168 1,722.27 124.75 0.394.7 14,200 287.48 308.45 0.00166 1,720.73 124.71 0.394.7 14,100 287.48 308.44 0.00165 1,719.23 124.67 0.394.7 14,000 287.48 308.43 0.00163 1,717.77 124.63 0.394.7 13,900 287.48 308.42 0.00161 1,716.34 124.59 0.384.7 13,800 287.48 308.41 0.00159 1,714.95 124.56 0.384.7 13,700 287.48 308.40 0.00157 1,713.59 124.52 0.384.7 13,600 287.48 308.39 0.00155 1,712.27 124.48 0.384.7 13,500 287.48 308.37 0.00153 1,710.98 124.45 0.38
4.5 Bridge

Appendix 1 45
Table 1-3. HEC-RAS model calibration to estimate the April 2007 Suncook River flood-peak discharge from high-water-mark data collected at the Short Falls Road bridge in Epsom, New Hampshire.—Continued
[River station locations are indicated by an arbitrary cross-section numbering system and are not shown on any figure. ft, feet; ft3/s, cubic feet per second]
River stationQ, total
discharge(ft3/s)
Minimum channel
elevation(ft)
Water-surface elevation
(ft)
Energy grade slope (ft/ft)
Flow area (ft2)
Top width (ft)
Channel Froudenumber
4.3 14,500 287.48 307.48 0.00210 1,601.24 120.77 0.444.3 14,400 287.48 307.49 0.00207 1,602.19 120.82 0.434.3 14,300 287.48 307.50 0.00204 1,603.12 120.86 0.434.3 14,200 287.48 307.50 0.00201 1,604.05 120.91 0.434.3 14,100 287.48 307.51 0.00198 1,604.97 120.96 0.434.3 14,000 287.48 307.52 0.00195 1,605.89 121.00 0.424.3 13,900 287.48 307.53 0.00192 1,606.79 121.05 0.424.3 13,800 287.48 307.53 0.00189 1,607.69 121.09 0.424.3 13,700 287.48 307.54 0.00186 1,608.57 121.14 0.414.3 13,600 287.48 307.55 0.00183 1,609.45 121.18 0.414.3 13,500 287.48 307.56 0.00180 1,610.32 121.22 0.41
4 14,500 286.73 307.99 0.00032 4,897.13 385.23 0.164 14,400 286.73 307.99 0.00031 4,897.21 385.23 0.164 14,300 286.73 307.99 0.00031 4,897.29 385.23 0.164 14,200 286.73 307.99 0.00031 4,897.37 385.24 0.164 14,100 286.73 307.99 0.00030 4,897.45 385.24 0.154 14,000 286.73 307.99 0.00030 4,897.53 385.24 0.154 13,900 286.73 307.99 0.00029 4,897.60 385.24 0.154 13,800 286.73 307.99 0.00029 4,897.69 385.25 0.154 13,700 286.73 307.99 0.00028 4,897.76 385.25 0.154 13,600 286.73 307.99 0.00028 4,897.84 385.25 0.154 13,500 286.73 307.99 0.00028 4,897.91 385.26 0.15
3 14,500 276.83 308.05 0.000063 9,822.06 631.09 0.093 14,400 276.83 308.05 0.000063 9,821.64 631.08 0.093 14,300 276.83 308.05 0.000062 9,821.20 631.06 0.093 14,200 276.83 308.05 0.000061 9,820.77 631.05 0.093 14,100 276.83 308.05 0.000060 9,820.37 631.04 0.093 14,000 276.83 308.05 0.000059 9,819.94 631.03 0.093 13,900 276.83 308.05 0.000058 9,819.52 631.02 0.093 13,800 276.83 308.04 0.000057 9,819.11 631.01 0.093 13,700 276.83 308.04 0.000057 9,818.71 631.00 0.083 13,600 276.83 308.04 0.000057 9,818.31 630.99 0.083 13,500 276.83 308.04 0.000057 9,817.90 630.97 0.08
2 14,500 270.77 308.08 0.00002 15,316.79 937.35 0.052 14,400 270.77 308.08 0.00002 15,315.73 937.34 0.052 14,300 270.77 308.08 0.00002 15,314.65 937.33 0.052 14,200 270.77 308.08 0.00002 15,313.59 937.32 0.052 14,100 270.77 308.08 0.00002 15,312.56 937.31 0.052 14,000 270.77 308.08 0.00002 15,311.50 937.31 0.052 13,900 270.77 308.08 0.00002 15,310.47 937.30 0.052 13,800 270.77 308.08 0.00002 15,309.44 937.29 0.052 13,700 270.77 308.07 0.00002 15,308.44 937.28 0.052 13,600 270.77 308.07 0.00002 15,307.41 937.27 0.052 13,500 270.77 308.07 0.00002 15,306.41 937.26 0.05

46 Flood of April 2007 in New Hampshire
Table 1-3. HEC-RAS model calibration to estimate the April 2007 Suncook River flood-peak discharge from high-water-mark data collected at the Short Falls Road bridge in Epsom, New Hampshire.—Continued
[River station locations are indicated by an arbitrary cross-section numbering system and are not shown on any figure. ft, feet; ft3/s, cubic feet per second]
River stationQ, total
discharge(ft3/s)
Minimum channel
elevation(ft)
Water-surface elevation
(ft)
Energy grade slope (ft/ft)
Flow area (ft2)
Top width (ft)
Channel Froudenumber
1 14,500 286.21 308.00 0.00014 9,571.49 943.03 0.121 14,400 286.21 308.00 0.00014 9,571.49 943.03 0.121 14,300 286.21 308.00 0.00014 9,571.49 943.03 0.121 14,200 286.21 308.00 0.00013 9,571.49 943.03 0.121 14,100 286.21 308.00 0.00013 9,571.49 943.03 0.121 14,000 286.21 308.00 0.00013 9,571.49 943.03 0.121 13,900 286.21 308.00 0.00013 9,571.49 943.03 0.121 13,800 286.21 308.00 0.00013 9,571.49 943.03 0.121 13,700 286.21 308.00 0.00012 9,571.49 943.03 0.121 13,600 286.21 308.00 0.00012 9,571.49 943.03 0.121 13,500 286.21 308.00 0.00012 9,571.49 943.03 0.11

Appendix 1 47
Table 1-4. HEC-RAS model calibration to estimate the April 2007 Suncook River flood-peak discharge from high-water-mark data collected at the Websters Mill Road bridge in Chichester/Pittsfield, New Hampshire.—Continued
[River station locations are indicated by an arbitrary cross-section numbering system and are not shown on any figure. ft, feet; ft3/s, cubic feet per second]
River stationQ, total
discharge(ft3/s)
Minimum channel
elevation(ft)
Water-surface elevation
(ft)
Energy grade slope (ft/ft)
Flow area (ft2)
Top width (ft)
Channel Froudenumber
6 9,500 387.95 395.76 0.00631 988.50 224.12 0.946 9,400 387.95 395.72 0.00632 980.41 223.67 0.946 9,300 387.95 395.68 0.00632 972.32 223.22 0.946 9,200 387.95 395.64 0.00633 964.23 222.78 0.946 9,100 387.95 395.61 0.00633 956.06 222.33 0.946 9,000 387.95 395.58 0.00628 951.44 222.07 0.946 8,900 387.95 395.55 0.00627 944.01 221.66 0.946 8,800 387.95 395.51 0.00626 936.47 221.25 0.936 8,700 387.95 395.48 0.00625 928.87 220.83 0.936 8,600 387.95 395.44 0.00625 921.21 220.40 0.936 8,500 387.95 395.40 0.00624 913.45 219.97 0.93
5 9,500 387.63 395.39 0.00496 1,133.44 246.66 0.845 9,400 387.63 395.34 0.00501 1,119.73 246.29 0.855 9,300 387.63 395.28 0.00506 1,105.85 245.91 0.855 9,200 387.63 395.23 0.00511 1,091.88 245.52 0.855 9,100 387.63 395.17 0.00517 1,077.81 245.14 0.865 9,000 387.63 395.12 0.00518 1,066.95 244.84 0.865 8,900 387.63 395.06 0.00526 1,051.18 244.41 0.865 8,800 387.63 394.95 0.00548 1,025.07 243.69 0.885 8,700 387.63 394.88 0.00559 1,007.50 243.20 0.895 8,600 387.63 394.80 0.00574 987.66 242.65 0.905 8,500 387.63 394.73 0.00583 971.71 242.21 0.90
4 9,500 385.45 394.46 0.00739 942.93 184.20 1.014 9,400 385.45 394.42 0.00740 935.53 184.01 1.014 9,300 385.45 394.38 0.00742 928.15 183.83 1.014 9,200 385.45 394.34 0.00743 920.77 183.64 1.014 9,100 385.45 394.30 0.00745 913.34 183.46 1.014 9,000 385.45 394.25 0.00752 903.55 183.21 1.014 8,900 385.45 394.21 0.00751 897.17 183.05 1.014 8,800 385.45 394.17 0.00752 889.61 182.86 1.014 8,700 385.45 394.13 0.00753 882.58 182.69 1.014 8,600 385.45 394.10 0.00751 876.09 182.52 1.014 8,500 385.45 394.05 0.00755 867.84 182.32 1.01
3.7 9,500 384.07 393.47 0.00264 964.61 137.62 0.623.7 9,400 384.07 393.42 0.00265 957.86 136.96 0.623.7 9,300 384.07 393.36 0.00265 951.29 136.33 0.623.7 9,200 384.07 393.31 0.00266 944.49 135.67 0.623.7 9,100 384.07 393.25 0.00267 937.62 135.01 0.623.7 9,000 384.07 393.20 0.00267 930.79 134.35 0.623.7 8,900 384.07 393.14 0.00268 923.96 133.69 0.623.7 8,800 384.07 393.09 0.00268 917.05 133.02 0.623.7 8,700 384.07 393.03 0.00269 910.18 132.35 0.623.7 8,600 384.07 392.98 0.00270 903.20 131.68 0.623.7 8,500 384.07 392.92 0.00270 896.23 131.00 0.62

48 Flood of April 2007 in New Hampshire
Table 1-4. HEC-RAS model calibration to estimate the April 2007 Suncook River flood-peak discharge from high-water-mark data collected at the Websters Mill Road bridge in Chichester/Pittsfield, New Hampshire.—Continued
[River station locations are indicated by an arbitrary cross-section numbering system and are not shown on any figure. ft, feet; ft3/s, cubic feet per second]
River stationQ, total
discharge(ft3/s)
Minimum channel
elevation(ft)
Water-surface elevation
(ft)
Energy grade slope (ft/ft)
Flow area (ft2)
Top width (ft)
Channel Froudenumber
3.5 Bridge
3.2 9,500 384.07 391.82 0.00558 767.08 127.89 0.873.2 9,400 384.07 391.78 0.00559 761.65 127.79 0.873.2 9,300 384.07 391.73 0.00562 755.17 127.66 0.883.2 9,200 384.07 391.67 0.00565 748.92 127.53 0.883.2 9,100 384.07 391.63 0.00567 743.12 127.41 0.883.2 9,000 384.07 391.58 0.00570 736.80 127.29 0.883.2 8,900 384.07 391.56 0.00562 734.79 127.25 0.873.2 8,800 384.07 391.51 0.00566 728.28 127.12 0.873.2 8,700 384.07 391.45 0.00570 721.64 126.98 0.883.2 8,600 384.07 391.40 0.00573 715.00 126.85 0.883.2 8,500 384.07 391.35 0.00576 708.66 126.72 0.88
3 9,400 381.86 391.91 0.00210 1,112.27 151.73 0.553 9,300 381.86 391.86 0.00211 1,103.75 151.49 0.553 9,200 381.86 391.80 0.00211 1,095.52 151.26 0.553 9,100 381.86 391.75 0.00211 1,087.83 151.05 0.553 9,000 381.86 391.70 0.00211 1,079.53 150.82 0.553 8,900 381.86 391.68 0.00208 1,076.52 150.74 0.553 8,800 381.86 391.62 0.00208 1,067.98 150.50 0.553 8,700 381.86 391.56 0.00209 1,059.29 150.26 0.553 8,600 381.86 391.50 0.00209 1,050.62 150.02 0.553 8,500 381.86 391.45 0.00209 1,042.31 149.79 0.54
2 9,500 381.20 389.07 0.01078 858.68 220.06 0.932 9,400 381.20 389.01 0.01088 849.29 219.86 0.942 9,300 381.20 388.98 0.01082 844.65 219.76 0.932 9,200 381.20 388.94 0.01079 838.84 219.64 0.932 9,100 381.20 388.89 0.01084 830.78 219.46 0.932 9,000 381.20 388.86 0.01081 825.01 219.34 0.932 8,900 381.20 388.67 0.01165 795.84 215.51 0.962 8,800 381.20 388.63 0.01167 788.71 214.23 0.962 8,700 381.20 388.58 0.01167 782.00 213.02 0.962 8,600 381.20 388.54 0.01168 775.15 211.77 0.962 8,500 381.20 388.49 0.01175 766.75 210.25 0.96
1 9,500 376.99 383.37 0.00598 1,089.92 241.65 0.671 9,400 376.99 383.37 0.00585 1,089.92 241.65 0.661 9,300 376.99 383.37 0.00573 1,089.92 241.65 0.651 9,200 376.99 383.37 0.00561 1,089.92 241.65 0.651 9,100 376.99 383.37 0.00549 1,089.92 241.65 0.641 9,000 376.99 383.37 0.00537 1,089.92 241.65 0.631 8,900 376.99 383.37 0.00525 1,089.92 241.65 0.631 8,800 376.99 383.37 0.00513 1,089.92 241.65 0.621 8,700 376.99 383.37 0.00501 1,089.92 241.65 0.611 8,600 376.99 383.37 0.00490 1,089.92 241.65 0.601 8,500 376.99 383.37 0.00479 1,089.92 241.65 0.60