flood modelling and compaction studies for the … · flood modelling and compaction studies for...
TRANSCRIPT
1
Flood modelling and compaction studies for theUpper Ure
Project UUCP1/2015
Jihui Gao, Mike Kirkby, Richard Grayson and Joseph Holden
water@leeds, School of Geography, University of Leeds
March 2015
Report to be cited as: Gao, J., Kirkby, M.J., Grayson, R. and Holden, J. (2015) Flood modellingand compaction studies for the Upper Ure. Final report to Yorkshire Dales National Park Authority,Project UUCP1/2015, University of Leeds, Leeds.
Contact: Professor Joseph Holden, water@leeds, School of Geography, University of Leeds,Leeds, LS2 9JT; [email protected]
2
1. Executive summary
This report presents work from two subcatchments of the Upper Ure with a view to
determining whether land management change in those catchments may have beneficial
impacts on flood risk and hydrological processes. The project also acts to demonstrate the
effectiveness of the research methods with a view to wider roll out across the Upper Ure
system to comprehensively assess where targeted actions might yield greatest benefits.
Two activities were undertaken: 1) Flood modelling in Coverdale using a new spatially
distributed form of TOPMODEL, involving a number of spatial experiments to test different
scenarios of land-cover change and their associated flood risk benefits under different
magnitudes of rainfall; 2) Soil compaction surveys for a large land-holding in Bishopdale
showing how compaction varies in different parts of the system and also testing the impact
of buffer strips on soil compaction.
The key findings were:
Coverdale flood modelling
Changes in the land cover in riparian zones have the potential to make very large
differences to flood peaks emerging from Coverdale. Stripping vegetation from
10 % of the catchment area along riparian zones could increase peak flows by
19 %. Placing denser vegetation in these areas could potentially reduce flood peaks
by 12 % during a 15 mm per hour rainfall event.
It is almost as effective to have a roughened buffer zone along riparian areas that
cover 10 % of the catchment as it is to have wider buffer zones that cumulatively
cover 20 % of the catchment area. Therefore, efficiency savings can be made by
investing in narrower buffer zones that cover a longer length adjacent to stream
channels.
Heavy grazing in ELS and HLS areas could theoretically enhance flood risk in the
Coverdale catchment. The impact of the combined ELS and HLS areas could be as
great as 32 % during a 15 mm per hour storm event. The impact on the flood peak
of such changes in HLS areas alone would be 25 %.
Bare peat covers around 5.8 % of Coverdale. Revegetation of this bare peat in the
headwaters of Coverdale could reduce peak flow by over 4% and 3% respectively
for either 15 mm or 30 mm per hour rainfall events.
In a very extreme storm event (150 mm in 5 hours), the proportional impact of land-
cover interventions on flood peak magnitude in Coverdale is likely to be small.
However, there will still be impacts on the timing of the rising and falling limbs of the
3
hydrographs which may have impacts on the overall flood peak in the Ure as this
will depend on the synchronicity of flood peaks from all the different tributaries down
the main Ure channel. For bare soil, enhanced grazing and more frequent moorland
burning scenarios, there would be earlier rising and falling limbs on the flood
hydrograph than is currently the case, while delayed rising and falling limbs would
occur if there was revegetation of bare areas and enhanced roughness (e.g.
reduced grazing, less frequent burning, creation of buffer zones).
The results show that the new distributed version of TOPMODEL can be applied to
test relevant scenarios of land cover change and to show how different spatial
configuration of change in the landscape can influence the flood peak.
It would be desirable to develop and run the model across the whole of the Upper
Ure to determine the full scale of possible management intervention effects in
different locations upon the overall flood peak in the main river channel. It may be
that some tributaries are more or less sensitive than Coverdale to changes in
surface cover and management and it would be possible to evaluate locations in the
Upper Ure system where efforts ought to be focussed.
Bishopdale compaction survey
This report provides one of the few studies of soil compaction that exists for the UK
uplands.
There are areas of high soil surface compaction (e.g. >100 N m-2 of soil resistance)
across some of the slopes on the study site in Bishopdale and these have been
mapped. These occur on both steep and gentle gradient slope areas.
After 5 years, the exclosure zones near the main stream channel had significantly
lower soil compaction than areas without exclosure, or areas that had been in
exclosure status for 2 or 3 years. Thus, the use of such measures may reduce
compaction in some areas of the study site after several years.
Data collected in this survey provide an essential baseline against which future
change through management interventions can be evaluated.
A compaction survey has been shown to provide a cost-effective way of determining
locations in the upper Ure system where there may be compaction problems. This is
because it does not require costly lab analysis which may be required for other soil
measures such as bulk density. It is therefore recommended that such surveys are
rolled out across other areas of interest in the Upper Ure.
Future work could consider measuring compaction in the subsoil for a subset of
sampling points as well as the topsoil.

4
Combining the two types of study
Combining results from the compaction surveys with the use of TOPMODEL would
be very useful in showing what impact different spatial hotspots of compaction may
have on the flood peak. As TOPMODEL results demonstrated for Coverdale,
changes in grazing intensity that increase or reduce soil compaction can greatly
affect the flood peak at the catchment outlet. Therefore, by combining compaction
data with hydrological modelling it would be possible to show which compaction
zones may be having the largest impact on flood peaks in the Ure system and
therefore which locations should be prioritised with interventions to reduce
compaction.

5
2. Flood modelling in Coverdale
2.1 Objectives
This research seeks to show, for a tributary in the Upper Ure catchment, how different
spatial configurations of land management may influence local flood peaks and to
demonstrate how the new distributed version of TOPMODEL, developed by water@leeds,
can be used to predict the effect of land-cover change on flood flows. Such work could
support decision-makers in understanding the scale of flood benefits possible from land-
cover change and also how to target interventions spatially for maximum effect.
Specifically the work was commissioned to:
Adjust the modified spatially distributed version of TOPMODEL developed by Gao
et al (2015) for use in Coverdale.
Run the model for three types of rainfall magnitude
Test possible impacts of different levels of compaction in ELS areas on the flood
peak at the Coverdale catchment outlet
Test possible impacts of bare peat restoration in Coverdale on the flood peak
downstream
Test possible impacts of moorland burn rotation scenarios on the flood peak
downstream
2.2 Study site and methodology
The Coverdale catchment (54◦16’ N, 2◦43’ W) located in the Yorkshire Dales National Park
has an area of 84.0 km2 at elevations between 97 m and 675 m AOD. The River Cover is
a tributary of the Ure. The climate is cool and wet with a mean annual precipitation of 1757
mm based on the Environment Agency rainfall record (station number: 047281) between
1986 and 2014. Figure 2.1 shows a rainfall frequency analysis for the EA gauge data.

6
Figure 2.1. Frequency of maximum rainfall for each year (a) 15-min rainfall, (b) hourlyrainfall, (c) daily rainfall. A frequency of 0.8, for example, would indicate that themaximum rainfall in 80 % of all years is above that value.
The hydrological model, TOPMODEL, was developed at the University of Leeds in the
1970s. It is now used worldwide. Recently, a new fully distributed version of the model has
been produced (Gao et al., 2015). TOPMODEL was already suited to upland catchments
but this new development has major advantages because: 1) it can predict where overland
flow will occur, showing greater detail for the rates and pathways of overland flow
production; and 2) it makes use of measured overland flow rates to forecast how the
speed of overland flow depends on the density of vegetation cover. These properties
mean that land management or surface-cover change in different parts of the catchment
can be evaluated with regard to impacts on the river flow at the catchment outlet.
To model the impact of land management on downstream flow in the catchment,
illustrative scenarios are needed to represent different land management options. Groups
of scenarios were designed to determine basic factors that might have the largest effect on
flood peaks for Coverdale. These scenarios are described in turn in section 2.3. It should
be noted that many other scenarios could be chosen and tested if stakeholders require.
However, due to the project being a pilot exercise with limited funding then we have
restricted the work to a handful of scenarios to be modelled. The distributed version of
(a) (b)
(c)

7
TOPMODEL was used to simulate river flow for each scenario under a series of rainfall
events.
The size of the digital elevation model grid-cell used in the study was 20 m by 20 m. The
time step was set as 0.1 hr (i.e. a discharge result for every 6 minutes) in scenario
modelling runs to identify possible minor differences between outcomes on river flow. For
rainfall input, a number of typical rainfall events with different rainfall intensities were
employed to demonstrate the impacts of land-cover change scenarios on river flow in
different rainfall conditions. These rainfall intensities were selected based on the results
from Figure 2.1 using the ~30 year rainfall record and were 15 mm/hr for one 1 hr (roughly
equivalent to a one in 10-year event), 30 mm/hr for 1 hr (approximating the maximum
recorded in the whole rainfall timeseries) and 30mm/hr for 5 hrs (approximating the highest
total daily rainfall in the record). The modelling was done by running a 10-step (1 hour)
warming-up stage for the model at the very beginning of each scenario run prior to the
rainfall event. Another 80 steps follow each rainfall period in the entire modelling period.
Most scenario hydrographs shown within the figures in this report just present the first 80
or 100 time steps to focus on the rising and falling limbs around peak flow conditions and
ignore the last steps which just contain the low flow recessional part of the hydrographs.
Due to the lack of river flow data in the Coverdale catchment (monitoring by water@leeds
has only recently begun in one part of the catchment as part of a different project, and
there are only a few months of stage data to date), it is difficult to optimize the parameters
of the distributed TOPMODEL in this catchment. A nearby catchment in the Upper Ure
system, Snaizeholme Beck (54◦17’ N, 2◦15’ W), has a long-term flow record (2003-2014,
15-min interval), and was employed to optimize the parameter set of the catchment
hydrological model. Two 3-day periods were selected in summer as calibration and
validation periods in order to avoid confusion due snowmelt events, and the two periods
(i.e. [0:00 17th Aug 2012 - 23:59 19th Aug 2012] and [0:00 8th June 2011 - 23:59 10th June
2011]) contain the largest hourly rainfall intensities in the rainfall record. Each period had
288 time steps with 15-min intervals which matches the interval of rainfall and river flow
records.
A total of 20 testing runs of the model were operated through the calibration period to
identify a well-performing set of parameters (m = 14 mm, K = 100 m hr-1, kv = 30). There
was a good correspondence between simulated and observed flow in the calibration
period (the Nash-Sutcliffe efficiency is 0.88, see Figure 2.2). This parameter set was then
used to run the model in the validation period and the simulation corresponds well to the
observed flow with an efficiency of 0.82 (Figure 2.3). Thus the model performed well
against observed data.

8
Figure 2.2. Time series of observed and simulated runoff in the calibration period for thecatchment of Snaizeholme Beck.
Figure 2.3. Time series of observed and simulated runoff in the validation period for thecatchment of Snaizeholme Beck.

9
2.3 Results
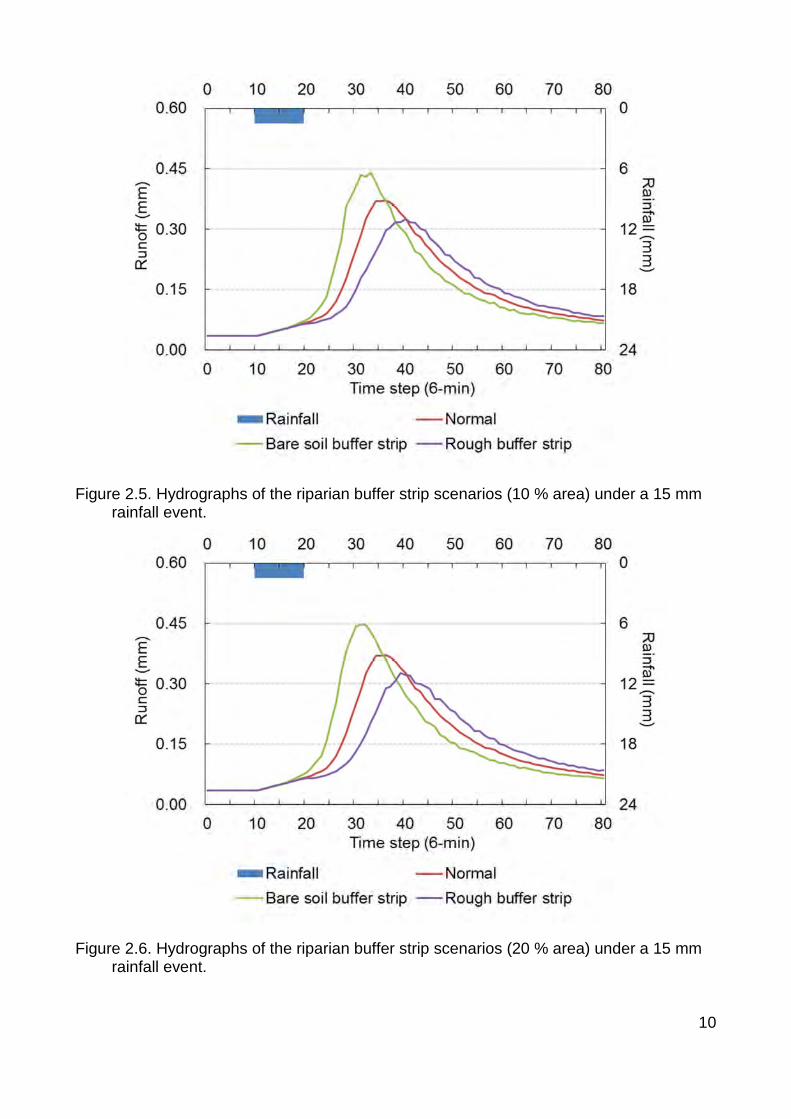
2.3.1 Riparian buffer areas
Cells with a cumulative upslope area of over 1.2 km2 were defined as river channels.
Riparian strips of theoretical bare soil and rough vegetation cover were placed parallel to
water courses as scenarios, covering either 10 % (thinner strips) or 20 % (thicker strips) of
the catchment area as shown in Figure 2.4.
Figure 2.4. Riparian buffer strips covering 10% and 20% of Coverdale.
The results of the modelling suggests that the bare soil strips give a higher flow peak and
reduce the delay to flow peak, while there is a reduction and delay in flood peak
associated with rough vegetation strips (Figures 2.5-2.10). Table 2.1 shows the change of
flow peak in each scenario compared to the current baseline (‘normal’) scenario.
10
Figure 2.5. Hydrographs of the riparian buffer strip scenarios (10 % area) under a 15 mmrainfall event.
Figure 2.6. Hydrographs of the riparian buffer strip scenarios (20 % area) under a 15 mmrainfall event.
11
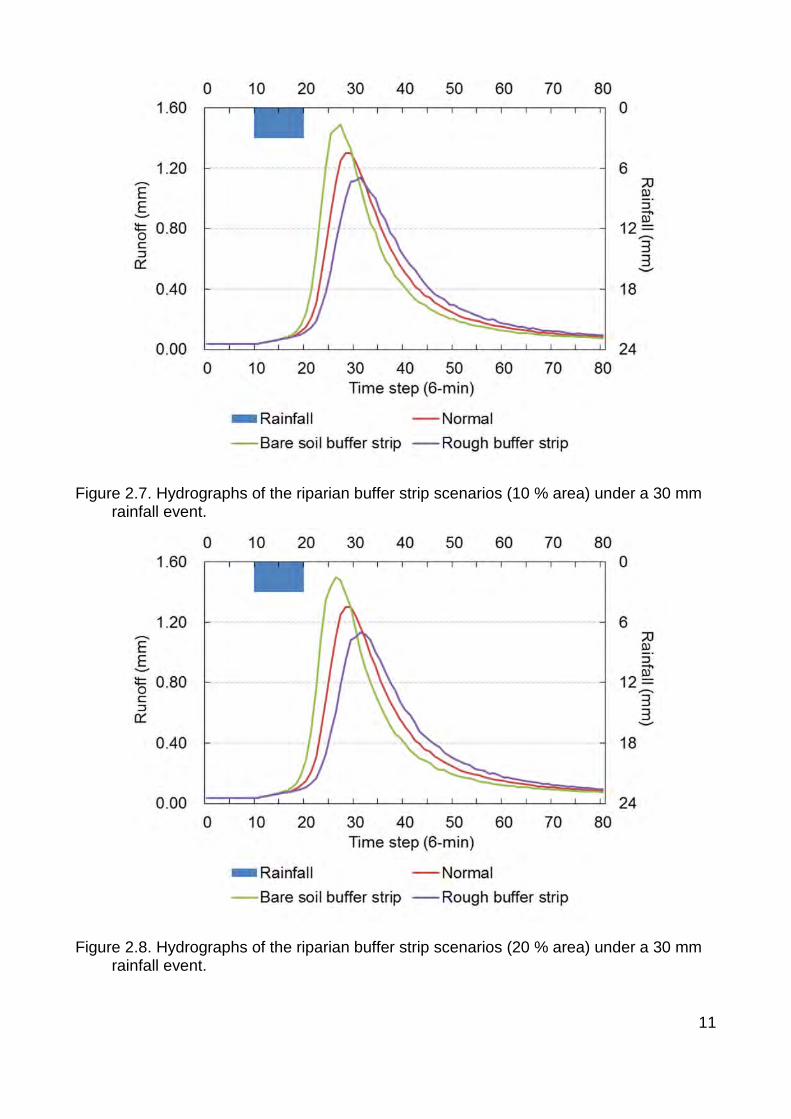
Figure 2.7. Hydrographs of the riparian buffer strip scenarios (10 % area) under a 30 mmrainfall event.
Figure 2.8. Hydrographs of the riparian buffer strip scenarios (20 % area) under a 30 mmrainfall event.

12
Figure 2.9. Hydrographs of the riparian buffer strip scenarios (10 % area) under a 150 mmrainfall event.
Figure 2.10. Hydrographs of the riparian buffer strip scenarios (20 % area) under a 150mm rainfall event.

13
Table 2.1. Modelling comparison of riparian buffer strip scenarios.
Land cover scenario
Peak flow change compared normalPeak delaycompared tonormal(time step)Absolute change Relative
change(mm/6min) (m3/s)
15-mmrainfallevent
10% area
Bare soil 0.070 16.33 18.9 % 3
Roughvegetation
-0.046 -10.73 -12.4 % -4
20% area
Bare soil 0.076 17.73 20.5 % 5
Roughvegetation
-0.044 -10.27 -11.9 % -3
30-mmrainfallevent
10% area
Bare soil 0.19 44.32 14.6 % 1
Roughvegetation
-0.16 -37.33 -12.3 % -3
20% area
Bare soil 0.20 46.65 15.4 % 2
Roughvegetation
-0.17 -39.66 -13.1 % -3
These results indicate that loss of vegetation in riparian areas of the Coverdale catchment
may increase the flood risk substantially. Conversely, vegetation regeneration with dense
cover to slow flows of water in those areas would have a considerable effect on flood
attenuation. Importantly, from a management perspective, it is almost as good to have a
buffer zone that covers 10 % of the catchment area as it is to have one that covers 20% of
the catchment area. Therefore, efficiency savings can be made by investing in narrower
buffer zones that cover a longer length of stream channels. There was a slight decline in
the relative effects of the vegetation change on flood peak for each scenario when the
storm event increased from 15 mm to 30 mm. For the massive 150 mm event (Figures 2.9
and 2.10), there is a convergence of flood peaks at about the same level suggesting that,
for the very extreme events, land cover would not affect the magnitude of the flow peak.
However, even here the bare soil scenarios have early rising limbs in hydrographs, while
delayed rising limbs can be seen in rough vegetation scenarios.
2.3.2 ELS and HLS areas
There is 24.4 km2 of land under Entry Level Stewardship (ELS) and 42.6 km2 under Higher
Level Stewardship (HLS) in the Coverdale catchment. Grazing in these areas may
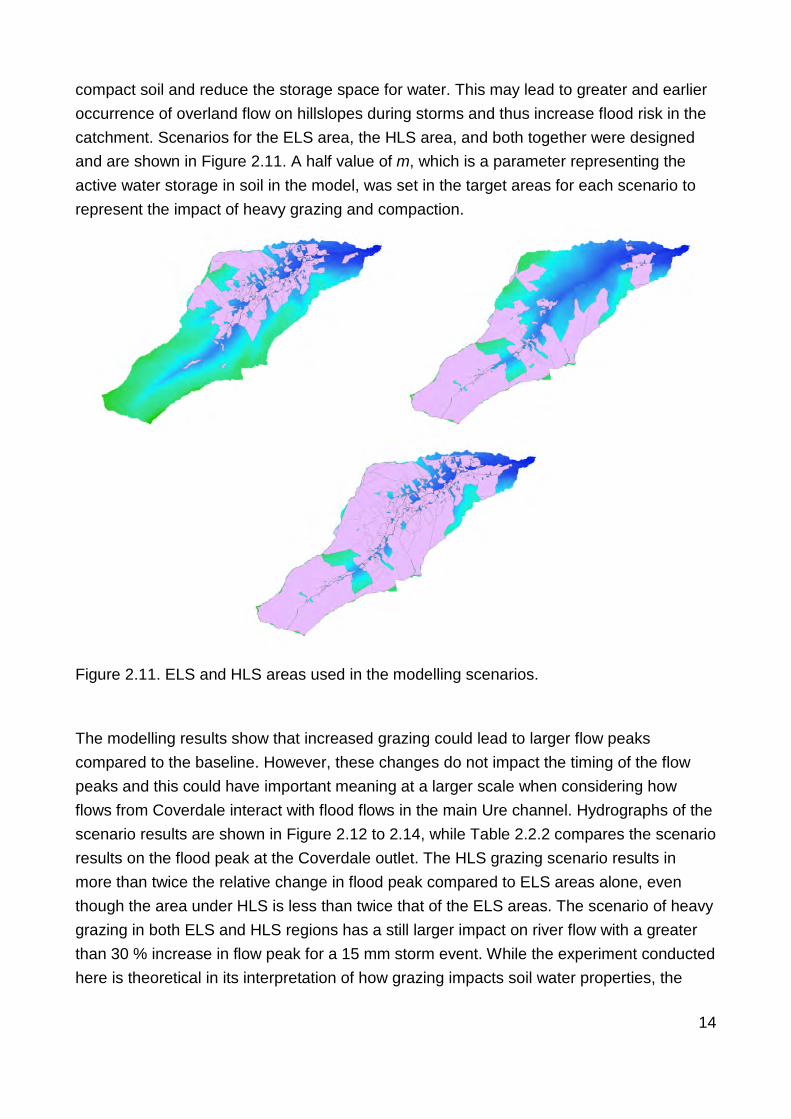
14
compact soil and reduce the storage space for water. This may lead to greater and earlier
occurrence of overland flow on hillslopes during storms and thus increase flood risk in the
catchment. Scenarios for the ELS area, the HLS area, and both together were designed
and are shown in Figure 2.11. A half value of m, which is a parameter representing the
active water storage in soil in the model, was set in the target areas for each scenario to
represent the impact of heavy grazing and compaction.
Figure 2.11. ELS and HLS areas used in the modelling scenarios.
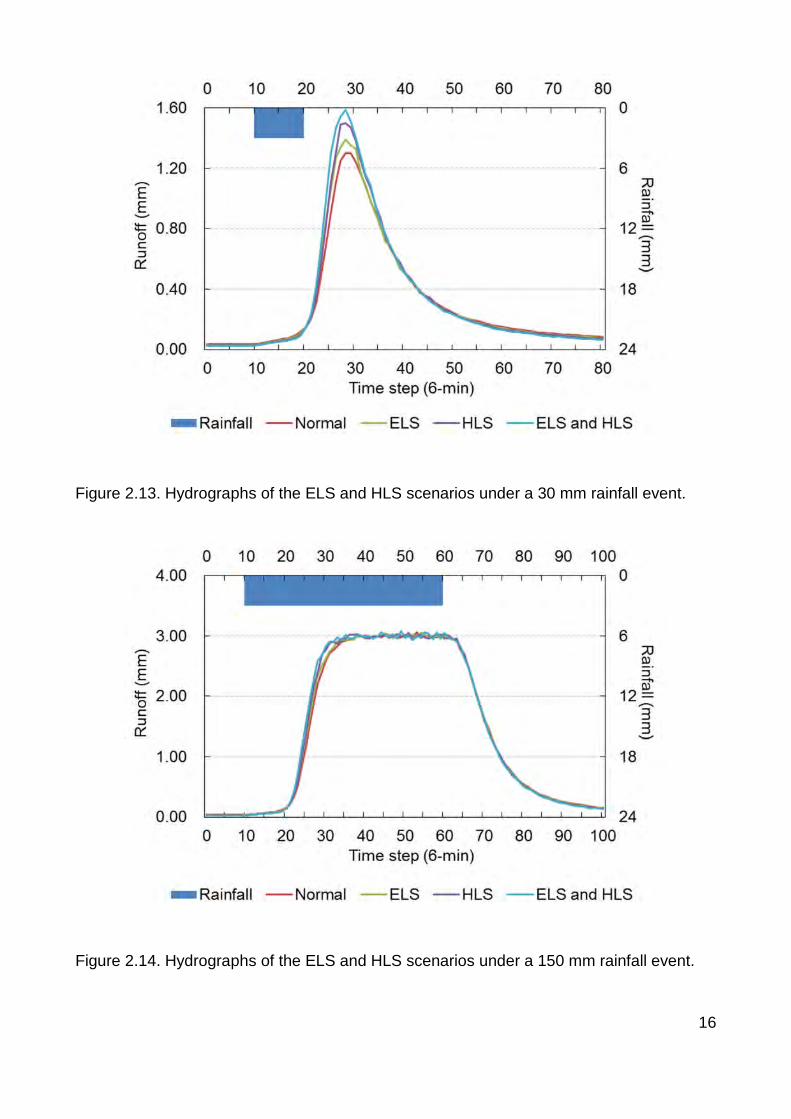
The modelling results show that increased grazing could lead to larger flow peaks
compared to the baseline. However, these changes do not impact the timing of the flow
peaks and this could have important meaning at a larger scale when considering how
flows from Coverdale interact with flood flows in the main Ure channel. Hydrographs of the
scenario results are shown in Figure 2.12 to 2.14, while Table 2.2.2 compares the scenario
results on the flood peak at the Coverdale outlet. The HLS grazing scenario results in
more than twice the relative change in flood peak compared to ELS areas alone, even
though the area under HLS is less than twice that of the ELS areas. The scenario of heavy
grazing in both ELS and HLS regions has a still larger impact on river flow with a greater
than 30 % increase in flow peak for a 15 mm storm event. While the experiment conducted
here is theoretical in its interpretation of how grazing impacts soil water properties, the

15
message is very clear: Any changes in land management in the ELS or HLS areas that
could reduce compaction and increase soil water storage and flow through the soil (rather
than as overland flow) have the potential to significantly reduce flood peaks in Coverdale.
In Coverdale, the areas under HLS appear to be more sensitive to such changes than
those under ELS. In other words, the flood benefits could be greater from encouraging
change in HLS areas than the same change in the ELS areas of this catchment, but that is
not to say that the potential effects of ELS change would not also be large.
Figure 2.12. Hydrographs of the ELS and HLS scenarios under a 15 mm rainfall event.
16
Figure 2.13. Hydrographs of the ELS and HLS scenarios under a 30 mm rainfall event.
Figure 2.14. Hydrographs of the ELS and HLS scenarios under a 150 mm rainfall event.
17
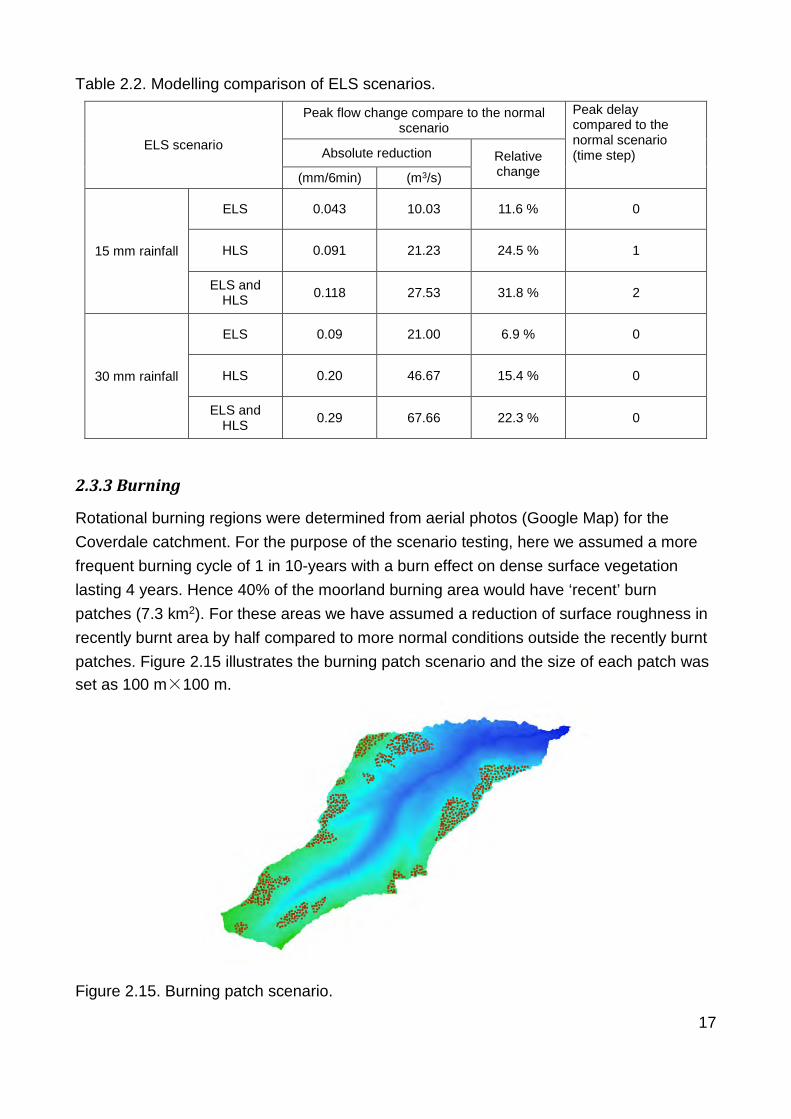
Table 2.2. Modelling comparison of ELS scenarios.
ELS scenario
Peak flow change compare to the normalscenario
Peak delaycompared to thenormal scenario(time step)Absolute reduction Relative
change(mm/6min) (m3/s)
15 mm rainfall
ELS 0.043 10.03 11.6 % 0
HLS 0.091 21.23 24.5 % 1
ELS andHLS
0.118 27.53 31.8 % 2
30 mm rainfall
ELS 0.09 21.00 6.9 % 0
HLS 0.20 46.67 15.4 % 0
ELS andHLS
0.29 67.66 22.3 % 0
2.3.3 Burning
Rotational burning regions were determined from aerial photos (Google Map) for the
Coverdale catchment. For the purpose of the scenario testing, here we assumed a more
frequent burning cycle of 1 in 10-years with a burn effect on dense surface vegetation
lasting 4 years. Hence 40% of the moorland burning area would have ‘recent’ burn
patches (7.3 km2). For these areas we have assumed a reduction of surface roughness in
recently burnt area by half compared to more normal conditions outside the recently burnt
patches. Figure 2.15 illustrates the burning patch scenario and the size of each patch was
set as 100 m×100 m.
Figure 2.15. Burning patch scenario.

18
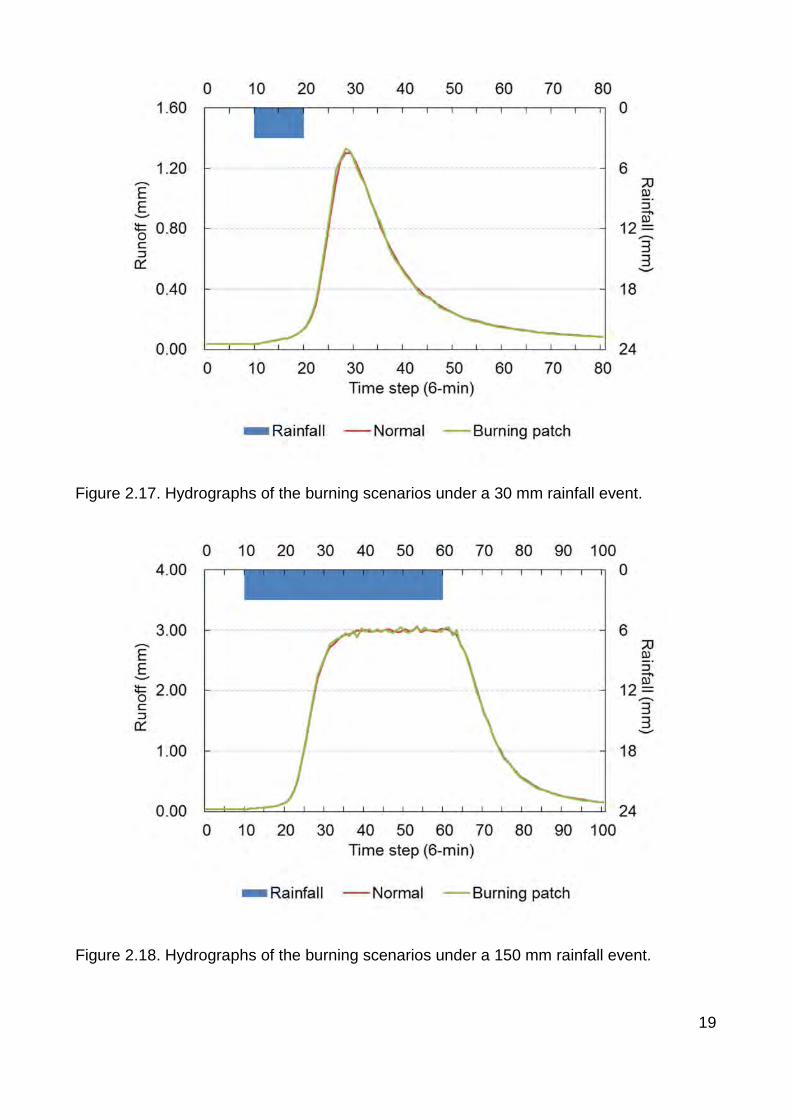
The modelling results show that having burning patches gives higher flow peaks under
every rainfall event we tested. The results of the scenario runs are shown in Figure 2.16 to
2.18 with a summary comparison presented in Table 2.3.
Figure 2.16. Hydrographs of the burning scenarios under a 15 mm rainfall event.
19
Figure 2.17. Hydrographs of the burning scenarios under a 30 mm rainfall event.
Figure 2.18. Hydrographs of the burning scenarios under a 150 mm rainfall event.

20
Table 2.3. Modelling comparison of rotational burning scenarios.
Burning scenario
Peak flow change compare to the normalscenario
Peak delaycompared to thenormal scenario(time step)Absolute reduction Relative
change(mm/6min) (m3/s)
15 mm rainfall 0.011 2.57 3.0 % 0
30 mm rainfall 0.03 7.00 2.3 % 0
The total area of the Coverdale catchment under recent burning in our scenario was 8.7 %
with these areas being concentrated in the headwaters where the moorland is more
extensive. In Coverdale, the relative effect of such moorland burn patches on flood peaks
appears to be a lot smaller than for the role of riparian vegetation for a similar proportion of
the catchment under consideration (i.e. 10 % of the catchment was tested under the
riparian buffer strip scenarios). We conclude that the impact on flood peaks in Coverdale
of reducing burn frequency or ‘stopping’ burning would be relatively small, although
potentially still important (e.g. reduced peak by 7 m3 s-1 in a 30 mm rainfall event).
However, we suggest that the result may be different in other catchments with a different
spatial configuration of moorland burning and that if the burning area extended to
downslope areas closer to main channels it would be expected to have a greater impact
on river flow.
2.3.4 Bare peat restoration scenarios
We consider the case of what might happen if we revegetate the areas of bare peat that
exist in the Coverdale catchment. The bare areas were digitized (approximately) using
aerial photos of the catchment from Google Map (a more accurate bare soil distribution
map would need a UAV or field survey). Most bare areas are concentrated in the peaty
headwaters and they cover 5.8 % of the catchment (Figure 2.19). To explicitly evaluate the
impact of bare soil restoration on river flow, a scenario with all bare soil areas and a
scenario representing revegetating all these areas were simulated to see the differences in
hydrographs before and after revegetation.

21
Figure 2.19. General locations of bare soil areas in the Coverdale catchment.
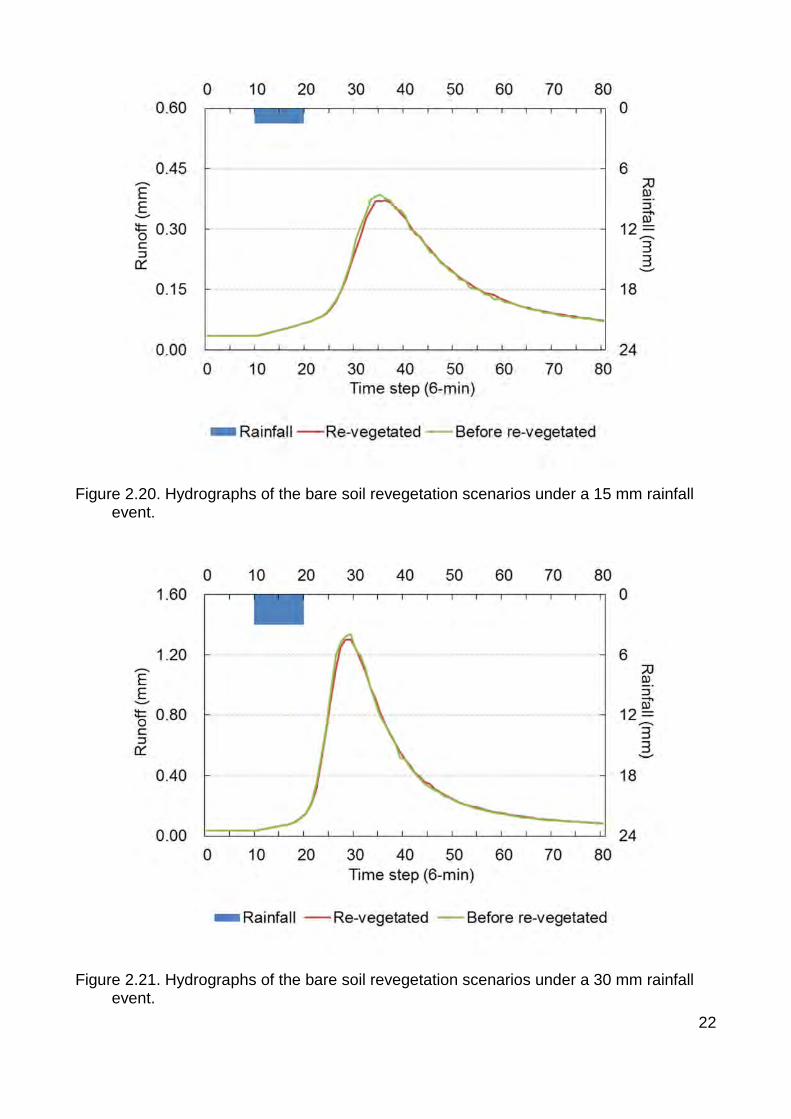
Revegetation of bare areas would decrease river flow peak and postpone the start of the
rising limb of the flow peak but the overall time to peak would not be delayed (see Figure
2.20 to 2.22 for the different hydrographs). Table 2.4 provides a comparison of the bare
soil revegetation scenario results. As rainfall intensity increases, the relative change in the
flood peak caused by revegetation decreases. However, the absolute change in flood peak
becomes greater, meaning that revegetating bare soil has a greater absolute effect in
reducing the flow peaks under heavier and rarer rainfall events.
22
Figure 2.20. Hydrographs of the bare soil revegetation scenarios under a 15 mm rainfallevent.
Figure 2.21. Hydrographs of the bare soil revegetation scenarios under a 30 mm rainfallevent.

23
Figure 2.22. Hydrographs of the bare soil revegetation scenarios under a 150 mm rainfallevent.
Table 2.4. Modelling comparison of bare soil revegetation scenarios.
Revegetation scenario
Peak flow change compare to the normalscenario
Peak delaycompared to thenormal scenario(time step)Absolute reduction Relative
change(mm/6min) (m3/s)
15 mm rainfall 0.015 3.50 4.04 % 0
30 mm rainfall 0.04 9.33 3.08 % 0
2.4 Conclusions and recommendations from the flood modelling
To evaluate the impact of potential land-management activities on flood peaks in the
Coverdale catchment, scenario modelling was conducted under a series of rainfall events
using the distributed TOPMODEL. The main conclusions are as follows:
Changes in the land cover in riparian zones have the potential to make very large
differences to flood peaks emerging from Coverdale. Stripping vegetation from
10 % of the catchment area along riparian areas could increase peak flows by
24
19 %. Placing denser vegetation in these areas could potentially reduce flood peaks
by 12 % during a 15 mm per hour rainfall event.
It is almost as good to have stream corridor buffer zones that cover 10 % of the
catchment area as it is to have wider buffer zones that cumulatively cover 20 % of
the catchment area. Therefore, efficiency savings can be made by investing in
narrower buffer zones that cover a longer length adjacent to stream channels.
Heavy grazing in ELS and HLS areas might greatly increase flood risk in the
Coverdale catchment. The combined impact of ELS and HLS change could be as
great as 32 % during a 15 mm per hour storm event. The impact on the flood peak
of such changes in HLS areas alone would be 25 %.
Any changes in land management in the ELS or HLS areas that could reduce
compaction and increase soil water storage and flow through the soil (rather than as
overland flow) have the potential to significantly reduce flood peaks in Coverdale.
The areas under HLS appear to be more sensitive to such changes than those
under ELS but that is not to say that the potential effects of ELS change would not
also be large.
Areas associated with bare peat cover around 5.8 % of Coverdale. Revegetation of
this bare peat in the headwaters of Coverdale could reduce peak flow by over 4 %
and 3 % respectively for either 15 mm or 30 mm per hour rainfall events.
In a very extreme storm event (150 mm in 5 hours), the proportional impact of land-
cover interventions on flood magnitude in Coverdale is likely to be small. However,
there will still be impacts on the timing of the rising and falling limbs of the
hydrographs which may be important for the overall flood peak in the Ure but this
will depend on the synchronicity of flood peaks from all the different tributaries down
the main Ure channel. For an extreme 150 mm event for the bare soil, enhanced
grazing and more frequent moorland burning scenarios tested, there would be
earlier rising and falling limbs of the flood hydrograph than is currently the case,
while delayed rising and falling limbs would occur if there was revegetation of bare
areas and enhanced roughness (e.g. reduced grazing, less frequent burning,
creation of buffer zones).
The new distributed version of TOPMODEL was successfully applied to test
relevant scenarios of land-cover change to show how different spatial configurations
in the landscape can influence the flood peak. The work shows clear promise in
determining how spatially specific land management might affect flood peaks under
different types of rainfall events in the wider Ure catchment. Clearly, it would be
desirable to run the model across the whole of the Upper Ure to determine the full

25
scale of possible management intervention effects in different locations upon the
overall flood peak in the main river channel. It may be that some tributaries are
more or less sensitive than Coverdale to changes in surface cover and
management and it would be possible to evaluate where in the Upper Ure system
efforts ought to be focussed.
This work could involve:
Additional field campaigns to measure flow rates across major surface cover types
not already captured by existing data used in the model.
Inclusion of a wider range of surface cover change scenarios to be tested.
Inclusion of a wider range of soil types and drainage data.
Coupling the model to the streamflow models in the catchment.
Comparing land-cover change scenario impacts with potential impacts of other flood
reduction measures such as woody debris dams, water retention features etc.
26
3. Compaction study in Bishopdale
3.1 Objectives
The objective was to conduct a survey of parts of Bishopdale to measure soil compaction
to understand different levels of compaction in the system. Specifically the work was
commissioned to undertake:
A diffuse survey covering valley bottom, valley sides and upland parts of the
catchment.
A concentrated survey around areas of buffer zone implementation to test
differences between buffer zones of different ages and non-buffer zone areas.
Compaction results in greater bulk density and reduced soil pore space. Compaction is
known to affect soil flora and fauna, including plant community composition and diversity in
grasslands (Godefroid and Koedam, 2004; Defra, 2007), may negatively impact water
quality in relation to loss of applied nutrients and agrochemicals, and may also negatively
impact some species of birds (Defra, 2007). There is some evidence of upland soil
compaction impacts on flood risk (Meyles et al., 2006; Zhao, 2007), although there has
been little work at the catchment scale to evaluate such effects (O’Connell et al., 2007; but
see section 2 above for new evidence from Coverdale). Despite the potential effects of
compaction outlined above, data on soil compaction are very scarce, particularly in the
uplands.
3.2 Study site and methodology
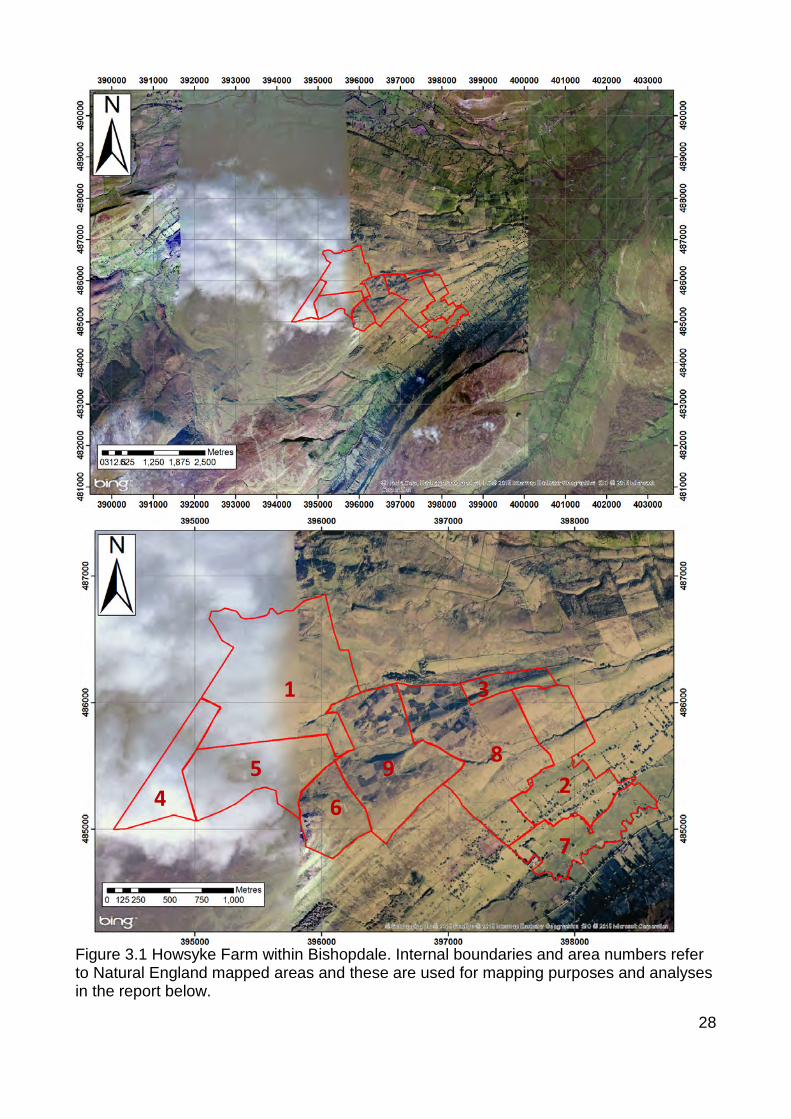
Howsyke Farm (Figure 3.1) was selected for the study as a large land-holding where
permissions had been agreed for us to undertake the work. The site covers 4.6 km2 and
ranges in altitude from 550 to 174 m. Nine zones are shown in Figure 3.1 which relate to
Natural England (2010) Environmental Stewardship Scheme index map codes for the
farm. This numeric coding is used throughout this report to refer to different parts of the
system. Howskye is dominated by organic and organo-mineral soils (Table 3.1) with
blanket peat being dominant in zone 9 with some coverage over areas 6 and 7. Peaty soils
(such as humic rankers) dominate in zones 1, 4, 5 and 6 while gleys (with a peaty surface
layer) dominate in zones 3 and 8. At the lower end of the site, adjacent to the main water
course, some narrow buffer strips have been installed, excluding sheep and encouraging
grass and shrub growth. Four of these areas were installed on the site being 1, 2, 3 and 5
years old respectively. Of these buffer strips, the 1, 2 and 3-yr strips are quite narrow (with
1 and 3-yr strips being rather small in total area), while the 5-yr strip is wider (see Figure
3.12).

27
Three types of measurement were made across the study site: soil resistance (i.e.
compaction), soil moisture and the geo-referenced sampling location. Sampling was
generally conducted in a grid format across the site with 1201 compaction measurements
making this one of the richest studies of surface soil compaction in the UK to date.
Sampling was densest in valley side and bottom areas where grazing was concentrated
while the peat was sampled less intensively. The buffer strips were each sampled,
although as the yr-1 buffer strip was very small indeed, the results are shown but they
were not included in statistical analysis which aimed to test whether the buffer strips
resulted in reduced compaction. As the buffer strips are of different sizes, a different
number of samples were obtained from each so that the density of sampling was about the
same in each case. To aid statistical analysis a control area without fencing, but adjacent
to the buffer strips with similar soil and slope setting was sampled with the same density
as the buffer strips.
Soil surface compaction was measured using a Van Walt penetrometer. Two readings
were taken at each point. If the values were within 10 % of each other (i.e. lowest value
was at least 0.9 times the highest value) then the mean of those values was taken. If the
values were more than 10 % different then a third reading was taken and the median value
was used for that point. Readings were not taken when the sampling point hit a large
stone. The final values of compaction for each sampling point are provided in the
accompanying excel spreadsheet with GPS location points. These data provide an
excellent baseline by which change over time can be determined in future years.
Soil moisture was measured to aid interpretation of the compaction sampling and in case
there were large differences between sampling days. However, as the sampling was
carried out in February and March 2015 then the soil moisture was consistent from day to
day and so a correction factor was not applied to the compaction data. A time domain
reflectrometry (TDR) probe was used to measure soil moisture in the field. Data from the
probe were checked against laboratory soil moisture tests (oven mass loss) resulting in a
strong and robust calibration equation. A hand-held GPS was used to record the location
of each sampling point. These are accurate to +/- 4 m in the x and y co-ordinates.
28
Figure 3.1 Howsyke Farm within Bishopdale. Internal boundaries and area numbers referto Natural England mapped areas and these are used for mapping purposes and analysesin the report below.
1
2
3
45
6
7
89
29
Table 3.1 Proportion of each zone on Howsyke covered by different soil types
% of zone covered by soil typeHowsyke Farmzone
Total area,km2
Humicranker
Brownalluvial soil
Brownearth
Stagnogley
Stagnohumicgley
Blanketpeat
1 1.076 55.9 0.0 0.0 0.0 42.7 1.4
2 0.536 0.0 13.4 53.6 32.9 0.0 0.0
3 0.106 0.0 0.0 0.0 100.0 0.0 0.0
4 0.291 99.2 0.0 0.0 0.0 0.0 0.8
5 0.509 69.3 0.0 0.0 0.0 10.1 20.5
6 0.273 56.2 0.0 0.0 1.7 0.8 41.3
7 0.320 0.0 79.3 20.7 0.0 0.0 0.0
8 0.813 0.0 0.0 22.4 61.2 7.1 9.3
9 0.666 0.0 0.0 0.0 18.5 16.4 65.1
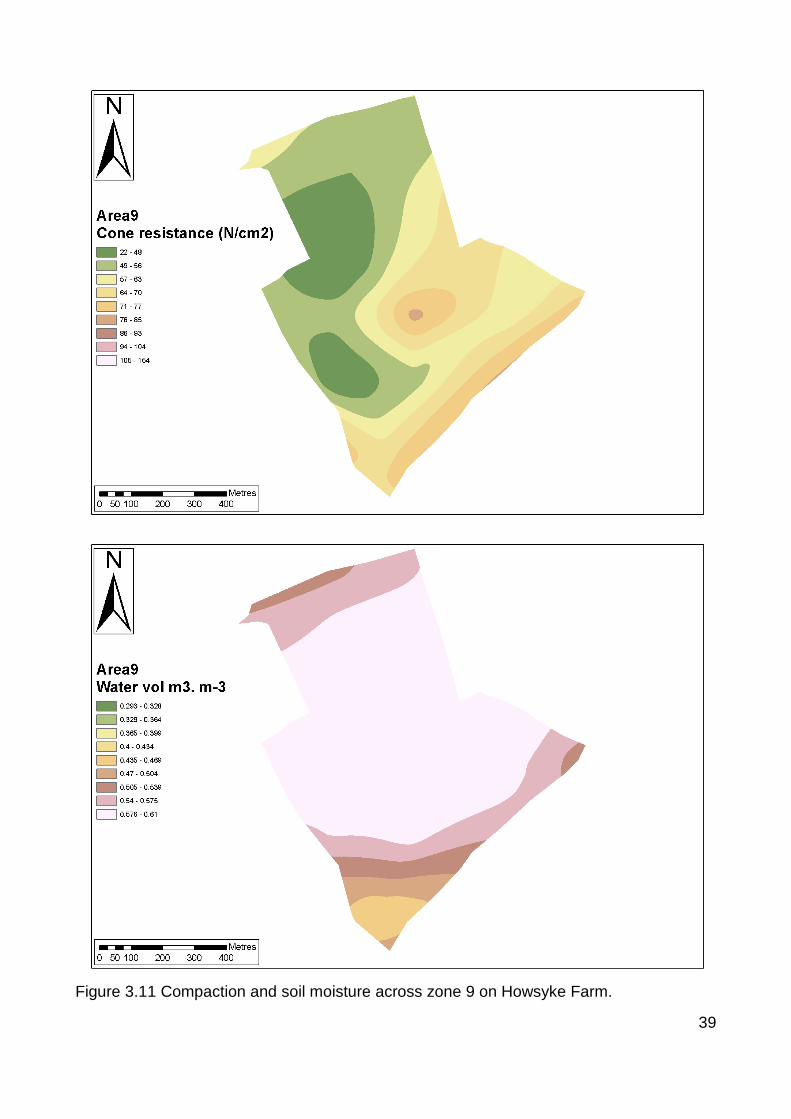
3.3 Results
Surface compaction varied from 5 to 158 N m-2. The spatial distribution of compaction is
shown in Figure 3.2 for the whole area. As would be expected the least compacted areas
correspond with locations of blanket peat, and these are also the areas with highest
moisture content. The zones of high compaction were found on the central and
southwestern parts of zone 8, parts of zone 7 and zones 1 and 5. These maps should
allow managers to focus soil remediation efforts in those locations with high compaction.
Maps for each zone are shown in Figures 3.3 to 3.11. Summary data for each zone is
shown in Table 3.2. However, as some zones have areas of both high and low compaction
averages can mask the fact that there are concentrated areas with high compaction within
some of the farm zones.
Table 3.2 Summary compaction statistics for each zone on Howsyke Farm, N m-2 (notincluding buffer zones)
Zone n Median Max Min Interquartile range
1 15 80 102 44 20
2 178 62 158 32 23
3 31 74 100 22 47
4 49 68 113 38 26
5 13 70 108 50 20
6 5 64 100 50 19
7 679 54 132 28 20
8 11 72 124 36 26
9 8 52 80 36 15

30
Figure 3.2 Compaction and soil moisture across Howsyke Farm, February-March 2015

31
Figure 3.3 Compaction and soil moisture across zone 1 on Howsyke Farm.

32
Figure 3.4 Compaction and soil moisture across zone 2 on Howsyke Farm.

33
Figure 3.5 Compaction and soil moisture across zone 3 on Howsyke Farm.

34
Figure 3.6 Compaction and soil moisture across zone 4 on Howsyke Farm.

35
Figure 3.7 Compaction and soil moisture across zone 5 on Howsyke Farm.
36
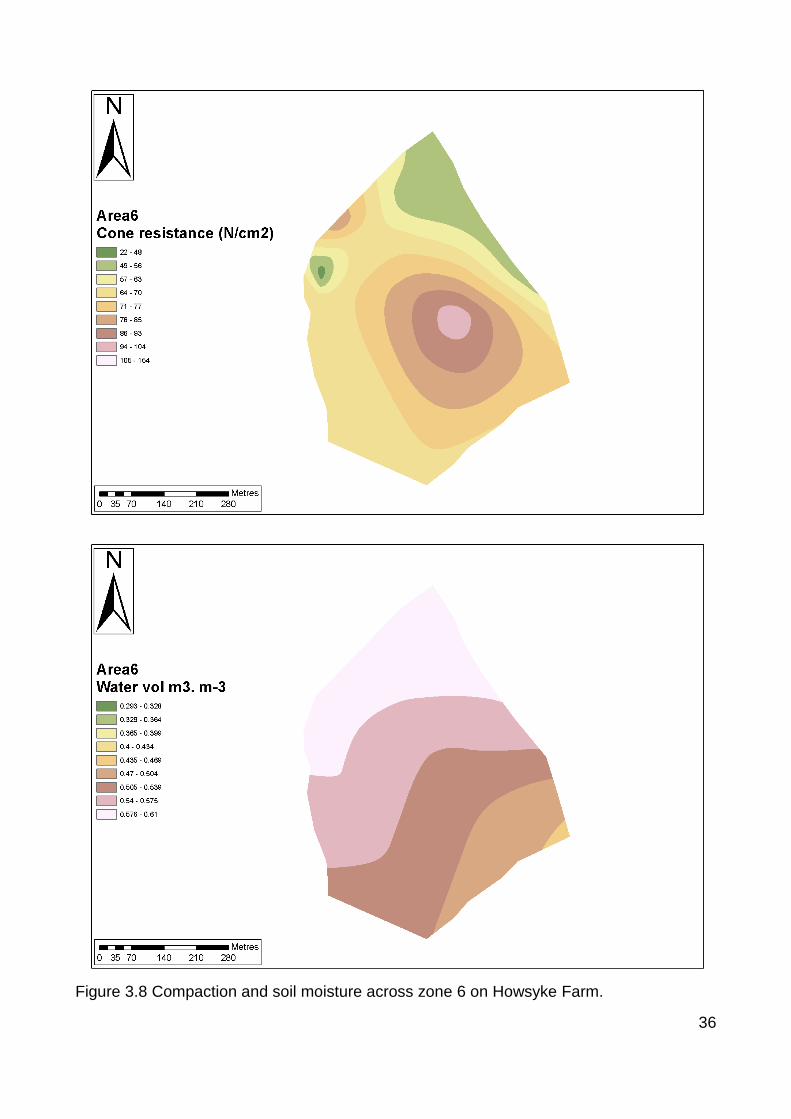
Figure 3.8 Compaction and soil moisture across zone 6 on Howsyke Farm.

37
Figure 3.9 Compaction and soil moisture across zone 7 on Howsyke Farm.
38
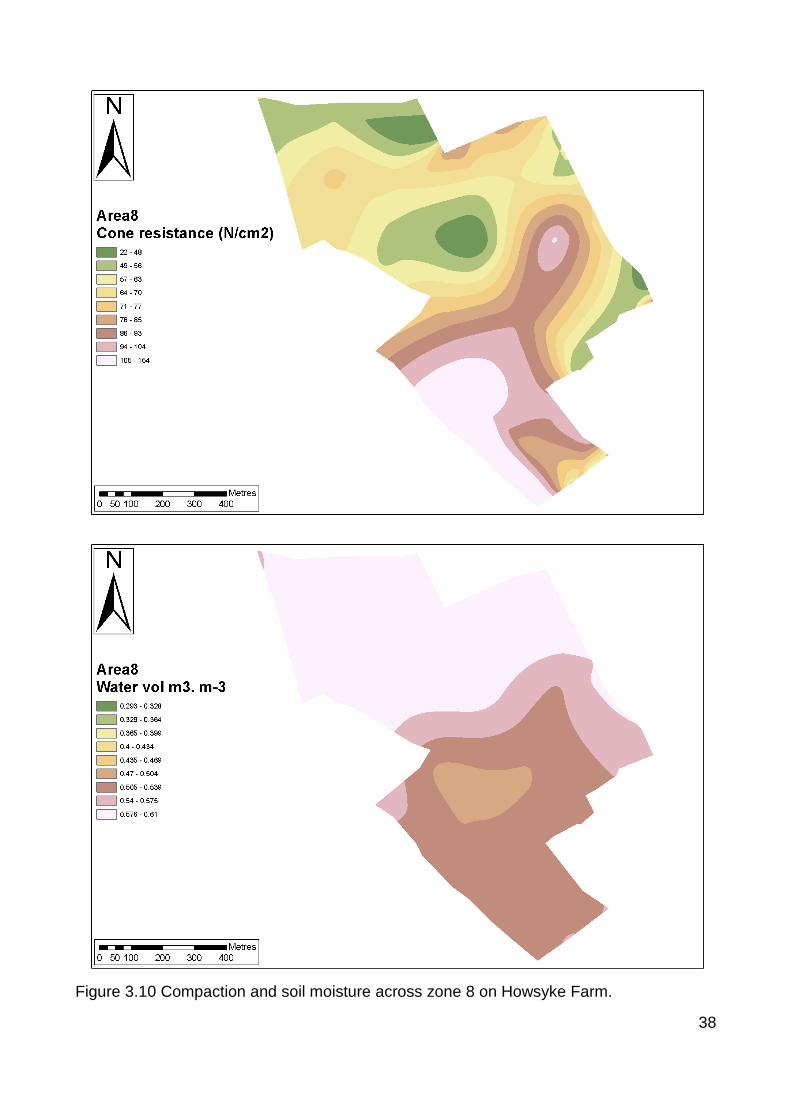
Figure 3.10 Compaction and soil moisture across zone 8 on Howsyke Farm.
39
Figure 3.11 Compaction and soil moisture across zone 9 on Howsyke Farm.
40
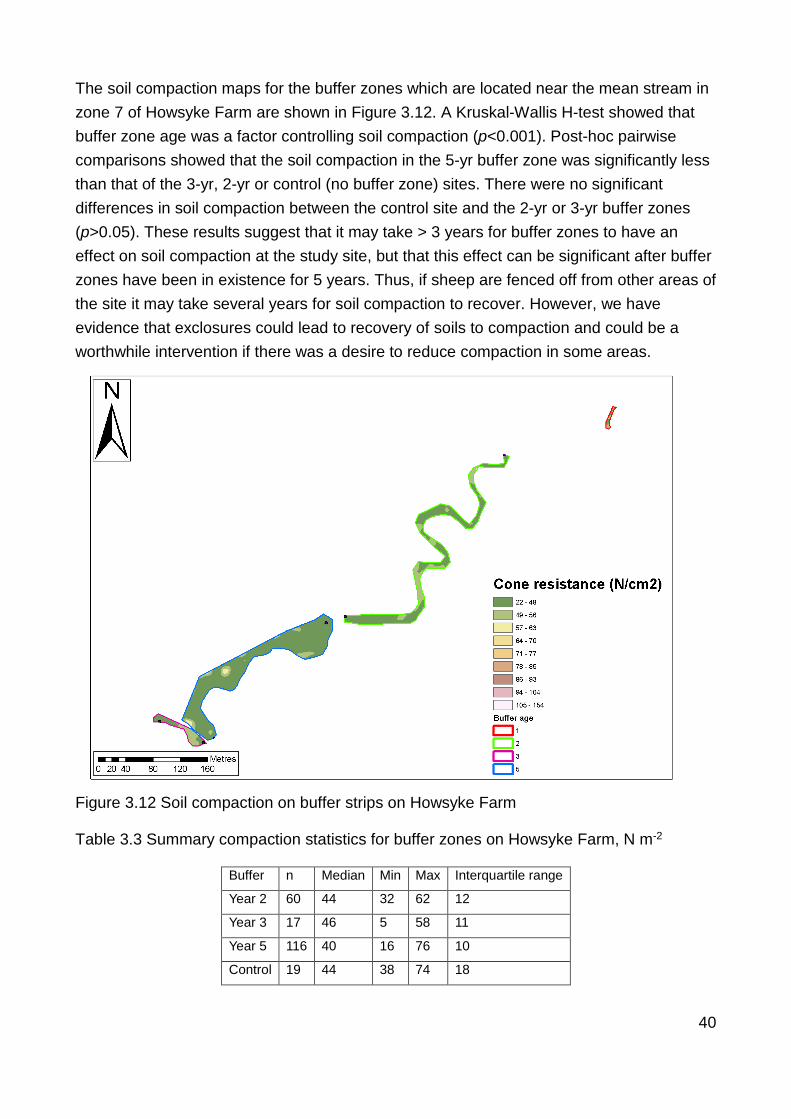
The soil compaction maps for the buffer zones which are located near the mean stream in
zone 7 of Howsyke Farm are shown in Figure 3.12. A Kruskal-Wallis H-test showed that
buffer zone age was a factor controlling soil compaction (p<0.001). Post-hoc pairwise
comparisons showed that the soil compaction in the 5-yr buffer zone was significantly less
than that of the 3-yr, 2-yr or control (no buffer zone) sites. There were no significant
differences in soil compaction between the control site and the 2-yr or 3-yr buffer zones
(p>0.05). These results suggest that it may take > 3 years for buffer zones to have an
effect on soil compaction at the study site, but that this effect can be significant after buffer
zones have been in existence for 5 years. Thus, if sheep are fenced off from other areas of
the site it may take several years for soil compaction to recover. However, we have
evidence that exclosures could lead to recovery of soils to compaction and could be a
worthwhile intervention if there was a desire to reduce compaction in some areas.
Figure 3.12 Soil compaction on buffer strips on Howsyke Farm
Table 3.3 Summary compaction statistics for buffer zones on Howsyke Farm, N m-2
Buffer n Median Min Max Interquartile range
Year 2 60 44 32 62 12
Year 3 17 46 5 58 11
Year 5 116 40 16 76 10
Control 19 44 38 74 18
41
3.4 Conclusions and recommendations from compaction surveys
This report provides one of the few studies of soil compaction that exists for the UK
uplands.
There are areas of high compaction (e.g. >100 N m-2 of soil resistance) across
some of the slopes on the study site in Bishopdale and these have been mapped.
After 5 years, the exclosure zones near the main stream channel had significantly
lower soil compaction than areas without exclosure, or areas that had been in
exclosure status for 2 or 3 years. Thus, the use of such measures may reduce
compaction in some areas of the study site after several years.
Data collected in this survey provide an essential baseline against which future
change through management interventions can be evaluated.
A compaction survey provides a cost-effective way of showing locations in the
upper Ure system where there may be compaction problems. This is because it
does not require costly lab analysis which may be required for other soil measures
such as bulk density. It is therefore recommended that such surveys are rolled out
across other areas of interest in the Upper Ure.
Combining results from the compaction surveys with the use of TOPMODEL would
also be highly useful in showing what impact different spatial hotspots of
compaction may have on the flood peak. As TOPMODEL results demonstrated for
Coverdale, changes in grazing intensity that increase or reduce soil compaction can
greatly affect the flood peak at the catchment outlet. Therefore, by combining
compaction data with hydrological modelling it would be possible to show which
compaction zones may be having the largest impact on flood peaks in the Ure
system and therefore which ones should be prioritised for interventions to reduce
compaction.
Acknowledgements
We thank Daniel Turner of the Yorkshire Dales Rivers Trust for provision of information
and land-access arrangements in Bishopdale. We thank Robert Brown of Howsyke Farm
for kindly allowing land access for the compaction survey and Stuart Dent for supporting
the access arrangements. We thank Karen Scott, David Ashley, Sarah Hunt, Robert
Peachey, Michael Dorrington, Shengmiao Jiang, Rudi Barker and Olivia Desmond for
undertaking the field surveys.

42
References
Defra (2007) Scoping study to assess soil compaction affecting upland and lowlandgrassland in England and Wales. Final report, BD2304, Cranfield University.
Gao J, Holden J, Kirkby MJ. (2015). A distributed TOPMODEL for modelling impacts ofland-cover change on river flow in upland peatland catchments. HydrologicalProcesses. DOI: 10.1002/hyp.10408.
Godefroid S, Koedam N. (2004) Interspecific variation in soil compaction sensitivity amongforest floor species. Biological Conservation 119, 207-217.
Meyles EW, Williams AG, Ternan JL, Anderson JM, Dowd JF. (2006). The influence ofgrazing on vegetation, soil properties and stream discharge in a small Dartmoorcatchment, southwest England, UK. Earth Surface Processes and Landforms 31,622-631.
Natural England (2010) Environmental Stewardship Scheme index map, Howsyke Farm,application AG00302894.
O'Connell E, Ewen J, O'Donnell G, Quinn P. (2007) Is there a link between agriculturalland-use management and flooding? Hydrology and Earth Systems Sciences 11,96-107.
Zhao Y. (2007) Livestock impacts on hydrological connectivity. PhD thesis, University ofLeeds, Leeds.
Appendix
An Excel spreadsheet has been provided showing sample locations and compaction
values for the Bishopdale survey