flood-inundation maps for the leaf river at hattiesburg ... · flood-inundation maps for the leaf...
TRANSCRIPT
Prepared in cooperation with the City of Hattiesburg, City of Petal, Forrest County, Mississippi Emergency Management Agency, Mississippi Department of Homeland Security, and the Emergency Management District
Flood-Inundation Maps for the Leaf River at Hattiesburg, Mississippi
Pamphlet to accompany Scientific Investigations Map 3228
U.S. Department of the InteriorU.S. Geological Survey

Cover. Left, photograph looking downstream at the Leaf River at State Highway 42 above Hattiesburg, Mississippi, April 25, 2012. Right, inundation map of Leaf River at Hattiesburg, Mississippi (02473000), at 34.0 feet gage datum (see Sheet 13 for details).

Flood-Inundation Maps for the Leaf River at Hattiesburg, Mississippi
By John B. Storm
Prepared in cooperation with the City of Hattiesburg, City of Petal, Forrest County, Mississippi Emergency Management Agency, Mississippi Department of Homeland Security, and the Emergency Management District
Pamphlet to accompany Scientific Investigations Map 3228
U.S. Department of the InteriorU.S. Geological Survey

U.S. Department of the InteriorKEN SALAZAR, Secretary
U.S. Geological SurveyMarcia K. McNutt, Director
U.S. Geological Survey, Reston, Virginia: 2012
For more information on the USGS—the Federal source for science about the Earth, its natural and living resources, natural hazards, and the environment, visit http://www.usgs.gov or call 1-888-ASK-USGS
For an overview of USGS information products, including maps, imagery, and publications, visit http://www.usgs.gov/pubprod
To order this and other USGS information products, visit http://store.usgs.gov
Any use of trade, product, or firm names is for descriptive purposes only and does not imply endorsement by the U.S. Government.
Although this report is in the public domain, permission must be secured from the individual copyright owners to reproduce any copyrighted materials contained within this report.
Suggested citation:Storm, J.B., 2012, Flood-inundation maps for the Leaf River at Hattiesburg, Mississippi: U.S. Geological Survey Scientific Investigations Map 3228, 8 p. pamphlet, 13 sheets; available online at http://pubs.usgs.gov/sim/3228/.

iii
Contents
Abstract ...........................................................................................................................................................1Introduction ....................................................................................................................................................2
Purpose and Scope ..............................................................................................................................2Study Area Description ........................................................................................................................4Previous Studies ..................................................................................................................................4
Constructing Water-Surface Profiles .........................................................................................................4Hydrologic and Steady-Flow Data .....................................................................................................4Topographic/Bathymetric Data ..........................................................................................................4Energy Loss Factors .............................................................................................................................5Model Calibration and Performance .................................................................................................5Development of Water-Surface Profiles ...........................................................................................6
Inundation Mapping ......................................................................................................................................6Leaf River, Hattiesburg, Mississippi, Flood-Inundation Maps on the Internet ...........................7Disclaimer for Flood-Inundation Maps .............................................................................................7Uncertainties and Limitations Regarding Use of Flood-Inundation Maps ..................................7
Summary..........................................................................................................................................................7References Cited............................................................................................................................................8
Figure 1. Map showing location of study reach for the Leaf River and location of U.S.
Geological Survey streamgage and National Weather Service forecast site ...................3
Tables 1. Site information for the U.S. Geological Survey streamgage in the
Leaf River basin at Hattiesburg, Mississippi ............................................................................2 2. Estimates of peak discharge for a 1.0-percent annual exceedance probability
for selected locations on the Leaf River near Hattiesburg, Mississippi ..............................4 3. Comparison of hydraulic-model output and water-surface elevations at
the Leaf River at Hattiesburg, Mississippi, streamgage ........................................................5 4. Comparison of hydraulic-model output and surveyed high-water mark
elevations from the floods of April 1974 and March 2011 at the Leaf River at Hattiesburg, Mississippi, streamgage ..................................................................................5
5. Stages (and water-surface elevations) with corresponding discharge estimates for selected simulated water-surface profiles at the Leaf River at Hattiesburg, Mississippi, streamgage ..................................................................................6

iv
Sheets (Each sheet has individual pdf files available for download. For links, see http://pubs.usgs.gov/sim/3228/.)
1–13. Maps showing flood inundation for Hattiesburg, Mississippi, corresponding to a gage height and an elevation (NAVD 88) as listed below at U.S. Geological Survey streamgage Leaf River at Hattiesburg, MS (02473000)—
1. Gage height of 22.0 feet and an elevation of 140.18 feet
2. Gage height of 23.0 feet and an elevation of 141.18 feet
3. Gage height of 24.0 feet and an elevation of 142.18 feet
4. Gage height of 25.0 feet and an elevation of 143.18 feet
5. Gage height of 26.0 feet and an elevation of 144.18 feet
6. Gage height of 27.0 feet and an elevation of 145.18 feet
7. Gage height of 28.0 feet and an elevation of 146.18 feet
8. Gage height of 29.0 feet and an elevation of 147.18 feet
9. Gage height of 30.0 feet and an elevation of 148.18 feet
10. Gage height of 31.0 feet and an elevation of 149.18 feet
11. Gage height of 32.0 feet and an elevation of 150.18 feet
12. Gage height of 33.0 feet and an elevation of 151.18 feet
13. Gage height of 34.0 feet and an elevation of 152.18 feet

v
AbbreviationsAHPS Advanced Hydrologic Prediction Service
FEMA Federal Emergency Management Agency
FIS Flood Insurance Study
GIS geographic information system
LiDAR light detection and ranging
NWS National Weather Service
USGS U.S. Geological Survey
Conversion Factors and Datums
Multiply By To obtain
Length
inch 25.4 millimeter (mm)foot (ft) 0.3048 meter (m)mile (mi) 1.609 kilometer (km)
Area
square foot (ft2) 0.0929 square meter (m2)square mile (mi2) 2.590 square kilometer (km2)
Flow rate
cubic foot per second (ft3/s) 0.02832 cubic meter per second (m3/s)
Hydraulic gradient
foot per mile (ft/mi) 0.1894 meter per kilometer (m/km)
Vertical coordinate information is referenced to the North American Vertical Datum of 1988 (NAVD 88).Horizontal coordinate information is referenced to the North American Datum of 1983 (NAD 83).Elevation, as used in this report, refers to the distance above NAVD 88.Stage, as used in this report, is the height of the water surface above an arbitrary datum established at the gage (gage datum).
AcknowledgmentsThe author wishes to thank the Mississippi Department of Environmental Quality, which has cooperated in the funding for the operation and maintenance of the streamgage used for this study. Special thanks are given to the City of Hattiesburg, City of Petal, Forrest County, Mississippi Emergency Management Agency, Mississippi Department of Homeland Security, and the Emergency Management District for their cooperation in this study, and to the National Weather Service for their continued support to the USGS flood-inundation mapping initiative.


Flood-Inundation Maps for the Leaf River at Hattiesburg, Mississippi
By John B. Storm
AbstractDigital flood-inundation maps for a 1.7-mile reach
of the Leaf River were developed by the U.S. Geological Survey (USGS) in cooperation with the City of Hatties-burg, City of Petal, Forrest County, Mississippi Emergency Management Agency, Mississippi Department of Home-land Security, and the Emergency Management District. The Leaf River study reach extends from just upstream of the U.S. Highway 11 crossing to just downstream of East Hardy/South Main Street and separates the cities of Hattiesburg and Petal, Mississippi. The inundation maps, which can be accessed through the USGS Flood Inunda-tion Mapping Science Web site at http://water.usgs.gov/osw/flood_inundation/, depict estimates of the areal extent of flooding corresponding to selected water-surface elevations (stages) at the USGS streamgage at Leaf River at Hattiesburg, Mississippi (02473000). Current conditions at the USGS streamgage may be obtained through the National Water Information System Web site at http://waterdata.usgs.gov/ms/nwis/uv/?site_no=02473000&PARAmeter_cd=00065,00060. In addition, the information has been provided to the National Weather Service (NWS) for incorporation into their Advanced Hydrologic Prediction Service (AHPS) flood-warning system (http://water.weather.gov/ahps/). The NWS forecasts flood hydrographs at many places that are often collocated at
USGS streamgages. The forecasted peak-stage information, available on the AHPS Web site, may be used in conjunction with the maps developed in this study to show predicted areas of flood inundation.
In this study, flood profiles were computed for the stream reach by means of a one-dimensional step-backwater model. The model was calibrated using the most current stage-discharge relations at the Leaf River at Hattiesburg, Mississippi, streamgage and documented high-water marks from recent and historical floods. The hydraulic model was then used to determine 13 water-surface profiles for flood stages at 1.0-foot intervals referenced to the streamgage datum and ranging from bankfull to approximately the highest recorded water-surface elevation at the streamgage. The simulated water-surface profiles were then combined with a geographic information system digital elevation model [derived from Light Detection and Ranging (LiDAR) data having a 0.6-foot vertical accuracy and 9.84-foot horizontal resolution] in order to delineate the area flooded at each 1-foot increment of stream stage.
The availability of these maps, when combined with real-time stage information from USGS streamgages and forecasted stream stage from the NWS, provides emergency management personnel and residents with critical information during flood-response activities, such as evacuations and road closures, as well as for post-flood recovery efforts.

2 Flood-Inundation Maps for the Leaf River at Hattiesburg, Mississippi
Introduction The City of Hattiesburg is a medium-sized urban
community (4th largest city in Mississippi) with an esti-mated population of 45,989 (U.S. Bureau of Census, 2010). Hattiesburg, which is in Forrest County, has experienced severe flooding numerous times; most notably the four largest floods occurring during the past 100 years in 1920, 1921, 1961, and 1974. Damage costs unadjusted for infla-tion within the cities of Hattiesburg and Petal were reported to be $3.25 million for the 1961 flood (Wilson, 1964) and $8.3 million for the 1974 flood (U.S. Army Corps of Engi-neers, 1983). The majority of flood damages have occurred along the Leaf River and several tributaries (Bouie River, Gordon Creek), all of which flow through the city. Flood plains within Hattiesburg are moderately to highly developed and contain a mix of residential and commercial structures.
Prior to this study, city officials in Hattiesburg and Petal have relied on several information sources (all of which are available on the Internet) to make decisions on how to best alert the public and mitigate flood damages. One source is the Federal Emergency Management Agency (FEMA) Flood Insurance Study (FIS) for Forrest County (Federal Emergency Management Agency, 2010). A second source of information is the U.S. Geological Survey (USGS) streamgage Leaf River at Hattiesburg, Mississippi (MS) (02473000; table 1), from which current or historical water-surface elevations (stage) can be obtained. A third source is the National Weather Service (NWS) forecast of peak stage at the USGS streamgage through the Advanced Hydrologic Prediction Service (AHPS) Web site at http://water.weather.gov/ahps/.
Although USGS current stage and NWS forecast stage data are particularly useful for residents in the immediate vicinity of a streamgage, the data are of limited use to residents farther upstream or downstream because the water-surface elevation is not constant along the entire stream channel. Also, FEMA and State emergency management mitigation teams or property owners typically lack information related to water depth at locations other than near USGS streamgages or NWS flood-forecast points. To help guide the general public in taking individual safety precautions and provide local officials with a tool to help efficiently manage emergency flood operations and flood-mitigation efforts,
digital flood-inundation maps for a 1.7-mile (mi) reach of the Leaf River were developed by the USGS in cooperation with the City of Hattiesburg, City of Petal, Forrest County, Mississippi Emergency Management Agency, Mississippi Department of Homeland Security, and the Emergency Management District.
Purpose and Scope
The purpose of this report is to describe the develop-ment of a series of estimated flood-inundation maps for the Leaf River at Hattiesburg, MS. The maps and other useful flood information are available on the USGS Flood Inunda-tion Mapping Science Web site at http://water.usgs.gov/osw/flood_inundation/ and the previously mentioned NWS AHPS Web site. Internet users can select estimated inundation maps that correspond to (1) current stages at the USGS Leaf River at Hattiesburg streamgage (02437000), or (2) the NWS fore-casted peak stage.
The scope of the study was limited to a 1.7-mi reach of the Leaf River between U.S. Highway 11 and just down-stream of East Hardy/South Main Street (fig. 1). Tasks specific to development of the flood-inundation maps were (1) collection of topographic data and geometric data for bridges throughout the study reach, (2) determination of energy loss factors (roughness coefficients) in the stream channel and flood plain, (3) collection of steady-flow data (discharge rating) at the streamgaging station, (4) computation of water-surface profiles using HEC–RAS, a U.S. Army Corps of Engineers computer program (U.S. Army Corps of Engi-neers, Hydrologic Engineering Center, 2010), (5) production of estimated flood-inundation maps at various stream stages using HEC–GeoRAS, a U.S. Army Corps of Engineers computer program (U.S. Army Corps of Engineers, Hydro-logic Engineering Center, 2009), and a geographic information system (GIS), and (6) development of a Web site interface that links to USGS real-time streamgage information and NWS forecasted peak stage to facilitate the display of user-selected flood-inundation maps on the Internet.
Methods used are generally cited from previously published reports. If techniques varied substantially from previously documented methods due to local hydrologic conditions or available data, they are described in detail in
Table 1. Site information for the U.S. Geological Survey streamgage in the Leaf River basin at Hattiesburg, Mississippi.
[mi2, square mile; ft, foot; current year refers to 2012, year of this publication; NAVD 88, North American Vertical Datum of 1988]
Station nameStation number
Leaf River drainage area
(mi2)Latitude Longitude
Period of record
Maximum recorded stage at gage
(ft above gage datum), and date
Leaf River at Hattiesburg, MS
02473000 1,750 31°20'35"N 89°16'49"W October 1905 to current year
34.03 ft (152.21 ft NAVD 88)
4/15/1974
Introduction 3
Hattiesburg
Petal
4211
11
1 MILE0 0.5
1 KILOMETER0 0.5
EXPLANATION
Direction of surface-water flow
Study area boundary
89°15'89°16'89°17'89°18'
31°21'
31°20'
31°19'
ForrestCounty
MISSISSIPPI
Studyarea
Orthography from National Agriculture Imagery Program, 2010Transverse Mercator projectionNorth American Datum of 1983 andNorth American Vertical Datum of 1988
02473000
02473000
Bouie River
Gordon
Creek
Leaf River
W 7TH STREET
CARTERVILLE ROADE HARDY STREET
S M
AIN
STR
EET
NEW RICHTON ROAD
HARDY STREET
OLD RICHTON ROAD
USGS streamgage and NWS forecast site and identifier
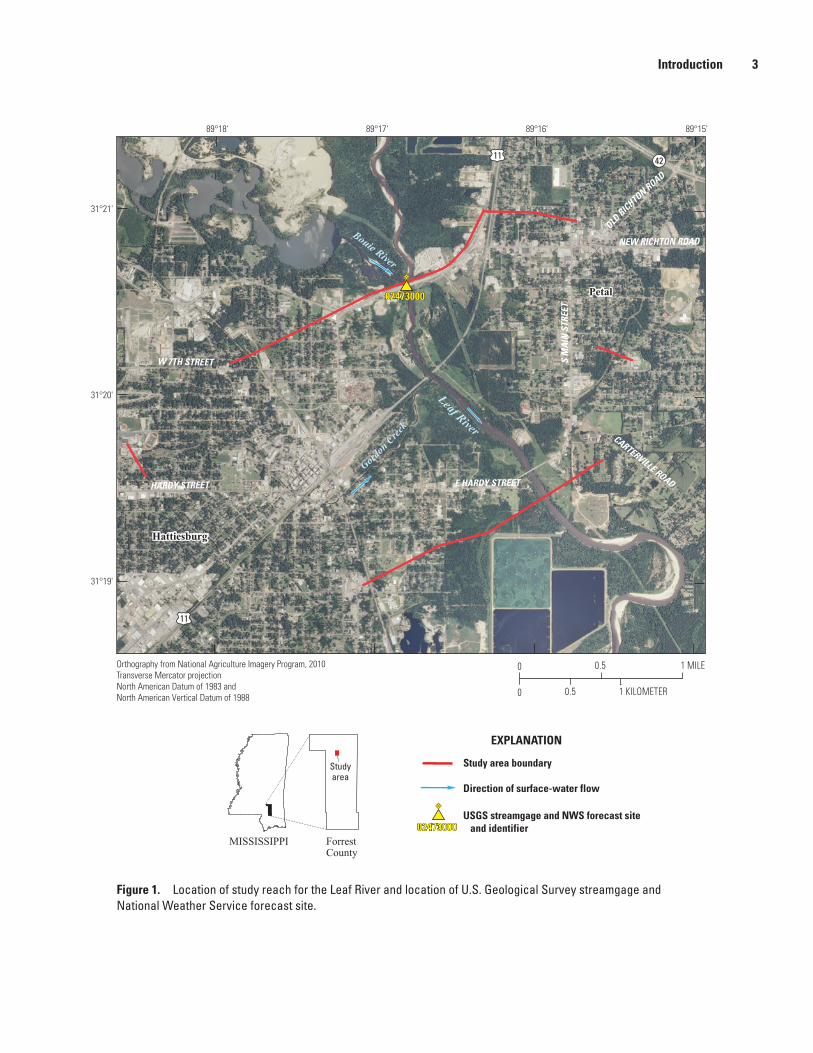
Figure 1. Location of study reach for the Leaf River and location of U.S. Geological Survey streamgage and National Weather Service forecast site.

4 Flood-Inundation Maps for the Leaf River at Hattiesburg, Mississippi
this report. Maps were produced for water levels referenced to the water-surface elevation (stage) at the Leaf River at Hatties-burg streamgage (02473000) and range from approximately bankfull (22.0 feet) to the maximum observed water-surface elevation at the streamgage (34.0 feet).
Study Area DescriptionThe Leaf River is in southeastern Mississippi in the
East Gulf Coastal Plain. The drainage area ranges from 1,750 square miles (mi2) at the Leaf River at Hattiesburg streamgage (02473000) to 1,760 mi2 at the downstream extent of the study reach. The headwaters of the Leaf River originate in Scott County, and the river flows generally southward before entering the Hattiesburg city limits. The Bouie River is a major tributary to the Leaf River, joining the main stem as it flows through Hattiesburg. The Bouie River’s confluence with the Leaf River is approximately 0.1 mi upstream of the Leaf River at Hattiesburg streamgaging station. The Leaf River basin terrain is generally flat, and most of the basin is rural. The study reach is approximately 1.7 mi long, has an average top-of-bank channel width of about 350 feet (ft) and has an average channel slope of about 2.1 feet per mile (ft/mi). The basin is still under development, and population has increased 2.7 percent from 44,779 to 45,989 between 2000 and 2010 (U.S. Bureau of Census, 2010). The main channel within the study reach has three major road crossings or other structures that lie within the channel or the adjacent floodplain.
Previous Studies The current FIS for Forrest County (Federal Emergency
Management Agency, 2010) was completed by the State of Mississippi in 2008 and revised in 2010. That study provided information on the 10.0-, 2.0-, 1.0- and 0.2-percent annual exceedance probability water-surface profiles and associated flood-plain maps for the Leaf River. Estimates of the peak discharges for the 1.0-percent annual exceedance probability flood along the Leaf River, as shown in table 2 for the study reach, are described in the current FIS.
Constructing Water-Surface ProfilesThe water-surface profiles used to produce the
13 flood-inundation maps in this study were computed using HEC–RAS, version 4.1.0 (U.S. Army Corps of Engineers, Hydrologic Engineering Center, 2010). HEC–RAS is a one-dimensional step-backwater model for simulation of water-surface profiles with steady-state (gradually varied) or unsteady-state flow computation options. The HEC–RAS analysis for this study was done using the steady-state flow computation option.
Hydrologic and Steady-Flow Data
The study area hydrologic network consists of one streamgage (fig. 1; table 1). Water-surface elevation (stage) is measured continuously at the Leaf River at Hattiesburg streamgage (02437000), and continuous records of streamflow are computed. All water-surface elevations are referenced to North American Vertical Datum of 1988 (NAVD 88). The gage is equipped with a satellite radio transmitter that allows data to be transmitted routinely and made available on the Internet within an hour of collection. The site also is equipped with a recording tipping-bucket rain gage. Longitudinal water-surface profiles from high-water marks along the main channel of the Leaf River were documented following the peak of the record flood of 1974 and during a bankfull event in 2011. These water-surface profiles were used for model calibration.
Steady-flow data consisted of flow regime, boundary conditions (either a known water-surface elevation associ-ated with a discharge measurement, critical depth, normal depth, or streamgage rating curve value), and peak discharge information. The steady-flow data for the study reach were obtained from field measurements of streamflow at the Leaf River at Hattiesburg streamgage. At the streamgage site (02473000), all computations using discharge values with known stages from actual streamflow measurements or stage-discharge relations were used. For ungaged sites, normal-depth boundary conditions were assumed (using a friction slope estimated from the average streambed slope through the reach) unless miscellaneous discharge measurements referenced to a known stage were available.
Topographic/Bathymetric Data
Channel cross sections were developed from USGS field surveys that were conducted from 1990 to 2011; these cross sections provide detailed channel elevation data below the water surface and were collected using mechanical means to measure depth, velocity, and horizontal distance at the U.S. Highway 11 and East Hardy Street/South Main Street bridges. The channel cross section at the Southern Railroad bridge was defined by tapedowns to the channel bed from
Table 2. Estimates of peak discharge for a 1.0-percent annual exceedance probability for selected locations on the Leaf River near Hattiesburg, Mississippi (Federal Emergency Management Agency, 2010).
[mi2, square mile; ft3/s, cubic foot per second]
Location on Leaf River
Drainage area (mi2)
Peak discharge estimate
(ft3/s)
Percentage of total
discharge
At U.S. Highway 11 1,760 110,000 100
Upstream from Bouie River confluence
1,100 82,000 75

Constructing Water-Surface Profiles 5
the downstream side of the bridge. Control at the railroad bridge was established by real-time kinematic global posi-tioning system survey procedures and then elevations were determined using closed level-loop surveying techniques with a total station. Light Detection and Ranging (LiDAR) data with horizontal resolution of 9.84 ft and vertical accu-racy of 0.6 ft were used to provide digital elevation data for the portions of the cross sections that were above the water surface at the time of the surveys. The LiDAR data were collected in March and April 2006 by EarthData International, Inc.; postprocessing of these data was completed by EarthData International, Inc., in 2007.
Various manmade drainage structures (bridges, culverts, roadway embankments, levees, and dams) in and along the stream affect or have the potential to affect water-surface elevations during flooding. To properly account for these features in the model, structural dimensions for three bridges were measured and surveyed in the field concurrently with stream-channel surveys. A detailed description of the methods used to acquire and process the topographic and bathymetric data can be found in Bales and others (2007).
Energy Loss Factors
Field observations and high-resolution aerial photo-graphs were used to select initial (pre-calibration) Manning’s roughness coefficients (“n” values) for energy (friction) loss calculations. The final Manning’s n values ranged from 0.026 to 0.042 for the main channel and from 0.040 to 0.28 for the overbank areas modeled in this analysis.
Model Calibration and Performance
The hydraulic model was calibrated to the most current (2012) stage-discharge relation at the Leaf River at Hatties-burg streamgage (02473000) and to high-water marks from the floods of April 1974 and March 2011. The measured peak discharges (and stages) for the 1974 and 2011 floods were 121,000 cubic feet per second (ft3/s) (34.03 ft) and 33,400 ft3/s (21.34 ft), respectively. Model calibration was accomplished by adjusting Manning’s n values and, in some cases, changing the channel cross section or slope until the results of the hydraulic computations closely agreed with the known flood discharge and stage values. Differences between measured and simulated water-surface elevations at the streamgaging station for specified flows were equal to or less than 0.17 ft and were within 5 percent of the current stage-discharge rela-tion (table 3). Differences between measured and simulated water-surface elevations for models calibrated to high-water marks were equal to or less than 0.15 ft (table 4). The results demonstrate that the model is capable of simulating accurate water-surface elevations over a wide range of flows in the basin. Details on techniques used in model development and calibration can be found in Bales and others (2007).
Table 3. Comparison of hydraulic-model output and water-surface elevations at the Leaf River at Hattiesburg, Mississippi, streamgage (02473000).
[ft3/s, cubic feet per second; NAVD 88, North American Vertical Datum of 1988; ft, foot]
Discharge (ft3/s)
Stage, in feetabove gage
datum
Water- surface
elevation, in feet,
NAVD 88
Simulated water- surface
elevation, in feet,
NAVD 88
Elevation difference
(ft)
33,400 21.34 139.52 139.65 0.13
35,350 22.00 140.18 140.26 0.08
35,680 22.11 140.29 140.36 0.07
38,530 23.00 141.18 141.24 0.06
40,120 23.48 141.66 141.73 0.07
41,200 23.77 141.95 142.10 0.15
42,070 24.00 142.18 142.28 0.10
45,970 25.00 143.18 143.11 – 0.07
46,170 25.05 143.23 143.15 – 0.08
50,450 26.00 144.18 144.05 – 0.13
54,700 26.90 145.08 144.95 – 0.13
55,200 27.00 145.18 145.05 – 0.13
60,200 28.00 146.18 146.01 – 0.17
Table 4. Comparison of hydraulic-model output and surveyed high-water mark elevations from the floods of April 1974 and March 2011 at the Leaf River at Hattiesburg, Mississippi, streamgage (02473000).
[NAVD 88, North American Vertical Datum of 1988; ft, foot; mi, mile]
Flood date
Measured high-water mark
elevation, in feet,
NAVD 88
Simulated water-surface
elevation, in feet,
NAVD 88
Elevation difference
(ft)
East Hardy Street/South Main Street Bridge (70.4 mi river station)
April 15, 1974 146.8 146.73 –0.07
March 11, 2011 136.1 136.04 –0.06
Southern Railroad Bridge (71.2 mi river station)
April 15, 1974 149.7 149.6 –0.10
March 11, 2011 137.8 137.75 –0.05
USGS streamgage 02473000 (71.8 mi river station)
April 15, 1974 152.2 152.22 0.02
March 11, 2011 139.5 139.65 0.15

6 Flood-Inundation Maps for the Leaf River at Hattiesburg, Mississippi
Development of Water-Surface Profiles
Profiles were developed for 13 stages at 1.0-ft intervals between 22.0 ft and 34.0 ft (140.18 ft and 152.18 ft NAVD 88, respectively) as referenced to the local datum at the Leaf River at Hattiesburg streamgage (02473000). Discharges corre-sponding to the various stages were obtained from the most current stage-discharge relation at the streamgage.
Discharges for all profiles (table 5) at locations down-stream of streamgage 02473000 on the Leaf River were held constant due to the relatively small amount of contributing drainage that enters the Leaf River within the study reach. Gordon Creek most likely will be ineffective during a flood event because of backwater storage of floodwaters from the Leaf River. There is a possibility of localized heavy rainfall contributing to the backwater inundation areas, but this is beyond the scope of this report.
Inundation MappingFlood-inundation maps were created for 13 profiles at
the USGS Leaf River at Hattiesburg streamgage (02473000), which has been designated as an NWS flood-forecast point
since 1957 (fig. 1). The maps were created in a GIS by combining the water-surface profiles and digital elevation model data. The digital elevation model data were collected and processed to yield an average spacing of points no greater than 9.84 ft (3 meters) apart and achieve a vertical accuracy of 0.6 ft (18.5 centimeters) root mean square error. Estimated flood-inundation boundaries for each simulated profile were developed with HEC–GeoRAS software (U.S. Army Corps of Engineers, Hydrologic Engineering Center, 2009). HEC–GeoRAS is a set of procedures, tools, and utili-ties for processing geospatial data in ArcGIS (Esri, 2010) by using a graphical user interface (Whitehead and Ostheimer, 2009). The interface allows the preparation of geometric data for import into HEC–RAS and processes simulation results exported from HEC–RAS (U.S. Army Corps of Engineers, Hydrologic Engineering Center, 2010). USGS personnel modified the HEC–GeoRAS results to ensure a hydrauli-cally reasonable transition of the boundary between modeled cross sections relative to the contour data for the land surface (Whitehead and Ostheimer, 2009). The maps show estimated flood-inundated areas overlain on high-resolution, georeferenced, aerial photographs of the study area for each of the water-surface profiles that were generated by the hydraulic model.
Table 5. Stages (and water-surface elevations) with corresponding discharge estimates for selected simulated water-surface profiles at the Leaf River at Hattiesburg, Mississippi, streamgage (02473000).
[Values 22.0–34.0 represent stage, in feet above gage datum. Values in parentheses (140.18–152.18) represent water-surface elevations, in feet above North American Vertical Datum of 1988]
Leaf River at Hattiesburg, Mississippi
Stage (water-surface elevation)
22.0 (140.18)
23.0 (141.18)
24.0 (142.18)
25.0 (143.18)
26.0 (144.18)
27.0 (145.18)
28.0 (146.18)
Discharge, in cubic feet per second
35,200 38,100 41,400 46,300 50,900 56,000 61,300
Sheet number 1 2 3 4 5 6 7
Stage (water-surface elevation)
29.0 (147.18)
30.0 (148.18)
31.0 (149.18)
32.0 (150.18)
33.0 (151.18)
34.0 (152.18)
Discharge, in cubic feet per second
67,500 74,100 83,000 94,900 107,800 121,000
Sheet number 8 9 10 11 12 13

Summary 7
Leaf River, Hattiesburg, Mississippi, Flood-Inundation Maps on the Internet
A USGS Flood Inundation Mapping Science World Wide Web portal (http://water.usgs.gov/osw/flood_inundation/) has been established by the USGS to provide estimated flood-inundation information to the public. The maps from this study are available in several commonly used electronic file formats that can be downloaded from that portal. Each stream reach displayed on the Web site contains links to USGS National Water Information System graphs of the current stage and streamflow at USGS Leaf River at Hatties-burg streamgage (02473000), to which the inundation maps are referenced (http://waterdata.usgs.gov/ms/nwis/uv/?site_no=02473000&PARAmeter_cd=00065,00060). A link also is provided to the NWS AHPS Web site (http://water.weather.gov/ahps/) so that users can obtain applicable information on forecasted peak stage. The estimated flood-inundation maps are displayed in sufficient detail to note the extent of flooding with respect to individual structures so that preparations for flooding and decisions for emergency response can be performed efficiently.
Disclaimer for Flood-Inundation Maps
Inundated areas shown should not be used for navigation, regulatory, permitting, or other legal purposes. The USGS provides these maps “as-is” for a quick reference, emergency planning tool but assumes no legal liability or responsibility resulting from the use of this information.
Uncertainties and Limitations Regarding Use of Flood-Inundation Maps
Although the flood-inundation maps represent the bound-aries of inundated areas with a distinct line, some uncertainty is associated with these maps. The flood boundaries shown were estimated based on water stages and streamflows at the Leaf River at Hattiesburg streamgage (02473000). Water-surface elevations along the stream reaches were estimated by steady-state hydraulic modeling, assuming unobstructed flow, and by using streamflows and hydrologic conditions antici-pated at the USGS streamgage. The hydraulic model reflects the land-cover characteristics and any bridge, dam, levee, or other hydraulic structures existing as of the date of the model calibration (December 2011). Unique meteorological factors (timing and distribution of precipitation) may cause actual streamflows along the modeled reach to vary from those assumed during a flood, which may lead to deviations in the
water-surface elevations and inundation boundaries shown. Additional areas may be flooded due to unanticipated condi-tions such as changes in the streambed elevation or rough-ness, backwater into major tributaries along a main-stem river, or backwater from localized debris. The accuracy of the floodwater extent portrayed on these maps will vary with the accuracy of the digital elevation model used to simulate the land surface. Additional uncertainties and limitations pertinent to this study may be described elsewhere in this report.
If this series of flood-inundation maps will be used in conjunction with National Weather Service (NWS) river forecasts, the user should be aware of additional uncertainties that may be inherent or factored into NWS forecast proce-dures. The NWS uses forecast models to estimate the quantity and timing of water flowing through selected stream reaches in the United States. These forecast models (1) estimate the amount of runoff generated by precipitation and snowmelt, (2) simulate the movement of floodwater as it proceeds downstream, and (3) predict the flow and stage (and water-surface elevation) for the stream at a given location (AHPS forecast point) throughout the forecast period (every 6 hours and 3 to 5 days out in many locations). For more information on AHPS forecasts, please see: http://water.weather.gov/ahps/pcpn_and_river_forecasting.pdf.
SummaryA series of estimated flood-inundation maps for a
1.7-mile reach of the Leaf River at Hattiesburg, Missis-sippi, was developed by the U.S. Geological Survey (USGS) in cooperation with the City of Hattiesburg, City of Petal, Forrest County, Mississippi Emergency Management Agency, Mississippi Department of Homeland Security, and the Emergency Management District. These maps, available at a USGS Web portal, in conjunction with the real-time stage data from the USGS streamgage at Leaf River at Hattiesburg, MS (02473000), and National Weather Service flood-stage fore-casts, can help to guide the general public in taking individual safety precautions and can provide local officials with a tool to efficiently manage emergency flood operations and flood-mitigation efforts.
The maps were developed using the U.S. Army Corps of Engineers HEC–RAS and HEC–GeoRAS computer programs to compute water-surface profiles and to delineate estimated flood-inundation areas for selected stream stages. The maps show estimated flood-inundation areas overlain on high-resolution, georeferenced, aerial photographs of the study area for stream stages between 22.0 ft and 34.0 ft (gage datum) at the Leaf River at Hattiesburg streamgage (02473000).

8 Flood-Inundation Maps for the Leaf River at Hattiesburg, Mississippi
References Cited
Bales, J.D., Wagner, C.R., Tighe, K.C., and Terziotti, Silvia, 2007, LiDAR-derived flood-inundation maps for real-time flood-mapping applications, Tar River Basin, North Carolina: U.S. Geological Survey Scientific Investigations Report 2007–5032, 42 p.
Esri [2010], ArcGis Desktop: Version 9.3.1: Accessed August 2010 at http://www.esri.com.
Federal Emergency Management Agency, 2010, Flood Insur-ance Study, Forrest County, Mississippi and Incorporated Areas, 79 p.
U.S. Army Corps of Engineers, Hydrologic Engineering Center, 2009, HEC–GeoRAS, GIS Tools for Support of HEC–RAS using ArcGIS, User’s Manual, version 4.2, [variously paged].
U.S. Army Corps of Engineers, Hydrologic Engineering Center, 2010, HEC–RAS River Analysis System, Hydraulic Reference Manual, version 4.1, [variously paged].
U.S. Army Corps of Engineers, 1983, Leaf and Bouie Rivers Hattiesburg and Petal, Mississippi, Detailed Project Report and Environmental Impact Statement, 267 p.
U.S. Bureau of Census, 2010, State population datasets—Population, population change and estimated components of population change: 2000 to 2010 (http://quickfacts.census.gov/qfd/states/28000.html).
Whitehead, M.T., and Ostheimer, C.J., 2009, Development of a flood-warning system and flood-inundation mapping for the Blanchard River in Findlay, Ohio: U.S. Geological Survey Scientific Investigations Report 2008–5234, 9 p.
Wilson, K.V., 1964, Floods of 1961 in Mississippi: U.S. Geological Survey Bulletin 64–4, 93 p.

Manuscript approved on August 8, 2012
Edited by Kimberly A. WaltenbaughLayout by Caryl J. WipperfurthScience Publishing Network, Raleigh PSC
For more information about this publication, contact: Director, Mississippi Water Science Center U.S. Geological Survey 308 Airport Road South Jackson, MS 39208-6649 (601) 933-2900
http://ms.water.usgs.gov/

Storm—
Flood-Inundation Maps for the Leaf River at H
attiesburg, Mississippi—
Scientific Investigations Map 3228