flood-inundation maps for a 6.5-mile reach of the kentucky...
TRANSCRIPT
U.S. Department of the InteriorU.S. Geological Survey
Pamphlet to accompany Scientific Investigations Map 3278
Prepared in cooperation with City of Frankfort, Kentucky, Office of Emergency Management
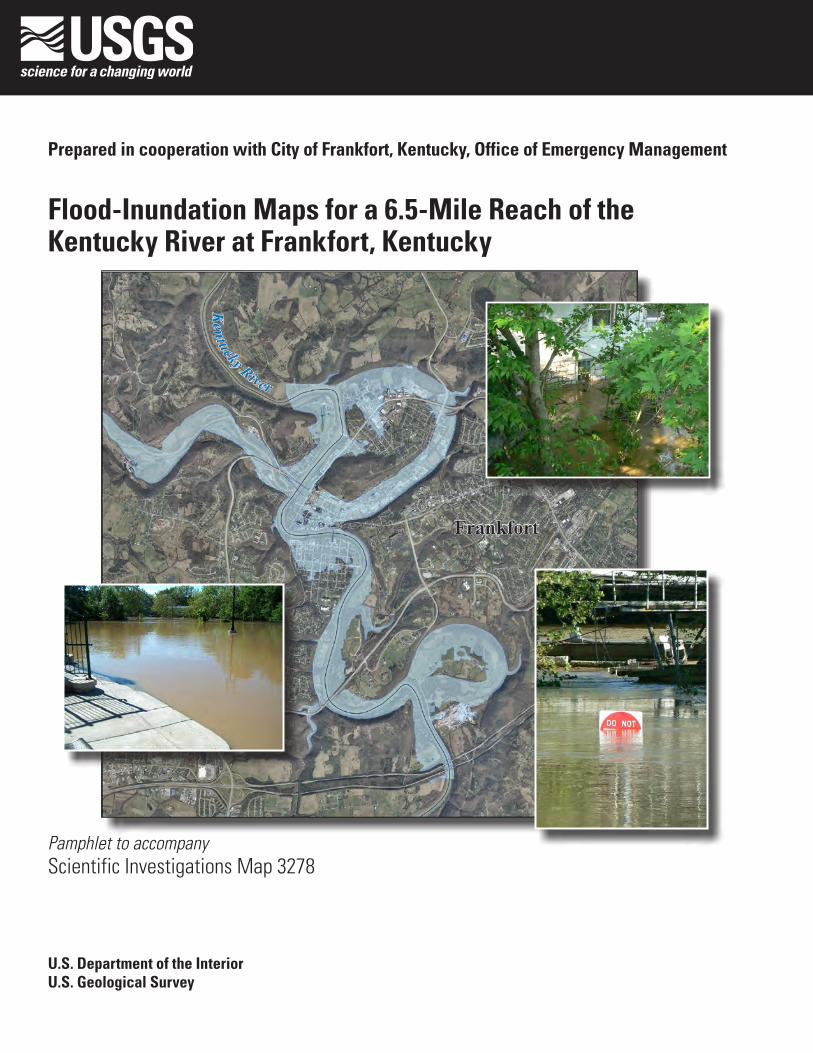
Flood-Inundation Maps for a 6.5-Mile Reach of the Kentucky River at Frankfort, Kentucky

CoverBackground image: Flood inundation area at stage 52.Small photos: Flood views in Frankfort, Kentucky. Photo courtesy of Cloyd Stratton and Steven P. Cohen.

Flood-Inundation Maps for a 6.5-Mile Reach of the Kentucky River at Frankfort, Kentucky
By Jeremiah G. Lant
Prepared in cooperation with City of Frankfort, Kentucky, Office of Emergency Management
Pamphlet to accompany Scientific Investigations Map 3278
U.S. Department of the InteriorU.S. Geological Survey

U.S. Department of the InteriorSALLY JEWELL, Secretary
U.S. Geological SurveySuzette M. Kimball, Acting Director
U.S. Geological Survey, Reston, Virginia: 2013
For more information on the USGS—the Federal source for science about the Earth, its natural and living resources, natural hazards, and the environment, visit http://www.usgs.gov or call 1–888–ASK–USGS.
For an overview of USGS information products, including maps, imagery, and publications, visit http://www.usgs.gov/pubprod
To order this and other USGS information products, visit http://store.usgs.gov
Any use of trade, firm, or product names is for descriptive purposes only and does not imply endorsement by the U.S. Government.
Although this information product, for the most part, is in the public domain, it also may contain copyrighted materials as noted in the text. Permission to reproduce copyrighted items must be secured from the copyright owner.
Suggested citation:Lant, J.G., 2013, Flood-inundation maps for a 6.5-mile reach of the Kentucky River at Frankfort, Kentucky: U.S. Geological Survey Scientific Investigations Map 3278, 26 sheets, 10-p. pamphlet, http://dx.doi.org/10.3133/sim3278.
ISSN 2329-132X (online)http://dx.doi.org/10.3133/sim3278

iii
Contents
Acknowledgments ........................................................................................................................................viAbstract ...........................................................................................................................................................1Introduction ....................................................................................................................................................1
Purpose and Scope ..............................................................................................................................2Study Area Description ........................................................................................................................2Previous Studies ..................................................................................................................................2
Constructing Water-Surface Profiles .........................................................................................................4Hydrologic and Steady-Flow Data .....................................................................................................4Topographic/Bathymetric Data ..........................................................................................................4Energy-Loss Factors .............................................................................................................................5Model Calibration and Performance .................................................................................................5Development of Water-Surface Profiles ...........................................................................................5
Inundation Mapping ......................................................................................................................................9Kentucky River, Kentucky, Flood-Inundation Maps on the Internet .............................................9Disclaimer for Flood-Inundation Maps .............................................................................................9Uncertainties and Limitations for Use of Flood-Inundation Maps ...............................................9
Summary........................................................................................................................................................10References Cited..........................................................................................................................................10Glossary .........................................................................................................................................................10
Sheets
Sheets and additional materials are available online at http://dx.doi.org/10.3133/sim3278/. 1–26. Estimated flood-inundation maps for the Kentucky River from reach near
Interstate 64 to reach near Lock 4 referenced to USGS streamgage Kentucky River at Lock 4 at Frankfort, Kentucky (sta. no. 03287500) for stream stages of:
1. 27 feet and an elevation of 488.58 feet. 2. 28 feet and an elevation of 489.58 feet. 3. 29 feet and an elevation of 490.58 feet. 4. 30 feet and an elevation of 491.58 feet. 5. 31 feet and an elevation of 492.58 feet. 6. 32 feet and an elevation of 493.58 feet. 7. 33 feet and an elevation of 494.58 feet. 8. 34 feet and an elevation of 495.58 feet. 9. 35 feet and an elevation of 496.58 feet. 10. 36 feet and an elevation of 497.58 feet. 11. 37 feet and an elevation of 498.58 feet. 12. 38 feet and an elevation of 499.58 feet. 13. 39 feet and an elevation of 500.58 feet. 14. 40 feet and an elevation of 501.58 feet. 15. 41 feet and an elevation of 502.58 feet.
iv
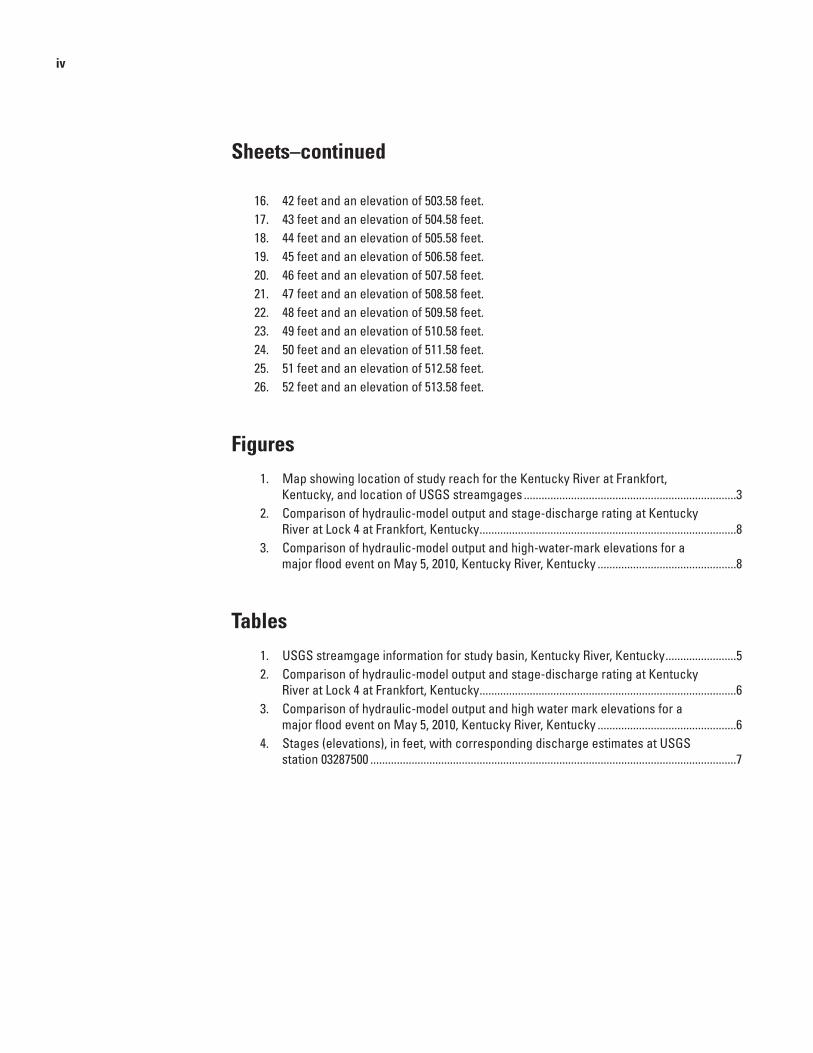
Sheets–continued
16. 42 feet and an elevation of 503.58 feet. 17. 43 feet and an elevation of 504.58 feet. 18. 44 feet and an elevation of 505.58 feet. 19. 45 feet and an elevation of 506.58 feet. 20. 46 feet and an elevation of 507.58 feet. 21. 47 feet and an elevation of 508.58 feet. 22. 48 feet and an elevation of 509.58 feet. 23. 49 feet and an elevation of 510.58 feet. 24. 50 feet and an elevation of 511.58 feet. 25. 51 feet and an elevation of 512.58 feet. 26. 52 feet and an elevation of 513.58 feet.
Figures
1. Map showing location of study reach for the Kentucky River at Frankfort, Kentucky, and location of USGS streamgages ........................................................................3
2. Comparison of hydraulic-model output and stage-discharge rating at Kentucky River at Lock 4 at Frankfort, Kentucky .......................................................................................8
3. Comparison of hydraulic-model output and high-water-mark elevations for a major flood event on May 5, 2010, Kentucky River, Kentucky ...............................................8
Tables
1. USGS streamgage information for study basin, Kentucky River, Kentucky ........................5 2. Comparison of hydraulic-model output and stage-discharge rating at Kentucky
River at Lock 4 at Frankfort, Kentucky .......................................................................................6 3. Comparison of hydraulic-model output and high water mark elevations for a
major flood event on May 5, 2010, Kentucky River, Kentucky ...............................................6 4. Stages (elevations), in feet, with corresponding discharge estimates at USGS
station 03287500 ............................................................................................................................7

v
Multiply By To obtain
Length
foot (ft) 0.3048 meter (m)mile (mi) 1.609 kilometer (km)
Area
square mile (mi2) 2.590 square kilometer (km2)Flow rate
cubic foot per second (ft3/s) 0.02832 cubic meter per second (m3/s)Hydraulic gradient
foot per mile (ft/mi) 0.1894 meter per kilometer (m/km)
Vertical coordinate information is referenced to the North American Vertical Datum of 1988 (NAVD 88).
Horizontal coordinate information is referenced to the North American Datum of 1983 (NAD 83).
Conversion Factors
Inch/Pound to SI

vi
Acknowledgments
The author wishes to thank the local, State, and Federal agencies that have cooperated in and (or) funded for the operation and maintenance of the streamgage used for this study, especially the City of Frankfort Office of Emergency Management. Special thanks are given to Deron Rambo, Director of Emergency Management for the City of Frankfort at the Office of Emergency Management, for his cooperation in this study and to the National Weather Service for their continued support of the USGS flood-inundation mapping initiative.
Flood-Inundation Maps for a 6.5-Mile Reach of the Kentucky River at Frankfort, Kentucky
By Jeremiah G. Lant
Abstract
Digital flood-inundation maps for a 6.5-mile reach of Kentucky River at Frankfort, Kentucky, were created by the U.S. Geological Survey (USGS) in cooperation with the City of Frankfort Office of Emergency Management. The inundation maps, which can be accessed through the USGS Flood Inundation Mapping Science Web site at http://water.usgs.gov/osw/flood_inundation/, depict estimates of the areal extent and depth of flooding corresponding to selected water levels (stages) at the USGS streamgage Kentucky River at Lock 4 at Frankfort, Kentucky (station no. 03287500). Cur-rent conditions for the USGS streamgage may be obtained online at the USGS National Water Information System site (http://waterdata.usgs.gov/nwis/inventory?agency_code=USGS&site_no=03287500). In addition, the information has been provided to the National Weather Service (NWS) for incorporation into their Advanced Hydrologic Prediction Ser-vice (AHPS) flood warning system (http:/water.weather.gov/ahps/). The NWS forecasts flood hydrographs at many places that are often colocated at USGS streamgages. The forecasted peak-stage information, also available on the Internet, may be used in conjunction with the maps developed in this study to show predicted areas of flood inundation.
In this study, flood profiles were computed for the Ken-tucky River reach by using HEC–RAS, a one-dimensional step-backwater model developed by the U.S. Army Corps of Engineers. The hydraulic model was calibrated by using the most current (2013) stage-discharge relation for the Kentucky River at Lock 4 at Frankfort, Kentucky, in combination with streamgage and high-water-mark measurements collected for a flood event in May 2010. The calibrated model was then used to calculate 26 water-surface profiles for a sequence of flood stages, at 1-foot intervals, referenced to the streamgage datum and ranging from a stage near bankfull to the elevation that breached the levees protecting the City of Frankfort. To delin-eate the flooded area at each interval flood stage, the simulated
water-surface profiles were combined with a digital elevation model (DEM) of the study area by using geographic infor-mation system software. The DEM consisted of bare-earth elevations within the study area and was derived from a Light Detection And Ranging (LiDAR) dataset having a 5.0-foot horizontal resolution and an accuracy of 0.229 foot.
The availability of these maps, along with Internet infor-mation regarding current stages from USGS streamgages and forecasted stages from the NWS, provides emergency manage-ment personnel and local residents with critical information for flood response activities such as evacuations, road clo-sures, and postflood recovery efforts.
Introduction
The City of Frankfort, Kentucky, is an urban community with an estimated population of 27,590 (U.S. Census Bureau, 2012). Frankfort, the capital of Kentucky, is located within a sharp bend of the Kentucky River. The Kentucky River flows through the heart of Frankfort, splitting the city into a northern and southern part. Frankfort’s location and low-lying flood plains make the city susceptible to flooding. According to the flood categories established by the National Weather Service, the City of Frankfort has experienced approximately 58 flood events within the last 100 years, most notably in 1978.
Prior to this study, Frankfort officials relied on several information sources (all of which are available on the Internet) to make decisions on how to best alert the public and mitigate flood damages. One source is the September 28, 2007, Federal Emergency Management Agency (FEMA) Flood Insurance Study (FIS) for Franklin County and Incorporated Areas (Federal Emergency Management Agency, 2007). A second source of information consists of a USGS streamgage that lies within the city limits of Frankfort: Kentucky River at Lock 4 at Frankfort, Kentucky (station no. 03287500), from which current and historical water levels (stage) can be obtained. A
2 Flood-Inundation Maps for a 6.5-Mile Reach of the Kentucky River at Frankfort, Kentucky
third source is the National Weather Service forecast of peak stage at the USGS Kentucky River Lock 4 streamgage (station no. 03287500) through the Advanced Hydrologic Predic-tion Service (AHPS) Web site (NWS forecast point FFTK2). Although current USGS stage and NWS forecasted stage information is particularly useful for residents in the immedi-ate vicinity of a streamgage, it is of limited use to residents farther upstream or downstream because the water-surface elevation is not constant along the entire stream channel. Also, FEMA, State emergency management mitigation teams, and property owners typically lack information related to water depth at locations other than near a USGS streamgage or an NWS flood-forecast point.
Purpose and Scope
The purpose of this report is to (1) describe the develop-ment of a series of estimated flood-inundation maps for a 6.5-mile reach of the Kentucky River near Frankfort, Kentucky, and (2) provide the City of Frankfort and the public with a library of flood-inundation maps that correspond to water lev-els referenced to the water-surface elevation and gage heights at the USGS streamgage at Kentucky River Lock 4 at Frank-fort, Kentucky (station no. 03287500). The flood-inundation maps and other flood information are made available on the USGS Flood Inundation Mapping Science Web site at http://water.usgs.gov/osw/flood_inundation/. Internet users can select estimated inundation maps that correspond to current stages at the USGS streamgage, the NWS forecasted peak stage, or other desired stream stages.
The scope of the study was limited to the Kentucky River reach bounded by Interstate 64, approximately 5 miles (mi) south of Frankfort, and an area approximately 1 mi north of Lock 4 (fig. 1). To develop flood-inundation maps, a hydraulic model of the Kentucky River reach was built to provide water-surface profiles for various flood stages.
Study Area Description
The Kentucky River is a tributary of the Ohio River. The headwaters originate in the Cumberland Mountains of south-east Kentucky, and the river flows generally northwestward for approximately 250 mi through the heart of Kentucky before entering the Ohio River. The reach studied is in north-central
Kentucky in what is locally called the Bluegrass Region. The drainage area ranges from 5,411 square miles (mi2) at station 03287500 to 6,950 mi2 at the confluence of the Ohio River. No major tributary to the Kentucky River joins the main stem as it flows through Frankfort, but there are a few minor tributar-ies; among these is Benson Creek, which joins the main stem south of Frankfort and approximately 300 feet (ft) downstream of station 03287500. The basin terrain changes gradually from steep to rolling hills adjacent to the city to low-lying and flat areas within the city. The study reach is approximately 6.5 mi long, has an average top-of-bank channel width of about 400 ft, and has an average channel slope of 1 foot per mile. The basin is still undergoing suburban and urban development; population increased 1.2 percent (from 27,269 to 27,590) between 2010 and 2012 (U.S. Census Bureau, 2012). The main channel within the study reach has six major road cross-ings or other structures that lie within the channel or the adja-cent flood plain, as well as a low-flow navigational dam (Lock and Dam 4) approximately 0.8 mi downstream of station 03287500. The City of Frankfort also has a Flood Protection System made up of levees, floodwalls, and pumping stations that protect Frankfort.
Previous Studies
The FIS by FEMA is a compilation and presentation of flood risk within a community for the National Flood Insur-ance Program (NFIP) (Federal Emergency Management Agency, 2013). A FIS report is regulatory by nature and con-tains flood-elevation data in flood profiles and data tables that are based on theoretical flows. The flood inundation studies conducted by the USGS are non-regulatory by nature and con-tain detailed flood-elevation data in flood maps that are based on measured stages and (or) flows.
The current FIS for Franklin County (Federal Emer-gency Management Agency, 2007) was completed by the URS Corporation in April 2010. The FIS provided information on water-surface profiles and associated flood-plain maps for the Kentucky River at 1.0- and 0.2-percent annual exceedance probabilities. The City of Frankfort provided the hydraulic model used in the FIS, which contained bathymetric and struc-ture datasets for most of the study area.

Introduction 3
Figure 1. Location of study reach for the Kentucky River at Frankfort, Kentucky, and location of USGS streamgages. The National Weather Service forecast point (FFTK2) is at USGS streamgage Kentucky River at Lock 4 at Frankfort, Kentucky (station no. 03287500).
! §03287500
%&'64
%&'(64
%&'64
(127
(/127
(60
(/60
(/460
(/421
Projection: Lambert Conformal ConicState Plane Coordinate System, Kentucky, FIPS, 1600North American Datum of 1983 (NAD83)Orthophotography from Kentucky Aerial Photography and Elevation Data Program, 2012
Frankfort
Kentucky River
KENTUCKY
Study area
0 0.5 1 MILE
0 0.5 1 KILOMETER
84°55'
38°14'
84°54' 84°53' 84°52' 84°51' 84°50' 84°49'
38°13'
38°12'
38°11'
38°10'
Versailles Road
East West Connector
Lock and Dam 4Benson Creek
EXPLANATION
03287500! § USGS streamgage and number
Flow arrow—Indicates direction of water flow
Centerline Kentucky River
Limits of study area
(127 Route markers%&'64
! §

4 Flood-Inundation Maps for a 6.5-Mile Reach of the Kentucky River at Frankfort, Kentucky
Constructing Water-Surface Profiles
The following steps were taken to construct the water-surface profiles: (1) examination of current and historical data from a streamgage on the Kentucky River (table 1); (2) collection of hydrologic and steady-flow data; (3) collection of topographic data, geometric data (for structures/bridges), and bathymetric data throughout the study reach; (4) determination of energy-loss factors (roughness coefficients) in the stream channel and flood plain; (5) model calibration and evalua-tion, and (6) computation of water-surface profiles by means of HEC–RAS, the U.S. Army Corps of Engineers’ hydraulic modeling software (U.S. Army Corps of Engineers, 2010).
The water-surface profiles used to produce the 26 flood-inundation maps in this study were computed by using HEC–RAS, version 4.1.0 (U.S. Army Corps of Engineers, 2010). HEC–RAS simulates the flow of water through open channels and computes water-surface profiles. HEC–RAS is a one-dimensional step-backwater model for simulation of water-surface profiles with steady-state (gradually varied) or unsteady-state flow computation options. The HEC–RAS analysis for this study was done by using the steady-state flow computation option.
Methods used are generally cited from previously published reports. If techniques varied significantly from previously documented methods because of local hydrologic conditions or available data, they are described in detail in this report. Maps were produced for water levels referenced to the water-surface elevation (stage) at station 03287500 and ranging from near bankfull (27 ft; 488.58 ft above the North American Vertical Datum of 1988 (NAVD 88)) to the elevation that breaches the levees protecting Frankfort (52 ft; 513.58 ft above NAVD 88).
Hydrologic and Steady-Flow Data
The study-area hydrologic network consists of one USGS streamgage (fig. 1; table 1). The streamgage on Kentucky River at Lock 4 at Frankfort, Kentucky (station no. 03287500) has a continuous record of measured stage (water level) and computed streamflow (table 1). All measured stages and corre-sponding water-surface elevations are referenced to NAVD 88. The USGS streamgage within the study reach is equipped with satellite radio transmitters that allow data to be transmitted in near real time. Flow and stage data for a particular streamgage can be accessed online from the USGS at http://waterdata.usgs.gov/ky/nwis/current/?type=flow.
Steady-flow data necessary for the hydraulic model consisted of flow regime, downstream boundary condi-tions (either known water-surface elevation associated with a discharge measurement, critical depth, normal depth, or streamgage rating-curve value), and peak-discharge informa-tion. The hydraulic model developed contains a normal depth boundary condition using an average channel slope within
the study domain. The steady-flow data for the study reach were obtained from previous studies and field measurements of streamflow made at station 03287500, and the most current (2013) stage-discharge relation at station 03287500.
Topographic/Bathymetric Data
Light Detection And Ranging (LiDAR) data near Frank-fort were furnished by the Kentucky Energy and Environment Cabinet (Carey Johnson, Kentucky Energy and Environment Cabinet, written commun., 2012). LiDAR provides high-resolution topographic data for models and other applications. The LiDAR data used in the study had a horizontal resolu-tion of 5.0 ft and a vertical accuracy of 0.229 ft. The LiDAR data were collected and postprocessed by Photo Science, Inc. (Lexington, Kentucky), in 2012, resulting in a series of tiled bare-earth digital elevation models (DEMs). The DEM tiles that covered the study area were mosaicked together using geoprocessing tools in ArcGIS.
River bathymetry data within the study reach were col-lected by the USGS Kentucky Water Science Center (Albert Ruby, USGS Kentucky Water Science Center, written com-mun., 2012). The bathymetric survey was run June 27–28, 2012. A 210-kilohertz AirmarTM transducer and a Reson Navi-soundTM 210 echo sounder were used to collect the bathymet-ric data. A Trimble TM Differential Global Positioning System (DGPS) was used for horizontal positioning during the survey. The HYPACK TM navigation software package was used to integrate riverbed depths along with the DGPS horizontal position data and to display the location of the boat on a geore-ferenced aerial photo of the river for navigation.
A computer program was developed in Python (Python Software Foundation, 2013) to postprocess the raw bathymet-ric data and create a series of properly oriented cross sections that span the width of the river. By using the series of cross sections, a bathymetric surface was created with the inverse distance weighted interpolation routine in ArcGIS. The bathy-metric surface was then merged with the bare-earth DEM.
The Louisville District of the U.S. Army Corps of Engi-neers (James Lowe, U.S. Army Corps of Engineers, written commun., 2013) provided a levee dataset from February, 29, 2008, containing surveyed elevations of the North and South Frankfort levees. The surveyed levee dataset was merged with the bare-earth DEM.
A total of six hydraulic structures exist within the study area and all were included in the hydraulic model. The struc-ture datasets within the study area originated from the FIS for Franklin County (Federal Emergency Management Agency, 2007) and included structure surveys of the Kentucky River within the mapped river reach (fig. 1). The structure datasets were checked and validated in consultation with the City of Frankfort (Deron Rambo, City of Frankfort at the Office of Emergency Management, written commun., 2013) to ensure that no newly built structures were within the study area.

Constructing Water-Surface Profiles 5
HEC-GeoRAS and ArcGIS were used to extract flood plain elevations from the LiDAR-derived DEM at selected cross sections along the Kentucky River for use in the HEC–RAS model. The flood plain and river bathymetry elevations were merged with the structure datasets during the development of the HEC–RAS model.
Energy-Loss Factors
USGS field observations and photographs, along with high-resolution aerial photographs furnished by the City of Frankfort (Kentucky GIS Server, 2013), were used to select initial (precalibration) channel and flood plain friction coef-ficients. These friction coefficients, commonly called Man-ning’s roughness coefficients or Manning’s n values, account for energy (friction) loss in model calculations. The final Manning’s n values used ranged from 0.04 to 0.043 for the main channel and 0.12 to 0.13 for the overbank areas; these values were selected according to the channel and flood plain characteristics described by Chow (1959). The main channel banks and overbank areas throughout the study area domain are highly vegetated.
Model Calibration and Performance
The hydraulic model was calibrated to the most current stage-discharge relation at station 03287500 (Kentucky River at Lock 4 at Frankfort, Kentucky), using a total of 24 profiles. The hydraulic model was also calibrated to 19 high-water-mark measurements collected for the flood event that occurred on May 5, 2010 (Albert Ruby, USGS Kentucky Water Sci-ence Center, written commun., 2010). Model calibration was
Table 1. USGS streamgage information for study basin, Kentucky River, Kentucky.
[mi2, square miles; ft, feet; NAVD 88, North American Vertical Datum of 1988]
Station nameStation number
Drainage area (mi2)
Latitude (degrees, minutes, seconds)
Longitude (degrees, minutes, seconds)
Period of record
Maximum recorded stage at streamgage (ft above NAVD 88)
and date
Kentucky River at Lock 4
03287500 5,411.0 38°12′06″ N. 84°52′54″ W. Oct. 1927 to current year (2013).
48.47 ft (510.05 ft ) December 10, 1978.
accomplished by adjusting Manning’s n values until the results of the hydraulic computations closely agreed with the known flood discharge and stage values; Manning’s n values were also verified to fall within realistic bounds, as described by Chow (1959). Differences between measured and simulated water levels for specified flows from the established stage-discharge relation were less than −0.34 ft (table 2). Differences between measured and simulated water levels for models calibrated to flood events were less than −0.83 ft (table 3). These calibration results demonstrate that the model is capable of simulating accurate water levels over a wide range of flows in the basin.
Development of Water-Surface Profiles
Profiles were developed for 26 stages at 1-ft intervals between 27 ft and 52 ft as referenced to station 03287500. Discharges corresponding to the various stages were obtained from the most current stage-discharge relation (2013) at station 03287500 (Kentucky River at Lock 4 at Frankfort, Kentucky).
Discharges for all profiles (table 4) were selected with the assumption that, within the 6.5-mi study reach, there are no significant inflows. The discharges were estimated to be uniform and steady throughout the study reach. The water-surface elevations and the corresponding discharge estimates used for stages 51.0 ft and 52.0 ft were obtained by using the fully calibrated model in an iterative approach with various flows. These stages correspond to the water levels that breach the North and South Frankfort levees.
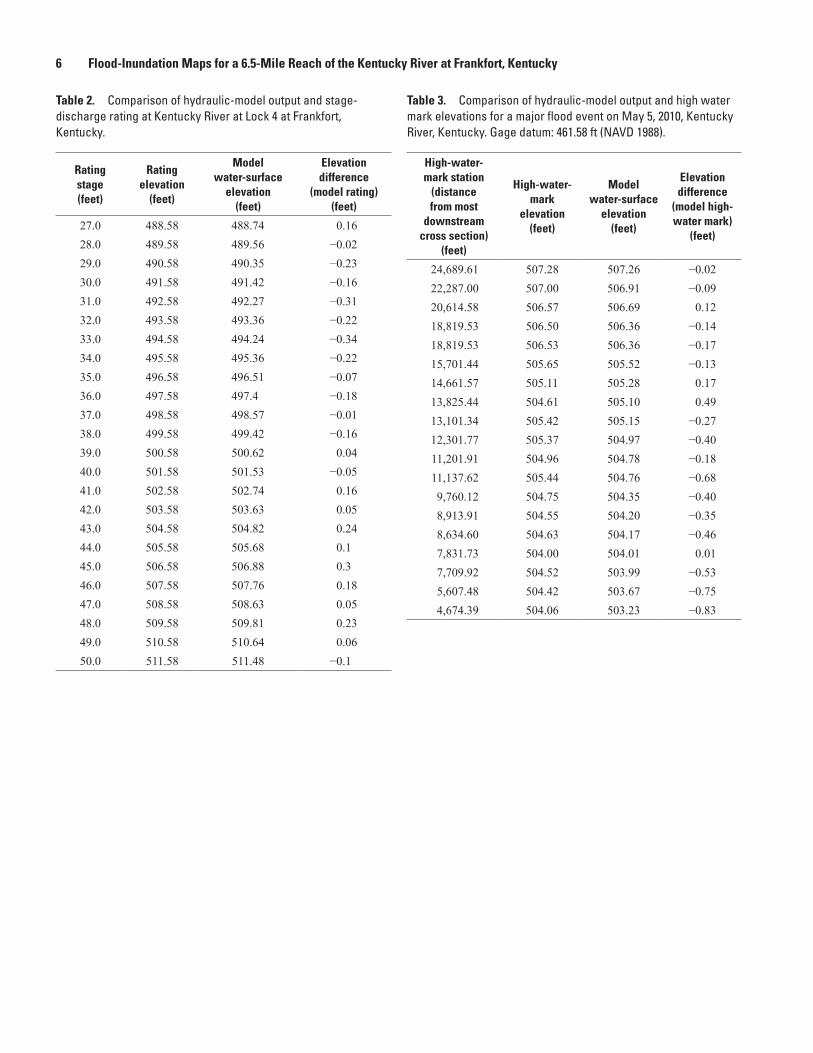
6 Flood-Inundation Maps for a 6.5-Mile Reach of the Kentucky River at Frankfort, Kentucky
High-water- mark station
(distance from most
downstream cross section)
(feet)
High-water- mark
elevation(feet)
Model water-surface
elevation(feet)
Elevation difference
(model high- water mark)
(feet)
24,689.61 507.28 507.26 −0.0222,287.00 507.00 506.91 −0.0920,614.58 506.57 506.69 0.1218,819.53 506.50 506.36 −0.1418,819.53 506.53 506.36 −0.1715,701.44 505.65 505.52 −0.1314,661.57 505.11 505.28 0.1713,825.44 504.61 505.10 0.4913,101.34 505.42 505.15 −0.2712,301.77 505.37 504.97 −0.4011,201.91 504.96 504.78 −0.1811,137.62 505.44 504.76 −0.689,760.12 504.75 504.35 −0.408,913.91 504.55 504.20 −0.358,634.60 504.63 504.17 −0.467,831.73 504.00 504.01 0.017,709.92 504.52 503.99 −0.535,607.48 504.42 503.67 −0.754,674.39 504.06 503.23 −0.83
Table 3. Comparison of hydraulic-model output and high water mark elevations for a major flood event on May 5, 2010, Kentucky River, Kentucky. Gage datum: 461.58 ft (NAVD 1988).
Rating stage (feet)
Rating elevation
(feet)
Model water-surface
elevation (feet)
Elevation difference
(model rating) (feet)
27.0 488.58 488.74 0.1628.0 489.58 489.56 −0.0229.0 490.58 490.35 −0.2330.0 491.58 491.42 −0.1631.0 492.58 492.27 −0.3132.0 493.58 493.36 −0.2233.0 494.58 494.24 −0.3434.0 495.58 495.36 −0.2235.0 496.58 496.51 −0.0736.0 497.58 497.4 −0.1837.0 498.58 498.57 −0.0138.0 499.58 499.42 −0.1639.0 500.58 500.62 0.0440.0 501.58 501.53 −0.0541.0 502.58 502.74 0.1642.0 503.58 503.63 0.0543.0 504.58 504.82 0.2444.0 505.58 505.68 0.145.0 506.58 506.88 0.346.0 507.58 507.76 0.1847.0 508.58 508.63 0.0548.0 509.58 509.81 0.2349.0 510.58 510.64 0.0650.0 511.58 511.48 −0.1
Table 2. Comparison of hydraulic-model output and stage-discharge rating at Kentucky River at Lock 4 at Frankfort, Kentucky.

Constructing Water-Surface Profiles 7
Table 4. Stages (elevations), in feet, with corresponding discharge estimates at USGS station 03287500 (Kentucky River at Lock 4 at Frankfort, Kentucky) for selected simulated water-surface profiles.
[NAVD 88, North American Vertical Datum of 1988]
Stage, in feet above gage datum (elevation, in feet, NAVD 88) associated with the indicated discharge value, in cubic feet per second
Stage (elevation) 27.00(488.58)
28.00(489.58)
29.00(490.58)
30.00(491.58)
31.00(492.58)
32.00(493.58)
33.00(494.58)
34.00(495.58)
35.00(496.58)
36.00(497.58)
Discharge 67,700 70,100 72,500 75,000 77,600 80,200 82,900 85,700 88,500 91,300
Map sheet no. 1 2 3 4 5 6 7 8 9 10
Stage (elevation) 37.00(498.58)
38.00(499.58)
39.00(500.58)
40.00(501.58)
41.00(502.58)
42.00(503.58)
43.00(504.58)
44.00(505.58)
45.00(506.58)
46.00(507.58)
Discharge 94,200 97,000 100,000 103,000 106,000 109,000 112,000 115,000 118,000 121,000
Map sheet no. 11 12 13 14 15 16 17 18 19 20
Stage (elevation)47.00
(508.58)48.00
(509.58)49.00
(510.58)50.00
(511.58)51.00
(512.58)52.00
(513.58)
Discharge 124,000 127,000 130,000 133,000 136,850 140,425
Map sheet no. 21 22 23 24 25 26
8 Flood-Inundation Maps for a 6.5-Mile Reach of the Kentucky River at Frankfort, Kentucky
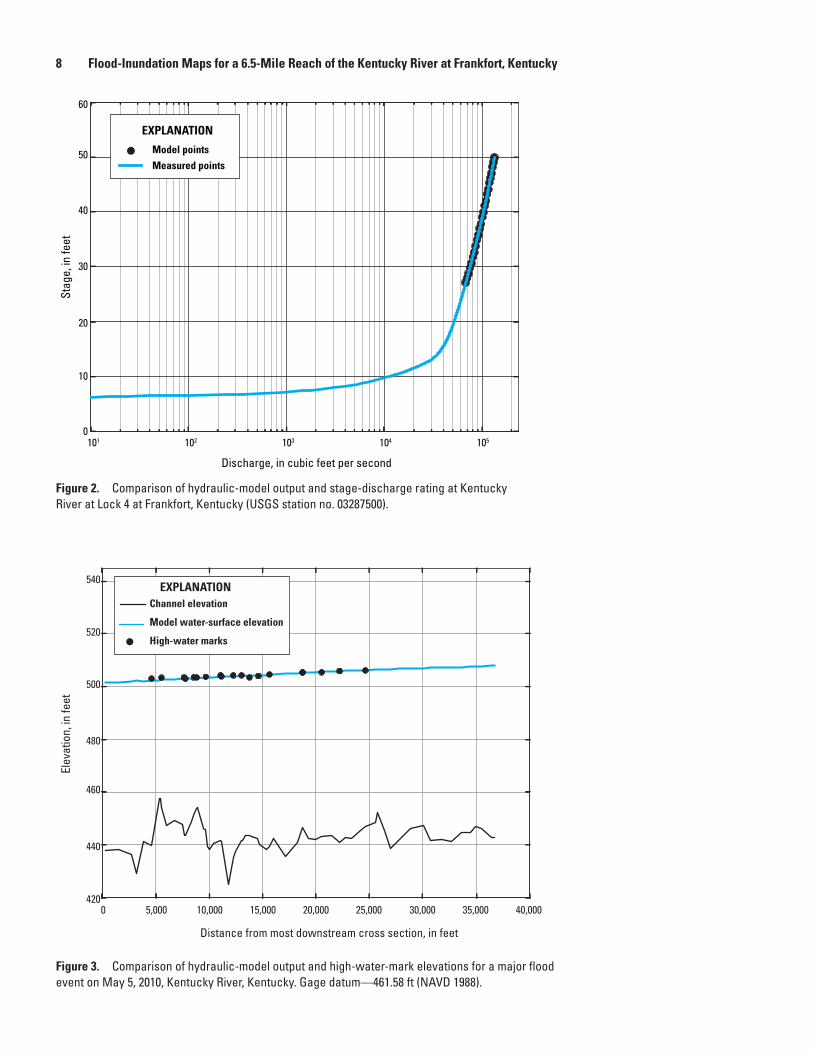
Figure 3. Comparison of hydraulic-model output and high-water-mark elevations for a major flood event on May 5, 2010, Kentucky River, Kentucky. Gage datum —461.58 ft (NAVD 1988).
Figure 2. Comparison of hydraulic-model output and stage-discharge rating at Kentucky River at Lock 4 at Frankfort, Kentucky (USGS station no. 03287500).
Model points
Measured points
EXPLANATION
60
50
40
Stag
e, in
feet
Discharge, in cubic feet per second
30
20
10
101 102 103 104 1050
Channel elevation
Model water-surface elevation
High-water marks
EXPLANATION
Distance from most downstream cross section, in feet
4200 5,000 10,000 15,000 20,000 25,000 30,000 35,000 40,000
540
520
500
480
Elev
atio
n, in
feet
460
440

Inundation Mapping 9
Inundation Mapping
Flood-inundation maps were created for a river reach near Frankfort, Kentucky, referenced to a USGS streamgage site, station 03287500 (Kentucky River at Lock 4 at Frank-fort, Kentucky), which is also an NWS flood-forecast point. The inundation maps were created in ArcGIS, a geographic information system, by combining the water-surface profiles from the hydraulic model and DEM data. The DEM data were derived from 5.0-ft-horizontal-resolution LiDAR data with a vertical accuracy of 0.229 ft, obtained from Photo Science, Inc. Estimated flood-inundation datasets for each simulated water-surface profile were developed with HEC–GeoRAS software (U.S. Army Corps of Engineers, 2009). HEC–Geo-RAS is a set of procedures, tools, and utilities for processing geospatial data in ArcGIS by use of a graphical user inter-face. The interface allows the preparation of geometric data for import into HEC–RAS and processes simulation results exported from HEC–RAS (U.S. Army Corps of Engineers, 2010). The datasets produced by using HEC-GeoRAS included flood-inundation polygons and water depth grids. The procedure used to create the datasets for each simulated water-surface profile included creating a bounding polygon that defined the analysis extent for mapping the inundation. Then, surfaces containing the water-surface elevation for each simulated water-surface profile were created within the analysis extent. Lastly, the DEM was subtracted from each surface containing the water-surface elevation for each simu-lated water-surface profile, resulting in the final water depth grids. The water depth grids were then converted to the final flood-inundation polygons representing the inundation extent. The HEC-GeoRAS results were modified to ensure a hydrauli-cally reasonable transition of the boundary between modeled cross sections relative to the contour data for the land surface. The resulting inundation maps have a vertical accuracy of about 1.0 ft. The maps show estimated flood-inundated areas overlaid on high-resolution, georeferenced aerial photographs of the study area for each water-surface profile generated by the hydraulic model.
Kentucky River, Kentucky, Flood-Inundation Maps on the Internet
The flood-inundation maps and current study docu-mentation are available online at the U.S. Geological Survey Publications Warehouse (http://dx.doi.org/10.3133/sim3278/). Also, a Flood Inundation Mapping Science Web site has been established to provide a portal for USGS flood-inundation study information to the public at http://water.usgs.gov/osw/flood_inundation/. That Web portal has a link (http://wim.usgs.gov/FIMI/FloodInundationMapper.html) to interactive online map libraries that can be downloaded in several commonly used electronic file formats. In the latter link, each stream reach displayed contains further links to NWISWeb graphs of
the current stage and streamflow at USGS station 03287500 to which the inundation maps are referenced. A link also is pro-vided to the NWS AHPS site (http:/water.weather.gov/ahps/) so that the user can obtain applicable information on fore-casted peak stage. The estimated flood-inundation maps are displayed in sufficient detail to note the extent of flooding with respect to individual structures so that preparations for flood-ing and decisions for emergency response can be performed efficiently. Roadways and bridges were closely reviewed and are shown as shaded (inundated and likely impassable) or not shaded (dry and passable) to facilitate emergency planning and use. The policy set forth by the National Weather Service is that a bridge is considered to be inundated when the water-surface elevation exceeds the low chord (“low steel,” or low member) of the bridge. However, buildings that are shaded do not reflect inundation but denote that bare-earth surfaces in the vicinity of the buildings are inundated. When the water depth (as indicated in the Web Mapping Application by holding the cursor over an inundated area) in the vicinity of the building of interest exceeds that building’s height, the structure can be considered fully submerged.
Disclaimer for Flood-Inundation Maps
Inundated areas shown should not be used for navigation, regulatory, permitting, or other legal purposes. The USGS provides these maps “as-is” for a quick reference, emergency planning tool but assumes no legal liability or responsibility resulting from the use of this information.
Uncertainties and Limitations for Use of Flood-Inundation Maps
Although the flood-inundation maps represent the bound-aries of inundated areas with a distinct line, some uncertainty is associated with these maps. The flood boundaries shown were estimated on the basis of stages (water-surface eleva-tions) and streamflows at selected USGS streamgages. Water-surface elevations along the stream reaches were estimated by steady-state hydraulic modeling, assuming unobstructed flow, and using streamflows and hydrologic conditions anticipated at the USGS streamgage. The hydraulic model reflects the land-cover characteristics and any bridge, dam, levee, or other hydraulic structures existing as of June 2013. Unique meteo-rological factors (timing and distribution of precipitation) may cause actual streamflows along the modeled reach to vary from those assumed during a flood, which may lead to devia-tions in the water-surface elevations and inundation boundar-ies shown. Additional areas may be flooded due to unantici-pated conditions such as changes in the streambed elevation or roughness, backwater into small tributaries along the study reach, or backwater from localized debris or ice jams. The accuracy of the floodwater extent portrayed on these maps will vary with the accuracy of the digital elevation model used to simulate the land surface.

10 Flood-Inundation Maps for a 6.5-Mile Reach of the Kentucky River at Frankfort, Kentucky
If this series of flood-inundation maps will be used in conjunction with NWS river forecasts, the user should be aware of additional uncertainties that may be inherent or fac-tored into NWS forecast procedures. The NWS uses forecast models to estimate the quantity and timing of water flowing through selected stream reaches in the United States. These forecast models (1) estimate the amount of runoff generated by precipitation and snowmelt, (2) simulate the movement of floodwater as it proceeds downstream, and (3) predict the flow and stage (water-surface elevation) for the stream at a given location (AHPS forecast point) throughout the forecast period (every 6 hours and 3 to 5 days out in many locations). For more information on AHPS forecasts, please see http://water.weather.gov/ahps/pcpn_and_river_forecasting.pdf.
Summary
A series of estimated flood-inundation maps were developed in cooperation with the City of Frankfort Office of Emergency Management for the Kentucky River at Frankfort, Kentucky. These maps, available through a USGS Web portal, in conjunction with the real-time stage data from the USGS streamgage 03287500 (Kentucky River at Lock 4 at Frankfort, Kentucky) and National Weather Service flood-stage fore-casts, will help to guide the general public in taking individual safety precautions and will provide city officials with a tool to efficiently manage emergency flood operations and flood mitigation efforts.
The maps were developed by using the U.S. Army Corps of Engineers’ HEC–RAS and HEC-GeoRAS programs to compute water-surface profiles and to delineate estimated flood-inundation areas for selected stream stages. The maps show estimated flood-inundation areas overlaid on high-resolution, georeferenced aerial photographs of the study area for stream stages between 27 ft and 52 ft at station 03287500. The maps are available at the USGS Web portal at http://dx.doi.org/10.3133/sim3278/ and at the USGS Flood Inunda-tion Mapping Science Web site at http://wim.usgs.gov/FIMI/FloodInundationMapper.html, where users can interact with the maps and gain a general indication of depth of water at any point.
References Cited
Chow, V.T., 1959, Open-channel hydraulics: New York, McGraw-Hill, 680 p.
Federal Emergency Management Agency, 2007, Flood insur-ance study for Franklin County, Kentucky: Washington D.C., Flood Insurance Study 21073CV000B.
Federal Emergency Management Agency, 2013, Flood insur-ance study Web page, accessed August 28, 2013, at http://www.fema.gov/floodplain-management/flood-insurance-study.
Python Software Foundation, 2013, Python programming lan-guage, accessed August 28, 2013, at http://www.python.org/.
U.S. Army Corps of Engineers, Hydrologic Engineering Center, 2009, HEC-GeoRAS, GIS tools for support of HEC–RAS using ArcGIS—User’s manual, version 4.2 [variously paged].
U.S. Army Corps of Engineers, Hydrologic Engineering Center, 2010, HEC–RAS River Analysis System— Hydraulic Reference Manual, version 4.1 [variously paged].
U.S. Census Bureau, 2012, 2012 Census interactive population search, KY—Frankfort town: Washington, D.C., accessed August 28, 2013, at http://quickfacts.census.gov/qfd/states/21/2128900.html.
Glossary
Annual exceedance probability The probability that a par-ticular flood size will occur in any given year. As an example, a 1-percent annual exceedance probability flood has a 1-per-cent chance of being equaled or exceeded in any single year. A 1-percent annual exceedance probability flood is also referred to as a “100-year flood.”DEM Digital elevation model (DEM), a digital file consisting of terrain elevations for ground positions at regularly spaced horizontal intervals.Depth grid A digital file consisting of the mathematical dif-ference between the water-elevation surface and ground-eleva-tion surface for ground positions at regularly spaced horizontal intervals.Gage height Term used by the USGS National Water Infor-mation System display to describe the height of water above the datum at a streamgage. It is synonymous with stage.Inundation surfaces Surfaces representing areas covered by water, derived as the mathematical difference between the water-elevation surface and ground-elevation surface.Rating curve The relation between stage and discharge at a cross section in a river. Stage Term used by the National Weather Service to describe the height of water above the datum at a streamgage. It is synonymous with gage height. Water-surface elevation Elevation of water at a streamgage determined by adding the gage height of the water to the datum for the streamgage. Water-surface profile A diagram showing how the elevation of a river changes along its centerline.


Lant— Flood-Inundation M
aps for a 6.5-Mile Reach of the Kentucky River at Frankfort, Kentucky —
Scientific Investigations Map 3278
ISSN 2329-132X (online)http://dx.doi.org/10.3133/sim3278