flint water press conferenceflintwaterstudy.org/.../09/vt_edwards_09.15.2017-final.pdfjeffrey parks,...
TRANSCRIPT

Flint WaterPress Conference
September 15, 2017
1

1) Five rounds of lead in water testing (led by Ms. LeeAnne Walters and Flint residents)
Round 1 and 5 Funded by Virginia Tech.
Rounds 2-4 Funded by U.S. EPA R5
2) A special study of Legionella testing
Initial data funded by the State of Michigan;
Follow-up sampling funded by Virginia Tech
2

Flint resident sampling:August 2015 - August 2017
Min Tang, Kelsey Pieper, Sid Roy, Jeffrey Parks, and Marc Edwards
3

Sampling in August 2017Sampling organized by LeeAnne Walters and the Flint citizen science team
4
Flint Citizen Science Team Leaders: LeeAnne Walters, Dennis
Walters, Matt Smith, Tracy Hacker, Tonya Williams, Kaylie Mosteller,
Carrie Nelson, Claire McClinton, Keri Webber, Jessica Owens

Sampling protocol
Collected water samples from a cold water tap that is used for drinking water
1 L
First draw
Home Plumbing
500 mL
1 min flush
Service Line
125 mL
3 min flush
Flushed Water
Flush for
2 minutes
6+ hour
stagnation
Flush for
45 seconds
5

Sampling protocol
1 L
First draw
Home Plumbing
500 mL
1 min flush
Service Line
125 mL
3 min flush
Flushed Water
Flush for
2 minutes
6+ hour
stagnation
Flush for
45 seconds
6
2015 2016 2017
Aug. 2015
First Round
Mar. 2016
Second Round
Jul. 2016
Third RoundAug. 2017
Fifth Round
Nov. 2016
Fourth Round

Sampling protocol
1 L
First draw
Home Plumbing
500 mL
1 min flush
Service Line
125 mL
3 min flush
Flushed Water
Flush for
2 minutes
6+ hour
stagnation
Flush for
45 seconds
7
2015 2016 2017
Aug. 2015
First Round
Mar. 2016
Second Round
Jul. 2016
Third RoundAug. 2017
Fifth Round
Nov. 2016
Fourth Round
138 homes participated
in all 5 sampling efforts
Only data from those homes is
presented herein

Service Line Material-Flint Records for the 138 Participants
8
55%
9%12%
24%
0%
10%
20%
30%
40%
50%
60%
70%
Copper
(N=76)
Galvanized
(N=12)
Lead
(N=17)
Unknown
(N=33)
Per
cen
t
Source: https://www.umflint.edu/gis/gis-center-projects

Lead pipe
Water flow without corrosion inhibitors
Mobilization of corrosion rust layers
9
April 2014: Flint discontinued corrosion control

First draw lead in August 2015(138 homes participating in all 5 rounds)
10
20.822.5
11.8
8.4 8.3
0
5
10
15
20
25
Aug. 15 Mar. 16 Jul. 16 Nov. 16 Aug. 17
90
thP
erce
nti
le L
ead
(µ
g/L
)
N=138
EPA standard1.4X

Lead pipe
Oct-Dec 2015: Connected to DWSD and added extra corrosion treatment
Water flow with corrosion inhibitors
Form new
corrosion scales
11

Lead pipe
May 2016: Promoted high-flow flushing to remove loose sediment
Water flow with corrosion inhibitors
Loose leaded
sediment
12

First draw lead in March and July 2016
13
20.822.5
11.8
8.4 8.3
0
5
10
15
20
25
Aug. 15 Mar. 16 Jul. 16 Nov. 16 Aug. 17
90
thP
erce
nti
le L
ead
(µ
g/L
)
N=138
EPA standard

First draw lead in November 2016
14
20.822.5
11.8
8.4 8.3
0
5
10
15
20
25
Aug. 15 Mar. 16 Jul. 16 Nov. 16 Aug. 17
90
thP
erce
nti
le L
ead
(µ
g/L
)
N=138
EPA standard

First draw lead in August 2017
15
20.822.5
11.8
8.4 8.3
0
5
10
15
20
25
Aug. 15 Mar. 16 Jul. 16 Nov. 16 Aug. 17
90
thP
erce
nti
le L
ead
(µ
g/L
)
N=138
EPA standard

1-min Flush Sample: Service Line
16
1.7
<1 <1
5.1
1.7
<1
0
1
2
3
4
5
6
Aug. 15 Jul. 16 Aug. 17
Med
ian
Lea
d (
µg
/L)
1-min Flush (N=138)1-min flush (N=17 with LSLs)
LSLs=Lead Service Lines

3-min Flush Sample: Flushed Water
17
<1 <1 <1
3.9
1.1 1.0
0
1
2
3
4
5
Aug. 15 Jul. 16 Aug. 17
Med
ian L
ead (
µg/L
)
3-min Flush (N=138)
3-min flush (N=17 with LSLs)
LSLs=Lead Service Lines
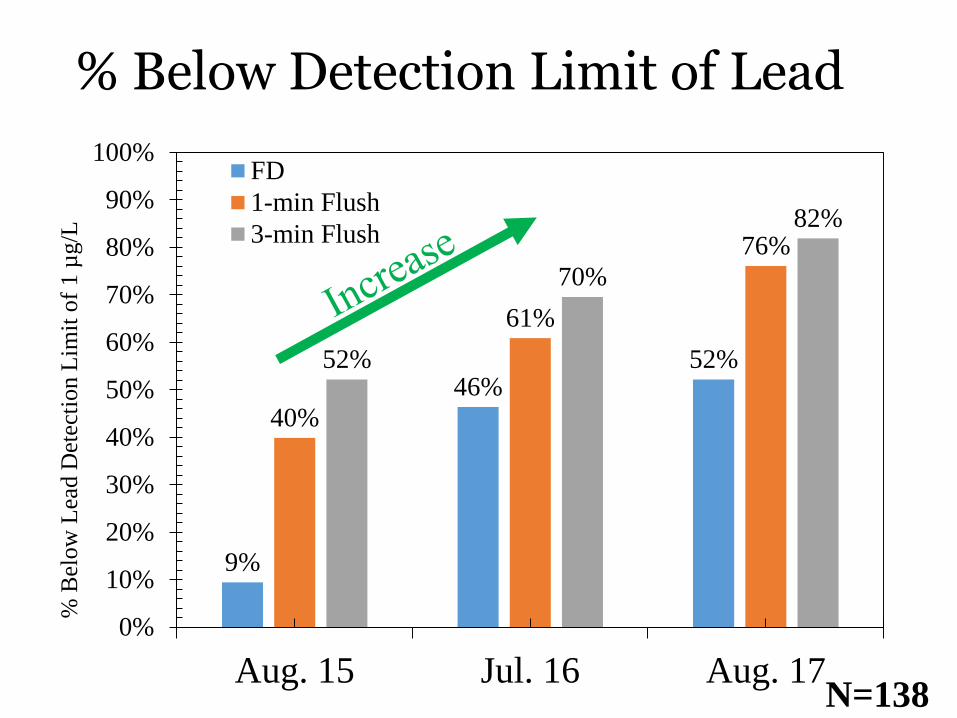
% Below Detection Limit of Lead
18
9%
46%52%
40%
61%
76%
52%
70%
82%
0%
10%
20%
30%
40%
50%
60%
70%
80%
90%
100%
Aug. 15 Jul. 16 Aug. 17
% B
elow
Lea
d D
etec
tion
Lim
it o
f 1 µ
g/L
FD
1-min Flush
3-min Flush
N=138

% Below Detection Limit of Iron
19
1%
22%
44%
2%
33%
46%
2%
34%
55%
0%
10%
20%
30%
40%
50%
60%
Aug. 15 Jul. 16 Aug. 17
% B
elo
w D
etec
tio
n L
imit
of
10
µg/L
FD
1-min Flush
3-min Flush
N=138
RYAN GARZA/APLEEANNE WALTERS

% Below Detection Limit of Iron
20
1%
22%
44%
2%
33%
46%
2%
34%
55%
0%
10%
20%
30%
40%
50%
60%
Aug. 15 Jul. 16 Aug. 17
% B
elo
w D
etec
tio
n L
imit
of
10
µg/L
FD
1-min Flush
3-min Flush
N=138
RYAN GARZA/APLEEANNE WALTERS
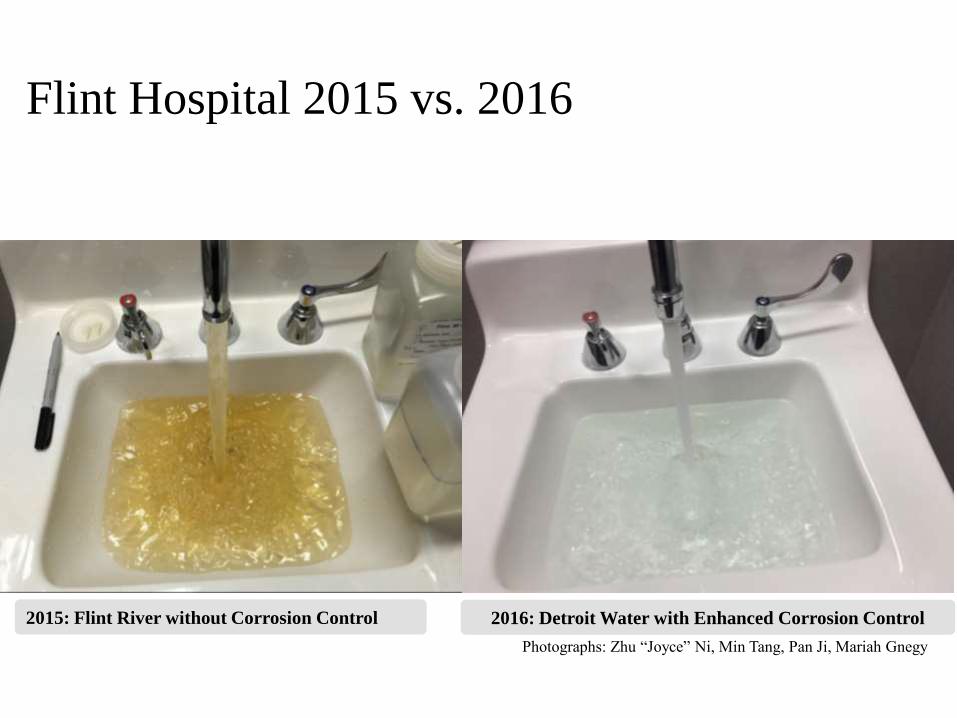
2015: Flint River without Corrosion Control 2016: Detroit Water with Enhanced Corrosion Control
Flint Hospital 2015 vs. 2016
Photographs: Zhu “Joyce” Ni, Min Tang, Pan Ji, Mariah Gnegy

% Below Detection Limit of Iron
22
1%
22%
44%
2%
33%
46%
2%
34%
55%
0%
10%
20%
30%
40%
50%
60%
Aug. 15 Jul. 16 Aug. 17
% B
elo
w D
etec
tio
n L
imit
of
10
µg/L
FD
1-min Flush
3-min Flush
N=138

% Below Detection Limit of Iron
23
1%
22%
44%
2%
33%
46%
2%
34%
55%
0%
10%
20%
30%
40%
50%
60%
Aug. 15 Jul. 16 Aug. 17
% B
elo
w D
etec
tio
n L
imit
of
10
µg/L
FD
1-min Flush
3-min Flush
N=138
FROM LEEANNE WALTERS’ HOUSE

Calculated LCR Results(using sample pool with 50% lead service line homes)
24
• Use data from 17 homes with lead pipes• Randomly select 17 homes from the remaining 88 homes
without lead pipes but built after 1986• Calculate 90th percentile for the 34 selected homes for each of 10
simulations
N=34Error bar denotes a 95% confidence interval.
30.7
13.0
9.8
0
5
10
15
20
25
30
35
40
Aug. 15 Jul. 16 Aug. 17
90
thP
erce
nti
le L
ead (
µg/L
)
EPA standard
3.1x

The 10th round of State Extended Sentinel data indicates 90 percent of the Tier 1 samples are at or below 6 µg/L.
25
Conclusions
1. State data indicate Flint is meeting the lead action level. Flint citizen and VT sampling confirm that.
2. Lead and iron levels have decreased very significantly compared to first sampling event in August 2015.
3. Residents should continue to use lead filters or bottled water until further notice from the State or EPA, to avoid lead mobilized by infrastructure upgrades and “normal” (but still too high by modern standards) levels of lead from pipes
26

Water Heater Study: Update
William Rhoads, Taylor Bradley, Amy Pruden and Marc Edwards
27

Previous Press Conferences Reporting on this Study
• Tang, M.; Rhoads, W.J.; Strom, O.; Edwards, M.A. Flint Water Press Conference. December 2, 2016. Available: http://flintwaterstudy.org/2016/12/flint-water-study-press-conference-12-2-2016/ (Accessed 8/2/2017).
• Pieper, K.; Bradley, T.; Rhoads, W.J.; Edwards, M.A. Flint Water Press Conference. August 11, 2016. Available: http://flintwaterstudy.org/2016/08/flint-water-press-conference-august-11-2016/ (Accessed 8/2/2017).
28

Legionnaires’ Disease Incidence
91 confirmed cases; 12 deaths
29

Water Quality Testing in Homes
July 2016 – 30 Homes
• Tested water
• Metals (Pb, Fe, Al, Cu)
• Chemistry (Cl2, pH, temperature)
• Legionella
• Implemented intensive water heater cleaning protocol
• Very low detection rate of culturable Legionella
• 2 out of 30 homes positive
Sacrificial Anode
Rod
Sediment Accumulation
Fe tank corrosion
Iron, Lead, Aluminum
[Cl2]
30

L. pneumophila serogroup 1 – identified in 85% of clinical isolates
Monoclonal Antibiody Group 2 (MAb2)
L. pneumophila serogroup 1 MAb2 is observed in 94% of outbreak cases
Legionella bacteria is the cause of Legionnaires’ disease and Pontiac fever
31

Follow-Up Sampling in One of the Homes
Culture L. pneumophila serogroup 1, MAb2 positive?Kitchen Tap: July 2016 Nov. 2016
“Distribution System Water” Yes NoCold Water Yes NoHot Water Yes No
32

Possible Explanations for Improved Water Quality with Respect to Legionella
• Amount of time back on Detroit water
• General Improved water quality stability
• Chlorine residuals throughout system
• Reduced Iron
• Increased water heater temperature
• Hot water temperature = 53.7 °C (128.7 °F)
• Seasonality
• Cooler weather = cooler water in mains
33

Follow up sampling Aug 2017
• Culturable Legionella in hot water
• Not serogroup 1 or MAb2 positive
• Concentration was very low
• 0.025 CFU/mL (Below accurate quantification level)
• Levels of concern (French Guideline)
• 1 CFU/mL (40X higher than what we detected)
34
Since initial sampling, we have not detected
the strain of Legionella most commonly
associated with disease outbreak.

Legionnaires’ incidence Jan-Aug
35
0
5
10
15
20
25
30
35
40
2011 2012 2013 2014 2015 2016 2017
Legio
nnaires'
Dis
ease
Incid
ence,
Jan-A
ug (
cases)
5-yr avg. on DWSD water (Jan-Aug)*
*Dotted line indicates average of 2011-2017, but
excludes time on the Flint River (2014 and 2015)

36
Flint Citizen Science Team

Thank you!
37