flinders ranges, south australia using remote sensing, gis,
TRANSCRIPT
water
Article
Identification of Groundwater Potential Recharge Zones inFlinders Ranges South Australia Using Remote Sensing GISand MIF Techniques
Alaa Ahmed 12 Abdullah Alrajhi 3 and Abdulaziz S Alquwaizany 3
Citation Ahmed A Alrajhi A
Alquwaizany AS Identification of
Groundwater Potential Recharge
Zones in Flinders Ranges South
Australia Using Remote Sensing GIS
and MIF Techniques Water 2021 13
2571 httpsdoiorg103390
w13182571
Academic Editor
Ahmed Abou-Shady
Received 30 July 2021
Accepted 13 September 2021
Published 17 September 2021
Publisherrsquos Note MDPI stays neutral
with regard to jurisdictional claims in
published maps and institutional affil-
iations
Copyright copy 2021 by the authors
Licensee MDPI Basel Switzerland
This article is an open access article
distributed under the terms and
conditions of the Creative Commons
Attribution (CC BY) license (https
creativecommonsorglicensesby
40)
1 Centre for Scarce Resources and Circular Economy (ScaRCE) UniSA STEM University of South AustraliaMawson Lakes Adelaide SA 5095 Australia ahmedaaunisaeduau
2 Geology Department Division of Water Resource Desert Research Center Mathaf El Matariya StreetCairo 11753 Egypt
3 King Abdulaziz City for Science and Technology King Abdullah Road Riyadh 11442 Saudi Arabiaaalrajhikacstedusa
Correspondence aquwaizanykacstedusa Tel +966-114-814354
Abstract In Australia water resource management is a major environmental biological and socio-economic issue and will be an essential component of future development The Hawker Areaof the central Flinders Ranges South Australia suffers from a lack of reliable data to help withwater resource management and decision making The present study aimed to delineate and assessgroundwater recharge potential (GWRP) zones using an integration between the remote sensing(RS) geographic information system (GIS) and multi-influencing factors (MIF) approaches in theHawker Area of the Flinders Ranges South Australia Many thematic layers such as lithologydrainage density slope and lineament density were established in a GIS environment for the purposeof identifying groundwater recharge potential zones A knowledge base ranking from 1 to 5 wasassigned to each individual thematic layer and its categories depending on each layerrsquos importanceto groundwater recharge potential zones All of the thematic layers were integrated to create acombined groundwater potential map of the study area using weighting analysis in ArcGIS softwareThe groundwater potential zones were categorized into three classes good moderate and low Theresulting zones were verified using available water data and showed a relative consistency with theinterpretations The findings of this study indicated that the most effective groundwater potentialrecharge zones are located where the lineament density is high the drainage density is low andthe slope is gentle The least effective areas for groundwater recharge are underlain by shale andsiltstone The results indicated that there were interrelationships between the groundwater rechargepotential factors and the general hydrology characteristics scores of the catchment MIF analysisusing GIS mapping techniques proved to be a very useful tool in the evaluation of hydrogeologicalsystems and could enable decision makers to evaluate better manage and protect a hydrogeologicalsystem using a single platform
Keywords remote sensing geographic information system multi-influencing factors techniquegroundwater potential recharge zones Flinders Ranges South Australia
1 Introduction
In Australia groundwater is vital for domestic agricultural mining and industrialpurposes [1] It makes up approximately 17 of the available water resources and over30 of the total water consumption and is accessible to 60 of the continentrsquos total area [2]In last decades most of the continent has faced water scarcity due to the overuse of ground-water that led to an unacceptable decline in water levels causing serious issues such asincreased groundwater salinity high pumping costs seawater intrusion and loss of accessto groundwater by users and ecosystems [1] Traditional methods such as geophysical and
Water 2021 13 2571 httpsdoiorg103390w13182571 httpswwwmdpicomjournalwater
Water 2021 13 2571 2 of 18
hydrogeological techniques that have been used in groundwater potential assessment arecostly and time-consuming The delineation and identification of potential groundwaterzones have become more attainable with the utilization of geospatial methods and satelliteimages which have been widely used in recent years Mapping of groundwater resourcesand planning for future resources are urgently needed to overcome the problem of limitedwater supply and increasing demand for water The determination of the distributionof groundwater recharge potential zones is a useful tool for sustainable groundwatermanagement
The occurrence and movement of groundwater are affected by the type thicknessand structural fabric of the underlying rocks denudation structural features topographydrainage and the climate [3ndash6] The impact of these factors on groundwater recharge variesfrom location to location For example linear features such as fractures and faults can actas conduits or barriers for groundwater flow [7ndash9] Therefore they are highly influentialfactors in identifying recharge potential zones In general buffer zones of 300ndash500 m nearthe lineament are favorable zones for groundwater recharge [10] It is essential howeverto consider all factors in order to delineate and identify the groundwater recharge potential(GWRP) of an area
Identification of the GWRP is traditionally completed using hydrogeological geo-logical and geophysical investigations and soil moisture modelling [11ndash14] Howevermost in situ investigation methods are expensive time-consuming require skilled humanresources and are not feasible for the evaluation of the recharge potential at the catchmentscale [515] Currently the integration of remote sensing (RS) and geographic informationsystem (GIS) technology is used as a faster more accurate and more cost-efficient wayto identify the various factors relevant to the GWRP [16ndash18] Various studies around theworld have been carried out to identify and delineate groundwater recharge potentialzones by integrating RS and GIS techniques [1619ndash23] Most of these studies have beenbased on integrating the relative weights of different thematic layers such as the geol-ogy geomorphology lineament density drainage density and slope etc within the GISenvironment [52425] The assignment of the relative weights is subjective and basedon literature reviews andor expert knowledge [152627] The multi-influencing factor(MIF) approach in GIS is commonly used for the identification of GWRP based on theinterrelationships of the different factors [27] This approach has attained its popularityfrom its practical applications prior to introducing costly field explorations [52527]
The Flinders Ranges is located in South Australia (Figure 1) Groundwater is the mainsource of fresh water in the region and has played a significant role since the Europeansettlement The region depends on groundwater stored in fractured rock aquifers forvarious purposes [28] Therefore it is essential to understand this valuable water resourceto ensure its sustainable development and management The main aim of this study was todelineate and evaluate the GWRP for a selected catchment in the Flinders Ranges SouthAustralia through the integrated use of the geospatial (RS and GIS) and multi-influencefactor (MIF) approach
11 Overview of the Study Area
The Hawker Area is located 370 km north of Adelaide in the Flinders Ranges SouthAustralia The study area extended from latitude 3139prime to 3250prime south and longitude13820prime to 13850prime east covering an area of 9164 km2 (Figure 1) The elevation ranges from240 to 950 m The climate of the area is characterized by semi-arid to arid conditions withhot and dry summers and cool to mild winters with low annual rainfall The wet periodextends from May through October while the dry period occurs between November andApril (Figure 2) During the dry period tropical lows in northern Australia may causeoccasional thunderstorms with heavy rainfalls The average annual rainfall varies frommore than 300 mm in the higher elevation areas to below 200 mm at lower elevation areasThe summer temperature ranges from 28 to 40 C and winter temperatures range from 6 to22 C (httpwwwbomgovau) (accessed on 12 July 2021)
Water 2021 13 2571 3 of 18
1
Figure 1 Location of the study area showing the wellsrsquo locations in the Hawker Area
Water 2021 13 x FOR PEER REVIEW 4 of 19
Figure 2 Modern climate of the study area Monthly average temperature (Red dotes) and precipi-tation (black column) at Hawker Weather Station (1980ndash2021) Data source The Australia Bureau of Meteorology httpwwwbomgovau) (accessed on 12 July 2021)
12 Geology and Hydrogeology The study area is a part of the Adelaide Fold Belt which consists of Paleoproterozoic
to Mesoproterozoic basement rocks extending beyond a thick sedimentary sequence that is Neoproterozoic to Cambrian [29ndash31] The crystalline basement and the overlying sedi-mentary rocks were deformed in an orogenic setting in the late Cambrianndashearly Ordovi-cian Delamerian Orogeny to form the typical strike ridges of the Flinders Ranges (Figure 3) Structurally the study area is fragmented by an anticlinendashsyncline NW and NNW fold system resulting in a series of parallel ridges separated by relatively wide valleys [30] The ridges are dominated by high resistance Cambrian and Neoproterozoic quartzites and limestones and calcareous meta-siltstones (Wilpena Umberatana and Hawker groups) while alluvial deposits are outcropped in valleys and low topographic areas
0
5
10
15
20
25
30
35
0
5
10
15
20
25
30
35
40
Jan Feb Mar Apr May Jun Jul Aug Sep Oct Nov DecMonth
Tem
pera
ture
(deg
ree)
Rai
nfal
l (m
m)
Rainfall Temperature
Figure 2 Modern climate of the study area Monthly average temperature (Red dotes) and precipita-tion (black column) at Hawker Weather Station (1980ndash2021) Data source The Australia Bureau ofMeteorology httpwwwbomgovau) (accessed on 12 July 2021)
12 Geology and Hydrogeology
The study area is a part of the Adelaide Fold Belt which consists of Paleoproterozoicto Mesoproterozoic basement rocks extending beyond a thick sedimentary sequence that isNeoproterozoic to Cambrian [29ndash31] The crystalline basement and the overlying sedimen-tary rocks were deformed in an orogenic setting in the late Cambrianndashearly OrdovicianDelamerian Orogeny to form the typical strike ridges of the Flinders Ranges (Figure 3)Structurally the study area is fragmented by an anticlinendashsyncline NW and NNW foldsystem resulting in a series of parallel ridges separated by relatively wide valleys [30] The
Water 2021 13 2571 4 of 18
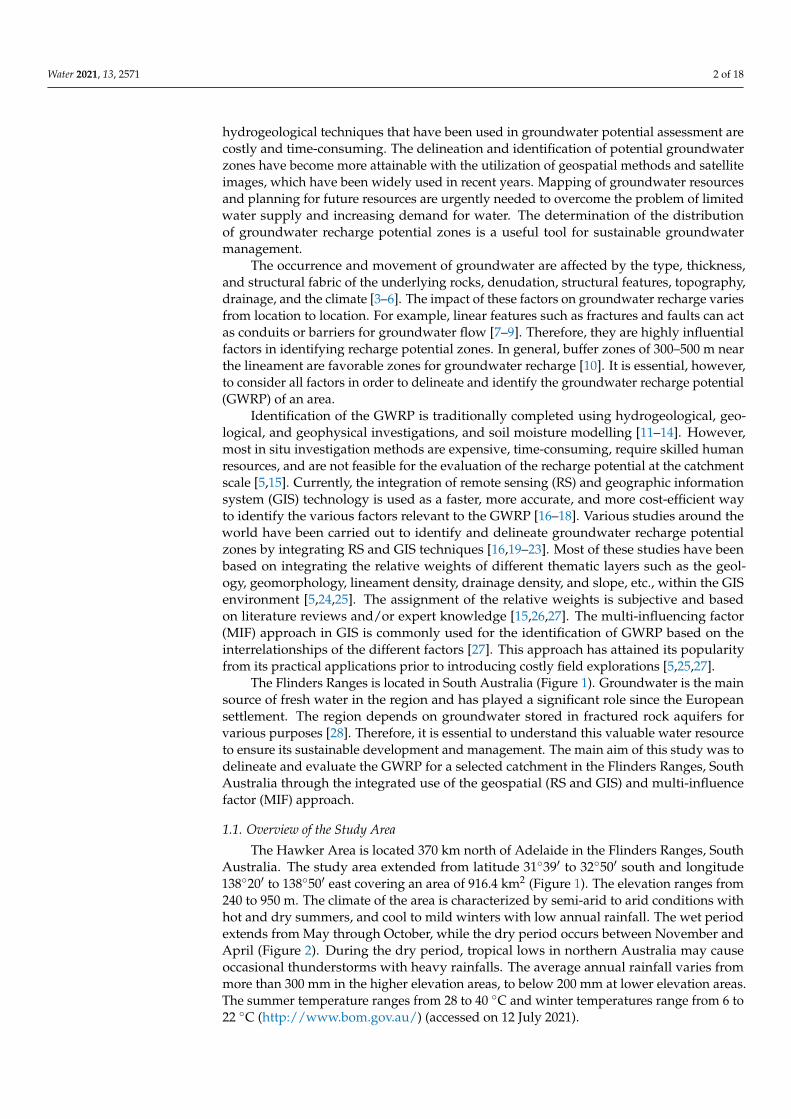
ridges are dominated by high resistance Cambrian and Neoproterozoic quartzites andlimestones and calcareous meta-siltstones (Wilpena Umberatana and Hawker groups)while alluvial deposits are outcropped in valleys and low topographic areas
Most of the information regarding the hydrogeological setting was sourced from min-eral or hydrocarbon exploration reports [34] Groundwater of variable quantity and qualityoccurs throughout the Quaternary sediments and the underlying fractured metasedi-ments [28] Throughout the study area the ridges are considered to be groundwaterdivides recharging the more distal parts in the low topographic areas The thickness of theQuaternary sediments is variable ranging from 100 m in the northwest to around 20 m inthe southeast [34]
Water 2021 13 x FOR PEER REVIEW 5 of 19
Figure 3 Stratigraphic units in the study area [31ndash33]
Most of the information regarding the hydrogeological setting was sourced from mineral or hydrocarbon exploration reports [34] Groundwater of variable quantity and quality occurs throughout the Quaternary sediments and the underlying fractured metasediments [28] Throughout the study area the ridges are considered to be ground-water divides recharging the more distal parts in the low topographic areas The thickness of the Quaternary sediments is variable ranging from 100 m in the northwest to around 20 m in the southeast [34]
2 Materials and Methods 21 Processing and Extraction of Thematic Layers
In this study groundwater recharge potential zones were delineated and evaluated by preparing and integrating RS and GIS data Five influencing factors including lithol-ogy lineament drainage slope and landcover were considered Various thematic layers of theses influencing factors were analyzed using the GIS and MIF approach to assess the GWRP zones The methodology is given in the flowchart of Figure 4
The methodology starts with identifying and assigning data sources of the various conditioning factors relevant to the groundwater potential (Table 1) followed by prepro-cessing these sources to ensure a uniform projection and resolution Data extraction and analysis were carried out using ArcGIS 107 The Advanced Spaceborne Thermal Emission
Figure 3 Stratigraphic units in the study area [31ndash33]
Water 2021 13 2571 5 of 18
2 Materials and Methods21 Processing and Extraction of Thematic Layers
In this study groundwater recharge potential zones were delineated and evaluated bypreparing and integrating RS and GIS data Five influencing factors including lithologylineament drainage slope and landcover were considered Various thematic layers oftheses influencing factors were analyzed using the GIS and MIF approach to assess theGWRP zones The methodology is given in the flowchart of Figure 4
Water 2021 13 x FOR PEER REVIEW 7 of 19
Figure 4 Materials and methods flowchart
22 Multi‑Influencing Factors Approach (MIF) The MIF approach has been extensively and successfully applied by many research-
ers in groundwater recharge potential mapping studies [335] In the MIF method all the-matic maps and their individual classes are weighted based on the literature review and according to their hydrological significance for the groundwater recharge potentiality [35] Figure 5 illustrates the conceptual diagram of the interrelationships among the dif-ferent influencing factors From the figure it is evident that the magnitude of the influence of each factor on the groundwater recharge potential can be computed and evaluated from the interrelationships among the different influencing factors (major and minor) A score of 10 was assigned for a strong relationship between the parameters while a score of 05 was given if a minor effect was found reflecting weak relationships between the factors For instance major interrelationships were observed for lineaments on landcover and drainage Therefore its evaluated weight was 20 This high weight value means that the factor significantly influences the recharge potentiality
Figure 4 Materials and methods flowchart
The methodology starts with identifying and assigning data sources of the variousconditioning factors relevant to the groundwater potential (Table 1) followed by prepro-cessing these sources to ensure a uniform projection and resolution Data extraction andanalysis were carried out using ArcGIS 107 The Advanced Spaceborne Thermal Emissionand Reflection Radiometer (ASTER GDEM) was used with topographic and geologic mapsas base maps for the delineation and evaluation of the watershed (Table 1) GDEM isprocessed in GIS environment by filling the sinks flow direction and flow accumulationgrids to extract streams watersheds and topographic and slope features
Landsat Enhanced Thematic Mapper (ETM+) imagery with free cloud cover scenes forthe year of 2015 (Path = 98 and row = 81) during summer season were best to distinguishthe spectral signatures of the different landcover types The images were preprocessedin the ENVI 54 environment to reduce or eliminate haze effects before mosaicking andsub-setting Enhancement image techniques including RGB band combinations bandrationing and decorrelation stretch of the highest contrast were applied to the Landsat
Water 2021 13 2571 6 of 18
imagery The Line Module of PCI Geomatica 2020 Software Package was then used for thedetailed automatic extraction of the lineaments The lineament density map was derivedfrom the Landsat images based on grid cell size of 50 km2 The landuselandcover (LULC)features were classified using the maximum likelihood classifier in ArcGIS 107 The LULCcategories were further verified using image interpretation elements such as drainage tonetexture and relief for the satellite images
Table 1 Data and sources used for GWRP analysis for the Hawker Area
DataSoftware Description Source Thematic Layer
Aster GDEM
14 spectral bands with a spatialresolution of 90 m in the thermal infrared(TIR) 30 m in the short-wave infrared(SWIR) and 15 m in the visible andnear-infrared (VNIR)
httpsearthdatanasagov(accessed on 12 July 2021) Drainage
Landsat Images9 spectral bands with a spatial resolutionof 30 m for bands 1 to 7 and 9 and 15 mfor band 8 (panchromatic)
httpsearthexplorerusgsgov(accessed on 12 July 2021)
Lineamentslanduse
Topographic Map 150000 httpsmapsarigsagovau(accessed on 12 July 2021) Topography
Geologic Map 1250000 Geology
Borehole data httpsmapsarigsagovau(accessed on 12 July 2021) Water layers
The average annual rainfall data for a period of 30 years was collected from the Bureauof Meteorology Australia from the grid file Then it was exported as a raster format usingGIS and processed to extract the rainfall values To overcome the low resolution of the griddata compared to the other factorsrsquo thematic layers an equal distribution of 400 points wascreated over the study area and the rainfall value was extracted and interpolated using theinverse distance weighting (IDW) method to 15 m resolution In addition groundwaterdata were retrieved from the hydrogeological database of Primary Industries and ResourcesSouth Australia (httpsmapsarigsagovau) (accessed on 12 July 2021) This databasecontains information recorded by well drillers about well location water depth wateryield and rock type The well database for the Flinders Ranges contains information forapproximately 90 of the wells in the region All of the thematic layers were then storedand classified in a geo-database as GIS layers Analyses and interpretations were conducteddirectly from the created geo-database for the influencing factors
22 Multi-Influencing Factors Approach (MIF)
The MIF approach has been extensively and successfully applied by many researchersin groundwater recharge potential mapping studies [335] In the MIF method all thematicmaps and their individual classes are weighted based on the literature review and accordingto their hydrological significance for the groundwater recharge potentiality [35] Figure 5illustrates the conceptual diagram of the interrelationships among the different influencingfactors From the figure it is evident that the magnitude of the influence of each factor on thegroundwater recharge potential can be computed and evaluated from the interrelationshipsamong the different influencing factors (major and minor) A score of 10 was assigned fora strong relationship between the parameters while a score of 05 was given if a minoreffect was found reflecting weak relationships between the factors For instance majorinterrelationships were observed for lineaments on landcover and drainage Thereforeits evaluated weight was 20 This high weight value means that the factor significantlyinfluences the recharge potentiality
Water 2021 13 2571 7 of 18Water 2021 13 x FOR PEER REVIEW 8 of 19
Figure 5 The interactive influence of the selected factors
A cumulative score weight of both major and minor effects in terms of groundwater recharge potentiality was calculated to obtain the relative score for the different influenc-ing factors (Table 2) This was further used to estimate the proposed score of each influ-encing factor as shown in the following equation S = (A + B)sum(A + B) times 100 (1)
where ldquoSrdquo is the proposed score of every selected influencing factor and ldquoArdquo and ldquoBrdquo are the major and the minor interrelationships between each two factors respectively The proposed score of every influencing factor was then divided and assigned to every reclas-sified sub-factor (Table 3) All the parameters with their potential weights were reclassi-fied and integrated into five classes by applying weighted overlay analysis in the GIS en-vironment to determine the GWRP zones
Table 2 Reclassified values of the influencing factors on the recharge potentiality
Influencing Factor Major Effect (A) Minor Effect (B) Sum (A + B) Proposed Score of Each Factor Lineament 1 + 1 0 2 19 Lithology 1 + 1 0 2 19 Drainage 1 05 15 14 Landcover 1 + 1 05 25 24 Slope 1 05 15 14 Rainfall 0 05 + 05 1 10 sum105 sum100
To obtain the GWRP map rasters with the influencing factors were overlaid using the following formula GWRP = Li times Li + Lin times Lin + As times As + Lu times Lu + Dr times Dr + Rf times Rf (2)
where Li is the lithology Lin is the lineament As is the average slope LU is the land use Dr is the drainage density Rf is the rainfall r is the rating of each class of each thematic layer and w is the weight of each thematic layer The obtained values for the GWRP were classified into three categories from 1 to 3
Figure 5 The interactive influence of the selected factors
A cumulative score weight of both major and minor effects in terms of groundwaterrecharge potentiality was calculated to obtain the relative score for the different influencingfactors (Table 2) This was further used to estimate the proposed score of each influencingfactor as shown in the following equation
S =
((A + B)
sum(A + B)
)times 100 (1)
where ldquoSrdquo is the proposed score of every selected influencing factor and ldquoArdquo and ldquoBrdquoare the major and the minor interrelationships between each two factors respectivelyThe proposed score of every influencing factor was then divided and assigned to everyreclassified sub-factor (Table 3) All the parameters with their potential weights werereclassified and integrated into five classes by applying weighted overlay analysis in theGIS environment to determine the GWRP zones
Table 2 Reclassified values of the influencing factors on the recharge potentiality
Influencing Factor Major Effect (A) Minor Effect (B) Sum (A + B) Proposed Score of Each Factor
Lineament 1 + 1 0 2 19Lithology 1 + 1 0 2 19Drainage 1 05 15 14Landcover 1 + 1 05 25 24Slope 1 05 15 14Rainfall 0 05 + 05 1 10
sum105 sum100
To obtain the GWRP map rasters with the influencing factors were overlaid using thefollowing formula
GWRP = LirtimesLiw +LinrtimesLinw +AsrtimesAsw +LurtimesLuw +DrrtimesDrw +Rfr timesRfw (2)
where Li is the lithology Lin is the lineament As is the average slope LU is the land useDr is the drainage density Rf is the rainfall r is the rating of each class of each thematiclayer and w is the weight of each thematic layer The obtained values for the GWRP wereclassified into three categories from 1 to 3
Water 2021 13 2571 8 of 18
Table 3 Classification of weighted parameters influencing the groundwater potential zone (GWPZ)
Parameter Zone Total Score Individual Score
Lithology
Alluvial sediments 19 19Sandstones 15Carbonates 11Shale and siltstone 7Metasediments 3
Lineament density (KmKm)
lt005ndash025 19 19026ndash036 15037ndash046 11047ndash057 7gt058ndash079 3
Average slope ()
lt2 14 14201ndash400 11401ndash11 81101ndash2000 5gt3000 2
Landuse and landcover
Water bodies 24 24Grazing 19Agriculture 14Conservation 9Industrial 4
Drainage density (KmKm)
Less than 025 14 14026ndash033 11034ndash039 804ndash046 5More than 046 2
Rainfall (mm)
25ndash30 10 1030ndash35 835ndash40 640ndash45 445ndash50 2
23 Verification of the GWRP
In the present study the final map obtained using the MIF approach was validatedusing an independent dataset that was not used to construct the map The observed well-yields of the water wells were obtained from the Department for Environment and WaterSouth Australia The water wells were referred to as high medium and low water yieldand used to validate the accuracy of the final groundwater recharge potential map
3 Results31 Influencing Factors
The analysis of seven major factors was performed using GIS to demonstrate andevaluate their effect on the groundwater recharge potentiality
311 Drainage and Drainage Density
The nature shape and density of drainage are essential factors that can affect therunoff flow and recharge of groundwater [26] The results indicated that the watershedshows a dendritic drainage pattern the total area (A) of the watershed is 9164 km2 andlength (LB) is 495 km (Figure 6a) Using the method proposed by Strahler (1964) thewatershed was found to comprise a six-order pattern with a total of 2646 streams of whichnearly 5036 are first order 2315 are second order 1271 are third order 722 arefourth order 363 are fifth order and 003 are sixth order streams (Table 2)
Water 2021 13 2571 9 of 18Water 2021 13 x FOR PEER REVIEW 11 of 19
(a) (b)
Figure 6 (a) Drainage Density and (b) Lineament density
Lineament density is considered a useful tool to identify ldquohot spotsrdquo of groundwater recharge potentiality [42ndash44] Lineament density (Ld) is defined as the total lineament length in a unit area It is expressed as L = ΣA L (4)
where Σ L denotes the total length of lineaments and A is the unit area The highest densities were identified in the northeast and southwest and around the
Hawker town (Figure 6b) The lineament densities in this study area were quite high which can be attributed to the geologic setting of the study area
313 Topographic and Slope Features The relief ratio (Rr) was introduced to express the difference between the highest and
the lowest elevation of the basin [45] The maximum elevation of the basin was 1000 m and the lowest was 250 m therefore the relief of the basin was 750 m The relief ratio for this area was 002 which indicated a moderate topographic nature The relief ratio and the elongated ratio of the watershed implied low resistance and more erosion and weath-ering processes which are positive for groundwater potential [36]
Basin slope (Sb) is another influencing factor which is mainly controlled by climate processes in areas outcropped by different lithologies [4647] In the present study based on the degree of the slope the watershed was classed into gentle (lt10deg) moderate (10ndash20deg) and steep (gt20deg) Gentle slopes were classified as ldquogoodrdquo for groundwater recharge as nearly flat terrain is the most favorable for infiltration (Figure 7a) Moderate slopes were categorized as ldquomoderaterdquo for groundwater recharge due to their slightly undulat-ing topography which permits partial runoff Steep slopes allow high surface runoff and a negligible amount of infiltration and therefore were assigned to the ldquopoorrdquo category for groundwater recharge
Figure 6 (a) Drainage Density and (b) Lineament density
The total length of all streams was 25896 km and ranged from 1280 km to 71 km forthe first order and sixth order respectively (Table 4) It was evident that the first orderstreams had the greatest total length of stream segments and consequently the lengthdecreased as the stream order increased Length of streams is a significant hydrologicalfactor as it reflects the runoff characteristics and hence is related to recharging aquifersStreams of smaller length are characterized by steep slopes good runoff and low rechargewhile streams with longer lengths are commonly indicative of a smoother slope low runoffand good recharge This change in stream length for the different orders indicated theimpact of altitude lithological variations and slopes More importantly it indicated thehydrological characteristics of the underlying rock of the different stream orders in thestudy area [36]
Table 4 Morphometric aspects of the study area
Parameter Formula 1st 2nd 3rd 4th 5th 6th Total
Number of streams Nu 2956 1359 746 424 213 172 5870
Number 5036 2315 1271 722 363 003
Stream length Lu 1280 646 317 195 81 71 2589
Mean length Lsm = LuNu 043 048 042 046 038 041
Drainage density (D) was introduced by Horton (1945) as the total length of the streamper unit area Drainage density provides a quantitative measure of the average length ofstreams in the whole basin Greenbaum (1985) defined the drainage density (Dd) as thetotal drainage length of the drainage in a unit area It is expressed as
Dd =sumi=n
i=1 Si
A(3)
Water 2021 13 2571 10 of 18
where sumi=ni=1 Si denotes the total length of the drainage and A is the unit of the area The
calculated drainage density of the study area was 283 kmkm2 (Figure 6a) Drainagedensity values could be linked to the permeability of the dominant landcover topographyand vegetation [37ndash39] Based on the findings the drainage density in the study area wasclassified into five categories very good good moderate poor and very poor densityGenerally low drainage density is more likely to dominate in highly permeable densevegetation and low relief areas while high drainage density occurs in low permeable lessvegetation and high relief areas [40] Accordingly high drainage areas have less waterinfiltration whereas low-density areas have high water infiltration to the aquifers [41]
312 Lineament and Lineament Density
Two main directions NEndashSW and EndashW were identified from the images The orienta-tions of the lineaments matched the faults-oriented NEndashSW throughout the study area Thelineament length distribution obtained from Landsat images showed that the lineamentlengths were highly variable (SD = 775 m) with a mean length of about 1338 m (Figure 6b)The lineament length distribution reflects high variability in lineament length and numberwhich can be attributed to the geological characteristics of the study area (Figure 6b)
Lineament density is considered a useful tool to identify ldquohot spotsrdquo of groundwaterrecharge potentiality [42ndash44] Lineament density (Ld) is defined as the total lineamentlength in a unit area It is expressed as
Ld =sumi=n
i=1A
Li (4)
where sumi=ni=1 Li denotes the total length of lineaments and A is the unit area
The highest densities were identified in the northeast and southwest and aroundthe Hawker town (Figure 6b) The lineament densities in this study area were quite highwhich can be attributed to the geologic setting of the study area
313 Topographic and Slope Features
The relief ratio (Rr) was introduced to express the difference between the highest andthe lowest elevation of the basin [45] The maximum elevation of the basin was 1000 mand the lowest was 250 m therefore the relief of the basin was 750 m The relief ratio forthis area was 002 which indicated a moderate topographic nature The relief ratio and theelongated ratio of the watershed implied low resistance and more erosion and weatheringprocesses which are positive for groundwater potential [36]
Basin slope (Sb) is another influencing factor which is mainly controlled by climateprocesses in areas outcropped by different lithologies [4647] In the present study basedon the degree of the slope the watershed was classed into gentle (lt10) moderate (10ndash20)and steep (gt20) Gentle slopes were classified as ldquogoodrdquo for groundwater recharge asnearly flat terrain is the most favorable for infiltration (Figure 7a) Moderate slopes werecategorized as ldquomoderaterdquo for groundwater recharge due to their slightly undulatingtopography which permits partial runoff Steep slopes allow high surface runoff and anegligible amount of infiltration and therefore were assigned to the ldquopoorrdquo category forgroundwater recharge
Water 2021 13 2571 11 of 18
Water 2021 13 x FOR PEER REVIEW 12 of 19
314 Lithology and Landcover In the Hawker Area while the lithological log data for the wells was not available
the lithological grouping was decided based on detailed available geological maps The geological map of the study area revealed that the high elevation features are covered by
metasediments quartzite sandstone limestone shale and siltstone and the lower elevation areas are dominated by recent alluvial sediments (Figure 7b) Different rock for-mations were assigned rankings based on their recharge potential properties Generally massive unfractured lithologic units have little influence on groundwater recharge poten-tiality while alluvial and sandstones with secondary porosity form a good potential groundwater zone
The landusecover is a significant factor that can influence the recharge infiltration and runoff process of the groundwater regime [48] In Figure 7c the primary landusecover is composed of grazing native vegetation (6855) agriculture and planta-tions (2229) conservation and natural environments (726) industrial (190) and water (lt1) Due to the high potentiality to recharge and the storage of groundwater water bodies were assigned the highest weightage Lower weightage was allocated to in-dustrial lands due to their poor water holding capacity and less infiltration Agricultural areas were given moderate weightage factors and native covers were allocated the highest weightage due to their ability to reduce the speed of water flow and increase the time duration for infiltration
(a) (b)
Water 2021 13 x FOR PEER REVIEW 13 of 19
(c) (d)
Figure 7 (a) Slope in degrees (b) lithology (c) landcover and (d) average rainfall in millimeters
315 Rainfall In arid areas rainfall is considered as one of the most influential factors in ground-
water recharge capability [49] Processes such as precipitation evapotranspiration and percolation can control the water availability at the land surface [35] As mentioned ear-lier rainfall is the main source for the aquifersrsquo recharge in the study area The climate of the area is classified as arid to semi-arid with a high variation in rainfall The average annual rainfall of the study area ranges from 35 to 50 mm Accordingly the annual rainfall is classified into five classes Higher rainfall potentially infiltrates into the soil and is stored in the aquifers (Figure 7d) The rainfall distribution map indicates that the annual rainfall is higher in the high topographic areas than in the low topographic areas Rainfall is typically regular in the hillslope areas in contrast to the foothill areas [50]
32 Recharge Potential Model By classifying and implementing the MIF approach the final map of the GWRP was
produced and grouped into three classes (good moderate and low) (Figure 8a) It was observed that about 2897 58 and 1303 of the areas fall under good moderate and low groundwater potential zones respectively (Figure 8b) Good groundwater potential zones were observed in the central western and small parts of the eastern areas due to the distribution of low slope high drainage density alluvial sediments high lineament density and natural and agricultural land Medium and low groundwater potential re-charge zones existed mainly in elevated areas in the southern and eastern parts of the study area where higher slopes and siltstone are the main lithology
33 Verification of the Recharge Potential Model For the purpose of verification validation of the groundwater potential map was un-
dertaken using water yield data from the study area (Figure 8bc) The water yield data was used to statistically demonstrate the failure and success relative to each obtained class of recharge potential The results showed that 2929 of the wells with a high water yield (mean = 104 LS) are sited on good areas 6286 with moderate yield (mean = 080 LS) are located on moderate areas and 786 are on poor groundwater potential recharge zones (Figure 8)
Figure 7 (a) Slope in degrees (b) lithology (c) landcover and (d) average rainfall in millimeters
314 Lithology and Landcover
In the Hawker Area while the lithological log data for the wells was not availablethe lithological grouping was decided based on detailed available geological maps Thegeological map of the study area revealed that the high elevation features are coveredby metasediments quartzite sandstone limestone shale and siltstone and the lowerelevation areas are dominated by recent alluvial sediments (Figure 7b) Different rockformations were assigned rankings based on their recharge potential properties Gener-
Water 2021 13 2571 12 of 18
ally massive unfractured lithologic units have little influence on groundwater rechargepotentiality while alluvial and sandstones with secondary porosity form a good potentialgroundwater zone
The landusecover is a significant factor that can influence the recharge infiltrationand runoff process of the groundwater regime [48] In Figure 7c the primary landusecoveris composed of grazing native vegetation (6855) agriculture and plantations (2229)conservation and natural environments (726) industrial (190) and water (lt1) Dueto the high potentiality to recharge and the storage of groundwater water bodies wereassigned the highest weightage Lower weightage was allocated to industrial lands dueto their poor water holding capacity and less infiltration Agricultural areas were givenmoderate weightage factors and native covers were allocated the highest weightage due totheir ability to reduce the speed of water flow and increase the time duration for infiltration
315 Rainfall
In arid areas rainfall is considered as one of the most influential factors in ground-water recharge capability [49] Processes such as precipitation evapotranspiration andpercolation can control the water availability at the land surface [35] As mentioned earlierrainfall is the main source for the aquifersrsquo recharge in the study area The climate of thearea is classified as arid to semi-arid with a high variation in rainfall The average annualrainfall of the study area ranges from 35 to 50 mm Accordingly the annual rainfall isclassified into five classes Higher rainfall potentially infiltrates into the soil and is stored inthe aquifers (Figure 7d) The rainfall distribution map indicates that the annual rainfall ishigher in the high topographic areas than in the low topographic areas Rainfall is typicallyregular in the hillslope areas in contrast to the foothill areas [50]
32 Recharge Potential Model
By classifying and implementing the MIF approach the final map of the GWRP wasproduced and grouped into three classes (good moderate and low) (Figure 8a) It wasobserved that about 2897 58 and 1303 of the areas fall under good moderate andlow groundwater potential zones respectively (Figure 8b) Good groundwater potentialzones were observed in the central western and small parts of the eastern areas due to thedistribution of low slope high drainage density alluvial sediments high lineament densityand natural and agricultural land Medium and low groundwater potential recharge zonesexisted mainly in elevated areas in the southern and eastern parts of the study area wherehigher slopes and siltstone are the main lithology
33 Verification of the Recharge Potential Model
For the purpose of verification validation of the groundwater potential map wasundertaken using water yield data from the study area (Figure 8bc) The water yield datawas used to statistically demonstrate the failure and success relative to each obtained classof recharge potential The results showed that 2929 of the wells with a high water yield(mean = 104 LS) are sited on good areas 6286 with moderate yield (mean = 080 LS)are located on moderate areas and 786 are on poor groundwater potential rechargezones (Figure 8)
Water 2021 13 2571 13 of 18Water 2021 13 x FOR PEER REVIEW 14 of 19
(a)
(b) (c)
Figure 8 (a) Recharge potential map (b) Recharge potential classesrsquo areas and (c) Recharge potential classes against num-ber of wells () and average yield
4 Discussions Influencing factors related to groundwater recharge potentiality were selected and
weighted in order to identify favorable zones for recharge using the RS GIS and MIF approach The findings indicated that the groundwater regime of arid regions is mainly controlled by the topography geology fracture systems and climatic conditions As shown in this study the various groundwater potential recharge zones are distributed along the study area The northern and western parts near lineaments with low drainage density and where secondary structures and alluvial lithology are located are character-ized as good groundwater potential recharge areas (Figure 9) The central areas which are dominated by a low lineament density and high slope features are classified as low re-charge potential areas This variability in groundwater potentiality can be attributed to
010203040506070
Good Moderate Poor
Area
Recharge Potential Class
000
020
040
060
080
100
120
010203040506070
Good Moderate Poor
Aver
age
Yeild
(LS
)
Num
ber o
f Wel
l (
)
Recharge Potential Class
Figure 8 (a) Recharge potential map (b) Recharge potential classesrsquo areas and (c) Recharge potential classes against numberof wells () and average yield
4 Discussions
Influencing factors related to groundwater recharge potentiality were selected andweighted in order to identify favorable zones for recharge using the RS GIS and MIFapproach The findings indicated that the groundwater regime of arid regions is mainlycontrolled by the topography geology fracture systems and climatic conditions Asshown in this study the various groundwater potential recharge zones are distributedalong the study area The northern and western parts near lineaments with low drainagedensity and where secondary structures and alluvial lithology are located are characterizedas good groundwater potential recharge areas (Figure 9) The central areas which aredominated by a low lineament density and high slope features are classified as low
Water 2021 13 2571 14 of 18
recharge potential areas This variability in groundwater potentiality can be attributedto many geological factors [81051] Lineaments as a structural weakness could play anessential role in groundwater potential recharge zones by increasing the infiltration capacityof the soil and facilitating the groundwater flow and movement [2649] In addition theoccurrence of lithologic units with high permeability such as alluvial sediments couldincrease groundwater storage and yields [52] These directly impact water infiltration andpercolation [2353] This infiltration capacity could also be influenced by the dominantslope gradient Gentle slopes promote groundwater recharging potentiality by providingsufficient time for infiltration while areas with steep slopes permit low recharging dueto rapid flow and low infiltration capacity [15] Drainage density is considered anothersignificant factor in identifying recharge sites because of its influence on surface runoffThe occurrence of a dense drainage system indicates high water permeability zones in theregion [54]
Water 2021 13 x FOR PEER REVIEW 15 of 19
many geological factors [81051] Lineaments as a structural weakness could play an es-sential role in groundwater potential recharge zones by increasing the infiltration capacity of the soil and facilitating the groundwater flow and movement [2649] In addition the occurrence of lithologic units with high permeability such as alluvial sediments could in-crease groundwater storage and yields [52] These directly impact water infiltration and percolation [2353] This infiltration capacity could also be influenced by the dominant slope gradient Gentle slopes promote groundwater recharging potentiality by providing sufficient time for infiltration while areas with steep slopes permit low recharging due to rapid flow and low infiltration capacity [15] Drainage density is considered another sig-nificant factor in identifying recharge sites because of its influence on surface runoff The occurrence of a dense drainage system indicates high water permeability zones in the re-gion [54]
The effects of the combination of these influencing factors on controlling the ground-water regime contribute to the recharge potentiality of different aquifers Areas with good to moderate groundwater potential zones can attribute this to the lithology slope and drainage density territories This classification could thus provide preferred targets for groundwater exploration since it combines several hydrogeological features that could affect groundwater availability The findings from this study are comparable to the find-ings of other recharge potential studies in many areas around the world [1520242755]
(a) (b)
(c) (d)
Figure 9 (a) Percentage of the water wells within the different classes of the influencing factors (bndashd) Average of the water yield against the classes of the influencing factors
However it is important to note that the delineation of the recharge potential map using the MIF method might not be a better reflection of the realities on the ground This
0
20
40
60
80
100
Wat
er W
ell
Factor
Class 1 Class 2 Class 3 Class 4 Class 5
0
05
1
15
2
0 1 2 3 4 5 6
Aver
age
Yeild
(LS
)
Class
Drainage Slope
0
20
40
60
80
100
Wat
er W
ell
Factor
Class 1 Class 2 Class 3 Class 4 Class 5
0
05
1
15
2
0 1 2 3 4 5 6
Aver
age
Yeild
(LS
)
Class
Lineament Rainfall
Figure 9 (a) Percentage of the water wells within the different classes of the influencing factors (bndashd) Average of the wateryield against the classes of the influencing factors
The effects of the combination of these influencing factors on controlling the ground-water regime contribute to the recharge potentiality of different aquifers Areas with goodto moderate groundwater potential zones can attribute this to the lithology slope anddrainage density territories This classification could thus provide preferred targets forgroundwater exploration since it combines several hydrogeological features that couldaffect groundwater availability The findings from this study are comparable to the findingsof other recharge potential studies in many areas around the world [1520242755]
Water 2021 13 2571 15 of 18
However it is important to note that the delineation of the recharge potential mapusing the MIF method might not be a better reflection of the realities on the groundThis study was limited by the absence of recent drilling flows to validate the sensitivityof the results However it appeared that the drilling program was not optimized andsuffered from a lack of preliminary investigation of groundwater availability This wasevident when comparing the locations of the wells throughout the study area The sitingof boreholes in relation to the local topography and occasionally to local fractures is themost common drilling method In many cases however social factors such as the locationof the house to be supplied or the boundary of the property determine the siting of theborehole As a result the validation of the groundwater potential map should be improvedusing recent drilling data in order to better evaluate the realities on the ground In additionthe delineation of a good recharge potential zone does not assure a 100 success rate indrilling even if the prospect appeared to be promising and verified by available wateryield data In-depth investigation is required within the proposed approach to overcomethe limitation encountered from the hypothetical interpolations of surface data
5 Conclusions
This study obtained a groundwater recharge potential map of the Hawker Area inthe Flinders Ranges South Australia using a GIS RS and MIF approach Analysis ofthe results provides ample information and analysis for decision makers Integration ofthematic maps such as drainage density lithology slope landcover rainfall and lineamentdensity could present valuable information for local authorities and planners regardingsuitable areas for groundwater recharge potentiality in the Flinders Ranges
The results showed that the most promising groundwater recharge potential zonesare located in areas with high lineament density low drainage density and gentle slopesFurthermore the data analysis suggested that alluvial sediments and sandstone havehigh infiltration capacity The areas that are least effective for groundwater recharge areunderlain by shale and siltstone and have low lineament density This was validatedby the correlation between water yield and the recharge potential categories Throughthe integration of GIS RS and MIF along with other hydrological characteristics of thedrainage basin the strategy of identifying and selecting groundwater recharge zones couldprovide better groundwater management plans
Based on the present study a number of future investigations are suggested To startwith lineament zones need to be investigated in more detail The focus should be onclassifying categorizing and exploring these lineaments by means of drilling and fieldmapping both across their width and along the strike Additionally lithological data formost of the wells are not available therefore further data are required to develop a feasibleinterpretation of the recharge potential mapping Moreover a detailed investigation ofthe water chemistry and water level should be undertaken to understand the impacts oflithology and water rock interactions to give more meaningful results This can be achievedby installing new piezometers in the monitoring boreholes to obtain hydraulic head datafor a better understanding of the flow directions Finally building on different appliedapproaches and models such as the analytical hierarchy method (AHP) and frequencyration (FR) and optimizers such as UCODE or hydroPSO as well as sensitivity analysiscould provide more meaningful results for practical applications [56ndash58]
Author Contributions Conceptualization original draft preparation and editing AA (Alaa Ahmed)methodology investigation editing AA (Abdullah Alrajhi) and editing and funding ASA Allauthors have read and agreed to the published version of the manuscript
Funding This research received no external funding
Institutional Review Board Statement Not applicable
Informed Consent Statement Not applicable
Data Availability Statement Not applicable
Water 2021 13 2571 16 of 18
Acknowledgments The authors would like to thank Abdullatif Lacina University of South Australiafor help in editing revision and improvement of the manuscript
Conflicts of Interest The authors declare that they have no known competing financial interests orpersonal relationships that could have appeared to influence the work reported in this paper
References1 Barnett S Harrington N Cook P Simmons CT Groundwater in Australia Occurrence and Management Issues In Sustainable
Groundwater Management Springer BerlinHeidelberg Germany 2020 pp 109ndash1272 Pigram J Australiarsquos Water Resources From Use to Management CSIRO Publishing Clayton South Australia 20073 Selvam S Magesh N Chidambaram S Rajamanickam M Sashikkumar M A GIS based identification of groundwater
recharge potential zones using RS and IF technique A case study in Ottapidaram taluk Tuticorin district Tamil Nadu EnvironEarth Sci 2015 73 3785ndash3799 [CrossRef]
4 Souissi D Msaddek MH Zouhri L Chenini I El May M Dlala M Mapping groundwater recharge potential zones in aridregion using GIS and Landsat approaches southeast Tunisia Hydrol Sci J 2018 63 251ndash268 [CrossRef]
5 Magesh NS Chandrasekar N Soundranayagam JP Delineation of groundwater potential zones in Theni district Tamil Naduusing remote sensing GIS and MIF techniques Geosci Front 2012 3 189ndash196 [CrossRef]
6 Ahmed AA Shabana AR Integrating of remote sensing GIS and geophysical data for recharge potentiality evaluation in WadiEl Tarfa eastern desert Egypt J Afr Earth Sci 2020 172 103957 [CrossRef]
7 Edet A Teme S Okereke C Esu E Lineament analysis for groundwater exploration in Precambrian Oban massif and Obuduplateau SE Nigeria In Proceedings of International Journal of Rock Mechanics and Mining Sciences and Geomechanics Abstracts ElsevierScience Amsterdam The Netherlands 1996 p 215A
8 Solomon S Quiel F Groundwater study using remote sensing and geographic information systems (GIS) in the central highlandsof Eritrea Hydrogeol J 2006 14 1029ndash1041 [CrossRef]
9 Sander P Lineaments in groundwater exploration A review of applications and limitations Hydrogeol J 2007 15 71ndash74[CrossRef]
10 Corgne S Magagi R Yergeau M Sylla D An integrated approach to hydro-geological lineament mapping of a semi-aridregion of West Africa using Radarsat-1 and GIS Remote Sens Environ 2010 114 1863ndash1875 [CrossRef]
11 Eilers V Carter RC Rushton KR A single layer soil water balance model for estimating deep drainage (potential recharge)An application to cropped land in semi-arid North-east Nigeria Geoderma 2007 140 119ndash131 [CrossRef]
12 Maliva RG Clayton EA Missimer TM Application of advanced borehole geophysical logging to managed aquifer rechargeinvestigations Hydrogeol J 2009 17 1547ndash1556 [CrossRef]
13 Daessleacute L Peacuterez-Flores M Serrano-Ortiz J Mendoza-Espinosa L Manjarrez-Masuda E Lugo-Ibarra K Goacutemez-Trevintildeo EA geochemical and 3D-geometry geophysical survey to assess artificial groundwater recharge potential in the Pacific coast of BajaCalifornia Mexico Environ Earth Sci 2014 71 3477ndash3490 [CrossRef]
14 Chenini I Msaddek MH Dlala M Hydrogeological characterization and aquifer recharge mapping for groundwater resourcesmanagement using multicriteria analysis and numerical modeling A case study from Tunisia J Afr Earth Sci 2019 154 59ndash69[CrossRef]
15 Singh SK Zeddies M Shankar U Griffiths GA Potential groundwater recharge zones within New Zealand Geosci Front2019 10 1065ndash1072 [CrossRef]
16 Fagbohun BJ Integrating GIS and multi-influencing factor technique for delineation of potential groundwater recharge zones inparts of Ilesha schist belt southwestern Nigeria Environ Earth Sci 2018 77 1ndash18 [CrossRef]
17 Lentswe GB Molwalefhe L Delineation of potential groundwater recharge zones using analytic hierarchy process-guided GISin the semi-arid Motloutse watershed eastern Botswana J Hydrol Reg Stud 2020 28 100674 [CrossRef]
18 Vishwakarma A Goswami A Pradhan B Prioritization of sites for Managed Aquifer Recharge in a semi-arid environment inwestern India using GIS-Based multicriteria evaluation strategy Groundw Sustain Dev 2021 12 100501 [CrossRef]
19 Senanayake I Dissanayake D Mayadunna B Weerasekera W An approach to delineate groundwater recharge potential sitesin Ambalantota Sri Lanka using GIS techniques Geosci Front 2016 7 115ndash124 [CrossRef]
20 Yeh H-F Cheng Y-S Lin H-I Lee C-H Mapping groundwater recharge potential zone using a GIS approach in HualianRiver Taiwan Sustain Environ Res 2016 26 33ndash43 [CrossRef]
21 Arabameri A Rezaei K Cerda A Lombardo L Rodrigo-Comino J GIS-based groundwater potential mapping in Shahroudplain Iran A comparison among statistical (bivariate and multivariate) data mining and MCDM approaches Sci Total Environ2019 658 160ndash177 [CrossRef] [PubMed]
22 Arshad A Zhang Z Zhang W Dilawar A Mapping favorable groundwater potential recharge zones using a GIS-basedanalytical hierarchical process and probability frequency ratio model A case study from an agro-urban region of Pakistan GeosciFront 2020 11 1805ndash1819 [CrossRef]
23 Mukherjee I Singh UK Delineation of groundwater potential zones in a drought-prone semi-arid region of east India usingGIS and analytical hierarchical process techniques Catena 2020 194 104681 [CrossRef]
24 Shaban A Khawlie M Abdallah C Use of remote sensing and GIS to determine recharge potential zones The case ofOccidental Lebanon Hydrogeol J 2006 14 433ndash443 [CrossRef]
Water 2021 13 2571 17 of 18
25 Yeh H-F Lee C-H Hsu K-C Chang P-H GIS for the assessment of the groundwater recharge potential zone Environ Geol2009 58 185ndash195 [CrossRef]
26 Das S Pardeshi SD Integration of different influencing factors in GIS to delineate groundwater potential areas using IF and FRtechniques A study of Pravara basin Maharashtra India Appl Water Sci 2018 8 1ndash16 [CrossRef]
27 Ahmed A Ranasinghe-Arachchilage C Alrajhi A Hewa G Comparison of Multicriteria Decision-Making Techniques forGroundwater Recharge Potential Zonation Case Study of the Willochra Basin South Australia Water 2021 13 525 [CrossRef]
28 Watt E Berens V Non-Prescribed Groundwater Resources AssessmentmdashAlinytjara Wilurara Natural Resources Management RegionPhase 1 South Australia Government Printer Adelaide Australia 2011
29 Preiss WV The Adelaide Geosyncline Late Proterozoic Stratigraphy Sedimentation Palaeontology and Tectonics In GeologicalSurvey of South Australia Bulletin South Australia Government Printer Adelaide Australia 1987
30 Paul E Floumlttmann T Sandiford M Structural geometry and controls on basement-involved deformation in the northernFlinders Ranges Adelaide Fold Belt South Australia Aust J Earth Sci 1999 46 343ndash354 [CrossRef]
31 Preiss W The Adelaide Geosyncline of South Australia and its significance in Neoproterozoic continental reconstructionPrecambrian Res 2000 100 21ndash63 [CrossRef]
32 Backeacute G Baines G Giles D Preiss W Alesci A Basin geometry and salt diapirs in the Flinders Ranges South AustraliaInsights gained from geologically-constrained modelling of potential field data Mar Pet Geol 2010 27 650ndash665 [CrossRef]
33 Hearon IV TE Rowan MG Lawton TF Hannah PT Giles KA Geology and tectonics of Neoproterozoic salt diapirs andsalt sheets in the eastern Willouran Ranges South Australia Basin Res 2015 27 183ndash207 [CrossRef]
34 Osei-Bonsu K Dennis KJ Robe Township Water Supply Wellfield Evaluation Department of Water Land and BiodiversityConservation South Australia Government Printer Adelaide Australia 2004
35 Agarwal R Garg P Remote sensing and GIS based groundwater potential amp recharge zones mapping using multi-criteriadecision making technique Water Resour Manag 2016 30 243ndash260
36 Sreedevi P Sreekanth P Khan H Ahmed S Drainage morphometry and its influence on hydrology in an semi arid regionUsing SRTM data and GIS Environ Earth Sci 2013 70 839ndash848 [CrossRef]
37 Jasmin I Mallikarjuna P Satellite-based remote sensing and geographic information systems and their application in theassessment of groundwater potential with particular reference to India Hydrogeol J 2011 19 729ndash740 [CrossRef]
38 Deepika B Avinash K Jayappa K Integration of hydrological factors and demarcation of groundwater prospect zones Insightsfrom remote sensing and GIS techniques Environ Earth Sci 2013 70 1319ndash1338 [CrossRef]
39 Arya S Subramani T Karunanidhi D Delineation of groundwater potential zones and recommendation of artificial rechargestructures for augmentation of groundwater resources in Vattamalaikarai Basin South India Environ Earth Sci 2020 79 1ndash13[CrossRef]
40 Nag S Ghosh P Delineation of groundwater potential zone in Chhatna Block Bankura District West Bengal India using remotesensing and GIS techniques Environ Earth Sci 2013 70 2115ndash2127 [CrossRef]
41 Bagyaraj M Ramkumar T Venkatramanan S Gurugnanam B Application of remote sensing and GIS analysis for identifyinggroundwater potential zone in parts of Kodaikanal Taluk South India Front Earth Sci 2013 7 65ndash75 [CrossRef]
42 Tam V De Smedt F Batelaan O Dassargues A Study on the relationship between lineaments and borehole specific capacityin a fractured and karstified limestone area in Vietnam Hydrogeol J 2004 12 662ndash673 [CrossRef]
43 Sener B Suumlzen ML Doyuran V Landfill site selection by using geographic information systems Environ Geol 2006 49376ndash388 [CrossRef]
44 Shankar MR Mohan G Assessment of the groundwater potential and quality in Bhatsa and Kalu river basins of Thane districtwestern Deccan Volcanic Province of India Environ Geol 2006 49 990ndash998 [CrossRef]
45 Schumm SA Evolution of drainage systems and slopes in badlands at Perth Amboy New Jersey Geol Soc Am Bull 1956 67597ndash646 [CrossRef]
46 Sharma K Singh H Pareek O Rainwater infiltration into a bare loamy sand Hydrol Sci J 1983 28 417ndash424 [CrossRef]47 Fox D Bryan R Price A The influence of slope angle on final infiltration rate for interrill conditions Geoderma 1997 80
181ndash194 [CrossRef]48 Bronstert A Niehoff D Buumlrger G Effects of climate and land-use change on storm runoff generation Present knowledge and
modelling capabilities Hydrol Process 2002 16 509ndash529 [CrossRef]49 Ahmed A El Ammawy M Hewaidy AG Moussa B Hafz NA Mapping of lineaments for groundwater assessment in the
Desert Fringes East El-Minia Eastern Desert Egypt Environ Monit Assess 2019 191 1ndash22 [CrossRef] [PubMed]50 Subyani AM Geostatistical study of annual and seasonal mean rainfall patterns in southwest Saudi ArabiaDistribution
geacuteostatistique de la pluie moyenne annuelle et saisonniegravere dans le Sud-Ouest de lrsquoArabie Saoudite Hydrol Sci J 2004 49[CrossRef]
51 Babiker M Gudmundsson A The effects of dykes and faults on groundwater flow in an arid land The Red Sea Hills SudanJ Hydrol 2004 297 256ndash273 [CrossRef]
52 Benjmel K Amraoui F Boutaleb S Ouchchen M Tahiri A Touab A Mapping of groundwater potential zones in crystallineterrain using remote sensing GIS techniques and multicriteria data analysis (Case of the Ighrem Region Western Anti-AtlasMorocco) Water 2020 12 471 [CrossRef]
Water 2021 13 2571 18 of 18
53 Zhu Q Abdelkareem M Mapping groundwater potential zones using a knowledge-driven approach and GIS analysis Water2021 13 579 [CrossRef]
54 Krishnamurthy J Venkatesa Kumar N Jayaraman V Manivel M An approach to demarcate ground water potential zonesthrough remote sensing and a geographical information system Int J Remote Sens 1996 17 1867ndash1884 [CrossRef]
55 Chang K-T Weng C-I An investigation into the structure of aqueous NaCl electrolyte solutions under magnetic fields ComputMater Sci 2008 43 1048ndash1055 [CrossRef]
56 Abdelaziz R Merkel BJ Sensitivity analysis of transport modeling in a fractured gneiss aquifer J Afr Earth Sci 2015 103121ndash127 [CrossRef]
57 Dar T Rai N Bhat A Delineation of potential groundwater recharge zones using analytical hierarchy process (AHP) GeolEcol Landsc 2020 1ndash16 [CrossRef]
58 Abd Manap M Nampak H Pradhan B Lee S Sulaiman WNA Ramli MF Application of probabilistic-based frequencyratio model in groundwater potential mapping using remote sensing data and GIS Arab J Geosci 2014 7 711ndash724 [CrossRef]
- Introduction
-
- Overview of the Study Area
- Geology and Hydrogeology
-
- Materials and Methods
-
- Processing and Extraction of Thematic Layers
- Multi-Influencing Factors Approach (MIF)
- Verification of the GWRP
-
- Results
-
- Influencing Factors
-
- Drainage and Drainage Density
- Lineament and Lineament Density
- Topographic and Slope Features
- Lithology and Landcover
- Rainfall
-
- Recharge Potential Model
- Verification of the Recharge Potential Model
-
- Discussions
- Conclusions
- References
-
Water 2021 13 2571 2 of 18
hydrogeological techniques that have been used in groundwater potential assessment arecostly and time-consuming The delineation and identification of potential groundwaterzones have become more attainable with the utilization of geospatial methods and satelliteimages which have been widely used in recent years Mapping of groundwater resourcesand planning for future resources are urgently needed to overcome the problem of limitedwater supply and increasing demand for water The determination of the distributionof groundwater recharge potential zones is a useful tool for sustainable groundwatermanagement
The occurrence and movement of groundwater are affected by the type thicknessand structural fabric of the underlying rocks denudation structural features topographydrainage and the climate [3ndash6] The impact of these factors on groundwater recharge variesfrom location to location For example linear features such as fractures and faults can actas conduits or barriers for groundwater flow [7ndash9] Therefore they are highly influentialfactors in identifying recharge potential zones In general buffer zones of 300ndash500 m nearthe lineament are favorable zones for groundwater recharge [10] It is essential howeverto consider all factors in order to delineate and identify the groundwater recharge potential(GWRP) of an area
Identification of the GWRP is traditionally completed using hydrogeological geo-logical and geophysical investigations and soil moisture modelling [11ndash14] Howevermost in situ investigation methods are expensive time-consuming require skilled humanresources and are not feasible for the evaluation of the recharge potential at the catchmentscale [515] Currently the integration of remote sensing (RS) and geographic informationsystem (GIS) technology is used as a faster more accurate and more cost-efficient wayto identify the various factors relevant to the GWRP [16ndash18] Various studies around theworld have been carried out to identify and delineate groundwater recharge potentialzones by integrating RS and GIS techniques [1619ndash23] Most of these studies have beenbased on integrating the relative weights of different thematic layers such as the geol-ogy geomorphology lineament density drainage density and slope etc within the GISenvironment [52425] The assignment of the relative weights is subjective and basedon literature reviews andor expert knowledge [152627] The multi-influencing factor(MIF) approach in GIS is commonly used for the identification of GWRP based on theinterrelationships of the different factors [27] This approach has attained its popularityfrom its practical applications prior to introducing costly field explorations [52527]
The Flinders Ranges is located in South Australia (Figure 1) Groundwater is the mainsource of fresh water in the region and has played a significant role since the Europeansettlement The region depends on groundwater stored in fractured rock aquifers forvarious purposes [28] Therefore it is essential to understand this valuable water resourceto ensure its sustainable development and management The main aim of this study was todelineate and evaluate the GWRP for a selected catchment in the Flinders Ranges SouthAustralia through the integrated use of the geospatial (RS and GIS) and multi-influencefactor (MIF) approach
11 Overview of the Study Area
The Hawker Area is located 370 km north of Adelaide in the Flinders Ranges SouthAustralia The study area extended from latitude 3139prime to 3250prime south and longitude13820prime to 13850prime east covering an area of 9164 km2 (Figure 1) The elevation ranges from240 to 950 m The climate of the area is characterized by semi-arid to arid conditions withhot and dry summers and cool to mild winters with low annual rainfall The wet periodextends from May through October while the dry period occurs between November andApril (Figure 2) During the dry period tropical lows in northern Australia may causeoccasional thunderstorms with heavy rainfalls The average annual rainfall varies frommore than 300 mm in the higher elevation areas to below 200 mm at lower elevation areasThe summer temperature ranges from 28 to 40 C and winter temperatures range from 6 to22 C (httpwwwbomgovau) (accessed on 12 July 2021)
Water 2021 13 2571 3 of 18
1
Figure 1 Location of the study area showing the wellsrsquo locations in the Hawker Area
Water 2021 13 x FOR PEER REVIEW 4 of 19
Figure 2 Modern climate of the study area Monthly average temperature (Red dotes) and precipi-tation (black column) at Hawker Weather Station (1980ndash2021) Data source The Australia Bureau of Meteorology httpwwwbomgovau) (accessed on 12 July 2021)
12 Geology and Hydrogeology The study area is a part of the Adelaide Fold Belt which consists of Paleoproterozoic
to Mesoproterozoic basement rocks extending beyond a thick sedimentary sequence that is Neoproterozoic to Cambrian [29ndash31] The crystalline basement and the overlying sedi-mentary rocks were deformed in an orogenic setting in the late Cambrianndashearly Ordovi-cian Delamerian Orogeny to form the typical strike ridges of the Flinders Ranges (Figure 3) Structurally the study area is fragmented by an anticlinendashsyncline NW and NNW fold system resulting in a series of parallel ridges separated by relatively wide valleys [30] The ridges are dominated by high resistance Cambrian and Neoproterozoic quartzites and limestones and calcareous meta-siltstones (Wilpena Umberatana and Hawker groups) while alluvial deposits are outcropped in valleys and low topographic areas
0
5
10
15
20
25
30
35
0
5
10
15
20
25
30
35
40
Jan Feb Mar Apr May Jun Jul Aug Sep Oct Nov DecMonth
Tem
pera
ture
(deg
ree)
Rai
nfal
l (m
m)
Rainfall Temperature
Figure 2 Modern climate of the study area Monthly average temperature (Red dotes) and precipita-tion (black column) at Hawker Weather Station (1980ndash2021) Data source The Australia Bureau ofMeteorology httpwwwbomgovau) (accessed on 12 July 2021)
12 Geology and Hydrogeology
The study area is a part of the Adelaide Fold Belt which consists of Paleoproterozoicto Mesoproterozoic basement rocks extending beyond a thick sedimentary sequence that isNeoproterozoic to Cambrian [29ndash31] The crystalline basement and the overlying sedimen-tary rocks were deformed in an orogenic setting in the late Cambrianndashearly OrdovicianDelamerian Orogeny to form the typical strike ridges of the Flinders Ranges (Figure 3)Structurally the study area is fragmented by an anticlinendashsyncline NW and NNW foldsystem resulting in a series of parallel ridges separated by relatively wide valleys [30] The
Water 2021 13 2571 4 of 18
ridges are dominated by high resistance Cambrian and Neoproterozoic quartzites andlimestones and calcareous meta-siltstones (Wilpena Umberatana and Hawker groups)while alluvial deposits are outcropped in valleys and low topographic areas
Most of the information regarding the hydrogeological setting was sourced from min-eral or hydrocarbon exploration reports [34] Groundwater of variable quantity and qualityoccurs throughout the Quaternary sediments and the underlying fractured metasedi-ments [28] Throughout the study area the ridges are considered to be groundwaterdivides recharging the more distal parts in the low topographic areas The thickness of theQuaternary sediments is variable ranging from 100 m in the northwest to around 20 m inthe southeast [34]
Water 2021 13 x FOR PEER REVIEW 5 of 19
Figure 3 Stratigraphic units in the study area [31ndash33]
Most of the information regarding the hydrogeological setting was sourced from mineral or hydrocarbon exploration reports [34] Groundwater of variable quantity and quality occurs throughout the Quaternary sediments and the underlying fractured metasediments [28] Throughout the study area the ridges are considered to be ground-water divides recharging the more distal parts in the low topographic areas The thickness of the Quaternary sediments is variable ranging from 100 m in the northwest to around 20 m in the southeast [34]
2 Materials and Methods 21 Processing and Extraction of Thematic Layers
In this study groundwater recharge potential zones were delineated and evaluated by preparing and integrating RS and GIS data Five influencing factors including lithol-ogy lineament drainage slope and landcover were considered Various thematic layers of theses influencing factors were analyzed using the GIS and MIF approach to assess the GWRP zones The methodology is given in the flowchart of Figure 4
The methodology starts with identifying and assigning data sources of the various conditioning factors relevant to the groundwater potential (Table 1) followed by prepro-cessing these sources to ensure a uniform projection and resolution Data extraction and analysis were carried out using ArcGIS 107 The Advanced Spaceborne Thermal Emission
Figure 3 Stratigraphic units in the study area [31ndash33]
Water 2021 13 2571 5 of 18
2 Materials and Methods21 Processing and Extraction of Thematic Layers
In this study groundwater recharge potential zones were delineated and evaluated bypreparing and integrating RS and GIS data Five influencing factors including lithologylineament drainage slope and landcover were considered Various thematic layers oftheses influencing factors were analyzed using the GIS and MIF approach to assess theGWRP zones The methodology is given in the flowchart of Figure 4
Water 2021 13 x FOR PEER REVIEW 7 of 19
Figure 4 Materials and methods flowchart
22 Multi‑Influencing Factors Approach (MIF) The MIF approach has been extensively and successfully applied by many research-
ers in groundwater recharge potential mapping studies [335] In the MIF method all the-matic maps and their individual classes are weighted based on the literature review and according to their hydrological significance for the groundwater recharge potentiality [35] Figure 5 illustrates the conceptual diagram of the interrelationships among the dif-ferent influencing factors From the figure it is evident that the magnitude of the influence of each factor on the groundwater recharge potential can be computed and evaluated from the interrelationships among the different influencing factors (major and minor) A score of 10 was assigned for a strong relationship between the parameters while a score of 05 was given if a minor effect was found reflecting weak relationships between the factors For instance major interrelationships were observed for lineaments on landcover and drainage Therefore its evaluated weight was 20 This high weight value means that the factor significantly influences the recharge potentiality
Figure 4 Materials and methods flowchart
The methodology starts with identifying and assigning data sources of the variousconditioning factors relevant to the groundwater potential (Table 1) followed by prepro-cessing these sources to ensure a uniform projection and resolution Data extraction andanalysis were carried out using ArcGIS 107 The Advanced Spaceborne Thermal Emissionand Reflection Radiometer (ASTER GDEM) was used with topographic and geologic mapsas base maps for the delineation and evaluation of the watershed (Table 1) GDEM isprocessed in GIS environment by filling the sinks flow direction and flow accumulationgrids to extract streams watersheds and topographic and slope features
Landsat Enhanced Thematic Mapper (ETM+) imagery with free cloud cover scenes forthe year of 2015 (Path = 98 and row = 81) during summer season were best to distinguishthe spectral signatures of the different landcover types The images were preprocessedin the ENVI 54 environment to reduce or eliminate haze effects before mosaicking andsub-setting Enhancement image techniques including RGB band combinations bandrationing and decorrelation stretch of the highest contrast were applied to the Landsat
Water 2021 13 2571 6 of 18
imagery The Line Module of PCI Geomatica 2020 Software Package was then used for thedetailed automatic extraction of the lineaments The lineament density map was derivedfrom the Landsat images based on grid cell size of 50 km2 The landuselandcover (LULC)features were classified using the maximum likelihood classifier in ArcGIS 107 The LULCcategories were further verified using image interpretation elements such as drainage tonetexture and relief for the satellite images
Table 1 Data and sources used for GWRP analysis for the Hawker Area
DataSoftware Description Source Thematic Layer
Aster GDEM
14 spectral bands with a spatialresolution of 90 m in the thermal infrared(TIR) 30 m in the short-wave infrared(SWIR) and 15 m in the visible andnear-infrared (VNIR)
httpsearthdatanasagov(accessed on 12 July 2021) Drainage
Landsat Images9 spectral bands with a spatial resolutionof 30 m for bands 1 to 7 and 9 and 15 mfor band 8 (panchromatic)
httpsearthexplorerusgsgov(accessed on 12 July 2021)
Lineamentslanduse
Topographic Map 150000 httpsmapsarigsagovau(accessed on 12 July 2021) Topography
Geologic Map 1250000 Geology
Borehole data httpsmapsarigsagovau(accessed on 12 July 2021) Water layers
The average annual rainfall data for a period of 30 years was collected from the Bureauof Meteorology Australia from the grid file Then it was exported as a raster format usingGIS and processed to extract the rainfall values To overcome the low resolution of the griddata compared to the other factorsrsquo thematic layers an equal distribution of 400 points wascreated over the study area and the rainfall value was extracted and interpolated using theinverse distance weighting (IDW) method to 15 m resolution In addition groundwaterdata were retrieved from the hydrogeological database of Primary Industries and ResourcesSouth Australia (httpsmapsarigsagovau) (accessed on 12 July 2021) This databasecontains information recorded by well drillers about well location water depth wateryield and rock type The well database for the Flinders Ranges contains information forapproximately 90 of the wells in the region All of the thematic layers were then storedand classified in a geo-database as GIS layers Analyses and interpretations were conducteddirectly from the created geo-database for the influencing factors
22 Multi-Influencing Factors Approach (MIF)
The MIF approach has been extensively and successfully applied by many researchersin groundwater recharge potential mapping studies [335] In the MIF method all thematicmaps and their individual classes are weighted based on the literature review and accordingto their hydrological significance for the groundwater recharge potentiality [35] Figure 5illustrates the conceptual diagram of the interrelationships among the different influencingfactors From the figure it is evident that the magnitude of the influence of each factor on thegroundwater recharge potential can be computed and evaluated from the interrelationshipsamong the different influencing factors (major and minor) A score of 10 was assigned fora strong relationship between the parameters while a score of 05 was given if a minoreffect was found reflecting weak relationships between the factors For instance majorinterrelationships were observed for lineaments on landcover and drainage Thereforeits evaluated weight was 20 This high weight value means that the factor significantlyinfluences the recharge potentiality
Water 2021 13 2571 7 of 18Water 2021 13 x FOR PEER REVIEW 8 of 19
Figure 5 The interactive influence of the selected factors
A cumulative score weight of both major and minor effects in terms of groundwater recharge potentiality was calculated to obtain the relative score for the different influenc-ing factors (Table 2) This was further used to estimate the proposed score of each influ-encing factor as shown in the following equation S = (A + B)sum(A + B) times 100 (1)
where ldquoSrdquo is the proposed score of every selected influencing factor and ldquoArdquo and ldquoBrdquo are the major and the minor interrelationships between each two factors respectively The proposed score of every influencing factor was then divided and assigned to every reclas-sified sub-factor (Table 3) All the parameters with their potential weights were reclassi-fied and integrated into five classes by applying weighted overlay analysis in the GIS en-vironment to determine the GWRP zones
Table 2 Reclassified values of the influencing factors on the recharge potentiality
Influencing Factor Major Effect (A) Minor Effect (B) Sum (A + B) Proposed Score of Each Factor Lineament 1 + 1 0 2 19 Lithology 1 + 1 0 2 19 Drainage 1 05 15 14 Landcover 1 + 1 05 25 24 Slope 1 05 15 14 Rainfall 0 05 + 05 1 10 sum105 sum100
To obtain the GWRP map rasters with the influencing factors were overlaid using the following formula GWRP = Li times Li + Lin times Lin + As times As + Lu times Lu + Dr times Dr + Rf times Rf (2)
where Li is the lithology Lin is the lineament As is the average slope LU is the land use Dr is the drainage density Rf is the rainfall r is the rating of each class of each thematic layer and w is the weight of each thematic layer The obtained values for the GWRP were classified into three categories from 1 to 3
Figure 5 The interactive influence of the selected factors
A cumulative score weight of both major and minor effects in terms of groundwaterrecharge potentiality was calculated to obtain the relative score for the different influencingfactors (Table 2) This was further used to estimate the proposed score of each influencingfactor as shown in the following equation
S =
((A + B)
sum(A + B)
)times 100 (1)
where ldquoSrdquo is the proposed score of every selected influencing factor and ldquoArdquo and ldquoBrdquoare the major and the minor interrelationships between each two factors respectivelyThe proposed score of every influencing factor was then divided and assigned to everyreclassified sub-factor (Table 3) All the parameters with their potential weights werereclassified and integrated into five classes by applying weighted overlay analysis in theGIS environment to determine the GWRP zones
Table 2 Reclassified values of the influencing factors on the recharge potentiality
Influencing Factor Major Effect (A) Minor Effect (B) Sum (A + B) Proposed Score of Each Factor
Lineament 1 + 1 0 2 19Lithology 1 + 1 0 2 19Drainage 1 05 15 14Landcover 1 + 1 05 25 24Slope 1 05 15 14Rainfall 0 05 + 05 1 10
sum105 sum100
To obtain the GWRP map rasters with the influencing factors were overlaid using thefollowing formula
GWRP = LirtimesLiw +LinrtimesLinw +AsrtimesAsw +LurtimesLuw +DrrtimesDrw +Rfr timesRfw (2)
where Li is the lithology Lin is the lineament As is the average slope LU is the land useDr is the drainage density Rf is the rainfall r is the rating of each class of each thematiclayer and w is the weight of each thematic layer The obtained values for the GWRP wereclassified into three categories from 1 to 3
Water 2021 13 2571 8 of 18
Table 3 Classification of weighted parameters influencing the groundwater potential zone (GWPZ)
Parameter Zone Total Score Individual Score
Lithology
Alluvial sediments 19 19Sandstones 15Carbonates 11Shale and siltstone 7Metasediments 3
Lineament density (KmKm)
lt005ndash025 19 19026ndash036 15037ndash046 11047ndash057 7gt058ndash079 3
Average slope ()
lt2 14 14201ndash400 11401ndash11 81101ndash2000 5gt3000 2
Landuse and landcover
Water bodies 24 24Grazing 19Agriculture 14Conservation 9Industrial 4
Drainage density (KmKm)
Less than 025 14 14026ndash033 11034ndash039 804ndash046 5More than 046 2
Rainfall (mm)
25ndash30 10 1030ndash35 835ndash40 640ndash45 445ndash50 2
23 Verification of the GWRP
In the present study the final map obtained using the MIF approach was validatedusing an independent dataset that was not used to construct the map The observed well-yields of the water wells were obtained from the Department for Environment and WaterSouth Australia The water wells were referred to as high medium and low water yieldand used to validate the accuracy of the final groundwater recharge potential map
3 Results31 Influencing Factors
The analysis of seven major factors was performed using GIS to demonstrate andevaluate their effect on the groundwater recharge potentiality
311 Drainage and Drainage Density
The nature shape and density of drainage are essential factors that can affect therunoff flow and recharge of groundwater [26] The results indicated that the watershedshows a dendritic drainage pattern the total area (A) of the watershed is 9164 km2 andlength (LB) is 495 km (Figure 6a) Using the method proposed by Strahler (1964) thewatershed was found to comprise a six-order pattern with a total of 2646 streams of whichnearly 5036 are first order 2315 are second order 1271 are third order 722 arefourth order 363 are fifth order and 003 are sixth order streams (Table 2)
Water 2021 13 2571 9 of 18Water 2021 13 x FOR PEER REVIEW 11 of 19
(a) (b)
Figure 6 (a) Drainage Density and (b) Lineament density
Lineament density is considered a useful tool to identify ldquohot spotsrdquo of groundwater recharge potentiality [42ndash44] Lineament density (Ld) is defined as the total lineament length in a unit area It is expressed as L = ΣA L (4)
where Σ L denotes the total length of lineaments and A is the unit area The highest densities were identified in the northeast and southwest and around the
Hawker town (Figure 6b) The lineament densities in this study area were quite high which can be attributed to the geologic setting of the study area
313 Topographic and Slope Features The relief ratio (Rr) was introduced to express the difference between the highest and
the lowest elevation of the basin [45] The maximum elevation of the basin was 1000 m and the lowest was 250 m therefore the relief of the basin was 750 m The relief ratio for this area was 002 which indicated a moderate topographic nature The relief ratio and the elongated ratio of the watershed implied low resistance and more erosion and weath-ering processes which are positive for groundwater potential [36]
Basin slope (Sb) is another influencing factor which is mainly controlled by climate processes in areas outcropped by different lithologies [4647] In the present study based on the degree of the slope the watershed was classed into gentle (lt10deg) moderate (10ndash20deg) and steep (gt20deg) Gentle slopes were classified as ldquogoodrdquo for groundwater recharge as nearly flat terrain is the most favorable for infiltration (Figure 7a) Moderate slopes were categorized as ldquomoderaterdquo for groundwater recharge due to their slightly undulat-ing topography which permits partial runoff Steep slopes allow high surface runoff and a negligible amount of infiltration and therefore were assigned to the ldquopoorrdquo category for groundwater recharge
Figure 6 (a) Drainage Density and (b) Lineament density
The total length of all streams was 25896 km and ranged from 1280 km to 71 km forthe first order and sixth order respectively (Table 4) It was evident that the first orderstreams had the greatest total length of stream segments and consequently the lengthdecreased as the stream order increased Length of streams is a significant hydrologicalfactor as it reflects the runoff characteristics and hence is related to recharging aquifersStreams of smaller length are characterized by steep slopes good runoff and low rechargewhile streams with longer lengths are commonly indicative of a smoother slope low runoffand good recharge This change in stream length for the different orders indicated theimpact of altitude lithological variations and slopes More importantly it indicated thehydrological characteristics of the underlying rock of the different stream orders in thestudy area [36]
Table 4 Morphometric aspects of the study area
Parameter Formula 1st 2nd 3rd 4th 5th 6th Total
Number of streams Nu 2956 1359 746 424 213 172 5870
Number 5036 2315 1271 722 363 003
Stream length Lu 1280 646 317 195 81 71 2589
Mean length Lsm = LuNu 043 048 042 046 038 041
Drainage density (D) was introduced by Horton (1945) as the total length of the streamper unit area Drainage density provides a quantitative measure of the average length ofstreams in the whole basin Greenbaum (1985) defined the drainage density (Dd) as thetotal drainage length of the drainage in a unit area It is expressed as
Dd =sumi=n
i=1 Si
A(3)
Water 2021 13 2571 10 of 18
where sumi=ni=1 Si denotes the total length of the drainage and A is the unit of the area The
calculated drainage density of the study area was 283 kmkm2 (Figure 6a) Drainagedensity values could be linked to the permeability of the dominant landcover topographyand vegetation [37ndash39] Based on the findings the drainage density in the study area wasclassified into five categories very good good moderate poor and very poor densityGenerally low drainage density is more likely to dominate in highly permeable densevegetation and low relief areas while high drainage density occurs in low permeable lessvegetation and high relief areas [40] Accordingly high drainage areas have less waterinfiltration whereas low-density areas have high water infiltration to the aquifers [41]
312 Lineament and Lineament Density
Two main directions NEndashSW and EndashW were identified from the images The orienta-tions of the lineaments matched the faults-oriented NEndashSW throughout the study area Thelineament length distribution obtained from Landsat images showed that the lineamentlengths were highly variable (SD = 775 m) with a mean length of about 1338 m (Figure 6b)The lineament length distribution reflects high variability in lineament length and numberwhich can be attributed to the geological characteristics of the study area (Figure 6b)
Lineament density is considered a useful tool to identify ldquohot spotsrdquo of groundwaterrecharge potentiality [42ndash44] Lineament density (Ld) is defined as the total lineamentlength in a unit area It is expressed as
Ld =sumi=n
i=1A
Li (4)
where sumi=ni=1 Li denotes the total length of lineaments and A is the unit area
The highest densities were identified in the northeast and southwest and aroundthe Hawker town (Figure 6b) The lineament densities in this study area were quite highwhich can be attributed to the geologic setting of the study area
313 Topographic and Slope Features
The relief ratio (Rr) was introduced to express the difference between the highest andthe lowest elevation of the basin [45] The maximum elevation of the basin was 1000 mand the lowest was 250 m therefore the relief of the basin was 750 m The relief ratio forthis area was 002 which indicated a moderate topographic nature The relief ratio and theelongated ratio of the watershed implied low resistance and more erosion and weatheringprocesses which are positive for groundwater potential [36]
Basin slope (Sb) is another influencing factor which is mainly controlled by climateprocesses in areas outcropped by different lithologies [4647] In the present study basedon the degree of the slope the watershed was classed into gentle (lt10) moderate (10ndash20)and steep (gt20) Gentle slopes were classified as ldquogoodrdquo for groundwater recharge asnearly flat terrain is the most favorable for infiltration (Figure 7a) Moderate slopes werecategorized as ldquomoderaterdquo for groundwater recharge due to their slightly undulatingtopography which permits partial runoff Steep slopes allow high surface runoff and anegligible amount of infiltration and therefore were assigned to the ldquopoorrdquo category forgroundwater recharge
Water 2021 13 2571 11 of 18
Water 2021 13 x FOR PEER REVIEW 12 of 19
314 Lithology and Landcover In the Hawker Area while the lithological log data for the wells was not available
the lithological grouping was decided based on detailed available geological maps The geological map of the study area revealed that the high elevation features are covered by
metasediments quartzite sandstone limestone shale and siltstone and the lower elevation areas are dominated by recent alluvial sediments (Figure 7b) Different rock for-mations were assigned rankings based on their recharge potential properties Generally massive unfractured lithologic units have little influence on groundwater recharge poten-tiality while alluvial and sandstones with secondary porosity form a good potential groundwater zone
The landusecover is a significant factor that can influence the recharge infiltration and runoff process of the groundwater regime [48] In Figure 7c the primary landusecover is composed of grazing native vegetation (6855) agriculture and planta-tions (2229) conservation and natural environments (726) industrial (190) and water (lt1) Due to the high potentiality to recharge and the storage of groundwater water bodies were assigned the highest weightage Lower weightage was allocated to in-dustrial lands due to their poor water holding capacity and less infiltration Agricultural areas were given moderate weightage factors and native covers were allocated the highest weightage due to their ability to reduce the speed of water flow and increase the time duration for infiltration
(a) (b)
Water 2021 13 x FOR PEER REVIEW 13 of 19
(c) (d)
Figure 7 (a) Slope in degrees (b) lithology (c) landcover and (d) average rainfall in millimeters
315 Rainfall In arid areas rainfall is considered as one of the most influential factors in ground-
water recharge capability [49] Processes such as precipitation evapotranspiration and percolation can control the water availability at the land surface [35] As mentioned ear-lier rainfall is the main source for the aquifersrsquo recharge in the study area The climate of the area is classified as arid to semi-arid with a high variation in rainfall The average annual rainfall of the study area ranges from 35 to 50 mm Accordingly the annual rainfall is classified into five classes Higher rainfall potentially infiltrates into the soil and is stored in the aquifers (Figure 7d) The rainfall distribution map indicates that the annual rainfall is higher in the high topographic areas than in the low topographic areas Rainfall is typically regular in the hillslope areas in contrast to the foothill areas [50]
32 Recharge Potential Model By classifying and implementing the MIF approach the final map of the GWRP was
produced and grouped into three classes (good moderate and low) (Figure 8a) It was observed that about 2897 58 and 1303 of the areas fall under good moderate and low groundwater potential zones respectively (Figure 8b) Good groundwater potential zones were observed in the central western and small parts of the eastern areas due to the distribution of low slope high drainage density alluvial sediments high lineament density and natural and agricultural land Medium and low groundwater potential re-charge zones existed mainly in elevated areas in the southern and eastern parts of the study area where higher slopes and siltstone are the main lithology
33 Verification of the Recharge Potential Model For the purpose of verification validation of the groundwater potential map was un-
dertaken using water yield data from the study area (Figure 8bc) The water yield data was used to statistically demonstrate the failure and success relative to each obtained class of recharge potential The results showed that 2929 of the wells with a high water yield (mean = 104 LS) are sited on good areas 6286 with moderate yield (mean = 080 LS) are located on moderate areas and 786 are on poor groundwater potential recharge zones (Figure 8)
Figure 7 (a) Slope in degrees (b) lithology (c) landcover and (d) average rainfall in millimeters
314 Lithology and Landcover
In the Hawker Area while the lithological log data for the wells was not availablethe lithological grouping was decided based on detailed available geological maps Thegeological map of the study area revealed that the high elevation features are coveredby metasediments quartzite sandstone limestone shale and siltstone and the lowerelevation areas are dominated by recent alluvial sediments (Figure 7b) Different rockformations were assigned rankings based on their recharge potential properties Gener-
Water 2021 13 2571 12 of 18
ally massive unfractured lithologic units have little influence on groundwater rechargepotentiality while alluvial and sandstones with secondary porosity form a good potentialgroundwater zone
The landusecover is a significant factor that can influence the recharge infiltrationand runoff process of the groundwater regime [48] In Figure 7c the primary landusecoveris composed of grazing native vegetation (6855) agriculture and plantations (2229)conservation and natural environments (726) industrial (190) and water (lt1) Dueto the high potentiality to recharge and the storage of groundwater water bodies wereassigned the highest weightage Lower weightage was allocated to industrial lands dueto their poor water holding capacity and less infiltration Agricultural areas were givenmoderate weightage factors and native covers were allocated the highest weightage due totheir ability to reduce the speed of water flow and increase the time duration for infiltration
315 Rainfall
In arid areas rainfall is considered as one of the most influential factors in ground-water recharge capability [49] Processes such as precipitation evapotranspiration andpercolation can control the water availability at the land surface [35] As mentioned earlierrainfall is the main source for the aquifersrsquo recharge in the study area The climate of thearea is classified as arid to semi-arid with a high variation in rainfall The average annualrainfall of the study area ranges from 35 to 50 mm Accordingly the annual rainfall isclassified into five classes Higher rainfall potentially infiltrates into the soil and is stored inthe aquifers (Figure 7d) The rainfall distribution map indicates that the annual rainfall ishigher in the high topographic areas than in the low topographic areas Rainfall is typicallyregular in the hillslope areas in contrast to the foothill areas [50]
32 Recharge Potential Model
By classifying and implementing the MIF approach the final map of the GWRP wasproduced and grouped into three classes (good moderate and low) (Figure 8a) It wasobserved that about 2897 58 and 1303 of the areas fall under good moderate andlow groundwater potential zones respectively (Figure 8b) Good groundwater potentialzones were observed in the central western and small parts of the eastern areas due to thedistribution of low slope high drainage density alluvial sediments high lineament densityand natural and agricultural land Medium and low groundwater potential recharge zonesexisted mainly in elevated areas in the southern and eastern parts of the study area wherehigher slopes and siltstone are the main lithology
33 Verification of the Recharge Potential Model
For the purpose of verification validation of the groundwater potential map wasundertaken using water yield data from the study area (Figure 8bc) The water yield datawas used to statistically demonstrate the failure and success relative to each obtained classof recharge potential The results showed that 2929 of the wells with a high water yield(mean = 104 LS) are sited on good areas 6286 with moderate yield (mean = 080 LS)are located on moderate areas and 786 are on poor groundwater potential rechargezones (Figure 8)
Water 2021 13 2571 13 of 18Water 2021 13 x FOR PEER REVIEW 14 of 19
(a)
(b) (c)
Figure 8 (a) Recharge potential map (b) Recharge potential classesrsquo areas and (c) Recharge potential classes against num-ber of wells () and average yield
4 Discussions Influencing factors related to groundwater recharge potentiality were selected and
weighted in order to identify favorable zones for recharge using the RS GIS and MIF approach The findings indicated that the groundwater regime of arid regions is mainly controlled by the topography geology fracture systems and climatic conditions As shown in this study the various groundwater potential recharge zones are distributed along the study area The northern and western parts near lineaments with low drainage density and where secondary structures and alluvial lithology are located are character-ized as good groundwater potential recharge areas (Figure 9) The central areas which are dominated by a low lineament density and high slope features are classified as low re-charge potential areas This variability in groundwater potentiality can be attributed to
010203040506070
Good Moderate Poor
Area
Recharge Potential Class
000
020
040
060
080
100
120
010203040506070
Good Moderate Poor
Aver
age
Yeild
(LS
)
Num
ber o
f Wel
l (
)
Recharge Potential Class
Figure 8 (a) Recharge potential map (b) Recharge potential classesrsquo areas and (c) Recharge potential classes against numberof wells () and average yield
4 Discussions
Influencing factors related to groundwater recharge potentiality were selected andweighted in order to identify favorable zones for recharge using the RS GIS and MIFapproach The findings indicated that the groundwater regime of arid regions is mainlycontrolled by the topography geology fracture systems and climatic conditions Asshown in this study the various groundwater potential recharge zones are distributedalong the study area The northern and western parts near lineaments with low drainagedensity and where secondary structures and alluvial lithology are located are characterizedas good groundwater potential recharge areas (Figure 9) The central areas which aredominated by a low lineament density and high slope features are classified as low
Water 2021 13 2571 14 of 18
recharge potential areas This variability in groundwater potentiality can be attributedto many geological factors [81051] Lineaments as a structural weakness could play anessential role in groundwater potential recharge zones by increasing the infiltration capacityof the soil and facilitating the groundwater flow and movement [2649] In addition theoccurrence of lithologic units with high permeability such as alluvial sediments couldincrease groundwater storage and yields [52] These directly impact water infiltration andpercolation [2353] This infiltration capacity could also be influenced by the dominantslope gradient Gentle slopes promote groundwater recharging potentiality by providingsufficient time for infiltration while areas with steep slopes permit low recharging dueto rapid flow and low infiltration capacity [15] Drainage density is considered anothersignificant factor in identifying recharge sites because of its influence on surface runoffThe occurrence of a dense drainage system indicates high water permeability zones in theregion [54]
Water 2021 13 x FOR PEER REVIEW 15 of 19
many geological factors [81051] Lineaments as a structural weakness could play an es-sential role in groundwater potential recharge zones by increasing the infiltration capacity of the soil and facilitating the groundwater flow and movement [2649] In addition the occurrence of lithologic units with high permeability such as alluvial sediments could in-crease groundwater storage and yields [52] These directly impact water infiltration and percolation [2353] This infiltration capacity could also be influenced by the dominant slope gradient Gentle slopes promote groundwater recharging potentiality by providing sufficient time for infiltration while areas with steep slopes permit low recharging due to rapid flow and low infiltration capacity [15] Drainage density is considered another sig-nificant factor in identifying recharge sites because of its influence on surface runoff The occurrence of a dense drainage system indicates high water permeability zones in the re-gion [54]
The effects of the combination of these influencing factors on controlling the ground-water regime contribute to the recharge potentiality of different aquifers Areas with good to moderate groundwater potential zones can attribute this to the lithology slope and drainage density territories This classification could thus provide preferred targets for groundwater exploration since it combines several hydrogeological features that could affect groundwater availability The findings from this study are comparable to the find-ings of other recharge potential studies in many areas around the world [1520242755]
(a) (b)
(c) (d)
Figure 9 (a) Percentage of the water wells within the different classes of the influencing factors (bndashd) Average of the water yield against the classes of the influencing factors
However it is important to note that the delineation of the recharge potential map using the MIF method might not be a better reflection of the realities on the ground This
0
20
40
60
80
100
Wat
er W
ell
Factor
Class 1 Class 2 Class 3 Class 4 Class 5
0
05
1
15
2
0 1 2 3 4 5 6
Aver
age
Yeild
(LS
)
Class
Drainage Slope
0
20
40
60
80
100
Wat
er W
ell
Factor
Class 1 Class 2 Class 3 Class 4 Class 5
0
05
1
15
2
0 1 2 3 4 5 6
Aver
age
Yeild
(LS
)
Class
Lineament Rainfall
Figure 9 (a) Percentage of the water wells within the different classes of the influencing factors (bndashd) Average of the wateryield against the classes of the influencing factors
The effects of the combination of these influencing factors on controlling the ground-water regime contribute to the recharge potentiality of different aquifers Areas with goodto moderate groundwater potential zones can attribute this to the lithology slope anddrainage density territories This classification could thus provide preferred targets forgroundwater exploration since it combines several hydrogeological features that couldaffect groundwater availability The findings from this study are comparable to the findingsof other recharge potential studies in many areas around the world [1520242755]
Water 2021 13 2571 15 of 18
However it is important to note that the delineation of the recharge potential mapusing the MIF method might not be a better reflection of the realities on the groundThis study was limited by the absence of recent drilling flows to validate the sensitivityof the results However it appeared that the drilling program was not optimized andsuffered from a lack of preliminary investigation of groundwater availability This wasevident when comparing the locations of the wells throughout the study area The sitingof boreholes in relation to the local topography and occasionally to local fractures is themost common drilling method In many cases however social factors such as the locationof the house to be supplied or the boundary of the property determine the siting of theborehole As a result the validation of the groundwater potential map should be improvedusing recent drilling data in order to better evaluate the realities on the ground In additionthe delineation of a good recharge potential zone does not assure a 100 success rate indrilling even if the prospect appeared to be promising and verified by available wateryield data In-depth investigation is required within the proposed approach to overcomethe limitation encountered from the hypothetical interpolations of surface data
5 Conclusions
This study obtained a groundwater recharge potential map of the Hawker Area inthe Flinders Ranges South Australia using a GIS RS and MIF approach Analysis ofthe results provides ample information and analysis for decision makers Integration ofthematic maps such as drainage density lithology slope landcover rainfall and lineamentdensity could present valuable information for local authorities and planners regardingsuitable areas for groundwater recharge potentiality in the Flinders Ranges
The results showed that the most promising groundwater recharge potential zonesare located in areas with high lineament density low drainage density and gentle slopesFurthermore the data analysis suggested that alluvial sediments and sandstone havehigh infiltration capacity The areas that are least effective for groundwater recharge areunderlain by shale and siltstone and have low lineament density This was validatedby the correlation between water yield and the recharge potential categories Throughthe integration of GIS RS and MIF along with other hydrological characteristics of thedrainage basin the strategy of identifying and selecting groundwater recharge zones couldprovide better groundwater management plans
Based on the present study a number of future investigations are suggested To startwith lineament zones need to be investigated in more detail The focus should be onclassifying categorizing and exploring these lineaments by means of drilling and fieldmapping both across their width and along the strike Additionally lithological data formost of the wells are not available therefore further data are required to develop a feasibleinterpretation of the recharge potential mapping Moreover a detailed investigation ofthe water chemistry and water level should be undertaken to understand the impacts oflithology and water rock interactions to give more meaningful results This can be achievedby installing new piezometers in the monitoring boreholes to obtain hydraulic head datafor a better understanding of the flow directions Finally building on different appliedapproaches and models such as the analytical hierarchy method (AHP) and frequencyration (FR) and optimizers such as UCODE or hydroPSO as well as sensitivity analysiscould provide more meaningful results for practical applications [56ndash58]
Author Contributions Conceptualization original draft preparation and editing AA (Alaa Ahmed)methodology investigation editing AA (Abdullah Alrajhi) and editing and funding ASA Allauthors have read and agreed to the published version of the manuscript
Funding This research received no external funding
Institutional Review Board Statement Not applicable
Informed Consent Statement Not applicable
Data Availability Statement Not applicable
Water 2021 13 2571 16 of 18
Acknowledgments The authors would like to thank Abdullatif Lacina University of South Australiafor help in editing revision and improvement of the manuscript
Conflicts of Interest The authors declare that they have no known competing financial interests orpersonal relationships that could have appeared to influence the work reported in this paper
References1 Barnett S Harrington N Cook P Simmons CT Groundwater in Australia Occurrence and Management Issues In Sustainable
Groundwater Management Springer BerlinHeidelberg Germany 2020 pp 109ndash1272 Pigram J Australiarsquos Water Resources From Use to Management CSIRO Publishing Clayton South Australia 20073 Selvam S Magesh N Chidambaram S Rajamanickam M Sashikkumar M A GIS based identification of groundwater
recharge potential zones using RS and IF technique A case study in Ottapidaram taluk Tuticorin district Tamil Nadu EnvironEarth Sci 2015 73 3785ndash3799 [CrossRef]
4 Souissi D Msaddek MH Zouhri L Chenini I El May M Dlala M Mapping groundwater recharge potential zones in aridregion using GIS and Landsat approaches southeast Tunisia Hydrol Sci J 2018 63 251ndash268 [CrossRef]
5 Magesh NS Chandrasekar N Soundranayagam JP Delineation of groundwater potential zones in Theni district Tamil Naduusing remote sensing GIS and MIF techniques Geosci Front 2012 3 189ndash196 [CrossRef]
6 Ahmed AA Shabana AR Integrating of remote sensing GIS and geophysical data for recharge potentiality evaluation in WadiEl Tarfa eastern desert Egypt J Afr Earth Sci 2020 172 103957 [CrossRef]
7 Edet A Teme S Okereke C Esu E Lineament analysis for groundwater exploration in Precambrian Oban massif and Obuduplateau SE Nigeria In Proceedings of International Journal of Rock Mechanics and Mining Sciences and Geomechanics Abstracts ElsevierScience Amsterdam The Netherlands 1996 p 215A
8 Solomon S Quiel F Groundwater study using remote sensing and geographic information systems (GIS) in the central highlandsof Eritrea Hydrogeol J 2006 14 1029ndash1041 [CrossRef]
9 Sander P Lineaments in groundwater exploration A review of applications and limitations Hydrogeol J 2007 15 71ndash74[CrossRef]
10 Corgne S Magagi R Yergeau M Sylla D An integrated approach to hydro-geological lineament mapping of a semi-aridregion of West Africa using Radarsat-1 and GIS Remote Sens Environ 2010 114 1863ndash1875 [CrossRef]
11 Eilers V Carter RC Rushton KR A single layer soil water balance model for estimating deep drainage (potential recharge)An application to cropped land in semi-arid North-east Nigeria Geoderma 2007 140 119ndash131 [CrossRef]
12 Maliva RG Clayton EA Missimer TM Application of advanced borehole geophysical logging to managed aquifer rechargeinvestigations Hydrogeol J 2009 17 1547ndash1556 [CrossRef]
13 Daessleacute L Peacuterez-Flores M Serrano-Ortiz J Mendoza-Espinosa L Manjarrez-Masuda E Lugo-Ibarra K Goacutemez-Trevintildeo EA geochemical and 3D-geometry geophysical survey to assess artificial groundwater recharge potential in the Pacific coast of BajaCalifornia Mexico Environ Earth Sci 2014 71 3477ndash3490 [CrossRef]
14 Chenini I Msaddek MH Dlala M Hydrogeological characterization and aquifer recharge mapping for groundwater resourcesmanagement using multicriteria analysis and numerical modeling A case study from Tunisia J Afr Earth Sci 2019 154 59ndash69[CrossRef]
15 Singh SK Zeddies M Shankar U Griffiths GA Potential groundwater recharge zones within New Zealand Geosci Front2019 10 1065ndash1072 [CrossRef]
16 Fagbohun BJ Integrating GIS and multi-influencing factor technique for delineation of potential groundwater recharge zones inparts of Ilesha schist belt southwestern Nigeria Environ Earth Sci 2018 77 1ndash18 [CrossRef]
17 Lentswe GB Molwalefhe L Delineation of potential groundwater recharge zones using analytic hierarchy process-guided GISin the semi-arid Motloutse watershed eastern Botswana J Hydrol Reg Stud 2020 28 100674 [CrossRef]
18 Vishwakarma A Goswami A Pradhan B Prioritization of sites for Managed Aquifer Recharge in a semi-arid environment inwestern India using GIS-Based multicriteria evaluation strategy Groundw Sustain Dev 2021 12 100501 [CrossRef]
19 Senanayake I Dissanayake D Mayadunna B Weerasekera W An approach to delineate groundwater recharge potential sitesin Ambalantota Sri Lanka using GIS techniques Geosci Front 2016 7 115ndash124 [CrossRef]
20 Yeh H-F Cheng Y-S Lin H-I Lee C-H Mapping groundwater recharge potential zone using a GIS approach in HualianRiver Taiwan Sustain Environ Res 2016 26 33ndash43 [CrossRef]
21 Arabameri A Rezaei K Cerda A Lombardo L Rodrigo-Comino J GIS-based groundwater potential mapping in Shahroudplain Iran A comparison among statistical (bivariate and multivariate) data mining and MCDM approaches Sci Total Environ2019 658 160ndash177 [CrossRef] [PubMed]
22 Arshad A Zhang Z Zhang W Dilawar A Mapping favorable groundwater potential recharge zones using a GIS-basedanalytical hierarchical process and probability frequency ratio model A case study from an agro-urban region of Pakistan GeosciFront 2020 11 1805ndash1819 [CrossRef]
23 Mukherjee I Singh UK Delineation of groundwater potential zones in a drought-prone semi-arid region of east India usingGIS and analytical hierarchical process techniques Catena 2020 194 104681 [CrossRef]
24 Shaban A Khawlie M Abdallah C Use of remote sensing and GIS to determine recharge potential zones The case ofOccidental Lebanon Hydrogeol J 2006 14 433ndash443 [CrossRef]
Water 2021 13 2571 17 of 18
25 Yeh H-F Lee C-H Hsu K-C Chang P-H GIS for the assessment of the groundwater recharge potential zone Environ Geol2009 58 185ndash195 [CrossRef]
26 Das S Pardeshi SD Integration of different influencing factors in GIS to delineate groundwater potential areas using IF and FRtechniques A study of Pravara basin Maharashtra India Appl Water Sci 2018 8 1ndash16 [CrossRef]
27 Ahmed A Ranasinghe-Arachchilage C Alrajhi A Hewa G Comparison of Multicriteria Decision-Making Techniques forGroundwater Recharge Potential Zonation Case Study of the Willochra Basin South Australia Water 2021 13 525 [CrossRef]
28 Watt E Berens V Non-Prescribed Groundwater Resources AssessmentmdashAlinytjara Wilurara Natural Resources Management RegionPhase 1 South Australia Government Printer Adelaide Australia 2011
29 Preiss WV The Adelaide Geosyncline Late Proterozoic Stratigraphy Sedimentation Palaeontology and Tectonics In GeologicalSurvey of South Australia Bulletin South Australia Government Printer Adelaide Australia 1987
30 Paul E Floumlttmann T Sandiford M Structural geometry and controls on basement-involved deformation in the northernFlinders Ranges Adelaide Fold Belt South Australia Aust J Earth Sci 1999 46 343ndash354 [CrossRef]
31 Preiss W The Adelaide Geosyncline of South Australia and its significance in Neoproterozoic continental reconstructionPrecambrian Res 2000 100 21ndash63 [CrossRef]
32 Backeacute G Baines G Giles D Preiss W Alesci A Basin geometry and salt diapirs in the Flinders Ranges South AustraliaInsights gained from geologically-constrained modelling of potential field data Mar Pet Geol 2010 27 650ndash665 [CrossRef]
33 Hearon IV TE Rowan MG Lawton TF Hannah PT Giles KA Geology and tectonics of Neoproterozoic salt diapirs andsalt sheets in the eastern Willouran Ranges South Australia Basin Res 2015 27 183ndash207 [CrossRef]
34 Osei-Bonsu K Dennis KJ Robe Township Water Supply Wellfield Evaluation Department of Water Land and BiodiversityConservation South Australia Government Printer Adelaide Australia 2004
35 Agarwal R Garg P Remote sensing and GIS based groundwater potential amp recharge zones mapping using multi-criteriadecision making technique Water Resour Manag 2016 30 243ndash260
36 Sreedevi P Sreekanth P Khan H Ahmed S Drainage morphometry and its influence on hydrology in an semi arid regionUsing SRTM data and GIS Environ Earth Sci 2013 70 839ndash848 [CrossRef]
37 Jasmin I Mallikarjuna P Satellite-based remote sensing and geographic information systems and their application in theassessment of groundwater potential with particular reference to India Hydrogeol J 2011 19 729ndash740 [CrossRef]
38 Deepika B Avinash K Jayappa K Integration of hydrological factors and demarcation of groundwater prospect zones Insightsfrom remote sensing and GIS techniques Environ Earth Sci 2013 70 1319ndash1338 [CrossRef]
39 Arya S Subramani T Karunanidhi D Delineation of groundwater potential zones and recommendation of artificial rechargestructures for augmentation of groundwater resources in Vattamalaikarai Basin South India Environ Earth Sci 2020 79 1ndash13[CrossRef]
40 Nag S Ghosh P Delineation of groundwater potential zone in Chhatna Block Bankura District West Bengal India using remotesensing and GIS techniques Environ Earth Sci 2013 70 2115ndash2127 [CrossRef]
41 Bagyaraj M Ramkumar T Venkatramanan S Gurugnanam B Application of remote sensing and GIS analysis for identifyinggroundwater potential zone in parts of Kodaikanal Taluk South India Front Earth Sci 2013 7 65ndash75 [CrossRef]
42 Tam V De Smedt F Batelaan O Dassargues A Study on the relationship between lineaments and borehole specific capacityin a fractured and karstified limestone area in Vietnam Hydrogeol J 2004 12 662ndash673 [CrossRef]
43 Sener B Suumlzen ML Doyuran V Landfill site selection by using geographic information systems Environ Geol 2006 49376ndash388 [CrossRef]
44 Shankar MR Mohan G Assessment of the groundwater potential and quality in Bhatsa and Kalu river basins of Thane districtwestern Deccan Volcanic Province of India Environ Geol 2006 49 990ndash998 [CrossRef]
45 Schumm SA Evolution of drainage systems and slopes in badlands at Perth Amboy New Jersey Geol Soc Am Bull 1956 67597ndash646 [CrossRef]
46 Sharma K Singh H Pareek O Rainwater infiltration into a bare loamy sand Hydrol Sci J 1983 28 417ndash424 [CrossRef]47 Fox D Bryan R Price A The influence of slope angle on final infiltration rate for interrill conditions Geoderma 1997 80
181ndash194 [CrossRef]48 Bronstert A Niehoff D Buumlrger G Effects of climate and land-use change on storm runoff generation Present knowledge and
modelling capabilities Hydrol Process 2002 16 509ndash529 [CrossRef]49 Ahmed A El Ammawy M Hewaidy AG Moussa B Hafz NA Mapping of lineaments for groundwater assessment in the
Desert Fringes East El-Minia Eastern Desert Egypt Environ Monit Assess 2019 191 1ndash22 [CrossRef] [PubMed]50 Subyani AM Geostatistical study of annual and seasonal mean rainfall patterns in southwest Saudi ArabiaDistribution
geacuteostatistique de la pluie moyenne annuelle et saisonniegravere dans le Sud-Ouest de lrsquoArabie Saoudite Hydrol Sci J 2004 49[CrossRef]
51 Babiker M Gudmundsson A The effects of dykes and faults on groundwater flow in an arid land The Red Sea Hills SudanJ Hydrol 2004 297 256ndash273 [CrossRef]
52 Benjmel K Amraoui F Boutaleb S Ouchchen M Tahiri A Touab A Mapping of groundwater potential zones in crystallineterrain using remote sensing GIS techniques and multicriteria data analysis (Case of the Ighrem Region Western Anti-AtlasMorocco) Water 2020 12 471 [CrossRef]
Water 2021 13 2571 18 of 18
53 Zhu Q Abdelkareem M Mapping groundwater potential zones using a knowledge-driven approach and GIS analysis Water2021 13 579 [CrossRef]
54 Krishnamurthy J Venkatesa Kumar N Jayaraman V Manivel M An approach to demarcate ground water potential zonesthrough remote sensing and a geographical information system Int J Remote Sens 1996 17 1867ndash1884 [CrossRef]
55 Chang K-T Weng C-I An investigation into the structure of aqueous NaCl electrolyte solutions under magnetic fields ComputMater Sci 2008 43 1048ndash1055 [CrossRef]
56 Abdelaziz R Merkel BJ Sensitivity analysis of transport modeling in a fractured gneiss aquifer J Afr Earth Sci 2015 103121ndash127 [CrossRef]
57 Dar T Rai N Bhat A Delineation of potential groundwater recharge zones using analytical hierarchy process (AHP) GeolEcol Landsc 2020 1ndash16 [CrossRef]
58 Abd Manap M Nampak H Pradhan B Lee S Sulaiman WNA Ramli MF Application of probabilistic-based frequencyratio model in groundwater potential mapping using remote sensing data and GIS Arab J Geosci 2014 7 711ndash724 [CrossRef]
- Introduction
-
- Overview of the Study Area
- Geology and Hydrogeology
-
- Materials and Methods
-
- Processing and Extraction of Thematic Layers
- Multi-Influencing Factors Approach (MIF)
- Verification of the GWRP
-
- Results
-
- Influencing Factors
-
- Drainage and Drainage Density
- Lineament and Lineament Density
- Topographic and Slope Features
- Lithology and Landcover
- Rainfall
-
- Recharge Potential Model
- Verification of the Recharge Potential Model
-
- Discussions
- Conclusions
- References
-
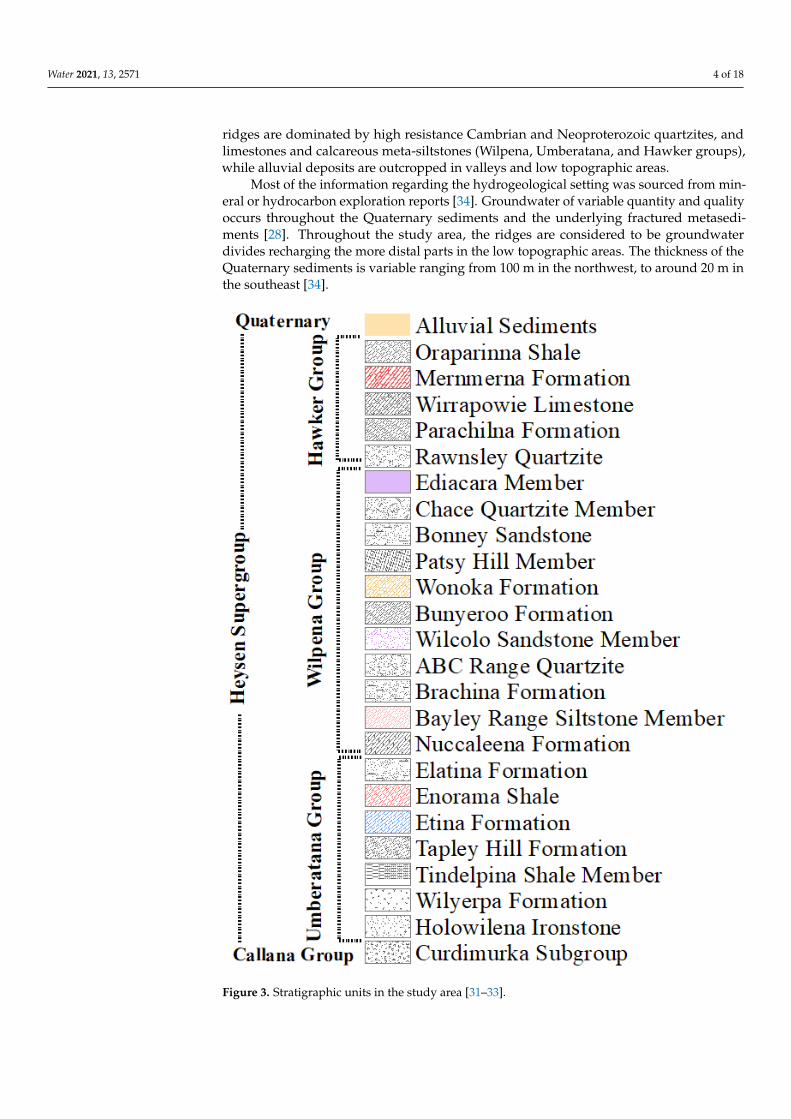