flf) - census survey of income and i program participation nonresponse adjustmemt methods for...
TRANSCRIPT

THE SURVEY OF INCOME AND
I PROGRAM PARTICIPATION
NONRESPONSE ADJUSTMEMT METHODS FOR DEMOGRAPHIC SURVEYS AT THE
US. BUREAU OF THE CENSUS
No. 8823 flf)
Rqjendra P. Singh and Rita J.Petroni
November 1988
I I I I I I 1 Urns- Deparbnent of Corn- BUREAU OF THE CENSUS
I

Prepared for presentation at the Research Planning Conference on Human Activity Patterns held May 10-12, 1988 at the University of Nevada, Las Vegas. The views expressed are the author(s) and do not necesr- 'y reflect those of the Census Bureau.

TABLE OF CONTENTS
I. INTRODUCTION......................................... 1
11. TYPES OF NONRESPONSE................................. 2
111. ADJUSTMENT FOR VARIOUS TYPES OF NONRESPONSE.......... 3
IV. EFFECT OF NONRESPONSE ON SURVEY ESTIMATES............ 3
V. CRITERIA TO DEFINE NONINTERVIEW ADJUSTMENT CELLS..... 7
................. A. Lower Bias................. 7 B. Lower Variance.............................. 8
VI. THE SURVEY OF INCOME AND PROGRAM PARTICIPATION....... 9
A. Noninterview Adjustment f o r ......... Cross-Sectional Estimates........ 11 B. Noninterview Adjustment f o r
Longitudinal Estimates........ ............ 13 VII. NONINTERVIEW ADJUSTMENT RESEARCH..................... 14
REFERENCES

NONRESPONSE ADJUSTMENT METHODS FOR DEMOGRAPHIC SURVEYS AT THE U.S. BUREAU OF THE CENSUS
BY RAJENDRA P. SINGH AND RITA J. PETRONI
1 .I. INTRODUCTION
I A sound sampling plan for a survey includes extensive effort to obtain useable data for each unit selected into the sample. Resources are allocated to develop a good sampling frame, design a good questionnaire, good interviewer's training and other data collection procedures such as how to gain cooperation of respondents. However, in spite of such efforts, all surveys
I encounter missing data which could occur either due to noncoverage or nonresponse. In this paper, we will discuss missing data due to nonresponse and methods to adjust for it. It occurs when some or all responses to the questions on a questionnaire are not obtained. This may be due to the respondents inability or unwillingness to answer.
I Researchers have been striving to reduce nonresponse. For exmple, they have done this by better designing and testing
I questionnaires thoroughly for complete and accurate answers before fielding the sunrey, providing respondents aids to keep better records, giving respondents gifts (cash or kind) to gain their cooperation and finding ways to improve training given to the data
I ~0lle~ti0n staff. Researchers are also heavily involved in improving the methods to account for missing data. Two approaches co~only used are imputation and weighting adjustment.
I In imputation, missing information is replaced with useable data
I from other sources. Regression imputation (Mlton and Kasprzyk, 1982) and cold-deck and hot-deck methods have been used by the U.S. Bureau of the Census. The demographic surveys primarily use
I the cold-deck and hot-deck procedures. The cold-deck procedure uses values from some prior distribution (same survey or other source), while the hot-deck uses current responses from the same source (survey) to substitute for missing values. Imputation is
I carried out by cross-classifying survey units into categories (cells) by a few variables in an attempt to group responses that are relatively homogeneous within the cells and heterogeneous
I betbf.cn cells. Within a cell, values obtained for s w e y Units are inserted as responses for missing items. To accomplish this, there must be at least one response available in each category to - be a donor for imputation.

Imputation is commonly used for partial response, that is, when a questionnaire is partially answered. It has also been used to compensate for complete nonresponse. One such example is -he 1960 U.S. Census (Pritzker et al. , 1965) adjustment for missin- 3ata. In this adjustment, a nonresponding household was imputed ( a
I responding household (donor) in the same cross-category. ?is approach of imputing a complete questionnaire amounts to i bling the weight of those respondents whose records are duplica i.
I Sufh a procedure can increase the variance as compared tc weighting adjustment. Hansen, Huwitz and Madow (1953) that the maximlxu increase in variance is about 12 percent fa: he method of duplicating records. If a donor is used more .Ian once,
I the variance increase could be even larger. I Weight adjustment within cells (Oh and Scheuren, 1983) to compensate for complete nonresponsr (unit nonresponse) is the predominant technique used in the demographic surveys of the
I Bureau of the Census. he general approach is basically the same for all its major surveys. 1t is simple and less expensive to b ~ l m e n t , as compared to imputation, and seems to work well (Jones, 1984) for some labor force characteristics in the Current
I Population Survey (cPS) such as number of persons in the labor farce, employed and unemployed. These estimates were not seriously affected by noninterview bias. The only labor force Categories with substantial bias were those which included vacationers and persons on layoff. I 1x1 this paper we will primarily discuss nonresponse weighting adjustment for demographic surveys used at the Bureau of the Census. Sections 11 and 1x1 discuss various types of nonresponse and adjustment approaches to deal with these different types of nonresponse, respectively. The effect of nonresponse on survey estimates is discussed in Section IV, and the criteria to define noninterview cells are presented in section V. As an example, the noninte~iew adjustment methods used for the S w e y of Income and P r o ~ l m Participation (SIPP) are presented in Section VI. Section
presents a discussion on noninterview adjustment research.
11. TYPES OF NONRESPONSE
Nonresponse can be divided into the following categories:
TYPE A NONINTERVIEW: A Type A noninterview occurs when every member of the hous&old is a nonintemiew. Also called a household nonresponse, it occurs when no one is home, household members are t~porari1y &sent (for example, they could be away on vacation), household membcrs refuse to participate in the survey, or the household cannot be located.

Type B Noninterview: This type of noninterview occurs when a housing unit is vacant, occupied by persons with their usual residence elsewhere, unfit or set to be demolished, under construction and not ready for occupancy, or converted to temporary business or storage. It also occurs when a site for a mobile home, trailer or tent is unoccupied or when a permit has been granted, but construction is not started.
Type C Noninterview: 1t occurs when a housing unit is demolished, or house or trailer is moved, converted to permanent business or storage, or merged or condemned.
Type Z Noninterview: Type 2 noninterview occurs when a member of an interviewed household is not interviewed and a proxy interview is not obtained. It is also called person nonresponse.
Item Nonresponse: Item Nonresponse occurs when a response to one or more questions is not provided, though most of m e questionnaire is completed.
III* ADJUSTMENT FOR VARIOUS TYPES OF NONRESPONSE
Of these five types of noninterview, no adjustment needs to be made for type B and type c noninterviews. This is because type C noninterviews are no longer housing units at the original address. For type B noninterviews, only households with usual residence elsewhere occupy housing units covered by these types of noninterview. such households have a chance of being in a sample at their usual residence.
Imputation techniques are used to deal with item nonresponse and type nonresponse in most of the demographic surveys at the Bureau of the Census. Weighting adjustment is used for type A nonresponse and in certain cases for type 2s. The procedures used for type As and type Zs are similar and based on the same general principals.
IV* EFFECT OF NONRESPONSE ON SURVEY ESTIMATES
It is a common belief that respondents have different characteristics from nonrespondents. This theory is supported by recent studies completed by Petroni (1987), and Short and M W h u r

(1986). Thus, nonresponse introduces bias in survey estimates We believe that the bias is small when the nonresponse rate is about 5% or less, but it increases as the nonresponse rate in Survey increases. Increase in bias with increase ' yonresponc can be shown mathematically as follows:
Let Pi ( = 1 , 2 , ) be the proportion and Ri be the responsc
rate of population members falling in ith group or cell. T ~ L the overall response rate, R, is given by:
K where L Pi = 1
i=l
Furthermore, assume that
- Yi = Mean of a characteristic of interest of the population
units falling in cell i.
'i(i1 = Mean of a characteristic of interest of the population
in the ith class which would not respond if selected in a sample.
'i(u)- = Mean of a characteristic of interest of the population
in the ith class which would respond if selected in a sample,
- = Sample estimate of ? '
yi(u) i(0)
Sample estimate of i(0) '

Then
'ij = n = Selection probability of jth unit in ith cell.
= Value of the characteristic of interest for the j th
Y i j
unit in the ith cell.
ni = Number of sample units in ith cell.
n = Number of sample units responding in ith cell. iv
Pi = Proportion of sample units falling in the i th
group or cell.
The expected value of 7 (u
is
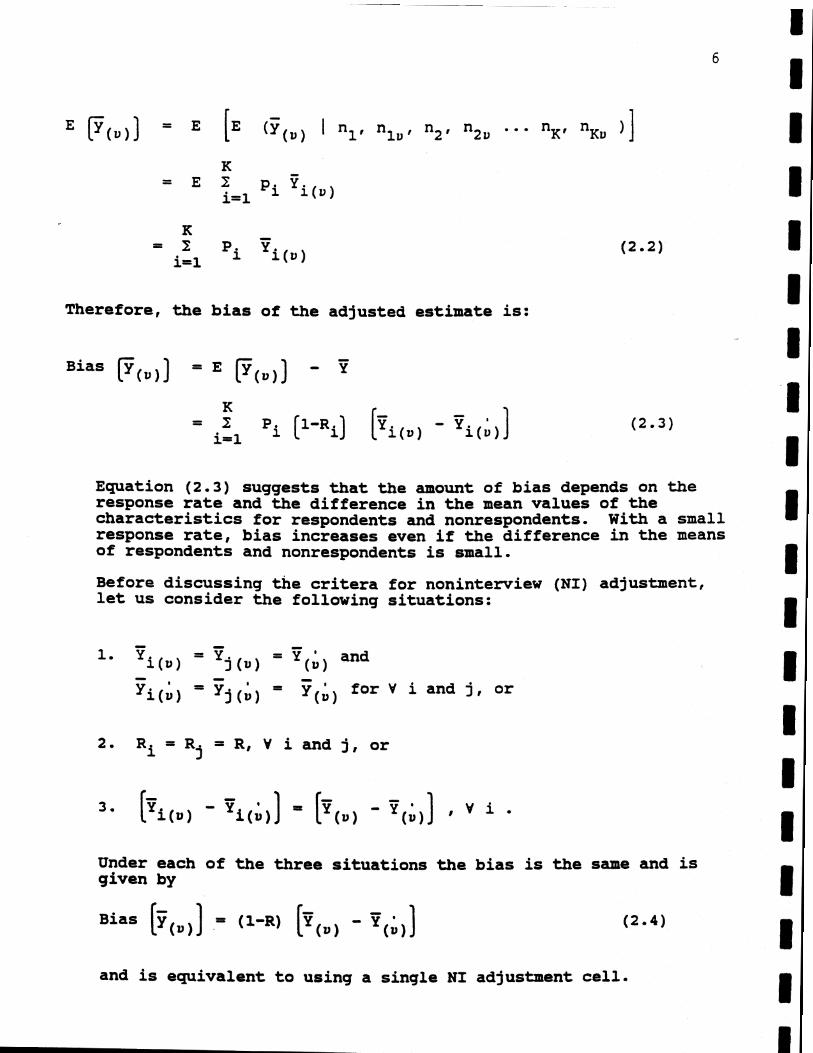
Therefore, the bias of the adjusted estimate is:
Equation (2.3) suggests that the amount of bias depends on the response rate and the difference in the mean values of the characteristics for respondents and nonrespondents. With a small response rate, bias increases even if the difference in the means of respondents and nonrespondents is small.
Before discussing the critera for noninterview (NI) adjustment, let us consider the following situations:
- - - 1. Y
i (u = Y
j (u) = Y ' and
- - (u ' - - * -
Yi(u) - Yj(u) - y(u) ' for V i and j, or
2. Ri = Rj = R, V i and j, or
Under each of the three situations the bias is the same and is given by
and is equivalent to using a single NI adjustment cell.

It is obvious from equation (2.3) that the bias in an estimate will be reduced by using two or more cells if
and Ri # R j ' V i, j. (2.6)
Therefore, the success of the NI adjustment procedure requires the identification of the survey variables which will define adjustment cells such that these cells vary both with respect to survey estimates and response rates. See Chapman (1976) for further details.
Note that there are other situations where bias could be reduced by use of more than one NI cell even if the above two conditions are not satisfied. For example, consider two cells. It is possible that one cell meets criteria (2.5) and the other does not, yet the population distribution into the cells and the response rates of the cells are such that the bias is less using two NI cells instead of one.
V. CRITERIA TO DEFINE NONINTERVIEW ADJUSTMENT CELLS
The objective of noninterview adjustment is to reduce the bias in survey estimates, A survey produces a large number of estimates, and adjustments which reduce bias for one set of estimates may not work well for another set of estimates. Therefore, it is essential to have a clear understanding of the relative importance of various estimates when implementing the criteria below to form NI cells. In addition to bias, it is occasionally necessary to consider reduction of mean square error. his is the case when the adjustment factor is large and, hence, increases the variance significantly.
A. Lower Bias
The following four criteria are used in selecting the cross-classification variables to reduce the bias in Survey estimates.
1. The variables are significantly correlated with the survey estimates. The implicit assumption in selecting these variables is that if for respondents these variables show a significantly high correlation with survey estimates to be produced, then they will also show high correlation

among nonrespondents. Since these variables must be available for both respondents and nonrespondents, the choice of the variables is constrained. These variabl-s are determined prior to data collection +e Onsure the necessary data is obtained and to avo~d possible bias due to the particular sample selected.
2. Within each weighting class E [yi(,,)] = E [yi(; I ] V i.
The means of any two noninterview adjustment cells differ,
4 . The response rate for any two cells differ, that is Ri # Rj , i # j, Vi and j.
B. Lower Variance
The variance contribution from a NI cell depends on the number Of responding and nonresponding units in that cell. For small cells the nonresponse weight adjustment can be large. Therefore, the size of the cell is an important consideration in defining a cell. One needs to consider the trade-off between variance and bias in deciding the size of the cell as bias should be reduced with a homogeneous (usually a smaller) - cell.
CILh00n and Bushery (1984) under a number of assumptioxs to simplify the mathematics involved showed that the va -ante of an estimator for cells with 25 sample units each is .9ut 0.5% higher assuming 52 nonresponse rate than a collapsec ,11 of 100 units. With 10% nonresponse rate it is about 1. ligher. In deriving these results they assumed independence t 3en sample units within a cell and between cells, cells a. f fixed equal size, and cells have the same expected re& 3e rate, expected value and variability of the characterr- :s of interest.
To reduce variance, NI cells are collapsed if the .?umber respondents in them is small or the nonintenriew adjusae factor

-1 n. 1 U
2 (wij) / (rij) I is too large. These limits are j=l j=l
somewhat subjective. For most of the demographic surveys at the Bureau, these limits are: a) minimum interviewed cases in a cell are 20-35, and b) maximum NI adjustment factor is 2. If one of these criteria is not satisfied by the cell it needs to be collapsed with another cell. The following collapsing criteria attempt to minimize the increase in mean square error of the survey estimates of interest. A cell i should be collapsed with a cell j if:
Usually, these two conditions are not satisfied by the same pair of cells. In those circumstances, either more emphasis should be placed on condition 1, or a pair should be found which reduces the mean square error even if neither of the two conditions is satisfied. Furthermore, if there is strong evidence that for a cell with a very high noninterview
adjustment factor E pi (v ) ] is very different from any other cell, then the cell should be kept seperate to minimize the bias due to nonresponse (Shapiro, 1980). (Since the amounts of bias and mean square error are unknown, experience is used to make judgements regarding expected reductions in mean square error and bias.)
VI. THE SURVEY OF INCOME AND PROGRAM PARTICIPATION
The Survey of Income and Program Participation (SIPP) is a new, - • ongoing national household survey administered by the Bureau of the Census. It is designed to provide improved data on income and participation in government administered programs such as food stamps, Aid to Families with Dependent Children (AFDC), Supplemental Security Income (SSI), etc. Data on demographic characteristics, labor force, education, etc. are also collected.
The SIPP is a multistage, stratified, systematic sample of the noninstitutionalized resident population of the United States.
This population includes persons living in group quarters quch as dormitories, rooming houses, and religious group dwelling: Noncitizens of the United States who u-rk or attend schoo in this country and their families are also el lgible. Crew membe of merchant vessels, Armed Forces personnel livinu i-n milita- barracks, and institutionalized persons a u ~ i ~ PS correctio: - facility inmates and nursing home residents are ineligible.~nitially, a sample OF living quarters in selr ad Primary Sampling Units (PSUS) is taken. (Living quarters re those in which the occupants do not live and eat with ar Jerson in the structure and that have either direct access frc- he outside of the building or through a common hall, or c- iete kitchen facilities for that unit only.) Persons resic in these living quarters at .the tima of the first interview are cmsidered to be in sample. However, only persons who are at leas= 15 years of age at this interview are eligible for interview. --mited data on children are also collected by proxy interviews.
The SIPP sample is divided into four groups of equal size called rotation groups. One rotation group is interviewed each month. In general, one cycle of four rotation groups is called a wave. This design provides a steady work load for data collection and processing. Persons 15 years old and over in the sample are interviewed once every four months for approximately 2.5 years. With certain restrictions, these sample persons are followed if they move to a new address. Persons who began living with sample Persons after the first interview are considered to be part of the sample only while residing with the sample persons. The reference period for the interview is the four months preceding the interview month. For example, for the first SIPP sample, the reference period for the November 1983 interview month was July through October 1983. ~hese sample persons were interviewed again in March 1984 for the November 1983 through February 1984 period. More details on the SIPP design are given in Nelson, McMillen, and Kasprzyk (1985).
The SIPP questionnaire is long and complex. Questions are asked by specific type of cash and non-cash income on montk. received and amounts per month. For many types of income, adc i0nal questions are asked of recipients. For example, in h eholds with children covered by Medicaid, up to 8 questions ~t health insurance are asked. Questions are also asked about = -ts and labor force status. Topical modules on various subjec Ire also included in most interviews.
For the subsequent waves, only original sample persons (t se interviewed in the first wave) and persc..- ,ng w i t h th are eligible to be interviewed. with certain resrrictions, c ginal

sample persons are to be followed if they moved to a new address. All noninterviewed households from Wave 1 are designated as noninterviews for all subsequent waves. Additional nonint@rViews result when original sample persons move without leaving a forwarding address or move to extremely remote parts of the country.
Due to the longitudinal nature (multiple interviews) of the survey, the noninterview rate accumlates over the life of the panel. Starting at about 5% - 7% at the time of the first interview, it reaches slightly over 20 percent for the last interview of the panel. The following briefly explains noninterview adjustment methods developed for the SIPP cross-sectional and longitudinal estimates.
A. Noninterview Adjustment for cross-Sectional Estimates
Noninterview adjustment for cross-sectional estimates are made at the household level. ~t the time of the first interview very little information (such as race of the reference person, owner-occupied or renter-occupied housing unit, size of the household, and the Census region) is available about the noninterviewed households. Therefore, a limited number of variables correlated to the SIPP characteristics of interest can be used to form noninterview cells. For first wave data, noninterview cells were formed using the following variables. See King (1985) for a detailed explanation.
a. Census region (Northeast, Midwest, South, West)
b- Residence (metropolitian statistical areas (MSA), not MSA)
c. Race of reference person (black, non-black)
d. Tenure (owner, renter)
e. Household size (1, 2, 3, 4 or more)
The nonintenriew adjustments for subsequent waves are in addition to the wave 1 adjustment, i.e., the NI adjustment made as a part of wave 1 weighting becomes an integral part of subsequent waves weighting. In subsequent waves, additional information obtained on previous wave respondents is available for use in developing noninterview cells. Using 1980 Decennial Census data, it was found that education level, race and origin of householder, household type, and tenure are highly correlated with the important characteristics (income,

poverty, etc) estimated by the sIPP. Also, Kalton et ale(1985) showed that the participation of a household in a given government program during the reference period covered by interview (K)is highly correlated with its participation in interview (K-1). For example, the correlations for food stamps and SSI were observed to be about .9 and .8 respectively. The relationship is also strong between interviews (K) and (K-2). For example, the correlation for food stamp participants between interviews (K) and (K-2) is .8. These correlations were obtained from the data collected in the Income Survey Development Program (ISDP) , a precedent of the SIPP.
Based on the above knowledge and experience of the Bureau Staff, the following household level variables were chosen to construct noninterview adjustment cells for second and subsequent waves. A detailed description of these cells is presented in King (1986) .
a. Race and Spanish origin of reference person (non-Spanish white, other).
b- Aousehold type (female householder with own children under 16 years of age but no husband present, householder is 65 years of age or older, others).
c- Education level of reference person (less than 8 years, 8-11 years, 12-15 years, and 16 or more years)
d. Type of income (welfare etc., others)
e. Assets (bonds etc., others)
f. Tenure (owner, renter)
g. Public housing or rent subsidized (resident of public housing or recipient of government rent subsidies, others)
h. Household size (1, 2, 3, 4 or more)
Cells which do not meet the following conditions are collapsed in a predetermined manner.
1. Number of interviewed households in a cell is greater than or equal to 30.

I 2. Noninterview adjustment factor is less than or equal to 2.
B. Noninterview Adjustment for Longitudinal Estimates
I At present, longitudinal weighting procedures are developed only for the estimates of persons. Two levels of non-interview adjustment are used in these procedures. The first is at the household level and is similar to the wave 1 adjustments for the cross-sectional estimate. It accounts for persons who could not be interviewed at the first wave of the reference period covered by the interval for which the longitudinal weights are developed. The second adjustment is made at the person level to account for those persons who could not be interviewed for at least one of the later waves covering the reference period of interest. An alternative to the weighting adjustment is imputation of the complete record for NI persons. (This is similar to imputation of type Zs in cross-sectional weighting.) However, this approach may have a significant adverse affect (increase bias) on estimates of gross flows, one of the most important longitudinal estimates. See Kalton (1986) and Singh et al. (1988).
The following variables were selected for use in the second level longitudinal NI adjustment procedures in the same way as for the cross-sectional adjustments and are based on the first interview covering the time interval for which the longitudinal weighting is developed. Note that certain person level variables are defined based on the household level variables. For example, a household in which at least one HH member received income from food stamps, the household is defined as having income from food stamps and each member of the household is considered a food stamp recipient. See Huggins (1988) for more information.
a. Average monthly HH income (<$1,200, $1,200-$3,999, 2 $4,000)
be hoployment status (Self-employed, others)
c- Type of income (welfare-etc., unemployment compensation, others)
d. Assets (bonds, others)
e. Education level (< 12 years, 12-15 years, 16 or more years)
f- Race and origin (white and not Spanish, others)

g. Labor force status (in labor force, not in labor force)
The cells formed using the above variables are collapsed before making noninterview adjustments if the number of interviewed persons in a given cell are either less than 30 and/or the noninterview adjustment factor is greater than 2.0.
VII . NONINTERVIEW AJDUSTMENT RESEARCH
To our knowledge, no study has been conducted to evaluate the effectivness of noninterview adjustment methods for the demographic surveys. Therefore, the effectiveness of these procedures to reduce bias in estimates is unknown. A study (Singh, 1987) to evaluate the s ~ p p noninterview adjustment methods for cross-sectional estimates is underway. The results from this study should be available later this year. Even then no general statement can be made, since the SIPP provides a large number of estimates. Some indirect evaluation of these procedures could be done. For example, the SIPP estimates from wave 1 and from a later wave (say wave 4) for a given characteristic could be compared against corresponding estimates from an independent source, especially administrative records. However, the validity of such an evaluation will be questionable.
The Bureau of the Census has conducted noninterview adjustment related research for its demographic surveys. Some of the research was performed for the American Housing Survey (AHS-National). Parmer (1986) examined correlations between variables of interest, between variables of interest and evaluation variables and the nonresponse rates for the selected variables of interest. He also examined stability of the variables considered to define noninterview adjustment cells. Research is also being conducted on improving noninterview adjustment for M e SIPP (petroni, 1988). Similar research may also prove useful for other demographic surveys.
Some research to examine the feasibility and merits of computing nonresponse adjustment factors as well as constructing weigt: -in9 cells is being conducted by Rosenbaum and Rubin (1983) and L ttle and Samuhel (1983). Research is also needed in developing models which may be used to estimate response probabilities for units. This could be done for several demographic surveys with simi-ar values of independent variables.

Acknowledgements
The authors wish t o express the ir appreciation for valuable technical comments provided by Leroy ~ a i l e y , David Chapman, Lawrence Altmayer, and Lloyd Hicks t o improve the quality of t h i s paper. Special thanks a l s o goes t o Kimberly Wilburn for typing the paper. Without her persistence and wil l ing att i tude, this paper could not have been completed.

REFERENCES
Cahoon, L. and Bushery, J. (1984)~ WEffect of Noninterview Cell size on the Variance of Estimatesw, Internal Census Bureau memorandum for documentation, November 27, 1984.
Chapman, D.W. (1976), "A Survey of Nonresponse Imputation *ocedurersw, Proceedings of the Social statistics Section, Pa* 1, American Swtistical Association, 245-251.
Hansen, M.H., W.N. Hurwitz,, and W.G. Hadow, Sample S u m y Methods and Theory, Vol. I, New York: John Wiley and Sons, Inc., 1953.
Jones,C.(1984), "Imputation Based on Subsets of ~nterviewed Casesw, Internal Census Bureau memorandum from Jones to Butz, December 29, 1984.
Kalton, G. (1986) , "Handling Wave Nonresponse in Panel Surveysn, Journel of Official statistics, 2, 303-314-
Kalton, G - and Kasprzyk, D. (1982), nInputing for Missing Survey Responsesw, Proceedings of the Survey Research Methods Section, American Statistical ~ssociation, pp. 22-31.
mlton, G., J. ~spkowski and T. in (1985), "compensating for Wave Nonresponse in the 1979 ISDP Research Paneln, Proceedings of the Suntey Research Methods Section, American Statistical Association, 372-377.
King, K. (1985) , wSIPP 8s: Cross-Sectional Weighting Specifications for Wave 1--Revision", Internal Census Bureau memorandum from Jones to Walsh, November 21, 1985-
King, KO (1986) , aSIPP: Cross-sectional Weighting Specifi~ations for the Second and Subsequent Wavesw, Internal Census Bureau memo1~dum from Jones to Walsh, June 19, 1986.
Little, R.J.A. and Samuhel, M.E. (1983), "Imputation Models on +he Propensity to Respondw, Proceedings of the Section on SurVey Research Methods, American statistical ~ssociation, 415-420.
Nelson, D., McMillen, D., and lCasprzyk (1985), "An overview of the Survey of Income and program participation : update lm, SIPP Working Paper series No. 8401, U.S. Bureau of the Census.

Oh, H.L. and Scheuren, F.J. (1983), Weighting Adjustment for Unit Nonresponse. Incomplete Data in sample Surveys. Vol. 2, New York: Academic Press, 143-184.
Parmer, R.J. (1986), wDocumentation fo the AHS-National Noninterview Adjustment Research for 198Sn, Interna- Census Bureau memorandum for documentation, April 16, 1986.
Pe-oni, R. (1987), "SIPP 84: Characteristics of Ini - 1 1 ~ Interviewed Persons by Response statusn, Internal ensus Bureau memorandum from Nonresponse Workgroup for the Record, September 3, 1987.
Petroni, R. (1988), RRtaluation of Mover characteristics ar-d Nonresponsen, Internal Census Bureau memorandum from Petroni to Singh, April 6, 1988.
Pritzker, L., J. Ogus, and M.H. Hansen (1965), wComputer Editing Methods - Some Applications and Resultsn, Bulletin of the International Statistical Institute, Proceedings of the 3Sth Session Belgrade 41, 1965.
Rosenbaum, P., and Rubin, D. (1983), "The Centml Role of the Propensity Score in Observational Studies for Casual Effects," Biometrika, 70, 41-55.
Shapiro, G (1980), WA General Approach to Nonintenriew Adjustmenta, Internal Census Bureau memorandum from Shapiro to Programs Area Branch chiefs, -ch 11, 1980.
Short, K., and M m u r , E. (1986), "Life Events and Sample Attrition in the Survey of Income and Program Pa*- icipationn, Proceedings of the Section on Survey Research He-ods, American Statistical Association, 200-205.
Singh, R., Weidman, L., and Shapiro, G. (1988), of the SIPP Estbates~, presented at the SIPP Conference on Individuals and Families in Transition: understanding Change through Longitudinal mta, &mapolis, -'and, Harch 16-18, 1988.