flexural behaviour of sandwich panels under elevated ... · figure 4.29. load ± deflection diagram...
TRANSCRIPT

FACULTY OF ENGINEERING AND SURVEYING
Flexural Behaviour of Sandwich Panels under Elevated
Temperature
A dissertation submission by
Swetha Surendar
In fulfilment of the requirements of
Courses ENG 8411 and 8412 Research Project
Towards the degree of
Master of Engineering Sciences – Structural Engineering
Submitted on: 30th
October 2014

i
Abstract
The objective of this work was to experimentally determine the flexural behaviour of
composite sandwich panels under elevated temperatures from 21°C to 180°C. The new
generation sandwich beams were fabricated using top and bottom skins made of two
plies of bi-axial glass fibre/resin and an innovative phenol-formaldehyde core. The
composite sandwich beams and the skins were subjected to flexure test under 3-point
static bending test to determine the strength and the stiffness. The elevated temperature
effects were applied using an environment chamber. The peak load, strength and the
Young’s modulus of each specimen under each temperature was recorded. Prior to this,
the skin and the core materials were also subjected to Dynamic Mechanical Analysis
(DMA) in order to determine the material properties at elevated temperatures.
The glass transition temperatures of the skin and the core were obtained through the
DMA as 125.06°C and 136.11°C respectively. A rapid loss in the storage modulus was
observed in the core specimens as the temperature increased and the specimens began to
decompose beyond the glass transition temperature. The testing of the skin specimens
revealed that the storage modulus decreases steadily with the increase in temperature
until the glass transition temperature and beyond the transition temperature the storage
modulus begins to increase.
The flexure test of the skin revealed that the Young’s modulus of the specimens
decrease steadily with the increase in the temperature before increasing beyond 120°C.
The strength of the skin decreases rapidly until 120°C and shows a slight increase in
strength beyond this temperature. The flexure test of the sandwich panels revealed that
the Young’s modulus of the sandwich panels decreases steadily as the temperature
increases. The strength of the sandwich panels was found to increase with the increase
in temperature until 50°C and starts to decrease beyond this temperature before showing
a slight increase in the flexural strength at 180°C.
A theoretical equation was developed which predicted the behaviour of the sandwich
panels under elevated temperature. The theoretical equation revealed that the Young’s
Modulus of the sandwich panel predicted through the theoretical equation correlated
well with the experimental values until 100°C. From 120°C, the experimental values
were lower than the values obtained from the prediction equation due to the partial loss
in the composite action of the sandwich panel.

ii
University of Southern Queensland
Faculty of Health, Engineering and Science
ENG8411/ENG8412 Masters Dissertation Project
Limitations of Use
The Council of the University of Southern Queensland, its Faculty of Health,
Engineering and Science, and the staff of the University of Southern Queensland, do not
accept any responsibility for the truth, accuracy or completeness of material contained
within or associated with this dissertation.
Persons using all or any part of this material do so at their own risk, and not at the risk
of the Council of the University of Southern Queensland, its Faculty of Health,
Engineering and Science or the staff of the University of Southern Queensland.
This dissertation reports an educational exercise and has no purpose or validity beyond
this exercise. The sole purpose of this dissertation project is to contribute to the overall
education within the student's chosen degree program. This document, the associated
hardware, software, drawings, and other material set out in the associated appendices
should not be used for any other purpose: if they are so used, it is entirely at the risk of
the user.
Professor Frank Bullen Dean Faculty of Engineering and Surveying

iii
Certification
I certify that the ideas, designs and experimental work, results, analyses and conclusions
set out in this dissertation are entirely my own effort, except where otherwise indicated
and acknowledged.
I further certify that the work is original and has not been previously submitted for
assessment in any other course or institution, except where specifically stated.
Student Name: SwethaSurendar
Student Number: 0061044210
____________________________
Signature
____________________________
Date

iv
Acknowledgements
I would like to take this opportunity thank my supervisor Dr. Allan Manalo for his
guidance and support throughout this project. I also wish to extend my thanks to the
Centre for Excellence in Engineered Fibre Composites (CEEFC) and the University of
Southern Queensland for sponsoring my project. I would also like to thank LOC
Composites, Pty Ltd for providing the necessary equipment and testing materials for
this project.
Finally I would like to thank my parents and my husband Mr. Prasad Pendlimarry for
their patience and support throughout this endeavour.

v
Table of Contents
Abstract i
Limitations of Use ii
Certification iii
Acknowledgements iv
List of Figures xi
List of Tables xvi
Glossary of Terms xvii
Chapter 1 – Introduction 1
1.1. Introduction 1
1.2. Project Background 2
1.3. Research Aims 2
1.4. Justification 3
1.5. Scope 3
1.6. Summary 4
Chapter 2 – Literature Review 5
2.1. Introduction 5

vi
2.2. History of Composites 5
2.2.1. Types of Fibres 5
2.2.2. Types of Resins 6
2.3. Limitations of the Composites 7
2.4. Background on Sandwich Panels 7
2.4.1. Background on Skin 8
2.4.2. Background on Core 9
2.4.3. Structural Applications of the Sandwich Panels 10
2.5. Behaviour of Sandwich Panels under Ambient Temperature 11
2.6. Effect of Elevated Temperature on Composites 14
2.7. Effect of Elevated Temperature on Sandwich Panels 16
2.8. Research Gaps from Previous Works 17
2.9. Summary 17
Chapter 3 – Project Methodology 18
3.1. Introduction 18
3.2. Materials 18
3.3. Test Specimen 19
vii
3.4. Specimen Preparation 20
3.5. Experimental Procedure 20
3.5.1. Dynamic Mechanical Analysis (DMA) 20
3.5.2. Flexure Test 21
3.6. Summary 23
Chapter 4 – Results and Observation 24
4.1. Introduction 24
4.2. Dynamic Mechanical Analysis 24
4.2.1. Skin 25
4.2.2. Core 27
4.3. Behaviour of the Skin 28
4.3.1. Load – Deflection Relation 28
4.4. Failure Modes of the Skin 37
4.4.1. Failure Mode at 21°C 37
4.4.2. Failure Mode at 35°C 39
4.4.3. Failure Modes at 50°C, 65°C and 80°C 40
4.4.4. Failure Modes at 100°C and 120°C 43

viii
4.4.5. Failure Modes at 150°C and 180°C 45
4.5. Behaviour of the Sandwich Panel 47
4.5.1. Load – Deflection Relation 47
4.6. Failure Modes of the Sandwich Panels 55
4.6.1. Failure Modes at 21°C and 35°C 55
4.6.2. Failure Modes at 50°C, 65°C and 80°C 56
4.6.3. Failure Modes at 100°C and 120°C 58
4.6.4. Failure Modes at 150°C and 180°C 60
4.7. Summary 62
Chapter 5 – Discussion 63
5.1. Mechanical Properties of the Skin and the Core under
Dynamic Mechanical Analysis (DMA) 63
5.2. Load – Displacement Diagram of the Skin under Three Point
Bending Test 65
5.3. Load – Displacement Diagram of the Sandwich Panel under
Three Point Bending Test 67
5.4. Effect of Elevated Temperature on the Strength of the Skin 68
5.5. Effect of Elevated Temperature on the Modulus of the Skin 69
5.6. Effect of Elevated Temperature on the Strength of the 70

ix
Sandwich Panel
5.7. Effect of Elevated Temperature on the Modulus of the
Sandwich Panel
71
5.8. Summary 72
Chapter 6 – Theoretical Prediction of the Composite Sandwich
Behaviour under Elevated Temperature 74
6.1. Introduction 74
6.2. Assumptions made for the Theoretical Prediction Equation 74
6.3. Prediction of the Strength and the Modulus of the Skin and
the Core of the Sandwich Panel 74
6.3.1. Prediction Equation for the Flexural Modulus of the
Skin 75
6.3.2. Prediction Equation for the Flexural Strength of the
Skin 76
6.3.3. Prediction Equation for the Flexural Strength and
the Flexural Modulus of the Core 77
6.4. Empirical Equations 78
6.4.1. Prediction of the Theoretical Young’s Modulus
(Esw) 78
6.4.2. Prediction of the Strength of the Skin and the Core 80

x
6.5. Comparison of the Results 81
6.5.1. Comparison of the Theoretical Modulus with the
Experimental Modulus 82
6.5.2. Comparison of the Theoretical Strength of the Skin
and the Core of the Sandwich Panel with the Experimental
Strength
83
6.6. Summary 85
Chapter 7 – Conclusion and Recommendation 86
7.1. Conclusion 86
7.2. Recommendations for Future Work 89
References 90
Appendix A - Project Specification 94
Appendix B 95
Appendix C 102

xi
List of figures
Figure 1.1. Composite fibre bridge in Tasmania, Australia 1
Figure 2.1. Illustration explaining sandwich panel concept 8
Figure 2.2. Fibre Composite Laminate 9
Fidure 2.3. Honeycomb and Foam cores 9
Figure 2.4. Structural Applications of Sandwich Panels 11
Figure 3.1. Carbon LOC® Panels 19
Figure 3.2. DMA Testing Equipment 21
Figure 3.3. DMA Test Set-Up 21
Figure 3.4. Schematic Diagram of Three Point Bending Test 22
Figure 3.5. Flexure Test Equipment 22
Figure 3.6. Flexure Test Set-Up 23
Figure 4.1. DMA Result of the Skin 25
Figure 4.2. DMA results of the Core 27
Figure 4.3. Load – Deflection diagram for the skin at 21°C 28
Figure 4.4. Load – Deflection diagram for the skin at 35°C 29
Figure 4.5. Load – Deflection diagram for the skin at 50°C 30

xii
Figure 4.6. Load – Deflection Diagram for the skin at 65°C 31
Figure 4.7. Load – Deflection Diagram for the skin at 80°C 32
Figure 4.8. Load – Deflection Diagram for the skin at 100°C 33
Figure 4.9. Load – Deflection Diagram for the skin at 120°C 34
Figure 4.10. Load – Deflection Diagram for the skin at 150°C 35
Figure 4.11. Load – Deflection Diagram for the skin at 180°C 36
Figure 4.12. Failure of the specimen at 21°C 37
Figure 4.13. Cracks on the compression side of the specimens at 21°C 38
Figure 4.14. Failure of the specimen at 35°C 39
Figure 4.15. Cracks on the tension side of the skin at 35°C 39
Figure 4.16. Failure of the specimen at 50°C 40
Figure 4.17. Compression and tension cracks on the specimen at 50°C 40
Figure 4.18. Failure of the specimen at 65°C 41
Figure 4.19. Compression and tension cracks on the specimen at 65°C 41
Figure 4.20. Failure of the specimen at 80°C 42
Figure 4.21. Compression and tension cracks on the specimen at 80°C 42
Figure 4.22. Failure of the specimen at 100°C 43

xiii
Figure 4.23. Compression and tension cracks on the specimen at 100°C 43
Figure 4.24. Failure of the specimen at 120°C 44
Figure 4.25. Compression and tension cracks on the specimen at 120°C 44
Figure 4.26. Compression cracks on the specimen at 150°C 45
Figure 4.27. Failure of the specimen at 180°C 45
Figure 4.28. Failure on the compression side of the specimen at 180°C 46
Figure 4.29. Load – Deflection diagram for the sandwich panel at 21°C 47
Figure 4.30. Load – Deflection diagram for the sandwich panel at 35°C 48
Figure 4.31. Load – Deflection diagram for the sandwich panel at 50°C 48
Figure 4.32. Load – Deflection diagram for the sandwich panel at 65°C 49
Figure 4.33. Load – Deflection diagram for the sandwich panel at 80°C 50
Figure 4.34. Load – Deflection diagram for the sandwich panel at 100°C 51
Figure 4.35. Load – Deflection diagram for the sandwich panel at 120°C 52
Figure 4.36. Load – Deflection diagram for the sandwich panel at 150°C 53
Figure 4.37. Load – Deflection diagram for the sandwich panel at 180°C 54
Figure 4.38. Failure modes at 21°C and 35°C 55
Figure 4.39. Delamination failures at 21°C and 35°C 55
xiv
Figure 4.40. Failure modes at 50°C and 65°C 56
Figure 4.41. Delamination failures at 50°C and 65°C 56
Figure 4.42. Failure mode of the specimen at 80°C 57
Figure 4.43. Delamination of the plies at 80°C 57
Figure 4.44. Failure mode of the specimen at 100°C 58
Figure 4.45 Failure mode of the specimen at 120°C 59
Figure 4.46. Delamination of the core at 100°C and 120°C 59
Figure 4.47. Failure of the specimen at 150°C 60
Figure 4.48. Failure of the specimen at 180°C 61
Figure 4.49. Delamination of the core at 150°Cand 180°C 61
Figure 5.1. Skin specimens before and after the DMA 64
Figure 5.2. DMA result of the skin 64
Figure 5.3. Load – Displacement Diagram of the skin specimens at
different temperatures 65
Figure 5.4. Load – Deflection diagram of the sandwich panel at different
temperatures 67
Figure 5.5. Strength Vs Temperature of the skin 68
Figure 5.6. Modulus Vs Temperature of the Skin 69

xv
Figure 5.7. Strength Vs Temperature of the sandwich panel 70
Figure 5.8. Modulus Vs Temperature of the sandwich panel 71
Figure 6.1 Prediction Equation for the modulus of the skin 75
Figure 6.2. Prediction Equation for the strength of the skin 76
Figure 6.3. Prediction equation for the modulus of the core 77
Figure 6.4. Prediction equation for the strength of the core 77
Figure 6.5. Normalised data of the skin 79
Figure 6.6. Dimensions of the sandwich panel 80
Figure 6.7. Comparison of the theoretical and experimental modulus of
the skin 82
Figure 6.8. Comparison of the theoretical strength and experimental
strength of the skin 83
Figure 6.9. Comparison of the theoretical and experimental Strengths of
the core 84
xvi
List of Tables
Table 3.1 Test Specimen Dimensions 19
Table 3.2. Dimensions of the DMA samples 20
xvii
Glossary of Terms
T Temperature in ͦ C
S Storage Modulus in MPa
P Peak Load in N
ɛ Peak Strain
Δ Deflection in mm
I Inertia in mm^4
M Moment of inertia in KNm
L Length in mm
σs Flexural Strength of the skin
σc Flexural Strength of the Core
Es Young’s modulus of the Skin
Ec Young’s modulus of the Core
Esw Young’s modulus of the Sandwich Panel
Is Moment of Inertia of the Skin
Ic Moment of Inertia of the Core
Isw Moment of Inertia of the Sandwich panel

xviii
(EI)sw Effective Equivalent Stiffness of the Sandwich Panel
b Width of the sandwich panel
ts Thickness of the skin
tc Thickness of the core
y Distance from the neutral axis
DMA Dynamic Mechanical Analysis
CEEFC Centre for Excellence in Engineered Fibre Composites

1
Chapter 1 - Introduction
1.1. Introduction
A recent trend in the arena of civil engineering is to employ the use of light weight,
smart materials for the construction of residential, commercial and industrial structures.
Fibre reinforced composites are found to be one of the best light weight construction
materials to be employed in the building material systems. There are a number of
naturally occurring composites in the nature such as the wood and bone.
The fibre reinforced polymer composites are a class of engineering materials which
consists of two or more constituent materials. The major constituent materials are the
reinforcement fibres and the matrix. The reinforcement fibres are generally in a
dispersed phase and the matrix is in a continuous phase. The matrix is often commonly
referred to as the resin. The primary purpose of the fibres is to provide the necessary
strength and the stiffness to the composite and to carry the primary loads to which the
composite is subjected. The purpose of the resin/matrix system is to bind the fibres as a
cohesive unit. The resin also performs other functions such as ensure the transfer of
loads between the fibres and the plies, carry the shear loads, support fibres against
buckling and to protect the fibres from mechanical and chemical damage.
Figure 1.1: Composite fibre bridge in Tasmania, Australia

2
The use of sandwich structures is increasing at a rapid rate in the engineering and
manufacturing world. This material has been widely used in the automotive, aerospace,
marine and other industrial applications due to its many advantages (Manalo et al,
2012)(Manalo, A., Aravinthan, T. & Karunasena, W. 2012). There is especially
substantial growth in this area, in applications where weight saving is a major
advantage. (Mujika et al. 2011).The light weight of the sandwich panels facilitates the
ease of handling during the manufacturing, assembling, and installation and also
reduces the manufacturing costs. In addition, composite sandwich structures are
preferred over conventional materials because of its high corrosion resistance (Manalo
et al, 2012).
1.2. Project Background
The sandwich panels which have already found their applications in the other fields due
to their many advantages are now being researched for their structural applications in
the field of civil engineering. The concept of sandwich panels provides an efficient
structural system suitable for a variety of applications, including floor and roof panels,
pedestrian bridge decks and cladding walls for buildings(Fam & Sharaf 2010).When the
composite sandwich panels are used as structural components in the field of structural
engineering, they will be exposed to a variety of operating environments and the effect
of elevated temperature is considered to be one among them. However, there is very
limited studies conducted investigating the effect of elevated temperature, which is the
main motivation of this project.
1.3. Research Aims
The aim of this research is to understand and analyse the effect of elevated temperature
on the flexural behaviour of the fibre reinforced sandwich panels through experimental
investigation and analytical studies.
The specific objectives of the project are as follows:

3
To understand and analyse the behavioural characteristics of the core and
the skin materials under elevated temperature.
To determine the flexural behaviour of the FRP panels under elevated
temperature
To establish an empirical equation describing the behaviour of the
sandwich panels.
1.4. Justification
The fibre composite sandwich panels are currently being researched for their
applications in the field of civil engineering. Any structure will be subjected to a variety
of operating environments and the effect of elevated temperature is one among them.
This kind of scenario is more common in the mining industry. Although, there is
extensive research conducted on the behaviour of the fibre composites under elevated
temperatures, the past research on the composite sandwich panels is limited to those
conducted under ambient temperatures to predict their behaviour. There is very limited
literature available for behaviour of sandwich panels under elevated temperatures.
Hence, this research fulfils the gap in the literature by investigating the behaviour of the
composite sandwich panels under elevated temperatures.
1.5. Scope
This project has focussed on the flexural behaviour of the fibre reinforced sandwich
panels under elevated temperature. The structural behaviour of the sandwich panels
subjected to the effect of temperature and three point static bending was investigated in
this study. The effect of temperature on the structural properties such as the strength and
stiffness was studied in detail for each temperature range. Through the experimental
investigation load-deflection, stress-strain, strength-temperature and young’s modulus-
temperature relation was established for each specimen under each temperature. A
theoretical equation describing the behaviour of the sandwich panels was developed
which predicts the behaviour of the sandwich panels under elevated temperature. The
results from the theoretical equation were compared with the experimental results for
correlation.

4
1.6. Summary
This research has studied and analysed the flexural behaviour of the fibre composite
sandwich panels under elevated temperature. Since there are very limited resources
available on the behaviour of the sandwich panels under elevated temperature, the
material properties and the behaviour of the panels under elevated temperature are
experimentally investigated followed by developing an empirical relation describing the
behaviour of the sandwich panels under elevated temperatures. The results from this
prediction were compared with experimental results in order to understand the effect of
the temperature on the sandwich panels.

5
Chapter 2 – Literature Review
2.1. Introduction
The history of composites, constituent materials and their structural application
pertaining to civil engineering will be discussed in this chapter. A detailed discussion on
the sandwich panels, their composition and their applications is presented in this
section. Further the past studies conducted on the composites under elevated
temperature, sandwich panels under ambient and elevated temperatures are discussed in
detail. Finally the research gaps from the previous works are discussed briefly.
2.2. History of Composites
The fibre reinforced polymer composites appear to be a relatively new concept, but
however the basics of these composites are age-old concepts dating back to the early
18th
century. The first structural application was through the development of the Adobe
bricks, which are straw- reinforced clay bricks. The first patent for the synthetic
composites was obtained in the year 1899 which was developed using the phenol-
formaldehyde resin (Bakelite). The commonly used reinforcements during the early
periods were linen cloth, asbestos and wood. However, they had a number of pitfalls
such as the brittle behaviour of the reinforcement fibres, low tensile strength and the
high cost of production and fabrication. The break-through to these problems were
achieved in the 1940’s through the release of the first commercial glass fibre cloth by
the Owens-Corning’s and the commercial release of the unsaturated polymer resins.
From this point there was a number of consecutive researches conducted in-order to aid
the development of the composite materials.
2.2.1. Types of Fibres
The reinforcement fibres are classified into two types namely:
Natural Fibres
Synthetic Fibres
The natural fibres are those fibres which are obtained from naturally available materials.
They are further classified into the plant which is derived from plants such as the hemp,
6
flax, jute, coir etc., and animal fibres such as the fur and wool which are obtained from
animals. On the other hand artificially manufactured fibres through certain mechanical
processes are called synthetic fibres such as the glass, carbon, aramid/Kevlar, ceramic,
and so on. The glass, carbon and the Kevlar fibres are commonly used due to their
advantages.
2.2.2. Types of resins:
The resin/matrix system is classified into two types namely:
Thermoplastic polymers
Thermoset Polymers
Thermoplastics are polymeric materials with a series of long chain polymers without
any covalent bonds connecting them. At room temperatures these polymers tend to
behave like a solid due to the entanglement of the long chained molecules, but under
heat and high pressure these molecules tend to slip under each other resulting in new
shapes. It is found that upon cooling these polymers possess the ability to restore back
to its original shape due to the restriction in the relative movement between the
individual molecules. At this juncture of time, it is found that the thermoplastic
molecules find a very limited application in the structural fibre composites from the
civil/structural engineering perspective due to their disadvantages such as high
processing and production costs. It was also found that thermoplastic polymers possess
a poor compressive strength and a poorer resistance towards solvents in comparison to
the thermosetting polymers. Some of the commonly used thermoplastic polymers from
the perspective of composites are polyphenylene-sulphide (PPS), polyether ether ketone
(PEEK), polyether imide (PEI) and polyamide-imide (PAI)
The thermoset polymers are materials in which the low molecular weight, reactive
compounds are cross-linked to each other via covalent bonds to form a single three
dimensional polymeric network. Unlike the thermoplastic polymers, the shape of the
thermosetting polymers cannot be altered by the application of heat as this would
involve the sliding of initial chain and would result in the breaking of the bonds. It is
observed that upon heating there is an increase in the strength of the bonds resulting in a
more rigid material. The thermoset polymers are widely used as the composite matrices
due to their advantages such as they can be formulated at ambient temperatures and can

7
be processed without the application of high pressures. They also offer increased
resistance to chemicals such as acids, bases and solvents. Some of the examples of the
thermosetting polymers are polyesters, vinyl esters, epoxies, phenols and polyurethenes.
2.3. Limitations of the Composites
Although the composite sandwich structures have a number of advantages, they possess
some constraints such as limited performance history, lack of design codes and
standards. Apart from this the major limitation was that the design of the composite
laminates is governed by stiffness rather than the strength which results in greater
deflection. This limitation of increased deflection led to the innovation of the novel
composite sandwich structures.
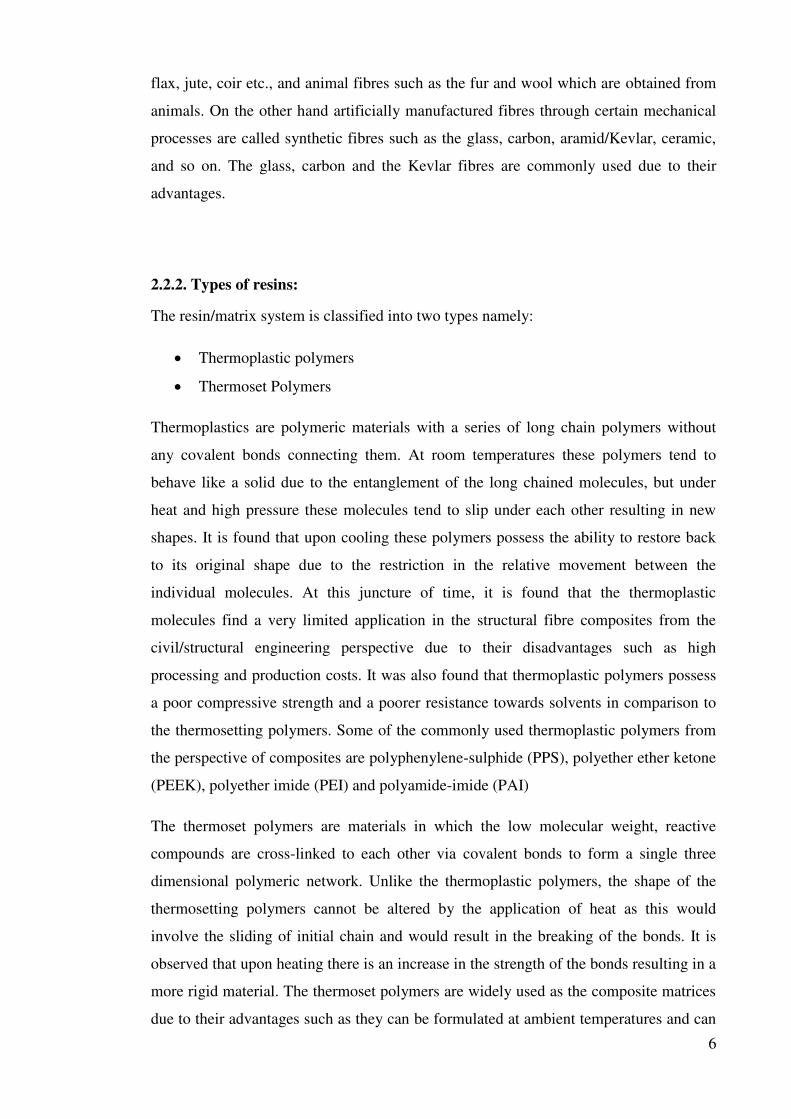
2.4. Background on Sandwich Panels
Typically, a low density core, which could also have excellent insulation characteristics,
is sandwiched between high strength and stiffness thin skins bonded to the core. The
system provides very high strength- and stiffness-to-weight ratios(Fam & Sharaf 2010).
The skin and the core are generally bonded together by either adhesives or by co-curing.
The top and the bottom skins carry the in-plane and the bending stresses (compression
at the top and tension at the bottom), while the cores carry the shear loads and the
normal loads.
8
Figure 2.1: Illustration explaining sandwich panel concept
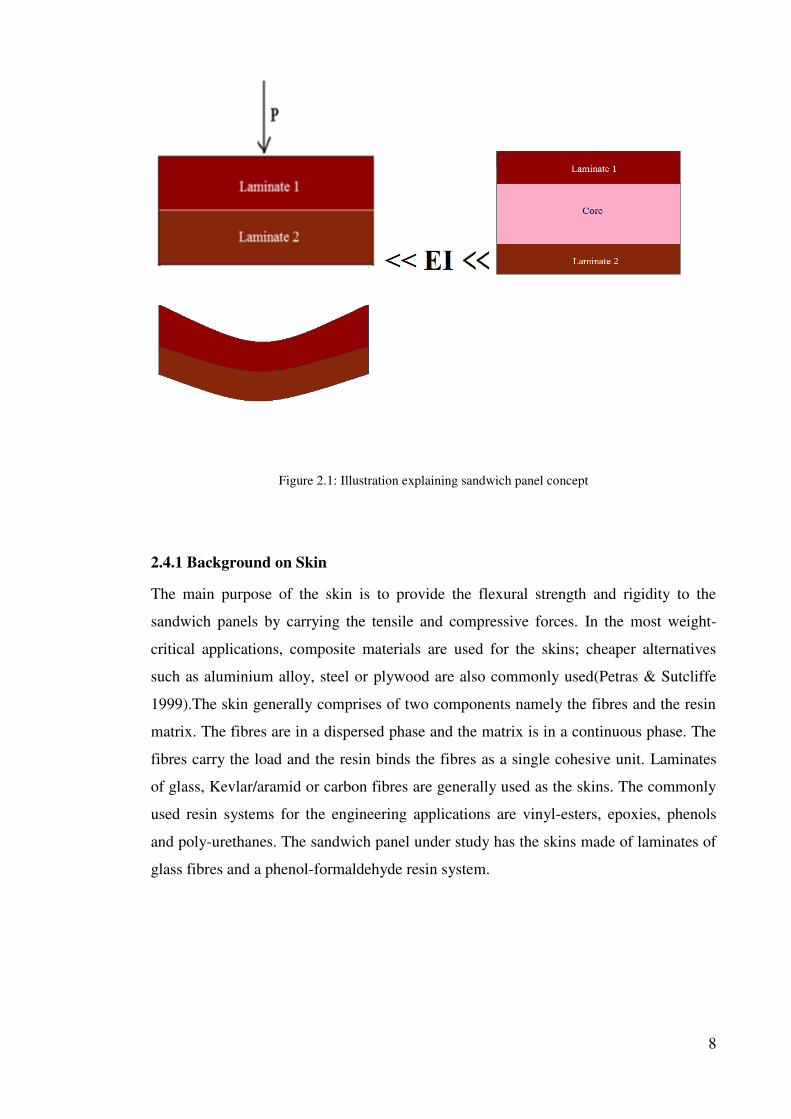
2.4.1 Background on Skin
The main purpose of the skin is to provide the flexural strength and rigidity to the
sandwich panels by carrying the tensile and compressive forces. In the most weight-
critical applications, composite materials are used for the skins; cheaper alternatives
such as aluminium alloy, steel or plywood are also commonly used(Petras & Sutcliffe
1999).The skin generally comprises of two components namely the fibres and the resin
matrix. The fibres are in a dispersed phase and the matrix is in a continuous phase. The
fibres carry the load and the resin binds the fibres as a single cohesive unit. Laminates
of glass, Kevlar/aramid or carbon fibres are generally used as the skins. The commonly
used resin systems for the engineering applications are vinyl-esters, epoxies, phenols
and poly-urethanes. The sandwich panel under study has the skins made of laminates of
glass fibres and a phenol-formaldehyde resin system.
9
Figure 2.2: Fibre composite laminate
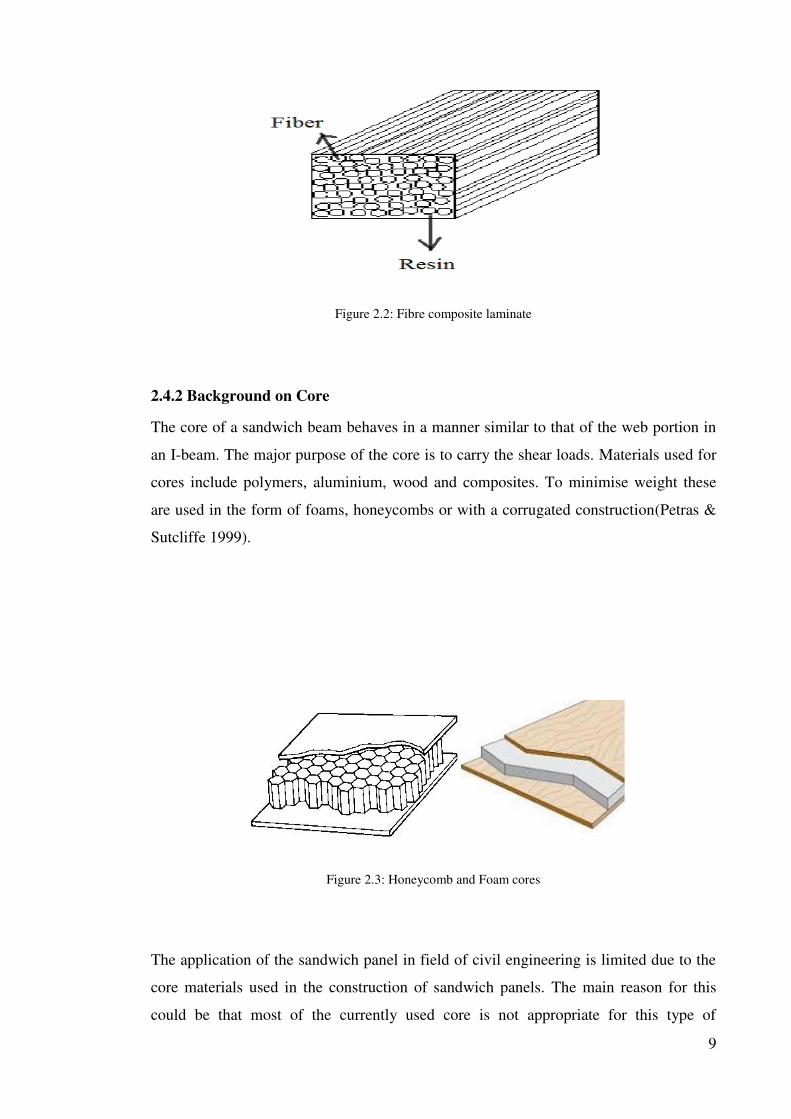
2.4.2 Background on Core
The core of a sandwich beam behaves in a manner similar to that of the web portion in
an I-beam. The major purpose of the core is to carry the shear loads. Materials used for
cores include polymers, aluminium, wood and composites. To minimise weight these
are used in the form of foams, honeycombs or with a corrugated construction(Petras &
Sutcliffe 1999).
Figure 2.3: Honeycomb and Foam cores
The application of the sandwich panel in field of civil engineering is limited due to the
core materials used in the construction of sandwich panels. The main reason for this
could be that most of the currently used core is not appropriate for this type of

10
application. Foam core and balsa wood are soft and will crush under high compressive
loads. Honeycomb and trussed-core structures have high compressive strength but the
presence of cavities in these core materials reduces their capacity to hold mechanical
connections. The evolution of a sandwich structure with lightweight, high strength core
and with good holding capacity for mechanical connections provides an opportunity to
develop this material for structural beams (Manalo et al, 2012).
2.4.3 Structural Applications of the Sandwich Panels
Their usage is mainly in the aerospace, aircraft and marine industries because of their
fuel efficiency in transportation vehicles, but at present, there is a strong interest in the
development and applications of sandwich structures for civil and building material
systems(Manalo 2013). These materials are now commonly used as structural panel for
roofs, floors, walls, and bridge decks(Manalo et al, 2012).The fibre reinforced sandwich
panels are being investigated for their applications in the field of civil/structural
engineering.

11
Figure 2.4: Structural Applications of Sandwich Panels
Source: www.usq.edu.au/CEEFC
2.5. Behaviour of Sandwich Panels under Ambient Temperatures
Manalo (2013) studied the behaviour of structural fibre composite sandwich beams
made up of glass fibre composite skins and phenolic core material under three-point
short beam and asymmetrical beam shear tests. The study focussed on the effect of the
shear span-to-depth ratio (a/D) on the strength and failure behaviour of the composite
sandwich beams. The test results showed that with an increase in the a/D ratio, there
was a decrease in the failure load of the sandwich beam. Further it was found that, the
coupling effect of flexural stresses increased with an increasing a/D ratio. It was to be
noted that, the fibre composite sandwich beams tested under asymmetrical beam shear
test exhibited higher failure load in comparison with the beams tested under short beam
shear test. Numerical analysis showed that the shear stress in the core is more dominant
than flexural stress when the a/D ratio is 1for the sandwich beams under short beam test
and 1–3 for the sandwich beams tested under asymmetrical beams shear test.A suitable
prediction equation was developed based on the results obtained, which accounts for
thecombined effect of shear and flexural stresses due to the changing a/D ratio,

12
presented a good agreement with the experimental results, showing that it can
reasonably estimate the failure load of structural fibre composite sandwich beams.
Awad et al., (2011), studied the geometry effect on the behaviour of single and glue-
laminated glass fibre reinforced polymer composite sandwich beams loaded in four-
point bending. The purpose of this research was to investigate the behaviour of single
and glue laminated glass fibre reinforced polymer (GFRP) composite sandwich beams
considering different spans and beam cross sections. The composite sandwich beams
with different thicknesses 1, 2, 3, 4, and 5 sandwich layers were tested using the four-
point static flexural test with different shear span to depth ratio (a/D). From the
experimental results, it was found that the a/D ratios had a direct effect on the flexural
and shear behaviour of the sandwich beams. It was also found that the capacity of the
beam decreased with an increasing a/D ratio. Several failure modes such as the core
crushing, core shear, and top skin compression failure were observed during the testing
of the beams. The failure mode map which was developed based on the experimental
findings and the analytical prediction indicated that the failure mode is affected by the
a/D with the number of glue laminated panels.
Manalo et al., (2012) conducted a research on the Prediction of the Flexural Behaviour
of Fibre Composite Sandwich Beams. A simplified Fibre Model Analysis (FMA) to
describe the approximate behaviour and the governing failure mechanisms of composite
sandwich structures under flexural load was developed in this research. The
fundamental design methodology was based on several key parameters such as the
sectional equilibrium, strain compatibility, and the constitutive material behaviour
which employed the use of a layer-by-layer approach to evaluate the sectional forces
and for the calculation of the nominal flexural capacity of a composite sandwich
section. A major merit of the proposed model was found to be its accountability for the
nonlinear behaviour of the core in compression, the effect of core cracking in tension
and the linear elastic behaviour of the fibre composite skins. Through this method, the
analysis of the composite sandwich structures with non-symmetric sections could be
carried out. The efficiency and practical application of the developed prediction
equation was demonstrated by analysis of the behaviour of the individual and glue-
laminated composite sandwich beam structures made from the glass fibre composite
skins and phenolic core material and through the comparison of the results from the
numerical simulation with the results of experimental investigation. This method was

13
found to reasonably describe the behaviour of the fibre composite sandwich structures
in flexure.
Manalo et al., (2012), studied the geometry and restraint effects on the bending
behaviour of the glass fibre reinforced polymer sandwich slabs under point load. The
study investigated the flexural behaviour of a new generation composite sandwich
beams made up of glass fibre reinforced polymer skins and modified phenolic core
material. 4-point static bending test was used to determine their strength and failure
mechanisms in the composite sandwich beams in the flatwise and the edgewise
positions. The results of the experimental investigation revealed that the composite
sandwich beams tested in the edgewise position failed at a higher load with less
deflection compared to specimens tested in the flatwise position. Under flexural
loading, the composite sandwich beams in the edgewise position failed due to
progressive failure of the skin while failure in the flatwise position is in a brittle manner
due to either shear failure of the core or compressive failure of the skin followed by de-
bonding between the skin and the core. Analytical predictions and numerical
simulations were developed and compared with the experimental results. It was found
that the results of the analytical predictions and numerical simulations agreed with the
experimental results
Fam and Sharaf.,(2010), studied the Flexural performance of sandwich panels
comprising polyurethane core and GFRP skins and ribs of various configurations. The
feasibility of fabrication and flexural performance of panels composed of
lowdensitypolyurethane foam core sandwiched between two GFRP skins were studied.
From the study it was found that, through the integration of the ribs, strength and
stiffness of the panels increased, by 44–140%, depending on the configuration of the
ribs. The maximum gain in strength was equivalent to the effect of doubling the core
density in a panel without ribs. Shear deformation of the core contributed over 50% of
mid-span deflection in the panel without ribs. Through the addition of ribs, the flexure
became more dominant and shear deformations of the ribs contributed only 15–20% of
the total deflection.

14
2.6. Effect of Elevated Temperature on Composites
Yu Bai and Thomas Kellar., (2011) investigated the delamination and kink band
failure of pultruded GFRP laminates under elevated temperature and compression.
Pultruded glass fibre composite laminates of width 48 mm, thickness 12 mm and 500
mm length were mechanical properties. The glass transition temperature was
determined by the dynamic mechanical analysis and the decomposition temperature was
determined by themogravimetric analysis. The specimens were tested for their axial
compression under elevated temperature range of 20°C and 220°C at an interval of
40°C. The DMA test revealed that the storage modulus decreased with increasing
temperatures and the leathery state was reached at 220°C. At lower temperature range
the load displacement curves revealed a clear bifurcation of the maximum and the post-
buckling load but as the temperature increased this bifurcation was less obvious and
disappeared beyond 180°C. At temperature below 180°C the delamination caused by
the second-order bending of the slender specimen was observed which was absent in
case of the specimens tested at temperatures above 180°C.’
Alsayed et al., (2012) investigated the performance of glass reinforced polymer bars at
elevated temperatures. E-glass/vinyl ester specimens of 12 mm diameter were used for
the study. The specimens were divided into two sets with one set of the specimen
covered in 40 mm concrete. All the specimens were exposed to the temperatures 100°C,
200°C and 300°C for a period of 1, 2 and 3 hours and tested for their mechanical
properties. Physical examination of the bars after the temperature exposure revealed
distinct dis-colouration which was observed for the temperatures 200 and 300°C. The
stress strain relationship was similar for all the specimens and the failure mode was
brittle in nature. The test revealed that the losses in tensile strength at elevated
temperatures were 3.1-35.1 % for concrete covered GRFP bars and 4.7-41.9 % for the
bare GRPF bars.’
Wong et al., (2004) ‘Studied the behaviour of pultruded GFRP short columns under
elevated temperature. The specimen under study was 100 x 30x 4 mm E-glass/ polyester
columns tested for their compressive strengths at 20, 60, 90, 120, 150, 200 and 250°C.
Two sets of specimens of lengths 30 mm and 400 mm were tested. The experimental
tests of the 30mm specimen revealed that at lower temperature of 20, 60 and 90°C the
specimens failed along the mid-length in a brittle manner and at elevated temperature
greater than 90°C the specimen failure was due to the resin softening phenomenon.

15
Distinct discolouration was observed at a temperature of 250°C. The results of the
column test conducted on the 400 mm specimen revealed that the column strengths of
the 60 and 90 °C specimens were reduced by about 65% of the ambient temperature
results and the specimens tested at 120°C and above revealed a quarter of the strength of
that under ambient temperatures. The failure mode at lower and elevated temperatures
was characterized by local buckling deformation.’
Gibson et al., (2010) ‘Studied the high temperature and fire behaviour of the glass
fibre/polypropylene laminates. Samples of width 20 mm and span 150 mm were tested
for their mechanical properties under three point bending and the flexural moduli was
measured in terms of creep applying dead loads to the centre of the samples at 1, 10,
100, 1000’s. From the experimental study it was found that the flexural modulus from
room temperature just before of melting point varies linearly. The compressive strength
of the specimens was substantially lower than their tensile strengths. The tensile stress-
strain curves were found to be non-linear which is attributed to the resin-
fibredebondingcombined with resin creep and fibre misalignment. It was found that the
properties of glass/pp composites decline gradually with temperature unlike the
thermoset polymers and the glass transition temperature influenced its behaviour from
20°C to 250°C.’
Lauobi et al., (2014) ‘Studied the thermal behaviour of E glass fibre reinforced
unsaturated polyester composites. The test materials under study are polyester resin and
glass/polyester composites. The specimens were heated at a temperature of 100°C,
200°C and 280°c for 1 hour and were cooled under ambient temperatures before the
commencement of the testing. The results of the themogravimetric analysis of the resin
revealed that the decomposition of the resin takes place at two temperatures namely
130°C and 400°C. In case of the composite the decomposition was just below 180°C.
The glass transition temperature for the resin was found to be 64.20°C and 81.66°C for
the composites. The mechanical properties of the resin and the composite were tested
using the tensile and the three point bending tests. The physical examination of the
specimens after the thermal exposure reveal no apparent change in their appearance
until 100°C however, on exposure to 200°C they undergo degradation at the fibre-
matrix interface and apparent de-lamination at 280°C. The stress-strain curve obtained
for the tensile tests reveal that the curve is linear at the beginning and non-linear at the
end but for 280°C which tends to follow a brittle behaviour. It was found that above
200°C the resin was more vulnerable than the composite. The three point bending test

16
revealed that the tensile strength slightly increases before 100°C and decreases
thereafter. The modulus of elasticity increases strongly at 100 °C and 200°C and
decreases thereafter. The displacement of the specimen gradually decreases with the
increase in the temperature.’
2.7. Effect of Elevated Temperature on Sandwich Panels
Liu et al,.(2011) ‘Investigated the temperature effects on the strength and crushing
behaviour of carbon fibre composite truss sandwich cores. In this project the sandwich
panels under study were made from carbon/epoxy prepreg face sheets and unidirectional
carbon rods were used for the truss cores. The specimens of composite rods were tested
for their mechanical strengths at cryogenic and elevated temperatures in the following
temperature range: -60°C, -30°C, -10°C, 20°C, 50°C, 80°C, 110°C, 140°C, 160°C,
200°C, and 260°C. The specimens of sandwich panels were tested at -60°C, 20°C,
70°C, 100°C, 140°C, and 160°C. The results from the experimental test revealed that at
elevated temperatures the strength and the stiffness of the sandwich panels decreased
which is attributed to the softening of the polymer matrix. Delamination failure was
observed throughout the operating temperature range, while the failure above the glass
transition temperature was characterised by the plastic kinking of the truss members.’
Liu et al, (2013) ‘Investigated the mechanical behaviour and failure mechanisms of
carbon fibre composite sandwich panel after thermal exposure. The sandwich panel
specimens were made from carbon/epoxy prepreg by molding hot-press method. The
composite sandwich panels were tested for their mechanical properties on exposure to
temperatures of 20, 100, 150, 200, 250, 300°C for 6 hours. The thermogravimetric
analysis revealed that the epoxy resin matrix decomposed in two stages namely the first
stage of rapid degradation from 250°C until a pseudo-plateau and the second stage
leading to the complete degradation. A distinct decolouration of the sandwich panels
were observed on exposure to temperatures beyond 150°C. It was observed that the
carbon sandwich panels failed due to core shear buckling and node rupture for the
specimens exposed from 100 - 200°C and face sheet crushing was observed for the
specimens exposed to 250 and 300°C which may be attributed to the severe heat
damage caused to the face sheet during the thermal exposure of the specimens.

17
2.8. Research Gaps from Previous Works
On reviewing the current literature it is found that the research on the sandwich panels
at elevated temperature is limited to the carbon fibre composite with a truss core (Liu et
al,. 2011). It is also found that the sandwich panels are tested only for the compression
at higher temperature range and no significant information is found to explain the
flexural behaviour of the glass fibre composites. Therefore, it is identified that there
exists a research gap in current knowledge which explains the flexural behaviour of
glass fibre reinforced sandwich panels under elevated temperature.
Thus the flexural behaviour of the sandwich panels at elevated temperature under three
point static bending is investigated in this research in order to fill the gap in the
literature. Further an empirical equation describing the behaviour of the sandwich
panels under elevated temperature is also proposed in this study. The methodology,
results and the observations from the testing of the panels are discussed in the following
sections. It is believed that this research will increase the application of the sandwich
panels as structural elements in the field of civil engineering.
2.9. Summary
The history of composites, their constituent materials and the types of the constituent
materials of a composite were briefly studied in this chapter. The limitations of the
composite materials were also briefly highlighted. Further, a brief background on the
sandwich panels and its constituent materials and their structural applications were
provided following which the past literature on the sandwich panels under ambient
temperature, composites under elevated temperature and sandwich panels under
elevated temperature was reviewed. Finally, the gaps from the previous works were
discussed thereby justifying the need for this research.

18
Chapter 3 – Project Methodology
3.1. Introduction
This chapter outlines the experimental methodology adopted in this project. The
materials used for the testing are discussed briefly in this chapter. The testing specimens
and the equipment used for the purpose of testing the specimens are also discussed and
outlined in this chapter. Finally the experimental set-up and the testing procedure
adopted are discussed in detail in this chapter.
3.2. Materials
The composite sandwich panel used in this study is made up of glass fibre composite
skins co-cured onto the modified phenolic core material using a toughened phenol
formaldehyde resin. The top and the bottom skins of the sandwich panels is made up of
2 plies of stitched bi-axial (0/90) E-CR glass fabrics with a chopped strand mat and a
toughened phenol formaldehyde resin is used as the laminate matrix. The skin has a
fibre fraction of 45% by weight and an average density of 1365 kg/m3. The phenolic
core material is a proprietary formulation by LOC Composites Pty Ltd, Australia. This
material comes from natural plant products derived from vegetable oils and plant
extracts and chemically bonded within the polymer resin. It has an average density of
855 kg/m3. Further information on the core is unavailable due to the commercial nature
of the product.

19
Figure 3.1: Carbon LOC® Panels
3.3. Test Specimen
The skin and the sandwich panels were tested for their flexure under three point static
bending test. The sandwich panels are 50 mm wide and 220 mm in length. The
thickness of the core is measured to be 10 mm. The Table 3.1 gives a detailed
description about the test specimens.
Specimen
type
Illustration No. of
specimens
Thickness,
t (mm)
Width,
b (mm)
Total
length,
LT
(mm)
Support
span, L
(mm)
Sandwich
beam
60 Actual 50 220 180
Skin only
60 actual 50 220 120
Table 3.1: Test Specimen Dimensions
t
b
t
b

20
The skin and the core materials were subjected to dynamic mechanical analysis in order
to determine their material properties. The details of the specimens used are given in the
Table 2.
Specimen Type Thickness, t (mm) Width, b (mm)
Skin 5 10
Core 5 10
Table 3.2: Dimensions of DMA samples
3.4. Specimen Preparation
The test specimens were made to order from the CarbonLOC Pvt Ltd, Australia. The
specimens were manufactured at the manufacturing facility in USQ, Toowoomba.
3.5. Experimental Procedure
3.5.1. Dynamic Mechanical Analysis (DMA)
The DMA test is a thermo-mechanical test which is performed to identify and measure
the visco-elastic properties of the constituent materials. The test was carried out
according to ASTM D 4065-2001 testing standards. The responses of the material as it
is subjected to the periodical forces are called as the Dynamic Mechanical Properties of
the material. The DMA applies an oscillating force in the form of stress and records the
oscillating responses of the sample. The modulus of the specimen tested is calculated
from the elastic responses and the damping is calculated from the viscous responses.
The mechanical properties are displayed in the form of sinusoidal oscillations as a
function of time and temperature. The green curve of the resulting graph represents the
storage modulus (E’) and the blue curve represents the tan delta. According to the
ASTM D 4065-2001 specifications the maximum of the curve representing the Tan
delta (Tan delta) represents the glass transition temperature. The glass transition
temperature (Tg) of the material is defined which helps in predicting the behaviour of
the materials when subjected to both mechanical and thermal stresses.

21
A specimen of 35 x 10 x 5 mm^3 is placed in the equipment and a small deformation is
applied to the specimen in a cyclic manner. Through this test the response of the
specimen to various parameters such as the temperature, stresses and the modulus are
studied.
Figure 3.2: DMA Testing Equipment
Figure 3.3: DMA Test Set-Up
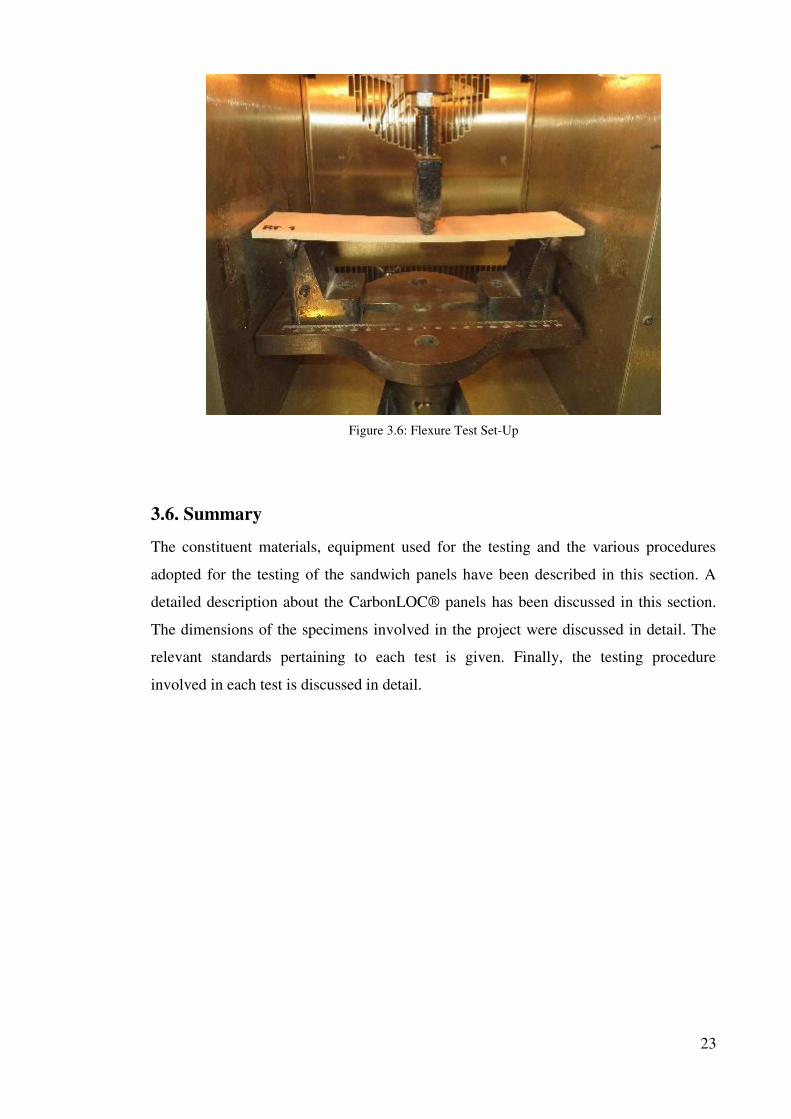
3.5.2. Flexure Test
In order to analyse the mechanical behaviour of the sandwich panels under elevated
temperature the skin and the sandwich panels were subjected to flexure test by three
point static bending tests (Figure 6) at elevated temperature under nine different
temperature ranges from 21°C to 180°C namely 21°C, 35°C, 50°C, 65°C, 80°C, 100°C,
120°C, 150°C, 180°C. A test specimen of 220 x 50 x 20 mm^3 is simply supported on

22
two ends and the load is applied at the mid-point through a 100KN servo-hydraulic
loading machine. The effects of temperature are applied through an environmental
chamber. The maximum temperature capacity of the chamber is 350°C. The specimens
were separated by a span of 180 mm for the sandwich panels and 120 mm for the skin
panels. The rate of loading was 5 mm/min. A set of 5 specimens were tested for each
temperature range.
Figure 3.4: Schematic Diagram of Three Point Bending Test
Figure 3.5: Flexure Test Equipment
0.5L 0.5L
L
P
LT
23
Figure 3.6: Flexure Test Set-Up
3.6. Summary
The constituent materials, equipment used for the testing and the various procedures
adopted for the testing of the sandwich panels have been described in this section. A
detailed description about the CarbonLOC® panels has been discussed in this section.
The dimensions of the specimens involved in the project were discussed in detail. The
relevant standards pertaining to each test is given. Finally, the testing procedure
involved in each test is discussed in detail.
24
Chapter 4 - Results and Observation
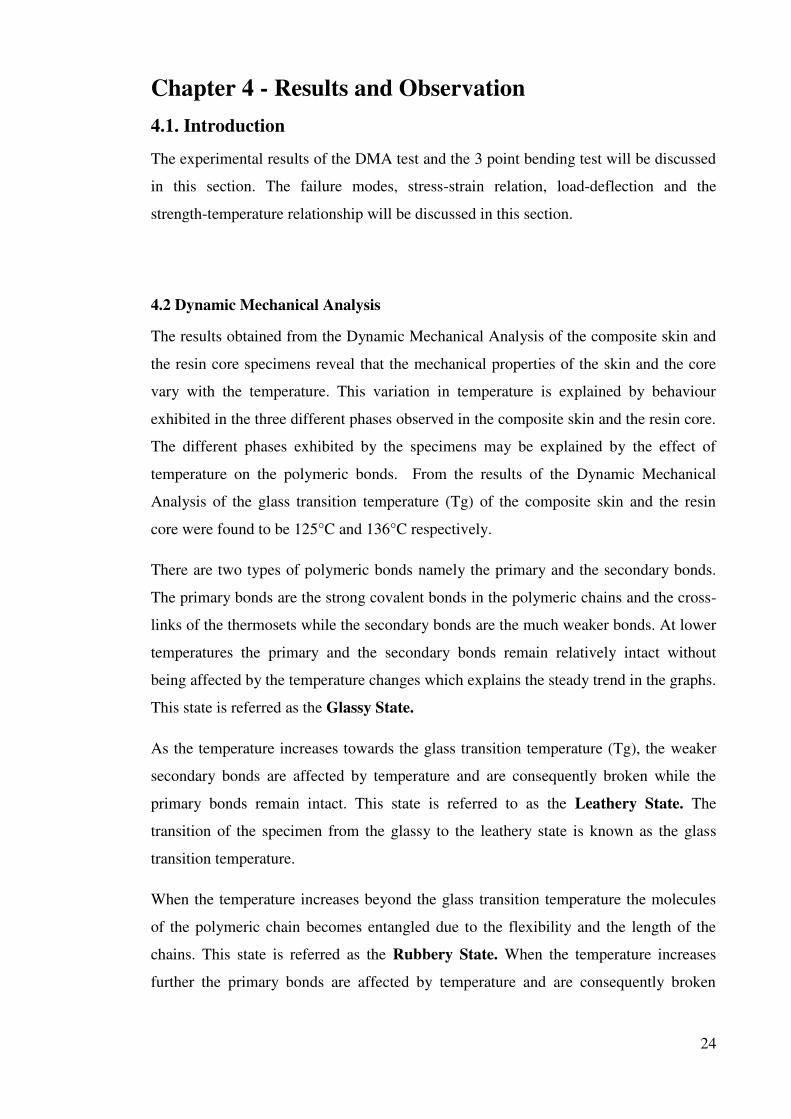
4.1. Introduction
The experimental results of the DMA test and the 3 point bending test will be discussed
in this section. The failure modes, stress-strain relation, load-deflection and the
strength-temperature relationship will be discussed in this section.
4.2 Dynamic Mechanical Analysis
The results obtained from the Dynamic Mechanical Analysis of the composite skin and
the resin core specimens reveal that the mechanical properties of the skin and the core
vary with the temperature. This variation in temperature is explained by behaviour
exhibited in the three different phases observed in the composite skin and the resin core.
The different phases exhibited by the specimens may be explained by the effect of
temperature on the polymeric bonds. From the results of the Dynamic Mechanical
Analysis of the glass transition temperature (Tg) of the composite skin and the resin
core were found to be 125°C and 136°C respectively.
There are two types of polymeric bonds namely the primary and the secondary bonds.
The primary bonds are the strong covalent bonds in the polymeric chains and the cross-
links of the thermosets while the secondary bonds are the much weaker bonds. At lower
temperatures the primary and the secondary bonds remain relatively intact without
being affected by the temperature changes which explains the steady trend in the graphs.
This state is referred as the Glassy State.
As the temperature increases towards the glass transition temperature (Tg), the weaker
secondary bonds are affected by temperature and are consequently broken while the
primary bonds remain intact. This state is referred to as the Leathery State. The
transition of the specimen from the glassy to the leathery state is known as the glass
transition temperature.
When the temperature increases beyond the glass transition temperature the molecules
of the polymeric chain becomes entangled due to the flexibility and the length of the
chains. This state is referred as the Rubbery State. When the temperature increases
further the primary bonds are affected by temperature and are consequently broken

25
resulting in the decomposition of the material. This state is referred as the
Decomposition State.
4.2.1 Skin
Figure 4.1 DMA result of the skin
The figure 4.1 shows the results of the DMA test on the skin. The figure shows two
curves representing the storage and the Tan delta. The green curve represents the
storage modulus (E’) and the blue curve represents the tan delta. As stated in the section
3.5.1 of the chapter 3, the dynamic mechanical analysis is conducted according to the
ASTM D 4065-2001 specifications and the maximum of the Tan delta curve represents
the glass transition temperature of the specimen. Hence, the glass transition temperature
of the skin specimen is found to be around 125.06°C.

26
From the figure 4.1, it can be observed that the mechanical properties of the composite
skin vary with the temperature. The variation of the mechanical properties of the skin
specimen can be explained by three phases namely:
Phase 1: This is the phase exists below 80°C (T < 80°C). In this phase, a slow decrease
in the storage modulus (E’) and a slow increase in the Tan delta are observed.
Phase 2: This phase exists between 80°C ant the glass transition temperature, Tg (80°C
< T < 125.06°C). There is a rapid decrease in the storage modulus (E’) and the curve
reaches its minimum at the glass transition temperature. Similarly the Tan delta
increases rapidly with the curve reaching its maximum value at the glass transition
temperature.
Phase 3: The last phase exists beyond the glass transition temperature (T > 125.06°C).
During this phase the storage modulus (E’) begins to increase rapidly and the Tan delta
begins to drop rapidly. The trend of the curve during this increase and the decrease is
found to be similar to that during the steep decrease and increase of the storage modulus
and Tan delta as explained in the previous phase.

27
4.2.2 Core
Figure 4.2 DMA results of the core
The figure 4.2 shows the results of the dynamic mechanical analysis of the core
specimens. As stated in the previous section the maximum of the tan delta curve
represents the glass transition temperature of the specimen, hence the glass transition
temperature is found to be 136.11°C from the above graph. The changes in the
mechanical properties of the resin core with the temperature are also seen from the
graph. The changes in the mechanical properties of the resin core can be explained in
detail by three phases namely:
Phase 1: This phase explains the behaviour of the resin core below 80°C (T < 80°C). It
is found that the resin core behaves in a manner similar to the composite in this phase.
The storage modulus (E’) of the resin core exhibits a slow decrease in its values with
temperature while Tan delta exhibits a slow increase in its values.
Phase 2: This phase explains the behaviour of the resin core beyond 80°C and below
the glass transition temperature of the resin core which is 136.11°C (80°C < T

28
<136.11°C). During this phase too the resin core behaves in a manner similar to the
composite skin where the Storage modulus of the core (E’) decreases rapidly with
temperature and the Tan delta shows a rapid increase in its values. At the glass
transition temperature, the storage modulus reaches its minimum while the Tan delta
reaches its maximum value.
Phase 3: This phase explains the variation of the mechanical properties of the resin core
beyond the glass transition temperature (T > 136.11°C). Unlike the composite skin the
behaviour of the resin core beyond the glass transition temperature follows a different
pattern. From the tan delta curve of the graph, it can be observed that the resin core
exhibits an irregular pattern which may be attributed to the decomposition of the resin
core beyond the glass transition temperature.
4.3. Behaviour of the Skin
4.3.1 Load Deflection Relation
Figure 4.3 Load – Deflection diagram for the skin at 21°C
Results from the load-deflection relation for the specimens tested at 21° reveal that the
skin exhibits a linear fashion with the peak load ranging between3000-3500 N,
0
500
1000
1500
2000
2500
3000
3500
4000
0 5 10 15 20 25
Loa
d N
Deflection mm
29
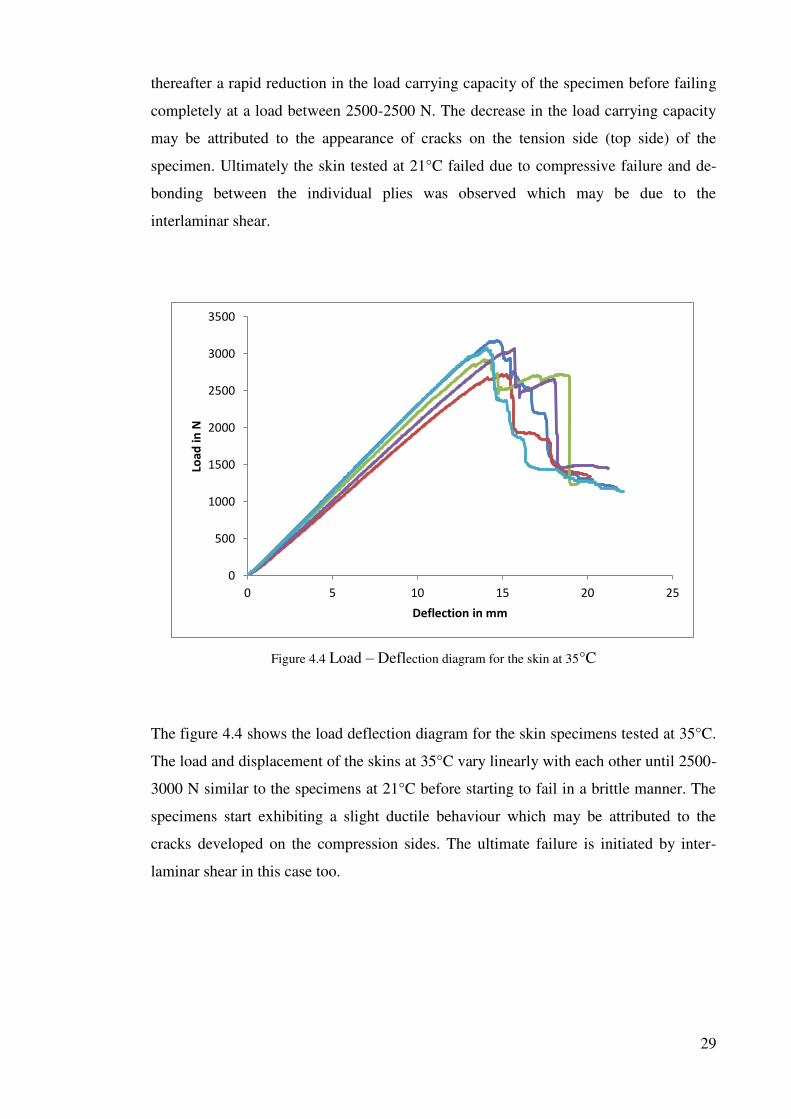
thereafter a rapid reduction in the load carrying capacity of the specimen before failing
completely at a load between 2500-2500 N. The decrease in the load carrying capacity
may be attributed to the appearance of cracks on the tension side (top side) of the
specimen. Ultimately the skin tested at 21°C failed due to compressive failure and de-
bonding between the individual plies was observed which may be due to the
interlaminar shear.
Figure 4.4 Load – Deflection diagram for the skin at 35°C
The figure 4.4 shows the load deflection diagram for the skin specimens tested at 35°C.
The load and displacement of the skins at 35°C vary linearly with each other until 2500-
3000 N similar to the specimens at 21°C before starting to fail in a brittle manner. The
specimens start exhibiting a slight ductile behaviour which may be attributed to the
cracks developed on the compression sides. The ultimate failure is initiated by inter-
laminar shear in this case too.
0
500
1000
1500
2000
2500
3000
3500
0 5 10 15 20 25
Loa
d i
n N
Deflection in mm

30
Figure 4.5 Load – Deflection diagram for the skin at 50°C
The figure 4.5 shows the load deflection relation for the skin specimens tested at 50°C.
The load and deflection curve for the specimens tested at 50°C varies linealy with each
other and the peak load varies between 2000-2500 N. It may be observed that the failure
tends to follow a plastic mode just before the brittle failure. This phenomenon may be
attributed to the softening of the resin matrix. The resin softening is characterized by the
indentations found at the point of loading. The decrease in the peak load capacities may
be attributed to the cracks developed on the tension and compression side of the
specimen. However, interlaminar shear dominates the ultimate failure.
0
500
1000
1500
2000
2500
3000
0 5 10 15 20 25
Loa
d N
Deflection mm
31
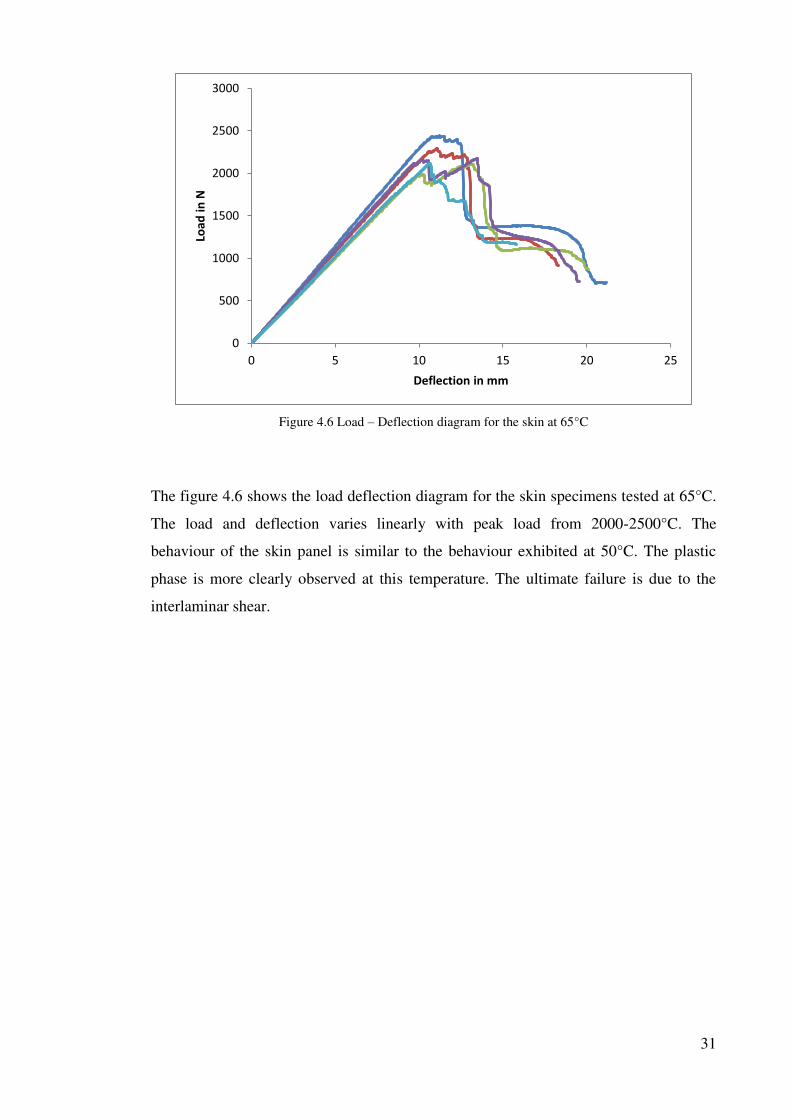
Figure 4.6 Load – Deflection diagram for the skin at 65°C
The figure 4.6 shows the load deflection diagram for the skin specimens tested at 65°C.
The load and deflection varies linearly with peak load from 2000-2500°C. The
behaviour of the skin panel is similar to the behaviour exhibited at 50°C. The plastic
phase is more clearly observed at this temperature. The ultimate failure is due to the
interlaminar shear.
0
500
1000
1500
2000
2500
3000
0 5 10 15 20 25
Loa
d i
n N
Deflection in mm

32
Figure 4.7 Load – Deflection diagram for the skin at 80°C
The figure 4.7 shows the load displacement diagram for the skin specimens tested at
80°C. The load displacement relation varies linearly until the peak load capacities
ranging between 1500-2000°C.There is clear indication of the resin softening
characterized by indentations. The peak deflections are between 5-10 mm.Interlaminar
shear dominates the failure.
0
500
1000
1500
2000
2500
0 5 10 15 20 25
Loa
d N
Deflection mm

33
Figure 4.8 Load – Deflection diagram for the skin at 100°C
The figure 4.8 shows the load-deflection relation for the skin specimens tested at 100°C.
The load deflection relation varies linearly and the failure tends to follow a more plastic
trend after the peak load range of 1400-1600 N. The specimens tested at 100°C reveal a
phenomenon of resin embrittlement.. However, interlaminar shear dominates the
ultimate failure.
0
200
400
600
800
1000
1200
1400
1600
1800
0 2 4 6 8 10 12 14
Loa
d N
Deflection mm

34
Figure 4.9 Load – Deflection diagram for the skin at 120°C
The figure 4.9 shows the load deflection relation for the skin specimens tested at 120°C.
The load deflection path is linear until the failure of the specimen and the failure is no
longer brittle as the failure takes place completely by a plastic mode. The peak load
carrying capacity also decreases to between 800-1400°C. Due to the effect of the
temperature the resin tends to soften initially characterized by strong indentations at the
loading point and leads to the decrease in the load carrying capacity of the specimen.
However as the test progresses the resin tends to turn brittle. The ultimate failure takes
place by cracks on the compression side due to interlaminar shear.
0
200
400
600
800
1000
1200
1400
1600
1800
0 5 10 15 20 25
Loa
d N
Deflection mm

35
Figure 4.10 Load – Deflection diagram for the skin at 150°C
The figure 4.10 shows the load-displacement diagram for the skin specimens tested at
150°C. The load and displacement varies linearly before the plastic failure of the
specimen. There is a slight increase in the peak load carrying capacities of the
specimens 1000 N to just above 1200 N, which is due to the phenomenon of resin
turning brittle characterized by the surface cracking at the loading point. Although the
failure is initiated due to the cracks on the compression side of the specimen the brittle
resin takes little higher load before failing completely due to interlaminar shear. It can
be observed that the phenomenon of resin softening attributes to the plastic failure in
this case also.
0
200
400
600
800
1000
1200
1400
0 2 4 6 8 10 12 14 16
Loa
d N
Deflection mm
36
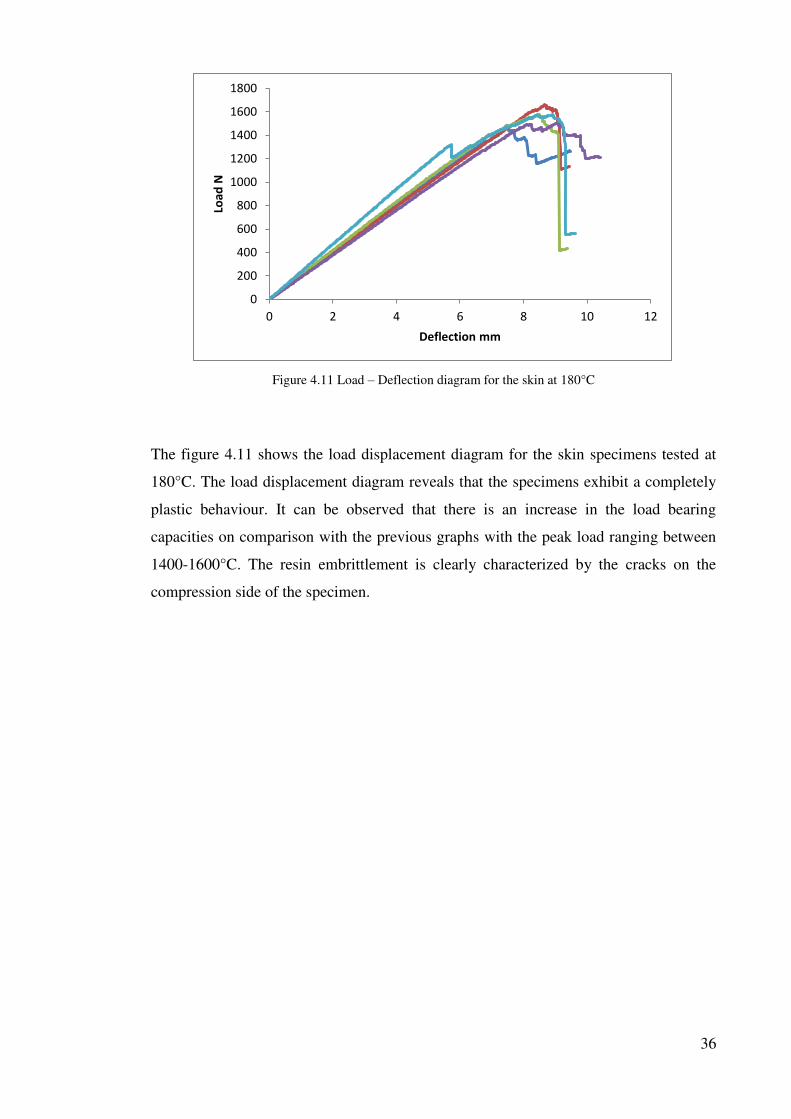
Figure 4.11 Load – Deflection diagram for the skin at 180°C
The figure 4.11 shows the load displacement diagram for the skin specimens tested at
180°C. The load displacement diagram reveals that the specimens exhibit a completely
plastic behaviour. It can be observed that there is an increase in the load bearing
capacities on comparison with the previous graphs with the peak load ranging between
1400-1600°C. The resin embrittlement is clearly characterized by the cracks on the
compression side of the specimen.
0
200
400
600
800
1000
1200
1400
1600
1800
0 2 4 6 8 10 12
Loa
d N
Deflection mm

37
4.4. Failure Modes of the Skin
The composite skins tested under three point static bending were studied for their
characteristic failure modes under each temperature range. On observing the specimens
after the tests it was found that the specimens failed by exhibiting different failure
modes under each temperature.
4.4.1. Failure Mode at 21°C
Figure 4.12 Failure of the specimen at 21°C

38
Figure 4.13 Cracks on the compression side of the specimen at 21°C
The figure 4.12 and 4.13 shows the failure mode at room temperature (21°C). From the
figure it can be found that the specimen at room temperature fails in a brittle manner as
discussed in the chapter 4. The failure of the specimen is dominated by interlaminar
shear. The skin specimen brittle failure of the skin specimen is initiated by the cracks on
the compression side (Top side) of the specimen as indicated in the above figure.

39
4.4.2 Failure Mode at 35°C
Figure 4.14 Failure of the specimen at 35°C
Figure 4.15 Cracks on the tension side of the skin at 35°C

40
The skin specimens tested at 35°C failed in a brittle manner by developing cracks on
both the compression and the tension sides of the specimen. The figures 4.14 and 4.15
shows the failure modes of the specimen tested at 35°C. The ultimate failure of the
specimen was governed by the interlaminar shear.
4.4.3 Failure Modes at 50°C, 65°C and 80°C.
Figure 4.16 Failure of the Specimen at 50°C
Figure 4.17 Compression and tension cracks on the specimen at 50°C

41
Figure 4.18 Failure of the specimen at 65°C
Figure 4.19 Compression and Tension cracks on the specimen at 65°C

42
Figure 4.20 Failure of the specimen at 80°C
Figure 4.21 Compression and Tension cracks on the specimen at 80°C
The specimens tested under 50°C, 65°C and 80°C fails in similar manner with
variations in their peak strength and Young’s modulus values. The specimens tested
under this temperature range fail in a brittle manner with the ultimate failure dominated
by interlaminar shear. However, all the specimens tested at this temperature range fail
by exhibiting a plastic phase just before the brittle failure which was observed in the
load-displacement diagrams of the specimens. The plastic phase observed during the
failure of the specimens is attributed to the phenomenon of the softening of resin as a
result of exposure to temperature which was observed during the DMA test conducted

43
on the composite skin and the resin core. The phenomenon of the softening of the resin
is observed in the form of indentations observed on the top surface of the skin
specimens at the point of loading as shown in the above figures.
4.4.4 Failure modes at 100°C and 120°C
Figure 4.22 Failure of the specimen at 100°C
Figure 4.23 Compression and tension cracks on the specimen at 100°C
44
Figure 4.24 Failure of the specimen at 120°C
Figure 4.25 Compression and Tension cracks on the specimen at 120°C
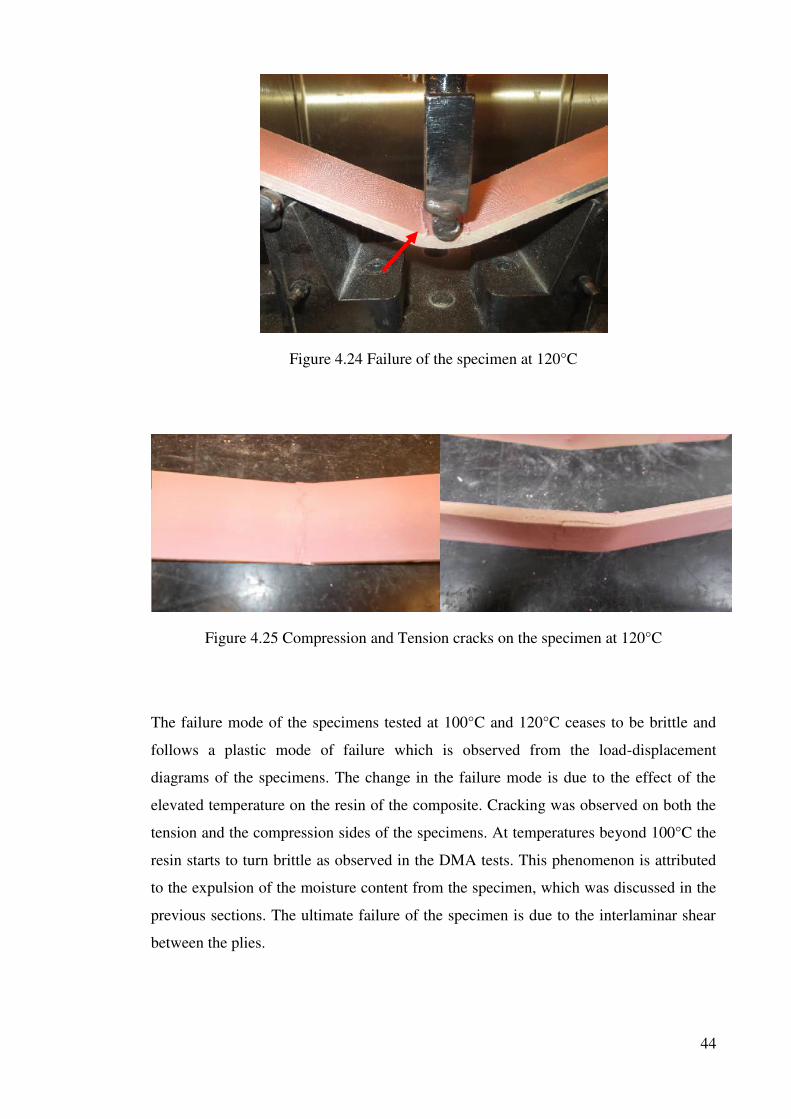
The failure mode of the specimens tested at 100°C and 120°C ceases to be brittle and
follows a plastic mode of failure which is observed from the load-displacement
diagrams of the specimens. The change in the failure mode is due to the effect of the
elevated temperature on the resin of the composite. Cracking was observed on both the
tension and the compression sides of the specimens. At temperatures beyond 100°C the
resin starts to turn brittle as observed in the DMA tests. This phenomenon is attributed
to the expulsion of the moisture content from the specimen, which was discussed in the
previous sections. The ultimate failure of the specimen is due to the interlaminar shear
between the plies.

45
4.4.5 Failure modes at 150°C and 180°C
Figure 4.26 Compression cracks on the specimen at 150°C
Figure 4.27 Failure of the specimen at 180°C

46
Figure 4.28 Failure on the compression side of the specimen at 180°C
The specimens tested at 150°C and 180°C failed in plastic manner as observed from the
load-deflection diagrams of the specimens. The plastic failure is due to the phenomenon
of softening of the resin as observed in the previous cases. As discussed earlier, the
resin turns brittle beyond the glass transition due to the removal of the moisture content
from the resin. The phenomenon of resin softening was observed in the form of
indentations at the point of loading and the phenomenon of the resin turning brittle was
observed in the form of wrinkling of the top layer of the skin as shown in the figure
4.28. It was also observed that the cracking occurs only on the compression side of the
specimen unlike the previous cases and the ultimate failure occurs due to interlaminar
shear as observed in the previous failures.
47
4.5 Behaviour of the Sandwich Panel
4.5.1 Load-Deflection Relation
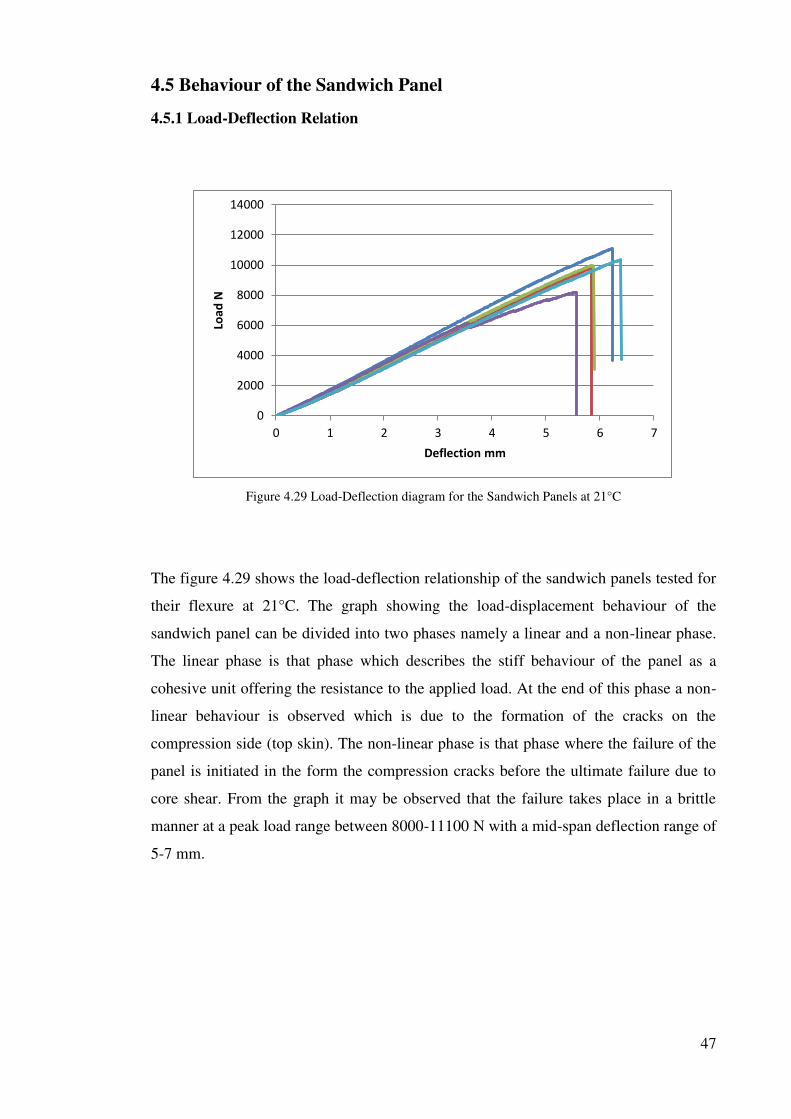
Figure 4.29 Load-Deflection diagram for the Sandwich Panels at 21°C
The figure 4.29 shows the load-deflection relationship of the sandwich panels tested for
their flexure at 21°C. The graph showing the load-displacement behaviour of the
sandwich panel can be divided into two phases namely a linear and a non-linear phase.
The linear phase is that phase which describes the stiff behaviour of the panel as a
cohesive unit offering the resistance to the applied load. At the end of this phase a non-
linear behaviour is observed which is due to the formation of the cracks on the
compression side (top skin). The non-linear phase is that phase where the failure of the
panel is initiated in the form the compression cracks before the ultimate failure due to
core shear. From the graph it may be observed that the failure takes place in a brittle
manner at a peak load range between 8000-11100 N with a mid-span deflection range of
5-7 mm.
0
2000
4000
6000
8000
10000
12000
14000
0 1 2 3 4 5 6 7
Loa
d N
Deflection mm
48
Figure 4.30 Load-Deflection diagram for the Sandwich Panels at 35°C
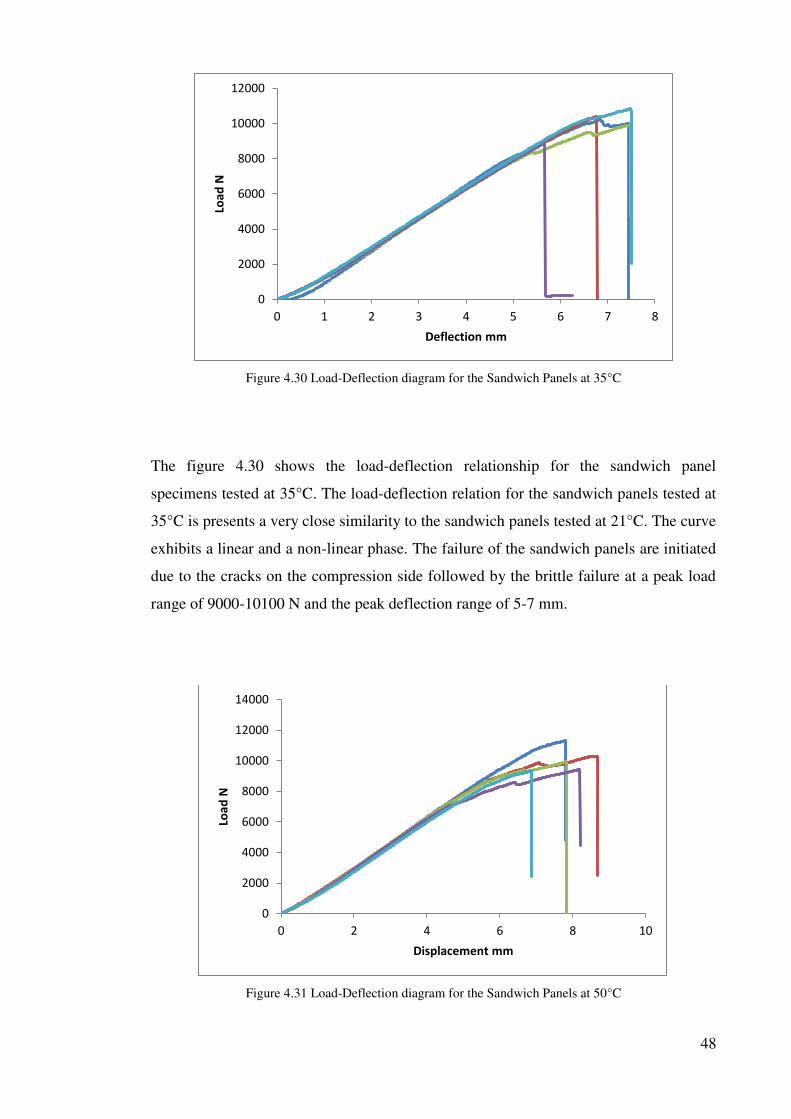
The figure 4.30 shows the load-deflection relationship for the sandwich panel
specimens tested at 35°C. The load-deflection relation for the sandwich panels tested at
35°C is presents a very close similarity to the sandwich panels tested at 21°C. The curve
exhibits a linear and a non-linear phase. The failure of the sandwich panels are initiated
due to the cracks on the compression side followed by the brittle failure at a peak load
range of 9000-10100 N and the peak deflection range of 5-7 mm.
Figure 4.31 Load-Deflection diagram for the Sandwich Panels at 50°C
0
2000
4000
6000
8000
10000
12000
0 1 2 3 4 5 6 7 8
Loa
d N
Deflection mm
0
2000
4000
6000
8000
10000
12000
14000
0 2 4 6 8 10
Loa
d N
Displacement mm

49
The figure 4.31 shows the load-deflection relationship for the sandwich panel
specimens tested at 50°C. The graph representing the load- deflection relationship of the
sandwich panels may be divided into three phases namely a linear phase, plastic phase
and failure phase. The linear phase represents the stiffness of the sandwich panel against
the applied load. In contrast to the previous case where the linear phase is followed by a
non-linear phase leading to failure of the specimen, the linear phase in this case is
followed by a small plastic phase due to the effect of the temperature. This plastic phase
is characterized by very minor indentations formed in the core region of the specimen.
The plastic phase is followed immediately by the brittle failure of the specimen at a
peak load range of 9400-11300 N and peak mid-span deflection range of 6-9mm. The
ultimate failure is caused due to the interlaminar shear forces developed in the core.
Figure 4.32 Load-Deflection diagram for the Sandwich Panels at 65°C
The figure 4.32 shows the load-deflection relationship for the sandwich panel
specimens tested at 65°C. The load - deflection relationship curve is similar to the
previous curve with three major phases. It may be observed that the curve possess the
initial linear phase followed by the plastic phase which is more clearly identified in the
graph followed by another linear phase before the final brittle failure of the specimen.
The peak load range is 8500-10000 N with mid-span deflection range of 7-8.5 mm. The
plastic phase exhibited is characterized by the indentations on the core before the brittle
0
2000
4000
6000
8000
10000
12000
0 2 4 6 8 10
Loa
d N
Displacement mm

50
failure. The ultimate failure of the specimen is brought about by the interlaminar shear
forces developed in the core.
Figure 4.33 Load-Displacement diagram for the Sandwich Panels at 80°C
The figure 4.33 shows the load – displacement relationship for the sandwich panel
specimens tested at 80°C. The load – displacement curve can be divided into three
phases namely the linear, plastic and failure phase. The curve begins with initial linear
phase followed by the plastic phase. Unlike the previous case, the plastic phase is
followed immediately by the brittle failure of the specimen with a peak load range of
7750 – 9200 N and mid-span deflection range of 8.7 – 11.50 mm. The effect of
temperature is characterised by the indentations formed in the core before the failure
and in the skin at the point of loading. However the ultimate failure is characterised by
the interlaminar shear developed in the core of the specimen.
0
2000
4000
6000
8000
10000
12000
0 2 4 6 8 10 12 14
Loa
d N
Displacement mm

51
Figure 4.34 Load-Deflection diagram for the Sandwich Panels at 100°C
The figure 4.34 shows the load – displacement relationship for the sandwich panel
specimens tested at 100°C. The curve representing the load – displacement may be
divided into two phases namely the linear phase followed by the plastic phase. It may be
observed that the failure of the specimen ceases to be brittle in nature and tends to
follow a plastic mode of failure. This change in the failure mode followed may be
attributed to the phenomenon of core softening which is characterized by the appearance
of major indentations on the core and the indentations formed on the skin directly below
the point of loading. The failure takes place at a peak load range of 5300 – 6500 N and
the mid-span deflection range of 10 – 14 mm. The ultimate failure of the specimen takes
place due to the interlaminar shear forces developed in the core.
0
1000
2000
3000
4000
5000
6000
7000
0 5 10 15 20
Loa
d N
Displacement mm
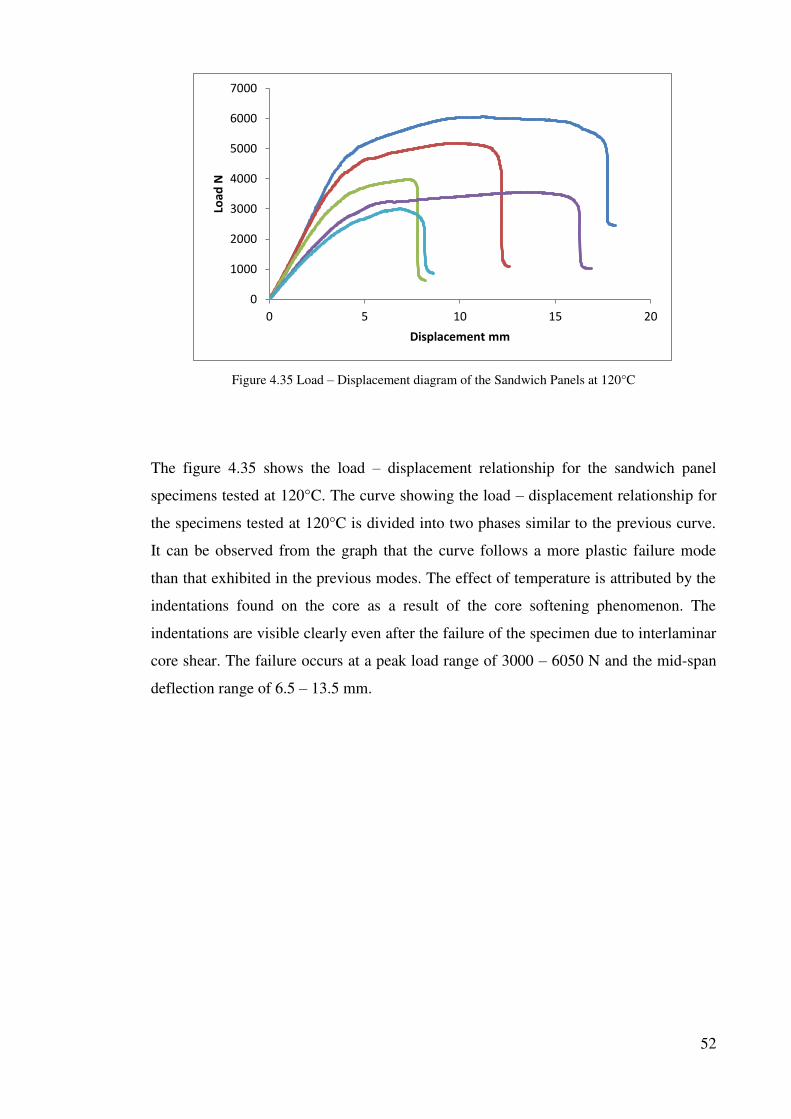
52
Figure 4.35 Load – Displacement diagram of the Sandwich Panels at 120°C
The figure 4.35 shows the load – displacement relationship for the sandwich panel
specimens tested at 120°C. The curve showing the load – displacement relationship for
the specimens tested at 120°C is divided into two phases similar to the previous curve.
It can be observed from the graph that the curve follows a more plastic failure mode
than that exhibited in the previous modes. The effect of temperature is attributed by the
indentations found on the core as a result of the core softening phenomenon. The
indentations are visible clearly even after the failure of the specimen due to interlaminar
core shear. The failure occurs at a peak load range of 3000 – 6050 N and the mid-span
deflection range of 6.5 – 13.5 mm.
0
1000
2000
3000
4000
5000
6000
7000
0 5 10 15 20
Loa
d N
Displacement mm

53
Figure 4.36 Load-Deflection diagram for the Sandwich Panels at 150°C
The figure 4.36 shows the load – displacement relationship of the sandwich panels
tested at 150°C. From the graph it may be observed that the curve follows a completely
plastic mode of failure. This may be attributed to phenomenon of the resin core being
affected more by the temperature than the composite skins. As the core is exposed to the
temperature beyond the glass transition temperature (Tg), the resin core starts to
decompose leading to the plastic failure. The phenomenon of the resin embrittlement
observed in the skin when exposed to higher temperatures in the earlier tests is also
clearly observed in case of the specimens tested at 150°C. A distinct odour of burning
of the epoxy was observed during the heating of the specimen. The peak load range
reduces to 2400 – 2800 N and the mid-span deflection range is between 5 - 18 mm.
0
500
1000
1500
2000
2500
3000
0 5 10 15 20
Loa
d N
Displacement mm

54
Figure 4.37 Load-Deflection diagram for the Sandwich Panels at 180°C
The figure 4.37 shows the load – deflection relation of the sandwich panels tested at
180°C. The phenomenon of the resin decomposition beyond the glass transition
temperature is clearly visible beyond the linear phase of the curve exhibited in the graph
before the plastic failure of the specimen. A strong odour marking the burning of the
epoxy was observed as the specimen was exposed to the elevated temperature of 180°C.
There is a slight increase in the peak load carrying capacity which lies in the range of
1900 – 3400 N and the mid span deflection lies in the range of 8 – 13.5 mm.
0
500
1000
1500
2000
2500
3000
3500
4000
0 2 4 6 8 10 12 14 16
Loa
d m
m
Displacement mm

55
4.6 Failure Modes of the Sandwich Panels
4.6.1 Failure modes at 21°C and 35°C
Figure 4.38 Failure modes at 21°C and 35°C
Figure 4.39 Delamination failures at 21°C and 35°C
The figure 4.38 shows the failure modes of the specimens tested at the temperature
range of 21°C and35°C. From the figure it is observed that the specimens follow the
same mode of failure from room temperature and 35°C. The failure is initiated due to
the cracks developed on the compression side of the specimen followed by the ultimate
failure due to interlaminar shear developed in the core which results in the breaking of
the structure. From the figure 4.39, it can also be observed that the failure is
characterised by the de-bonding between the skin and the core due to the delamination
of the individual plies of the skin laminate from the core.

56
4.6.2 Failure modes at 50°C, 65°C and 80°C
Figure 4.40 Failure modes at 50°C and 65°C
Figure 4.41 Delamination failures at 50°C and 65°C

57
Figure 4.42 Failure mode of the specimen at 80°C
Figure 4.43 Delamination of the plies at 80°C

58
The figure 5.25 to 5.28 shows the failure modes followed by the sandwich panel from
the temperature range of 50°C 80°C. From the load-displacement diagram of the
sandwich panels tested from 50°C to 80°C, it was observed that the panels exhibit a
plastic phase before failing in a brittle manner due to the inter-laminar shear in the core
of the panel. This plastic phase may be due to the effect of temperature on the resin
which is observed in the form of indentations in the top skin of the panel at the point of
loading which is indicated in the figure 4.42. It is also observed that the de-bonding
between the skin and the core occurs due to the delamination of the individual plies of
the skin which is similar to the failure modes observe in the previous temperature range.
4.6.3. Failure Modes at 100°C and 120°C
Figure 4.44 Failure mode of the specimen at 100°C

59
Figure 4.45 Failure mode of the specimen at 120°C
Figure 4.46 Delamination of the core at 100°C and 120°C
The figures 4.44, 4.45and 4.46 show the failure modes of the sandwich panel specimens
at 100°C and 120°C. From the load-displacement diagrams of the specimens tested at
10°C and 120°C, it was found that the failure beyond 100°C ceases to be brittle and
follows a plastic mode of failure. This plastic mode of failure may be attributed to the

60
phenomenon of core softening which is observed in the top skin as well as the resin core
of the sandwich panels in the form of indentations as shown in the figures 4.44 and
4.45. From the figure 4.46 it can be observed that the de-bonding of the skin and the
core takes place due to delamination of the core with the skin remaining intact which is
also due to the phenomenon of core softening at higher temperature. The ultimate
failure takes place by the interlaminar shear failure of the core.
4.6.4 Failure modes of the sandwich panel at 150°C and 180°C
Figure 4.47 Failure of the specimen at 150°C

61
Figure 4.48 Failure of the specimen at 180°C
Figure 4.49 Delamination of the core at 150°C and 180°C
The figures 4.47 and 4.48 show the failure modes of the sandwich panel specimens at
150°C and 180°C. From the load displacement diagram of the sandwich panels it was
observed that the specimens exhibit plastic mode of failure which attributed to the
phenomenon of core softening as an effect of temperature. The phenomenon of the core
softening is characterized by indentations as shown in the figures 4.47 and 4.48. At
temperatures beyond the glass transition temperature the resin turns brittle which is
characterized by the wrinkling of the top skin at the point of loading. The de-bonding of
62
the skin and the core takes place due to the delamination of the core from the skin as a
result of core softening which is observed beyond 100°C. Similar to the other failure
modes, the ultimate failure of the specimen takes place due to the interlaminar shear at
the resin core of the sandwich panel.
4.7. Summary
In this section the various results and the observations made during the testing of the
skin and the sandwich panel specimens was discussed in detail. The results observed
from the Dynamic Mechanical Analysis of the skin and core reveal the behaviour of the
composite skin and the resin core under elevated temperatures and the glass transition
temperature of the skin and the core were identified as 125.06°C and 136.11°C
respectively. The load-deflection diagrams obtained from the testing of the skin and the
sandwich panels were explained in detail in order to identify the behaviour of the
sandwich panels under elevated temperature. Finally the various failure modes observed
under each temperature range was discussed in detail in order to understand the ultimate
failure behaviour exhibited by the skin and the sandwich panel specimens.

63
Chapter 5 – Discussion
5.1. Mechanical Properties of the skin and core under Dynamic
Mechanical Analysis (DMA)
The composite skin and the resin core exhibit the glassy, leathery and the transition
from glassy to leathery state which explains the similar behaviour observed in the
phases 1 and 2 from the results of the DMA test on the skin and the coreA similar
observation in the behaviour of the composite and the resin was observed by Lauobi et
al (2014) from the DMA results of E-glass fibre reinforced with unsaturated polyester.
The results from the study made on E-glass fibre indicates that for the composites at
temperatures lower than 60°C, a slow decrease in storage modulus (E’) is observed in
the phase 1 followed by the steep decrease in the storage modulus from temperature
range of 60°C to Tg of around 81°C for the composite and temperatures less than Tg of
64°C for the resin which is observed in phase 2. The phase 1 which is specific to the
composite as observed by Lauobi et al is absent for the composite skin tested in this
study. Bai and Keller (2009) also observed a similar trend in the DMA curve of GRPF
laminates with polyester resin, where the storage modulus continuously decreased until
the glass transition temperature of 155°C for the composite. However, beyond the glass
transition temperature (Tg), the composite skin under studied in this research exhibits
the transition from the leathery to rubbery state where the polymeric chains tends to
towards an entangled molecular structure with broken secondary bonds and intact
primary bonds. This behaviour is characterized by the decrease in the Tan delta or the
loss factor curve observed in the graph. On the other hand, the resin core exhibits a
decomposition phase which is characterized by broken primary and secondary bods.
This behaviour is observed as the irregularity in the graph beyond the glass transition
temperature (Tg) in the tan delta curve. This behaviour of the composite skin and the
resin core beyond the glass transition temperature is in contrast to the results observed
from the DMA results of the previous studies conducted on composites and resins. It
was also observed that the composites used in the previous studies are made of
polyester resin unlike the phenol-formaldehyde resin which was used in this research.
From the DMA analysis of the skin it was observed that the resin oozes out from the
skin composite as shown in the figure 5.1. This phenomenon of the resin oozing out
from the composite is caused as a result of the melting of the resin at higher
temperature. It was also observed that the resin turns brittle the specimen is subjected to

64
the effect of elevated temperatures beyond 100°C.According to Lauobi et al (2014), the
moisture content of the specimen is removed in the form of evaporation at 200°C. This
phenomenon of resin turning brittle beyond 100°C may be attributed to this effect where
the moisture content is removed from the specimen as the temperature raises.
Figure 5.1 Skin Specimens before and after DMA
Figure 5.2 DMA result of the skin

65
5.2. Load – Displacement Diagram of the Skin under Three Point
Bending Test
Figure 5.3 Load – Displacement diagram of the skin specimen at different Temperatures
The figure shows the load - displacement diagram of the composite skin specimens
tested for their flexure under the influence of elevated temperature. From the figure 5.3
it can be observed that the behaviour of the composite skin is influenced by the effect of
temperature under the three point bending test. The figure reveals three different phases
that can be observed in the above graph namely the linear phase, non-linear phase and
the failure phase which is either brittle or plastic. A similar observation was made by
Laoubi et al (2014), when E-glass fibres with unsaturated polyesters were studied for
the thermal behaviour where the specimens exhibited a linear and non-linear phase at
different temperatures.The linear phase indicates the stiffness of the laminate which
fails ultimately by brittle failure dominated by the interlaminar shear between the
individual plies of the laminate. The linear phase is observed in the initial stages in all
the specimens at all temperature ranges for the specimens studied in this research. The
specimens tested under room temperature and 35°C exhibit a linear phase followed by
the brittle failure of the specimen. The non-linear phase or the plastic phase indicates
the phenomenon of the resin becoming soft as a result of the effect of elevated
temperature. This non-linear phase is observed just after the linear phase in the
0
500
1000
1500
2000
2500
3000
3500
4000
0 5 10 15 20 25
Loa
d N
Deflection mm
RT
35
50
65
80
100
120
150
180

66
specimens tested from 50°C to 80°C. Until the temperature of 80°C the specimen fails
in a brittle manner. Beyond 80°C the specimen failure of the specimen ceases to be
brittle and follows a plastic mode which is a clear indication of the phenomenon of the
resin softening. Similar observation of the failure modes of composites at elevated
temperature was made by Wong and Wang (2004), where the composite specimens
failed by crushing with a loud bang at temperatures below 90°C and beyond 90°C the
specimens failed as a result of softening of the resin and by Li et al (2012), for the three
point bending test of E-glass/epoxy braided composites tested for the effect of
temperature on the bending properties and failure mechanisms where the composites
failed in a brittle manner until 75°C and from 100°C the specimens failed in a plastic
manner due to resin softening. A characteristic dis-coloration of the specimen is
observed from 80°C. The specimens exhibit a pale pink colour at 80°C and 100°C and
at 120°C to 150°C the specimens exhibit a yellow shade at the edges. At 180°C the
specimens exhibit a brown shade indicating the effect of temperature on the physical
properties of the specimen.According to Alsayed et al (2012), the change in the colour
of the specimens is attributed to the decomposition of the polymer matrix and is
proportional to the exposure temperature and exposure periods. According to Wong and
Wang (2009), the brown colour is believed to be carbon, which indicates the beginning
of the decomposition of the resin.

67
5.3. Load – Displacement Diagram of the Sandwich Panel under Three
Point Bending Test
Figure 5.4 Load – Deflection diagram of Sandwich Panel specimen at different temperatures
The figure 5.4 shows the load – deflection diagram of the sandwich panel specimens
tested for their flexure at elevated temperature. The specimens tested for their behaviour
under three point bending test exhibited three different phases namely the linear phase,
non-linear phase and the failure phase similar to the skin specimens discussed in the
previous section. The sandwich panel specimens tested under room temperature and
35°C exhibit a linear phase followed by a very small non-linear phase which indicates
the failure of the specimen being initiated by the formation of cracks on the
compression side of the specimen.The non-linear phase is followed by the brittle failure
of the specimen. The specimens tested under the temperature range of 50°C to 80°C
exhibit a linear phase which is followed by a non-linear phase or the plastic phase which
indicates the phenomenon of the resin core softening as a result of the effect of
temperature on the sandwich panel. At temperatures beyond 80°C the linear phase is
followed by a plastic phase and the failure of the sandwich panel ceases to brittle in
nature by failing in a plastic manner attributed to the softening of the resin core. At the
temperature of 150°C and 180°C the linear phase is immediately followed by the plastic
failure indicating the failure of the core beyond the glass transition temperature of the
resin which was found as 136.11°C from the DMA. The behaviour of the sandwich
0
2000
4000
6000
8000
10000
12000
0 2 4 6 8 10 12 14
Loa
d N
Deflection mm
RT
35
50
65
80
100
120
150
180

68
panel is governed by the composite skin at lower temperature range of 21°C to 80°C
and from 100°C to 180°C the behaviour of the sandwich panel is governed by the resin
core than the skin. The ultimate failure of all specimens is dominated by the
interlaminar shear of the core. The specimens exhibit a characteristic discoloration and a
distinct odour at 150°C and 180°C. According to Liu et al (2013), the discolouration is
attributed to the thermal-oxidation occurring at the surface of the epoxy resin and the
exposure to high temperature had an important effect on the failure modes of the
sandwich panel as observed in this study also. A similar odour of the burning of the
resin was observed beyond 150°C by Liu et al (2013), which is attributed to some
decomposition of the polymer matrix when exposed to elevated temperature.
5.4. Effect of Elevated Temperature on the Strength of the Skin
Figure 5.5 Strength Vs Temperature of the skin
The figure 5.5 shows the variation of the strength properties of the skin with
temperature. From 21°C to 120°C the strength of the skin specimen shows a steady
decrease with the increase in the temperature. According to Wong and Wang (2009),
this steady decrease in the strength is attributed to the effect of temperature on the resin
of the composite. As the temperature increases the resin softens leading to the decrease
in the strength of the specimen. As the temperature progresses beyond the glass
0
50
100
150
200
250
0 50 100 150 200
Str
en
gth
Mp
a
Temperature °C
Temperature Vs Strength
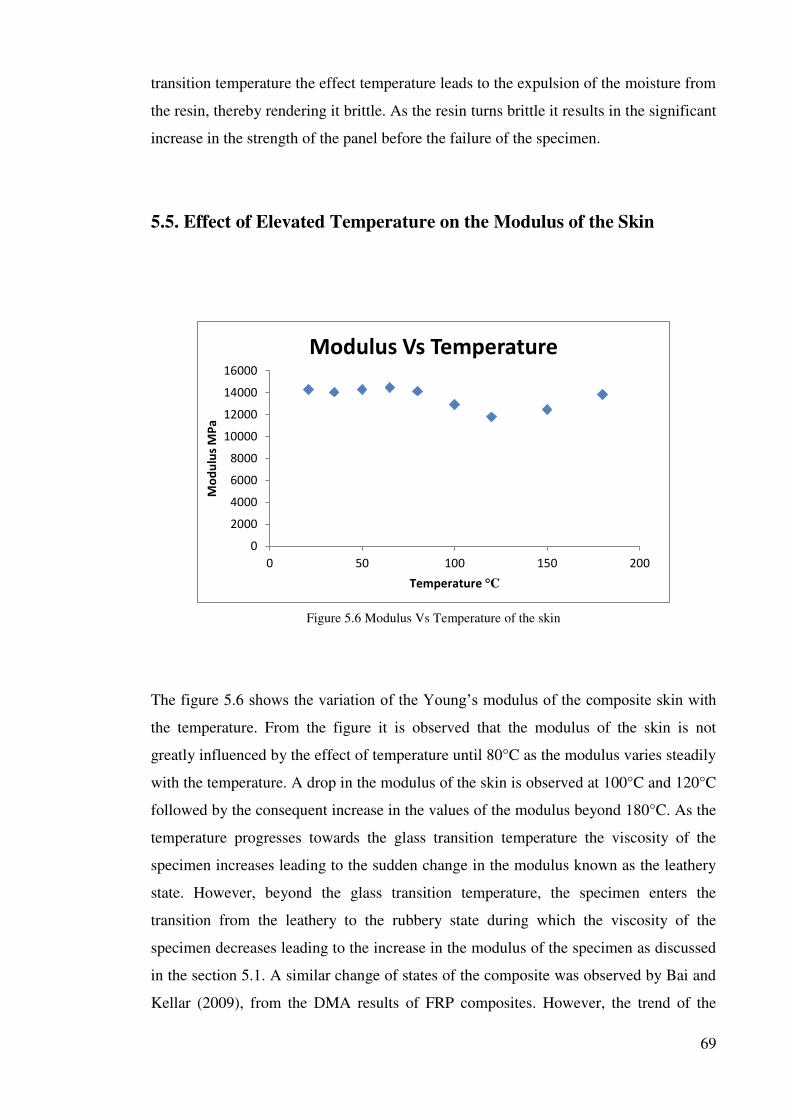
69
transition temperature the effect temperature leads to the expulsion of the moisture from
the resin, thereby rendering it brittle. As the resin turns brittle it results in the significant
increase in the strength of the panel before the failure of the specimen.
5.5. Effect of Elevated Temperature on the Modulus of the Skin
Figure 5.6 Modulus Vs Temperature of the skin
The figure 5.6 shows the variation of the Young’s modulus of the composite skin with
the temperature. From the figure it is observed that the modulus of the skin is not
greatly influenced by the effect of temperature until 80°C as the modulus varies steadily
with the temperature. A drop in the modulus of the skin is observed at 100°C and 120°C
followed by the consequent increase in the values of the modulus beyond 180°C. As the
temperature progresses towards the glass transition temperature the viscosity of the
specimen increases leading to the sudden change in the modulus known as the leathery
state. However, beyond the glass transition temperature, the specimen enters the
transition from the leathery to the rubbery state during which the viscosity of the
specimen decreases leading to the increase in the modulus of the specimen as discussed
in the section 5.1. A similar change of states of the composite was observed by Bai and
Kellar (2009), from the DMA results of FRP composites. However, the trend of the
0
2000
4000
6000
8000
10000
12000
14000
16000
0 50 100 150 200
Mo
du
lus
MP
a
Temperature °C
Modulus Vs Temperature
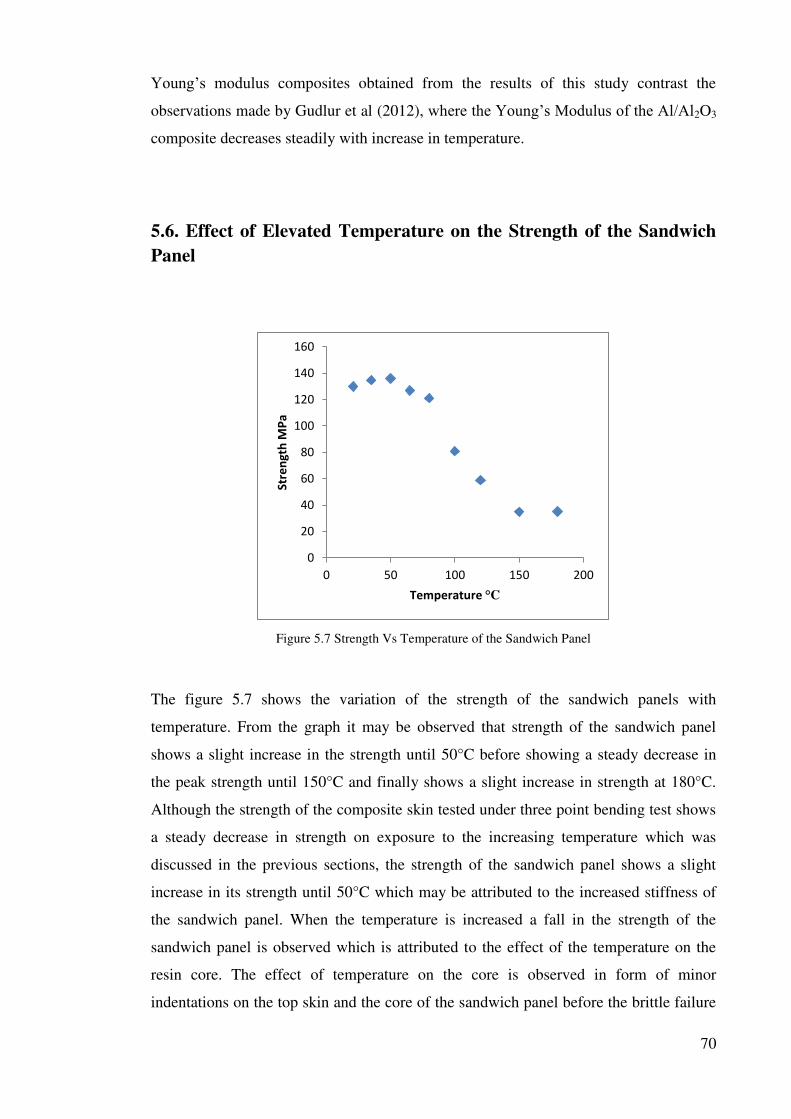
70
Young’s modulus composites obtained from the results of this study contrast the
observations made by Gudlur et al (2012), where the Young’s Modulus of the Al/Al2O3
composite decreases steadily with increase in temperature.
5.6. Effect of Elevated Temperature on the Strength of the Sandwich
Panel
Figure 5.7 Strength Vs Temperature of the Sandwich Panel
The figure 5.7 shows the variation of the strength of the sandwich panels with
temperature. From the graph it may be observed that strength of the sandwich panel
shows a slight increase in the strength until 50°C before showing a steady decrease in
the peak strength until 150°C and finally shows a slight increase in strength at 180°C.
Although the strength of the composite skin tested under three point bending test shows
a steady decrease in strength on exposure to the increasing temperature which was
discussed in the previous sections, the strength of the sandwich panel shows a slight
increase in its strength until 50°C which may be attributed to the increased stiffness of
the sandwich panel. When the temperature is increased a fall in the strength of the
sandwich panel is observed which is attributed to the effect of the temperature on the
resin core. The effect of temperature on the core is observed in form of minor
indentations on the top skin and the core of the sandwich panel before the brittle failure
0
20
40
60
80
100
120
140
160
0 50 100 150 200
Str
en
gth
MP
a
Temperature °C

71
of the specimen. When the temperature of the sandwich panels reaches 100°C and
progresses towards the glass transition temperature, a rapid fall in strength is observed
before the plastic failure of the specimen. The phenomenon of core softening due to the
effect of temperature was observed which was characterised by strong indentations in
the top skin at the point of loading and in the core. As the temperature increases beyond
the glass transition temperature and reaches 150°C, a further decrease in the strength of
the sandwich panel is observed which is attributed to the effect of core softening
followed by the phenomenon of resin turning brittle which results in the wrinkling of
the surface of the top skin of the sandwich panel. As the temperature reaches 180°C, the
core softens initially which is characterised by indentations, followed by the
phenomenon of the resin turning brittle as observed during the DMA tests which leads
to the slight increase in the strength of the sandwich panel. The trend of the variation of
the strength properties with temperature observed in this study is in contrast to the
observations made by Liu et al (2013), as the strength of the carbon sandwich panels
steadily decreases with the increase in the temperature.
5.7. Effect of Elevated Temperature on the Modulus of the Sandwich
Panel
Figure 5.8 Modulus Vs Temperature of the Sandwich Panels
0
1000
2000
3000
4000
5000
6000
7000
8000
9000
10000
0 50 100 150 200
Yo
un
g's
Mo
du
lus
Mp
a
Temperature °C
Modulus Vs Temperature

72
The figure 5.8 shows the variation of the Young’s modulus of the specimen with
temperature. It is found that the Young’s modulus of the specimen decreases steadily
with the increase in temperature until 120°C followed by a rapid decrease in the
modulus of the specimen beyond the glass transition temperatures of the skin and the
core. The steady decrease in the modulus of the sandwich panel may be attributed to the
effect of temperature on the resin core as the trend followed by the Young’s modulus
curve is similar to that of the Storage modulus curve observed during the DMA test of
the core. The rapid drop in the modulus beyond the glass transition temperature may be
attributed to the decomposition of the core which was characterised by the irregularity
observed in the results of the DMA analysis of the core. Hence, based on the results and
the observations made it is found that the Young’s Modulus of the sandwich panel is
influenced by the behaviour of the resin core under elevated temperature. According to
Liu et al the viscosity of the polymer matrix increases with exposure to temperature
resulting in the decrease in the young’s modulus of the specimens which indicates that
the resin is susceptible to the elevated temperature.
5.8. Summary
The flexural behaviour of the skin and the sandwich panel has been examined through
the experimental analysis. The primary cause of the failure of the skin material at room
temperature is found to be due to the compressive cracks developed at the point of
loading. When the skin is subjected to a raise in temperature range of 35°C to 80°C, it is
observed that the failure is initiated by the cracks developed on both the compression
and the tension side of the specimen before failing due to inter-laminar shear between
the individual plies of the skin. At the temperature of 100°C and 120°C the resin starts
to soften before failing due to the formation of cracks and inter laminar shear between
the plies. Finally at 150°C and 180°C the resin starts to decompose as it is exposed to
temperatures beyond the glass transition temperature (Tg). This leads to the
phenomenon of the resin turning brittle due to the removal of the moisture content from
the specimen.
The results from the sandwich panel reveal that the panels fail under room temperature
due to the compressive failure of the skin which is closely followed by the inter-laminar

73
shear in the core and finally the de-bonding of the skin and the core materials. This
mode of failure is observed at almost all temperatures. At 80°C a plastic phase is
observed before the specimen fails in a brittle manner. The skin bends and cracks before
the break failure of the specimen. It is observed that the failure takes place by the de-
bonding of the skin which is characterized by the de-lamination between the individual
plies of the skin. At 100°C the failure ceases to be brittle and the specimen tends to
follow a plastic mode of failure. The change in the failure mode may be due to the
phenomenon of core softening where the core yields characterized by indentations. The
specimen bends and the failure is initiated at the tension side (bottom skin). A steep
decrease in the strength is observed while the flexural modulus remains relatively the
same. It is observed that the de-bonding of the skin and core takes place due to core
delamination. At 120°C the failure is more plastic which is attributed to the softening of
the core. The effect of core softening is characterised by major indentations on the core
during the process of loading. The softening of the resin is also observed at the point of
loading in the form of indentations along with cracks on the compression side. At 150°C
the specimen fails primarily due to the decomposition of the core as the specimen is
exposed to temperatures beyond the glass transition (Tg). As a result of this the
moisture content in core is removed which leads to the phenomenon of the resin turning
brittle which is observed in both the skin and the core. The failure is characterised by
major indentations at the loading point. There is a drop in the value of the flexural
modulus and the peak strength. At 180°C the phenomenon of the resin decomposition is
clearly characterized by the formation of cracking of the top surface of the skin just
below the loading point which is similar to the result observed during the testing of the
skin material under ambient temperature conditions

74
Chapter 6 – Theoretical prediction of composite
sandwich behaviour at elevated temperature
6.1. Introduction
This chapter will explain the assumptions made during the numerical analysis of the
sandwich panels. The process adopted to develop the empirical equation describing the
flexural behaviour of the sandwich panels under elevated temperature are also explained
in this section. Finally a comparison of the experimental and the theoretical results is
presented in this section.
6.2. Assumptions made for the Theoretical Prediction Equation
The numerical analysis of the sandwich panel is done based on the Simple Bending
Theory or the Theory of flexure. The following assumptions are made for the purpose of
numerical analysis of the sandwich panels under elevated temperature:
Beam is initially straight, and has a constant cross-section.
Beam is made of homogeneous material and the beam has a longitudinal
plane of symmetry.
Resultant of the applied loads lies in the plane of symmetry.
The geometry of the overall member is such that bending not buckling is the
primary cause of failure.
Elastic limit is nowhere exceeded and ‘E' is same in tension and compression.
Plane cross - sections remains plane before and after bending.
6.3. Prediction of the Strength and the Modulus of the Skin and the
Core of the Sandwich Panel
The prediction equations were calculated from the normalised curves using Microsoft
Excel using the Trend line option which calculates the equation using the process of
arithmetic regression. Normalisation of data was carried out by dividing the values of
the strength and modulus at each temperature by the values obtained at ambient
temperature. A comparison was made between the different equations types such as the
exponential, linear, logarithmic and polynomial equations of various degrees. The best
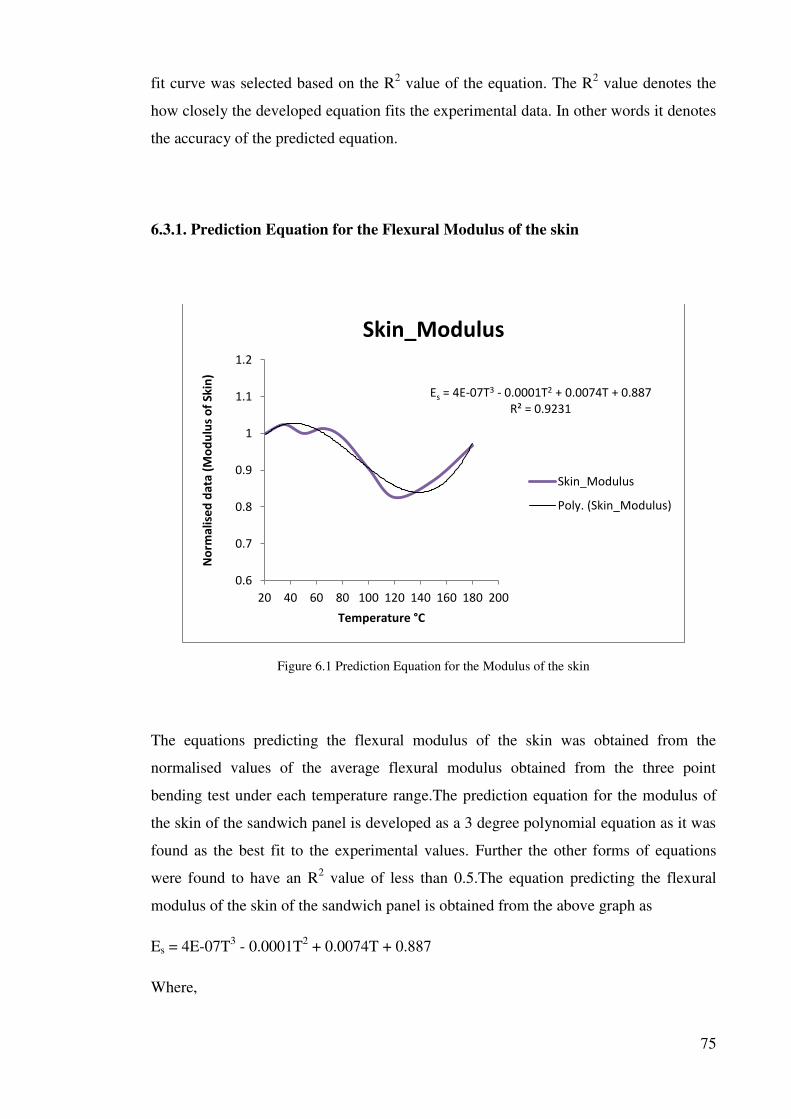
75
fit curve was selected based on the R2 value of the equation. The R
2 value denotes the
how closely the developed equation fits the experimental data. In other words it denotes
the accuracy of the predicted equation.
6.3.1. Prediction Equation for the Flexural Modulus of the skin
Figure 6.1 Prediction Equation for the Modulus of the skin
The equations predicting the flexural modulus of the skin was obtained from the
normalised values of the average flexural modulus obtained from the three point
bending test under each temperature range.The prediction equation for the modulus of
the skin of the sandwich panel is developed as a 3 degree polynomial equation as it was
found as the best fit to the experimental values. Further the other forms of equations
were found to have an R2 value of less than 0.5.The equation predicting the flexural
modulus of the skin of the sandwich panel is obtained from the above graph as
Es = 4E-07T3 - 0.0001T
2 + 0.0074T + 0.887
Where,
Es = 4E-07T3 - 0.0001T2 + 0.0074T + 0.887
R² = 0.9231
0.6
0.7
0.8
0.9
1
1.1
1.2
20 40 60 80 100 120 140 160 180 200
No
rma
lise
d d
ata
(M
od
ulu
s o
f S
kin
)
Temperature °C
Skin_Modulus
Skin_Modulus
Poly. (Skin_Modulus)

76
Es = Young’s Modulus of the Skin
T = Temperature in °C
6.3.2. Prediction Equation for the Flexural Strength of the Skin
Figure 6.2 Prediction Equation for the Strength of the Skin
The strength of the skin was obtained from the normalised values of the average flexural
strength obtained from the results of the three point bending test under elevated
temperature. The prediction equation for the strength of the skin of the sandwich panel
is computes as logarithmic equation with an R2 value of 0.88. On comparing with the
other equation types it was found that the logarithmic equation and a polynomial
equation of 2 degree provided the best fit. Hence for the purpose of simplicity a
logarithmic equation predicting the flexural strength of the skin of the sandwich panel is
obtained from the above graph as
σs = 4E-07T3 - 7E-05T
2 - 0.0029T + 1.1116
Where,
σs = Flexural Strength of the Skin
y = -0.313ln(x) + 2.0121
R² = 0.8822
0
0.2
0.4
0.6
0.8
1
1.2
0 50 100 150 200
No
ma
lise
d D
ata
(S
tre
ng
th o
f S
kin
)
Temperature°C
Skin_Strength
Log. (Skin_Strength)

77
T = Temperature in °C
6.3.3. Prediction Equation for the Flexural Strength and Flexural Modulus of the
Core
Figure 6.3 Prediction Equation for the Modulus of the Core
Figure 6.4 Prediction Equation for the Strength of the Core
Ec = 0.000000002978T4 - 0.000000448512T3 -
0.000078426603T2 + 0.006694923752T +
0.861599599652
R² = 0.990312926989
0.010.060.110.160.210.260.310.360.410.460.510.560.610.660.710.760.810.860.910.961.011.06
0 50 100 150 200
No
rma
lise
d V
alu
es
Temperature in C
Core_1
Poly. (Core_1)
σc = 0.000000002978T4 - 0.000000448512T3 -
0.000078426603T2 + 0.006694923752T +
0.861599599652
R² = 0.990312926989
0.010.060.110.160.210.260.310.360.410.460.510.560.610.660.710.760.810.860.910.961.011.06
0 50 100 150 200
No
rma
lise
d V
alu
es
Temperature in C
Core_1
Poly. (Core_1)

78
The equations predicting the flexural strength and the modulus of the core were
obtained from the normalised values of the Storage modulus obtained from the DMA of
the core. This procedure was adopted to ensure that the strength and the modulus of the
core followed the same trend under elevated temperature.On comparing with the other
types of equations the polynomial equation was selected as the best fit for the curve
with an R2 value of 0.99. A fourth degree polynomial with very high precision was
selected in order to account for the values under 0.1.
Hence, the equation predicting the flexural modulus and the flexural strength of the
core of the sandwich panel under elevated temperature is obtained from the above graph
as
Ec = 0.000000002978T4 - 0.000000448512T
3 - 0.000078426603T
2 + 0.006694923752T
+ 0.861599599652
σc= 0.000000002978T4 - 0.000000448512T
3 - 0.000078426603T
2 + 0.006694923752T
+ 0.861599599652
Where,
Ec= Young’s Modulus of the Core
σc= Flexural Strength of the Core
T = Temperature in °C
6.4. Empirical Equations
The empirical equation predicting the behaviour of the sandwich panels is obtained
from the following procedure:
6.4.1. Prediction of the Theoretical Young’s Modulus (Esw)
The results obtained from the Dynamic Mechanical Analysis and the flexure test of the
skin is normalised to capture the trends of the curves depicting its behaviour at elevated
temperatures. The normalisation was carried out by dividing each value of the flexural
modules of the skin specimens obtained by the three point bending test at each
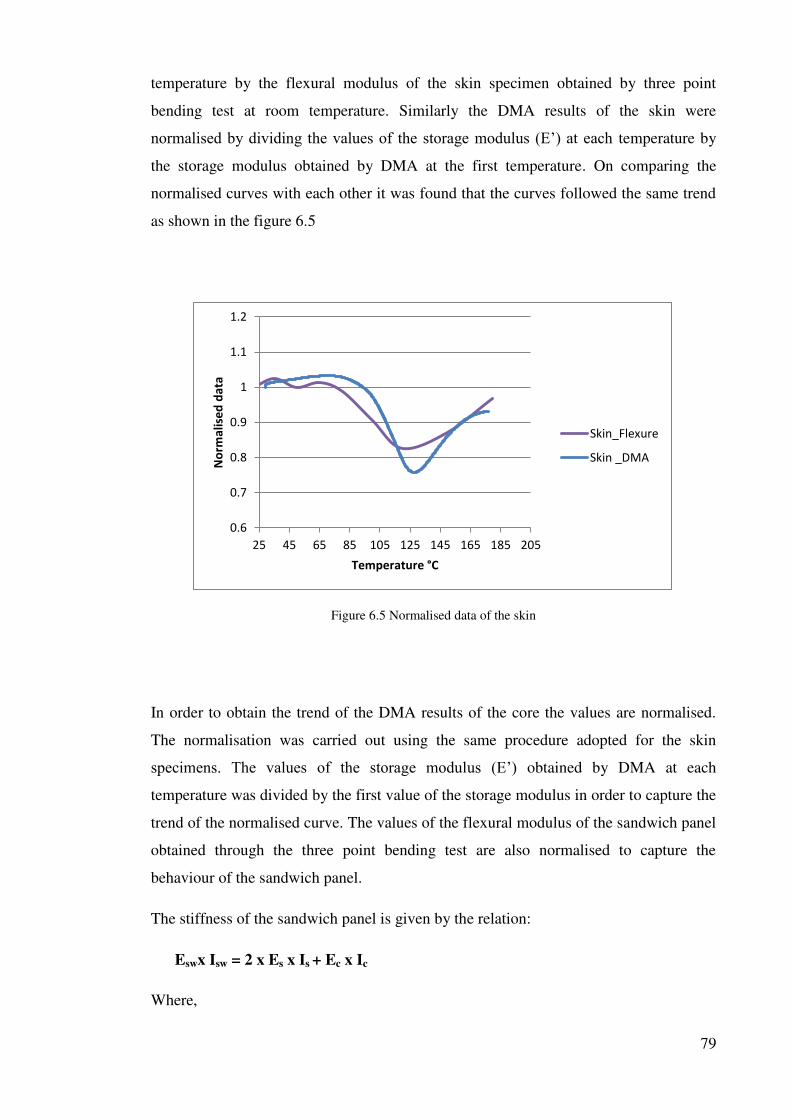
79
temperature by the flexural modulus of the skin specimen obtained by three point
bending test at room temperature. Similarly the DMA results of the skin were
normalised by dividing the values of the storage modulus (E’) at each temperature by
the storage modulus obtained by DMA at the first temperature. On comparing the
normalised curves with each other it was found that the curves followed the same trend
as shown in the figure 6.5
Figure 6.5 Normalised data of the skin
In order to obtain the trend of the DMA results of the core the values are normalised.
The normalisation was carried out using the same procedure adopted for the skin
specimens. The values of the storage modulus (E’) obtained by DMA at each
temperature was divided by the first value of the storage modulus in order to capture the
trend of the normalised curve. The values of the flexural modulus of the sandwich panel
obtained through the three point bending test are also normalised to capture the
behaviour of the sandwich panel.
The stiffness of the sandwich panel is given by the relation:
Eswx Isw = 2 x Es x Is + Ec x Ic
Where,
0.6
0.7
0.8
0.9
1
1.1
1.2
25 45 65 85 105 125 145 165 185 205
No
rma
lise
d d
ata
Temperature °C
Skin_Flexure
Skin _DMA
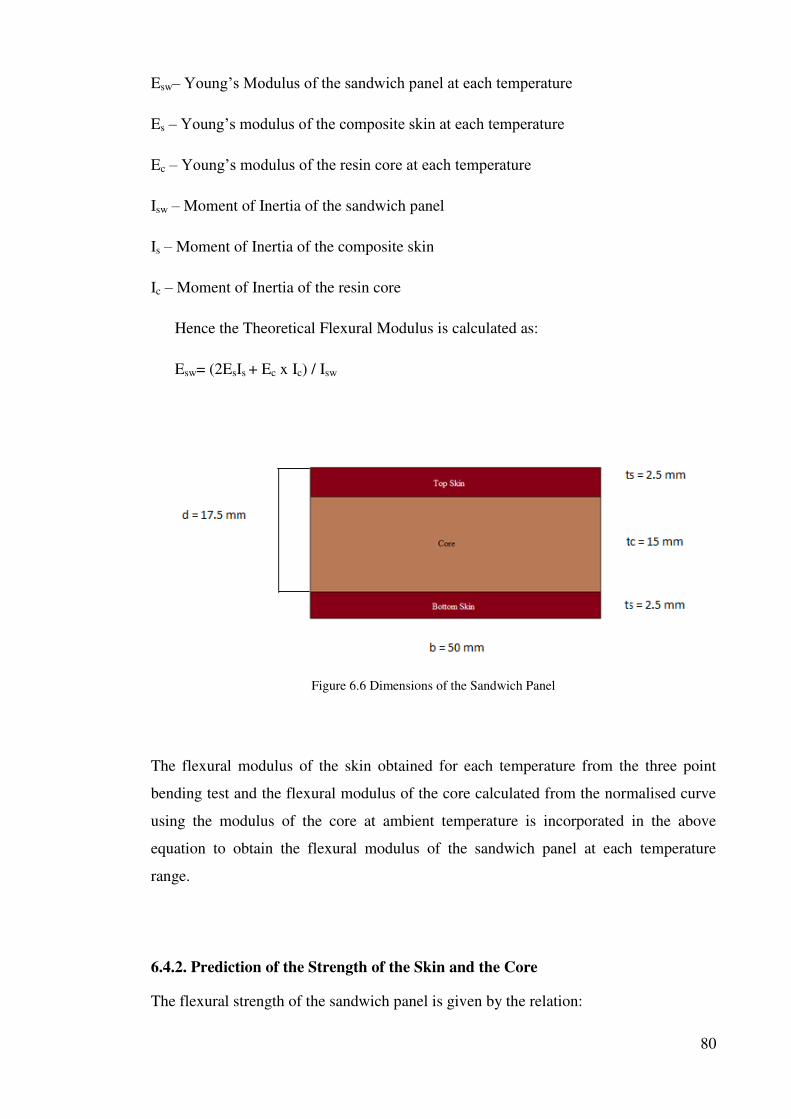
80
Esw– Young’s Modulus of the sandwich panel at each temperature
Es – Young’s modulus of the composite skin at each temperature
Ec – Young’s modulus of the resin core at each temperature
Isw – Moment of Inertia of the sandwich panel
Is – Moment of Inertia of the composite skin
Ic – Moment of Inertia of the resin core
Hence the Theoretical Flexural Modulus is calculated as:
Esw= (2EsIs + Ec x Ic) / Isw
Figure 6.6 Dimensions of the Sandwich Panel
The flexural modulus of the skin obtained for each temperature from the three point
bending test and the flexural modulus of the core calculated from the normalised curve
using the modulus of the core at ambient temperature is incorporated in the above
equation to obtain the flexural modulus of the sandwich panel at each temperature
range.
6.4.2. Prediction of the Strength of the Skin and the Core
The flexural strength of the sandwich panel is given by the relation:

81
σ = M y/ I
Hence the theoretical strength of the skin and the core is calculated using the relation:
σs=(MyEs)/ (EI)sw
σc = (MyEc)/ (EI)sw
(EI)sw = 2 * [Es * (b*(ts^3))/12 + (b*ts*(d^2))/4] + Ec*b*(d^3)/12
Where,
σs – Strength of the skin of the sandwich panel
σc– Strength of the resin core of the sandwich panel
M – Maximum bending moment of the sandwich panel
y – Distance from the neutral axis
Es – Young’s modulus of the composite skin at each temperature
Ec – Young’s modulus of the resin core at each temperature
(EI)sw – Effective equivalent stiffness of the sandwich panel
b – Width of the sandwich panel
ts – Thickness of the skin
d – ts+ tc
6.5. Comparison of the Results
The results obtained from the theoretical prediction equation are compared with the
experimental results in order to validate the prediction equation.

82
6.5.1. Comparison of the Theoretical Modulus with the Experimental Modulus
Figure 6.7 Comparison of the theoretical and experimental modulus of the skin
The figure 6.7 shows the comparison of the flexural modulus of the sandwich panel
obtained by the empirical prediction equation and the experimental results obtained
from the three point bending test. From the figure it is observed that the theoretical
results obtained from the empirical equation correlate with the experimental results until
the 120°C and beyond the glass transition temperature it is observed that the results do
not correlate with the experimental results. This difference in the results may be
attributed to the hypothesis of the partial loss in the composite action of the sandwich
panel where the top and the bottom skins and the core behave as if they are not bonded
with each other. Based on this hypothesis the partial interaction factors at 150°C and
180°C is calculated as 1.30 and 2.31 respectively.
0
1000
2000
3000
4000
5000
6000
7000
8000
9000
10000
0 50 100 150 200
Yo
un
g's
Mo
du
lus
MP
a
Temperature °C
T Vs E(theoritical)
T Vs E(Experimental)

83
6.5.2. Comparison of the Theoretical Strength of the Skin and the Core of the
Sandwich Panel with the Experimental Strength
Figure 6.8 Comparison of the theoretical strength and experimental strengths of the skin
The figure 6.8 shows the comparison of the flexural strength of the skin of the sandwich
panel that was obtained from the prediction equation and the three point static bending
test. From the figure it can be observed that the flexural strength of the skin obtained by
the experimental tests and the flexural strength obtained from the theoretical prediction
equation follow the same trend with variations in their values. From this it was found
that the theoretical prediction equation is able to predict the behaviour of the skin of the
sandwich panel under elevated temperature.
0
50
100
150
200
250
300
0 50 100 150 200
Str
en
gth
in
Mp
a
Temperatue in C
T vs
Strength(theoritical)
T Vs Strength
(Experimental)

84
Figure 6.9 Comparison of the theoretical and Experimental Strengths of the Core
The figure 6.9 shows the comparison of the flexural strength of the core of the sandwich
panel obtained from the prediction equation and the flexural strength obtained from the
normalisation of the values. From the figures it can be observed that the flexural
strength obtained from the prediction equation and the values obtained from the
normalisation of the graph follow the same trend as observed in the of the skin of the
sandwich panel in the previous case.
The variation in the theoretical and the experimental strength at temperatures may be
attributed to the value of the Young’s Modulus value that is applied to calculation of the
strength from the prediction equation. The theoretical strength of the skin and the core
of the sandwich panel are calculated from the relations,
σs=(M x y x Es)/ (EI)sw
σc = (M x y x Ec)/ (EI)sw
respectivelyas discussed in the section 6.3.2 of the chapter 6. The Young’s modulus of
the skin is obtained from the linear portion of the load – displacement graph rather and
not from the peak, while the moment (M) of the sandwich panel is obtained from the
peak load. Further, the values of the Young’s modulus used in the above prediction
equation to incorporate the effects of temperature are the average values of the flexural
modulus obtained for the each temperature of the skin and the core with might
significantly contribute to the variation of the result obtained.
0
2
4
6
8
10
12
14
16
0 50 100 150 200
T Vs Core Strength(T)
T vs Core Strength (E)
85
6.6. Summary
The development of the empirical equation predicting the behaviour of the sandwich
panels under elevated temperature was discussed in this chapter. The various
assumptions made for the purpose of developing the prediction equations was also
briefly discussed in this chapter. The methods adopted to develop the prediction
equations for the skin and the core were under elevated temperature was also outlined
clearly. Finally a comparison of the results obtained from the experimental study and
the empirical equations were compared.
86
Chapter 7 – Conclusion and Recommendation
7.1. Conclusion
This project has studied the effect of elevated temperature on the flexural strength and
the modulus of the sandwich panel under elevated temperature. The CarbonLOC®
sandwich panels incorporate the use of novel phenolic core which is manufactured
primarily for structural applications. The test specimens were manufactured by
CarbonLOC Pvt Ltd in the manufacturing facility located at the University of Southern
Queensland. The flexural behaviour of the sandwich panels under elevated temperature
was determined by three point static bending tests. The mechanical properties of the
constituent materials under elevated temperature were determined by Dynamic
Mechanical Analysis (DMA) of the skin and the core. The results from the experimental
results were used to develop an empirical equation predicting the behaviour of the
sandwich panels under elevated temperature. The results of the empirical equation were
compared with the obtained experimental results to validate the equations developed.
Based on the results of this investigation, the following conclusions were drawn:
The DMA revealed that the glass transition temperature of the skin and the core
was 125°C and 136°C, respectively. Further the variation of the storage modulus
with the temperature was also obtained for the skin and the core which indicates
the behaviour of the constituent materials of the sandwich panel under elevated
temperature. Beyond the glass transition temperature the resin oozed out from
the skin specimen as a result of resin softening and the resin turned brittle which
is due to the expulsion of the moisture from the specimen.
From the results of the bending test it was observed that the strength of the skin
laminate decreased steadily with the increase in temperature until 120°C. The
steady decrease in the strength of the skin was attributed to the effect of
temperature on the resin of the composite. Beyond 120°C, the strength of the
skin showed a significant increase which is attributed to the phenomenon of the
resin turning brittle due to the expulsion of the moisture from the specimen as
observed in the DMA.
The strength of the sandwich panel showed a slight increase in the strength of
the sandwich panel until 50°C which is attributed to the stiffness of the sandwich

87
panel, followed by a steady decrease in the strength until 100°C. The steady
decrease in the strength of the sandwich panel is attributed to the phenomenon of
resin softening which is a result of the effect of elevated temperature on the resin
core of the sandwich panel. From 120°C there is a steep decrease in the strength
of the sandwich panel which is attributed to the failure of the resin beyond the
glass transition temperature. At 180°C, a slight increase in the strength of the
sandwich panel is observed which is attributed to the phenomenon of the resin in
the composite skin becoming brittle.
The effect of temperature on the Young’s Modulus of the sandwich panel was
observed from the three point bending test conducted on the composite skin
specimens. It was found that the modulus of the skin was not greatly influenced
by the temperature until 80°C. From 100°C a steep decrease in the modulus of
the skin is observed which is attributed to the increase in the viscosity of the
specimen as the temperature progresses towards the glass transition temperature
and the specimen enters the leathery state from the glassy state. From 120°C, the
modulus tends to increase which is attributed to the decrease in the viscosity as
it enters the rubbery state from the leathery state.
The Young’s modulus of the sandwich panel was observed from the three point
bending test conducted under elevated temperature. The test revealed that the
modulus of the sandwich panels steadily decreased until 120°C attributed to the
effect of the temperature on the resin core. A sudden decrease in the modulus is
observed at 150°C and180°C, which is attributed to the phenomenon of the
decomposition of the resin core which is indicated in the form of irregularities in
the DMA curve of the core.
The composite skin specimens exhibited failure modes which vary with
temperature. The skin specimens tested under room temperature failed in a
brittle manner by developing cracks on the compression side (top surface) of the
specimen. The specimen tested at 35°C too failed in a brittle manner but the
specimens developed cracks on both the compression and the tension side. The
specimens tested at 50°C, 65°C and 80°C failed in a brittle manner but the
specimens exhibited a plastic phase just before failing in a brittle manner which
is attributed to the effect of temperature on the resin. This is characterised by
minor indentation bat the point of loading. At 100°C and 120°C, the failure of
the skin specimens ceases to be brittle and fails in a more plastic manner. This
behaviour is attributed to the phenomenon of resin softening under elevated

88
temperature. At 150°Cand 180°C, the skin specimens fail in a completely plastic
manner which is attributed to the phenomenon of the resin softening which was
observed in the previous cases. At 150°C and 180°C the cracks were observed
only on the compression side of the specimen. The ultimate failure occurred due
to the interlaminar shear between the plies of the skin laminate.
The sandwich panel specimens tested at room temperature and 35°C failed in a
brittle manner with the failure dominated by the interlaminar shear of the core.
The specimens tested at 50°C, 65°C and 80°C exhibited a plastic phase before
failing in a brittle manner. The plastic phase exhibited by the sandwich panels is
attributed to the effect of temperature on the resin core of the panel which is
characterised by minor indentations on the core and on the top skin below the
point of loading. Until 80°C, the skin de-bonds from the core due to the
delamination of the individual plies of the skin. The specimens tested at 100°C
and 120°C fail in a completely plastic manner which is attributed to the
phenomenon of resin softening which is characterised by strong indentations on
the top skin and the core at the point of loading. At 150°C and 180°C, the
specimens fail in a completely plastic manner similar to the previous case. The
phenomenon of resin softening is characterised by strong indentation on the core
and the phenomenon of the resin turning brittle is observed in the top skin of the
specimen. From 100°C the de-bonding of the skin and the core takes place due
to the delamination of the core from the skin while the skin laminate stays intact.
The theoretical equation predicting the flexural behaviour of the sandwich panel
under elevated temperature was developed based on the principles of pure
bending theory. The modulus of the sandwich panel was calculated from the
empirical equation incorporating the effects of elevated temperature. The results
from the prediction equation were compared with the experimental results. On
comparison it was found that there is a partial loss in the composite behaviour of
the sandwich panel at temperatures beyond the glass transition temperature
136.11°C. The strength of the skin and the core of the sandwich panel were
calculated from the empirical equation and the results were compared to the
experimental results. On comparison it was found that strength of the skin and
the core of the sandwich panels correlated well with experimental results.

89
7.2. Recommendations for Future Work
The results of the experimental and numerical analysis of the sandwich panels under
elevated temperature reveal that the strength and the stiffness of the sandwich panels
vary with the increase in the temperature. On comparing the theoretical results with the
experimental results of the flexural modulus it was found that there is a partial loss in
the composite action of the sandwich panel. This hypothesis could be subjected to
further investigation in order to analyse the behaviour of the sandwich panels. Finally
the finite element analysis of the sandwich panels is to be done in order to analyse the
behaviour of the sandwich panels under elevated temperature by comparing them
against the experimental results observed.
In some situation, only one side of the sandwich panel is subjected to the effect of
elevated temperature. Although this scenario can be predicted through the empirical
equation developed in this research, further investigation may be made in order to
account for the exact temperature to which the resin core and the top and the bottom
skins are subjected to.

90
References
Abbasi, A & Hogg, PJ 2005, 'Temperature and environmental effects on glass fibre rebar:
modulus, strength and interfacial bond strength with concrete', Composites Part B:
Engineering, vol. 36, no. 5, pp. 394-404.
Alsayed, S, Al-Salloum, Y, Almusallam, T, El-Gamal, S & Aqel, M 2012, 'Performance of glass
fiber reinforced polymer bars under elevated temperatures', Composites Part B: Engineering,
vol. 43, no. 5, pp. 2265-71.
Asaro, RJ, Lattimer, B & Ramroth, W 2009, 'Structural response of FRP composites during fire',
Composite Structures, vol. 87, no. 4, pp. 382-93.
Ateş, E & Barnes, S 2012, 'The effect of elevated temperature curing treatment on the
compression strength of composites with polyester resin matrix and quartz filler', Materials &
Design, vol. 34, pp. 435-43.
Awad, ZK, Aravinthan, T & Manalo, A 2012, 'Geometry effect on the behaviour of single and
glue-laminated glass fibre reinforced polymer composite sandwich beams loaded in four-point
bending', Materials & Design, vol. 39, pp. 93-103.
Awad, ZK, Aravinthan, T, Zhuge, Y & Manalo, A 2013, 'Geometry and restraint effects on the
bending behaviour of the glass fibre reinforced polymer sandwich slabs under point load',
Materials & Design, vol. 45, pp. 125-34.
Bai, Y & Keller, T 2009, 'Modeling of mechanical response of FRP composites in fire',
Composites Part A: Applied Science and Manufacturing, vol. 40, no. 6-7, pp. 731-8.
Bai, Y & Keller, T 2011, 'Delamination and kink-band failure of pultruded GFRP laminates under
elevated temperatures and compression', Composite Structures, vol. 93, no. 2, pp. 843-9.
Bai, Y, Keller, T & Vallée, T 2008, 'Modeling of stiffness of FRP composites under elevated and
high temperatures', Composites Science and Technology, vol. 68, no. 15-16, pp. 3099-106.
Bosze, EJ, Alawar, A, Bertschger, O, Tsai, Y-I & Nutt, SR 2006, 'High-temperature strength and
storage modulus in unidirectional hybrid composites', Composites Science and Technology, vol.
66, no. 13, pp. 1963-9.
Carvelli, V, Pisani, MA & Poggi, C 2013, 'High temperature effects on concrete members
reinforced with GFRP rebars', Composites Part B: Engineering, vol. 54, pp. 125-32.
Çavdar, A 2012, 'A study on the effects of high temperature on mechanical properties of fiber
reinforced cementitious composites', Composites Part B: Engineering, vol. 43, no. 5, pp. 2452-
63.

91
Correia, JR, Gomes, MM, Pires, JM & Branco, FA 2013, 'Mechanical behaviour of pultruded
glass fibre reinforced polymer composites at elevated temperature: Experiments and model
assessment', Composite Structures, vol. 98, pp. 303-13.
da Costa Mattos, HS, Reis, JML, Paim, LM, da Silva, ML, Amorim, FC & Perrut, VA 2014,
'Analysis of a glass fibre reinforced polyurethane composite repair system for corroded
pipelines at elevated temperatures', Composite Structures, vol. 114, pp. 117-23.
Davies, JM 2013, 'Thermal elongation of sandwich panels', Proceedings of the ICE - Structures
and Buildings, vol. 166, no. 3, pp. 125-38.
De Monte, M, Moosbrugger, E & Quaresimin, M 2010, 'Influence of temperature and thickness
on the off-axis behaviour of short glass fibre reinforced polyamide 6.6 – cyclic loading',
Composites Part A: Applied Science and Manufacturing, vol. 41, no. 10, pp. 1368-79.
Fam, A & Sharaf, T 2010, 'Flexural performance of sandwich panels comprising polyurethane
core and GFRP skins and ribs of various configurations', Composite Structures, vol. 92, no. 12,
pp. 2927-35.
Feih, S & Mouritz, AP 2012, 'Tensile properties of carbon fibres and carbon fibre–polymer
composites in fire', Composites Part A: Applied Science and Manufacturing, vol. 43, no. 5, pp.
765-72.
Feih, S, Boiocchi, E, Mathys, G, Mathys, Z, Gibson, AG & Mouritz, AP 2011, 'Mechanical
properties of thermally-treated and recycled glass fibres', Composites Part B: Engineering, vol.
42, no. 3, pp. 350-8.
Galgano, A, Di Blasi, C, Branca, C & Milella, E 2009, 'Thermal response to fire of a fibre-
reinforced sandwich panel: Model formulation, selection of intrinsic properties and
experimental validation', Polymer Degradation and Stability, vol. 94, no. 8, pp. 1267-80.
Gibson, AG, Torres, MEO, Browne, TNA, Feih, S & Mouritz, AP 2010, 'High temperature and fire
behaviour of continuous glass fibre/polypropylene laminates', Composites Part A: Applied
Science and Manufacturing, vol. 41, no. 9, pp. 1219-31.
Gu, P & Asaro, RJ 2012, 'Skin wrinkling of sandwich polymer matrix composite panels subjected
to fire exposure', Thin-Walled Structures, vol. 51, pp. 139-46.
Hollaway, LC 2010, 'A review of the present and future utilisation of FRP composites in the civil
infrastructure with reference to their important in-service properties', Construction and
Building Materials, vol. 24, no. 12, pp. 2419-45.

92
Islam, MM & Aravinthan, T 2010, 'Behaviour of structural fibre composite sandwich panels
under point load and uniformly distributed load', Composite Structures, vol. 93, no. 1, pp. 206-
15.
Laoubi, K, Hamadi, Z, Ahmed Benyahia, A, Serier, A & Azari, Z 2014, 'Thermal behavior of E-
glass fiber-reinforced unsaturated polyester composites', Composites Part B: Engineering, vol.
56, pp. 520-6.
Li, D, Fanga, D, Zhanga, G & Hub, H 2012, 'Effect of temperature on bending properties and
failure mechanism of three-dimensional braided composite', Materials and Design, vol. 41, pp.
167 - 70.
Liu, J, Zhou, Z, Wu, L & Ma, L 2013, 'Mechanical Behavior and Failure Mechanisms of Carbon
Fiber Composite Pyramidal Core Sandwich Panel after Thermal Exposure', Journal of Materials
Science & Technology, vol. 29, no. 9, pp. 846-54.
Liu, J, Zhou, Z, Ma, L, Xiong, J & Wu, L 2011, 'Temperature effects on the strength and crushing
behavior of carbon fiber composite truss sandwich cores', Composites Part B: Engineering, vol.
42, no. 7, pp. 1860-6.
Manalo, A, Aravinthan, T & Karunasena, W 2012, 'Mechanical properties characterization of
the skin and core of a novel composite sandwich structure', Journal of Composite Materials,
pp. 1-16.
Manalo, A, Aravinthan, T, Karunasena, W & Islam, M 'Flexural Behaviour in Flatwise and Edge-
wise Positions', Composite Structures.
Manalo, AC 2013, 'Behaviour of fibre composite sandwich structures under short and
asymmetrical beam shear tests', Composite Structures, vol. 99, pp. 339-49.
Manalo, AC, Aravinthan, T & Karunasena, K 2012, 'Prediction of the Flexural Behavior of Fibre
Composite Sandwich Beams', in APIFS, 2012: proceedings of theAPIFS, 2012 Hokkaido
University, Japan.
Nardone, F, Di Ludovico, M, De Caso y Basalo, FJ, Prota, A & Nanni, A 2012, 'Tensile behavior of
epoxy based FRP composites under extreme service conditions', Composites Part B:
Engineering, vol. 43, no. 3, pp. 1468-74.
Nigro, E, Cefarelli, G, Bilotta, A, Manfredi, G & Cosenza, E 2014, 'Guidelines for flexural
resistance of FRP reinforced concrete slabs and beams in fire', Composites Part B: Engineering,
vol. 58, pp. 103-12.
Petras, A & Sutcliffe, MPF 1999, 'Failure mode maps for honeycomb sandwich panels ',
Composite Structures, vol. 44, pp. 237-52.

93
Pihtili, H 2009, 'An experimental investigation of wear of glass fibre–epoxy resin and glass
fibre–polyester resin composite materials', European Polymer Journal, vol. 45, no. 1, pp. 149-
54.
Pradeep Gudlura, Adam Fornessa, Jonathan Lentzc, Miladin Radovic & Mulianaa, A 2012,
'Thermal and mechanical properties of Al/Al2O3 composites at elevated temperatures',
Materials Science and Engineering, vol. 531, no. A, pp. 18 - 27.
Rudzinski, S, Häussler, L, Harnisch, C, Mäder, E & Heinrich, G 2011, 'Glass fibre reinforced
polyamide composites: Thermal behaviour of sizings', Composites Part A: Applied Science and
Manufacturing, vol. 42, no. 2, pp. 157-64.
Sun, Y & Gao, L 2013, 'Mechanical behavior of all-composite pyramidal truss cores sandwich
panels', Mechanics of Materials, vol. 65, pp. 56-65.
Trey, SM, Kristofer Gamstedt, E, Mäder, E, Jönsson, S & Johansson, M 2011, 'Glass fiber
reinforced high glass transition temperature thiol–ene networks', Composites Part A: Applied
Science and Manufacturing, vol. 42, no. 11, pp. 1800-8.
Wang, K, Young, B & Smith, ST 2011, 'Mechanical properties of pultruded carbon fibre-
reinforced polymer (CFRP) plates at elevated temperatures', Engineering Structures, vol. 33,
no. 7, pp. 2154-61.
Wang, YC, Wong, PMH & Kodur, V 2007, 'An experimental study of the mechanical properties
of fibre reinforced polymer (FRP) and steel reinforcing bars at elevated temperatures',
Composite Structures, vol. 80, no. 1, pp. 131-40.
Wong, PMH & Wang, YC 2007, 'An experimental study of pultruded glass fibre reinforced
plastics channel columns at elevated temperatures', Composite Structures, vol. 81, no. 1, pp.
84-95.
Wong, PMH, Davies, JM & Wang, YC 2004, 'An experimental and numerical study of the
behaviour of glass fibre reinforced plastics (GRP) short columns at elevated temperatures',
Composite Structures, vol. 63, no. 1, pp. 33-43.
Yu, B, Till, V & Thomas, K 2007, 'Modeling of thermo-physical properties for FRP composites
under elevated and high temperature', Composites Science and Technology, vol. 67, no. 15-16,
pp. 3098-109.
Zhang, Z, Chen, X & Wang, Y 2010, 'Uniaxial ratcheting behavior of polytetrafluoroethylene at
elevated temperature', Polymer Testing, vol. 29, no. 3, pp. 352-7.

94
Appendix A
Project Specification

95
Appendix B
Appendix B1 Dynamic Mechanical Analysis of the Skin

96
Appendix B2 Dynamic Mechanical Analysis of the Core

97

98
Appendix B3 Dimensions of the Skin Specimens
Specimen Results:
Specime
n #
Thickne
ss 1
mm
Thickne
ss 2
mm
Thickne
ss 3
mm
Width 1
mm
Width 2
mm
Width 3
mm
Average
Width
mm
Average
Thickne
ss
mm
1 5.22 5.22 5.22 51.54 51.54 51.54 51.54 5.22
2 4.85 4.85 4.85 51.78 51.78 51.78 51.78 4.85
3 5.06 5.06 5.06 51.19 51.19 51.19 51.19 5.06
4 5.21 5.21 5.21 51.67 51.67 51.67 51.67 5.21
5 5.09 5.09 5.09 51.38 51.38 51.38 51.38 5.09
6 5.24 5.24 5.24 51.63 51.63 51.63 51.63 5.24
7 4.72 4.72 4.72 51.41 51.41 51.41 51.41 4.72
8 4.71 4.71 4.71 51.78 51.78 51.78 51.78 4.71
9 4.72 4.72 4.72 51.47 51.47 51.47 51.47 4.72
10 5.04 5.04 5.04 51.77 51.77 51.77 51.77 5.04
11 4.67 4.67 4.67 50.10 50.10 50.10 50.10 4.67
12 5.20 5.20 5.20 51.68 51.68 51.68 51.68 5.20
13 5.09 5.09 5.09 51.55 51.55 51.55 51.55 5.09
14 5.34 5.34 5.34 51.62 51.62 51.62 51.62 5.34
15 4.95 4.95 4.95 51.75 51.75 51.75 51.75 4.95
16 4.98 4.98 4.98 51.42 51.42 51.42 51.42 4.98
17 4.90 4.90 4.90 51.20 51.20 51.20 51.20 4.90
18 4.92 4.92 4.92 51.11 51.11 51.11 51.11 4.92
19 5.09 5.09 5.09 51.58 51.58 51.58 51.58 5.09
20 4.92 4.92 4.92 51.60 51.60 51.60 51.60 4.92
21 4.84 4.84 4.84 50.90 50.90 50.90 50.90 4.84
22 4.98 4.98 4.98 51.63 51.63 51.63 51.63 4.98
23 5.21 5.21 5.21 51.65 51.65 51.65 51.65 5.21
24 4.60 4.60 4.60 50.70 50.70 50.70 50.70 4.60
25 4.92 4.92 4.92 51.56 51.56 51.56 51.56 4.92

99
26 4.67 4.67 4.67 50.94 50.94 50.94 50.94 4.67
27 5.34 5.34 5.34 51.41 51.41 51.41 51.41 5.34
28 4.78 4.78 4.78 51.13 51.13 51.13 51.13 4.78
29 5.05 5.05 5.05 51.57 51.57 51.57 51.57 5.05
30 4.96 4.96 4.96 51.75 51.75 51.75 51.75 4.96
31 4.84 4.84 4.84 51.18 51.18 51.18 51.18 4.84
32 4.88 4.88 4.88 51.16 51.16 51.16 51.16 4.88
33 4.88 4.88 4.88 51.31 51.31 51.31 51.31 4.88
34 5.43 5.43 5.43 51.40 51.40 51.40 51.40 5.43
35 4.88 4.88 4.88 51.52 51.52 51.52 51.52 4.88
36 4.70 4.70 4.70 51.19 51.19 51.19 51.19 4.70
37 4.64 4.64 4.64 51.09 51.09 51.09 51.09 4.64
38 4.86 4.86 4.86 51.53 51.53 51.53 51.53 4.86
39 5.05 5.05 5.05 51.63 51.63 51.63 51.63 5.05
40 5.08 5.08 5.08 51.73 51.73 51.73 51.73 5.08
41 5.12 5.12 5.12 51.57 51.57 51.57 51.57 5.12
42 4.68 4.68 4.68 51.24 51.24 51.24 51.24 4.68
43 4.92 4.92 4.92 51.26 51.26 51.26 51.26 4.92
44 4.55 4.55 4.55 51.24 51.24 51.24 51.24 4.55
45 5.57 5.57 5.57 51.57 51.57 51.57 51.57 5.57
Mean 4.96 4.96 4.96 51.40 51.40 51.40 51.40 4.96
Std
Dev
0.23 0.23 0.23 0.33 0.33 0.33 0.33 0.23
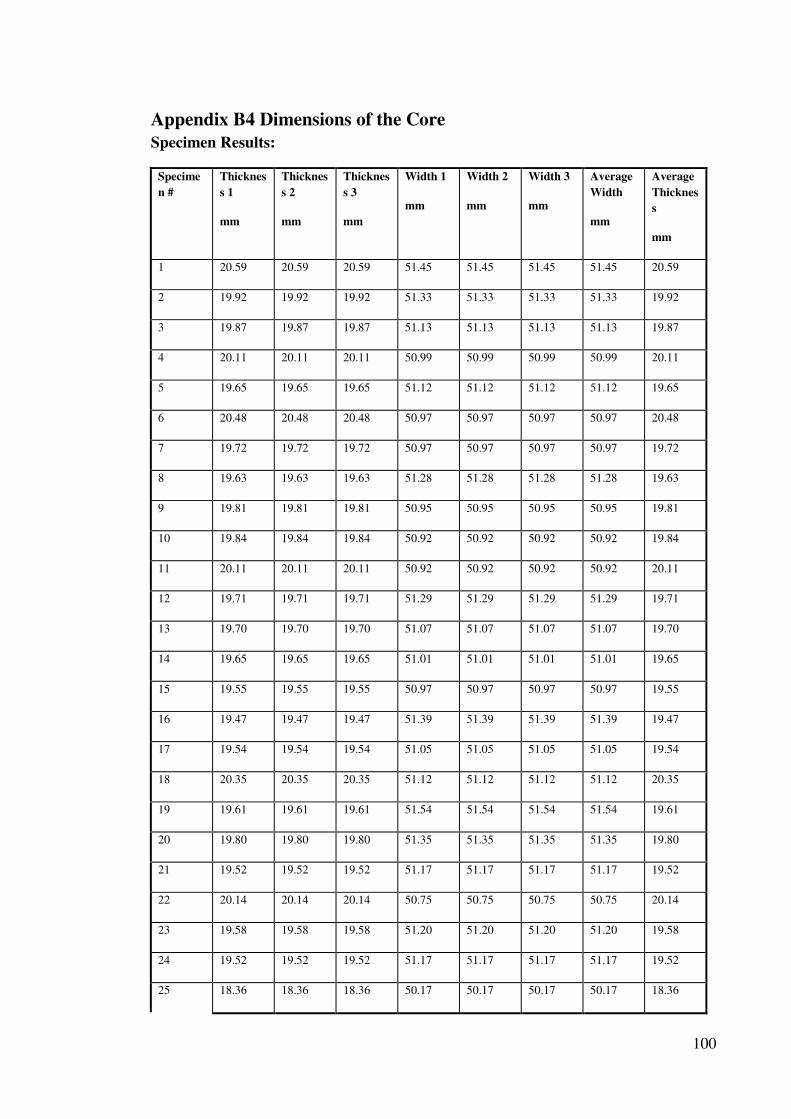
100
Appendix B4 Dimensions of the Core
Specimen Results:
Specime
n #
Thicknes
s 1
mm
Thicknes
s 2
mm
Thicknes
s 3
mm
Width 1
mm
Width 2
mm
Width 3
mm
Average
Width
mm
Average
Thicknes
s
mm
1 20.59 20.59 20.59 51.45 51.45 51.45 51.45 20.59
2 19.92 19.92 19.92 51.33 51.33 51.33 51.33 19.92
3 19.87 19.87 19.87 51.13 51.13 51.13 51.13 19.87
4 20.11 20.11 20.11 50.99 50.99 50.99 50.99 20.11
5 19.65 19.65 19.65 51.12 51.12 51.12 51.12 19.65
6 20.48 20.48 20.48 50.97 50.97 50.97 50.97 20.48
7 19.72 19.72 19.72 50.97 50.97 50.97 50.97 19.72
8 19.63 19.63 19.63 51.28 51.28 51.28 51.28 19.63
9 19.81 19.81 19.81 50.95 50.95 50.95 50.95 19.81
10 19.84 19.84 19.84 50.92 50.92 50.92 50.92 19.84
11 20.11 20.11 20.11 50.92 50.92 50.92 50.92 20.11
12 19.71 19.71 19.71 51.29 51.29 51.29 51.29 19.71
13 19.70 19.70 19.70 51.07 51.07 51.07 51.07 19.70
14 19.65 19.65 19.65 51.01 51.01 51.01 51.01 19.65
15 19.55 19.55 19.55 50.97 50.97 50.97 50.97 19.55
16 19.47 19.47 19.47 51.39 51.39 51.39 51.39 19.47
17 19.54 19.54 19.54 51.05 51.05 51.05 51.05 19.54
18 20.35 20.35 20.35 51.12 51.12 51.12 51.12 20.35
19 19.61 19.61 19.61 51.54 51.54 51.54 51.54 19.61
20 19.80 19.80 19.80 51.35 51.35 51.35 51.35 19.80
21 19.52 19.52 19.52 51.17 51.17 51.17 51.17 19.52
22 20.14 20.14 20.14 50.75 50.75 50.75 50.75 20.14
23 19.58 19.58 19.58 51.20 51.20 51.20 51.20 19.58
24 19.52 19.52 19.52 51.17 51.17 51.17 51.17 19.52
25 18.36 18.36 18.36 50.17 50.17 50.17 50.17 18.36

101
26 19.90 19.90 19.90 50.86 50.86 50.86 50.86 19.90
27 19.85 19.85 19.85 51.30 51.30 51.30 51.30 19.85
28 19.74 19.74 19.74 51.03 51.03 51.03 51.03 19.74
29 19.78 19.78 19.78 51.09 51.09 51.09 51.09 19.78
30 20.55 20.55 20.55 51.28 51.28 51.28 51.28 20.55
31 19.73 19.73 19.73 51.06 51.06 51.06 51.06 19.73
32 19.87 19.87 19.87 51.45 51.45 51.45 51.45 19.87
33 19.88 19.88 19.88 50.69 50.69 50.69 50.69 19.88
34 19.82 19.82 19.82 51.10 51.10 51.10 51.10 19.82
35 19.58 19.58 19.58 51.02 51.02 51.02 51.02 19.58
36 19.84 19.84 19.84 50.77 50.77 50.77 50.77 19.84
37 19.76 19.76 19.76 50.85 50.85 50.85 50.85 19.76
38 20.29 20.29 20.29 50.80 50.80 50.80 50.80 20.29
39 19.63 19.63 19.63 51.21 51.21 51.21 51.21 19.63
40 19.70 19.70 19.70 51.35 51.35 51.35 51.35 19.70
41 20.62 20.62 20.62 50.97 50.97 50.97 50.97 20.62
42 19.83 19.83 19.83 50.86 50.86 50.86 50.86 19.83
43 19.71 19.71 19.71 51.01 51.01 51.01 51.01 19.71
44 19.90 19.90 19.90 50.91 50.91 50.91 50.91 19.90
45 19.80 19.80 19.80 51.12 51.12 51.12 51.12 19.80
Mean 19.82 19.82 19.82 51.07 51.07 51.07 51.07 19.82
Std
Dev
0.37 0.37 0.37 0.24 0.24 0.24 0.24 0.37

102
Appendix – C
Appendix C1 Excel Results for Skin Strength and Modulus
Normalisation
Temperature °C Flexural Modulus MPa Normalised Data
21 14285.4 1
35 14648.8 1.025
50 14282.2 0.999
65 14474.6 1.0132
80 14129.8 0.9891
100 12919 0.9043
120 11777.6 0.8245
150 12447.8 0.8714
180 13828.31 0.9680
Temperature °C Flexural Strength MPa Normalised Data
21 217.84 1
35 220.39 1.0114
50 171.35 0.787
65 159.29 0.731
80 145.17 0.666
100 111.08 0.51
120 88.47 0.406
150 86.72 0.398
180 112.34 0.515

103
Appendix C2 Excel results for the Core Strength and the Modulus
Temperature °C Flexural Modulus
MPa
Normalised Data Flexural Strength
21 1330 1 14.32
35 1310.51 0.985 14.110
50 1298.268 0.976 13.978
65 1202.671 0.904 12.949
80 1045.56 0.786 11.258
100 778.167 0.585 8.378
120 492.045 0.370 5.298
150 141.019 0.106 1.518
180 39.13 0.029 0.421