flexibility in natural gas and demand
TRANSCRIPT

I N T E R N AT I O N A L E N E R G Y A G E N C Y
FLEXIBILITY IN
NATURAL GASSUPPLY AND DEMAND

I N T E R N AT I O N A L E N E R G Y A G E N C Y
FLEXIBILITY IN
NATURAL GASSUPPLY AND DEMAND

© OECD/IEA, 2002
Applications for permission to reproduce or translate all or part of this publication should be made to:Head of Publications Service, OECD/IEA
2, rue André-Pascal, 75775 Paris cedex 16, Franceor
9, rue de la Fédération, 75739 Paris Cedex 15, France.
INTERNATIONAL ENERGY AGENCY9, rue de la Fédération,
75739 Paris, cedex 15, France
The International Energy Agency (IEA) is anautonomous body which was established inNovember 1974 within the framework of theOrganisation for Economic Co-operation andDevelopment (OECD) to implement an inter-national energy programme.
It carries out a comprehensive programme ofenergy co-operation among twenty-six* of theOECD’s thirty Member countries. The basic aimsof the IEA are:
• to maintain and improve systems for copingwith oil supply disruptions;
• to promote rational energy policies in a globalcontext through co-operative relations with non-member countries, industry and internationalorganisations;
• to operate a permanent information system onthe international oil market;
• to improve the world’s energy supply anddemand structure by developing alternativeenergy sources and increasing the efficiency ofenergy use;
• to assist in the integration of environmental andenergy policies.
* IEA Member countries: Australia, Austria,
Belgium, Canada, the Czech Republic, Denmark,
Finland, France, Germany, Greece, Hungary, Ireland,
Italy, Japan, the Republic of Korea, Luxembourg,
the Netherlands, New Zealand, Norway, Portugal,
Spain, Sweden, Switzerland, Turkey, the United
Kingdom, the United States. The European
Commission also takes part in the work of the IEA.
ORGANISATION FOR ECONOMIC CO-OPERATION
AND DEVELOPMENT
Pursuant to Article 1 of the Convention signed inParis on 14th December 1960, and which cameinto force on 30th September 1961, the Organisationfor Economic Co-operation and Development(OECD) shall promote policies designed:
• to achieve the highest sustainable economicgrowth and employment and a rising standardof living in Member countries, while maintainingfinancial stability, and thus to contribute to thedevelopment of the world economy;
• to contribute to sound economic expansion inMember as well as non-member countries in theprocess of economic development; and
• to contribute to the expansion of world tradeon a multilateral, non-discriminatory basis inaccordance with international obligations.
The original Member countries of the OECD areAustria, Belgium, Canada, Denmark, France,Germany, Greece, Iceland, Ireland, Italy,Luxembourg, the Netherlands, Norway, Portugal,Spain, Sweden, Switzerland, Turkey, the UnitedKingdom and the United States. The followingcountries became Members subsequentlythrough accession at the dates indicatedhereafter: Japan (28th April 1964), Finland(28th January 1969), Australia (7th June 1971),New Zealand (29th May 1973), Mexico (18thMay 1994), the Czech Republic (21st December1995), Hungary (7th May 1996), Poland (22ndNovember 1996), the Republic of Korea (12thDecember 1996) and Slovakia (28th September2000). The Commission of the EuropeanCommunities takes part in the work of the OECD(Article 13 of the OECD Convention).
page2-16x23 8/04/02 15:20 Page 1

FOREWORD
Flexibility of natural gas supply is essential for efficient operation of the gasindustry. Gas companies have developed various flexibility tools to harmonisethe variations and fluctuations in gas demand with the relative rigidity of gassupply. These tools mainly work on the volumes of supply and demand.
Market liberalisation is changing the traditional landscape. It brings a newmarket-driven approach to flexibility. In competitive markets, new marketmechanisms are available to bring gas supply and demand into line, for examplein marketplaces where both gas and flexibility services are traded. However,inelastic demand by non-interruptible customers still needs to be covered asit arises. Traditional flexibility tools remain important for this purpose.
This book surveys the impact of market opening on flexibility tools andmechanisms. The experience in competitive markets demonstrates the changeswhich are taking place. It is important to keep track of these developments innewly opened markets and this book suggests some developments thatgovernments should particularly monitor: the parallel opening to competitionof the electricity and gas sectors and the possible impact on gas supply anddemand of the arbitrage between gas and power; the increased volatility of prices;and the responsibility of the different players.
This book is one part of a more general review by the International EnergyAgency of the security of natural gas supply in OECD countries.
This book is published under my authority as Executive Director of theInternational Energy Agency.
Robert PriddleExecutive Director
3


ACKNOWLEDGEMENTS
The main author of this book is Sylvie Cornot-Gandolphe. Ralf Dickel, Headof the Energy Diversification Division, directed the project and providedvaluable input and advice. The Director of the Long-Term Office, OlivierAppert, provided support and encouragement throughout the project. Specialthanks to all other IEA colleagues who provided comments on the analysis,statistical data and editorial oversight.
Comments and suggestions from various delegates to the Standing Group onLong-term Co-operation as well as from key experts of the gas industry aregratefully acknowledged.
5


TABLE OF CONTENTS
Foreword ............................................................................ 3Acknowledgements .............................................................. 5Table of contents .................................................................. 7
Executive Summary ............................................................. 13
■ Gas demand and supply do not always react to market signals in ways typical of other commodities ..................................... 13
■ How flexibility requirements are evolving to meet supply anddemand trends in the OECD ............................................... 15
■ Traditional flexibility tools .................................................... 18
■ The role of flexibility is evolving with market liberalisation .. 20
■ New flexibility patterns in the LNG market ......................... 22
Recommendations ............................................................... 25
■ Ensure the working of the new markets ................................ 25
■ Ensure the provision of the flexibility needed by non-interruptible customers that lack fuel-switching capacity ...... 26
■ Monitor investment performance and take action, if needed 27
1. Introduction .................................................................. 29
■ Why flexibility is needed ...................................................... 29
■ Large variations in demand; a certain rigidity in supply ........ 29
■ Different flexibility requirements by sector ........................... 33
■ Changes that come with market liberalisation ....................... 35
7

2. Supply and Demand Trends in OECD Regions andTheir Impact on Flexibility ....................................... 37
■ Introduction ......................................................................... 37
■ OECD North America ......................................................... 38
Market overview ............................................................ 38
Regulatory reforms in gas and electricity ....................... 39
Gas demand trends. ...................................................... 41
Gas supply trends .......................................................... 42
Impact on flexibility ...................................................... 42
■ OECD Europe ..................................................................... 43
Market overview ............................................................ 43
Regulatory reforms in gas and electricity ....................... 44
Gas demand trends ....................................................... 45
Gas supply trends .......................................................... 46
Impact on flexibility ...................................................... 50
■ OECD Pacific ...................................................................... 51
Market overview ............................................................ 51
Regulatory reforms in gas and electricity ....................... 51
Gas demand trends ....................................................... 53
Gas supply trends .......................................................... 54
Impact on flexibility ...................................................... 54
3. Flexibility Tools in Traditional Markets .................... 57
■ Introduction ......................................................................... 57
■ Flexibility of supply .............................................................. 58
Flexibility in gas production and imports ...................... 58
Access to spare capacity at import and transportationfacilities.......................................................................... 63
■ Storage ................................................................................. 64
Functions and characteristics ......................................... 64
8

Storage development in IEA .......................................... 65
Line-pack ...................................................................... 68
Storage at LNG terminals .............................................. 68
■ Demand side measures ......................................................... 69
Interruptible contracts. .................................................. 69
Fuel-switching ............................................................... 70
Demand-side reaction to price signals ........................... 73
■ Conclusion on the current state of flexibility ........................ 75
4. Market Liberalisation: A New Context for Flexibility .......... 77
■ Introduction ......................................................................... 77
■ The emergence and development of gas trading .................... 78
Marketplaces: new hubs ................................................ 78
Spot and futures markets ............................................... 81
Emerging trends in Continental Europe ........................ 85
■ New forms of flexibility and the changing role of gas storage .. 88
Unbundled services ....................................................... 88
The new functions of underground gas storage ............. 90
Forces favouring storage use – the US and UK experiences ............................................................. 92
Storage and liberalisation in Continental Europe .......... 93
■ Electricity-gas arbitrage at hubs ............................................ 95
5. The role of LNG in Flexibility .................................. 99
■ Introduction ......................................................................... 99
■ International LNG trade ...................................................... 99
Global trends ................................................................ 99
Regional trends ............................................................. 101
■ Deregulation of Asian and European LNG markets .............. 103
9

■ New trading arrangements .................................................... 105
Swap agreements ........................................................... 105
New contractual terms .................................................. 106
Arbitrage: The development of Transatlantic LNG trade .................................................................... 107
Spot sales ...................................................................... 108
■ Pricing development ............................................................. 110
■ Driving forces in the development of an LNG spot market .. 112
Spare capacity at liquefaction plants .............................. 113
Shipping issues .............................................................. 114
Regasification terminals ................................................ 115
■ A global LNG market? .......................................................... 116
IEA Countries Annexes ........................................................ 117
Australia ............................................................................ 121Austria .............................................................................. 127Belgium ............................................................................. 132Canada ............................................................................. 138Czech Republic .................................................................. 146Denmark ............................................................................ 150Finland .............................................................................. 155France ............................................................................... 159Germany ........................................................................... 165Greece .............................................................................. 173Hungary ............................................................................ 176Ireland ............................................................................... 180Italy ................................................................................... 185Japan ................................................................................ 192Korea ................................................................................ 200Luxembourg ....................................................................... 205
10

Netherlands ....................................................................... 208New Zealand ..................................................................... 214Norway ............................................................................. 218Portugal ............................................................................. 222Spain ................................................................................ 226Sweden ............................................................................. 232Switzerland ........................................................................ 234Turkey ................................................................................ 237United Kingdom ................................................................. 243United States ...................................................................... 252
Glossary of Terms and Abbreviations................................... 261
References.......................................................................... 269
11

LIST OF TABLES IN TEXT
Table 1 Breakdown of Gas Consumption by Sector (2000 data) 30Table 2 Underground Gas Storage in IEA Countries in 2000 ... 67Table 3 LNG Regasification Terminals in Operation in IEA
Countries in 2000 ........................................................ 69Table 4 Multi-Fired Electricity Generating Capacity in IEA
Countries at 31 December 2000 .................................. 72Table 5 Flexibility in IEA Countries in 2000 ............................ 74Table 6 Main Characteristics of Regional LNG Markets
in 2001 ........................................................................ 101Table 7 LNG Spot and Swap Transactions - 1992 to 2001 ....... 108
LIST OF FIGURES IN TEXT
Figure 1 European Monthly Gas Production ............................. 59Figure 2 European Monthly Gas Imports from the Netherlands,
Norway, Algeria and Russia (1995-2000) ..................... 59Figure 3 Groningen Production Profile in 2000 ......................... 60Figure 4 UK Swing Gas Production ........................................... 61Figure 5 Norwegian Monthly Gas Production (1993-2001) ...... 62Figure 6 IEA Fuel-Switching Capabilities (1999 data) ............... 71Figure 7 Spot and Forward Prices in UK and US ....................... 84Figure 8 Existing and Possible Gas Hubs in Europe ................... 88Figure 9 Evolution of LNG Trade .............................................. 100Figure 10 Evolution of LNG Prices in the United States, Europe
and Japan ..................................................................... 112
LIST OF BOXES IN TEXT
Box 1 Flexibility in Long-Term Contracts .............................. 48 Box 2 Groningen, a Swing Supplier for Europe ...................... 60 Box 3 US Market Centres and Hub Services .......................... 80Box 4 Gasunie Flexibility Services .......................................... 89Box 5 Impact of Storage Levels on Gas Prices: Recent US
Experience .................................................................... 92Box 6 Gas-Power Arbitrage and Prices in
the United Kingdom .................................................... 96
12

EXECUTIVE SUMMARY
GAS DEMAND AND SUPPLY DO NOT ALWAYS REACT TOMARKET SIGNALS IN WAYS TYPICAL OF OTHER COMMODITIES
Gas demand reacts only partially to price signalsIn commodity markets, supply and demand are normally balanced by theprice mechanism. Buyers and sellers react to price signals given by the market.The need for flexibility of volume – the ability to add to supply or reducedemand – reflects the nature of the commodity. In gas markets, demand is notparticularly flexible. Most residential and commercial customers are unable toswitch easily to alternative fuels. Once gas consumers have committed to usinggas as a fuel and have invested in gas-fired equipment, they cannot then changequickly to other fuels. Furthermore, these customers cannot store gas. Theytherefore cannot react easily to market signals such as a sudden price increase.In other words, these customers have a rather price-inelastic demand.
On the other hand, industrial gas customers equipped with bi-fuel equipmentor power generators linked to the power grid can replace gas on a short-termbasis, in response to price signals. However, in markets where the price of gasis linked to the price of replacement fuels, these customers actually have littleincentive to switch to another fuel. This is indeed the case for many Europeanindustrial customers, who as a result have little incentive to maintain costlybivalent equipment. Where industrial consumers do hold stocks of alternatefuels, they usually hold only enough fuel to cover short periods of gasinterruption, thus limiting the scope and effect of fuel-switching that maytake place.
Gas supply does not always react to price signals eitherIn most parts of the world, gas production and transportation require largeinvestments because of difficult geological conditions of extraction andproduction and the increasing distances over which gas must be transportedfrom wellhead to market. In addition, once a gas project is planned out andthe necessary investment funds are committed, the project’s carrying capacityis usually fixed. This is particularly so because gas infrastructure takes a
13

considerable time to construct and bring on line, and therefore additions aregenerally made in major increments over time, as individual projects areinitiated, constructed and completed. In traditional markets, major investmentsof this sort are most often handled by large utilities. It is important for utilitiesto conclude additional long-term delivery and transportation contracts withgas suppliers and transporters in order to keep up with increasing demand andto retain sufficient flexibility to adapt to fluctuations in that demand.
In liberalised markets, supply reacts to price signals sent by the market. Thismeans an optimum use of spare capacity. Higher prices will also triggerinvestments into additional production capacity, as suggested above. But evenin liberalised gas markets, flexibility of supply still has distinct limits. In theUnited States, for instance, when gas prices are high, producers increase theirdrilling. However, it takes about 18 months before such new drilling translatesinto additional production capacity. The time lag can be even longer for large,capital-intensive projects, such as LNG terminals and long-distance pipelines.Moreover, when more than one country is involved in the gas chain, price signalsgiven by the market in a consuming country will not always translate into newinvestment in exploration, production and transport capacity in supplyingcountries.
Flexibility is an essential component of supplysecurity
Residential and commercial gas demand is seasonal, temperature-dependent andinelastic. It must be covered as it arises. To respond to such variations requiresflexibility. Flexibility here means the ability to adapt supply to foreseeablevolume variations in demand (mainly seasonal) and to adjust for erraticfluctuations in demand (mainly short-term temperature variations), or to adaptdemand (i.e., reduce it) when supply is insufficient. Flexibility is achievedthrough physical instruments and contractual arrangements that anticipatelikely variations in demand and balance the volume of gas supply and demandat any time. Physical instruments include variable supply in production andimport contracts, gas from storage and line-pack. Contractual arrangements cantake the form of contracts with “interruptible customers” that allow interruptionof their supply at agreed times. Liberalised markets bring a new market-drivenapproach to flexibility that supplements the traditional flexibility tools.
The notion of flexibility is usually linked both to volumes and to delivery ortransmission capacities. The latter are becoming more critical because the
14

unbundling of the supply and transmission businesses creates a new risk –that a transmission network’s capacity will not always be sufficient to carry allthe available supply. Thus, flexibility to produce a certain amount of additionalsupply is not in itself sufficient to meet unexpected requirements. Enoughextra capacity must be available on the transmission grid to transport thisincrement in a timely way. Recently, balancing supply and demand by market-based mechanisms has become an important feature. Throughout this survey,however, the term flexibility refers to flexibility in volumes and capacitiesaimed at balancing supply and demand.
HOW FLEXIBILITY REQUIREMENTS ARE EVOLVING TO MEETSUPPLY AND DEMAND TRENDS IN THE OECD
Increasing gas demand in all three OECD regionsrequires additional investment to meet greaterfluctuation in demand. The ability to respond variesfrom region to regionOECD gas demand is expected to increase rapidly during the next 30 years. Thedriving force will be increased use of gas in power generation, mainly in combined-cycle gas turbine power plants. Residential, commercial and combined heat andpower sectors are also expected to increase their gas consumption. Becausedemand from these sectors is highly sensitive to temperatures, fluctuations in gasdemand will be larger in the three OECD regions as demand increases.
On the other hand, supply to the three regions will remain fairly rigid. Worldgas reserves are concentrated in only a few regions and countries, mainlyoutside the IEA. As a result, most IEA countries will become increasinglydependent on imports from more distant sources. Further diversification ofsupply sources and the increased use of flexibility instruments will be requiredto avoid vulnerability to specific supply sources and routes as well as undueexposure to specific supply risks.
An important issue is whether adequate and timely investment in upstreamproduction and transportation capacity will be triggered by market signals assupply gaps develop. The answer differs fundamentally from one OECDregion to another. For decades, the reserves-to-production ratio in the US hasbeen just 7-8 years, as new reserves were developed “just in time”. Acceleratingdepletion rates may make this more challenging. In the recent past, circumstances
15

in the UK resembled those in the US, but this may change, as resources on theUK Continental Shelf are now on the decline. Continental Europe and Japanhave long relied on long-haul imports of pipeline gas and LNG, with long-termcontracts that, in effect, underpin the capital investment in supplier countriesmainly outside the OECD.
In OECD North America, gas-to-gas competition has developed. Supply anddemand are matched by market mechanisms, and several different flexibilitytools compete on the market. The market is liquid and self-sufficient, andcustomers can always buy flexibility on the market, although prices for theseservices can be high.
The UK is in a similar position, with a fully liberalised, competitive andcurrently self-sufficient gas market. So far, UK gas supply has reacted to pricesignals sent by the market. With the depletion of gas reserves, however, thecountry’s ability to meet its own needs for flexibility is likely to decline.
In Continental Europe, a high level of flexibility is in place. However, thecapability to cope with any substantial supply disruption has never had to betested. For now, gas oversupply and some spare capacity in the gas transmissiongrid allow a great deal of flexibility of supply, although the situation varies widely among European countries. There are some bottlenecks on the EUtransportation network, and some countries rely on just one source of supplyand so enjoy little supply flexibility.
Many Continental European countries have ample storage capacity, enoughto supply the market for several months. Here again, though, there are largedifferences among countries. Italy, for instance, has a highly adaptable systemthat includes a large amount of strategic storage to deal with supply interruptions.Other countries, however, use storage only for balancing and some countrieshave little or no storage capacity at all.
The introduction of competition, with third-party access1 in the gas sector, hasfostered market mechanisms to match supply and demand. However, becauseof Europe’s large and increasing import dependency on long-haul gas, traditionalflexibility instruments (such as flexibility in production and import contracts,storage and interruptible contracts) will remain vital. Increasing demand willgradually reduce spare capacity in transportation and supply. More storagecapacity and more interconnection among the gas grids thus will be required.The new ways in which the liberalised market will assist countries in meeting
16
1 Third-party access (TPA) is the right or opportunity for a third party (shipper) to make use of the transportationor distribution services of a pipeline company to move gas for a set or negotiated charge.

their flexibility requirements will effectively supplement the extended use oftraditional instruments of flexibility.
Improved interconnection of the gas transmission network will be an importantfactor in enhancing flexibility and security. It can allow additional gas to betransported in the short term from one market to a nearby one – for example,when extreme weather in one market coincides with mild weather in another.
In the OECD Pacific region, the two LNG-importing countries, Japan andKorea, have very different seasonal profiles. Japan, which uses large amountsof gas to generate electricity but does not rely directly on it for space heating,is less subject to seasonal variations than is Korea, which uses less gas overallbut does use it mainly for space heating. Both countries have developed severaltools to ensure flexibility and security of supply in their gas systems. Japan relieson a combination of several means, such as modular supply and deliverysystems that limit dependence on any single installation, along with opportunitiesfor fuel substitution and sharing via the electricity generation system. Korearelies heavily on buying spot LNG cargoes to cover its peak winter demand.In the future, seasonal variations are likely to increase as a result of increaseduse of gas in the residential and commercial sectors in both countries, and forupper and middle load production in the power generation sector in Japan. Thistrend will have to be met by increased flexibility of supply.
Flexibility requirements continue to differ betweenthe three regions, and their use of flexibilityinstruments varies commensuratelyFlexibility requirements and mechanisms differ greatly from one OECD regionto another, and from one country to another, depending on the state of marketliberalisation, the demand structure, the share of gas in the energy mix, theexistence and size of national gas resources, and the diversification of supply.Moreover, flexibility needs and mechanisms are not static. They evolve withtime. For instance, flexibility in supply declines when a major gas field, as itis depleted, can no longer offer above-average monthly deliveries, or “swing”(here defined as the maximum gas monthly delivery divided by the averagemonthly delivery in a given year).
The variations in flexibility provisions at present are illustrated by the case studiesof IEA countries presented in annexes. They can be categorised as follows:
■ producing countries with short-haul transportation, such as the Netherlands,where flexibility in demand is met by variations in production;
17

■ producing countries with a long-distance transportation grid, such as theUnited States, where flexibility in demand is provided by storage andinterruptible contracts;
■ importing countries that meet flexibility requirements by flexibility inimporting contracts, as in Belgium;
■ importing countries that meet flexibility requirements mostly by storage,as in France;
■ importing countries that meet flexibility requirements by a combinationof flexibility in production, import contracts and storage, such as Germany;and
■ LNG-importing countries with high seasonal variations in demand, suchas Korea, that achieve flexibility through medium-term contracts andspot LNG cargoes.
TRADITIONAL FLEXIBILITY TOOLS
A variety of tools is available to balance supply and demand for gas at any time.These tools fall into three categories: those aimed at increasing supply flexibility,those that provide buffer stocks and those that reduce demand at times ofpeak gas use.
The supply sideOn the supply side, the obvious response to a sudden need for additional gasis to increase one’s own gas production, if possible, and to increase the volumeof gas received under domestic or import purchase contracts, if possible, withinany entitlement not fully used. In Europe, the Dutch gas field, Groningen, hasplayed the role of the swing supplier, thanks both to its geological characteristicsand to its proximity to the main European markets.
Imports by pipeline from remote areas offer very limited swing, because of thehigh share of fixed transportation costs. This is typically the case for gas receivedin Europe from outside the EU or for Canadian gas imported into the US.Although LNG supplies in the Pacific area were very rigid in the early days ofLNG trade, they have recently become more flexible thanks mainly to theexistence of spare capacity at new liquefaction plants.
In many gas systems, hourly variations in demand can often be balanced outby line-pack (i.e., by raising the pressure within a gas pipeline system above the
18

required delivery pressure in order to increase the system’s storage capability).The role that line-pack plays in balancing differs significantly among countriesaccording to the differing designs of their transmission grids and to theirparticular supply patterns. For instance, in the United Kingdom, line-pack hastraditionally been able to meet incremental demand of up to 3% of totaldemand, but in Spain the figure is just 0.4%.
Storage facilities also play an important role in providing flexibility to meetseasonal variations, to cover unforeseen changes in demand and in somecountries as a back-up in case of supply interruptions. In traditional markets,withdrawals from storage facilities have been the major instrument used toprovide supplementary gas supplies when the country’s own production orcontract flexibility are insufficient to bridge the gap. LNG receiving facilitiesalso offer supply flexibility and storage possibilities for LNG-importing countriesbeyond the flexibility offered by the import contracts.
OECD North America and Europe have ample storage capacity. North Americahas 453 underground gas storage facilities, representing 17% of annual gasconsumption; OECD Europe has 94, representing 13%, but distribution ofstorage is uneven across the market. Storage helps to balance rigid gas suppliesand seasonal demand while minimising the size of the pipelines needed andthe transportation costs. Some European companies also maintain strategicreserves beyond their commercial requirements for security-of-supply reasons.In North America, storage is increasingly used for trading purposes.
The demand sideOn the demand side, gas suppliers often conclude interruptible contracts withlarge industrial consumers and power generators. In return for a discount onthe price they pay for gas, these customers take on a contractual obligation tostop taking gas under specified conditions usually linked to outside temperatures.Interruptible customers may install dual-fired capacity so that they can switchfrom gas to alternative fuels in times of interruption, or – in the case of gas-fired power generation – they may arrange for back-up supplies of electricityfrom the grid. Alternatively, of course, they may simply stop their gas-basedoperation in response to a contractual interruption.
Not all these tools are available or used in every IEA country. The annexes tothis study detail seasonal gas demand in each IEA country and the way it isbalanced by traditional flexibility tools.
19

At present, supply flexibility, volumes of storage and the number of interruptiblecontracts are high in the IEA countries – although the situation differs forindividual countries. The current situation generally provides a sufficient basisfor flexibility of supply in relation to overall demand, although there remainquestions about the practical limit of interruptible contracts.
THE ROLE OF FLEXIBILITY IS EVOLVING WITH MARKETLIBERALISATION
The development of trading hubs as commoditymarketsWith markets opening to competition, price is becoming a new instrument tobalance supply and demand. Open access to infrastructure has given birth tomarketplaces for gas. Trading hubs will generally emerge where several pipelinesmeet, often near storage sites and areas of high demand. In the UK, the entirenational grid has become a virtual single market for gas. Spot markets haveevolved along with these trading hubs.
In the United States and Canada, the regulatory reforms of the 1980s and 1990sfostered market hubs and centres where gas, transportation and storage rightsare traded among a diverse group of market participants. At least 39 centresare now operating in North America. Some hubs have grown into full-fledgedcommodity markets, initially spot trading for prompt and forward delivery, andlater for financial instruments such as futures and options.
In Continental Europe, third-party access prompted the development of thefirst trading centre, Zeebrugge in Belgium. Zeebrugge is the landing point ofthe UK-Belgian Interconnector and the Norwegian Zeepipe, and it also hasan LNG terminal. A second hub is emerging at Bunde in Germany, close tothe gas delivery point for Dutch and Norwegian gas in Germany.
More choice and responsibility for the consumerWith third-party access and unbundling of businesses, buyers may not onlychoose their supplier but may also choose to buy different services à la carteinstead of a standard menu of services. With the unbundling of services,opportunities open up for trading not only gas but also other services, including
20

back-up and seasonal flexibility. The Dutch company Gasunie was the first ofthe Continental gas companies to offer such unbundled services à la carte. Mostother gas companies have followed suit. This in turn has led to the emergenceof a market for flexibility services, which are offered and priced independentlyfrom the gas.
Eligible customers – gas users that meet criteria specified in the EU GasDirective or in national legislation, such as a minimum volume of gas consumedper year, have the right to choose their supplier and request third-party accessto the grid – will have to assume increasing responsibility for their flexibilitychoices. They may, for example, have to face the fact that interruptible contractswill increasingly be interrupted. If the market is sufficiently liquid, customerscan always obtain the gas and flexibility services they want at short notice,although possibly at a higher price.
Better use of infrastructure and the effectiveness of price signalsLiberalised markets offer incentives to use infrastructure very intensively. In theUnited States, production, transport and storage are increasingly used at nearlyfull capacity. Pipeline utilisation rates in parts of the West have recently beenwell above 95% on a continuing basis.
Lack of supply and pipeline capacity can result in price hikes during peakperiods. Sudden price hikes for gas may be a warning signal that supply capacityis not sufficient to cover the inelastic demand or unanticipated demand surges.
The new role of storageStorage is one of several instruments providing flexibility. In liberalised gasmarkets, it competes with other flexibility services and instruments, such assupply flexibility, interruptible contracts, line-pack and LNG peak-shavingunits. The market can now value the services provided by storage.
Storage is acquiring a new role as additional storage services appear. Thetraditional functions of meeting seasonal demand fluctuations, using the gridmore efficiently and providing security of supply are still valid. In liberalisedmarkets, storage will also play roles in price hedging and as a trading tool,allowing players to exploit price differentials. Governments will need to assesswhether commercially motivated storage will meet the broader security needsof national energy policy.
21

Arbitrage between gas and power marketsThe parallel opening of the electricity and gas markets provides a new market-driven method of balancing supply and demand. With the increased use of gasfor power generation and the opening of the electricity grids to competition,gas demand becomes more price elastic in the short term. The short-termprice elasticity of gas demand increases further as the gas grid is opened tocompetition.
With the development of marketplaces in both the gas and electricity sectors,arbitrage between gas and power has become possible and is increasingly used.Through arbitrage between gas and electricity markets, gas demand and supplycan be balanced by cross trading for supply and demand in the electricitysector.
Electricity producers optimise their fuel input and electricity output accordingto the prices of both. Generators can resell gas they have bought under long-term contracts and buy electricity from the grid when doing so can provide ahigher yield than if the gas were used to produce power. This practice ofarbitrage is still quite new in the US and the UK. It will certainly spread toContinental Europe.
In the US and the UK, increased use of natural gas for power generation hascaused gas prices and electricity prices to influence one another. Developmentsin the electricity market and arbitrage between gas and power greatly affectflexibility needs and the availability of gas. Yet, winter peak in electricitydemand often corresponds with the peak in gas demand for heating purposes,which could lead to systemic problems. Ensuring a secure supply of electricityand gas to the final consumers now requires close monitoring of both theelectricity and gas markets and the potential for interactions between them thatresult from arbitrage.
NEW FLEXIBILITY PATTERNS IN THE LNG MARKET
Several factors are changing LNG markets, bringing new challenges andopportunities to both buyers and sellers. Cost reductions in liquefaction plantshave made it possible for investors to secure financing by selling only part ofplanned capacity under long-term contracts while retaining some non-committed capacity to be sold spot or short-term or long-term at a later date.The increasing number of LNG tankers – the fleet’s capacity will be increased
22
by half in the next two to three years – has led to a more fluid market in LNGtransportation. Spare capacity and third-party access to receiving terminalsfurther increase liquidity.
New ways of conducting LNG trade are emerging. Spot and short-termtransactions are increasing. Swap agreements are developing and arbitragebetween regional markets is taking place to capture the price differentialsbetween markets. An additional element of flexibility is likely to appear basedon the fact that seasonal patterns in LNG demand vary from one importingcountry to another. Parts of the LNG business are moving away from bilaterallong-term contracts towards a structure that is more flexible and more responsiveto market signals.
LNG buyers may now meet part of their flexibility needs directly on the LNGmarket. They may do so through spot transactions, for uncovered winter peakdemand, or through swaps agreements with other regions or other customers.
Traditional long-term LNG contracts are gradually being complemented byLNG transactions that are more flexible in timing and location. Thesetransactions are starting to serve as transmitters of price signals between regionalgas markets. LNG spot trading, which represented 8% of global LNG tradein 2001, will develop further, but it will not replace long-term deals entirely,as these deals will underlie new project investment. In any event, chances arethat a global LNG market, such as those for oil or coal, will gradually emergeas LNG trade expands and involves more players.
23


RECOMMENDATIONS
The opening of the gas sector has created a situation in which parts of demandand supply are balanced by the price mechanism. It also led to the developmentof flexibility services that are traded in a competitive environment and aretherefore valued by the market. Yet, customers with no fuel-switching capabilitiesand whose demand is price-inelastic still need secure, uninterrupted supply.Providing that supply requires clear responsibilities and adequate flexibilityinstruments. In the current context, the impact on flexibility in the gas sectorof sectors that are intertwined with it – mainly the electricity sector – must beconsidered. Governments need to (1) ensure that the new markets can workin an unimpeded and efficient way; (2) define clear roles and responsibilitiesfor providing the flexibility necessary to meet the varying demand of customerswith no price elasticity; and (3) monitor the overall operational and investmentperformance of the gas sector in providing such flexibility and, if necessary, taketimely action using market mechanisms.
The following recommendations apply in general, but the emphasis on specificrecommendations differs greatly among the three IEA regions and betweencountries within a region. They vary by the degree of liberalisation of gas (andelectricity) markets as well as by demand structure and supply options in theparticular cases.
ENSURE THE WORKING OF THE NEW MARKETS
■ Governments should allow market players to develop marketplaces andflexibility services as the market players see fit. Governments should providea clear framework and instruments of control to prevent players fromabusing their market power and to achieve other objectives of governmentpolicy. They should especially monitor the risk and impact of newly evolvingfinancial instruments.
■ Governments should ensure that flexibility services are offered on a non-discriminatory basis. While the instruments that provide flexibility, such asstorage or production, are not natural monopolies, there may be marketstructures for flexibility services that are de facto monopolies or that maybe dominated by just a few players. In such cases, third-party access or
25

obligatory divestiture may be required to develop a market for flexibilityservices.
■ Given the strong links between the gas and power markets, governmentsshould ensure overall consistency in the regulation of both markets.
■ Governments should work to streamline the formalities of building LNGterminals within their jurisdiction, including the efficiency of environmentalreviews. Governments might consider how to improve the efficiency andeconomies of international LNG trade by fostering more technicalstandardisation and a common trading framework.
ENSURE THE PROVISION OF THE FLEXIBILITY NEEDED BY NON-INTERRUPTIBLE CUSTOMERS THAT LACKFUEL-SWITCHING CAPACITY
■ Inelastic demand by non-interruptible customers must be covered.Governments should define minimal criteria and clear rules for who has toprovide the necessary flexibility to meet such demand, and they shouldspecify how it should be paid for.
■ Governments should see that enough flexibility is provided to coverfluctuations and variations of non-interruptible customers’ consumption.Governments should ensure that market players responsible for providingsuch flexibility have the necessary capacity and volumes to meet the definedcriteria.
■ Governments should take into account the increasing convergence betweenthe gas and electricity sectors and the possibility of the convergence ofthreats to the security of supply emerging in both systems. Special attentionshould be paid to systemic failures, especially in extreme weather conditions,and to the effects of short-term swapping of gas between the two systemsthrough arbitrage.
26

MONITOR INVESTMENT PERFORMANCE AND TAKE ACTION, IFNEEDED
■ Governments should monitor the overall investment performance of the gassector, and where they detect forthcoming shortages of flexibility, theyshould identify policy action that builds on market mechanisms to theextent possible. Governments should take into account the interaction offlexibility in the gas and electricity sectors and their collective impact oninvestment needs.
■ Gas importers should create conditions that will induce private investorsto invest in gas production, export and cross-border transportation and toexpand access to reserves. Measures might include long-term contracts orjoint ventures to market or produce the gas.
■ Balancing supply and demand by the price mechanism may lead to volatilityif supply is tight and can not respond to market signals. Governmentsshould identify policies that will stimulate investment into the entire gaschain. Governments should seek to mitigate technical or regulatorybottlenecks that inhibit flexibility. Here, as elsewhere, they should preventany abuse of market power.
27


INTRODUCTION
WHY FLEXIBILITY IS NEEDED
In commodity markets, where demand is price sensitive, supply and demandare usually balanced by the price mechanism. Buyers and sellers react to pricesignals from the market. Volume flexibility, the ability to add supply or withholddemand, is not normally needed to match supply and demand.
But, for many gas customers, especially households, things are very different.Once they have chosen gas-fired equipment, they cannot alter their decisionin the short run. What they want is reliable, uninterrupted gas supply that variesaccording to their needs. Most of these customers use gas mainly for heating.Since their gas use depends directly on the weather, they have little or nocontrol over when they use it, although they can and do choose to have moreor less heating. The inconvenience and discomfort that occur when theirvolume requirements are not met is very high compared to the price of the gas.As a result, their demand is relatively price-inelastic. On the other hand,industrial customers equipped with bi-fuel equipment or power generatorslinked to the power grid, do have the possibility of replacing gas on a short-term basis. In markets where the price of gas is linked to the price of thereplacement fuels, however, customers have little incentive to reduce their gasdemand by switching to another fuel. Under these circumstances supply anddemand are often matched by the use of flexibility instruments, which adjustvolumes on the supply side and to a smaller extent on that of demand.
In liberalised gas markets in the US and UK, the price mechanism has beenplaying an increasing role in making supply and demand match short-term.The household sector, however, still needs volume flexibility to meet variationsand fluctuations in demand.
LARGE VARIATIONS IN DEMAND; A CERTAIN RIGIDITY IN SUPPLY
Natural gas plays a growing role as an OECD energy source. OECD gasconsumption reached 1,369 bcm in 2000 which represented 22% of totalprimary energy supply, up from 19% in 1980. Within twenty years, gas
29
1

consumption has increased by almost 50%. This can be explained by the intrinsicproperties of natural gas (clean combustion, easy handling, efficiency, flexibility),and by its abundant reserves (178 tcm of global proven reserves as of 1 January2002, representing 60 years of production at current rates). Gas meets someenvironmental concerns, as the effects of its use on the air and climate are lessthan those of other fossil fuels. Gas is price competitive and its attraction has beenenhanced by the development of high-performance technologies, in particulargas turbines and combined-cycle gas turbine power plants.
Unlike oil, which is primarily used in the transportation sector, gas is mainlyused for stationary purposes at a fixed site, such as space heating in residentialand commercial buildings, as a feedstock for the petrochemical industry, asprocess gas, to produce steam for industrial purposes and for power generation.Residential and commercial sectors absorb 35% of OECD gas consumption,the figure reaching 40% in OECD Europe, 34% in OECD North Americaand 23% in OECD Pacific. Natural gas has been increasingly used to generateelectricity although the share of power generation based on gas varies largelyamong IEA countries from zero in Norway to 55% in the Netherlands. Thereare important differences in gas-consumption patterns in the three OECDregions, as illustrated in the following table.
30
Table 1: Breakdown of Gas Consumption by Sector (2000 data)
OECD Total North America Pacific Europe
bcm % bcm % bcm % bcm %
Residential/ 483.85 35 263.70 34 28.28 23 191.87 40Commercial (1)
Industry, 347.29 25 182.24 24 24.85 20 140.19 30including RawMaterial
Power 391.78 29 210.81 27 66.86 53 114.11 24Generation (2)
Others (3) 145.80 11 113.38 15 5.53 4 28.91 6
Total 1,368.72 100 768.13 100 125.52 100 475.08 100
(1) Including agriculture.(2) Including combined heat and power generation.(3) Energy sector, district heating (accounting for 7 bcm in 2000 for the OECD as a whole),
transportation sector and distribution losses. Source: IEA (2002b).

Where gas is heavily used for space heating, total gas demand varies stronglywith outside temperatures. In France, for example, consumption between theannual peak-load days and those with the lowest demand can vary by an orderof magnitude. The French industry’s maximum daily dispatch of 2.42 TWhor 210 mcm, was recorded on 2 January 1997. On that day, storage facilitiessupplied 52% of the demand.
Two aspects of variability on the demand side need to be distinguished:
(1) Variations due to demand patterns, which repeat themselves at regularintervals. The leading example is seasonality, but there are also patternsinduced by social habits, such as vacation periods or weekly work schedules.These resulting demand variations are to a large extent foreseeable.
(2) Variations due to exogenous forces, mainly from fluctuations in temperature,which trigger a corresponding fluctuation in the demand for heating orcooling. While it is predictable that winter days are colder than summerdays, each winter day may vary in temperature in an unforeseeable way.
The flexibility required to meet repetitive demand variation is foreseeable, sothat economic decisions can be taken with some certainty. But the flexibilityrequired to meet unexpected fluctuations takes on the character of a physical-risk insurance. It requires economic decisions to be taken in the face of greateruncertainty. Residential and commercial customers rightly expect that gas willbe supplied even on the coldest winter day. Back-up systems are too expensivefor these customers and an interruption of gas supplies on such a day wouldcause unacceptable discomfort, and possibly real damage. In addition, if gasdistributors were unable to guarantee supply in extreme conditions, alternativefuels such as heating oil would gain tremendous competitive advantage, whichcould probably not be offset by lower gas prices. Therefore, the gas industryis required to take precautions to be able to meet the coldest day of winterdemand by non-interruptible customers, without knowing when or how oftenthat case will occur. Data on past temperatures are usually available for severaldecades as well as models reflecting consumers’ reactions to different weatherconditions. But the investment required to meet such cases may only berecovered by charging a risk premium to customers requiring such security ofsupply.
Gas suppliers must cover a seasonally-determined and temperature-dependentdemand, which is price inelastic and which must be covered as it arises. Thereare additional flexibility requirements on the supply side to anticipate
31

interruption due to technical, contractual or political reasons, or even becauseof labour-management friction.
In this study, the term “flexibility” refers to the capability to change gas volumesover defined time-periods. Flexibility may be used to adapt supply to variationsand fluctuations in demand or to adapt elements of demand in the case ofinsufficient supply.
In the past, the provision of flexibility did not affect the price of the gas, as theflexibility was included in the service offered by the supplier to its customerand its cost was rolled into the price of the gas.
In the new liberalised gas markets, marketplaces for gas (hubs) develop, wheregas supply and demand is balanced by price. The various elements of flexibilityare becoming distinct services to adapt supply or demand and as such have adistinct value or price of their own, determined by the market. These costs offlexibility may not be automatically rolled into the price of the gas delivered.
To provide flexibility, gas suppliers resort to flexibility tools designed to meetthe varying and fluctuating volumes demanded hourly, daily, monthly andannually. Three main categories of flexibility tools are available:
■ Providing large enough supply capacity to meet the highest possibledemand. That can be done by own investment into production andtransportation capacity or by contracting the respective production andtransportation capacity;
■ Providing of storage capacity in underground storage or LNG tanks tobalance variations in demand;
■ Arrange for customers to reduce or stop their offtake of gas at the requestof the supplier according to a contractual scheme. In return the customergets a more favourable gas price.
Gas suppliers will optimise their portfolio of flexibility instruments to meet thevariations and peaks in demand. The objective is to guarantee gas supplyunder extreme weather conditions notwithstanding the failure of a majorsupply source or another system component. As neither production nortransportation capacity can be increased at short notice, surge or excess capacityneeded must be anticipated at the time of the investment decision. The costof providing such capacity is largely independent of its usage, i.e., whether usedor not the same costs will be incurred.
32

Rising gas demand in most OECD countries has brought greater reliance onmore remote supplies and reduced flexibility in supply capacity. Whereasimports from external suppliers represented 8% of OECD gas demand in1980, they reached 20% in 2000 and are expected to reach 26% by 2010 and32% by 2030. In view of the small share of transportation costs in the valueof the gas, short-haul gas easily provides supply flexibility able to matchvariations in demand. In the case of long-haul gas, however, as transportationcosts of long-distance pipelines constitute a large share of the value of gas,infrastructure utilisation close to the maximum is extremely desirable. This limitssupply flexibility. Thus, with an increased share of long-haul gas, more storagecapacity and more truly interruptible customers are needed to allow meetingvariations in gas demand.
DIFFERENT FLEXIBILITY REQUIREMENTS BY SECTOR
Flexibility requirements vary greatly from sector to sector. Residential andsmall commercial2 consumers experience large seasonal variations and generatea large requirement for flexibility and “swing”3, as their consumption is mainlyfor heating purposes. These customers cannot easily switch to other fuels.When they install gas-fired equipment, they become “captives” of their choicefor the time it would take to install alternative equipment. Generally, they areeconomic captives for the 15-to-20-year lifetime of the equipment and areextremely vulnerable if the gas industry is unable to provide the flexibilitythey require. These customers’ demand can be characterised as highly price-inelastic4. Their demand shifts with temperature in the short-term and canincrease rapidly when outside temperature drops. Their demand does, however,display some degree of price elasticity in the longer term, depending on theeconomic conditions of installing alternative heating equipment. Residentialcustomers in the United Kingdom, for example, responded significantly overtime to the gas price rises of the 1970s and early 1980s.
There are also non-interruptible consumers in industry, typically when gas isfor process purposes. For example, when the heat from burning gas is directly
33
2 A distinction must be made between big and small commercial customers. Small commercial customers donot usually have the possibility to switch to alternative fuels, but big commercial customers, like airports orhospitals, generally have some back-up fuel and fuel-switching capability and a different gas demand profile.
3 The swing is the maximum gas monthly delivery divided by the average monthly delivery in a given year.4 It should be noted, however, that residential customers can and do respond to price changes (by overheating
rooms in the case of low prices, for instance). But the fact that the price of gas to these customers tends tobe averaged and lagged limits their ability to respond to short-term price fluctuations.

applied to a product, the process is sensitive to any interruption, as in makingsheet glass. The advantage of gas over alternative fuels, which could be storedat the customers’ site, is its more uniform quality and its easier and moretailor-made handling. The non-interruptible industrial customers require asteady and reliable gas supply, but their demand is not influenced by exogenousfactors as is demand for heating. These customers’ demand is price inelastic inthe short-term, but is stable and varies only little with outside temperature. Thisis also the case in industries that use gas as a raw material, notably in theproduction of fertilisers. If the price of interruptible gas is sufficiently attractive,petrochemical companies may store their end product in order to provideinsurance against a gas supply interruption.
Demand from some industrial and larger commercial customers is different.There are a number of energy sources that these customers can substitute fornatural gas. Oil and natural gas liquids can both be used as feedstock in thepetrochemical industry. Both oil and coal can be used to produce steam in theindustrial and electricity-generation sectors. As a result, some large gas usershave installed equipment which gives them the capability to switch quicklybetween these fuels, depending on price and availability. They will optimisetheir use of two or more fuels according to operating costs, principally fuel costs.In case of power generation based on gas, shutting down the power plant andtaking electricity from the grid may be an alternative.
The ability to substitute one fuel for another varies considerably across IEAregions and industries. In many cases, it is possible to switch between fuels onlyfor short periods or with considerable investment and a time lag. Among IEAcountries, the short-term fuel-switching capability from gas into oil by powergenerators and industrial customers is limited at 3.5 mb/d5, correspondingto approximately 490 mcm/d. It is concentrated in only five countries: theUnited States, Japan, Korea, Germany and Italy. In most other IEA countries,switching capability is very small and available only for very short periods. Stocksof back-up fuel are not usually kept. Moreover, the alternative fuels for generatorsor industrial customers are likely to be more polluting than gas. With increasinglystringent environmental rules, switching from gas to oil may no longer be areal option. For these and other reasons, the quality of interruptible contractsvaries considerably.
34
5 This figure indicates the maximum possible fuel-switching capability (IEA 2002f).

With the opening of the electric markets, the pattern for using gas in powergeneration has changed. Surplus power capacity can now be traded via the gridbetween different players and optimisation of power plant dispatch is nolonger restricted to predetermined sets of alternatives under the control ofindividual players – for example, a utility having a portfolio of its own powerplants. Electricity taken from or fed into to the grid has become a new alternativeprice benchmark for each player. In addition, the existence in some IEAcountries of non gas-fired power plants, which have been mothballed, indirectlyprovides additional flexibility to the gas market. In some cases, these can bereactivated, thus freeing gas from power generation for use in other purposes.
As new trading patterns and possibilities emerge in electric markets, the timeperiods for cost-optimising fuel switching become much shorter. Dependingon price differentials and the resulting arbitrage possibilities, additional gasdemand may be induced. But the new patterns will also allow a single customerto switch much more easily away from gas, as he has the whole electricitysystem as a back-up. In general, liberalised systems are becoming increasinglyresponsive to short-term price incentives.
With the increasing development of combined-cycle gas turbines for powergeneration, fuel-switching capability will become more limited. Dual-firingCCGT units requires distillate rather than residual fuel-oil for back-up.Switching from gas to distillate requires a much higher natural gas price to triggerit. According to James Jensen’s estimates6, switching to distillate only becameeffective when natural gas prices approached $6/MBtu during the US gasshortages in the winter of 2000, whereas switching to residual fuel oil becameeconomic when gas prices reached $3.60/MBtu.
CHANGES THAT COME WITH MARKET LIBERALISATION
With the opening of the gas sector, gas hubs have developed in marketplaceswhere gas is traded like other commodities. Spot and future markets developat many hubs, where gas supply and demand are balanced by price. Some ofthe most liquid marketplaces are used as a reference for futures trading in gas.
Gas suppliers have begun to offer a more varied range of gas related servicesinstead of the uniform product they offered before. Supply flexibility, forexample, is offered through separate services which are valued and traded bysuch marketplaces.
35
6 Jensen J. 2001a.

While for some sectors, mainly residential and commercial, variation in demandmust be met by gas suppliers, customers in other sectors, mainly powergeneration and industry, can change their demand in reaction to market prices.With the opening of electricity sectors in IEA countries there is increasing useof price arbitrage between electricity and gas markets.
New flexibility options are also appearing in LNG markets because of anincrease in world-wide LNG spot trade over the last few years. On the demandside this development was stimulated by access to the highly liquid US gasmarket. On the supply side the costs of liquefaction plants have come downsubstantially, allowing gas suppliers to sell only a part of their capacity underlong-term contracts while selling the remaining capacity as spot cargoes.
In liberalised markets, most gas supply and demand is balanced by trading indomestic markets or LNG spot purchases. But a still significant number of non-interruptible customers will continue to need the flexibility instruments to meetvariations in the volume of demand.
36

SUPPLY AND DEMAND TRENDSIN OECD REGIONS AND THEIR
IMPACT ON FLEXIBILITY
INTRODUCTION
In most OECD countries, natural gas demand is expected to increase stronglyover the next three decades and account for a growing share of primary energyconsumption. OECD gas demand amounted to 1,393 bcm in 2000 and isexpected to reach 2,449 bcm in 2030, an increase of 1.9% a year over theperiod7. Growth in gas demand is projected to be strong in all the OECDregions. It will be strongest in OECD Pacific, with annual rates of about 2.3%,while European consumption is expected to increase by 2.1% and OECDNorth America by 1.7%. In all regions, the strongest increase is expected to occurin the power generation sector. The reasons for this are: the low construction andoperating costs of gas-fired power plants; their high thermal efficiency; thepossibility to build new gas-fired power capacity in a modular way when andwhere it is required (which makes gas a good fit with liberalised electricitymarkets); and the clean-burning properties of gas compared with other fossil fuels.
The impact on load factor of gas use in the power sector differs depending onwhether the gas is used for base, middle or peak load8. If it is used for base-load, the overall load factor of dispatched gas will be increased. If it is used formiddle or peak load, the load factor of gas will decrease. The merit order9 ofgas-fired CCGT plants in a given market will be a function of the size of themarket, the fuel-mix of existing generators, the price of competing fuels andthe nature of the demand profile. For instance, when LNG first entered theJapanese electricity market in the 1970s, the competitive target was base-loadgeneration by oil, and so LNG was used for base-load generation. This is nolonger true. Today the competitive targets include coal, nuclear power andhydropower. This has forced CCGT units to move increasingly into mid-loadservice. Now Japanese CCGT units operate at close to a 50% load factor,accentuating the seasonality of LNG demand.
2
7 This chapter draws on WEO 2002 (IEA 2002a), WEO 2001 (IEA 2001a) and WEO 2000 (IEA 2000a).8 This paragraph and the next are drawn from a presentation by James T. Jensen on “Comparative energy costs
in power generation” (Jensen J., 2001b).9 Ranking in order of which generation plant should be used, based on ascending order of operating cost
together with amount of energy that will be generated.
37

The fluctuations of power generation loads pose a challenge to gas supply.These daily fluctuations are usually manageable when LNG is used, but lessso when the fuel is pipeline gas. Shifts in electricity loads are instantaneous.The gas transmission grid can provide some intra-day flexibility but its peak-hour delivery capacity is usually limited to some percentage of its maximumdaily quantity. In the United States, for example, intraday flexibility is typicallylimited to 6% of the daily contractual quantity in any one hour. In somecases, it may be profitable to operate newer gas pipelines designed to carry gas-fired power-generation loads at very high pressures in order to maximise line-pack. The Yacheng pipeline that serves Hong Kong from offshore Hainan isan example of such a design.
In an environment that allows for arbitrage between the electricity and gasmarkets, it may be rational for gas-fired power plants to stop taking gas duringgas peak-load hours, and instead to sell it on a gas spot market. The loss in powerproduction would be replaced by electricity purchase from the electricity spotmarket (when possible). In such cases, flexibility in the electricity sector mayenhance flexibility in the gas sector.
Flexibility is even more important in responding to predictable increases in gasuse in the residential and commercial sectors. These sectors are typicallyresponsible for the largest seasonal variations in gas demand. Gas demand inthese sectors in OECD countries is expected to grow a modest 130 Mtoe(155 bcm) between 2000 and 2030, for an average annual rate of 0.9%.
The increase in demand in the residential and commercial sectors will add tothe volume of price-inelastic demand. By contrast, the increase in gas demandin the power sector is rather price elastic in the short-term, due to generators’fuel-switching capacity and the back-up by the electricity grid. With theopening of the electricity market, this trend will intensify due to the arbitragepossibilities between gas and power. Over time, as gas use increases in powergeneration, there will be limits to the price elasticity of gas demand for power.
OECD NORTH AMERICA
Market overviewThe North American gas market is the largest in the world with 733 bcmconsumed in 2001, or 29% of global gas demand. The United States accountedfor 608 bcm. The region is self-sufficient in gas, with a reserves-to-production
38

ratio in US over several decades of about 7 to 8 years. Over recent years,depletion rates for gas have been accelerating. North America has a large yet-to-be explored potential. Remaining resources are 27-34 tcm, while remainingproven reserves are about 7.8 tcm (Cedigaz), so that new gas will probably bedeveloped when the market signals are right and if there are no regulatoryobstacles.
US imports of LNG, which reached 6.75 bcm in 2001, have so far been of minorimportance for the volume balance of North America. This situation is evolving.LNG is now viewed as a “backstop” supply the US can fall back on ifconventional production does not develop in line with expectations10. Forexample, LNG imports increased in 2000 and 2001 triggered by high US gasprices. Numerous spot LNG cargoes complemented long-term LNG suppliesto the US East Coast from Algeria and from Trinidad and Tobago.
Canada and the US have similar regulatory frameworks as both are NAFTAmembers, and large pipeline links carry substantial flows of gas from Canadato the United States (107 bcm in 2001). The two countries’ gas systems may,in fact, be considered a single network. However, interconnection between thecountries varies considerably among states and provinces. The western UnitedStates is more closely integrated with Canada than it is with the Eastern USmarket. Mexico is also connected to the US market, but the capacity of theconnecting pipelines is small.
Regulatory reforms in gas and electricityThe US and Canadian gas industry has undergone profound structural changesover the last two decades, largely due to regulatory reforms aimed at promotingcompetition and improving efficiency. This process began with the lifting ofcontrols on wellhead prices, followed by mandatory open access to the interstatepipeline and storage system and the unbundling of pipeline companies’ gas-trading, transportation and sales activities. To date, open access is mostlylimited to industrial and large commercial end-users. Several states and provincesare now expanding open access and retail competition to small residential andcommercial consumers. Pricing of transmission services remains, for the mostpart, regulated by the national regulators, the National Energy Board in Canadaand the Federal Energy Regulatory Commission in the United States.Distribution services come under state and provincial regulators, usually on atraditional cost-of-service basis.
10 Jensen J. 2002.
39

The US and Canadian power industries have also undergone major regulatorychanges, since 1992. Unlike the gas industry, electricity generation and theregional electric grids are regulated on the state or province level. A majorshare of the overall reform effort has been aimed at intensifying competitionbetween power generators, mainly through the provision of non-discriminatoryaccess to the transmission grid. New regulation focuses on levelling the playingfield for supply competition by means of unbundling and by transparencyobligations imposed on the utilities. On the end-user side, reforms aim atenabling all consumers to choose their supplier and at strengthening consumerprotection. In some states, retail electricity customers can now choose theirelectricity supplier11, but the California power crisis has slowed the pace of reformin a number of states.
Wholesale electricity markets, which only recently came into existence, are nowoperating in many parts of North America. The emergence of centralisedpower markets has significantly changed the way power is sold. Numerouselectricity trading hubs12 have emerged over the past few years, as was thecase in the gas sector during the 1990s. There are currently ten major tradinghubs for electric power in the United States, five of them are located in westernUS, four in the Midwest, and one in the East. The NYMEX (New YorkMercantile Exchange) and the CBOT (Chicago Board of Trade) have developedand sponsored electricity futures contracts to facilitate trading at these hubs.The existence of futures contracts has increased the linkage between the gas andpower sectors, facilitating arbitrage between the two commodities.
In Mexico, the government announced plans in 2000 to restructure the energysector and reform its legal and institutional framework to boost efficiency andinvestment. The reforms would grant operational and financial autonomy tothe public energy companies and would lower their high tax burdens to enablethem to reinvest. The role of the private sector would be enlarged. Mainelements of the planned reforms that are relevant to natural gas and electricityare:
■ Private oil and gas companies will be invited to tender bids to develop non-associated gas fields on behalf of Pemex under long-term service contracts.
■ Private and foreign companies will be allowed to participate in buildingand operating LNG import terminals.
11 EIA (2000a).12 A hub is a location on the power grid representing a delivery point where power is sold and ownership changes
hand.
40

■ Independent power producers will be allowed to sell directly to end-usersany power not bought by the Federal Electricity Commission.
■ Energy subsidies will be phased out, and all fuels will be priced on the basisof full supply costs.
Gas demand trendsOECD North American gas consumption has been rising steadily since the mid-1980s, from 579 bcm in 1985 to 733 bcm in 2001. Most of the increase inUS demand has been met by Canadian production (70% of the increase overthe period 1985-2001). Canadian and Mexican demand have also increasedrapidly, from 61 bcm in 1985 to 85 bcm in 2001 in Canada and from 28 bcmin 1985 to 39 bcm in 2001 in Mexico.
US gas consumption decreased by 6% in 2001, as high gas prices, fuel switchingand lower economic activity, especially after the 11 September terrorist attacks,reduced industrial and power-sector demand, while deliveries to commercialand residential consumers were low in response to above-normal temperatures.Gas consumption started to rise again in 2002 in line with US economicactivity.
North American gas consumption is projected to rise at an average annual rateof 1.7% between 2000 and 2030, from 788 bcm to 1,305 bcm. Its share intotal energy supply will increase from 24% in 2000 to 29% in 2030. Powergeneration accounts for three-quarters of the increase. During the past five years,demand growth for gas in electric power has been particularly strong in theUnited States (11% per year between 1996 and 2000). The gas-fired share ofUS electricity generation, including co-generation, rose from 13.2% in 1996to 16% in 2000. About 22 GW of new gas-fired generating capacity wasadded in 2000 and 40 GW in 2001. According to the Utility Data Institute,this trend will continue over the next five years. Of 253 GW of generatingcapacity planned or under construction in the United States, 238 GW will befuelled by gas. Electricity generation is therefore expected to surpass theindustrial sector as the largest consumer of natural gas in the United States.
Gas in power generation in the US is principally used for middle load. The newcapacity recently built, under construction or in planning consists of 170 GWof CCGT (typically used for base load), 66 GW of gas turbines (typicallyused for peak load13) and 2 GW of cogeneration. New gas turbines that can
13 Generating units that can be brought on line quickly and used to meet requirements during the greatest orpeak-load periods on the system (for instance, during heat waves on the East Coast).
41

be switched on and off at short notice are well suited for arbitrage between thepower and gas sectors and are already causing substantial swings in gasrequirements.
Gas supply trendsProven gas reserves in North America amounted to 7.8 tcm at the beginningof 2002, 4% of global gas reserves. Just above two-thirds of these reserves arein the United States. Production is concentrated in the southern and centralUS states and in western Canada.
World Energy Outlook 2002 foresees a 27% increase in North American gas pro-duction over the period 2000-2030. Marketed production in 2030 is expectedto reach 960 bcm, up from 773 bcm in 2001. North American gas productionprospects depend on producers discovering and developing conventional andunconventional reserves and connecting them to markets. Higher output willrequire increased drilling in established producing basins in the lower 48 USstates and in Canada, as well as new greenfield projects. Aggregate productionin the United States and Canada is projected to climb slowly from 736 bcmin 2001 to 823 bcm in 2010 before beginning to decline around 2020, to812 bcm in 2030. In Mexico, the long-term outlook is more promising. Gasoutput is projected to grow from 37 bcm in 2001 to 148 bcm in 2030.
According to the National Energy Board14, exports from Canada to the US couldreach a maximum of about 140 bcm in 2018, before declining moderately to130 bcm by 2025. Imports of LNG will play a growing role in US gas supplyin the long term. Capacity expansions at the four existing LNG facilities onthe Gulf and East Coasts and potential investment in new terminals in theUnited States, or neighbouring countries, will depend on prices and project-development costs. The rising cost of gas from domestic sources, togetherwith continuing reductions in the costs of LNG supply, is expected to boostUS imports of LNG, directly or via Mexico. There may also be potential forlarge-scale imports of Mexican gas by pipeline into the United States. But thiswill probably not happen before 2020, as Mexico will need to meet its domesticneeds first.
Impact on flexibilityIncreased demand in the residential and commercial sectors, as well as the useof gas in gas turbines for peak load, will increase the seasonality of gas demand.
14 National Energy Board (1999).
42

This will be somewhat counterbalanced by the increasing use of gas in CCGTfor base load and by supply trends, including an increased share of LNG in gasimports. LNG imports are more flexible than long-distance pipeline importsand could increase the swing in gas imports, reacting to price signals.
Arbitrage possibilities between gas and electric power resulting from theliberalisation of both sectors will increase the elastic part of gas demand, asoperators will have the possibility to sell their gas on the spot market and buyelectricity from the power exchanges or vice versa. The result, as can alreadybe seen today, will be an increased use of flexible instruments, such as high-deliverability gas storage.
OECD EUROPE
Market overviewWith 490 bcm consumed in 2001, OECD Europe is the third largest regionalgas market after North America and the Former Soviet Union. European gasdemand grew at an average rate of 3.7% per year from 1973 to 2000. Theresidential sector is the single largest consuming sector, followed by theindustrial, electricity and commercial sectors. The use of gas in power generationis growing rapidly, especially in the United Kingdom. The largest gas marketsare the UK, Germany, Italy, the Netherlands and France. Together, theyaccounted for three-quarters of OECD European gas consumption in 2001.
Indigenous production, concentrated in the UK, Norway and the Netherlands,has grown in recent years, but not fast enough to keep pace with demand.Imports from external suppliers have therefore increased, and now account for41% of total European gas needs, compared to only 17% in 1980. Russiaand Algeria are the two major external suppliers. Inside the region, Norway andthe Netherlands provide the bulk of internal trade.
The Continental European gas market is characterised by a small number oflarge gas companies, most of them with the state as a major shareholder, andwith strong positions in their home market. Legislation at national andEuropean level to liberalise gas markets by introducing third-party access andunbundling have brought a degree of gas-to-gas competition and have fosteredspot markets. By contrast, the UK market is fully private and liberalised andUK has its own substantial gas reserves.
43
In Continental Europe, price signals do not necessarily work their way to theproducing countries, especially to Russia and Algeria, where upstream investmentdecisions are triggered by many other factors than market prices in the EuropeanUnion. This is not the case so far in the UK where supply reacts quickly to pricesignals from the market.
Regulatory reforms in gas and electricity
The pace of market reform varies widely across Europe. Gas-to-gas competitionis most developed in the UK, where structural and regulatory reforms were firstlaunched in the late 1980s.
In Continental Europe, market liberalisation started in August 2000 with thetransposition of the EU Gas Directive into national laws. The directiveestablished common rules for the implementation of competition in the gassector, through third-party access (TPA) to the transmission networks. Thedirective allows either “negotiated” TPA with the publication of the maincommercial conditions, or “regulated” TPA, based on published tariff structures.Most EU member states, except Germany, have opted for, or are moving to,regulated TPA. National approaches to unbundling of transportation andsupply activities are quite mixed. Some countries are moving towardsorganisational unbundling, rather than unbundling of accounts. In 2001/2002,a number of companies in Belgium, Spain, Italy and the Netherlands decidedto separate their transmission and supply activities.
Competition was introduced in all EU member states’ electricity markets in1999, when the Electricity Directive was transposed into national laws.
In the UK, gas and electricity markets have been fully opened since 1998. Allhouseholds are eligible to choose their supplier. In October 1999, New GasTrading Arrangements (NGTA) were published, introducing entry capacityauctions. Under New Electricity Trading Arrangements (NETA) implementedin March 2001, the old mandatory electricity pool has been replaced by asystem in which electricity trade is mostly bilateral contracts.
In March 2002 the Council of the European Union agreed to vote on new EUgas and electricity directives before the end of 2002. The new draft directivesforesee an extension of the right to choose their gas and electricity suppliersto all non-household consumers by the end of 2004. This will amount to atleast 60% of the total market. The new directives were tabled by the EUCommission in 2001. They aimed to open electricity and gas markets fully,
44

to reduce existing barriers to competition and to reinforce the regulatoryfunction.
Gas and electricity market reforms have led to the emergence of new marketplaces, in addition to APX in Amsterdam; Nordpool in Oslo; OMEL inMadrid; and Elexon, IPE, NGC, PowerEx and the UK Power Exchange in theUnited Kingdom. PowerNext opened in France in November 2001 and anItalian power exchange is expected to start operation in 200315. The twoGerman power exchanges, located in Frankfurt and Leipzig, merged in March2002. On the gas side, a new hub is developing at Bunde in Germany, inaddition to the two existing hubs, the National Balancing Point in UK andZeebrugge in Belgium.
Gas demand trendsGas consumption in OECD Europe is expected to continue growing faster thanthat for any other fuel, at an average rate of 2.1% per year between 2000 and2030, resulting in 87% growth from 482 bcm in 2000 to 901 bcm in 2030.Gas would then become Europe’s second fuel after oil, with 33% of TPES in2030 (22% in 2000).
Gas use is increasing in power generation and in all end-user sectors. Seventy-two per cent of the expected increase in European gas demand by 2030 isexplained by increased use of gas in the power generation sector, where gas willtake up the predominant share in market growth. The large European increaseof gas in the power sector has been led by the dash for gas in the UK, wheregas is used for base-load power generation. The relative prices of power and gasin the UK under the new NETA regime are such that gas-fired CCGT plantscannot recover their full costs. Gas use may therefore be reduced. It alreadyhappened in 2001 in UK when generators sought to cut their fuel costs. Theextent of the reduction in gas use will depend on whether environmentalconsiderations restrict coal use and on the possibility of importing electricityfrom neighbouring countries.
A limited increase of 55 Mtoe, or 66 bcm (+ 1% per year) is expected over theperiod 2000-2030 in the residential and commercial sectors, while consumptionby industry is expected to increase on average by 0.8% per year during the period.
15 IEA (2002e-forthcoming).
45

Gas supply trendsOECD Europe’s 7.35 tcm of proven gas reserves at the beginning of 2002represents 4.5% of the world total (Cedigaz). About 80% of the region’sreserves are in Norway, the Netherlands and the United Kingdom. For severalyears, the reserves-to-production ratio has been stable at about 20 years, despiterising production in the North Sea. Major reserves have been added mainly bynew finds in the North Sea and Norwegian Sea and by higher recovery ratesin existing fields, due to techniques to improve recovery, mainly horizontaldrilling. European gas production amounted to 308 bcm in 2001. Norwayexports substantial volumes of gas to the Continent and small volumes to theUnited Kingdom. The Netherlands export half of their gas production toother European countries. The United Kingdom has become an exporter ofgas to the Continent since the opening of the Interconnector in October1998, but due to price differentials across the Channel, the UK sometimesimports gas, as the Interconnector can reverse its flows.
Most European countries depend heavily on gas imports from distant sourcesand from a limited number of producing countries, in several of which exportsare exclusively handled by state monopolies. Russia is the largest externalsupplier to Europe, providing 117 bcm or just under two-thirds of totalEuropean imports from external suppliers, and a quarter of total supply –entirely by pipeline. Algeria, with 55 bcm, is the next biggest exporter of gasto Europe, both via pipeline and as LNG. Imports of LNG play a small, butincreasing role in OECD Europe. LNG imports from Nigeria began in 1999and from Trinidad and Tobago in 2000. Europe has been importing smallvolumes of LNG from Libya since the early 1970s and spot cargoes from theMiddle East in recent years.
Gas production in OECD Europe is expected to remain stable at approximately300 bcm a year until 2020 and then decrease slightly to 276 bcm in 2030.Production could turn out to be higher depending on technological and pricedevelopments. Nevertheless, given the limited gas resources in most Europeancountries and the prospect of rising demand, imports from Norway and from outside the region are expected to continue to increase for the next twodecades.
Incremental European gas import requirements are likely to be met by increasedpiped supplies from the two main existing suppliers, Russia and Algeria, anda mixture of piped gas and LNG from other existing or emerging suppliers.The latter will probably include Libya (via pipeline), with LNG coming from
46

Nigeria, Trinidad and Tobago, Egypt and Qatar. Venezuela may also emergein the longer term as a bulk supplier of LNG, while shipments of LNG fromother Middle East producers (whose reserve potential is large and still little used)may also increase. LNG, both under long-term contracts and via spot purchases,could play a much more important role in supplying the European gas market.
Currently, most gas in Continental Europe is imported through long-termTake-or-Pay contracts. These contracts divide the risks associated with highlycapital-intensive gas projects among producers and importers. They typicallyput the price risk on the seller and the volume risk on the buyer (ToPobligations). With market reform some significant changes in the structure andpricing of these long-term ToP contracts will be observed.
Experience in liberalised markets shows that long-term contracts do not entirelydisappear with market liberalisation. In the United Kingdom, about 85% ofthe gas delivered at the beach is covered by contracts, as is about half of thewholesale gas in the United States. But the eight-to-ten-year duration of UScontracts is shorter than in continental Europe and contracts have differentpricing rules. Moreover, gas is traded repeatedly before it reaches the burnertip, and there are numerous renegotiations between producers, suppliers andconsumers on price, volume and delivery point. As gas-to-gas competitionincreases and oil products become less competitive with gas in the powergeneration markets, prices in most contracts are partly or totally indexed withchanges in spot or futures gas prices.
Some changes can be observed in new continental gas supply contracts as areaction to market reform and as part of a portfolio approach by buyers:shorter terms for new contracts (8-to-15 years instead of 20-to-25 years),smaller volumes and greater flexibility in reviewing contractual terms, newprice indices including electricity pool prices and spot gas prices. On theContinent, however, some very large long-term ToP contracts will remain inforce for decades to come. These include contracts between Gasexport andRuhrgas (prolonged in 1998 until 2030), the Troll contracts, Gasunie andSonatrach contracts. These contracts are less rigid than older Asian LNGcontracts, as they include regular renegotiation clauses.
47

Long-term Take-or-Pay (ToP) contracts are generally considered to be“rigid” contracts, mainly because they link sellers and buyers for 20 to25 years, over which both of them have strictly defined obligations. Theyinclude a ToP clause, under which the buyer must pay for a certain amountof gas whether taken or not, as well as an obligation on the seller to makeavailable defined volumes of gas. Such contracts constitute a firm basis forboth sellers and buyers to finance a highly capital-intensive infrastructure.
In some contracts price conditions are fixed for the lifetime of the contract,others provide instruments to renegotiate prices to adapt them to changedcircumstances. The first type has been usual practice in UK and US; thesecond, in Continental Europe.
Experience with long-term ToP contracts in the UK and the US indicatesthat the contract obligations can be very costly for the companies involvedwhen circumstances such as the regulatory framework change substantiallyand there is no re-opener clause. In the United Kingdom, it cost British Gas£2.5 billion to renegotiate its contracts with North Sea producers when gasprices dropped to 9 p/therm, while the cost to British Gas for buying itaveraged 19 p/therm.
Long-term ToP contracts in Continental Europe allow for regular pricerenegotiations every three years by which price and in some cases otherconditions can be revised if market circumstances change significantly. Ifthe parties cannot agree on changes, either party may go to arbitration butthis has rarely happened.
Long-term contracts in Continental Europe usually provide that the pricingprovision should reflect the competitive situation in the buyer’s market. Thisapproach results in different gas price formulas – and prices – to the marketof different buyers. These price differentials create an incentive for buyersto profit from price differentials by reselling part of their offtake to morelucrative markets. While sellers tend to try to restrict the use of such pricedifferentials by their buyers, any restriction of the use of gas to the countryof the buyer (destination clause) would certainly not be in line withEuropean law.
Long-term ToP contracts include an element of volume flexibility, whichdepends on the economics of the production and transportation side.Short-haul gas from pure gas fields is offered with a large swing and largeflexibility while long-haul gas or offshore gas is offered with more limitedswing and flexibility. Gas from associated fields tends to carry most rigidofftake obligations to avoid flaring. The value of the flexibility offered bythe contract is reflected in the price of the gas.
48
Box 1: Flexibility in Long-Term Contracts

The flexibility offered by long-term contracts consists mainly in thedifference between the capacity and the off-take/minimum-pay obligationfor various time spans; a year for long-term flexibility and a day or an hourfor short-term flexibility:
■ Annual flexibility is typically of the order of 20%. The minimum pay-out is mainly a provision to protect the cash flow of the seller. So,contracts usually have a carry-forward provision, which allows gastaken in excess of the minimum pay obligation to be credited againstfuture minimum pay-out obligations. There is also a make-up provision,under which gas not taken may be treated as a prepayment which canbe counted against future off takes above the minimum pay obligation.In addition there may be clauses that adjust the annual volumeobligations as a function of exogenous influences like averagetemperature.
■ Daily flexibility is measured by the difference between daily capacityand the daily off-take obligation. A daily off-take obligation is notnecessary to protect the seller’s cash flow. But it may be necessarybecause of technical minimum-flow restrictions or to guarantee theoutlet of associated gas. Gas from pure gas fields usually has a very lowdaily minimum off-take obligation or none while gas from associatedgas fields may have a minimum daily off-take obligation not verymuch lower than the one-day average annual obligation.
■ The “swing” given by a contract results from the relation between thedaily and annual obligations. Where the daily availability is considerablyhigher than the average annual availability the contract allows for a largeswing to follow the market. The Dutch contracts provide such a largeswing; so did the early UK delivery contracts from the fields in thesouthern UK Continental Shelf. Both were for short-haul gas. Forlong-haul gas, daily availability is usually not larger than average annualavailability; as a higher daily availability would require investment incapacity without a guaranteed cash flow.
■ A new feature was included in some of the long-term UK exportcontracts for delivery to the Continent via the Interconnector. It is calleda “clawback gas” provision. It gives the supplier the right to interruptthe normal contractual flow to take advantage of high UK spot prices.Contrary to the traditional volume-related elements of flexibility thisadds a price element to the flexibility provisions.
49
Source: ESMAP (1993), European Gas Matters, 30 April 2002.

Impact on flexibilityOn one hand, increased use of gas in the residential and commercial sectorswill increase gas demand seasonality in Europe. On the other hand, the largestincrease in gas demand is expected from power generation, which might reducegas seasonality if the gas is used for base-load generation. This has been the casein the United Kingdom so far.
European gas companies have recently begun to increase storage capacity inorder to meet the challenges that a temperature-sensitive market may present duringthe next few decades. At the beginning of 2000, the working gas volumes ofEuropean storage facilities amounted to 59 bcm (13% of 2000 gas consumption)compared with 31 bcm at the beginning of 1990 (12% of 1990 gas consumption).
For the time being, oversupply and some spare capacity in transportationsystems provide a great deal of gas flexibility on the supply side, althoughsome transmission pipelines are already operating near capacity. Increasingdemand will gradually reduce spare capacity and decrease the current flexibility,spurring increase in storage capacity and interconnectivity of the gas grids. Supplyand transportation flexibility will also decrease as imports increasingly comefrom more remote areas and exporters seek to make best use of their assets. Thiswill be partly compensated by an increase in LNG imports, which are moreflexible and could increase the swing in overall gas imports.
On the other hand, market liberalisation will offer new ways to deal withflexibility requirements: swap agreements, spot markets, LNG spot cargoes, moreflexibility in contracts. Liberalisation will also bring market-based valuationsof the various forms of flexibility. Improved interconnection of the gastransmission network in Europe will be an important factor in enhancingflexibility and security. Because of the diversity of OECD European markets,improved interconnection can allow additional short-term gas to be providedfrom neighbouring markets, if there is a large difference in prevailing demand,such as might happen with cold weather in one market and milder weather ina neighbouring interconnected area.
Since the United Kingdom was geographically isolated from the ContinentalEuropean gas grid and the country was self-sufficient in gas, the UK gas marketdeveloped in its own way, which was more like the US gas market than thatof Continental Europe. As gas production on the UK Continental Shelf is notkeeping step with gas consumption, the UK market could be in a similarsituation to that of Continental Europe in the next five-to-ten years, with agrowing share of imported gas and the need to find additional flexibility.
50

OECD PACIFIC
Market overviewOECD Pacific consumed 131 bcm of gas in 2001. The region’s main gasmarkets contrast sharply. Japan and Korea, with limited reserves of their own,are large LNG importers, whilst Australia is a large LNG exporter. Gas use hasgrown very rapidly in the region (+ 11% per year during the period 1971-2000)due to massive LNG imports by Japan and Korea.
Natural gas resources and production in OECD Pacific are concentrated inAustralia, with a small amount in New Zealand, which is self-sufficient.Australia is a major LNG supplier to Japan. But the main part of the region’sgas needs is met by LNG imports from the rest of East Asia/Pacific and theMiddle East. Imports, which account for 96% of natural gas use in Japan, areentirely in the form of LNG, coming from Indonesia, Malaysia, Australia,Brunei, the United Arab Emirates, Qatar, Alaska and Oman. Imports reached78 bcm in 2001. South Korea imported 21 bcm of LNG in 2001, mainlyfrom Indonesia, Malaysia, Qatar and Oman.
Demand is dominated by power generation which used 54% of the region’sgas in 2000. Demand and trade – both within and outside the region – willcontinue to grow at different rates across countries. In New Zealand, gasconsumption is set to decline in line with the depletion of national gas reserves;little growth is expected in Japan, where the major uncertainty lies in theamount of gas that will be consumed in future by the power electricity sector.Strong growth in consumption is expected in both Australia and Korea.
Regulatory reforms in gas and electricityDownstream markets in Japan and South Korea are in a state of change, asgovernments introduce competition into the electricity and gas markets.
In Japan, retail power sales to large users who account for about one-third ofJapan’s power demand were opened to competition in March 2000. As a result,competition is emerging among existing players and new entrants and Japanesepower companies have become much more cost-conscious than before. Furtherreforms of the electricity sector will include the unbundling and regulation oftransmission, the creation of a spot market and the opening up of the retailmarket16.
16 IEA (2002e-forthcoming).
51

The gas industry is undergoing changes as a result of power-sector deregulationand of emerging competition in domestic gas distribution. Amendments to theGas Utility Law passed in 1999 and 2000 liberalised gas sales to industrialcustomers whose annual consumption exceeds one million cubic meters. Thegovernment has speeded up the access of new entrants to the existing large-usermarket, by dropping a requirement for prior approval, in favour of a merenotification of intention to compete. Existing gas and electricity utilities, andnew entrants, mainly oil companies, can now sell in one another’s territory. SomeJapanese gas and electricity utilities are beginning to look outside their traditionalmarkets, and some oil refiners are looking at new opportunities in the LNGretail market.
Tokyo Electric Power Company (Tepco), Japan’s major importer of LNG, isaiming to become a wholesale gas supplier. It has signed a contract with KeiyoGas, Japan’s fifth-largest local gas distributor. Tepco is also selling gas to OtakiGas, another Chubu-based gas distributor. Tepco plans to start selling surplusLNG in 2006 under two-to-three-year contracts with small domestic gascompanies.
Tokyo Gas, the largest gas utility company, has recently established a joint venturewith Shell, Nijo Gas Co, to sell gas to independent power producers and otherlarge consumers in Tokyo’s metropolitan district.
The Japanese Ministry of Economy, Trade and Industry (METI) is takingsteps to ensure competitive third-party access for small- and medium-sizedcompanies to city gas grids. Third-party access to LNG facilities, storage tanksand pipelines is due in 2003. The government is also investigating how todevelop a natural gas grid to foster competition.
In Korea, the electricity and gas sectors are in the early stages of a longrestructuring, privatisation and liberalisation process. In April 2001, non-nuclear power-generation assets were divided into five generating subsidiariesstill wholly-owned by the state, but with privatisation planned to begin in2002. A cost-based electricity pool and power exchange was put into operationin April 2001 and is expected to be transformed into a competitive mandatorypool in 2003. By the end of 2002, distribution subsidiaries are to be created.In the gas sector, gas imports and sales are going to be unbundled from terminaland transmission operations and the government intends to open access to LNGreceiving terminals and the transmission network in 2003.
In Australia, electricity reforms have occurred at both state and national levels.At national level, the aim was to develop a national electricity market (NEM)
52

for the wholesale supply and purchase of electricity in five Australian states andterritories. The market provides open access to transmission and distributionnetworks by generators, retailers and customers, co-ordinated planning of theinterconnected power systems in the NEM jurisdictions and the maintenanceof system security. At state level, reform was led by the two most populous states:Victoria, which privatised and restructured its electricity sector in 1994, andNew South Wales, which established a daily electricity pool in 1996.
The Australian natural-gas market has also changed considerably in the last fewyears. Competition has been introduced through non-discriminatory openaccess to pipelines and intensified interstate trade through the removal ofregulatory barriers and the interconnection of state infrastructure.
In New Zealand, a package of reforms to promote competition in electricitygeneration, distribution and retailing was adopted in 1998. Non-discriminatoryaccess to the gas transmission grid was introduced in 1999.
Gas demand trendsNatural gas consumption in OECD Pacific reached 131 bcm in 2001. It isexpected to grow at an average annual rate of 2.3% from 2000 to 2030. Thisis far less than the 11% growth observed during the period 1971-2000. Gasconsumption is expected to increase from 122 bcm in 2000 to 243 bcm in 2030.
In Japan and Korea, the gas market was shaken by the Asian financial crisis of1997-1998, when LNG buyers found themselves vastly over-supplied. Growthhas picked up again and is expected to continue. However, the pace of futuregrowth remains uncertain. In Japan, future demand will depend on the strengthof the economy and the power sector, which consumed approximately 70%of LNG imports in 2000. The gas requirements of electric power companiesare not expected to grow much in Japan, due to competition from coal andnuclear power, and to low economic growth generally. On the other hand,demand for residential and commercial use, which is relatively inelastic to theeconomic situation and prices, is expected to increase rapidly. In the 2001review of Japanese Energy Policy, the Japanese government foresees an increasein total gas consumption of 7 Mtoe or approximately 8 bcm (10% in all) overthe period 2000-2010 under its “policy case” scenario (which includes plannedpolicy measures to achieve Japan’s Kyoto targets).
Until recently, LNG consumption was relatively stable throughout the year aspower plants used it for base-load generation. In the past few years, however,LNG consumption has become increasingly seasonalised, with two peaks: one
53

in summer induced by electricity needs for cooling and one in winter forheating. Residential and commercial sector consumption has been growing fastin Japan and Korea and this trend is expected to continue. In addition, becauseof competition with coal and nuclear power, gas-fired power plants areincreasingly being used for middle and peak loads. This is expected to continuein the future. In Japan, the electric utilities will use soon LNG as a swing orbuffer fuel, much the way oil is used today17.
In Korea, where seasonal fluctuations in gas demand are high, the Korean gascompany KOGAS gives financial incentives for gas-operated cooling systemshoping to smooth demand by promoting gas sales in the summer season.
In Australia, most demand growth is expected to come from the powergeneration and industrial sectors.
Gas supply trendsAustralia has large and increasing proven gas reserves, 3.6 tcm as of 1 January2002, according to Cedigaz, and a large resource potential. The country willprovide the bulk of the future increase in OECD Pacific production, whichis expected to grow from 42 bcm in 2001 to 63 bcm in 2010 and 122 bcm in2030. The dependence of OECD Pacific countries on gas imports from outsidethe OECD is expected to fall, as Australia will partly provide the growingvolumes of imported LNG in Japan and Korea.
Nevertheless, both Japan and Korea will continue importing large amounts ofgas from outside the region. The principal options for Japan to meet anyfuture increase in natural gas demand include increased imports of LNG fromAsia, the Middle East, Alaska or Sakhalin. There is also the potential forRussian gas piped from Sakhalin or Irkutsk via China and the Korean Peninsula.The most likely sources of additional LNG supplies are from existing majorsuppliers and possibly Russia. Japan is already committed to lifting more LNGfrom Malaysia, starting in 2003, and from Australia’s Northwest Shelf expansion,starting in 2004. In Korea, the options for imports from new greenfield LNGprojects include LNG from Tangguh in Indonesia, the new Australian projects,Gorgon and North Australia, Russia’s Sakhalin-2 and new Middle East projects.
Impact on flexibilityGas demand in OECD Pacific is set to become more seasonal because ofincreased use of gas in the residential and commercial sectors and for upper and
54
17 FACTS (2002).

middle load in the power generation sector. Increasing seasonality in gasdemand will require increased flexibility of supply. This could be achievedthrough a combination of swap agreements between companies in the region,spot LNG cargoes purchased during peak requirements periods and increasedflexibility in new long-term contracts.
Increased LNG purchases in Japan and Korea will probably be conditional onmore competitive pricing formulae and more flexible contracts, with shorterterms. A growing proportion of any new demand is likely to be met by spotpurchases.
55


FLEXIBILITY TOOLS IN TRADITIONAL MARKETS
INTRODUCTION
Before market liberalisation, the entire gas demand curve was largely inelastic.It was also subject to exogenous influences such as weather, focussing theoverriding aim on ensuring that demand was always met. It was, in effect, amatter of volume management. The main requirement was that the availablesupply should at all times be sufficient to cover contractual demand at eachlocation.
Large suppliers such as state monopolies or companies with exclusive supplyconcessions were meeting this requirement. Replacement-value pricing withreference to crude oil meant that gas competitiveness was linked to other fuels.As such, there was little incentive for customers to switch to alternate fuels inresponse to prices. Flexibility had a cost, but it was included as part of abundled service and the costs were passed on to customers in gas prices.
In traditional markets18, gas companies have developed several mechanisms forbalancing gas supply and demand for discrete periods of time. Some of thesemechanisms are supply-side techniques that adjust the volume of gas madeavailable by the system. Others work on the demand side, by influencing thecall on gas. Buffer tools, such as underground gas storage and liquefied naturalgas storage tanks also play an essential role in balancing supply and demand.
An important aspect of flexibility is the timing required: hourly, daily, monthlyand annually. Different tools apply according to the required timing:
■ flexibility in supply (production and imports) is required to cover monthlyand annual variations in demand;
■ storage can usually cover daily and seasonal variations in gas demand;■ line-pack is generally used to cover flexibility requirements during the day;■ interruptible contracts are ultimately available in the case of a sudden
unforeseen increase in gas demand (wave of cold weather) or in the caseof interruptions in gas supply.
3
18 «Traditional markets», as used here, refers to markets where there is little or no gas-to-gas competition as opposedto fully competitive markets.
57
Market players’ access to flexibility tools can be directly through ownership,as in the case of a vertical operator, or it may be through contractual relationshipswith suppliers. Access may also take the form of anonymous market instrumentssuch as commodity exchanges in more mature markets.
FLEXIBILITY OF SUPPLY
Flexibility in gas production and importsCertain fields play a large role in meeting seasonal demand variations. Thesefields are typically non-associated gas and have geological characteristics suchas high pressure and high permeability as well as favourable economic parameters,such as low investment requirements for production and proximity to themarket. They are, as a result, able to vary their production up and down asrequired. This is particularly the case of the Groningen field in the Netherlands,which is considered the swing provider for Europe (Box 2).
Flexibility at a given delivery point can be measured by the “swing”, which isdefined as the maximum monthly delivery divided by the average monthlydelivery in a given year.
■ IEA Europe
For IEA Europe, the average swing at the production and import points was135% in 2000. The two major producing countries, the Netherlands and theUK, present a high level of swing. In other producing countries in Europe, theswing is more limited. In the Netherlands, the monthly production in January2000 was 3.5 times higher than in August 2000 (Figure 1).
Flexibility in supply contracts is an important element to meet variations indemand, but it depends heavily on economic considerations. The main fieldsthat supply gas to Europe, such as Troll in Norway, Urengoy in Russia and HassiR’Mel in Algeria, have high flexibility to vary their production rate. However,the high and fixed transportation costs due to long distance or offshoretransportation result in a rigidly defined upper limit on the delivery capacityfrom those fields, which allows little flexibility. Groningen is an exception, beingclose to the main markets.
Generally, import contracts to the EU provide for a flexibility allowance of 90-110% of contracted volumes. The swing shown in exports from Russia, Norwayand Algeria is in the range of 110-120%. Exports from the Netherlands showed
58

mcm
35000
30000
25000
20000
15000
10000
5000
0
Jan-9
8
Mar-
98
May
-98
Jul-9
8
Sep-
98
Nov-9
8
Jan-9
9
Mar-
99
May
-99
Jul-9
9
Sep-
99
Nov-9
9
Jan-0
0
Mar-
00
May
-00
Jul-0
0
Sep-
00
Nov-0
0
Other Europe Norway UK Netherlands
mcm
30000
25000
20000
15000
10000
5000
0
Jan-9
5
May
-95
Sep-
95
Jan-9
6
May
-96
Sep-
96
Jan-9
7
May
-97
Sep-
97
Jan-9
8
May
-98
Sep-
98
Jan-9
9
May
-99
Sep-
99
Jan-0
0
Jan-0
1
May
-00
Sep-
00
Netherlands 168%
Norway 127%
Algeria 117%
Russia 110%
Swing in 2000
Source: IEA Monthly Database
Source: IEA Monthly Database.
Figure 1: European Monthly Gas Production
Figure 2: European Monthly Gas Imports from the Netherlands,Norway, Algeria and Russia (1995-2000)
a swing of 160% or more, reflecting the country’s role as a swing supplier. Aninteresting development is the increased flexibility of Norwegian gas exports19.
59
19 Statistics on suppliers other than the Netherlands require cautious interpretation. These swings may, in fact,be quite different from the maximum swings provided for in the contract. The statistics do not show the reasonsfor the respective swing and may differ from the swing that might be contractually possible. They do not revealto what extent incentives in the form of summer rebates may influence the importer’s physical import pattern.

60
Box 2: Groningen, a Swing Supplier for Europe
The Dutch Groningen field was discovered in 1959 and began productionin 1964. Of its initial 2,800 bcm of recoverable reserves, 1,600 bcm havebeen produced to date. Twenty-nine production clusters and 300 wells areused to produce the gas. Nederlandse Aardolie Maatschappij B.V., a 50-50joint venture of Shell and Exxon Mobil, is the operator. Production can varygreatly and follow demand variations, according to the temperature or thebusiness cycle, as shown in the figure below. Groningen has thus become themajor swing supplier of Europe. Gas from Groningen marked the beginningsof the natural gas industry in Europe. Given its geological characteristics andits proximity to the main market areas, the Groningen field couldeconomically provide gas with a swing to meet market requirements.
mcm/d300
200
100
0Jan Feb Mar Apr May Jun Jul Aug Sep Oct Nov Dec
Figure 3: Groningen Production Profile in 2000
Source: NAM20.
Groningen can be considered as an exception, however, not only becauseof its intrinsic “predisposition” to act as a swing producer, but also becauseof the policy adopted by the Dutch government in the 1970s to useGroningen to tie in smaller, less flexible fields. This would extend the lifetime of Groningen while providing the necessary flexibility to market thegas from those smaller fields.
Gas from Groningen is “L-gas” - a gas with a lower calorific value than “H-gas” from the North Sea and Russia. L-gas has relatively high nitrogencontent. It is delivered to northwest Europe through a gas grid that isseparate from the grid for H-gas and has separate storage facilities. AsGroningen gas is delivered in line with market requirements for flexibility,only very little storage capacity for L-gas has been developed.
20 Van Nieuwland A.J.F.M (2001).

■ A decrease in UK production swing
Virtually all domestic gas in the United Kingdom is produced offshore in theNorth Sea and the Irish Sea. Traditionally, British gas was produced with a highswing factor, averaging from 150% to 160% up to 1995. Output from theMorecambe field landed at Barrow had the highest swing among the major fields.The swing of gas production in the United Kingdom has declined since 1995,to just 124% in 2000.
The decrease in the swing factor has several causes. The increasing use of gasfor base-load power generation has decreased the percentage of demandrequiring swing. There has also been an increase in the output of gas inassociation with crude oil or condensates. Swing is generally much lower forthis sort of gas because producers have a strong incentive to keep oil productionconstantly high. Finally, with the removal of the British Gas’ monopoly,producers have also been lowering swing to improve profits.
Inte
rcon
nect
or
170%
160%
150%
140%
130%
120%
110%
100%
1985
1986
1987
1988
1989
1990
1991
1992
1993
1994
1995
1996
1997
1998
1999
2000
Figure 4: UK Swing Gas Production
Source: IEA Monthly Database.
The recent sharp decrease in swing production can be partly explained by thebalancing role played by the UK-Belgium Interconnector, which entered intooperation in October 1998 (see Annex on United Kingdom). The decrease inswing production also demonstrates the rather high cost of swing productioncapacity compared with other sources of flexibility, especially interruption. Inthe UK market, approximately 26% of sales are on an interruptible basis,including 69% of sales to the electricity sector. Although the short-term fuel-switching capability of generators and industrial boilers is quite limited, thecountry’s 16 GW of gas-fired power capacity can easily be interrupted withoutjeopardizing security of power supply, as the UK electricity generation industry
61

has between 15 and 22 GW of over-capacity. This will obviously change as sparegenerating capacity is absorbed.
■ An increasing swing in Norwegian production
Although Norway was not considered a swing provider because of the highspecific cost of offshore production and transport, the flexibility that Norwegianproducers are willing to provide to their customers has increased during recentyears, as seen in the graph below. The swing factor was 127% in 2000.
mcm
7000
6000
5000
4000
3000
2000
1000
0
Jan-9
3Ju
l-93
Jan-9
4Ju
l-94
Jan-9
5Ju
l-95
Jan-9
6Ju
l-96
Jan-9
7Ju
l-97
Jan-9
8Ju
l-98
Jan-9
9Ju
l-99
Jan-0
0Ju
l-00
Jan-0
1
Figure 5 : Norwegian Monthly Gas Production (1993-2001)
Source: IEA Monthly Database.
Gas from the Troll West field, a pure-gas field which accounts for about halfof Norwegian sales, offers higher flexibility than the associated gas from Ekofisk.The first Norwegian gas sales in 1976 were from the Ekofisk area to theContinent and from the joint UK-Norwegian Frigg field to the UnitedKingdom. The sales contracts were based on the depletion of reserves inspecified fields. Frigg deliveries had considerable flexibility because they werefrom a non-associated gas field, but Ekofisk had limited flexibility, as its gaswas associated gas, whose exploitation was determined by oil-productionneeds. This situation changed after 1993 when deliveries to the Continent underthe Troll Gas Sales Agreements began. The Troll contracts offer the customersmore flexibility in annual volumes than the Ekofisk contracts. The increasingshare of deliveries under the Troll Agreements is reflected in an increasing
62

63
swing factor as shown in Figure 5. Under the Troll agreements demand ispartly met by gas from smaller fields with Troll serving as a back-up when thesmaller fields are shut in and to provide the contractual flexibility.
■ IEA North America
North American gas production is mainly domestic. Only 1% of US supplyis imported in the form of LNG from outside the region. 18% of US supplyis imported from Canada with a relatively low swing. In the United States andCanada, gas production is steady throughout the year. Swing is 104% in theUnited States and 106% in Canada. These low figures reflect the economicconstraint of long-distance transportation. Storage provides the major part offlexibility needs in the region.
■ IEA Pacific
In the IEA Pacific region, most fields supplying gas to the region have thecharacteristics needed to provide flexible production. When the liquefactionchains were developed in the 1970s and 1980s, however, the high investment tiedup in liquefaction plants and receiving terminals required even higher utilisationrates than for pipeline gas. The rigidity of LNG tanker schedules in the early daysof LNG trade also limited flexibility. Since the investment in liquefaction plantsis independent of distance, even short-haul LNG transport required high utilisationrates and so impeded flexibility of supply. In addition – at least in the beginningof LNG trade – there was little or no over-capacity in tankers, and tankers stuckto a well-defined schedule at both the loading and unloading points.
The swing factor of LNG imports in Japan is low at an average of 113% in2000. Japan is still receiving LNG under long-term contracts signed in the 1970sand 1980s, with very little or no flexibility. The term of new LNG contractswill not reflect this rigidity of the pioneering days of LNG trade. To meet itshigh seasonal requirements, Korea buys spot cargoes during winter peakperiods. Recently, spare capacity at new liquefaction plants in a number ofMiddle East and Asian countries has allowed more flexibility in LNG contractsand supplies. These new trends are analysed in Chapter 5.
Access to spare capacity at import andtransportation facilitiesAny additional supply that may be available from production and fromflexibility in import contracts has to be transported to the place where this supply

64
is needed. This requires that transportation capacity is available. Pipelinecapacity is limited by the pipeline’s diameter and maximum design pressure andby its compressor configuration – the distance between compressors and theratio between the compressors’ inlet and outlet pressure. Similarly, LNGtransport capacity is limited at the receiving point by unloading capacity, tankcapacity, regasification capacity and the availability of tankers. Apart fromthese physical restrictions, there may also be restrictions of access to capacitydue to legal, contractual or regulatory restrictions.
In less mature LNG markets, spare capacity was not available to third parties.But in Europe, it is now available to third parties under a regulated or negotiatedregime. The spare capacity in pipelines will be a factor to watch in the liberalisedmarket. Bottlenecks in the transmission grid may make it impossible totransport available additional supply further downstream. With unbundlingof the supply and transmission functions, a new risk is appearing that thephysical infrastructure of the network will not always be sufficient to allowavailable gas to be flowed to markets.
STORAGE
Functions and characteristicsWithdrawals from storage facilities are a major source of temporarysupplementary gas supply. For short-term requirements of from one to ahundred days duration, gas withdrawals from storage facilities often providethe quickest and most secure form of flexible gas supply.
Storage is a vital part of the gas chain. In the traditional markets, it performsthree different functions to the gas operators :
■ Flexibility- load balancing at any time, hourly, daily, weekly or seasonally, and moreflexibility to end-users;- fulfillment of minimum take-or-pay obligations in times of low demand.
■ SecuritySome European companies have built storage facilities as a buffer againstinterruption of supplies and they maintain strategic reserves to ensuresecurity of supply.
■ More-efficient grid designStorage allows a more-efficient design of the grid. Storage can cover peakdemand and so the pipeline can be smaller and more fully used throughoutthe year.

With the introduction of competition, storage has new roles to play in gastrading. These new roles are analysed in Chapter 4.
Depending on the function, there are different requirements for the locationof the storage. Storage intended mainly to provide flexibility is best located, ifpossible, close to the market it serves. Storage intended to make up for supplyinterruptions can be placed along the delivery route of the gas to be replaced,closer to the market than the sources of the most probable disruptions.
In traditional markets, storage facilities play a vital role in meeting peakdemand. During the cold day of 2 January 1997, storage in France provided1.3 TWh, or 52% of that day’s gas supply – a rate sustainable for only arelatively short period.
Different types of storage are more or less suitable for the purposes describedabove. Suitability depends primarily on the volume and rates of withdrawal forwhich the storage facility is intended. Three major types of geological storageare used in IEA countries: depleted gas fields, aquifers and salt cavities. A fewfacilities are also developed in disused mines and a commercial project is underway to test storage in lined-rock caverns.
Depleted fields and aquifers can store a large working volume of gas at low cost.However, the withdrawal rate for a given working volume is limited. So theyare best suited for seasonal balancing and for storing strategic reserves. Storagefacilities built in salt cavities offer a high withdrawal rate for a given volumeof working gas and can be cycled more than once a year. They are thus well-suited for daily or weekly balancing. However, their volume specific costs arehigher than for depleted gas fields or aquifers.
Gas can also be stored in liquid form. However, because methane liquefies onlyat -162˚C, storing gas in liquid form is very expensive. Storage in liquid formis therefore used only in the LNG supply chain at receiving terminals, or for“needle peak” management of remote parts of major transmission anddistribution systems, in LNG peak shaving facilities.
Storage development in IEA
■ IEA North AmericaIn the United States, there are 415 underground gas storage facilities in 30 states.They have a working capacity of 110 bcm, representing 17% of average annualgas consumption in 2000. Canadian storage capacity is an estimated 17 bcmof working gas, or 19% of average annual gas consumption.
65

North American storage facilities were built primarily for commercial purposesto balance remote gas supplies and seasonal market demand, while minimisingthe size of pipelines and transportation costs. However, storage is increasinglybeing used for trading purposes. Several market hubs are now operating in NorthAmerica, offering storage services such as gas loans, gas balancing and peakingservices (see Chapter 4).
In North America, the continuing restructuring of the gas industry has resultedin increasing demand for new and more flexible storage sites, especially closeto a trading hub. Storage capacity is expected to increase with rising demandfor natural gas and with growing reliance on remote areas like Alaska.
■ IEA Europe
Europe has ample commercial storage capacity. The working capacity of the94 facilities in IEA Europe is 58.8 bcm, or 13% of consumption. Storagecapacity has grown rapidly in recent years. Since 1993, 13 new sites have beenbuilt in Western Europe, adding 15 bcm of capacity. Three countries dominatethe European storage scene: Germany (with 39 storage sites and 18.6 bcm ofworking capacity), Italy (with 10 sites and 12.7 bcm) and France (with 15 sitesand 10.5 bcm).
Future requirements for storage capacity will depend on two counteracting forces.On the one hand, the increasing share of supplies coming from more distantsources with high load will swell the need for new storage capacity. On the otherhand, the increasing share of gas used as a base-load fuel in power plants willdecrease the demand for swing and abate the need for new storage21. Inaddition, the opening of markets will provide more market mechanisms to makebetter use of spare capacity in pipelines and other infrastructure.
Europe has a large geological potential for all types of storage facilities. Plannedenlargements of existing facilities and 30 new underground storage projects areexpected to meet Europe’s commercial storage requirements for the next 15 years.Furthermore, countries like the Slovak Republic and Latvia, which are close tothe IEA European region, are also well endowed with gas storage capacity.
■ IEA Pacific
The use of underground gas storage is not common in the IEA Pacific region.Japan and Korea do not have underground gas storage, but rely on storage attheir LNG regasification terminals.
66
21 See Chapter 2.

In Australia, the gas transmission network is not integrated because of thegreat distances between consuming areas. Four depleted gas fields have beenconverted into storage facilities to cope with seasonal demand fluctuations.
Liberalisation of the gas market is now under way in Japan and Korea. It mayaccelerate the expansion of gas transmission and storage. However, geographicconditions in Japan do not lend themselves to the building of transmissionpipelines and underground gas storage.
67
(a) Ratio of working gas to annual consumption.(b) Ratio of working gas to total consumption multiplied by 365.(c) Ratio of working gas to residential and commercial consumption multiplied by 365.Figures do not include peak shaving units.
Source: IEA, Natural Gas Information, 2002, and Country submissions.
Table 2: Underground Gas Storage in IEA Countries in 2000
Number NumberCountry/ Number Working Peak daily Per cent of days of daysregion of storage gas volumes deliverability rate of gas of average of firm
facilities (million cm) (million cm/day) consumption consum- demand(a) ption (b) (c)
IEA Europe 94 58,761 1,243.98 13 47 116
Austria 5 2,820 28.3 37 134 459
Belgium 2 654 11.3 4 15 42
Czech Republic7 2,147 42.5 23 85 192
Denmark 2 810 24 17 60 311
France 15 10,490 182 26 95 182
Germany 39 18,556 425.2 21 75 157
Hungary 5 3,610 46.58 30 109 206
Italy 10 12,747 267 18 66 184
Netherlands 3 2,400 144 5 18 42
Spain 2 1,274 9.7 8 28 160
UK 4 3,253 63.4 3 12 26
IEA Pacific 4 1,244 14.2 1 4 16
Australia 4 1,244 14.2 6 20 106
IEA North
America453 127,573 2912 17 64 177
Canada 38 17,167 710.8 19 69 208
United States 415 110,406 2201.2 17 63 173
IEA 551 187,578 4170.18 14 52 144

Line-packLine-pack is the storing of gas inside the pipeline network by boosting the linepressure above the delivery pressure. It can be used as an initial means tobalance supply and demand fluctuations during the day. Line-pack is a limitedtool as it requires some time to build up, but it can be helpful especially whena cold weather front is coming.
Line-pack capacity depends on the design of the gas transmission system22. Somedesigns are based on the principle that transmission capacity and supplycapacity are matched and the transmission system cannot be used for diurnalstorage. In other designs, the transmission system can be used not only fortransporting gas from the supply sources to the end-users but also as a meansto balance the fluctuations in demand that occur during the day.
The use of line-pack differs strongly among countries, according to the designof the transmission grid and supply patterns. In the United Kingdom, forinstance, line-pack has traditionally covered up to 3% of total demand. In Spain,the figure is 0.4%. In some circumstances, extra compression or a larger pipemay be a useful alternative to storage by increasing the potential for line-pack.
Storage at LNG terminalsAlthough limited, storage at LNG import terminals plays a key role in someimporting countries, especially where geological options for underground gasstorage are limited, such as Japan, Korea, Belgium and Spain.
In itself, LNG provides a valuable source of flexible supply and the growth inthe short-term market for spot cargoes gives LNG buyers a chance to diversifyimports still further and eventually to adapt supply to demand by using theLNG spot market. This issue is discussed in Chapter 5.
LNG terminals - except in the US - were not in the past open to third parties.So, storage capacity in LNG tanks was an operational tool under the controlof traditional companies. This is changing in Europe, with the coming ofthird-party access to terminals, and the idea is being actively debated in Japanand Korea. This issue is discussed in Chapter 5.
68
22 GTE (2001).

DEMAND SIDE MEASURES
Gas suppliers often conclude interruptible contracts with certain large industrialconsumers and power generators. In return for a discount on the gas price, thesecustomers reduce or stop their gas off-takes at the request of the supplier. Therequest is subject to certain criteria, often linked to temperature. “Interruptible”customers are usually equipped to switch from gas to other fuels or electricity,or to suspend the part of their production based on gas. Interruptible customerscan make an important contribution to flexibility. Gas suppliers can arrangewith these customers to decrease demand during times of tight gas supplies.
Interruptible contractsInterruptible gas supply contracts enable the buyer to get gas at a discount offrom 2% to 20% throughout the year23. In exchange, the supplier may
69
Table 3: LNG Regasification Terminals in Operation in IEA Countries in 2000
Number Storage capacity Working capacity(thousand cm of LNG) (million cm/day)
IEA Europe 9 1,660 149.8
Belgium 1 260 17.8
France 2 510 53
Greece 1 75 5.4
Italy 1 100 10
Spain 3 460 50.6
Turkey 1 255 13
IEA Pacific 25 14,178.9 741
Japan 23 12,178.9 604
Korea 2 2,000 137
IEA North America 2 277.5 32.5
United States (a) 2 277.5 32.5
IEA Total 36 16,116.4 923.3
(a) Everett, Massachusetts and Lake Charles, Louisiana.The detail by country is given in Annexes.Source: IEA (2002b) and Country submissions.
23 CERA (1998).

interrupt the gas flow according to mutually agreed criteria, normally dependingon temperature. In some contracts, however, the supplier may interruptdeliveries as he sees fit, up to a maximum number of days per year. Customers,in turn, are free within limits defined by a minimum take-or-pay obligation -which may be zero on any single day - to vary the amount of gas they receive.
At present less than 15%24 of gas sales in IEA Europe is on an interruptiblebasis. This is an average figure and individual country situations will bedifferent.
Most customers with interruptible supply contracts have dual-firing capability.They are expected to hold non-gas capacity and fuel in reserve, so that theycan continue to operate during an interruption. Nevertheless, ContinentalEuropean customers have rarely been interrupted as often as the contractualterms allow and there is reason to question whether they are really interruptible.This could change in a more competitive environment.
In the US and the UK, interruptible customers are really interrupted and aretherefore really interruptible. Interruptible contracts are not just a way to offerdiscounts to a certain class of customers, as is the case in some ContinentalEuropean countries, but a management tool for balancing supply and demand.In the United States, in 1998, total sales on an interruptible basis amountedto 140 bcm or 25% of total gas sales. Thirty-eight per cent of sales to theindustrial sector were on an interruptible basis (93 bcm), 36% of sales toelectric utilities (33 bcm) and 15% of sales to commercial consumers (13 bcm).
In the United Kingdom, sales of gas on an interruptible basis accounted for26% of all gas sales in 2000, mainly to electricity generators. Interruptible salesto the electricity generation sector were an estimated 68% of total sales tothat sector. Due to over-capacity in the UK electricity industry, interruptionsof gas-fired power plants have no effect on electricity sales.
Fuel-switchingFor decades, natural gas has competed with fuel oil in industrial markets.Depending on the use, it may be possible to switch from gas to another fuelwithout any interruption in the production process. But in uses such as makingsheet glass, where the gas flame is directly applied to the material, it is very hardto switch at short notice to another fuel.
70
24 Most gas supplying companies hold a substantial share of interruptible contracts with customers they neverinterrupt in practice. As a result, effective short-term switching capacity may be lower than usually stated.

The gas use most suitable for fuel-switching is in boilers, either for steamraising or for power generation. For steam raising purposes in the industrialsector, gas can be replaced by residual fuel oil. In the electricity sector, with moreand more gas used in combined-cycle gas turbine plants, the only alternate fuelwill be distillate. Exact figures on various countries’ real (as opposed to nominal)capacity for rapid switching from gas to other fuels are hard to find. A recentIEA survey25 identifies short-term fuel-switching capability in IEA countries.The survey focuses on short-term fuel-switching from oil to other fuels in thecontext of an emergency response measure. But it also examines the effectthat gas supply disruptions might have on oil demand and, in this context,provides information on the short-term fuel-switching capability of the powerand industrial sectors in IEA countries.
Figure 6 below illustrates the results of the study. For the IEA as a whole, fuel-switching capability from gas to oil by industrial customers and power generatorsis estimated at 3.5 mb/d (corresponding to about 490 mcm/d). This result doesnot take into account the utilisation rates of plants. It represents a maximumrated capability.
This 490 mcm/d is concentrated in only five countries: the United States(165 mcm/d), Japan (106 mcm/d), Korea (48 mcm/d), Germany (25 mcm/d)and Italy (25 mcm/d).
71
25 IEA (2002f).
Total IEA fuel-switching from gas into oil 490 mcm/d (3.5 mb/d)
Other119 mcm/d
United States165 mcm/d
Japan106 mcm/d
Korea48 mcm/d
Germany25 mcm/d
Italy25 mcm/d
Source: IEA (2002f).
Figure 6: IEA Fuel-Switching Capabilities (1999 data)

These results suggest that name-plate short-term fuel-switching capability byindustrial customers and power generators amounts to about 12% of averagedaily gas consumption in IEA Europe, to 9% for IEA North America and to50% for IEA Pacific. The figures should be considered as maxima, since theswitching capabilities indicated might no longer be effective, either becauselocal sources of residual fuel oil in some countries no longer exist, or because theequipment has not been maintained. In some countries, new environmentalconstraints rule out switching to a more polluting fuel.
In principle, all gas-fired power generation could be cut off and replaced byelectricity fed into the electric grid so long as there was enough spare non-gas-generated power and transportation capacity. This could be done simply to bringcosts down but it could also be done to compensate for interruptions in gas supply.
Additional information on fuel-switching capacity in the power sector isavailable in Table 4. The table shows the share of thermal generating capacity
72
Table 4: Multi-Fired Electricity Generating Capacity in IEA Countriesat 31 December 2000 (GW)26
IEA NorthIEA Europe IEA Pacific
America
Total electricity generatingcapacity (public utilities + 944.16 682.22 365.26autoproducers)
Total capacity by combustible fuels 663.19 350.24 242.80
Of which Single fuel-fired 394.64 220.84 206.05
Of which Multi-fired 268.55 129.40 36.75
Solid-Gas 40.29 8.72 1.00
Solid-Liquids 6.29 47.59 4.62
Liquids-Gas 56.9827 55.72 30.49
Liquids-Solids-Gas 164.99 17.37 0.64
% multi-fired/total generating capacity 28% 19% 10%
% multi-fired/thermal generating capacity 40% 37% 15%
% liquids-gas/multi-fired generating capacity 21% 43% 83%
% liquids-gas/total generating capacity 6% 8% 8%
Source: IEA (2002g).
26 The figures in the table are maxima, as the rate of utilisation is not taken into account.27 ESAI, an independent research firm based in Boston, estimates at about 60 GW the true dual-fired gas
/heavy fuel oil capacity in the US (ESAI, 2001).

in total electricity capacity in the three IEA regions, the share of multi-firedpower plants and the plants that can switch from or to natural gas.
There are important differences by region. IEA North America has a largemulti-fired capacity, 28% of total electricity generating capacity, compared with19% for IEA Europe and 10% for IEA Pacific. The share of multi-fired powerplants in thermal generating capacity is also higher in IEA North America(40%) than in IEA Europe (37%) and IEA Pacific (15%).
Natural gas plays a large role in switching capacities. Twenty-one per cent ofmulti-fired power plants28 in IEA North America can switch from oil to gasand back again. This represents 6% of total electricity generating capacity andcan exert a great effect on markets and prices, in particular in very cold weather.This is further analysed in Chapter 4. Forty-three per cent of multi-fired powerplants in IEA Europe can switch between oil and gas. This represents 8% oftotal capacity. In IEA Pacific, 83% of multi-fired power plants, 8% of totalcapacity, can alternate oil and gas.
Demand-side reaction to price signalsGas customers with fuel-switching capabilities, whether industrial customersor power generators, may themselves choose to switch fuels in response tomarket signals. In Europe, many power generators can call on alternativegenerating facilities that use other fuels. Increasingly, they may call on electricityprovided by the power market. But, as a matter of fact, industrial fuel-switchingin response to price signals is limited in Europe, due to the practice of peggingthe gas price to the price of substitute fuels.
In the United States, on the other hand, many industrial consumers have theoption of switching to other fuels when natural gas prices rise29. This optionwas exercised by some industrial users in 2000-2001, when natural gas pricesrose dramatically. Another option chosen by some industrial users was toreduce or stop operations and sell off gas they had already contracted andpaid for to the highest bidder. Examples include Terra Nitrogen, which shutdown one of its fertiliser plants in 2000 and cut back operations at another,and Mississippi Chemical, which halted fertiliser production altogether. Bothcompanies sold off their natural gas futures contracts30.
When spot prices in the New York City market rose from $2.65 to $15.34/MBtuin January 2001, there was evidence of fuel-switching by gas customers as well
73
28 If only liquid/gas power plants are taken into account.29 According to EIA (1997b), 39% of industrial natural gas consumption in 1994 could have switched to
other fuels. The IEA Survey (IEA 2002f) indicates a rate of 28% in 1999.30 EIA (2001b).

as interruption of gas service to non-firm customers in the Northeast US. Thesteep rise was due to a sudden surge of cold weather and a deliverability constraint.
The responsiveness of demand ultimately depends on how much the responsecosts, relative to the prevailing natural gas price, and the time required toimplement that response. The moderate responses to very high US gas pricesin late 2000 and early 2001 in US suggests that the costs of fuel-switching couldbe higher and the delays longer than might have been thought31.
74
Table 5: Flexibility in IEA Countries in 200032
IEA NorthIEA Europe IEA PacificAmerica
Production swing 105% 134% 116%
Import swing 119% 118% 113%
Supply (production + import) swing 107% 125% 109%
Consumption swing 137% 152% 111%
Storage(working gas as a percentage 17% 13% 1%of annual consumption)
LNG tanks (a)(tank capacity as a percentage 0.02% 0.2% 7%of annual consumption)
Fuel-switching as a percentage of 9% 12% 50%average daily gas consumption (b)
Share of temperature-sensitive 35% 40% 23%consumers in total consumption
31 EIA (2001e).32 The regional aggregated figures in this table are representative for IEA North America, which can be considered
as one market. The situation is different in IEA Europe and Pacific, where the situation of individual countriescan be quite different from the average one. The lack of interconnections with sufficient capacity may restrictflexibility provisions in some peripheral European countries.
(a) 1 cm of LNG = 593 cm of gas.(b) Calculated from the IEA survey on fuel-switching (IEA 2002f). This daily figure cannot be translated intoan annual figure, as fuel-switching capability and interruptions are normally limited to a number of days.

CONCLUSION ON THE CURRENT STATE OF FLEXIBILITY
At present storage volumes, the number of interruptible supply contracts,swing potential in indigenous production and import contracts in IEA gasmarkets are all high, as indicated in Table 5, though the situation in individualcountries may be quite different. Circumstances will evolve with the continuedgrowth in gas demand, new supply trends and market liberalisation. Theimpact of these new trends is discussed in Chapters 4 and 5.
75


MARKET LIBERALISATION: ANEW CONTEXT FOR FLEXIBILITY
INTRODUCTION
Until now flexibility in traditional gas markets has mainly been a matter ofvolume, and has been provided by traditional instruments, such as supplyswing, interruptible contracts and storage. The role of storage was confined largelyto meeting variations in demand and interruptions of supply. There were fewshort-term opportunities to arbitrage between different energy commodities anddifferent markets. As markets are being opened through third-party access, aswell as by abolition of state monopolies and exclusive concessions for transportand distribution, competitive markets for gas are emerging and new gas servicesare being developed. Gas flexibility in its various forms is becoming a tradeableservice and is valued by the market. Experience in North America and theUnited Kingdom indicates that TPA leads to gas-to-gas competition and theemergence of marketplaces, usually trading hubs. Gas is traded like any othercommodity on such a marketplace. Once there is sufficient liquidity, spotmarkets for immediate and forward delivery emerge. In places with a liquidforward market, futures markets evolve to hedge exposure to price volatility. Pricevolatility modifies the role played by traditional flexible tools, such as storage,which is increasingly used or price optimisation rather than simply to managevolume.
With the opening of gas and electricity markets, opportunities for price arbitragebetween the two commodities arise. In countries where gas is used for powergeneration, arbitraging itself permits a completely new instrument to provideflexibility. With arbitrage between the gas and electricity markets, gas demandand supply can be partly brought in line by drawing on supply and demandin the electricity sector.
This chapter analyses the new flexibility emerging with market liberalisation.The first section deals with the emergence and development of gas trading, withreference to the North American and British experiences. It also discusses thelatest trends in Continental Europe, in particular the recent emergence oftrading hubs for gas. The second section analyses the emergence of flexibilitytrading and the changing role of traditional flexibility instruments in this new
77
4

environment, especially that of underground gas storage. The third sectiondiscusses the new features and opportunities arising from the development ofgas/power arbitrage that results from the development of liberalised marketsfor natural gas and power.
THE EMERGENCE AND DEVELOPMENT OF GAS TRADING
Marketplaces: new hubs
With the introduction of third-party access, new trading opportunities areemerging in places where different owners’ pipelines meet each other, as oneowner may now use the other’s line33. Some places, where several pipelines meetand where storage facilities and consumption centres are both close by, developinto a marketplace for gas – a hub. Hubs provide the means to increase short-term exchanges between parties; short-term/short-haul transportation services;and opportunities to reduce price risk exposure34.
For a hub to qualify as a market, the hub operator must provide the followingservices: interconnections between the pipelines to allow the gas to beinterchanged between the systems and, ideally, storage facilities; ease oftransportation to and from the hub; and several associated services, such asbalancing35 and recording of title transfers.
An important prerequisite for successful short-term trading at a hub is the speedat which contracts can be concluded. Standardised contracts expedite trading.An active approach on the part of participating gas operators can also contributeto the success of a hub.
Short-term balancing of supply and demand is a major function of a markethub. Storage at hubs, particularly when they are close to markets, is a valuabletool for traders. Storage adds flexibility to the marketplace, both in physicalterms, via access to gas (at times of peak demand) and in trading terms, byproviding physical hedging and the ability to arbitrage.
The number of sellers and buyers at a hub is important: it needs to be largeenough to create a liquid market, where there is sufficient supply and demandfor gas to be traded rapidly and freely. It also needs to be large enough so thatone transaction will not alter the market price. The size of the “churn” – the
78
33 CEC (2000).34 EIA (1997a).35 A short-term interruptible arrangement to cover a temporary imbalance between supply and demand.

ratio of traded volumes at a hub to actual physical volumes – is generallydeemed the yardstick for when a hub becomes a successful pricing reference.
In liberalised gas markets, two different types of marketplaces have emerged.On the one hand, there are gas hubs, like Henry Hub in the United States orthe Alberta Energy Company (AECO) hub in Canada. On the other hand, thereis the national balancing point (NBP) in the UK.
The NBP is a virtual trading place covering the whole network of Transco, theUK gas transmission company. Due to the short average transport distance andthe high number of inlet and outlet points at relatively short distance, theUK system is like a grid. Gas on which the entry fee has been paid is treatedas being at the NBP, in other words, on the marketplace. To take the gas fromthe NBP an exit fee has to be paid. As on traditional marketplaces, transportcosts to and from the marketplace (entry and exit fees) may differ for individualmarket participants but this is irrelevant to the trading of the commodity onthe marketplace.
In 1994, the NBP became an informal market for gas trading among UKpower generators. Transco’s introduction in September 1996 of a tight dailybalancing system, backed by penalties, led to NBP’s using geographical locations– such as Bacton, the main landing point for North Sea gas in England, or itsScottish equivalent, St. Fergus – as the main places for spot gas trading activity.Approximately 15% of the gas at the beach36 is sold directly to the wholesalespot market. A similar proportion is sold as one-to-three year contracts, withthe remainder being sold on traditional long-term contracts, most of themindexed to oil prices. Currently, about 80 traders are active on the NBP andthe churn ratio is 17 to 1.
In the US, the 278,000-mile gas pipeline system includes numerous pipelineinterconnections. Before the establishment of open access in 1986, little couldbe gained from using these interconnections. Open access to transport andstorage has completely modified the picture. It is now possible for everyone tomove gas between pipeline systems and between pipeline and storage systems.And this has engendered hubs as natural transfer and trading points of gas.
North America has 39 trading hubs, of which Henry Hub is by far the largest.In the United States, gas companies promoted hubs to increase trade in gas andcapacity across pipeline and storage systems and to meet the need for short-
79
36 In the UK, when gas has been brought ashore to a terminal by producers but is not yet in the NationalTransmission System, the gas is called “at the beach”.

term balancing services that were formerly provided by pipeline companies underbundled services37.
Henry Hub in southern Louisiana is the largest hub in the world. It connectstwelve pipelines and has access to three salt storage caverns. It is accessible tomajor producers from both onshore and offshore Louisiana. Information onprices and other relevant matters is readily available. It has a very high liquidity:its churn ratio is approximately a hundred to one. Henry Hub also serves asthe delivery and reference point for the New York Mercantile Exchange(NYMEX) gas futures contract and is the reference for all gas export contractsto Mexico.
80
37 EIA (1997a).
The type of services provided by market centres and hubs varies significantly.The Federal Energy Regulatory Commission’s Office of Economic Policyprovides a comprehensive list of the available services. The major ones are:
Balancing – A short-term interruptible arrangement to cover a temporaryimbalance. This service is often provided in conjunction with “parking” and“loaning”.
Electronic Trading – Trading systems that either electronically matchbuyers with sellers or facilitate direct negotiation for legally-bindingtransactions. Customers may connect with the hub electronically to entergas nominations, examine their account position, or access e-mail andbulletin-board services.
Loaning – A short-term advance of gas to a shipper by a market centre thatis repaid in kind by the shipper a short time later. Also referred to as“advancing”, “drafting”, “reverse packing” and “imbalance resolution”.
Parking – A short-term transaction in which the hub holds the shipper”s gasfor redelivery at a later date. Often uses storage facilities, but may also usedisplacement or variations in line-pack.
Peaking – Short-term, usually less than a day and sometimes hourly, salesof gas to meet unanticipated increases in demand or shortages of gasexperienced by the buyer.
Storage – Storage that is longer than “parking”, such as seasonal storage.Injection and withdrawal may be separately charged.
Box 3: US Market Centres and Hub Services

Spot and futures markets Once trading at a hub develops into a liquid market, spot and futures marketswill form and a market price for immediate and future delivery will emerge.Spot markets usually start with over-the-counter trades based on standardisedagreements for a fixed volume of gas. They are made either bilaterally betweenthe two parties concerned or through a broker. Gas delivery can be for periodsof between one day and one year, either for prompt (very short-term) orforward (long-term) delivery at a defined location, usually the hub.
Deliveries in the future are dealt with in forward contracts, which are acommitment to deliver or take a specific amount of gas, usually in units of10,000 MBtu, at a defined time and place for an agreed price. The financialtransaction takes place on the day of delivery. Forward contracts are tradedover the counter, in customised one-off transactions between a buyer and aseller.
Futures markets emerge in countries that have fully liquid spot markets forimmediate and forward delivery. Although they have similar names, “forward”contracts and “futures” contracts are quite different instruments. Gas futuresare usually paper trades that track the daily movement of the expected futureprice until the expiration date of the contract, when gas must be delivered orthe differential between the agreed price and the spot price on that day mustbe settled in cash. Unlike forward deals, which may be traded over the counterand always related to final physical delivery, futures contracts are traded onorganised commodity exchanges with standardised terms. Futures contracts –because they are financial hedging instruments – can be traded independentlyfrom delivery to the underlying spot gas marketplace. They nevertheless needa spot market as a final reference point.
Futures markets provide an independent and transparent pricing signal for futureprice development and this can be used as a pricing indicator for other contracts.
81
Title Transfer – A service in which changes in ownership of a specific gaspackage are recorded by the market centre. Some gas titles may be transferredseveral times before the gas leaves the centre. This service is merely anaccounting or documentation of title transfers. It may be done electronicallyand/or by hard copy.
Wheeling – Essentially a transportation service. Transfer of gas from oneinterconnected pipeline to another through a hub, by displacement, includingswaps, or by physical transfer over a market-centre pipeline.
Source: EIA (1997a).

The future price represents the current market opinion of what the gas will beworth at some time in the future. It is the only indicator (although by no meansa correct prediction) of the expected spot price of the commodity in the future.Futures prices also serve as a stimulus to store or release gas from storage.
The other main function of the futures market is to transfer risk. Hedging allowsmarket participants to lock in prices and margins in advance. Hedging reducesexposure to price risk by shifting it to those with opposite risk profiles or tospeculators who are willing to accept the risk in exchange for possible profit.By using futures contracts, anybody who is dependent on gas prices may offsetor minimise the risk inherent in a fluctuating gas price. A gas buyer may havean interest in buying gas futures within a certain price limit to hedge the costof using gas as an input into his productive activity. A seller, perhaps a smallindependent producing company, may want to hedge its earnings to meet itsminimum income requirements such as interest payments on its financing.
Three broad categories of traders can be identified in futures markets – hedgers,speculators and arbitrageurs. Hedgers enter the market to offset a position withthe intent of managing risk. In hedging one transaction is protected by another.Speculators are willing to accept the risk in exchange for profit. They take aposition with the intent to earn a margin. Speculators provide the market withliquidity. Arbitrageurs take advantage of momentary disparities between pricesof the commodity in two different marketplaces. They make markets moreefficient by bringing prices of different marketplaces in line with each other.Increasingly, arbitrageurs will trade across commodities with the effect thatpressures on gas prices may have their origins in non-energy commodities.
Various types of regulations have been introduced to prevent undue volatilityin or influence on the markets. These regulations include limits on daily pricemovement, position limits and surveillance to detect trading irregularities.
NYMEX launched the world’s first natural-gas futures contract in April 1990with Henry Hub as the reference point. Volumes and “open interest” (thenumber of futures or options natural gas contracts outstanding in the market)have grown rapidly, and the NYMEX gas contract is the fastest growinginstrument in the exchange’s history. The estimated trading volume, around725 Btu (20 bcm) of gas a day, is ten times the amount of gas delivered dailyin the United States. In October 1992, NYMEX marked another milestonein the energy markets when it launched “options” on natural-gas futures,giving market participants still another instrument to manage their market risk.
The exchange allows hedgers and investors to trade anonymously throughfutures brokers. NYMEX gas instruments have attracted private and institutional
82

investors who seek to profit by assuming the risks that the industry seeks toavoid in exchange for the possibility of rewards. A wide cross-section of the gasindustry is active on the futures market from producers to end-users: producers,processors, local distribution companies and marketers, industrial andcommercial gas users. The marketers, predictably, are the largest participantsaccounting for 69% of the open interest in 2000.
Gas suppliers use the NYMEX futures contracts to provide a variety of servicesto help customers manage their price risks. These include fixing gas costs orexpenditures and offering ceiling prices. Marketers often manage the marketrisk for their customers. As a result, local distribution utilities themselvesaccounted for only 1.7% of the reportable open interest for 2000 – althougha much larger share of transactions was performed on their behalf.
In Canada, the “Natural Gas Exchange” (NGX), located in Calgary, provideselectronic trading and clearing services to natural-gas buyers and sellers inCanadian markets. The NGX started service in February 1994. Over the pasteight years, NGX has grown to serve over 150 customers with trading activityaveraging 200,000 TJ (5 bcm) per month. NGX is wholly owned by the OMGroup, the world”s leading provider of transaction technology. In Canada, theregulation of commodity trading is under provincial jurisdiction. The AlbertaSecurities Commission is NGX’s lead regulator.
In the United Kingdom, the International Petroleum Exchange (IPE) launchedgas-futures contracts in 1997. They are based on deliveries of natural gas at theNBP. The IPE gas futures market is a transparent, screen-based system, whichprovides a mechanism for risk management, hedging and in some cases thephysical delivery of gas. The IPE traded a daily average of 60 million thermsof natural gas, or approximately 60% of the UK’s daily consumption.
Price volatility38 is inevitable in competitive markets. It is a fact of economiclife in all commodity markets. When the industry operates close to full capacity,small changes in supply and/or demand or relevant news items or sound bitesmay cause strong market pressures and substantial price increases or decreases39.This was illustrated in the United States in late 2000, when gas supplyconstraints led to a price surge.
Excessive and sustained price fluctuations can put large, capital-intensivesupply projects at risk, especially those that require long lead times, such as LNGterminals and long-distance pipelines. In the US, sustained large shifts in pricemay preclude the building of new LNG facilities even though they could
83
38 Volatility is measured as the relative deviations around an average price value. 39 EIA (2001e).

moderate natural-gas price fluctuations in the future. This problem is commonto all volatile energy sources, notably in the oil markets, where the oil pricecollapse in 1998/99, followed by high peaks in 2000, created major problemsfor investors.
It is hard to identify and weigh causes of price volatility. However, it is essentialthat the new markets work efficiently, free of the abuse of market power by well-positioned players and of inappropriate trading practices. For instance, althoughthe market needs speculators to ensure liquidity, their actions can seriouslyaffect the price of the commodity. During 2000, when US gas prices soared,it appears that a huge inflow of speculative money exacerbated upward pressureon prices. Gas price trends in that period clearly reflected overreaction to theactual imbalances in supply and demand. Trading can thus cause additionalvolatility – volatility not based on responses to perceived changes in current orfuture fundamentals but on the desire for pure trading profits.
The US exchanges are under the control of the US Securities and ExchangeCommission (SEC). With the emergence of increasingly complicated risk-hedging instruments, there is a rising risk of misuse or lack of control, as wasdemonstrated by the tremendous pressure on energy merchants in the wake ofthe spectacular bankruptcy of Enron in 2002. However, even this failure didnot disrupt the working of the gas markets, which were liquid enough to bridgeany shortfall that might have been caused by Enron’s disappearance from thetrading floor. As a consequence of the Enron bankruptcy, the stocks of some
84
10
9
8
7
6
5
4
3
2
1
0
Henry Hub
Spot UK (Bacton)
Jan-99 Jan-00 Jan-01 Jan-02
$/M
Btu
Source: World Gas Intelligence, European Gas Matters.
Figure 7: Spot and Forward Prices in UK and US

major US energy companies have fallen more than the stock averages overthe past twelve months. Some of them are also under investigation by theSEC and the Federal Energy Regulatory Commission for possible trading oraccounting irregularities. Serious questions surround the issue of risk-hedgingoperations and overly “creative” accounting practices.
The recent events in US energy markets have brought to the fore the need formitigating counter-party risk in gas trading and ensuring that trading marketsdo work fairly and efficiently. Spot and futures markets do offer new flexibilityto individual buyers and sellers. But if the system does not send the propermarket signals so that the underlying physical flexibility instruments are builtin time to cover variations in supply and demand, the market will remainvery volatile. Volatility is unlikely on over-supplied markets, but is a real threatwhen the market is tight.
Emerging trends in Continental Europe
■ Zeebrugge Hub
The Zeebrugge hub in Belgium is the first gas-trading hub to be launched inContinental Europe. It is located at a coastal town where gas pipelines fromthe United Kingdom (Interconnector) and Norway (Zeepipe) meet. There isalso an LNG import terminal and a link into the Belgian national gastransmission network. Zeebrugge is linked by large pipelines to France, theNetherlands and Germany. These pipelines and terminals are all interlinked,so that gas can physically be moved or exchanged between them.
The Belgian company Distrigas with the support of 40 other gas companieslaunched Zeebrugge as a market hub in November 1999. It is operated by aDistrigas subsidiary, Huberator. Huberator has two functions: to managephysical gas flows between the different inlet and outlet points in Zeebruggeand to act as a broker between the partners using the Zeebrugge hub. Threemain services are offered: matching nominations40 (verification and confirmationof corresponding trade nominations), title tracking and allocation.
Distrigas has developed two standard contracts: a Hub Services Agreement(HSA) between the hub operator and parties using the hub, in essence arulebook on hub operations, and the Zeebrugge Gas Trading Terms andConditions, under which two parties may enter into a standardised gas salesagreement at the hub.
85
40 The notification to put into effect a contract or part of a contract, e.g., a gas flow nomination from a shipperto advise the pipeline owner of the amount of gas it wishes to transport or hold in storage on a given day.

Under the HSA, Huberator undertakes to provide dispatching, balance checksand matching services on a 24-hour basis. Balance checks are necessary, becauseno shipper is permitted to have a gas surplus or shortfall at the hub at the endof the day. Huberator also confirms effective hourly deliveries, redeliveriesand allocation – when capacity constraints on pipelines leading to the hub requirea prorationing of shippers’ nominations.
The Zeebrugge trading document is a physical gas contract, priced in euros pergigajoule under which volumes in GJ have to be matched each hour. Althoughthe trading document is voluntary, it has gradually been adopted for allZeebrugge transactions. Payments due in the event of mismatched deals aresettled by the traders involved, without involvement by Huberator.
The churn ratio at Zeebrugge is seven-to-one. Forty-four companies nowactively trade at the hub. Two elements have been of critical importance to thesuccessful development of the hub. One was the opening of the UK-BelgiumInterconnector in October 1998. This enabled arbitrage between the UK spotmarket and the Continental market where virtually all gas business was still doneon a long-term basis, with gas prices indexed to oil. The other was Distrigas’skeen interest in developing Zeebrugge as a commercial gas hub.
■ Bunde
A second hub is being developed at Bunde in Germany. Bunde is a crossingpoint for three important pipelines. The first carries Dutch gas from thedelivery point at Oude Stadenzijl to the east and south of Germany. Thesecond carries Norwegian gas from the Emden/Dornum landing points tothe South of Germany. The third, the Midal system built to compete with theexisting pipeline system, links North Sea gas to Russian gas imports. TheEtzel, Dornum and Rheden storage facilities are close by and Bunde is also closeto the Ruhr area, a major industrial area of Germany.
Two groups of companies are preparing to launch two parallel hubs. One isbeing developed by EuroHub BV, which is wholly owned by Gas TransportServices, the transport arm of the Dutch company Gasunie. The other is thework of NWE-Hubco, a joint venture between the two German companies,Ruhrgas Transport and BEB Transport, and the Norwegian company Statoil.
Gas Transport Services is concentrating on offering capacity at the pipelinejuncture and title tracking. Since the end of February 2002, EuroHub hasprovided a title-transfer service in the high-calorific Oude- Statenzijl-Bunde-
86

87
Emden gas network. It is planning to expand its hub services soon to potentialfurther hubs in the Netherlands.
Ruhrgas, BEB and Statoil came together in November 2001 to form the NorthWest European Hub Company to manage the logistics and infrastructure ofbuilding a new marketplace. NWE-Hubco intends to offer the followingservices:
■ Safeguard the physical hub balance (net flow).
■ Provide and manage information technology infrastructure for an integratedcommodity market.
■ Provide and manage IT infrastructure for a secondary market fortransportation capacity and wheeling services – the transfer of gas fromone interconnected pipeline to another through the hub.
■ Provide and manage IT infrastructure for wheeling services between thepipeline junctures at Oude/Bunde or Emden.
■ Nominate, allocate and track titles for gas traded at the hub.
A drafting group has been established to prepare standard trading terms andconditions for both Eurohub and NWE-Hubco.
This move in northern Europe is extremely important for future trading.Given its favourable location, Bunde could well develop into a true Europeanhub.
■ Hubs under discussion
With market liberalisation spreading across Europe, other trading hubs are beingdiscussed at strategic points on the European network, where several pipelinesinterconnect and there is proximity to storage facilities and demand centers:
■ Baumgarten in Austria,
■ Lab in Slovakia,
■ Lampertheim near Ludwigshafen, in Germany,
■ One hub in southwest of France or Spain,
■ The Po valley in Italy.

NEW FORMS OF FLEXIBILITY AND THE CHANGING ROLE OF GAS STORAGE
Unbundled servicesThird-party access enables buyers to choose their supplier, and this frees themfrom dependence on an all-in-one service. In effect, they can buy gas à la carteinstead of from a standard menu. The opportunity has opened up for tradingnot only gas but also all kinds of services. The Dutch company Gasunie wasthe first of the Continental gas companies to offer unbundled services à la carte,such as peak capacity, seasonal swing and temperature-related backup. Mostother gas companies have followed suit and are now offering a similar set ofunbundled services.
88
Existing Pipelines
Planned Pipelines
Existing Hubs
Potential Hubs
LNG Terminals
Frankfurt an der Oder
Bunde
NBP
Bacton
Zeebrugge
LampertheimLaqc
Pyrenees
Po ValleyWaidhous
Ukraine
Lab
Baumgarten
Figure 8: Existing and Possible Gas Hubs in Europe

89
41 The organisational division of N.V. Nederlandse Gasunie was implemented on 1 January 2002. There arenow two units: Gasunie Trade and Supply, a trading company buying and selling natural gas and gas-relatedservices in the Netherlands and elsewhere in Europe, and Gas Transport Services, for transport and relatedservices. This is an interim step toward the planned legal division of the company.
Gasunie Trade and Supply41 (GTS) is one of the largest providers of servicesassociated with the supply of natural gas, such as capacity, flexibility andback-up. These services can be booked separately and the user is not obligedto buy gas from Gasunie.
In the case of additional capacity requirements, however, the customermust reserve corresponding transportation capacity. Customers who exceedthe capacity reserved in their contracts are not cut off, but they must paya penalty for the additional capacity required.Capacity is based on hourly rates.
Flexibility services offered:
■ Additional Annual FlexibilityIn addition to the flexibility that comes with annual off-takes provided byGasunie as a non-exclusive supplier, Gasunie offers additional flexibility inannual off-takes as a separate flexibility service.
■ Additional CapacityIn addition to the base-load capacity included in gas-supply contracts withGasunie or another supplier, Gasunie offers additional capacity on anannual basis. It may be used throughout the year along with the capacityalready booked from Gasunie or another supplier. This additional capacitywould not include additional volumes. Typically it would be used to coverseasonal variations in demand.
■ Incidental CapacityIncidental capacity is offered to cover incidental peaks in the off-takepattern. Gasunie offers this service to customers whose maximum hourlycapacities are not often required. There is a maximum of 31 periods a yearof 24 hours each.
■ Hourly flexibilityHourly flexibility gives the customer the right to receive for a limitednumber of consecutive hours, a certain capacity in addition to its contractualand possibly its incidental capacities. Hourly flexibility is a possibilitywhere there is a cyclical pattern to the customer’s use – variations betweenday and night. In hourly flexibility, a customer contracts for a “virtual” bufferthat fills up during hours when demand is lower than the contract providesfor, and empties when demand is higher.
Box 4: Gasunie Flexibility Services

The unbundling of services has had several consequences for gas customers andfor the companies’ operations. In a liberalised market, eligible customers – gasusers that meet criteria specified in the EU Gas Directive or in nationallegislation, such as a minimum volume of gas consumed per year, have the rightto choose their supplier and request third-party access to the grid – are free todecide for themselves how much flexibility and back-up they require, and willcontract this from their gas suppliers or other service providers. Responsibilityfor procuring adequate flexibility lies with the customer. The various commercialplayers merely fulfil their contractual obligations. They do not take responsibilityfor ensuring the overall flexibility or security-of-supply needs of their eligiblecustomers. A new risk pattern has emerged. Instead of contracting for aguaranteed supply under all circumstances, including temperature variations,each eligible customer can design for himself the risk pattern that suits him bestand pay accordingly. But eligible customers have to bear the consequences ofnot contracting adequate services. They may be cut off or may have to paypenalties for exceeding their agreed-upon draw on the system.
Providing eligible consumers with the choice to buy tailor-made flexibilityleads to better use of existing infrastructure. It also sends out market signals andcreates a transparent market value for flexibility-related services. It allows thecustomer to choose between using the services offered by the system, or anyalternative flexibility services belonging to him, or any kind of financial risk-hedging available on the market. The customer may also sell gas and services,bought but not needed by him. The allocation of scarce capacity is decided bymarket mechanism.
The question remains, however, of how non-interruptible customers, whohave no fuel-switching capability, will get secure supply including the flexibilityneeded to cover exogenous influences.
The new functions of underground gas storageAs gas market structures change, storage offers new business opportunities,mainly as a trading tool to ensure price optimisation. In the United States, gasstorage has become an independent service, both physically and in the contextof financial trading. Traditionally, storage facilities were owned by localdistribution companies and inter- and intra-state pipelines. Mega-marketers havebought a lot of available storage, since it allows them to take best advantage ofarbitrage opportunities and price swings. Since storage facilities were unbundledfrom transportation, additional services have evolved, such as parking, balancingand loaning. More recently storage operators have combined the physicalservices of storage with financial derivatives. More than two-thirds of marketcentres in the US have access to storage.
90

■ Arbitrage on price variations and trading support
Storage now allows a trader to exploit price differentials between differentpoints in time. One can, for instance, store gas in summer when prices are lowand sell it in peak winter time, when prices are high. This is known as the“seasonal spread”.
Market liberalisation has brought price volatility, and storage is a useful tool tobenefit from price variations. One can buy gas cheap and store it with theintention to sell when prices go up. Price arbitrage between spot and futures gasprices is profitable, if the cost of storage is less than the price differential betweenthe present and the future. The difference between the current spot price andthe futures price for nearby delivery contracts in future months is called the “flexspread”. When supplies of gas are tight, the spot price can move above thefutures price. In this case, a company can sell gas from storage onto wholesalemarkets and, at the same time, buy more gas under a futures contract. Thecompany is guaranteed the difference in these prices less any transaction costs.
This approach calls for much more operational flexibility than did a traditionalseasonal supply service. The operator must be able to inject or withdraw gasat any time during the year at short notice.
■ Impact on spot prices
A study carried out by the US Energy Information Administration42 indicatesthat expected storage requirements and spot prices are strongly linked duringthe winter heating season. High prices in the spot market are generallyaccompanied by low levels of storage relative to expected deliveries. As thetemperature drops below normal, more and more gas is withdrawn fromstorage and prices can rise dramatically. During the rest of the year, therelationship between storage and spot prices is much less direct.
In the United States, the amount of storage anticipated throughout the yearis a key element in gas prices. Storage refills can determine the near-termdirection of gas prices. The gas supply situation during the spring and summerbears close monitoring. If it is particularly hot in regions that consume largequantities of gas-fired electricity, then injections into storage for the nextwinter drop off, and this brings sharply rising prices during the so-called“injection season”.
91
42 EIA (1995).

Forces favouring storage use – the US and UK experiencesThe US market provides an interesting example of the changed role of gas storagein liberalised markets. In the United States, access to storage was mandated byFERC”s Order 636 in November 1993, which foresaw that:
■ storage be unbundled from other services and be offered as a distinctservice, separately charged;
■ customers be offered access to storage capacity or the right to use spacein storage reservoirs;
■ customers be given the opportunity to sublease any of their contractedstorage capacity.
During the 1990s, the operational practices of many underground gas storagesites became much more geared to trading. The following trends have developed:
■ There is more storage facilities which can supply at a high rate for a shortperiod, especially in producing regions. Between 1993 and 2000, deliverycapacity from high-deliverability storage facilities grew by 62% and thenumber of sites increased from 21 to 27. The average cycling rate at thesesites increased from 1.66 in 1993 to 2.1 in 2000;
92
In the United States, spot gas prices at Henry Hub began to climb duringthe first half of 2000 and reached record highs, exceeding $10/MBtu at theend of December 2000. The principal factors behind the surge were thesupply-and-demand fundamentals. This was exacerbated by low storage. On1 November 2000, at the beginning of the heating season, total workinggas storage, at 78.6 bcm, was the lowest for the date since 1976 and 6 bcmbelow the five year average.
Several factors have contributed in recent years to relatively low storage. Someare market-related. There was high demand for gas combined with lowsupply. Others are weather-related. The summer of 2000 was warmer thanusual and the winter of 2001 more severe.
At the beginning of 2001, storage levels were still low and prices averagedabout $5/MBtu. By summer 2001, they decreased and stabilised at around$3/MBtu, still fairly high by historical standards. One factor that keptprices high was the need for unusually large refill volumes for undergroundstorage.
Box 5: Impact of Storage Levels on Gas Prices: Recent US Experience

■ Competitive pressures have shut down some small depleted gas fields thatwere considered to be uneconomical to operate in the new marketplaceor which were thought to be unsafe.
■ There is more emphasis on inventory management, with more frequentinjection and withdrawal through the year. There is also a trend towards“just-in-time” management of storage, with less inventory at the beginningof the season. Many storage owners are minimising inventories in aneffort to synchronise their buying and selling activities with market needs43;
■ Interest in market-based rates has increased as competition has developedin the storage field, and companies are asking for market-based tariffs forsuch storage services;
■ A secondary market for storage capacity (or storage capacity release) hasemerged.
The UK experience in storage is less advanced than that of the United Statesfor two major reasons. There are only four underground storage facilities in theUnited Kingdom, with a working capacity of 3.3 bcm, or only 3% of total gasconsumption. Moreover, another source of flexibility was readily available inthe past, in the form of short-haul pure gas fields in the southern UK ContinentalShelf.
Increasing volatility in gas prices has now sharply increased demand for storageservices. Competition has come to storage markets. New facilities are being builtby various entrepreneurs. No longer is the business the exclusive preserve ofDynegy, the US company that bought out UK BG Storage and of Transco, thetransmission company which also owns the LNG peak shaving facilities.
Virtual storage service providers are also emerging. With the introduction ofNETA, the new arrangement for electricity trading which replaced the electricitypool in March 2001, and the gradual convergence between gas and electricitymarkets, gas storage can now be used to arbitrage daily electricity swing.
Storage and liberalisation in Continental EuropeContinental European companies in the 1970s and 1980s built storage facilitiesto meet seasonal variations in demand under long-term long-haul supplycontracts with a high minimum pay. They also sought to bolster security ofsupply. These two functions remain in the new liberalised gas markets. In
93
43 EIA (2001a).

addition, however, storage is starting to play new roles, such as making use ofprice arbitrage and serving as a supporting tool to gas trade.
Companies are beginning to use storage in a very different way:
■ Inventories are increasingly cycled more than once a year.
■ In choosing sites for new storage capacity, preference is given to moreflexible facilities such as salt caverns. Although the working capacity of saltcaverns is less than in depleted fields or aquifers, the caverns offer highdeliverability rates and can be cycled more than once a year.
■ “Virtual storage” to complement physical storage is already offered bycompanies. Virtual storage are backed up by storage facilities or otherflexibility instruments belonging to the company.
The EU Gas Directive does not require member countries to provide open accessto storage. Access must be granted to storage only when, and to the extent that,it is technically necessary to move gas efficiently into transmission or distributionnetworks. However, in the European Commission proposal for a new directive44,access to storage and ancillary services45 is mandatory. Member states wouldhave the choice between regulated or negotiated access to storage and ancillaryservices.
EU countries have in fact chosen different approaches and are at differentstages in providing non-discriminatory access to flexibility instruments. Inthe UK, for example, storage capacity is sold in regular auctions while “virtual”storage can be bought on the spot market. In Italy and Spain, access to storageis regulated. Most other EU countries offering access to storage have opted fornegotiated access.
Storage and other flexibility services or instruments offer a competitive advantageto a gas supplier. They lower costs, facilitate balancing and allow provision ofgreater flexibility and security of supply for customers. Storage is one of theseveral means to achieve flexibility and will eventually compete with otherflexibility services, such as supply swing, interruptibles, spot and futuresmarkets. To the extent that competition develops between providers of flexibilityservices, there should be little need to regulate access to them.
94
44 CEC (2001c).45 Ancillary services means all services necessary for the operation of transmission and/or distribution networks
and/or LNG facilities, including storage facilities and equivalent flexibility instruments, load balancing andblending.

ELECTRICITY-GAS ARBITRAGE46 AT HUBS
Before the liberalisation of the power sector, demand for gas in power generationwas mainly a matter of price optimisation of different input fuels on a long-term basis. Utilities had a portfolio of power plants which each had its placein the “merit order” for dispatching power. This ranking was a function ofoperating costs, efficiencies and fuel prices. In the order of merit, nuclear,hydro and lignite were generally used as base-load energy sources and coalwas generally used for base- or middle-load. Depending on relative pricing, gaswas used for middle- and peak-load. The high efficiency and low capital costsof gas-fired CCGT plants mean that they can also compete for base-load if gasprices allow.
With the increased use of gas for power generation and the opening of theelectricity grid to competition, gas demand for power generation becomesmore price elastic in the short term as the competitive electricity market offersshort-term incentives to take gas or not, according to its price. Power producerscan resell gas they have purchased under long-term contracts (if contractspermit). They can sell the gas at the current market price and buy electricityfrom the grid, if that gives a higher yield than using the gas to produce power.
In a competitive gas and electricity market, the operator of a gas-fired powerplant can optimise his operations according to what is known as the “sparkspread”. The spark spread is defined as the difference, at a particular locationand at a particular point in time, between the fuel cost of generating a MWhof electricity and the price of electricity. It is calculated as the differencebetween the product of the gas price and the heat rate of a power plant (a measureof thermal efficiency) used to generate the electricity less the spot price ofelectricity at that location. As a result, a positive spark spread indicates the powergenerator should buy electricity rather than make it.
Arbitrage between the electricity and gas markets functions this way: when themarket price of electricity is higher than the price of gas at the power plant,plus variable power production costs and taking into account the thermalefficiency, the power generator will generate electricity from gas. In the oppositecase, he will produce from another energy source or buy the electricity on the
95
46 Arbitrage covers three main situations:– Time arbitrage is trading the difference of gas prices at different times via spot and futures prices.– Geographical arbitrage is trading the difference in the price of gas on different markets. Examples of
geographical arbitrage include trading the price difference between natural gas in the UK and Belgium(Zeebrugge) or transatlantic arbitrage of LNG between LNG exported to Europe or to the United States.This calculation will include the cost of transportation of LNG to the United States.
– Form arbitrage is exploiting the difference in the value of gas in different markets, electricity and spot gasmarkets. Gas-electricity arbitrage is the most common example of form arbitrage.
spot market47. He may interrupt his own production and sell gas instead ofburning it. The market price of spot gas is, therefore, increasingly determinedby the spot price of electricity.
In the United States, suppliers of natural gas to electricity generators increasinglytrack the price of power at different locations in real time. When the price ofelectricity rises at one location, they try to sell more gas into a market nearby, orthey transport gas to a particular generator and make an arrangement with thegenerator to produce more power. In this case, the gas supplier may arrange tosell the power himself – a practice known as “tolling”. It occurred in the UnitedKingdom during the second dash for gas, after 1995, when producers saw thatthey could earn more from their gas by converting it into electricity than by sellingit on the spot market. They arranged with independent power producers to“toll” their gas and take the electricity receipts in exchange for a tolling charge.
In the United States, the complexity of the deregulated gas market and itsgrowing interrelationship with electricity markets have increased the need forcoordination among market participants. In addition to dealing with productionproblems, timely additions of natural gas pipeline capacity and otherinfrastructure will require coordination among pipeline companies, consumers,the FERC and state regulatory bodies48.
96
47 In this case, he also needs to take into account the cost of not using his gas plant.48 EIA (2001b)49 Source : World Gas Intelligence, April 3, 2002 and 28 November 2001, European Gas Markets, 30 March
2001, The Utilities Journal, March 2002, Energy Trends, DTI, United Kingdom50 The electricity spot market in England and Wales – the Pool – was a compulsory trading mechanism for
generators and suppliers, regulated by its members and operated by NGC. It was mandatory. Generators wereobliged to sell their production to the Pool and electricity buyers to buy from it. The Pool set prices for energyfor each half-hour period on the basis of a daily day-ahead auction. Generators submitted bids specifyingthe capacity available for the next day and the price at which they were willing to sell output from each capacityunit. Bids were fixed for the day; in other words, the same prices applied to all half-hour periods. With limitedexceptions, there was no demand-side bidding. Bid prices contained several terms such as a fixed start-uprate, a no-load rate for each hour that the unit was running at its technical minimum and various energy ratesfor different loads. The Pool combined the bids to construct an unconstrained merit order of generating plantsthat minimised the cost of serving the scheduled demand for each period.
In the United Kingdom, wholesale power prices have decreased by 20% to30% since the introduction of the New Electricity Trading Arrangementson 27 March 2001. The decrease reflects more competition in the electricitymarket, as well as changes in input fuel costs, the effect on new entrantsand the erosion of market concentration.
NETA replaced the Electricity Pool of England and Wales50, in which half-hourly prices had been set by generators, with no scope for bidding by
Box 6: Gas-Power Arbitrage and Prices in the United Kingdom 49

Given the existence of high generation over-capacity and growing competitionin liberalising power markets, the situation in Continental Europe is convergingwith that of the UK. In 2001, Belgian gas prices were less competitive than usual,
97
any other players. Under NETA, over 150 companies, including large end-users and small generators, may participate in the marketplace.
NETA has had a radical effect on the gas side. Before its inception, gas andpower markets had hardly been intertwined, except that gas has beenincreasingly used for power generation, going from zero in 1990 to 30%in 2000. With NETA, generators have an incentive to arbitrage betweengas and power markets.
The first signs of gas-power arbitrage emerged in 2001, when generatorssold gas back into the gas market to seize price differentials. Many gassupply contracts have been renegotiated by power generators to allowdelivery at the National Balancing Point, instead of at the beach or the plantgate, and to allow full re-sale rights.
With gas prices at a fairly high 20 to 30 p/therm in 2001, new combined-cycle gas turbines are vulnerable to a margin squeeze, since their fuel costsare not covered by the electricity market price.
Higher gas prices in 2001 have brought a halt to the rising trend in gas useat power stations despite the fact that new gas-fired stations have come onstream in 2000 and 2001. In 2001, supply from gas-fired power plants fellby 2%, while supply from the coal-fired power stations of major powerproducers rose by 8.5%.
As a consequence of the wholesale power-price decline in 2001, several plantswere mothballed before the new UK financial year (April 2002), in order toavoid grid-connection fees and other annual charges. The US company TXUmothballed two 189 MW coal-fired units at High Marnharm and a 333 MWcoal-fired unit at Drakelow, representing over 20% of its 2,914 MW of UKcapacity. In February 2002, the electricity company AES mothballed its 363MW coal-fired plant at Fifoots Point. International Power mothballed halfthe capacity at its 500 MW gas-fired power plant at Teeside.
Although these are all market-related incidents, concerns are emerging inthe UK about their longer-run effects on reserve capacity and security ofsupply, especially in peak periods. Today it is not a problem because the UKhas 20%-30% over-capacity in electricity generation, equal to 15-22.5GW. This overhang looks set to shrink over the next 15 years, since old plantswith about 14 GW of capacity are due to be decommissioned.

and electricity utilities in Belgium reduced their gas off-takes by 5.8% to thebenefit of coal and oil.
Since most of the growth potential for natural gas lies in power generation, gasprices to generators will need to be competitive with the electricity price if thisdemand potential is to be realised. Europe’s over-capacity in power generationand the resulting depressed price of electricity in some European countries meansthat for some time it will not be economic to build new gas-fired capacity.
98

THE ROLE OF LNG IN FLEXIBILITY
INTRODUCTION
In the past, the liquefied natural gas (LNG) market was characterised byrigidity: long-term Take-or-Pay contracts; liquefaction capacities booked underlong-term contracts; almost no supply flexibility and no ships available forreleased spot volumes.
Market deregulation in many East Asian and European countries is changingthe LNG market, bringing new challenges and opportunities to both buyersand sellers. The business is moving away from long-term bilateral contractstowards a system that is more flexible and responsive to market signals. Majornew trends include the growing short-term market with more spot transactionsand the increasing, albeit still embryonic, globalisation of the LNG business.
INTERNATIONAL LNG TRADE
Global trendsThe LNG market is still small compared with the oil market. Total LNG tradewas 146 bcm in 2001 (141 bcm in 2000) corresponding to less than 3 millionbbl/day, with twelve importing and twelve exporting countries. LNG nowrepresents 22% of the world’s total cross-border gas trade.
In 2001, global LNG trade increased only 3%, much less than in former years.A weak global economy, the aftermath of 11 September and mild winterweather limited world LNG growth. However, trade has doubled in the pastdecade and is expected to experience strong growth in the coming years, withLNG trade expected to rise to approximately 220 to 270 bcm a year by 201051.
LNG production requires huge infrastructure investments and long lead times.Up to now, the LNG trade has been built on contracts of 20 to 25 yearsduration. Take-or-Pay (ToP) and Ship-or-Pay (SoP) arrangements frequently
99
5
51 Valais M., Chabrelie M.F., and Lefeuvre T. (2001).

cover 100% of the contracted quantity. This was a consequence of the industry’scapital-intensive structure. Investments were high, on the order of $5 billionfor a two-train 6Mt/year LNG project for liquefaction, ships and regasification.The cost of liquefaction and LNG transportation made up a high proportionof the market value of the delivered gas. Because of the tight economics, therewas practically no possibility for the parties in an LNG chain to do businesswith others. In order to secure capital, LNG purchasers agreed to sign rigidcontracts, with ToP obligations covering close to 100% of the contractualquantity and very long-term commitments, typically twenty to twenty-fiveyears. But recent cost reductions in the gas chain and especially in thetransportation and liquefaction segments have made it possible for LNG sellersnot to bind all their production to fixed counter-parties under long-termcontracts and to sell spot to other partners.
Technological progress achieved in the past decades has led to a sharp decreasein investment and operating costs all along the LNG chain. Among otherthings, this has made LNG more competitive with piped gas. The average unitinvestment for a liquefaction plant dropped from some $550 per tonne per yearof capacity in the 1960s, to approximately $350 in the 1970s and 1980s, $250in the late 1990s. For projects begun today, the price is slightly under $200 (allin current dollars)52.
100
52 Ibid.
140
120
100
80
60
40
20
0
bcm
1964
1966
1968
1970
1972
1974
1976
1978
1980
1982
1984
1986
1988
1990
1992
1994
1996
1998
2000
Europe Asia/Oceania North America
Source: CEDIGAZ.
Figure 9: Evolution of LNG Trade

Regional trendsSo far LNG markets are regional. In 2001, Asian importing countries took 73%,Europe 22% and North America 5% of world trade. Among producing regions,52% came from the Asia/Pacific region, 23% from Africa, 22% from theMiddle East and 3% the Americas.
■ Asia
The Asian market, which imported 106 bcm in 2001, represents 73% of worldLNG trade, with Japanese gas and electricity companies buying three-quartersof the regional total. Asia has played a major role in the increase of world LNGdemand. Between 1985 and 2001, about 70% of the increase in world LNGdemand came in this region. LNG plays a major role in Asia in diversifyingsources of energy and reducing air pollution when it replaces oil and coal.
The Asian LNG markets were developed on the basis of dedicated long-termsupply. Historically, LNG was priced higher in Asia than in Europe and NorthAmerica where the competitive conditions were different. In Europe and NorthAmerica, LNG has to compete with pipeline gas. In Japan, it competed againstlight crude oil in base-load power generation.
Japan was the first Asian country to import LNG, and is currently the biggestimporter in the world, taking 78 bcm in 2001 from eight supplying countries.South Korea started to import LNG in 1986 and is now the second largest
101
Table 6: Main Characteristics of Regional LNG Markets in 2001
Region Country LNG imports Share of LNG Share of LNG LNG buyers’(bcm) in total in gas position/
gas imports consumption Power(%) (%)
Asia Japan 78 100 97 Dominant position
Korea 21 100 100 Monopoly
Taiwan 7 100 100 Monopoly
North USA 6.7 6 1 FullAmerica competition
Europe 33.3 11 7 Emergingcompetition
Source: Cedigaz, BP, IEA.

importer in the world, taking 21 bcm in 2001. Taiwan is a more recent Asianimporter, having started in 1990. Next to come are China with the Guangdongproject and India with several ongoing LNG receiving terminals projects, twoof them under construction.
LNG in Asia is at a transition point, with significant changes ahead in Japan,South Korea and Taiwan, as well as in the new emerging LNG markets. Themarket was shaken by the Asian financial crisis in 1997-1998, when Japaneseand Korean buyers found themselves stuck with volumes contracted well abovetheir requirements. This brought home the need to reduce the length ofcontracts and increase their flexibility. In this respect, changes are becomingvisible with the current renegotiation of contracts (see p. 106). Growth hasstarted again; Asian LNG demand is expected to reach 107 to 128 Mt (144to 173 bcm) in 2010.
■ Europe
Europe imported 33.3 bcm of LNG in 2001. That amount represents only 7%of European gas consumption. But the share is much higher for someMediterranean importers. In Spain, for example, LNG accounts for 54% of gassupplies.
In Europe, LNG competes with pipeline gas, and both compete with other fuels.European buyers choose LNG either to diversify their gas portfolio or to supplyareas far from the main gas grid. The major suppliers have been Mediterraneancountries: Algeria and, to a lesser extent, Libya. In 1999 and 2000, additionalLNG supply started from further afield: Nigeria and Trinidad and Tobago.
Continuing increases in demand and the liberalisation of European gas and powermarkets are leading to new opportunities for LNG, especially in theMediterranean. Despite strong competition from pipeline suppliers, LNGdeliveries to Europe are expected to rise steeply, reaching 39-48 Mt/year (53to 65 bcm) in 2010, approximately twice as much as in 2001. New LNGreceiving terminals are planned in France, Italy, Portugal, Spain, Turkey and theUnited Kingdom, which may eventually resume importing LNG. Competitionamong suppliers is likely to facilitate the development of new LNG projects inEurope. The number of short-term LNG purchasing contracts is growing, asEuropean buyers benefit from surpluses available in the Middle East and Africa.
■ United States
In the past few years, US LNG imports have increased again, after stagnatingat a very low level for a long time. Indeed, two terminals on the East Coast have
102

been mothballed since 1979. Gas prices rose sharply in 2000 as demandincreased and supply was very tight. As LNG supply costs have decreased, andUS gas prices have been high, LNG has become competitive in the US again.LNG imports rose to 6.4 bcm in 2000, 40% higher than in 1999 and 6.7 bcmin 2001, or 1% of total US gas supply. The slower increase in 2001 was dueto safety concerns after 11 September and to lower gas prices in the US. TheUS received only 12 cargoes during the fourth quarter of 2001, comparedwith 75 during the first three quarters.
The two LNG receiving terminals in operation at Lake Charles, Louisiana, andEverest, Massachusetts, are increasing their throughput capacity. The twoterminals that have been mothballed for many years, at Cove Point, Maryland,and Elba Island, Georgia, are being brought back into operation, and will evenbe enlarged.
LNG deliveries from Algeria and from Trinidad and Tobago are received underlong-term contracts. Spot cargoes have been imported from Qatar, Nigeria,Australia, Oman, Indonesia and Abu Dhabi. The spot sales market was veryactive in 2000 and in 2001, but since mid-2001, price trends have beenunfavourable. The current breakeven for US LNG imports is in the range of$3 to $3.5 per MBtu. Over the long term, LNG is likely to be an attractive optionfor increasing gas supplies to the US. Imports could reach 15 to 19 Mt/year (20to 26 bcm) by 2010.
DEREGULATION OF ASIAN AND EUROPEAN LNG MARKETS
Downstream gas markets in Japan and Korea are in a state of change, asgovernments introduce competition (see Chapter 2). Current deregulationtrends in the electricity and gas industries are producing a different businessenvironment from the past, and many uncertainties lie ahead. Buyers in Japanand Korea are now more reluctant to enter into rigid long-term contracts. Inboth countries, third-party access to LNG facilities is due in 2003.
In this new environment, Japanese LNG purchasers are asking for more flexiblecontract terms based on each purchaser’s individual requirements. Accordingto the Japanese company Chubu Electric53, LNG buyers now seek a portfolioof contracts, ranging from long- to medium-term to short-term, as well asspot transactions, which will allow them to cope with their demand patterns
103
53 Kuroyanagi (2001).

and with uncertainties ahead. When renewing existing contracts, LNG purchasersare seeking periods of 5 to 15 years rather than 20 to 25, more flexible volumesoff-take and purchases on a fob basis54. The newly-signed contracts betweenJapan and Malaysia (see p. 106) are the first sign of a change in LNG marketingin Asia.
In Europe, the EU Gas Directive provides for third-party access to LNGterminals, either regulated or negotiated. TPA frameworks are now in place inEuropean countries. Italy recently adopted negotiated TPA to LNG terminals.The Italian regime applies only to newly-built terminals; access to thetransmission grid and to the existing terminal is regulated. In France, the GasDirective has not yet been transposed into national law, but Gaz de France tookthe initiative to publish access conditions and charges in January 2001. Belgiuminitially opted for negotiated access but is now moving to regulated TPA.Belgian tariffs and access conditions have not yet been published. In Spain, aRoyal Decree adopted in August 2001 provides for regulated TPA to LNGterminals. Revised tariffs were published in February 2002. As emergingmarkets, Greece and Portugal obtained exemptions from implementing the EUGas Directive provisions up to 2006.
These legal provisions are all quite recent, and they have yet to effect any majorchanges in access to European LNG terminals. Nevertheless, third-party accessis increasing. In France, Distrigas gained access to the Montoir-de-Bretagneterminal; TotalFinaElf to Zeebrugge in Belgium, Edison Gas to La Spezia inItaly, while BP Global LNG, Cepsa, Shell and ENI have all made deliveries tothe Spanish LNG terminals.
LNG is playing a major role in the liberalisation process as many new entrantshave chosen to build their own LNG terminals and to import gas directly.New players, principally electricity companies, are entering the LNG business.They include Union Fenosa, Iberdrola, Cepsa and BP in Spain, Edison and theBG Group in Italy and TFE in France and Spain.
As competition in their markets increases, European LNG buyers have begunseeking contracts that are more flexible than the traditional 20-25 year ToPcontracts pegged to oil prices. LNG spot sales have rapidly increased since1997. Spot sales amounted to 3 bcm in 2001, most of them for the Spanishmarket. Short-term contracts are also being signed with suppliers (see p. 106).
104
54 Free-on-board (fob): Under a fob contract, the seller provides the LNG at the exporting terminal and the buyertakes responsibility for shipping and freight insurance.

New arrangements between gas suppliers and buyers are emerging. Algeria’sSonatrach and Gaz de France have established a 50/50 joint venture, MedLNG & Gas, to carry out short- and long-term LNG sales principally to theEuropean and North American markets. Med LNG & Gas will be free to sellup to 1 bcm of gas per year on the market of its choice, provided the price chargedis higher than the price quoted in the other Gaz de France/Sonatrach transactions.
NEW TRADING ARRANGEMENTS
LNG trading is increasingly showing more flexibility in contract terms anddestination, as well as in spot and short-term transactions, LNG swaps andarbitrage transactions.
Swap agreements
Swap agreements - which are not new in the gas industry - are developing. Aswap is usually an exchange of volumes not driven by price considerations. Twoquite different types of swaps can be observed. The first is aimed at shorteningdelivery routes; here there are sellers at two different locations and buyers at twodifferent locations. The second is intended to bridge differences in demandpattern between purchasers. It generally occurs when there is an over-commitment to take or pay or contractual entitlements not used in one place,and a lack of supply in the other with a mirrored situation later on. The firsttype cuts transportation costs and frees up shipping capacity; the second typeleads to increasing market flexibility by smoothing out differences in the timingof demand between two purchasers.
Examples of the first type of swap agreements include those among Spain,Algeria and Trinidad. In 2000, Spain’s Gas Natural became the first EuropeanLNG buyer to resell LNG to the US market. That gas has been sold to GasNatural by Atlantic LNG of Trinidad. At the same time, Algerian LNGdedicated to the US was delivered to Spain, reducing shipping charges for allparties. These swaps developed in 2001 into a more permanent arrangementwith the signature of a contract among Sonatrach of Algeria, Gas Natural ofSpain, Tractebel LNG North America in the US and Belgium’s Distrigas.
Companies with interests on both sides of the Atlantic have an advantage overothers as they can react fast to any market opportunity. This is currently thecase of Gas Natural and Tractebel LNG, and it may soon be the case for BP,
105

BG and Shell, all of which are positioning themselves on both sides of theAtlantic.
An example of the second type of swap agreement took place in 2000 and2001. In 2000, Japan and Korea swapped cargoes with Taiwan whose peakrequirements do not coincide with theirs. Taiwan gave the volumes back in 2001.
New contractual termsThere have also been major changes in the terms of contracts. In the past,most contracts were for a 20-25 year period and were almost entirely subjectto ToP or SoP obligations. New long-term contracts have a shorter durationof 15 years. Also medium-term contracts, of 5 to 8 years, are becoming morecommon. ToP obligations have been relaxed.
In Europe, several shorter-term contracts have recently been signed:
■ Oman LNG signed a contract with Shell for the sale of 700,000 tons ofLNG per year from February 2002 over five years. The LNG is intendedfor Spain.
■ BP signed a three-year contract to buy up to 750,000 tons of LNG per yearfrom Abu Dhabi’s Adgas, starting in 2002. The volume is very flexible; itcould be 300,000, 500,000 or 750,000 tons per year. The sales are on afob basis.
■ In May 2001, Qatargas signed a contract with Gas Natural for the supplyof 12-13 fob cargoes of LNG per year from October 2001 to July 2009and for the supply of 12-13 ex-ship cargoes55 per year from July 2002 toJuly 2007, with a possible extension to 2012.
In Asia, two recent transactions represent significant deviations from traditionalLNG marketing:
■ In February 2002, the first new contract with increased flexibility wassigned between three Japanese gas utilities and Malaysia. Tokyo Gas, OsakaGas and Toho Gas, undertook to buy from Malaysia LNG (Tiga) acombined 680,000 tons of LNG per year for 20 years, and an additional340,000 tons for the single year beginning April 2004. The single-yearcomponent of the contract is to be updated annually, with volumes specifieda year in advance. This combined short-term/long-term contract effectively
106
55 Ex-ship: Under an ex-ship contract, the seller has to deliver LNG to the buyer at an agreed importingterminal. The seller remains responsible for the LNG until it is delivered.

provides 40% volume flexibility, instead of the 5%-10% available underconventional contracts.
■ Also in February 2002, the Japanese companies Tepco and Tokyo Gasagreed in principle to renew their long-term contract with Malaysia LNG(Satu) for 15 years, starting in 2003. The current 20-year contract for7.4 million tons of LNG per annum expires in March 2003. In the processof preparing the new contract, Tepco and Tokyo Gas gained key concessionson flexibility. Instead of all cargoes being sold on a delivered basis, after 2003up to one quarter can be lifted fob Malaysia. There is also a buyer optionto cancel up to two-thirds of the 1.8 Mt/year fob volume, or 1.2 Mt, everyfour years, with one year’s advance notice. Press reports have said that thebuyers have secured a price cut of approximately 5%.
Besides altering the duration and volume of the contract, a buyer can alsoachieve greater flexibility in its LNG supplies including the length of the build-up period, make-up and carry-forward rights.
Arbitrage: The development of Transatlantic LNGtrade
A Transatlantic LNG market is starting to emerge, with spot trading, physicalarbitrage between European and US markets and an optimisation of shippingcosts.
In the US market, LNG cargoes can always be sold at short notice, within spareLNG receiving terminal capacity. High prices in the United States during thewinter of 2000-2001 made the US market very attractive to sellers.Simultaneously, Middle East producers had idle supply capacity in the wakeof the Asian financial crisis. The Middle East is well located to ship LNG toall three regional markets. In December 2000, prices at the Henry Hub reached$10/MBtu, and remained in a range of $4 to $9 throughout the first half of2001. After negotiations with their suppliers, some European term buyers ofLNG redirected cargoes to capture the economic benefit of high US prices.
The 2001 US gas-price boom affected European prices. LNG supply redirectedfrom Europe was replaced by cheaper spot purchases of UK gas from theInterconnector. The short-term effect of this development, combined withhigher Continental gas prices, was an increase in UK prices, which reached32 p/therm ($4.75/MBtu) at the National Balancing Point in January 2001.
107

The within-day price went even higher, to around 45-to-50 p/therm ($6.70 to7.40/MBtu).
But a fall in US prices in spring and summer of 2001 narrowed the scope forLNG arbitraging, and even reversed the flow. LNG cargoes contracted for theUS were redirected to Europe. This trend was reinforced after 11 September,partly because of a ban on LNG imports to Boston for safety reasons, andbecause of the economic recession that followed the terrorist attacks.
Spot salesThe global LNG spot market has been booming since 1999. Spot sales rose to11.41 bcm in 2001, an increase of 51% over 2000. In 2001, short-term LNGtrading represented 8% of all LNG trade.
The evolution of the spot LNG market56 is indicated in the following table:
108
56 Spot transactions and short-term contracts of less than one year.
Table 7: LNG Spot and Swap Transactions - 1992 to 2001By Exporting Country - bcm
Exporters 1992 1993 1994 1995 1996 1997 1998 1999 2000 2001
Abu Dhabi - - - 1.43 1.39 0.08 0.34 0.65 0.64 0.31
Algeria 0.53 0.49 0.59 0.35 - 0.60 0.45 1.33 1.38 2.64
Australia - 0.34 0.58 0.67 0.27 0.30 0.38 0.30 0.45 0.21
Brunei - - 0.30 0.08 - - - - - -
Indonesia 0.23 0.24 0.38 0.53 0.60 0.28 - 0.38 1.18 1.91
Libya - - 0.05 - - - - - - -
Malaysia 0.30 0.53 0.45 0.23 0.08 - - 0.08 0.08 0.52
Nigeria - - - - - - - - 0.37 1.22
Oman - - - - - - - - 0.60 0.58
Qatar - - - - - 0.39 0.95 1.60 1.98 2.62
Trinidad - - - - - - - 0.39 0.92 1.40
Total 1.05 1.59 2.34 3.27 2.33 1.64 2.12 4.72 7.58 11.41

More and more players are selling and buying spot LNG. This phenomenonwas triggered by the 1997-98 Asian financial crisis, which generated supplysurpluses in the Middle East. This was followed by spot sales to meet peak winterdemand in Korea and Spain. The next driving force was the US market withthe very high prices of 2000-2001, which led to spot cargoes’ being redirectedfrom Europe to US, as well as direct LNG spot purchases. About 4 bcm/yearwas imported to the US under spot or short-term contracts in 2000 and 2001.
The increase in global spot sales in 2001 resulted partly from exceptionalcircumstances. The temporary shutdown of the Arun liquefaction plant in
109
57 GIIGNL (2002).
By Importing Country - bcm
Importers 1992 1993 1994 1995 1996 1997 1998 1999 2000 2001
Belgium - 0.23 0.08 0.15 - - - - - 0.07
France - - - 0.87 0.23 - - 0.08 0.08 0.43
Italy 0.53 0.26 0.20 - - 0.12 0.54 0.48 0.38
Japan 0.38 0.39 0.08 0.08 0.15 0.28 - 0.15 0.32 2.22
Korea 0.15 0.45 1.05 0.90 0.68 - 0.08 0.31 1.47 1.85
Portugal - - - - - - - - 0.08 -
Spain - 0.27 0.94 1.05 0.98 0.99 0.83 1.69 1.43 2.20
Taiwan - - - - - - - - - 0.08
Turkey - - - 0.23 0.08 - 0.58 0.30 - -
US - - - - 0.23 0.30 0.53 1.66 3.73 4.18
Total 1.05 1.59 2.34 3.27 2.33 1.64 2.12 4.72 7.58 11.41
Share of spot in global LNG Trade - %
Year 1992 1993 1994 1995 1996 1997 1998 1999 2000 2001
1.3 1.9 2.7 3.5 2.3 1.5 1.9 3.9 5.4 7.8
The figures include both spot LNG sales and swap transactions.Source: PetroStrategies (1992-2000 data), US Department of Energy, International Group of Liquefied NaturalImporters57 and IEA estimates for 2001.

Indonesia gave a real impetus to spot trading. ExxonMobil decided to shut downthree of the four fields supplying the Arun plant, after repeated attacks on itsworkers from separatist rebels. This forced Pertamina, the state Indonesian oiland gas company, to declare a state of force majeure at the plant. Indonesia madeup most of the shortfall with spare capacity at Bontang; spot cargoes fromBontang to Japan and South Korea amounted to 1.9 bcm in 2001. Arun’sJapanese and South Korean customers, Tohoku Electric and Tepco in Japan andKogas in Korea, acquired the balance from other sources, mainly Qatar, Malaysiaand Australia.
Spot volumes in 2001 were produced mainly by Qatar with 23%; Algeria with23%; Indonesia, 17% and Nigeria, 11%. The spot trade now relies on excessproduction capacity in newly-built plants in the Middle East. For Middle Eastproducers, as contracts are in the build-up period58, spot sales are an attractiveway to make best use of their plant.
For LNG sellers, short-term trading provides an opportunity to market cargoesthat have not been contracted on a long-term basis. This reduces the risk of goinginto a project without having secured long-term sales for all the plannedproduction. In addition, a trading system may enable sellers to dispose ofcargoes that buyers cannot use because of a downturn in demand in theirmarket. From a producer’s perspective, spot selling is advantageous, so long asspot LNG prices do not undermine long-term LNG prices and revenues.
PRICING DEVELOPMENT
A more flexible approach to pricing is emerging in the LNG industry, with theadoption of new indices such as electricity pool prices, and the adoption of theso-called “S” curves59 for LNG prices.
The “S” curve formula was first adopted in 1989, in contracts between AustralianLNG suppliers and their Japanese customers. It was adopted last year in anumber of European contracts.
110
58 During the term of a contract, there are different stages. The build-up period will typically consist of severalsteps by which the contractual quantity is gradually increased up to the plateau or peak level.
59 The S-curve is a formula in which the variable portion of the LNG price is adjusted in accordance with theprice evolution of a basket of crude oils. Its evolution is linear within a price range (roughly between $21 to$28 per barrel). It shifts upward when the price of oil falls below the floor price. It shifts down when the oilprice exceeds the ceiling price. This curve is intended to protect the interests of both contractual parties againsthighly volatile oil prices.

Price renegotiations in 2001 also included new indices in the price formula, suchas electricity pool prices in the formula negotiated between Trinidad andTobago and Spain’s Gas Natural. As gas trading develops and new gas marketindices appear, future LNG contracts could be pegged to them.
Middle East producers have developed master agreements for spot LNG tradeor transactions concerning just a few cargoes. These standardised frameworkagreements facilitate spot transactions. They allow cargoes to be re-routed,provided that the LNG producer gets a piece of the benefit. Oman LNG,Adgas in Abu Dhabi, and Rasgas and Qatargas in Qatar are among the supplierswhich have such master agreements. Nigeria LNG has signed such agreementswith US CMS, Coral, a Shell affiliate in the US, TotalFinaElf and BP.
■ Regional pricing
Currently there are three regional LNG markets, each with its own pricing.
In Japan, cif60 LNG prices are based on a basket of crude oils imported intothe country and known as the Japanese Crude Cocktail (JCC). In the past, this“cocktail” was a convenient basis for gas pricing because the main competitorof gas was light crude oils, whose prices are reflected in the JCC.
Prices in European LNG contracts are still predominantly linked to the evolutionof gasoil and heavy fuel oil prices over a given period, usually six months to oneyear. In some contracts, however, other indices, such as electricity pool priceshave been included to reflect the new competitive situation of gas in powergeneration. European LNG contracts are also less rigid than Japanese ones, asthey include renegotiation clauses and opportunities to reopen price discussions.
In the US market, LNG prices are generally linked to the Henry Hub prices.Ex-ship prices tend to represent 80% to 90% of the futures prices at Henry Hub,adjusted for the location of the LNG terminal.
These pricing mechanisms result in three different regional price patterns, asindicated in figure 10.
With increasing short-term trading and physical arbitrage between the regionalmarkets, an additional pricing structure is beginning to evolve. Spot pricesreflect the supply and demand situation at any one time. In times of glut, spotprices will be below long-term contract prices and in times of squeeze, they will
111
60 Cost, insurance and freight (cif ): A cif price means that the cost of transportation, insurance and freight toa given destination are all included in the price. The seller is usually responsible for arranging transportation.

be above. As spot transactions develop, differences in timing, volume andduration of LNG contracts will be reflected in their price.
DRIVING FORCES IN THE DEVELOPMENT OF AN LNG SPOTMARKET
Given the increase in LNG spot sales, the question arises: is a global LNG marketdeveloping?
A spot market, in the sure sense of the term, aims to match short-term surplusesheld by a supplier with unfilled demand of the buyer. It is a permanent dynamicor tension between supply and demand for the commodity for immediatedelivery. The price of the goods is continuously quoted, on the basis of supplyand demand. A spot market needs the following prerequisites to be fully efficient:
■ Large number of players, without any leading player who could manipulateprices.
■ A fluid market with little or no bottleneck; transport of the commodityshould not hinder its availability, in place or time.
■ At least one place where the goods can be delivered to fulfil open deals.
112
7
6
5
4
3
2
1
0
Jan-9
8
Apr-9
8Ju
l-98
Oct-98
Jan-9
9
Apr-9
9Ju
l-99
Oct-99
Jan-0
0
Apr-0
0Ju
l-00
Oct-00
Jan-0
1
Apr-0
1Ju
l-01
Oct-01
Japanese LNG price Import crude oil price (1)
US LNG price
$/MBtu
European LNG price (2)
(1) average import crude oil price in Japan.(2) Algerian LNG received in France.Source: US DOE/EIA, World Gas Intelligence, IEA.
Figure 10: Evolution of LNG Prices in the United States, Europe and Japan

LNG spot transactions do not yet constitute a real LNG spot market, in thesure sense of the term. LNG spot transactions are still marginal at 8% of globalLNG trade.
The recent growth in LNG spot sales was made possible through spare capacityin liquefaction plants, the availability of at least a few LNG tankers and sparecapacity in receiving terminals.
Spare capacity at liquefaction plantsThere is a good deal of spare LNG capacity - capacity that is not contracted,or contracted but not taken. Spare capacity was estimated at 17 bcm in 2000and 12 bcm in 2001, the decrease being mainly due to the seven-month shutdown of the Arun plant in Indonesia. This spare capacity exists for severalreasons. In newly built plants, it exists because contracts are still in theirdevelopment stage. In existing plants, spare capacity was produced by de-bottlenecking and in some newer plants - thanks to cost reductions - not allof the initial capacity has had to be sold in advance to guarantee financing.
Most spare capacity is in the Middle East and in Africa. In the Middle East,three new liquefaction plants have been put on stream since 1996, Qatar’sRasgas, Qatargas and Oman LNG, adding a total of 20 Mt capacity per year.In Africa, Nigeria has added capacity of 5.3 Mt per year. All contracts linkedto these liquefaction plants are in their build-up stage:
■ Abu Dhabi: 4.3 Mt contracted long-term in 2001, out of 5.5 Mt/yearcapacity (78%).
■ Qatar: 10.16 Mt contracted long-term in 2001, out of 13.4 Mt/yearcapacity (76%).
■ Oman: 3.29 Mt contracted long-term in 2001, out of 6.6 Mt/year capacity(50%).
■ Nigeria: 4.4 Mt contracted long-term in 2001, out of 5.3 Mt/year capacity(83%).
By comparison, in 2001, the other exporting countries contracted from 84%to 93% of their total liquefaction capacity on a long-term basis. Australia andBrunei contracted their total capacity.
Current spare capacity is the result of a build-up of long-term contracts and willtherefore disappear when the contracts have reached their plateau level. Most
113

new greenfield investments are still linked to long-term contracts, and capacitiesare seldom deliberately earmarked for spot trade.
On the other hand, debottlenecking of existing plants will continue, whilenew plants and extensions to existing ones will be built around the world,regularly adding spare capacity not yet booked. Five plants, Atlantic LNG inTrinidad and Tobago, Nigeria LNG, Qatargas, Oman LNG and Australia’sNorth West Shelf, are currently being expanded, and many owners of liquefactionplants are discussing additional expansions.
There is also a new tendency by LNG producers to build plants without havingfull capacity booked under long-term contracts. This development is due to thesubstantial fall in building costs, especially for expansions. These savings allowthe financing of the project to be secured by long-term contracts withoutcommitting the plant’s total capacity. For example, both Qatar’s RasLaffanLNG and Oman LNG committed to project construction without full-capacitysales. This had two benefits. The principal buyer, in both cases Korea Gas, didnot have to wait for the seller to line up other buyers before the projects werebegun. Second, the projects made subsequent sales based on not-yet committedcapacity - Oman LNG to Japan and to the Indian Dabhol project, and RasGasto India’s Petronet project. Malaysian producers are also building an extensionto their LNG plant, Tiga, without full commitment for the production.
Shipping issues
The current shortage of LNG carriers is restricting spot LNG trade. Thissituation has persisted since 1999, even though a number of new LNG carriershave entered service since then. The fleet consisted of 128 vessels at the end of2001, but only five or six are available on an ad hoc basis for spot trade. Thisis a serious bottleneck. However, it is likely that there will be a surplus of LNGtankers in a few years. At the end of January 2002, shipbuilders had no less than53 firm orders for LNG tankers on their books, with options outstanding ona further 23. Until these ships are delivered, LNG transport will be tight, butby 2004, the situation will ease up and many ships should be available forspot transactions.
Almost all the LNG vessels in use, whether chartered by sellers or buyers, arededicated to specific projects and routes on a long-term basis. But a new trendis emerging with so-called “free ships”, that are not engaged in any specificbusiness and so can provide the flexibility required for spot trading.
114

Over the past two years, orders for new LNG tankers have increased as majoroil companies, independent ship owners and LNG purchasers responded to thelure of low prices. LNG ship prices have fallen dramatically, down to an averageof $170 million for a 135,000 cm vessel, from $250 million ten years ago.Companies like Shell and BP have placed orders for LNG carriers which arenot designated for specific import or export contracts. Independent ship ownershave also placed orders for LNG carriers which are not chartered for long-term trade.
On the purchasers’ side, a number of Japanese, US and European electricity andgas companies have decided to order LNG vessels, for fob contracts and for spotpurchases. This is not simply to take advantage of low ship prices, but is in linewith a policy to make procurement more flexible and better matched to eachmarket’s individual needs. Having the means to arrange delivery allows buyersa much freer choice of suppliers. Several buyers have invested in more shippingthan they will need in order to lift their volumes contracted on a long-term basis.They are now in a position to purchase additional cargoes of LNG or to usetheir ships to deliver LNG cargoes to other markets.
Regasification terminalsIn 2000, the major bottleneck to expanded LNG trade in the United States waslimited importing capacity. With the scheduled reopening in 2002 of twopreviously mothballed plants, Cove Point, Maryland, and Elba Island, Georgia,US importing capacity will reach nearly 32 bcm/year at the end of 2002. Thereare plans to enlarge the capacity at existing plants. There are also many newregasification projects planned or under consideration in North America: in theGulf of Mexico, North Carolina and Florida. To avoid siting problems for thenew terminals, especially in California, there have been proposals to site themjust outside US borders, notably in Baja California, Mexico, and in the Bahamas.There is also a project to build an offshore regasification terminal in the Gulfof Mexico, and to convert LNG tankers by installing regasification facilitiesonboard them.
In Europe, some LNG terminals have no spare capacity (La Spezia in Italy andHuelva in Spain), others have limited spare capacity (Fos-sur-mer in France,Barcelona and Cartagena in Spain), while Zeebrugge in Belgium, Montoir-de-Bretagne in France, and Marmara Ereglisi in Turkey, do have available sparecapacity. In all countries with existing LNG terminals except Belgium, thereare projects to build new terminals, some of which are more likely to be realised
115

than others: two projects in France at Fos and Le Verdon; eight projects in Italyat Marina di Rovigo, Brindisi, Taranto, Vado Ligure, Muggia-Trieste, Corigliano,Lamezia Terme and Rosignano Marittimo; three projects in Spain at Bilbao,El Ferrol and Valencia; two in the United Kingdom at Milford Haven and onthe Isle of Grain. A new terminal in Turkey at Izmir has recently been completed.
The legislation on access to LNG terminals will be the determining factor forthe building of new terminals. Current proposals within the frame of the EUGas Directive require LNG receiving terminals to offer third-party access. Thefinancing of the new terminals remains, however, an open issue. Italy is the firstcountry to have adopted a specific legislation encouraging the financing ofnew LNG terminals. It allows a priority of access to the sponsor of the newterminal and a higher rate of return than is now applicable to the transmissionnetwork (see Annex on Italy).
The current eligibility threshold for choosing one’s supplier in EU member statesis 25 mcm/year, or 40,000 cm of LNG, about the size of a “small” tanker. Anew entrant with a small gas market will have to pay high storage costs if hewants to supply his customers with LNG.
Japan has ample spare capacity at its regasification terminals. South Korea isgoing to expand the capacity of its two existing terminals and build a newone.
A global LNG market?There is now some, but not a great deal of, spare capacity in liquefaction plantsand regasification terminals. The number of free tankers is growing. Moreplayers are participating but the total is still limited at around sixty. Traditionallong-term LNG contracts are gradually being complemented by LNGtransactions that are more flexible in timing and location. These spot transactions,which represented 8% of global LNG trade in 2001, will develop further butthey will not soon replace long-term deals entirely, as these deals will still beneeded to secure new-project investment. In any event, chances are that aglobal LNG market, such as those for oil or coal, will gradually emerge.
116

IEA COUNTRIES ANNEXES


IEA COUNTRIES ANNEXES
The following annexes detail seasonal gas demand in each IEA country and theway seasonal gas demand is balanced by traditional flexibility tools. Theinformation contained here refers to volume flexibility and is based on monthlyinformation available in an IEA database. It therefore refers to seasonal, andnot to hourly or daily, flexibility.
Information on each country is presented in the following form:
1. Demand side■ size of temperature-sensitive sector,
■ seasonality of gas demand,
■ gas in power generation and multi-fired electricity generation,
■ interruptible customers and fuel-switching capabilities.
2. Supply side■ reserves,
■ gas supply structure,
■ production swing,
■ flexibility in imports.
3. Storage■ underground gas storage,
■ LNG receiving terminals,
■ stock changes/load balancing.
4. Regulatory framework■ security of supply,
■ access to transmission and storage,
■ development of gas hubs.
119

120
The following definitions have been adopted:
■ The temperature-sensitive sector refers to residential and commercialcustomers.
■ Seasonality in gas delivery is the ratio between gas consumption in thepeak and the lowest month of a given year.
■ Flexibility in gas supply (production and imports) is the swing, or themaximum monthly delivery divided by the average monthly delivery ina given year.
■ Reserves means proven reserves.
■ R/P stands for the reserves-to-production ratio in years.
The table on fuel-switching capacity in the power sector indicates: the shareof thermal power plants in the total electricity capacity of each IEA country;the share of multi-fired power plants; and the plants that can switch from orto natural gas.
Sources of informationThe following sources of statistical information have been used for the graphs,unless mentioned otherwise:
■ IEA Natural Gas Information 2002, Paris, OECD.
■ IEA Electricity Information 2002, Paris, OECD.
■ IEA monthly database.
■ Natural Gas in the World, CEDIGAZ (2001), Rueil Malmaison.
For consistency reasons, data refer to the year 2000, unless stated otherwise.
Units■ mcm stands for million cubic metres,
■ bcm stands for billion cubic metres,
■ mcfd stands for million cubic feet per day,
■ Mt stands for million tons,
■ GW stands for gigawatts.

121
AUSTRALIA
GAS DEMAND
■ Share of gas in TPES: 18% (2000)
Gas consumption reached 22.5 bcm in 2000. Unlike many other Asia-Pacificcountries, where the bulk of gas use is in the power sector, it is industry thatuses the largest share, 38% in 2000. The power sector accounts for 23%. Thecore sector (residential and commercial users) represented 19% only of totalconsumption.
To date, the Australian gas market has developed largely as a set of separatemarkets in individual states, with few interconnections and exchanges. Australia’snatural gas reserves are linked to major markets by over 19,000 km of high-pressure transmission pipelines. Most natural gas markets are supplied by a singlepipeline that carries gas from a single production centre.
■ The main consuming sectors are industry and power generation. Theresidential and commercial sectors represent only 19% of totalconsumption. Seasonal fluctuations in gas demand are less pronouncedthan in other OECD countries.
■ Australia has developed four underground storage facilities, whichhelp to cover fluctuations in gas demand.
■ Australia is rich in gas resources and is a big LNG exporter.
■ To date, the Australian gas market has, to a large extent, developed asseparate markets in individual states, with few interconnections andexchanges.

122
Figure 11: Australian gas consumption by sector in 2000
■ Seasonality
The ratio between gas sales in the peak and the lowest month of the year was1.6 to 1 in 2000.
■ Share of gas in the power-generation sector: 13% (2000)
* From combustible fuels.
2% only of total electricity-generating capacity by fuel is multi-fired. Historically,coal has been by far the fuel of choice in the power sector, with 80% ofelectricity generation. However, gas is penetrating the sector and gas-firedpower plants are expected to account for 17% of electricity generation in 2005and 20% in 2010.
■ Interruptibles and fuel switching
There are very few multi-fired electricity plants in Australia. All gas-firedelectricity plants are single fuel-fired.
Residential
Commerce - public services
Power generation
Industry
Others
20% 13%6%
23%38%
Table 8: Multi-Fired Electricity Generating Capacity in Australiaat 31 December 2000 (GW)
Solid/Liquid -
Solids/Gas -
Liquids/Gas 0.16
Liquids/Solids/Gas 0.64
Total Multi-fired 0.80
Total Capacity* 36.51

123
GAS SUPPLY
■ Reserves: 3,530 bcm R/P: 108 years
Australia has abundant gas resources. Unfortunately, these resources are notevenly distributed, the bulk of them are located in offshore Western Australia,far from the major consuming centres.
■ Gas supply structure: Indigenous production 100%
Gas production reached 32.7 bcm in 2000.
■ Supply swing
Production offers little swing: 119% in 2000.
Figure 12: Australian monthly gas production
Australia is a net exporter of gas. It exports 35% of its production in the form ofLNG through the North West Shelf project located in the Carnarvon Basin. In1999/2000, LNG production and exports rose to a peak of 7.9 Mt/year, as thecontracted sales to Japan were complemented by spot sales to Spain, South Korea,Turkey and the United States. The LNG project currently operates at maximumcapacity. Two additional LNG trains are planned at the NWS project, to go intoservice in 2004. Five other potential LNG projects are under consideration.
STORAGE
Australia has developed four underground gas storage facilities in depletedgas fields and an LNG peak-shaving facility near Melbourne.
3500
3000
2500
2000
1500
1000
500
0
mcm
Jan-9
8
Mar-
98
May
-98
Jul-9
8
Sep-
98
Nov-9
8
Jan-9
9
Mar-
99
May
-99
Jul-9
9
Sep-
00
Nov-0
0
Sep-
99
Nov-9
9
Jan-0
0
Mar-
00
May
-00
Jul-0
0

124
■ LNG exporting terminals
Australia has one large LNG terminal at Burrup, with storage tanks of260,000 cm of LNG.
Table 9: Undergound gas storage in Australia
Operator/Working Peak
Name TypeNumber
capacity output(mcm) (mcm/day)
Mondara Field, Perth Basin
Depleted gas field 127 5
Moomba, Cooper Basin Depleted gas field 623 4
Newstead, Surat Basin Depleted gas field 234
Iona Field, Otway Basin Depleted gas field 260 5.2
Dondenong LNG 18 6
Total 5 1,262 20.2
Table 10: LNG exporting terminals in Australia
TerminalsStorage tanks Nominal capacity
Start-up date(1,000 cm of LNG) (mcm/day)
Burrup (North West Shelf)
260 10.1 1989
Jan-9
8
Mar-
98
May
-98
Jul-9
8
Sep-
98
Nov-9
8
Jan-9
9
Mar-
99
May
-99
Jul-9
9
Sep-
00
Nov-0
0
Sep-
99
Nov-9
9
Jan-0
0
Mar-
00
May
-00
Jul-0
0
3500
3000
2500
2000
1500
1000
500
0
mcm
Gross inland consumption Production
■ Stock changes
Figure 13: Australian load balancing

Production offers little swing. Seasonal variations in gas demand are limitedand covered by swing in production and storage.
REGULATORY FRAMEWORK
■ Security of supply
Steps have been taken towards the gradual establishment of a national integratedgas market, which will reinforce flexibility and security of supply by ending thepresent dependence of each gas market on a single long pipeline.
An explosion at the Longford gas plant in Victoria in September 1998demonstrated the vulnerability of gas supply. It disrupted gas supplies toVictorian consumers for nearly two weeks. The incident provided a newimpetus to gas industry reform.
Since the Longford accident, a number of State Governments have beenpreparing an agreement to share gas supplies across borders61 in case ofemergency. The jurisdictions would communicate the extent of gas incidents.They would share gas supplies for essential services where there is a gas supplyshortfall that simultaneously affects several jurisdictions.
■ Access to the grid
The Natural Gas Strategy adopted by the Commonwealth government in1991 contained key objectives for gas reform that are still relevant today. Theseinclude competition through non-discriminatory open access to pipelines, theremoval of regulatory barriers on interstate trade, more interstateinterconnections, and a light-handed approach to regulation. In 1995, thestates involved in the agreement joined the gas industry to set up a gas-reformtask force that was to develop a national framework for grid access. “NaturalGas Pipelines Access Inter-Governmental Agreement” was adopted in November1997. That document includes legislation on pipeline access. It contains anAccess Code defining the rights and obligations of pipeline operators andusers that apply for third-party access to natural gas transmission and distribution
125
61 Crocker K. (2002).

126
networks. To establish TPA in interstate trade, Gas Pipeline Access Act wasadopted by the Commonwealth parliament in July 1998.
The Australian system resembles a negotiated TPA regime with a regulatedcommitment. This seems to be a good combination in a federal context, as itwas acceptable to the various state governments.

127
AUSTRIA
GAS DEMAND
■ Share of gas in TPES: 23% (2000)
Gas consumption reached 7.7 bcm in 2000. The industrial and power sectorsare the major consumers of gas. The seasonality of gas demand in Austria isimportant, due to the extensive use of gas in power plants for middle load.
Figure 14: Austrian gas consumption by sector in 2000
■ Seasonality
The ratio between gas sales in the peak and the lowest month of the year wasabout 3 to 1 in 2000. Peak daily sales by distribution companies were 41
■ The seasonality of gas demand in Austria is important, due to theextensive use of gas in power plants for middle load.
■ About a quarter of gas sales are on an interruptible basis.
■ Russian gas, the major supply source, is received with a high load factor.
■ Storage is the main load-management tool for matching seasonaldemand with fairly constant imports. Austria has five underground gasstorage sites and ample capacity, 2.8 bcm of working capacity, or134 days of consumption.
■ OMV is trying to develop Baumgarten as a trading hub.
Commerce - Public services
Residential
Power generation
Industry
Others
10% 7%
22%
26%35%

128
mcm/d in December 2001, six times higher than the lowest daily sales inAugust 2001.
■ Share of gas in the power-generation sector: 13% (2000)
Table 11: Multi-Fired Electricity Generating Capacity in Austriaat 31 December 2000 (GW)
Solid/Liquid 0.28
Solids/Gas 1.21
Liquids/Gas 2.71
Liquids/Solids/Gas 0.12
Total Multi-fired 4.32
Total Capacity* 6.13
* From combustible fuels.
71% of total electricity generating capacity by fuel is multi-fired. The largestgroup of plants runs on natural gas.
■ Interruptibles and fuel switching
Of total gas sales, 25% are sold on an interruptible basis.
Almost all gas-fired electricity plants are dual-or multi-fired.
GAS SUPPLY
■ Reserves: 26 bcm R/P: 14 years
■ Gas supply structure: indigenous production 23%; imports 77%, ofwhich:
- Russia 63%
- Germany 5%
- Norway 9%

129
■ Supply swing
Gas imported mainly from Russia is imported with a high load factor. Productionallows some swing, but it covers 23% of gas supply only.
Figure 15: Austrian monthly gas supply
Others: Germany and Norway.
STORAGE
A volume of gas amounting to more than one-third of Austria’s annual demandis held in five storage facilities, with a total working capacity of 2.8 bcm. This
900
800
700
600
500
400
300
200
100
0
mcm
Jan-9
8
Mar-
98
May
-98Ju
l-98
Sep-
98
Nov-9
8
Jan-9
9
Mar-
99
May
-99Ju
l-99
Sep-
00
Nov-0
0
Sep-
99
Nov-9
9
Jan-0
0
Mar-
00
May
-00Ju
l-00
Others 152%
Russia 123%
Production 146%
Swing in 2000
Table 12: Underground gas storage in Austria
Operator/Working Peak
Name TypeNumber
capacity output(mcm) (mcm/day)
Puchkirchen 1 Depleted gas field RAG 50 0.5
Puchkirchen 2 Depleted gas field RAG 450 4.5
Schoenkirchen/Reyersdorf Depleted gas field OMV 1,770 17.3
Speicher Vertrag 1 Depleted gas field OMV 300 3.2
Thann Depleted gas field OMV 250 2.8
Total 5 2,820 28.3

130
represents 134 days of current average consumption. All the storage facilitiesare in depleted fields, mostly around Vienna.
■ Stock changes
Figure 16: Austrian load balancing
This graph highlights the very important role that storage plays in meetingseasonal requirements.
REGULATORY FRAMEWORK
■ Gas security of supply
Storage plays an important part in the emergency supply plan of the Austriangas industry.
■ Access to the transmission grid and storage
Until the new Gas Law was passed, access to the transmission grid was negotiatedon the basis of published general conditions and pricing structures. SinceOctober 2002, access has been regulated. Access to storage is negotiated.
Jan-9
8
Mar-
98
May
-98
Jul-9
8
Sep-
98
Nov-9
8
Jan-9
9
Mar-
99
May
-99
Jul-9
9
Sep-
00
Nov-0
0
Sep-
99
Nov-9
9
Jan-0
0
Mar-
00
May
-00
Jul-0
0
1200
1000
800
600
400
200
0
-200
-400
-600
mcm
Stock changes Gross inland consumption Production Total imports

■ OMV’s services
OMV offers standard transport services, as well as a range of optional servicesincluding flexibility. OMV offers flexibility bids in its transportation service.Flexibility is individually negotiated with shippers.
OTHERS
Austria is an important transit country with some 25 bcm/year of Russian gastransiting Austrian territory en route to Italy, France, Germany, Hungary,Slovenia and Croatia.
OMV is developing “Gas Hub Baumgarten” (GHB), a trading hub whichwill include storage services in its portfolio. GHB is at the cross-roads of majorlines. It has suitable technical infrastructure, including Eurostorage Baumgarten,located at the Austrian-Slovak border.
131

BELGIUM
GAS DEMAND
■ Share of gas in TPES: 23% (2000)
Gas consumption reached 15.7 bcm in 2000. The power sector represents23% of total demand, much of which is interruptible. The power sector useshigh calorific gas. Since Distrigaz can cut off the power sector more easilythan others, there tends to be a surplus of high calorific gas but a shortage oflow calorific gas.
Figure 17: Belgian gas consumption by sector in 2000
132
Commerce - Public services
Residential
Power generation
Industry
Others
39%1% 12%
25%
23%
■ The seasonality of gas demand is relatively less pronounced in Belgiumthan in other EU countries.
■ Belgium has the ability to interrupt large power generating plants thataccount for about a third of gas sales.
■ The Interconnector offers new flexibility (spot purchases).
■ The country plays an important transit role.
■ The Dutch and Norwegian supplies provide a very large proportionof the total swing.
■ There is little underground storage capacity due to unfavourablegeological conditions.
■ Belgium’s hub, at Zeebrugge, offers great flexibility and reduces the needfor storage.
■ An LNG terminal offers additional flexibility.

■ Seasonality
The ratio between the peak and the lowest month of the year was 2.3 to 1 in2000. Belgium’s ability to interrupt large power generating plants that accountfor more than a third of gas sales allows it to cope with seasonal requirementsin the residential sector.
■ Share of gas in the power-generation sector: 19% (2000)
Table 13: Multi-fired electricity generating capacity in Belgiumat 31 December 2000 (GW)
Solid/Liquid 0.40
Solids/Gas 0.17
Liquids/Gas 4.37
Liquids/Solids/Gas 1.90
Total Multi-fired 6.84
Total Capacity* 8.55
* From combustible fuels.
80% of total electricity generating capacity by fuel is multi-fired and of thisamount, plants running on natural gas have the largest share.
■ Interruptibles and fuel switching
According to a recent report by the Belgium Gas and Electricity RegulatoryAuthority62, at least 30% of daily industrial demand on average is interruptible;52% of industrial consumers have a contract for firm supplies, 21% for non-firm supplies and 27% for some combination non-firm and firm supplies.Among the interruptible customers, 76% can be interrupted by the transmissionsystem operator (peak load balancing) and 24% at the request of the customer(price arbitrage); 62% of industrial customers with an interruptible contractcan switch to an alternative fuel.
The CCGT plants can switch to gas oil.
133
62 CREG (2001).

GAS SUPPLY
■ Gas supply structure: 15.7 bcm in 2000; indigenous production zero;imports 100%, of which:
- Algerian LNG 28%
- Norway 32%
- Netherlands 35%
- Spot (from Interconnector) 5%
The spot market is taking an increasing share. It was zero in 1998.
■ LNG share in gas supply: 28%
■ Gas imports flexibility63
Figure 18: Belgian monthly gas supply
Does not include UK imports (UK imports flexibility amounted to 231% in 2000).
Dutch and Norwegian supplies provide a very large proportion of Belgium’stotal swing. Norwegian supply was relatively flat before 1999 (113% in 1998)and then swing begun increasing to 134% in 1999 and 157% in 2000. Algeriangas deliveries are nearly flat. The constraint on Algerian supplies is the availabilityof LNG tankers. Short-term contracts are also important. The graph, however,gives an idea of flexibility in long-term contracts.
63 Due to the confidential character of data, the government only partly publishes monthly data related to gasimports.
mcm
1800
1600
1400
1200
1000
800
600
400
200
0
Jan-9
8
Mar-
98
May
-98Ju
l-98
Sep-
98
Nov-9
8
Jan-9
9
Mar-
99
May
-99Ju
l-99
Sep-
99
Nov-9
9
Jan-0
0
Mar-
00
May
-00Ju
l-00
Sep-
00
Jan-0
1
Nov-0
0
Netherlands 169%
Norway 157%
Algeria 121%
Swing in 2000
134

135
STORAGE
For geological reasons, storage is small in relation to demand; there is only onesignificant underground site. There is one LNG storage plant at Dudzele thatis used for peak shaving.
■ LNG import terminals
■ Stock changes
Figure 19: Belgian load balancing
Table 14: Underground gas storage in Belgium
Operator/Working Peak
Name TypeNumber
capacity output(mcm) (mcm/day)
Anderlues Mine Distrigas 84 1.3
Dudzele LNG Distrigas 58 8.9
Loenhout Aquifer Distrigas 570 10.0
Total 3 712 20.2
Table 15: Belgian LNG import terminals
TerminalsStorage tanks Nominal capacity
Start-up date(1,000 cm of LNG) (mcm/day)
Zeebrugge 260 8.6 1987
Jan-9
8
Mar-
98
May
-98
Jul-9
8
Sep-
98
Nov-9
8
Jan-9
9
Mar-
99
May
-99
Jul-9
9
Sep-
00
Nov-0
0
Sep-
99
Nov-9
9
Jan-0
0
Mar-
00
May
-00
Jul-0
0
2500
2000
1500
1000
500
0
-500
mcm
Stock changes Gross inland consumption Total imports

136
This graph shows that storage does not play a very important role in meetingseasonal fluctuations in gas demand. Flexibility in gas import contracts does playa major role. Purchases on the spot market have recently increased significantly.
REGULATORY FRAMEWORK
■ Security of supply
The “public service obligation” concept is important in Belgium. The networkis designed to cover all firm clients with amounts based on those of the winterof 1962-63. Daily delivery must be guaranteed down to temperatures of minus11˚C, and sufficient gas must be stored to meet the volume requirement of aone-in-fifty winter. Hourly peaks are covered by line-pack.
■ Access to transportation and storage
The 1999 Gas Law established negotiated access based on published commercialconditions. However, the law was modified on July 18, 2001 and the regimehas been changed to one of regulated third-party access for the entire gassystem including storage and LNG terminals.
Belgium’s limited storage capacity is entirely dedicated to the distributionmarket as Distrigas must cover the sector’s demand under a public serviceobligation.
OTHERS
■ Transit of gas
Belgium is a key transit country. Its total transit capacity amounts to 48 bcm/year,or three times internal consumption. Norwegian, UK and Dutch gas cantransit the country to France, Italy and Spain. Daily input and output figuresthrough the transit pipelines are practically equal; so Belgium cannot exploitthe transit of gas to help its own load-balancing. One exception to the rule canbe found in the transit of gas to France. During the winter Belgium deliversto France less Dutch gas than it receives, effectively drawing gas from Frenchstorage. The pattern is reversed during the summer.

■ Zeebrugge Hub
Zeebrugge, the landing site of the Zeepipe and the location of an LNGregasification terminal, has seen its role reinforced in 1998 with the openingof the Interconnector linking Zeebrugge to Bacton. The Interconnector has givenbirth to the first continental European hub, Zeebrugge Hub, whereapproximately 40 companies now regularly exchange gas. The liquidity at theZeebrugge Hub is such that representative price indexes can now be established.
■ Distrigas services
Virtual storage is available at published tariffs.
137

138
CANADA
GAS DEMAND
■ Share of gas in TPES: 30% (2000)
Canadian demand totalled 90.4 bcm in 2000, an increase of 6% from 1999.The industrial sector represents approximately 33% of total Canadianconsumption. The other most important market in Canada is the “core sector”which includes space heating for residential and commercial buildings.
Figure 20: Canadian gas consumption by sector in 2000
“Others” includes consumption by the natural gas industry itself, as pipeline compressor fuel.
Commerce - Public services
Residential
Power generation
Industry
Others
24%14%
10%
19%
33%
■ Canada has a large, fully deregulated gas market. Major production areasare in the west of the country, while the main consumers are in easternCanada and the US.
■ Gas sales to the residential sector in the peak month of the year are fivetimes higher than in the lowest month. The residential and commercialsectors represent 33% of total sales.
■ To cope with seasonal variations, Canada has developed hugeunderground gas storage, in both upstream and downstream regions.Total working capacity amounts to 17.2 bcm, or 19% of averageannual gas consumption.
■ Interruptible contracts are widely used, but precise estimates of thepotential for switching between fuels are not available.

139
■ Seasonality
The seasonality of gas demand is high, mainly because of weather patterns. Theconsumption profile of each market sector is important, as it defines the typeof contracting practices and risk management the sector will pursue. The ratiobetween total gas sales in the peak and the lowest month of the year was 2.1to 1 in 2000.
Figure 21: Canadian gas demand seasonality (2000)
Source: Canadian Natural Gas, Market Review & Outlook, Natural Resources Canada, 2001.
■ Share of gas in the power-generation sector: 6% (2000)
Table 16: Multi-fired electricity generating capacity in Canadaat 31 December 2000 (GW)
Solid/Liquid 0
Solids/Gas 1.63 (e)
Liquids/Gas 0.43 (e)
Liquids/Solids/Gas 0
Total Multi-fired 2.06
Total Capacity* 33.18
* From combustible fuels.
bcm
12
10
8
6
4
2
0
Residential
Commercial
Industrial
Others
Electricity
Janua
ry
Febr
uary
Marc
hApr
ilM
ayJu
ne July
Augus
t
Sept
embe
r
Octobe
r
Novem
ber
Decem
ber

Only 6% of total electricity-generating capacity by fuel is multi-fired, with plantsrunning on natural gas playing a marginal role. Most of electricity producedin Canada comes from hydro power.
■ Interruptible contracts and fuel switching
The use of interruptible contracts is widespread in Canada, but precise estimatesof the potential for switching between fuels does not seem to exist. In 1995,the government indicated that 20% of industrial sales by local distributioncompanies, or 10% of total sales, were switchable.
The use of interruptible contracts varies widely by region; it is very low inareas where end-users are located near production sites. In eastern Canada,local distribution companies have low interruptible rates in order to encouragesome customers to maintain multi-fuel capability. There are, however, fewcurtailments to interruptible customers, as curtailments generate loss of revenues.
GAS SUPPLY
■ Reserves: 1,728 bcm R/P: 10 years
■ Gas supply structure: indigenous production 99%; imports 1%, from US.
■ Gas production
Figure 22: Canadian monthly gas production
140
mcm
Jan-9
8
Mar-
98
May
-98
Jul-9
8
Sep-
98
Nov-9
8
Jan-9
9
Mar-
99
May
-99
Jul-9
9
Sep-
99
Nov-9
9
Jan-0
0
Mar-
00
May
-00
Jul-0
0
Sep-
00
Nov-0
0
18000
16000
14000
12000
10000
8000
6000
4000
2000
0

Canadian production totalled 181.7 bcm in 2000, an increase of 3.1% over1999. Most of the increase was due to the start-up of the Sable OffshoreEnergy project. Production is relatively flat throughout the year. Swingproduction was 106% in 2000.
■ Gas exports
Canadian natural gas exports to the US increased 7 bcm, or 7%, to reach101.8 bcm in 2000. Higher exports to the Northeast US were mainly dueto the start-up of the Maritimes & Northeast pipeline and Sable OffshoreEnergy project in January 2000. The swing factor of gas exports was 124%in 2000.
Figure 23: Canadian monthly gas exports to US
Pipeline capacity utilisation in Canada is generally high. According to NaturalResources Canada, existing export capacity was used at 90% load factor in 2000.The physical export capacity reached 12,100 mcfd (125 bcm/yearor 342 mcm/day) when the Alliance project was completed in December2000.
Right now total export capacity cannot be filled due to a lack of gas supply.Due to various constraints, capacity is seldom used at 100% load factors. Inrecent years, the best fill rate for total export capacity was about 95%.
mcm
Jan-9
8
Mar-
98
May
-98Ju
l-98
Sep-
98
Nov-9
8
Jan-9
9
Mar-
99
May
-99Ju
l-99
Sep-
99
Nov-9
9
Jan-0
0
Mar-
00
May
-00Ju
l-00
Sep-
00
Jan-0
1
Nov-0
0
11000
10000
9000
8000
7000
6000
5000
4000
3000
2000
1000
0
141

Table 17: Export pipeline capacity (mcm/d)
1999 2000
Year-end Increment Year-endcapacity capacity
Huntingdon (Westcoast) 29.6 0.0 29.6
Huntingdon (User Pipes) 10.8 0.0 10.8
Kingsgate (Foothills/ANG) 73.1 0.0 73.1
Total to US West 113.5 0.0 113.5
Monchy (Foothills) 62.0 0.0 62.0
Emerson (TCPL) 37.0 0.0 37.0
Elmore (Alliance) 0.0 37.5 37.5
Miscellaneous (see note) 8.5 0.0 8.5
Total to US Midwest 107.5 37.5 145.0
Iroquois (TCPL) 25.0 0.2 25.2
Niagara Falls (TCPL) 23.9 0.0 23.9
Chippawa (TCPL) 14.2 0.0 14.2
St. Stephen (MNP) 10.2 0.0 10.2
E. Hereford (TCPL) 4.6 1.1 5.7
Cornwall (TCPL) 1.8 0.0 1.8
Napierville (TCPL) 1.7 0.0 1.7
Phillipsburg (TCPL) 1.4 0.0 1.4
Highwater (TCPL) 0.0 0.0 0.0
Total to US Northeast 82.8 1.4 84.2
Total capacity (export) 303.8 38.9 342.6
Notes: Year-end mcm/d capacity represents approximately the contracted daily volumes that could be deliveredon the last day of the year. Capacity additions are generally completed on November 1. Miscellaneous (Midwest)includes nine export points with another 14 mcm/d of capacity. These export points are not intended to be usedat high load factors, and so a lower number has been used in the table.
Source: Canadian Natural Gas Market Review & Outlook, Natural Resources Canada, 2001.
STORAGE
Total working storage capacity in Canada is 17.2 bcm, or 19% of gasconsumption in 2000. The maximum daily sendout rate is 715 mcm. Upstream
142

storage capacity is being expanded in the producing regions, as one of theresponses to tighter supply and demand conditions.
■ Stock changes
Figure 24: Canadian load balancing
143
Table 18: Underground gas storage in Canada
Working Peak outputOperator Type Number capacity
(mcm) (mcm/day)
AEC Depleted gas field 2,691 56.6
BP Amoco and TransCanada
Depleted gas field 1,189 14.2
Andeerson Exploration Depleted gas field 340
B.C. Gas LNG tanks 17 4
Consumers Gas Depleted reef 2,720 48
GMI/Stogaz/Intragaz Depleted gas field 57 7
Atco Gas Salt cavern 3,116 482
Sabine Hub Services Depleted gas field 992 21
Transgas Salt cavern 907 14
Union Gas/Centra Depleted reef 4,023 57
Unocal Canada Depleted reef 1,133 11
Total 17,184 714.8
Jan-9
8
Mar-
98
May
-98
Jul-9
8
Sep-
98
Nov-9
8
Jan-9
9
Mar-
99
May
-99
Jul-9
9
Sep-
00
Nov-0
0
Sep-
99
Nov-9
9
Jan-0
0
Mar-
00
May
-00
Jul-0
0
20000
15000
10000
5000
0
-5000
mcm
Stock changes Gross inland consumption Production

144
This graph shows the seasonality of gas demand and the role of gas storage inbalancing supply and demand. Peak requirements are usually met by gas in storage.
The role of storage in Canada is essential. Since deregulation in 1985, excessdeliverability has decreased. Many producers and marketers have increasedthe proportion of their total gas supply that is sold on a short-term or spot basis.This enables them not only to backstop their long-term commitments morereadily, but also to take advantage of any short-term spikes.
For many years local distribution companies have used downstream storagefacilities located near their markets as an efficient tool to manage their gas-supplyportfolios and their customers’ gas peak demand during the heating season.Downstream storage is increasingly used not only by local distributioncompanies, but by end-users, marketers and pipeline companies as a way ofincreasing the reliability of gas supplies.
REGULATORY FRAMEWORK
■ Security of supply
The underlying principle of the Canadian Government’s approach to securityof supply is to ensure a healthy and open natural gas market. Nevertheless, theEnergy Preparedness Act and the Emergencies Act allow the Federal Governmentto allot, in an emergency, natural gas.
Energy security is the responsibility of the federal government. Physical energysecurity is not an issue in Canada because of the country’s huge and diverseenergy resource base. There are several major transmission pipelines, whichtransport gas produced in the west to the principal markets in the east.Vulnerability to supply disruption arising from long transmission pipelines ismitigated by duplicated lines. There is substantial upstream storage capacityin western Canada and downstream storage in eastern Canada.
The most vulnerable part of the system seems to be the TransCanada pipelinebetween Alberta and Ontario, which is the only direct east-west connection.The pipeline, however, is looped along its entire length, and disruptions couldbe countered by using storage in eastern Canada.
Currently, there are 24 pipeline interconnections between Canada and theUS with a total annual maximum capacity of 343 mcm/d. To manage possibleinterruption in gas supplies, agreements have been made with large customers

in Canada and the US, such as cogeneration plants, which are capable ofburning other fuels than gas. Under the agreement, gas to those customers couldbe interrupted.
The Canadian government considers fuel choice to be a commercial matter.It no longer has policies or programmes to encourage multi-fired capacity.
■ Access to the transportation system
Interprovincial transmission is regulated by the National Energy Board (NEB),which ensures that open non-discriminatory access is provided to all shipperson interprovincial gas pipelines. Interprovincial transportation rates, conditionsof access and terms of service are regulated by the NEB. However, the boardgenerally accepts the outcome of private negotiations for access to pipelines andimposes regulated rates only where a negotiated rate could not be agreed.
Local distribution companies are regulated at the provincial level by public utilitycommissions. These commissions regulate the rates charged by the companiesfor services, and authorise construction of transmission and distribution lines.
145

146
CZECH REPUBLIC
GAS DEMAND
■ Share of gas in TPES: 19% (2000)
Natural gas consumption increased by 80% in the Czech Republic duringthe last decade reaching 19% of TPES in 2000 (9.2 bcm). The temperature-sensitive market accounts for 43% of gas sales. Household consumptionincreased significantly during the last decade thanks to the extension ofdistribution networks, the replacement of town gas, the production of whichceased in 1996, and incentives to switch from coal to natural gas.
Figure 25: Czech gas consumption by sector in 2000
■ Seasonality
The ratio between gas sales in the peak and the low month of the year was 4.5to 1 in 2000, which is very high compared with other European countries. The
■ The seasonality of gas demand is very high. The temperature-sensitivemarket accounts for more than 40% of gas sales.
■ Supplies from Russia and Norway offer little swing.
■ The Czech Republic relies heavily upon storage to cope with fluctuationsin demand. The country has seven gas storage sites on its territoryand ample capacity (2.1 bcm of working capacity, or about 80 days ofconsumption). The Czech Republic has also contracted for gas-storagecapacity in the Slovak Republic and Germany.
Commerce - Public services
Residential
Power generation
Industry
Others
13% 15%
9%
28%35%

147
growth of space heating in the household and service sectors has increased theseasonal character of natural gas demand.
■ Share of gas in the power-generation sector: 4% (2000)
There is no multi-fired power plants in the Czech Republic.
■ Interruptibles and fuel switching
So far, interruptible contracts are not common in the Czech Republic. In thefuture, interruptible contracts with industrial users may provide enoughflexibility to accommodate the seasonal fluctuations of gas demand and limitthe need for new storage capacity.
GAS SUPPLY
■ Gas supply structure: indigenous production 2%; imports 98%, of which:
- Russia 77%- Norway 21%
The Czech Republic is a major transit country that plays a strategic role inEurope. Russian gas in transit through the Czech Republic represents nearly25% of Western European imports.
■ Supply swing
Russian and Norwegian supplies offer little swing (120% in 2000).
Figure 26: Czech monthly gas imports
Others: German imports, i.e. less than 1% of the supply.
mcm
Jan-9
8
Mar-
98
May
-98Ju
l-98
Sep-
98
Nov-9
8
Jan-9
9
Mar-
99
May
-99Ju
l-99
Sep-
99
Nov-9
9
Jan-0
0
Mar-
00
May
-00Ju
l-00
Sep-
00
Nov-0
0
1000
800
600
400
200
0
OthersRussia 121%Norway 120%
Swing in 2000

148
STORAGE
Six underground storage facilities (UGS) are owned by Transgas. UGS Uhriceis owned by Moravske Naftove Doly. All the underground facilities are operatedby Transgas. Their total capacity is 2.1 bcm (2001 data).
The total storage capacity amounts to 23% of the yearly consumption. However,the supply situation has been tense during winter peak load periods and Transgashas had to lease additional storage capacity. Capacity under contract in gas storagesites at Láb in the Slovak Republic is 500 mcm, with peak load of 5 mcm/day,and at Rehden in Germany, 492 mcm, with peak load of 4.2 mcm/day.
■ Stock changes
Figure 27: Czech load balancing
Table 19: Underground gas storage in the Czech Republic
Operator/Working Peak
Name TypeNumber
capacity output(mcm) (mcm/day)
Dolni Dunajovice Depleted gas field Transgas 700 12
Tvrdonice (Hrusky) Depleted gas field Transgas 487 7
Lobodice Aquifer Transgas 140 3
Stramberk Depleted gas field Transgas 435 6
Tranovice Depleted gas field Transgas 228 2.5
Haje Depleted gas field Transgas 57 6
Uhrice Depleted gas field Transgas 100 6
Total 7 2,147 42.5
Jan-9
8
Mar-
98
May
-98
Jul-9
8
Sep-
98
Nov-9
8
Jan-9
9
Mar-
99
May
-99
Jul-9
9
Sep-
00
Nov-0
0
Sep-
99
Nov-9
9
Jan-0
0
Mar-
00
May
-00
Jul-0
0
2000
1500
1000
500
0
-500
-1000
mcm
Stock changes Gross inland consumption Production Total imports

149
The graph highlights the important role of storage in meeting the CzechRepublic’s seasonal requirements.
REGULATORY FRAMEWORK
■ Security of supply
A new Energy Act was adopted in January 2001. The Act assigns power overthe Czech market between the Ministry of Industry and Trade and a newEnergy Regulatory Office which was established on 1 January 2001. TheEnergy Regulatory Office can impose an obligation to supply above the volumeof energy given by licences in case of need or to offer access to gas transmissionsystems for the above-mentioned supply to gas companies.
Up to the opening of the Czech gas market on 1 January 2005, Transgas isresponsible for secure and reliable supply. After market opening, Transgas, astransmission system operator, would be responsible for supply to all non-eligible customers.
Additional public service obligations that are given by the new Energy Act areas follows:
■ The transmission system operator, operators of distribution systems andnatural gas storage are responsible for secure and reliable operation oftheir gas equipment.
■ The above mentioned gas operators are obliged to work out a contingencyplan.
■ In case of an emergency, Transgas is obliged to steer the whole Czech gasnetwork.
■ Access to transportation and storage
The responsibilities of the energy regulatory authority include setting up theframework for third-party access to the gas grid. The schedule for phasing inthird-party access to gas starts with the largest users. The timetable goes as follows:
■ In 2005, 28% of the natural gas transmission system capacity will beopened to TPA.
■ In 2008, TPA will be extended to include 33% of natural gas transmission.

150
DENMARK
GAS DEMAND
■ Share of gas in TPES: 23% (2000)
Gas consumption reached 4.9 bcm in 2000. Half the gas is consumed by thepower sector. There are five big power plants and numerous producers ofcombined heat and power and district heating. Consumption by thetemperature-sensitive residential and commercial sectors, represents only 18%of total consumption.
Figure 28: Danish gas consumption by sector in 2000
(1) The energy sector accounts for 87% of the “others” category.
■ Seasonality
The ratio between gas sales in the peak and the lowest month of the year was2.5 to 1 in 2000. The ratio between maximum and minimum monthlyresidential gas sales was 3 to 1 in 2000.
■ Denmark has a relatively small gas market. Most of the gas is consumedby the power and combined heat and power generation sector.
■ Seasonality of gas demand is less pronounced than in other Europeancountries.
■ Production, complemented by two gas storage facilities, offers sufficientswing to cover seasonal variations in gas demand.
Commerce - Public services
Residential
Industry
Power generation
Others (1)
3% 15%
47%
18%
17%

151
Figure 29: Danish seasonality in gas demand
Source: DONG.
■ Share of gas in the power-generation sector:: 24% (2000)
Table 20: Multi-fired electricity generating capacity in Denmarkat 31 December 2000 (GW)
Solid/Liquid 5.49
Solids/Gas 0.25
Liquids/Gas 0.74
Liquids/Solids/Gas 0.36
Total Multi-fired 6.84
Total Capacity* 10.22
* From combustible fuels.
67% of total electricity generating capacity by fuel is multi-fired. In this share,plants running on natural gas have a marginal role.
■ Interruptibles and fuel switching
According to DONG, interruptible sales represented 33% of total gas salesin 2000. Half of sales to industry and 40% to the power sector are on
Jan-9
8
Mar-
98
May
-98
Jul-9
8
Sep-
98
Nov-9
8
Jan-9
9
Mar-
99
May
-99
Jul-9
9
Sep-
99
Nov-9
9
Jan-0
0
Mar-
00
May
-00
Jul-0
0
Sep-
00
Nov-0
0
mcm
600
500
400
300
200
100
0
Industry Residential and commercial Power plants (incl. CHP)

152
an interruptible basis. Back-up fuels for interruptible customers are coaland oil.
GAS SUPPLY
■ Reserves: 144 bcm R/P: 18 years
■ Gas supply structure: indigenous production 100%; imports zero
■ Production swing
Denmark produced 8.2 bcm in 2000. The swing factor was 133%. 39% of theproduction is exported to Germany and Sweden.
Figure 30: Danish monthly gas production
STORAGE
DONG has developed two underground storage facilities in aquifer and saltcaverns that have a working capacity of 810 mcm, or 60 days of Danishconsumption.
mcm
Jan-9
8
Mar-
98
May
-98
Jul-9
8
Sep-
98
Nov-9
8
Jan-9
9
Mar-
99
May
-99
Jul-9
9
Sep-
99
Nov-9
9
Jan-0
0
Mar-
00
May
-00
Jul-0
0
Sep-
00
Nov-0
0
1000
900
800
700
600
500
400
300
200
100
0

153
■ Stock changes
Figure 31: Danish load balancing
This graph shows that gas storage does not play an important role in balancingseasonal supply and demand. Denmark is able to modulate its productionaccording to market needs.
REGULATORY FRAMEWORK
■ Security of supply
The Danish gas industry aims to guarantee supply to all non-interruptiblecustomers:
■ even in the extreme case of a three-day supply failure at minus 14˚C;
■ in the extreme case of a sixty-day supply failure at normal temperatures.
Table 21: Underground gas storage in Denmark
Working PeakName Type Operator capacity output
(mcm) (mcm/day)
Lille Torup Salt cavity Dansk Naturgas 410 13
Stenlille Aquifer Dansk Naturgas 400 11
Total 2 810 24
Jan-9
8
Mar-
98
May
-98
Jul-9
8
Sep-
98
Nov-9
8
Jan-9
9
Mar-
99
May
-99
Jul-9
9
Sep-
00
Nov-0
0
Sep-
99
Nov-9
9
Jan-0
0
Mar-
00
May
-00
Jul-0
0
1000
800
600
400
200
0
-200
mcm
Stock changes Gross inland consumption Production

■ Access to transportation and storage
The Gas Act distinguishes between access to the transmission and distributionnetwork and access to storage facilities. There is:
■ regulated third-party access to transmission and distribution networks;
■ negotiated access to storage facilities.
154

155
FINLAND
GAS DEMAND
■ Share of gas in TPES: 10% (2000)
Gas consumption reached 4.2 bcm in 2000. More than half of the gas isconsumed by municipal district heating and related power production. Industrialconsumers, mainly the pulp and paper industry, consume 27%.
Figure 32: Finnish gas consumption by sector in 2000
■ Seasonality
The ratio between gas sales in the peak and the lowest month of the year wasabout 2 to 1 in 2000.
■ Finland is a developing market supplied by Russian gas.
■ Gas consumption is dominated by industry and power generation.
■ The pipeline system covers only part of the country.
■ Finland has no underground gas storage.
■ Fuel-switching is an important tool in securing fuel supplies andmanaging seasonality.
■ The opening of a secondary market, under the terms of the NaturalGas Market Act, provides a new flexibility tool to big customers.
Commerce - Public services
Others
Residential
Power generation
Industry
27% 15%1%
1%
56%

156
■ Share of gas in the power-generation sector: 14% (2000)
Table 22: Multi-fired electricity generating capacity in Finlandat 31 December 2000 (GW)
Solid/Liquid 5.23
Solids/Gas 0.25
Liquids/Gas 1.53
Liquids/Solids/Gas 2.13
Total Multi-fired 9.14
Total Capacity* 10.61
* From combustible fuels.
86% of total electricity generating capacity by fuel is multi-fired, with plantsrunning on natural gas playing an important role.
■ Interruptibles and fuel switching
Beyond formal interruptions, 90% of demand can easily switch to heavy or lightfuel oil, approximately 3% can switch to LPG and the remaining 7% can besupplied through the pipeline network with a propane-air mixture.
GAS SUPPLY
■ Gas supply structure: indigenous production 0%; imports 100%.
Natural gas deliveries to Finland are all from Russia. Although supplies havenever been uninterrupted since the first gas deliveries in 1974, the priority forFinland now is to build a pipeline linking users to possible suppliers in the West.
In June 2000, a new parallel pipeline was connected and commissioned in theKarelian Isthmus in Russia. The parallel pipeline between Lappeenranta andLuumäki in Finland was completed and entered into commercial service insummer 2001.
■ Supply swing
Gas is imported according to seasonal requirements. The swing in gas importswas 133% in 2000.
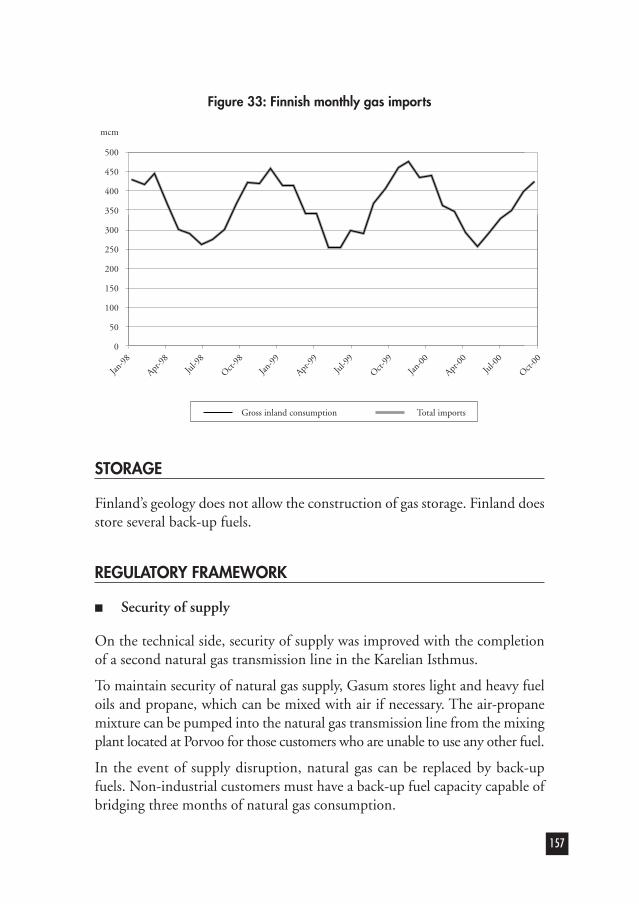
157
Figure 33: Finnish monthly gas imports
STORAGE
Finland’s geology does not allow the construction of gas storage. Finland doesstore several back-up fuels.
REGULATORY FRAMEWORK
■ Security of supply
On the technical side, security of supply was improved with the completionof a second natural gas transmission line in the Karelian Isthmus.
To maintain security of natural gas supply, Gasum stores light and heavy fueloils and propane, which can be mixed with air if necessary. The air-propanemixture can be pumped into the natural gas transmission line from the mixingplant located at Porvoo for those customers who are unable to use any other fuel.
In the event of supply disruption, natural gas can be replaced by back-upfuels. Non-industrial customers must have a back-up fuel capacity capable ofbridging three months of natural gas consumption.
500
450
400
350
300
250
200
150
100
50
0
Jan-9
8
Apr-9
8Ju
l-98
Oct-98
Jan-9
9
Apr-9
9Ju
l-99
Oct-99
Jan-0
0
Apr-0
0Ju
l-00
Oct-00
mcm
Gross inland consumption Total imports
■ Access to transportation
According to the EU Gas Directive, Finland may be exempted from theobligation to open its natural gas networks until the Finnish gas network isdirectly connected to another EU country or until gas can be purchased fromat least two external suppliers.
Finland’s Natural Gas Market Act, which came into force on 1 August 2000,provided for the following changes from 1 January 2001.
■ Transmission and distribution companies (including Gasum) must separatetheir natural gas sales and network business in their accounts.
■ The Electricity Market Regulator was to be transformed into the EnergyMarket Authority with new responsibility in the gas sector.
■ There were to be new natural gas transmission and energy tariffs system.These entered into force at the beginning of 2001.
■ A “secondary market”, consisting in trading of gas bought from Gasumbut not used, was to be opened on 1 March 2001. Online trading of gasvia the Internet did start in March 2001.
Eligible customers are not free to import gas from Russia (currently the onlysource). But retailers and large customers, those buying more than 5 mcm/yearin 2000, may trade with each other any natural gas they have bought fromGasum and not used. These customers represent 90% of the market.
158

FRANCE
GAS DEMAND
■ Share of gas in TPES: 14% (2000)
Gas consumption reached 40.2 bcm in 2000. Sales to the residential-commercialsectors are rising steadily, with 52% of gas consumption in 2000. Sales to theindustrial sector amounted to 41% of total consumption. The other sectors,in particular power generation (CHP), are marginal.
159
■ France has a large temperature-sensitive market, representing morethan half of gas sales.
■ The seasonality of gas sales is high. Interruptible customers are notnormally interrupted in winter.
■ Suppliers offer little swing.
■ France relies heavily upon storage to satisfy fluctuations in demand. Ithas 15 underground storage facilities, with working capacity of10.5 bcm, or 95 days of consumption.
■ The concept of “public service” is very important in France.
■ Gaz de France offers “virtual storage” services through flexibilityproducts.
Commerce - Public services
Residential
Power generation
Industry
Others
2% 25%
5% 27%
41%
Figure 34: French gas consumption by sector in 2000
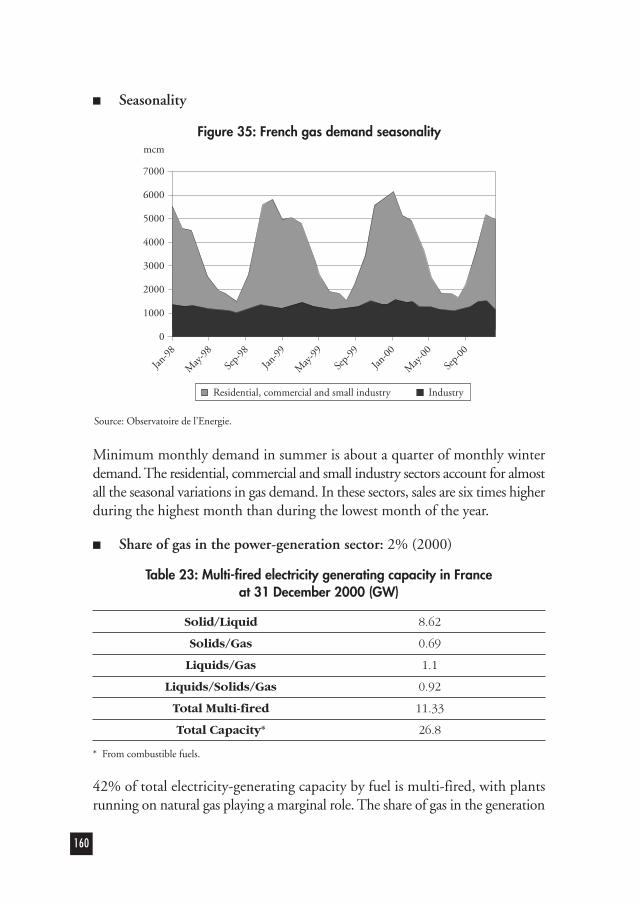
■ Seasonality
Minimum monthly demand in summer is about a quarter of monthly winterdemand. The residential, commercial and small industry sectors account for almostall the seasonal variations in gas demand. In these sectors, sales are six times higherduring the highest month than during the lowest month of the year.
■ Share of gas in the power-generation sector: 2% (2000)
Table 23: Multi-fired electricity generating capacity in Franceat 31 December 2000 (GW)
Solid/Liquid 8.62
Solids/Gas 0.69
Liquids/Gas 1.1
Liquids/Solids/Gas 0.92
Total Multi-fired 11.33
Total Capacity* 26.8
* From combustible fuels.
42% of total electricity-generating capacity by fuel is multi-fired, with plantsrunning on natural gas playing a marginal role. The share of gas in the generation
160
Jan-9
8
May
-98
Sep-
98
Jan-9
9
May
-99
Sep-
99
Jan-0
0
May
-00
Sep-
00
mcm
7000
6000
5000
4000
3000
2000
1000
0
Residential, commercial and small industry Industry
Figure 35: French gas demand seasonality
Source: Observatoire de l’Energie.

of electricity is marginal. Most electricity in France is generated from nuclearpower.
■ Interruptibles and fuel switching
Interruptible contracts make up approximately a third of the industrial market,but, they are not normally disrupted in winter. Disruptions would happen incase of gas supply interruption or of extreme cold weather conditions.
GAS SUPPLY
■ Reserves: 8 bcm R/P: 5 years
■ Gas supply structure: indigenous production; 4%, imports 96%, of which:
- Norway 28%
- Russia 27%
- Algeria 23%
- Netherlands 12%
- Nigeria 6%
■ LNG share in gas supply: 23%
■ Supply swing
161
Mar-
98Ju
l-98
Nov-9
8
Mar-
99Ju
l-99
Nov-9
9
Mar-
00Ju
l-00
Nov-0
0
Jan-9
8
May
-98
Sep-
98
Jan-9
9
May
-99
Sep-
99
Jan-0
0
May
-00
Sep-
00
mcm
4500
4000
3500
3000
2500
2000
1500
1000
500
0
Swing in 2000
Netherlands 154%
Algeria 138%
Norway 131%
Russia 121%
Production 118%
Does not include Nigerian imports.
Figure 36: French monthly gas supply

The swing offered by external suppliers is a relatively flat 119% for total importsin 2000. Dutch gas offers less swing to France than it does to Belgium andGermany. First, because France does not border on the Netherlands, and it isdesired that the transit pipeline through Belgium should be fully used. Second,because swap deals are made between Belgium and France, effectively usingFrench storage, so that Belgium takes more than its contractual volumes duringwinter and less during summer.
STORAGE
France has 15 storage facilities, 12 in aquifers and 3 in salt cavities. The presentworking capacity is 10.5 bcm, or 95 days of average gas consumption. AsFrance has only limited salt cavity storage it uses its aquifer storage in twomodes: for traditional seasonal supply and also for peak supply.
162
Table 24: Underground gas storage in France
Operator/Working Peak
Name TypeNumber
capacity output(mcm) (mcm/day)
Beynes Profond Aquifer GDF 310 9
Beynes Supérieur Aquifer GDF 210 4.5
Céré-la-ronde Aquifer GDF 320 3.7
Cerville-Velaine Aquifer GDF 640 4.8
Chéméry Aquifer GDF 3,430 42.5
Etrez Salt cavity GDF 450 20
Germiny-sous-Colombs Aquifer GDF 840 7
Gournay-sur-Aronde Aquifer GDF 670 17.5
Izaute Aquifer TFE 1400 1.8
Lussagnet Aquifer TFE 820 15
Manosque Salt cavity GDF 110 11
Saint-Clair-sur-Epte Aquifer GDF 410 4
Saint-Illiers Aquifer GDF 390 16
Soings-en-Sologne Aquifer GDF 240 9
Tersanne Salt cavity GDF 250 16.2
Total 15 10,490 182

■ LNG imports terminals
■ Stock changes
Compared with other IEA countries the demand for load balancing in Franceis quite large. This is because the residential and commercial sectors hold a majorshare of total gas consumption.
The graph clearly demonstrates the heavy reliance upon storage to accommodateseasonality, since suppliers offer very little swing.
REGULATORY FRAMEWORK
■ Security of supply
France is dependent on imports for 97% of its gas supply, and 52% of theseimports come from outside Europe. In this situation, France has opted to
163
Jan-9
8
Mar-
98
May
-98
Jul-9
8
Sep-
98
Nov-9
8
Jan-9
9
Mar-
99
May
-99
Jul-9
9
Sep-
00
Nov-0
0
Sep-
99
Nov-9
9
Jan-0
0
Mar-
00
May
-00
Jul-0
0
8000
6000
4000
2000
0
-2000
-4000
mcm
Stock changes Gross inland consumption Production Total imports
Figure 37: French load balancing
Table 25: French LNG import terminals
TerminalsStorage tanks Nominal capacity
Start-up date(1,000 cm of LNG) (mcm/day)
Fos-sur-Mer 150 22 1972
Montoir-de-Bretagne 360 31 1980
maintain strong security of supply, based largely on diversification of gas andenergy supply. France has also a large gas storage capacity.
The gas system is designed to cope with any of the following situations:
■ the coldest year that is statistically probable in a 50-year period;
■ 1 in 50 years peak day demand.
■ Access to transportation, storage and LNG terminals
A draft French law foresees a system of access based on published tariffsapproved by the regulator. Negotiation would only be required in exceptionalcircumstances when specific conditions justify an individual contract.
The three major operators, GdF, CFM and GSO have published their tariffsunder the temporary system and have adapted them to the regulator’sobservations.
164

GERMANY
GAS DEMAND
■ Share of gas in TPES: 21% (2000)
German gas consumption reached 90.5 bcm in 2000. The largest share is inthe temperature-sensitive residential and commercial sectors. Since 1995, the
165
■ Germany is the second biggest European gas market after the UnitedKingdom.
■ The temperature-sensitive market accounts for 40% of total demandand is growing.
■ Germany enjoys considerable flexibility from indigenous productionand imports from the Netherlands.
■ The country has ample storage capacity. Its 39 underground storagefacilities have 18.6 bcm working capacity, 75 days of consumption.
■ Access to storage is part of an Associations Agreement. Storage termshave been in place since 30 June 2001.
■ Most of the growth in European storage over the last decade, isconcentrated in Germany.
■ The country has the ambition of becoming a hub for European gassupplies.
Commerce - Public services
Residential
Power generation (1)
Industry
Others (2)
4% 9%
17% 35%
35%
Figure 38: German gas consumption by sector in 2000
(1) Includes combined heat and power.(2) Includes district heating, energy sector consumption and transport.

industrial sector has taken about 40% of total consumption. The power sectorrepresented 17% in 2000.
■ Seasonality
The ratio between gas sales in the peak and the lowest month of the year wasabout 3 to 1 in 2000.
■ Share of gas in the power-generation sector: 9% (2000)
Table 26: Multi-fired electricity generating capacity in Germanyat 31 December 2000 (GW)
Solid/Liquid 9.46
Solids/Gas 2.58
Liquids/Gas 8.67
Liquids/Solids/Gas 6.90
Total multi-fired 27.61
Total capacity* 80.79
* From combustible fuels.
34% of total electricity generating capacity by fuel is multi-fired. Plants runningon natural gas play an important role.
The share of natural gas in the power-generation fuel mix is continuallyincreasing. In the new Länder, municipalities and industry have built newcogeneration plants based on natural gas for district heating, and gas isprogressively replacing lignite in the existing district heating systems.
■ Interruptible contracts and fuel switching
Interruptible industrial contracts represent approximately a quarter of industrialconsumption and they may be disrupted in winter. Gas companies have,however, been reluctant to sell interruptible contracts.
Approximately 70% of sales to the power sector are interruptible.
GAS SUPPLY
■ Reserves: 264 bcm R/P: 12 years
166

■ Gas supply structure: indigenous production 23%; imports 77%, ofwhich:
- Russia 35%
- Netherlands 19%
- Norway 19%
- Denmark and spot 4%
■ Gas supply swing
German produced 22 bcm of gas in 2000. Production is divided equallybetween sweet and sour gas. Capital intensive plants are needed to desulphurisesour gas (they also earn income from sulphur sales). As it is uneconomical torun them with a low load-factor, sour gas is produced virtually at the maximumtechnically possible rate. Sweet gas, on the other hand, is used as a majorinstrument of load management.
Most of the supply swing is provided by deliveries from the Netherlands (194%in 2000) and from German sweet production.
There are two principal qualities of gas: L-Gas and H-Gas. L-Gas has a highnitrogen content of 10-15%. Domestic production and imports from theNetherlands are mainly L-Gas. H-gas has less of inert gases, such as nitrogen.It may consist almost exclusively of methane, like Russian gas. Or it can containa large share of higher hydrocarbons, as does Norwegian gas from associated
167
Mar-
98Ju
l-98
Nov-9
8
Mar-
99Ju
l-99
Nov-9
9
Mar-
00Ju
l-00
Nov-0
0
Jan-9
8
May
-98
Sep-
98
Jan-9
9
May
-99
Sep-
99
Jan-0
0
May
-00
Sep-
00
mcm12000
10000
8000
6000
4000
2000
0
Swing in 2000
Denmark and spot 174%
Netherlands 194%
Norway 138%
Russia 108%
Production 144%
Figure 39: German monthly gas supply

fields or from gas condensate fields. L-Gas and H-Gas are handled separatelyby two transport, storage and distribution systems. The handling of twodifferent qualities of gas further limits flexibility in supply and demand.
STORAGE
Due to the increase in household gas consumption and the consequent needfor load balancing, German gas storage capacity has increased dramaticallyover the past ten years to 18.6 bcm in 2000. This represents 75 days of annualconsumption. Underground storage is mainly owned by the regional transmissioncompanies.
168
Table 27: Undergound gas storage in Germany
Name TypeOperator/ Working capacity Peak outputNumber (mcm) (mcm/day)
Allmenhausen Depleted gas field CONT 40 0.8
Bad Lauschstädt Salt cavity Verbundnetz Gas AG 806 22.3b. Halle
Bad Lauschstädt Depleted gas fieldVerbundnetz Gas AG 426 5.7b. Halle
Berlin Aquifer Berliner Gaswerke AG 695 10.8
Bernburg Salt cavity Verbundnetz Gas AG 830 30
Bierwang b. Depleted gas field Ruhrgas AG 1,300 28.8München
Breitbrunn/ Depleted gas field RWE-DEA AG 550 6Eggestätt im Mobil EE GmbH Chiemgau Ruhrgas AG
Bremen-Lesum Salt cavity Stadtwerke Bremen AG 177 6.2
Buchholtz b. Aquifer Verbundnetz Gas AG 160 2.4Postdam
Burggraf-Bernsdorf Salt mine Verbundnetz Gas AG 3 1bei Naumburg
Dötlingen b. Depleted gas field BEB, Erdgas 2,025 20.2Oldenburg & Erdöl Gmbh
Empelde b. Salt cavity GHG GmbH (a) 146 7.2Hannover

169
Name TypeOperator/ Working capacity Peak outputNumber (mcm) (mcm/day)
Epe (Ruhrgas) Salt cavity Ruhrgas AG 1,565 51
Epe (Thyssengas) Salt cavity Thyssengas AG 185 9.1
Eschenfelden Aquifer Ruhrgas AG 72 3.1bei Nürnberg EWAG
Etzel b. Salt cavity IVG 534 31.4Wilhelmshaven
Frankenthal b. Aquifer Saar-Ferngas AG 60 2.4Worms
Fronhofen Depleted Deilmann EE GmbH 70 1.7gas field for GVS
Hähnlein b. Aquifer Ruhrgas AG 80 2.4Darmstadt
Harsefeld Salt cavity BEB Erdgas & Erdöl GmbH 140 7.2b. Stadt
Huntorf I.d. Salt cavity EWE AG 65 8.4Wesermarsch
Inzenham - West Depleted RWE-DEA AG 500 7.2bei Rosenheim gas field for Ruhrgas
Kalle b. Aquifer VEW 315 9.6Bad Bentheim
Kiel-Rönne Salt cavity Stadtwerke Kiel 74 4.3AG & Schleswag
Kirchheiligen bei Depleted 200 4.5Mühlausen/Th gas field
Kraak Salt cavity 50 6
Krummhörn Salt cavity Ruhrgas AG 116 6b. Emden
Neuenhuntorf Salt cavity EWE AG 20 2.4
Nüttermoor Salt cavity EWE AG 1,040 24b. Leer
Rehden Depleted gas field Wingas GmbH 4,200 57.6b. Diepholz
Reitbrook Oil field with Deilmann EE GmbH 350 8.4b. Hamburg gas cap Hamburger Gaswerke
Sandhausen Aquifer Ruhrgas AG & Gasversor- 30 1.1b. Heidelberg gung Süddeutchland

Germany has more storage than any other European country. It is the onlyEuropean country that has substantial proportions of all three types of storage:depleted fields, aquifers, salt caverns. Most of the growth of European storagelast decade took place in Germany, in line with increased gas consumption andwith the development of new large sites, such as Rheden.
Germany has never explicitly aimed for a strategic reserve of gas. The mainfunction of German storage is to cope with seasonal variations. Natural gas storagein Germany can be divided into two types: large volume storage for seasonaladjustment, which is mostly owned by the supra-regional companies, and peakstorage for daily adjustment, which is owned by the regional or local gas companies.
■ Stock changes
170
Name TypeOperator/ Working capacity Peak outputNumber (mcm) (mcm/day)
Schmidhausen Depleted Deilmann EE GmbH 150 3.6b. München gas field BMI Elwerath EE GmbH
Stassfurt Salt cavity VEW AG 68 5.3
Stockstadt Depleted gas Ruhrgas AG 135 3.2b. Darmstadt field, Aquifer
Uelsen Depleted BEB EE GmbbH 660 7.4gas field
Wolfersberg Depleted RWE-DEA AG 400 5b. München gas field for Bayerngas
Xanten am Salt cavity Thyssengas GmbH 193 6.7Niederrhein
Total 39 18,556 425.2
Jan-9
8
Mar-
98
May
-98
Jul-9
8
Sep-
98
Nov-9
8
Jan-9
9
Mar-
99
May
-99
Jul-9
9
Sep-
00
Nov-0
0
Sep-
99
Nov-9
9
Jan-0
0
Mar-
00
May
-00
Jul-0
0
15000
10000
5000
0
-5000
mcm
Stock changes Gross inland consumption Production Total imports
Figure 40: German load balancing

The graph shows that storage plays a complementary role in balancing supplyand demand. Most of the supply swing is provided by deliveries from theNetherlands and by German sweet production.
REGULATORY FRAMEWORK
■ Security of supply
In line with the light-handed regulation in Germany, the gas companiesthemselves are primarily responsible for ensuring the security of gas supplies.There are no standard criteria for security as there are in other Europeancountries, such as to meet 1-in-20 or 1-in-50 winters. In developing theirstorage and transportation systems, German companies usually base theircalculations on the winter 1962/63, which was the coldest in sixty years.
■ Access to transmission and storage
Germany has opted for negotiated access to transmission and storage. AnAssociations Agreement (Verbändervereinbarung; acronym: VV), between twoindustrial-user associations and two gas-industry associations defines the basisfor freely negotiated contracts. Access conditions to commercial storage facilitieswere defined in a second Associations Agreement (VV2), which refines the first.A third agreement, in May 2002, further defines access conditions.
In case of conflict over access or access conditions and tariffs, the dispute maybe brought before the federal anti-trust authority (Bundeskartellamt).
Companies are required to publish the main commercial conditions for accessto their network and storage. Since the introduction of negotiated accessseveral dozens of transportation agreements have been concluded. Ruhrgas,Wingas, BEB, Thyssengas and VNG, the five biggest holders of gas storagecapacity in Germany, have published terms and fees for third-party access totheir facilities.
Ruhrgas offers storage only as part of a package with transportation to specificinjection and withdrawal points, a service which it describes as “virtual storage.”Most other providers, including Wingas and BEB, sell storage separately fromtransportation.
171

■ Trading instruments, hubs
A gas-trading hub is being developed at Bunde in Germany. Bunde is close tothe delivery points for Norwegian gas in Emden and Dornum, and close to themain supply point for Dutch gas in Oude Stadenzijl. It is also close to Germandomestic production as well as to the large storage facilities at Etzel, Bunde andRheden and to the north-south and east-west German pipelines.
172

GREECE
GAS DEMAND
■ Share of gas in TPES: 6% (2000)
The Greek gas market is a young one. Natural gas was introduced in 1997 withthe first imports from Russia. Gas consumption reached 2.1 bcm in 2000. As inmost newly-developed markets, gas is primarily used in the power sector andindustry.
■ Seasonality
The ratio between gas sales in the peak and the lowest month of the year was1.7 to 1 in 2000.
173
■ Greece is currently establishing its gas market. Gas consumptionreached 2.1 bcm in 2000, most of it used by power plants. Seasonalvariations in gas demand are limited.
■ Greece has no indigenous production. Imports from Russia and Algeriaoffer little swing.
■ Greece has no underground gas storage but the Revithousa LNGregasification plant has storage tanks.
■ As an emergent market, flexibility is not yet an issue in Greece. Withthe expected increase in gas demand, flexibility tools will have to bedeveloped, such as an interconnection with the European gas grid andunderground gas storage.
Commerce - Public services
Residential
Power generation
Industry
Others76%
21%3%
Figure 41: Greek gas consumption by sector in 2000

■ Share of gas in the power-generation sector: 11% (2000)
There are no multi-fired power plants in Greece. About half of the existinggenerating capacity is based on coal and 30% on nuclear.
GAS SUPPLY
■ Reserves: 1 bcm R/P: 28 years
■ Gas supply structure: indigenous production 2%; imports 98%, of which:
- Russia 74%
- Algeria 24%
■ LNG share in gas supply: 24%
■ Supply swing
Russian deliveries started in 1997 and continue to rise. Algerian LNG deliveriesto the Revithousa LNG regasification terminal started in February 2000. Thesupply swing from these deliveries is not yet a relevant factor.
STORAGE
Greece has not yet built any underground gas storage. However, there is aproject to use a depleted gas field in South Kavala.
■ LNG import terminals
The LNG regasification plant at Revithousa has storage capacity of 75,000 cmof LNG.
174
Jan-0
1
Mar-
98Ju
l-98
Nov-9
8
Mar-
99Ju
l-99
Nov-9
9
Mar-
00Ju
l-00
Nov-0
0
Jan-9
8
May
-98
Sep-
98
Jan-9
9
May
-99
Sep-
99
Jan-0
0
May
-00
Sep-
00
mcm250
200
150
100
50
0
Algeria
Russia
Figure 42: Greek monthly gas imports

■ Stock changes
Seasonal variations in gas demand are limited, as gas is mainly used in powerplants for base load. The Revithousa LNG terminal has storage tanks that canbe used to smooth demand variations.
REGULATORY FRAMEWORK
■ Access to the transportation grid
Greece is an emerging market, not directly connected to the interconnectedsystem of any other EU member state. Russia has a market share close to 75%.As a result, Greece did not have to apply the provisions of the EU Gas Directivein 2000. The opening of the Greek gas market is scheduled for 2006.
175
Jan-9
8
Mar-
98
May
-98
Jul-9
8
Sep-
98
Nov-9
8
Jan-9
9
Mar-
99
May
-99
Jul-9
9
Sep-
00
Nov-0
0
Sep-
99
Nov-9
9
Jan-0
0
Mar-
00
May
-00
Jul-0
0
250
200
150
100
50
0
-50
mcm
Stock changes Gross inland consumption Production Total imports
Figure 43: Greek load balancing
Table 28: Greece LNG import terminals
TerminalsStorage tanks Nominal capacity
Start-up date(1,000 cm of LNG) (mcm/day)
Revithousa Islet 75 5.4 1999

HUNGARY
GAS DEMAND
■ Share of gas in TPES: 39% (2000)
Gas consumption reached 12 bcm in 2000. After the collapse of the old politicaland economic system in 1990, gas demand shrank, especially in the industrialsector. The share of the industrial sector in total gas consumption fell from 42%in 1990 to only 18% in 2000. On the other hand, the share of the commercialand residential sectors has increased. As a result gas consumption is highlyseasonal.
■ Seasonality
The ratio between gas sales in the peak and the lowest month of the year was4.2 to 1 in 2000, which is very high compared with other European countries.
176
■ The seasonality of gas demand in Hungary is high. The temperature-sensitive market accounts for nearly half of gas sales.
■ Indigenous production offers some swing, but domestic resources aredeclining and Hungary is becoming increasingly dependent on Russiangas imports.
■ Hungary has five underground storage facilities with a working capacityof 3.6 bcm, or 110 days of Hungarian gas consumption.
■ Hungary relies heavily upon storage to satisfy fluctuations in demandand is developing storage services for third parties.
Commerce - Public services
Residential
Power generation
Industry
Others30%
18%
18%
20%14%
Figure 44: Hungarian gas consumption by sector in 2000

■ Share of gas in the power generation sector: 19% (2000)
Table 29: Multi-fired electricity generating capacity in Hungaryat 31 December 2000 (GW)
Solid/Liquid 0
Solids/Gas 0
Liquids/Gas 3.78
Liquids/Solids/Gas 0.20
Total multi-fired 3.98
Total capacity* 6.41
* from combustible fuels.
62% of total electricity-generating capacity by fuel is multi-fired, with plantsrunning on natural gas holding the biggest share.
■ Interruptibles and fuel switching
Interruptible contracts are widely used for industrial customers that have fuel-switching capabilities.
Gas-fired plants are multi-fired and can burn fuel-oil when necessary.
GAS SUPPLY
■ Reserves: 26 bcm R/P: 8 years
■ Gas supply structure: indigenous production 26%; imports 74%, ofwhich:
- Russia 65%
- Germany* 6%
- France* 3%* The gas received from Germany and France is, in fact, from Russia, but the contracts are signed with Ruhrgasand Gaz de France.
■ Supply swing
Domestic production offers some swing (136% in 2000), but it covers only 26%of total supply. Imports come from Russia with a high load factor; they offervery little flexibility.
177

STORAGE
Hungary has five underground storage facilities with a working capacity of3.6 bcm, representing one-third of annual consumption. All the storage facilitiesare in depleted fields.
■ Stock changes
The graph below highlights the very important role of storage in meetingseasonal requirements. Peak winter demand is met by indigenous productionand storage.
178
Apr-9
8
Oct-98
Apr-9
9
Oct-99
Apr-0
0
Oct-00
Jan-9
8Ju
l-98
Jan-9
9Ju
l-99
Jan-0
0Ju
l-00
mcm1400
1200
1000
800
600
400
200
0
Total imports 122%
Production 136%
Swing in 2000
Figure 45: Hungarian monthly gas supply
Table 30: Underground gas storage in Hungary
Operator/Working Peak
Name TypeNumber
capacity output(mcm) (mcm/day)
Zana-Nord Depleted gas field MOL 1,300 18
Hajduszoboszlo Depleted gas field MOL 1,590 20.1
Pusztaederics Depleted gas field MOL 330 2.88
Kardoskút Depleted gas field MOL 240 3.4
Maros-1 Depleted gas field MOL 150 2.2
Total 5 3,610 46.58
Source: IEA, MOL.

REGULATORY FRAMEWORK
■ Security of supply
The main focus of the Hungarian government’s energy policy is supply security.Increasing gas storage capacity plays an important role in its plans. Hungaryhas a competitive advantage because it has abundant depleted gas fields. Thecountry has an explicit policy of responding to its declining domestic gasproduction and its increasing dependency on Russia through strategic storage.
Interconnection of the gas system with the European gas network has beenaccomplished with a pipeline linking Hungary and Austria (HAG) and long-termcontracts have been signed with Ruhrgas and Gaz de France to diversify gassupplies. The HAG pipeline provides a link to the Western European gas grid.It allows both cross-border trade and a diversification of supply routes. Thenumber and volume of contracts with the HAG are increasing. There is now virtualdiversification of gas supply through swaps contracts with Western suppliers.
■ Access to transportation and storage
The Hungarian Government intends to implement the European Union GasDirective (98/30/EC) by the time the country is a full member of the EU.
179
Jan-9
8
Mar-
98
May
-98
Jul-9
8
Sep-
98
Nov-9
8
Jan-9
9
Mar-
99
May
-99
Jul-9
9
Sep-
00
Nov-0
0
Sep-
99
Nov-9
9
Jan-0
0
Mar-
00
May
-00
Jul-0
0
2500
2000
1500
1000
500
0
-500
-1000
-1500
mcm
Stock changes Gross inland consumption Production Total imports
Figure 46: Hungarian load balancing

IRELAND
GAS DEMAND
■ Share of gas in TPES: 23% (2000)
Gas consumption reached 4 bcm in 2000. The power generation and industrialsectors are the principal gas consumers, representing 52% and 25% of total gassales.
180
■ The use of gas for base-load power generation represents more than 50%of Ireland’s total demand.
■ As a result, the seasonality of gas demand is less pronounced than inother European countries.
■ The Irish market is interconnected to the UK market. Three fourthsof the gas consumed is imported from UK. The balance is producedoffshore Ireland.
■ As there is sufficient capacity in the Interconnectors, Ireland has accessto all of the flexibility mechanisms available on the UK gas market.
■ Ireland has no underground gas storage of its own, though the SouthWest Kinsale Field has been developed to help load-balancing.
Commerce - Public services
Residential
Power generation
Industry
Others
13%25%
52%
9%1%
Figure 47: Irish gas consumption by sector in 2000

■ Seasonality
The ratio between gas sales in the peak and the lowest month of the year was1.3 to 1 in 2000. The ratio between the peak day and the summertime low isapproximately 6 to 1 in the residential and small commercial/industrial sectors.The ratio of the predicted peak month to the lowest month for these sectorsis approximately 3.5 to 1.
■ Share of gas in the power-generation sector: 39% (2000)
Table 31: Multi-fired electricity generating capacity in Irelandat 31 December 2000 (GW)
Solid/Liquid -
Solids/Gas -
Liquids/Gas 1.60
Liquids/Solids/Gas -
Total multi-fired 1.60
Total capacity* 4.07
* From combustible fuels.
39% of total electricity generating capacity by fuel is multi-fired by gas andliquids.
The recent high rate of growth in the Irish economy has led to a large increasein electricity demand. It is likely that incremental power-generation demandwill be met through combined-cycle gas turbine plants for the foreseeablefuture. The power-generation share of total gas demand is expected to grow overtime.
■ Interruptibles and fuel switching
The large power generation sites at Poolbeg, Aghada and North Wall havedual-fuel capability. Switching to heavy fuel-oil occurs when prices favour theburning of oil and also when natural gas supplies are restricted.
GAS SUPPLY
■ Reserves: 35 bcm R/P: 9 years
■ Gas supply structure: indigenous production 29%; imports from UK71%.
181

The Kinsale Head and Ballycotton fields are the current sources of indigenoussupply. Both fields are in depletion and are expected to cease production around2005. A new gasfield off the west coast, the Corrib Field, has been declaredcommercial. It is planned to bring this gas ashore starting from 2003/2004.
Irish imports represent around 4% of overall UK demand. Due to the relativelyflat nature of Irish demand, the Irish market places a negligible burden on UKflexibility.
■ Supply swing
Bord Gáis has signed a re-profiling agreement with Marathon, the operator ofthe Kinsale Head Facilities Gas Field. South West Kinsale, a small satellite ofthe Kinsale Head Field, will be used to reinject gas in summer and withdrawit as needed in winter. At this early stage its primary function will be to reducegas price differentials between summer and winter and to protect against pricespikes in the spot market rather than to serve as a source of peak management.The re-profiling service has commenced and will be operational until 2005.
Bord Gáis’s swing requirements are met from the UK, where a liquid spotmarket is in operation. Gas may be purchased either within-day or day-aheadto meet demand swings and to ensure daily balancing of the system.
182
Apr-9
8
Oct-98
Apr-9
9
Oct-99
Apr-0
0
Oct-00
Jan-9
8Ju
l-98
Jan-9
9Ju
l-99
Jan-0
0Ju
l-00
mcm450
400
350
300
250
200
150
100
50
0
UK imports 120%
Production 114%
Swing in 2000
Figure 48: Irish monthly gas supply

STORAGE
There is no natural gas storage in Ireland, other than what will be provided byMarathon from the South West Kinsale gas field.
■ Stock changes
Seasonal variations in demand are mostly met by swing in imports.
REGULATORY FRAMEWORK
■ Security of supply
The overall transmission system is designed to meet a 1-in-50 winter based onhistoric weather patterns.
Ireland has two sources of supplies: UK North Sea gas and indigenousproduction. The key to Irish security of supply till now is that either source couldsupply the non-interruptible gas market if there were a supply interruption inthe other. However, demand now exceeds the delivery capacity of the KinsaleHead field. Starting from late 2002, a new interconnector with the UK willprovide supply security for the older one. Its potential capacity is larger thanthat of the existing system. Either interconnector will be able to cover for a supplydisruption in the other. From 2003, gas from the Corrib gas field will furtherenhance the system’s security of supply.
■ Access to transmission
In 1995, third-party access legislation was enacted in Ireland for sites using morethan 25 mcm per year, or about 70% of the market. Ireland has opted for
183
Jan-9
8
Mar-
98
May
-98
Jul-9
8
Sep-
98
Nov-9
8
Jan-9
9
Mar-
99
May
-99
Jul-9
9
Sep-
00
Jan-0
1
Nov-0
0
Sep-
99
Nov-9
9
Jan-0
0
Mar-
00
May
-00
Jul-0
0
500
400
300
200
100
0
mcm
Stock changes Gross inland consumption Production Total imports
Figure 49: Irish load balancing

regulated third-party access. A division of the Department of Public Enterpriseacts as regulator. Legislation going now before parliament will extend the roleof the existing Commission for Electricity Regulation and will rename it asCommission for Energy Regulation, covering both gas and electricity. Thislegislation also provides for the lowering of the third-party access threshold to2 mcm per year.
184

ITALY
GAS DEMAND
■ Share of gas in TPES: 34% (2000)
Gas consumption reached 70.7 bcm in 2000, having developed strongly overthe past ten years, from 47.6 bcm in 1990. Since 1990, the share of theresidential and commercial sectors in total consumption has stayed around35-40%, whilst that of power generation has risen from 20% to 32%.
185
■ Italy has a highly developed gas market. Natural gas makes up 34% oftotal primary energy supply.
■ Gas sales to the residential and commercial sectors account for 35%of the market.
■ Seasonal variations in sales are extremely wide, with 62% of gas salesin the six winter months. There are few interruptible contracts.
■ Italian producers and external suppliers offer very little swing, exceptthe Netherlands.
■ Italy is heavily dependent upon storage to cover fluctuations in gasdemand. Italy has 10 underground storage sites, all in depleted reservoirs.The working volume is 12.7 bcm, 66 days of consumption.
■ Italy holds substantial strategic stocks. For security of supplyconsiderations, gas importers must store gas in a quantity equal to10% of their total imports from non-EU countries. Enough back-upstorage must be kept to meet the expected peak demand.
Residential - Commercial
Power generation
Industry
Others
32%
32%
35%
1%
Figure 50: Italian gas consumption by sector in 2000

■ Seasonality
Seasonal variations in sales are extremely wide, with 62% of gas sales taking placeduring the six coldest months. Sales to industry and power plants are flatthroughout the year, but sales to the residential and commercial sectors are highlydependent on temperature. The overall ratio between gas sales in the peak andthe lowest month of the year was 2.7 to 1 in 2000.
■ Share of gas in the power-generation sector: 38% (2000)
Table 32: Multi-fired electricity generating capacity in Italyat 31 December 2000 (GW)
Solid/Liquid 7.69
Solids/Gas 0
Liquids/Gas 20.36
Liquids/Solids/Gas 4.85
Total multi-fired 32.90
Total capacity* 54.03
* from combustible fuels. Public utilities only (data from autoproducers are not available).
186
Mar-
98Ju
l-98
Nov-9
8
Mar-
99Ju
l-99
Nov-9
9
Mar-
00Ju
l-00
Nov-0
0
Jan-9
8
May
-98
Sep-
98
Jan-9
9
May
-99
Sep-
99
Jan-0
0
May
-00
Sep-
00
mcm
10000
9000
8000
7000
6000
5000
4000
3000
2000
1000
0
Power generation Industrial Residential - Commercial
Figure 51: Italian seasonal gas demand
Source: Industry Ministry, in Staffetta News.

62% of total electricity-generating capacity by fuel is multi-fired, with plantsrunning on natural gas playing the biggest role.
■ Interruptible contracts and fuel switching
There is a trend in Italy towards firm gas contracts. Only 9% of sales areinterruptible. Interruptible contracts exist only in the industrial sector. Theconclusion of interruptible contracts is conditional upon the customer’s havingback-up facilities. 100% of interruptible industrial customers can use heavy fuel-oil as a substitute fuel.
Most gas-fired electricity generation plants are multi-fired, despite the factthat gas sales for power generation are not formally interruptible.
At the end of 2001 the share of interruptible capacity booked by shippers forthe years 2001-2002 was around 9%. As the system now provides incentivesto transmission companies to increase the volume transported, an increase ininterruptible contracts can be expected in the coming years.
GAS SUPPLY
■ Gas reserves: 199 bcm R/P: 13 years
■ Gas supply structure: indigenous production 22%; imports 78%, ofwhich:
- Algeria 38%
- Russia 29%
- Netherlands 8%
- Nigeria 3%
■ LNG share in gas supply: 4%
■ Supply swing
Italian producers and external suppliers offer very little swing. The very flat swingin production can be explained by technical and economic factors. Beforeliberalisation, ENI/Agip treated the combination of their producing fields andstorage facilities as a single system, which they sought to optimise. The gas-optimisation system is now regulated by the network and storage codes. Beforethe codes’ approval, it was regulated by guidelines issued by the Ministry of theProductive Activities (MAP).
187

Except for the Netherlands, all of Italy’s suppliers offer a high load factor. TheDutch contract is particularly flexible as all the gas received from the Netherlandscomes during cold months.
STORAGE
There are ten storage facilities, all located in depleted gas reservoirs, mainly inNorthern Italy. These facilities have a total working volume of 12.7 bcm, or 18%of total sales and 50% of sales to the residential and commercial sectors.
188
Table 33: Underground gas storage in Italy
Operator/Working Peak
Name TypeNumber
capacity output(mcm) (mcm/day)
Brugherio Depleted gas field STOGIT 300 11
Cellino Depleted gas field EDISON TGS 110 na
Conegliano Depleted gas field EDISON TGS 545 na
Cortemaggiore Depleted gas field STOGIT 960 18
Minerbio Depleted gas field STOGIT 2,360 65
Ripalta Depleted gas field STOGIT 1,580 20
Sabbioncello Depleted gas field STOGIT 847 22.5
S.Salvo Depleted gas field STOGIT 2,895 44
Sergnano Depleted gas field STOGIT 2,000 55
Settala Depleted gas field STOGIT 1,150 31.5
Total 10 12,747 267
Mar-
98Ju
l-98
Nov-9
8
Mar-
99Ju
l-99
Nov-9
9
Mar-
00Ju
l-00
Nov-0
0
Jan-9
8
May
-98
Sep-
98
Jan-9
9
May
-99
Sep-
99
Jan-0
0
May
-00
Sep-
00
mcm8000
7000
6000
5000
4000
3000
2000
1000
0
Nigeria 126%
Netherlands 120%
Algeria 120%
Russia 117%
Production 114%
Swing in 2000
Figure 52: Italian monthly gas supply

The facilities were until recently owned and operated by ENI/AGIP andEDISON. However, in 2001, ENI’s board approved a plan to spin off its gastransportation unit, Snam, as well as its storage assets and service. Two newcompanies have been created: SNAM Rete Gas for transportation, regasificationand dispatching, and Stoccaggi Gas Italia (STOGIT) for gas storage.Approximately 40% of SNAM Rete Gas has been privatised.
Italy has a very large volume of strategic gas storage. Historically, the strategicvolume corresponded to six months-supply from the main supplier (Algeriain the 1980s). There has never been any law, obligation or government directiveon the issue. ENI set the strategic reserve volume on its own initiative.Progressively lower ratios have been accepted, because supply has beenextensively diversified. Current strategic volumes, 5.1 bcm in 2000, can covera disruption for three-months on import pipeline or a very cold winterconditions.
As consumption increased from 47 bcm in 1990 to 71 bcm in 2000, so theamount required to cover seasonal fluctuations has increased too. New storageprojects will boost storage capacity to 19.7 bcm and daily output to 300 mcm.
■ LNG import terminals
■ New LNG import terminals
There are many projects for new LNG receiving terminals under consideration.These could eventually improve supply flexibility. New projects include: Rivigo(offshore), Taranto (Puglia), Vado Ligure (Liguria), Brindisi (Puglia), Muggia- Trieste (Friuli Venezia Giulia), Corigliano (Calabria), Lamezia Terme (Calabria),and Rosignano Marittimo (Toscana).
■ Stock changes
The graph below shows the important role played by gas storage in Italy inbalancing gas demand and supply.
189
Table 34: Italian LNG import terminals
TerminalsStorage tanks Nominal capacity
Start-up date(1,000 cm of LNG) (mcm/day)
Panigaglia 100 10 1971

REGULATORY FRAMEWORK
■ Security of supply
Transmission and storage systems have been designed to meet gas demand onthe coldest winter day in 1-in-20 winter and gas interruption of six months dueto disruption of the largest supplier, against the backdrop of a standard coldwinter.
According to the decree regulating natural gas imports of March 2001, gasimports from non-EU countries require the approval of the Ministry ofProductive Activities. In addition to meeting technical and financial requirements,the importer needs to demonstrate:
■ Availability of strategic storage equivalent to 10% of the volume annuallyimported from any non-EU source and, at the end of the peak season, to50% of the average expected daily peak requirement.
■ The capacity to contribute via appropriate investments plans to thedevelopment and security of the gas system or supply diversification.
The MAP will be responsible for emergency planning and safety conditions ofthe Italian system. The Ministry will supervise long-term planning and may give
190
Jan-9
8
Mar-
98
May
-98
Jul-9
8
Sep-
98
Nov-9
8
Jan-9
9
Mar-
99
May
-99
Jul-9
9
Sep-
00
Nov-0
0
Sep-
99
Nov-9
9
Jan-0
0
Mar-
00
May
-00
Jul-0
0
12000
10000
8000
6000
4000
2000
0
-2000
-4000
-6000
-8000
mcm
Stock changes Gross inland consumption Production Total imports
Figure 53: Italian load balancing

specific instructions to safeguard continuity and security of supply and thefunctioning of the storage system. In case of an energy crisis or serious risks,the Ministry will decree necessary short-term measures, which are to be keptto the strict minimum.
■ Access to transportation, storage and LNG terminals
Access to all facilities is regulated, except for newly-built LNG terminals. Theenergy regulator (Autorità per l’energia elettrica e il gas) has published thecriteria for setting transmission, dispatching and local distribution tariffs. Theenergy regulator has also published tariffs for access to storage and LNGterminals.
A decree was published in April 2001 to regulate third-party access to depletinggas fields, for the purpose of converting them into storage facilities.
According to Order n. 91/02 of 16 May 2002, access to newly-built LNGfacilities is negotiated. The sponsor of a newly-built LNG terminal has priorityof access to the terminal, with the following constraints: up to 20 years ofduration; up to 80% of financed new LNG regasification capacity; eligibilityto the priority of access is limited to 8.3 bcm/year of new capacity and to upto 25 bcm/year of total regasification capacity. A negotiated price applies forsuch a priority access. Use-it or lose-it will also apply for the priority of access,on a yearly basis. For other customers, the remaining capacity (20%) and anynon-assigned capacity on a priority basis will be made available at tariffs set bythe Regulatory Authority.
191

JAPAN
GAS DEMAND
■ Share of gas in TPES: 12% (2000)
Gas consumption reached 78 bcm in 2000. Almost all gas consumed in Japanis imported as LNG. Japan initiated LNG trade in the Asia-Pacific region in1969 with its first imports coming from Alaska. The country has since becomethe world’s largest LNG importer.
About two-thirds of LNG imports are used for power generation. Although Japanis the seventh biggest gas consumer in the world, it has a very limited gas
192
■ Gas represents 12% of Japan’s energy mix. The country relies on LNGimports for 97% of its gas supplies. About two thirds of LNG importsare used for power generation and most of the rest to make city gas.
■ Seasonal fluctuations in gas demand are less pronounced than in otherregions.
■ Japan has developed extensive flexibility tools to cope with its uniquesituation. LNG, imported under long-term contracts, comes fromeight countries and ten LNG plants.
■ LNG tanks at regasification terminals provide ample storage capacity.
■ Forty per cent of Japan’s gas-fired power plants are multi-fired andcan switch to other fuels.
Commerce - Public services
Residential
Power generation
Industry
Others
11%13%
68%
7%1%
Figure 54: Japanese gas consumption by sector in 2000

transmission system. Deregulation will help to open up new markets for citygas (residential/commercial sectors). This could have an effect on the seasonalityof gas demand.
■ Seasonality
The ratio between gas sales in the peak and the lowest month of the year was1.4 to 1 in 2000. There are two peaks in Japan: one in the winter for heatingpurposes and one in summer for air-conditioning.
■ Share of gas in the power generation sector: 22% (2000)
Table 35: Multi-fired electricity generating capacity in Japanat 31 December 2000 (GW)
Solid/Liquid 3.01
Solids/Gas 0
Liquids/Gas 23.36
Liquids/Solids/Gas 0
Total multi-fired 26.37
Total capacity* 166.65
* from combustible fuels.
193
May
-98
Jan-9
8
Sep-
99
May
-99
Jan-9
8
Sep-
98
May
-99
Jan-9
9
Sep-
00
mcm8000
7000
6000
5000
4000
3000
2000
1000
0
Power generation
City gas
Industrial
Figure 55: Japanese seasonality in gas demand
Source: www.eneken.ieej.or.jp
16% of total electricity-generating capacity by fuel is multi-fired, with plantsrunning on natural gas playing a leading role.
Maximum electricity-generating capacity from gas was 58.62 GW at the endof 2000. Gas used for electricity generation is projected to increase from around59 GW to about 67 GW by 2010, though its proportion of total capacity willremain stable. Coal and nuclear power will expand further than gas. Sincenuclear and coal will be used for base load, gas may move slightly up the meritorder. At present gas-fired plants operate for about 4,000 to 5,000 hours ayear. This load factor is expected to decline slightly. As dependence on oil frompower generation is reduced, gas may increasingly need to be used to meet peakdemand, making consumption less regular and predictable.
■ Interruptible contracts and fuel switching
Forty per cent of gas-fired power generating capacity is dual-fired, with crudeor fuel oil as the main alternative fuel. Fuel switching would pose few logisticalproblems, as the sites are all coastal and have storage and handling capacity. Thisflexibility will decline somewhat in the future, as new gas-fired generation willbe mainly single-fired CCGT plants.
For city-gas contracts there is less flexibility. There are no interruptible contractsas such, though contracts with industrial consumers contain force majeureclauses. Only about 20% of larger city-gas consumers, accounting for a smallproportion of total demand, have dual-firing and that proportion is declining.
GAS SUPPLY
■ Reserves: 40 bcm R/P: 16 years
■ Gas supply structure: indigenous production 3%; imports 97% of which:
- Indonesia 32%
- Malaysia 20%
- Australia 13%
- Qatar 11%
- Brunei 10%
- UAE 8%
- USA 2%
- Oman < 1%
194

Japan has diversified its LNG imports, which now come from eight countriesand ten LNG plants. Oman started to deliver in December 2000.
■ LNG share in gas supply: 97%
■ Supply swing
LNG supplies offer little swing (113% in average), except for LNG receivedfrom Qatar, with swing of 134% in 2000. This is due to the build-up of Qatarplants and available extra capacity.
STORAGE
There is no underground gas storage in Japan. However, the country has manyLNG aboveground tanks at its LNG terminals.
■ LNG import terminals
Japan has 22 regasification terminals, for a total capacity of 603.8 mcm/day,or about 200 bcm/year, which gives the country a huge spare capacity. The storagecapacity is 12.18 mcm of LNG (equivalent to 7.3 bcm of gas), which is hugein comparison to other LNG importing countries, but this is the only meansto store gas in Japan.
Many terminals serve specific power plants but some are shared betweenelectricity and city-gas companies.
195
Mar-
98Ju
l-98
Nov-9
8
Mar-
99Ju
l-99
Nov-9
9
Mar-
00Ju
l-00
Nov-0
0
Jan-9
8
May
-98
Sep-
98
Jan-9
9
May
-99
Sep-
99
Jan-0
0
May
-00
Sep-
00
mcm8000
7000
6000
5000
4000
3000
2000
1000
0
Malaysia 118%Indonesia 118%Brunei 125%UAE 111%Qatar 134%USA 141%Australia 114%Production 125%
Swing in 2000
Figure 56: Japanese monthly gas supply

■ Stock changes
The graph below shows that gas consumption is relatively flat throughout theyear (load of 112%). Fluctuations in gas demand are covered by importflexibility.
196
Table 36: Japanese LNG import terminals
TerminalsStorage tanks Nominal capacity
Start-up date(1,000 cm of LNG) (mcm/day)
Negishi 1,250 50.8 1969
Senboku I 180 8.4 1972
Sodegaura 2,660 103.6 1973
Senboku II 1,405 43.8 1977
Tobata 480 24 1977
Chita I 300 27 1977
Himeji I 520 31.6 1979
Chita II 640 42.9 1983
Higashi-Niigata 720 31.4 1983
Himeji II 560 14.8 1984
Higashi-Ohgishima 540 62.9 1984
Futtsu 610 69.3 1985
Yokkaichi (Kawagoe) 320 29.2 1987
Yanai 480 7.5 1990
Shin-Oïta 320 17.2 1990
Yokkaichi 160 2.4 1991
Fukuoka 70 1.7 1993
Hatsukaichi 85 1.3 1996
Sodeshi 82.9 2.3 1996
Kagoshima 36 0.5 1996
Shin-Minato 80 1.1 1997
Kawagoe 480 19.4 1997
Ohgishima I 200 10.7 1998
Total 12,178 603.8

REGULATORY FRAMEWORK
■ Security of supply
Japan’s gas market is different from those in the other IEA regions. Japan is almostcompletely dependent on imported LNG, most of which is used for powergeneration.
The special structure of the market determines Japan’s approach to energysecurity. Underground storage, interruptible contracts, pipeline links and otherapproaches that are common in other regional markets play no significant rolein Japan. Reliance is placed on long-term contracts with several stable suppliers,on modular supply and delivery systems that limit dependence on any singleinstallation, and on fuel substitution and sharing via the electricity-generationsystem.
These arrangements have served Japan well and no serious security problemshave been encountered, even when the Arun plant in Indonesia ceased todeliver from March to July 2001.
The Japanese approach to security of supply is very comprehensive. It seeks to:
1. conserve resources and alleviate energy loads through energy conservation;
2. obtain the best mix of energy supply, through diversification of supplysources and the use of more-environment-friendly fuels;
3. decentralise supply sources and promote producer-consumer dialogue;
4. promote security of the environment;
197
Jan-9
8
Mar-
98
May
-98Ju
l-98
Sep-
98
Nov-9
8
Jan-9
9
Mar-
99
May
-99Ju
l-99
Sep-
00
Nov-0
0
Sep-
99
Nov-9
9
Jan-0
0
Mar-
00
May
-00Ju
l-00
8000
6000
4000
2000
0
-2000
mcm
Stock changes Gross inland consumption Production Total imports
Figure 57: Japanese load balancing
5. take measures for emergency preparedness, especially stockpiling;
6. take measures to curb price volatility, by establishing markets that minimisethe perverse effects of deregulation.
In the gas sector, Japan has a series of measures providing insurance against supplyinterruptions:
■ Supply diversity: Eight countries supply LNG to Japan. Individual Japanesecompanies generally have more than one supplier. Osaka Gas, for examplehas six suppliers, under nine separate contracts.
■ Long-term contracts: Suppliers and customers are interdependent and havea common interest in security of supply. They are linked by long-termcontracts that have proved a stable basis for managing the business in thepast.
■ Modular supply systems: Production and liquefaction plants include anumber of separate units; several tankers are involved in each contract; mostimporting companies have more than one terminal; terminals have morethan one jetty.
■ Supply flexibility. Most supply contracts have from 5% to 10% flexibilityeither written into the contract or on a “best endeavours” basis.
■ Gas supply sharing: Although there are few pipeline connections, a numberof terminals are shared between gas and electricity companies. Furthermore,there is a high degree of standardisation of shipping capacity: extra supplyavailable from a particular source can usually be transferred to anothercompany that might be facing difficulties.
■ Electricity exchanges: Japan has two frequency zones - 50 Hz and 60 Hz.Electricity interconnections exist both between companies within thezones and, to a limited extent, between the zones. These interconnectionsare being expanded.
■ Fuel-switching: Forty per cent of gas-fired power generating capacity isdual-fired, with crude or fuel oil as the main alternative fuel.
■ SNG manufacture: There is considerable capacity for manufacturingsynthesised natural gas (SNG) from naphtha; capacity is around 1.4 milliontons annually for city-gas companies as a whole.
■ Storage: Although Japan has no underground storage, it has large aboveground capacity designed to cope with fluctuations in supply. Total storage,at 7.3 bcm, amounts to 34 days of average consumption.
198

■ Access to the grid
Japan’s Ministry of Economy, Trade and Industry (METI) plans to force gassuppliers to allow third-party access to their gas systems by March 2004. Themove will apply to both the retail and wholesale gas markets.
Initial steps towards competition in the Japanese electricity and city-gas marketshave been gradually taken since 1994. In 1999, the requirements for eligiblecustomers for liberalisation were decreased from purchases of 2 mcm/year toover 1 mcm/year. The deregulated segment of the city gas market is 30% of thetotal, and of the utilities market 20%. The deregulation of the electricity sector,started in 2000, is also affecting the gas market. City-gas and electricity utilitiescan now sell in one another’s territory.
199

KOREA
GAS DEMAND
■ Share of gas in TPES: 9% (2000)
Korean gas consumption reached 19 bcm in 2000. Natural gas is principallyconsumed by the power and residential sectors. The residential sector represents39% of total consumption.
Until the economic crisis at the end of 1997, Korea’s LNG use grew by an average25% per year in the 1990s. Imports decreased in 1998, but started to riseagain in 1999, by 23% and in 2000 by 12%.
200
■ Korea imports all its gas from LNG suppliers. The country is theworld’s second largest LNG importer with 19 bcm imported in 2000.Korea does not produce gas.
■ The temperature-sensitive market represents half of gas sales. Demandseasonality is high.
■ Seasonal variations in sales are mainly met by import flexibility and spotLNG cargoes imported in the winter period.
■ There is no underground gas storage on the territory.
■ LNG facilities have storage tanks and provide some flexibility.
Commerce - Public services
Residential
Power generation
Industry
Others39%
16%
33%
10%2%
Figure 58: Korean gas consumption by sector in 2000

■ Seasonality
The ratio between gas sales in the peak and the lowest month of the year was2.8 to 1 in 2000. As can be seen from the graph below, consumption in theresidential sector is highly temperature-dependent, with gas sales in December2000 about ten times higher than in August 2000. Gas consumption in thecommercial sector is also highly seasonal.
Gas consumption in the electricity sector peaks in the summer months and thushelps smooth out seasonal variations in gas demand.
■ Share of gas in the power generation sector: 10% (2000)
Table 37: Multi-fired electricity generating capacity in Koreaat 31 December 2000 (GW)
Solid/Liquid 1.61
Solids/Gas 0
Liquids/Gas 6.97
Liquids/Solids/Gas 0
Total multi-fired 8.58
Total capacity* 36.82
* from combustible fuels.
201
Mar-
98Ju
l-98
Nov-9
8
Mar-
99Ju
l-99
Nov-9
9
Mar-
00Ju
l-00
Nov-0
0
Jan-9
8
May
-98
Sep-
98
Jan-9
9
May
-99
Sep-
99
Jan-0
0
May
-00
Sep-
00
mcm2500
2000
1500
1000
500
0
ResidentialCommercialIndustryPower generation
Source: Korea Energy Economics Institute.
Figure 59: Korean gas demand seasonality64
64 Includes LPG (3% of total consumption in 2000).

23% of total electricity generating capacity by fuel is multi-fired, with plantsrunning on natural gas playing the largest role.
GAS SUPPLY
■ Gas supply structure: indigenous production zero; imports 100%, ofwhich:
- Indonesia 42%
- Qatar 22%
- Malaysia 17%
- Oman 11%
- Brunei 5%
- United Arab Emirates 2%
- Others - spot 1%
LNG is imported under long-term contracts from Indonesia, Malaysia, Oman,Qatar and Brunei, and also under short-term contracts from Abu Dhabi.
■ LNG share in gas supply: 100%
■ Supply swing
LNG supplies offer a great deal of flexibility as the deliveries under long-termcontracts are complemented by spot cargoes. Additional short-term LNG tradeto meet peak demand in the winter months of 2001-2002 required 16 cargoes.
202
Mar-
98Ju
l-98
Nov-9
8
Mar-
99Ju
l-99
Nov-9
9
Mar-
00Ju
l-00
Nov-0
0
Jan-9
8
May
-98
Sep-
98
Jan-9
9
May
-99
Sep-
99
Jan-0
0
May
-00
Sep-
00
mcm
4000
3000
2000
1000
0
Others 193%Other Asia 173%Malaysia 201%Indonesia 182%Brunei 243%
Swing in 2000
Figure 60: Korean monthly LNG supplies
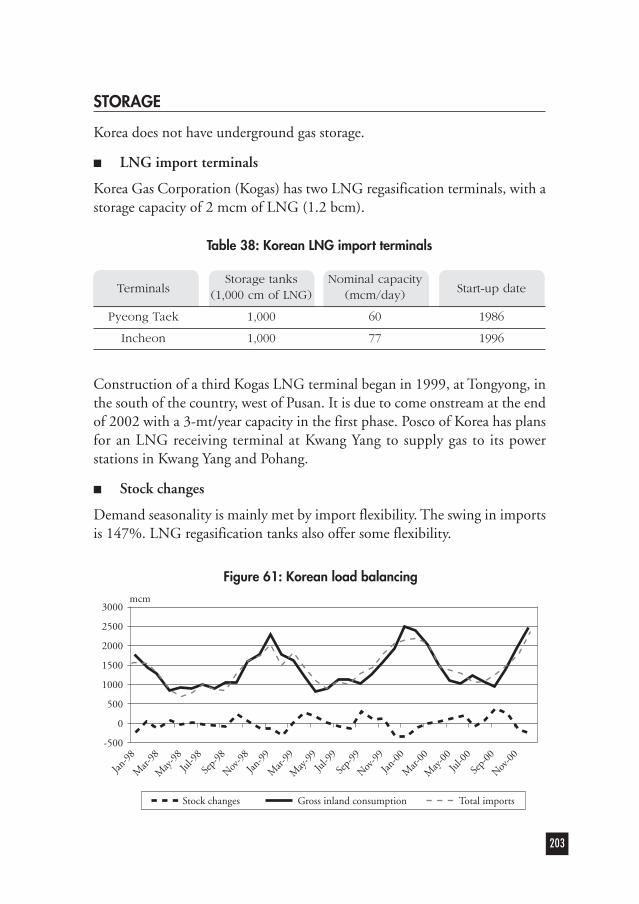
STORAGE
Korea does not have underground gas storage.
■ LNG import terminals
Korea Gas Corporation (Kogas) has two LNG regasification terminals, with astorage capacity of 2 mcm of LNG (1.2 bcm).
Construction of a third Kogas LNG terminal began in 1999, at Tongyong, inthe south of the country, west of Pusan. It is due to come onstream at the endof 2002 with a 3-mt/year capacity in the first phase. Posco of Korea has plansfor an LNG receiving terminal at Kwang Yang to supply gas to its powerstations in Kwang Yang and Pohang.
■ Stock changes
Demand seasonality is mainly met by import flexibility. The swing in importsis 147%. LNG regasification tanks also offer some flexibility.
203
Table 38: Korean LNG import terminals
TerminalsStorage tanks Nominal capacity
Start-up date(1,000 cm of LNG) (mcm/day)
Pyeong Taek 1,000 60 1986
Incheon 1,000 77 1996
Jan-9
8
Mar-
98
May
-98
Jul-9
8
Sep-
98
Nov-9
8
Jan-9
9
Mar-
99
May
-99
Jul-9
9
Sep-
00
Nov-0
0
Sep-
99
Nov-9
9
Jan-0
0
Mar-
00
May
-00
Jul-0
0
3000
2500
2000
1500
1000
500
0
-500
mcm
Stock changes Gross inland consumption Total imports
Figure 61: Korean load balancing

REGULATORY FRAMEWORK
■ Security of supply
One of the major objectives of the Korean energy policy is to maintain a diverseand stable energy supply. LNG was introduced in 1986 as one of the pillars ofKorea’s energy-diversification policy. LNG is imported under seven long-termcontracts with five major suppliers.
Security of supply was tested in 2001 when Exxon-Mobil’s Arun LNG complexin North Aceh, Indonesia, was forced to cease production from March toSeptember. The shut down of the Indonesian gas fields had a direct short-term impact in Korea, as Arun had contracted to provide Korea 3.3 milliontonnes of LNG per annum. During the shutdown, additional supply was madeavailable by Bontang in Indonesia and by Malaysia and Australia. This was madepossible by the existing spare capacity at these plants. It demonstrated theexcellent co-operation that exists among LNG players of the region.
■ Gas market reforms and access to the LNG terminals/grid
The government will liberalise and privatise the LNG import, transmission andwholesale businesses, which are now a monopoly of state-owned Kogas.
The basic steps of the restructuring plan include:
■ introducing gas-to-gas competition by unbundling of importing and salesactivities from operation of terminals and the transmission network;
■ instituting an open access regime for receiving terminals and the transmissionnetwork;
■ introducing competition in the retail sector through competition in facilityinvestment.
The plan includes dividing Kogas into four companies: a holding company forinfrastructure (terminals, pipelines and trunk line) and three trading companies.Two of these import and wholesale subsidiaries would be sold off by the endof 2002. The holding company and the third trading company would also besold off, but not immediately. LNG purchasing agreements will be grouped soas to ensure fair and transparent competition between the three import andwholesale companies. The three companies will each undertake three businesses:LNG imports, wholesaling and retailing.
204

LUXEMBOURG
GAS DEMAND
■ Share of gas in TPES: 18% (2000)
Luxembourg’s gas consumption was 0.76 bcm in 2000. Most of the gas wasconsumed by the industrial sector.
■ Seasonality
The ratio between gas sales in the peak and the lowest month of the year wasabout 2 to 1 in 2000.
■ Share of gas in the power generation sector: 53% (2000)
■ Interruptibles and fuel switching
Gas power plants are single-fired.
205
■ Luxembourg has a small gas market.
■ Gas is mostly used by the industrial sector.
■ Imports from Norway provide the required seasonal flexibility.
■ Balancing services are in place.
Residential
Power generation
Industry
Others7%62%
31%
0%
Figure 62: Luxembourg gas consumption by sector in 2000

GAS SUPPLY
■ Gas supply structure: indigenous production zero; imports 100%, ofwhich:
- France 6%
- Germany 2%
- Norway 92%
■ Supply swing
Figure 63: Luxembourg monthly gas supply
Norwegian imports which provide the bulk of gas supplies to Luxembourg,provide the required flexibility, with a swing of 143%.
STORAGE
There is no gas storage in Luxembourg.
■ Stock changes
206
Mar-
98Ju
l-98
Nov-9
8
Mar-
99Ju
l-99
Nov-9
9
Mar-
00Ju
l-00
Nov-0
0
Jan-9
8
May
-98
Sep-
98
Jan-9
9
May
-99
Sep-
99
Jan-0
0
May
-00
Sep-
00
mcm100
80
60
40
20
0
Germany 800%France 209%Norway 143%
Swing in 2000
Jan-9
8
Mar-
98
May
-98
Jul-9
8
Sep-
98
Nov-9
8
Jan-9
9
Mar-
99
May
-99
Jul-9
9
Sep-
00
Nov-0
0
Sep-
99
Nov-9
9
Jan-0
0
Mar-
00
May
-00
Jul-0
0
100
75
50
25
0
mcm
Gross inland consumption Total imports
Figure 64: Luxembourg load balancing

Demand seasonality is not very high in comparison with other Europeancountries and is met entirely by import flexibility.
REGULATORY FRAMEWORK
■ Access to the grid and storage
Grid access conditions are regulated and tariffs are published on a temporarybasis until the regulator approves them. Balancing services are in place and riskmanagement is possible, but the large buyers have not used it so far.
207

NETHERLANDS
GAS DEMAND
■ Share of gas in TPES: 46% (2000)
Gas consumption reached 48.9 bcm in 2000. The residential sector’s share inoverall gas consumption remains very stable, at 25%, whereas power generation’sshare is rising.
208
■ Natural gas accounted for 46% of the Netherlands’ total primary energysupply in 2000, a higher proportion than in most other OECD countries.
■ Seasonal variations in gas demand are less pronounced in theNetherlands than in other European countries. The residential andcommercial sectors represent only 25% of total sales.
■ Supplies to electricity generators can be interrupted when temperaturesdrop below 0˚C.
■ Thanks to the giant Groningen gas field and its proximity to Europeanmarkets, the Netherlands is the traditional European swing-gas supplier.The high swing offered by Groningen enables the Dutch gas industryto meet gas-demand fluctuations.
■ Until recently the Netherlands had only one LNG peak-shaving facility.Currently, Gasunie operates three underground storage sites and BPplans to develop a new site.
■ Gasunie offers access to “virtual storage” and plans to offer storageservices in the future.
Residential
Power generation
Industry
Others (1)
34%
26%
25%15%
Figure 65: Dutch gas consumption by sector in 2000
(1) Agriculture accounts for 43% and the energy sector for 10% of the “others” category.

■ Seasonality of gas demand
The ratio between gas sales in the peak and low month of the year was 2.3 to1 in 2000.
■ Share of gas in the power generation sector: 58% (2000)
Gas has a very high level of penetration in the power sector.
Table 39: Multi-fired electricity generating capacity in the Netherlandsat 31 December 2000 (GW)
Solid/Liquid 0.60
Solids/Gas 3.57
Liquids/Gas 3.91
Liquids/Solids/Gas 0
Total multi-fired 8.08
Total capacity* 20.07
* from combustible fuels.
40% of total electricity generating capacity by fuel is multi-fired, with plantsrunning on natural gas playing the biggest role.
■ Interruptible customers and fuel switching
Supplies to power stations can be interrupted when temperatures fall below zerodegree Celsius. They are routinely interrupted when temperatures drop belowminus 5˚C.
GAS SUPPLY
■ Gas reserves: 1,680 bcm R/P: 25 years
■ Gas supply structure: indigenous production 81%; imports 19%, ofwhich:
- UK 11%
- Norway 7%
- Germany 1%
209

■ Supply swing
The Netherlands has the second-largest gas reserves in the IEA-Europeancountries, much of them in the Groningen field. In 2001, Groningen suppliedjust over 29% of the total volume of gas purchased by Gasunie.
Production from Groningen rose exponentially between 1963 and 1973. In1974, the Dutch government introduced the “small gas fields” policy, designedto discover, develop and operate smaller fields in order to improve themanagement of its long-term natural gas resources. Under this policy, Gasunieis obliged to buy gas produced at small fields, when available, rather thanfrom Groningen. The policy was facilitated by the fact that Groningen hasunique flexibility, with a deliverability ranging between 0 and 500 mcm perday. This is sufficient to cope with Dutch and European customers’ demandseasonality. In effect, Groningen acts as a swing field.
Dutch production will eventually decrease as will its contribution to meetingflexibility in demand. Imports from Norway and UK are increasing (up 140%in three years) but these offer very little flexibility. With the opening of theInterconnector, imports from the UK began to augment, bringing intensifiedcompetition to the Dutch market.
STORAGE
For a long time, Holland had no underground gas storage at all, only a peak-shaving facility used during periods of very cold weather. The Groningen field
210
Jul-9
8
Jan-9
9Ju
l-99
Jan-0
0Ju
l-00
Jan-9
8
Apr-9
8
Oct-98
Apr-9
9
Oct-99
Apr-0
0
Oct-00
mcm14000
12000
10000
8000
6000
4000
2000
0
Total imports134%
Production169%
Swing in 2000
Figure 66: Dutch monthly gas supply

could, and still can, balance seasonal variations in consumption and play therole of a swing producer.
Faced with the prospect of the depletion of the Groningen field, Amoco,NAM/Gasunie and BP converted depleted gas fields into storage reservoirs.These facilities provide new flexibility. They also permit delaying the installationof extensive compression facilities on the Groningen field.
Gasunie contracted all capacity at the country’s three storage facilities on a long-term basis. There is open access to Gasunie’s storage, but the price of access isnot published. There is no secondary storage market, and the Dutch energyregulator is now reviewing the situation.
There is also an independent gas storage project, developed by BP and itspartners in the P15-P18 gas field complex, some 40 kilometers offshoreRotterdam. The complex can currently ship 15 mcm/day of gas via a dedicated26-inch pipeline to shore at Maasvlakte, where gas can be sold to industrial oroil-refining clients, or shipped onward via Gasunie’s open-access transmissionnetwork to Rotterdam.
■ Stock changes
Unlike other European countries, the Netherlands did not develop storage tobalance gas supply and demand. Seasonal variations in gas demand are met byswing production. Storage was developed to allow Gasunie to continue buyinggas from small fields with high load factors in priority over Groningen. Gasuniecan fulfil this obligation by adjusting purchases from Groningen and usingstorage.
211
Table 40: Underground gas storage in the Netherlands
Operator/Working Peak
Name TypeNumber
capacity output(mcm) (mcm/day)
Maasvlakte LNG peak shaving Gasunie 78 31
Norg (operated by NAM) Depleted gas field Gasunie 1,100 54
Grijpskerk (NAM) Depleted gas field Gasunie 800 54
Alkmaar (Amoco) Depleted gas field Gasunie 500 36
Total 4 2,478 175

REGULATORY FRAMEWORK
■ Security of supply
Security of supply is left to the markets. Suppliers to small households musthave permits based on guaranteed supply to these markets.
Gasunie has designed its pipeline network so that it can cover demand ondays when the average temperature drops below minus 15°C (which happensonce every 50 years, according to national statistics).
■ Access to transportation and storage
The Netherlands opted for a negotiated third-party access for transmission.Access, however, is subject to regulatory control. Indicative tariffs and termsand conditions for transport and necessary ancillary services are published.Services associated with transportation include load-factor conversion, providingflexibility and services relating to gas quality and pressure.
Storage companies with a dominant position (NAM, BP Amoco and Gasunie)are required to give new parties access to their gas-storage installations.
■ Gasunie services
Gasunie Trade & Supply (GTS) provides the following services: transportation,quality conversion and hourly flexibility.
212
Jan-9
8
Mar-
98
May
-98
Jul-9
8
Sep-
98
Nov-9
8
Jan-9
9
Mar-
99
May
-99
Jul-9
9
Sep-
00
Nov-0
0
Sep-
99
Nov-9
9
Jan-0
0
Mar-
00
May
-00
Jul-0
0
12000
10000
8000
6000
4000
2000
0
-2000
mcm
Stock changes Gross inland consumption Production Total imports
Figure 67: Dutch load balancing

■ Transport services: GTS provides transportation services for non-Gasuniegas from the point of delivery to the point of redelivery. The company usesits 12,000-km pipeline system, which covers all of the Netherlands. Theseservices are provided in accordance with the following principles:
- first come, first served;
- declaration of contract;
- hourly balancing (hour in = hour out).
■ Quality conversion: Gasunie can adjust the quality of the gas to the requirementof its customers.
■ Hourly flexibility: GTS provides hourly flexibility. It offsets short-termimbalances by providing virtual storage at the consumer location. Hourlyflexibility is a virtual gas storage tank that is made available to the customer.This tank has a volume and a given send-out capacity. Hourly flexibilityentitles the customer to have capacity available for a certain period inaddition to capacity supplied by another gas supplier.
213

NEW ZEALAND
GAS DEMAND
■ Share of gas in TPES: 27% (2000)
New Zealand’s gas consumption reached 6.07 bcm in 2000. There are threemajor consumer groups: the petrochemicals industry, electricity generationand direct users served by gas utilities. In 2000, 42% of New Zealand’s naturalgas was used in the production of methanol at the Montunui and Waitara plants,both owned by Methanex New Zealand Limited. Natural gas is also used as afuel and feedstock in the manufacture of ammonia and urea fertilisers. Afurther 41% of the gas was used for electricity generation. The remaining17% was delivered through a high-pressure pipeline system directly to majorusers, to gas utilities for distribution to other industrial users and to thecommercial and industrial sectors.
214
■ Gas consumption, which is entirely covered by indigenous production,reached 6.1 bcm in 2000. Gas sales to the industrial sector, especiallypetrochemicals, account for 52% of total sales. Sales to the powersector account for 41%.
■ Seasonal variations in sales are low and are entirely met by flexibilityin production.
■ New Zealand has no gas storage facility.
Commerce - Public services
Residential
Power generation
Industry
Others41%
3%
52%
2%2%
Figure 68: New Zealand gas consumption by sector in 2000

Only the North Island has a gas distribution system.
Due to depletion of Maui field, gas consumption is expected to decrease.According to the long-term outlook developed by the Ministry of EconomicDevelopment, even in a high “gas discovery scenario”, the existing petrochemicalsplants will have to close in the future.
■ Seasonality
The ratio between gas sales in the peak and the lowest month of the year was1.2 to 1 in 2000.
■ Share of gas in the power generation sector: 24% (2000)
Table 41: Multi-fired electricity generating capacity in New Zealandat 31 December 2000 (GW)
Solid/Liquid 0
Solids/Gas 1
Liquids/Gas 0
Liquids/Solids/Gas 0
Total multi-fired 1
Total capacity* 2.81
* from combustible fuels.
36% of total electricity-generating capacity by fuel is multi-fired.
GAS SUPPLY
■ Reserves: 62 bcm R/P: 11 years
■ Gas supply structure: indigenous production 100%; imports zero
All New Zealand’s gas is produced in the Taranaki region, mainly from the Mauifield. The Maui field is owned by Energy Exploration NZ Ltd, Shell PetroleumMining and Todd Energy. The Kapuni field is owned by Shell PetroleumMining and Todd Energy. In 2000, the Maui and Kapuni fields produced91.1% of all the country’s gas production. The Maui field is depleting rapidly.
■ Supply swing
Gas production offers little swing (110% in 2000).
215
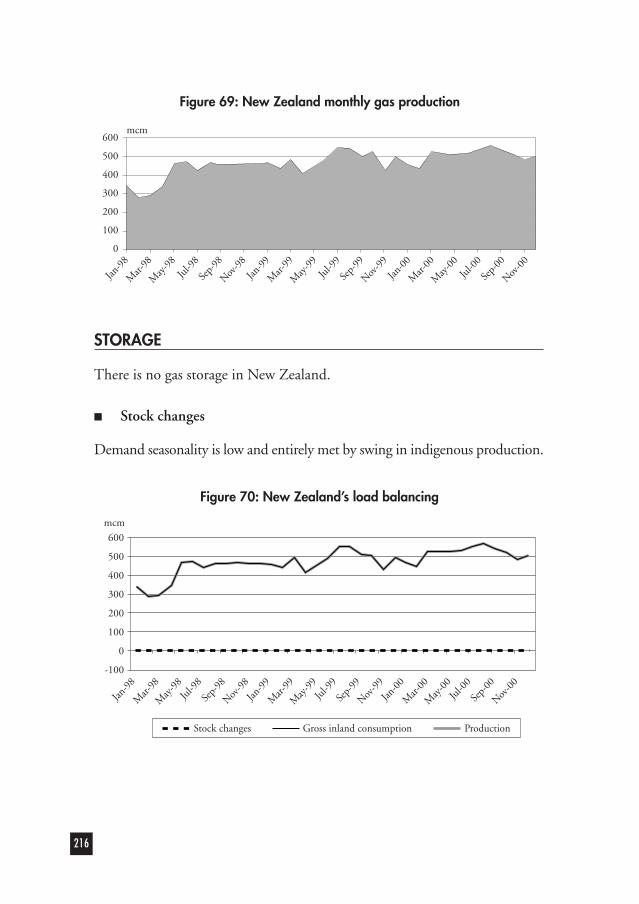
STORAGE
There is no gas storage in New Zealand.
■ Stock changes
Demand seasonality is low and entirely met by swing in indigenous production.
216
Mar-
98Ju
l-98
Nov-9
8
Mar-
99Ju
l-99
Nov-9
9
Mar-
00Ju
l-00
Nov-0
0
Jan-9
8
May
-98
Sep-
98
Jan-9
9
May
-99
Sep-
99
Jan-0
0
May
-00
Sep-
00
mcm600
500
400
300
200
100
0
Jan-9
8
Mar-
98
May
-98
Jul-9
8
Sep-
98
Nov-9
8
Jan-9
9
Mar-
99
May
-99
Jul-9
9
Sep-
00
Nov-0
0
Sep-
99
Nov-9
9
Jan-0
0
Mar-
00
May
-00
Jul-0
0
600
500
400
300
200
100
0
-100
mcm
Stock changes Gross inland consumption Production
Figure 69: New Zealand monthly gas production
Figure 70: New Zealand’s load balancing

REGULATORY FRAMEWORK
■ Security of supply
As the country is self-sufficient in gas, security of supply means mainly copingwith technical interruptions in gas supply. This is provided by the integratedcontrol system for high-pressure transmission lines, line-pack and interruptiblesupply to large customers (mainly electricity generators). An industry-agreedrationing programme is also available if necessary.
In the longer term, the depletion of the Maui field will create new challengesfor security of supply.
■ Access to the grid
A Gas Pipeline Access Code came into effect in early 1999. It is a voluntary,self-regulatory agreement between pipeline owners and users. It covers allpipelines except gas-gathering pipelines. The code provides for neutral, non-discriminatory access to available capacity. It is voluntary, has no sanctions, doesnot affect pricing and relies on information disclosure regulations.
217

NORWAY
GAS DEMAND
■ Share of gas in TPES: 14% (2000)
Norwegian gas consumption reached 4.2 bcm in 2000. Norway has not yetdeveloped its onshore gas market. Its current gas consumption consists mainlyof gas used for the compression and treatment of gas. Large amounts of gas(35 bcm in 2000) are reinjected in oil fields for secondary recovery.
Since the mid-1980s, several alternatives for gas-fired power generation inNorway have been commercially evaluated, but so far, none of these projectshave been realised. In 1994, Statkraft, Statoil and Norsk Hydro set up a jointcompany, Naturkraft. The objective of Naturkraft is to use natural gas fromthe Norwegian Continental Shelf for generation of electric power for theNordic market.
The Norwegian Government is preparing a white paper for the Parliament aboutonshore domestic use of natural gas. Opportunities exist for direct use ofnatural gas in industry, transport and for stationary energy purposes. Naturalgas will have positive effect on the environment if it is used to substitute other,more pollutive fossil fuels. Natural gas could also allow the substitution of gasfor electricity in some applications and, in some instances, gas transmission mighteffectively replace the need for expanding the electricity grid.
218
■ Norway is a major producer and exporter of natural gas.
■ Norway offers flexibility to its European customers under its long-term contracts.
■ The country has a little developed onshore gas market.
■ Large amounts of gas are reinjected in oil fields.
■ Regulatory reforms of the gas sector are taking place.

GAS SUPPLY
■ Reserves: 4,017 bcm R/P: 76 years
■ Gas supply structure: indigenous production 100%; imports zero
Marketed gas production reached 52.8 bcm in 2000.
■ Supply swing
Norway offers flexible supplies under its long-term contracts, as seen in the abovegraph. The swing factor was 124% in 1993 and reached 132% in 2000. Troll- which accounts for approximately half of Norwegian sales - and Sleipner offera great deal of flexibility.
All recent long-term supply contracts from small Norwegian fields to buyersin continental Europe have been so-called Troll Gas Sales Agreements thatensure a customer’s allotted supply is met using Troll gas when a smaller fieldis shut in.
The flexibility of Norwegian gas supply is well illustrated by the fact that 2001saw 791 field or pipeline shut-downs, and still the regularity of supply was99.8%.
■ Gas exports: Norway exported 48.5 bcm in 2000:
- Germany 38.2%
- France 24.7%
219
Mar-
98Ju
l-98
Nov-9
8
Mar-
99Ju
l-99
Nov-9
9
Mar-
00Ju
l-00
Nov-0
0
Jan-9
8
May
-98
Sep-
98
Jan-9
9
May
-99
Sep-
99
Jan-0
0
May
-00
Sep-
00
mcm7000
6000
5000
4000
3000
2000
1000
0
Figure 71: Norwegian monthly gas production

- Belgium 11.3%
- Netherlands 10.5%
- Spain 5.1%
- UK 4.5%
- Czech Republic 3.9%
- Austria 1.7%
- Poland 0.1%
STORAGE
Norway has no gas storage on its territory. But Norwegian gas sellers canaccommodate customers by drawing on storage capacity on the Continent. Thiscapacity is partly owned by Norwegian companies (like Etzel gas storage innorthern Germany) and partly rented (like GDF storage in France).
REGULATORY FRAMEWORK
■ Security of supply
The Norwegian integrated resource management policy is designed to ensureefficiency in production and transportation of natural gas. The NorwegianPetroleum Directorate is charged with overseeing the technical aspects ofsecurity of supply on the Norwegian Continental Shelf.
A comprehensive policy assessment of state ownership in the offshore oil andgas sectors took place in 2001. Statoil was partially privatised while the StateDirect Financial Interest was restructured. The Gas Negotiating Committee(GFU), which has co-ordinated the country’s exports since its creation in1993, terminated its activities as from 1 June 2001, and was formally abolishedon 1 January 2002. Gas producers on the Norwegian Shelf now individuallymarket their own gas. Changes in policy on oil and gas development and gasmarketing, are driven by the ongoing changes in the European gas markets andthe maturation of the Norwegian Continental Shelf.
Norway has developed an extensive transportation infrastructure, including sixmajor pipelines carrying gas from the Norwegian Continental Shelf to
220

Continental Europe and the United Kingdom. Major changes are taking placein the gas transportation system. The state owned company Gassco has takenover the operatorship of the gas transportation system from 1 January 2002.Gassco is a neutral operator for the integrated transportation system and isresponsible for operating the major gas transport pipelines in an efficient andsecure way.
The transmission system offers a great deal of flexibility, as was demonstratedin April 2000, when the Zeepipe gas trunkline from Norway to Zeebrugge inBelgium was shut down for two weeks following a gas leak upstream. Thepipeline carries about one fifth of all Norwegian gas exports. Customers forZeepipe gas were offered supplies from alternative landfalls in Germany andFrance.
■ Access to upstream pipelines
There is negotiated access to the Norwegian upstream gas transportationsystems, with the government having a reserve power under the Petroleum Actto determine prices in the event of a dispute about terms. All gas transportationagreements must be approved by the Government.
Tariffs in the upstream gas transportation pipelines are regulated by the Ministryof Petroleum and Energy under the existing law. Tariffs for the gas exportinfrastructure conveying gas to Europe are cost-based, with a 7% real rate ofreturn before tax as the guideline for determining tariff levels.
A process of unitisation of ownership in pipelines and a government evaluationof the access regime are taking place. The Ministry of Petroleum and Energyaims at issuing regulations for a new access regime for upstream pipelinesbefore end 2002.
221

PORTUGAL
GAS DEMAND
■ Share of gas in TPES: 8% (2000)
Portugal’s gas consumption reached 2.3 bcm in 2000, most of it for powergenerators and industrial customers.
According to forecasts by the Ministry of Economy, natural gas supply isexpected to increase at an annual rate of 19% per year until 2010 when it willreach 5.7 Mtoe, 22.7% of total energy supply. Gas use in power generation isexpected to be multiplied by more than ten between 1998 and 2010, reaching3.9 Mtoe (more than 68% of total gas supply) in 2010.
Up to 2010, gas consumption in industry and in the commercial and residentialsectors will be multiplied by approximately five to six. Industry will continueto be the second-largest gas-consuming sector with 1.2 Mtoe in 2010.Competition is expected to become sharper in these sectors once natural gashas replaced propane and butane in the distribution areas where natural gashas a competitive price advantage.
222
■ Portugal is an emerging gas market. It is still very small.
■ Gas is principally used in power plants and industry. Seasonal variationsof gas demand are limited.
■ Gas is imported from Algeria by pipeline under long-term contracts.
■ Flexibility in Algerian imports covers the seasonal fluctuations in gasdemand.
■ There are no storage facilities yet. An LNG terminal is underconstruction in Sines.
■ As an emergent market, Portugal applied for a derogation to the EUGas Directive until 2007.

■ Seasonality
The ratio between gas sales in the peak and the lowest month of the year was2 to 1 in 2000.
■ Share of gas in the power generation sector: 16% (2000)
Table 42: Multi-fired electricity generating capacity in Portugalat 31 December 2000 (GW)
Solid/Liquid 0.21
Solids/Gas -
Liquids/Gas 0.71
Liquids/Solids/Gas -
Total multi-fired 0.92
Total capacity* 6.27
* from combustible fuels.
15% of total electricity-generating capacity by fuel is multi-fired, with plantsrunning on natural gas playing a significant role.
GAS SUPPLY
■ Gas supply structure: indigenous production zero; imports 100%, ofwhich:
- Algeria 87%
- Nigeria 10%
- Malaysia 3%
223
Commerce - Public services
Residential
Power generation
Industry
Others57%
3%
33%
4%3%
Figure 72: Portuguese gas consumption by sector in 2000

Algerian gas is imported by pipe via Spain. LNG imports are received atSpanish terminals, pending the opening of the Sines regasification plant.
■ Supply swing
Others include Malaysian and Nigerian LNG received at Spanish plants.
STORAGE
Currently, there are no gas storage facilities in Portugal.
■ Stock changes
224
Mar-
98Ju
l-98
Nov-9
8
Mar-
99Ju
l-99
Nov-9
9
Mar-
00Ju
l-00
Nov-0
0
Jan-9
8
May
-98
Sep-
98
Jan-9
9
May
-99
Sep-
99
Jan-0
0
May
-00
Sep-
00
mcm300
250
200
150
100
50
0
Others 138%Algeria 129%
Swing in 2000
Jan-9
8
Mar-
98
May
-98
Jul-9
8
Sep-
98
Nov-9
8
Jan-9
9
Mar-
99
May
-99
Jul-9
9
Sep-
00
Nov-0
0
Sep-
99
Nov-9
9
Jan-0
0
Mar-
00
May
-00
Jul-0
0
300250200150100500
-50
mcm
Stock changes Gross inland consumption Total imports
Figure 73: Portuguese monthly gas supplies
Figure 74: Portuguese load balancing

As indicated in the graph, there is little seasonality in demand. What there isis met by flexibility in imports.
REGULATORY FRAMEWORK
■ Access to transportation and storage
Portugal is an emergent market and has applied for a derogation from the EUGas Directive, which Portugal will not implement until 2007.
225

SPAIN
GAS DEMAND
■ Share of gas in TPES: 12% (2000)
Spanish gas consumption reached 16.7 bcm in 2000.
226
■ Spain’s gas consumption reached 17 bcm in 2000. Sales to thetemperature-sensitive market are limited, amounting to 17% in 2000.
■ Seasonal fluctuations in gas demand are limited. The ratio between gassales in the peak and the lowest month of the year was about 2 to 1 in2000.
■ Some industrial customers, as well as power-generation plants, haveinterruptible contracts.
■ Flexibility in gas supply is limited. Indigenous production is negligible.Storage is limited. There are two underground storage sites with aworking capacity of 1.3 bcm, or 28 days of consumption. The targetis 35 days.
■ Regulated access to storage is offered by the transmission systemoperator, Enagas. In LNG contracts involving third-party access, aten-day storage service is included in the tariff. In transport TPAcontracts, a five-day storage service is included in the tariff.
■ New players are entering the gas market.
Commerce - Public services
Residential
Power generation
Industry
Others18%
2%
63%
13%4%
Figure 75: Spanish gas consumption by sector in 2000

Temperature-sensitive sales account for a small proportion of the market, 17%in 2000. This is partly due to Spain’s Mediterranean climate, but also becauseof the way in which the market has been developed, with an early emphasison large industry. The share of gas in power generation is increasing.
■ Seasonality
The ratio between gas sales in the peak and the lowest month of the year wasabout 2 to 1 in 2000.
■ Share of gas in the power-generation sector: 9% (2000)
Table 43: Multi-fired electricity generating capacity in Spainat 31 December 2000 (GW)
Solid/Liquid 0.30
Solids/Gas -
Liquids/Gas 3.12
Liquids/Solids/Gas -
Total multi-fired 3.42
Total capacity* 25.49
* from combustible fuels. Public utilities only (data from autoproducers are not available).
13% of total electricity-generating capacity by fuel is multi-fired, with plantsrunning on natural gas playing a major role. Most of the electricity producedin Spain comes from single-fired power plants run on hydropower, coal, oil andnuclear power.
■ Interruptible contracts and fuel switching
Interruptible contracts have been made with large consumers, who representapproximately 20% of all consumers, to increase gas supply flexibility. Thesecustomers are offered discount prices.
Much of the industrial market is served with interruptible contracts. Since gaswas brought to Spain only recently, oil-tanks and firing facilities which wereused before gas introduction, are in better condition than in many othercountries, and this makes such contracts easier to negotiate. Furthermore,given the lack of alternative flexibility tools interruptible sales provide therequired flexibility.
Combined-cycle gas turbine plants are generally supplied with firm gas.
227

GAS SUPPLY
■ Reserves: Spain has very little gas reserves (1 bcm at the beginning ofJanuary 2001)
■ Gas supply structure: indigenous production 1%; imports 99%, of which:
- Algeria 60.3% (LNG 24.4%, pipe 35.9%)
- Norway 13.4%
- Nigeria 10.9%
- Trinidad and Tobago 5%
- Libya 4.6%
- Qatar, United Arab Emirates, Belgium (spot): 1% each (approx).
■ LNG share in gas supply: 50.6%
■ Gas supply swing
Relatively little swing is provided by the suppliers. The economics of bothAlgerian LNG and long-distance Norwegian supplies dictate that they shoulddeliver gas with a high load factor.
228
Mar-
98Ju
l-98
Nov-9
8
Mar-
99Ju
l-99
Nov-9
9
Mar-
00Ju
l-00
Nov-0
0
Jan-9
8
May
-98
Sep-
98
Jan-9
9
May
-99
Sep-
99
Jan-0
0
May
-00
Sep-
00
mcm1600
1400
1200
1000
800
600
400
200
0
Others 164%
Algeria 115%
Norway 102%
Swing in 2000
Figure 76: Spanish monthly gas supplies
Others include imports from Belgium (spot - Interconnector), Trinidad and Tobago, Qatar, UAE, Libya and Nigeria.

STORAGE
Storage facilities are very limited. Spain has two underground storage facilities,with a working capacity of 1.3 bcm. They represent 28 days of averageconsumption in 2000. Other sites are actively being sought, with studieshaving taken place in the Tagus and Ebro River basins, the surroundings ofMadrid, Montilla (Cordova), Cantabria, Jumilla, the salt area in Alicante andin Reus (Tarragona).
■ LNG import terminals
Enagas owns the three existing LNG terminals: at Huelva, Cartagena andBarcelona. To cope with future domestic demand, three new LNG terminalshave been planned, at Bilbao, Valencia and El Ferrol.
229
65 Extra capacity operational since spring 2002.
Table 44: Underground gas storage in Spain
Operator/Working Peak
Name TypeNumber
capacity output(mcm) (mcm/day)
Serrablo Depleted gas field Enagas 495 4.0
Gaviota Depleted gas field Repsol 779 5.7
Total 2 1,274 9.7
Table 45: Spanish LNG import terminals
TerminalsStorage tanks Nominal capacity
Start-up date(1,000 cm of LNG) (mcm/day)
Barcelona (Catalogna)on the Mediterranean 240 29 1970coast
Cartagena (Murcia) onthe Mediterranean 55 + 10565 10.8 1989coast
Huelva (Andalusia) on the Atlantic coast 160 10.8 1988

■ Stock changes
Storage does not play an important role in balancing gas supply and demand.Most seasonal fluctuations in gas demand are covered by flexibility in gasimports.
REGULATORY FRAMEWORK
■ Security of supply
The Hydrocarbons Act of 1998 sets an indicative limit for maximum externalsupplies from any single country at 60%. The same limit is applied to thesupplies of each individual supplier, with the exception of gas supplied tofacilities with guaranteed reserves of alternative fuel.
Security of supply is enhanced through storage facilities and tanks at the LNGregasification terminals. The 1998 Hydrocarbons Act defines different operators’storage obligations:
■ Transporters who deliver gas to the system must maintain stocks equivalentto 35 days of their sales to distributors;
■ Traders must maintain stocks equivalent to 35 days of their sales;
■ Qualified consumers who buy from unauthorised traders must maintainstocks corresponding to 35 days of consumption.
230
Jan-9
8
Mar-
98
May
-98
Jul-9
8
Sep-
98
Nov-9
8
Jan-9
9
Mar-
99
May
-99
Jul-9
9
Sep-
00
Nov-0
0
Sep-
99
Nov-9
9
Jan-0
0
Mar-
00
May
-00
Jul-0
0
2000
1500
1000
500
0
-500
mcm
Stock changes Gross inland consumption Production Total imports
Figure 77: Spanish load balancing

A Royal Decree in 2000 created a new body, the Transmission System Operator.ENAGAS SA was named as system operator, and its capital opened up to newshareholders, with no individual company allowed to control more than 35%of its shares.
ENAGAS’ role as system operator is defined as:
■ controlling the short- and medium-term operation of the system, with theaim of guaranteeing continuity and security of supply;
■ applying daily balancing rules for system users;
■ proposing the development of transportation and storage capacity to theMinister of Economy;
■ proposing emergency plans on an annual basis, taking into considerationpossible disruption scenarios.
■ Access to transportation, storage and regasification terminals
Spain has opted for regulated third-party access based on published maximumtariffs. Twenty-eight companies have a gas-trading license in Spain. Not all ofthem have really started to operate. During 2001, the liberalised part of themarket already accounted for nearly 40% of total gas sales.
231

SWEDEN
GAS DEMAND
■ Share of gas in TPES: 1.4% (2000)Natural gas currently accounts for less than 2% of total Swedish energyconsumption, at 0.86 bcm. In the 26 municipalities that have access to naturalgas, it accounts for 20% of energy consumption, a level equivalent to that inthe rest of Europe.
Industrial plants, where gas serves both as raw material and as fuel for heating,make up 46% of the market. Power generation accounts for 30%; householdsfor 12%. The number of final customers is approximatley 55,000, most of themare single-family houses and apartment blocks.
■ SeasonalityThe ratio between gas sales in the peak and the lowest month of the year was 3.5 to 1in 2000.
■ Share of gas in the power generation sector: < 1% (2000)
GAS SUPPLY
■ Gas supply structure: indigenous production zero; imports 100%
All Sweden’s gas comes from the Tyra field in the Danish sector of the NorthSea. After transiting Denmark, a pipeline under Öresund brings the gas ashore
232
Residential
Power generation
Industry
Others
30%
46%
12%12%
■ Sweden has a small gas market of less than 1 bcm in 2000.
■ Gas is imported from Denmark. Gas demand seasonality is covered byflexibility in imports.
■ Sweden has no gas storage facility.
Figure 78: Swedish gas consumption by sector in 2000

in Sweden, at Klagshamn outside Malmö. A 300-km trunk main extends fromTrelleborg in the south to Gothenburg.
■ Supply swingDanish imports offered a swing of 161% in 2000.
STORAGE
There is no gas storage in Sweden due to unfavourable geological conditions.However, a lined-rock cavern demonstration storage site is under construction.
■ Stock changesThe graph below shows that seasonal variations in gas demand are covered byflexibility in import contracts.
REGULATORY FRAMEWORK■ Access to the gridAccess to the grid is regulated.
233
Mar-
98Ju
l-98
Nov-9
8
Mar-
99Ju
l-99
Nov-9
9
Mar-
00Ju
l-00
Nov-0
0
Jan-9
8
May
-98
Sep-
98
Jan-9
9
May
-99
Sep-
99
Jan-0
0
May
-00
Sep-
00
mcm150
100
50
0
Jan-9
8
Mar-
98
May
-98
Jul-9
8
Sep-
98
Nov-9
8
Jan-9
9
Mar-
99
May
-99
Jul-9
9
Sep-
00
Nov-0
0
Sep-
99
Nov-9
9
Jan-0
0
Mar-
00
May
-00
Jul-0
0
150
125
100
75
50
25
0
mcm
Gross inland consumption Total imports
Figure 80: Swedish load balancing
Figure 79: Swedish monthly gas imports

234
SWITZERLAND
GAS DEMAND
■ Share of gas in TPES: 9% (2000)
Swiss demand for gas has increased at a rate of more than 12% per year since1973, but the share of natural gas in total energy supply remains lower thanthe average of IEA European members.
Gas consumption reached 3 bcm in 2000. Almost 60% of natural gas isconsumed by the residential and commercial sectors. Demand seasonality istherefore high. Industrial consumption accounts for 31% of total sales.
■ Seasonality
The ratio between gas sales in the peak and the lowest month of the year was4 to 1 in 2000.
■ Switzerland has a small gas market which consumed 3 bcm in 2000.The temperature-sensitive market accounts for 60% of gas sales.Seasonal variations in gas demand are large.
■ Switzerland does not produce gas and has no gas storage facility.
■ The high seasonality of demand is covered by flexibility in importcontracts and leased storage capacity in France.
■ Interruptible contracts play an important role.
Commerce - Public services
Residential
Power generation
Total industry
Others7%
5%
31%
36%
21%
Figure 81: Swiss Gas Consumption by Sector in 2000

235
■ Share of gas in the power generation sector: 2% (2000)
Switzerland has no multi-fired power plants. Most of the electricity is generatedfrom hydro-power plants.
■ Interruptibles and fuel switching
Forty-five percent of total gas consumption is under an interruptible basis (1999).Thirty-two percent of gas demand for industrial customers and 100% for the powerand heat generation sector are on an interruptible basis. Deliveries to interruptiblecustomers can be interrupted when temperatures drop below minus 10˚C.
Switzerland stores heating oil as a backup for interruptible gas supply contracts.Light heating-oil stocks have been built up to cover approximately four-and-a-half months of natural gas consumption.
GAS SUPPLY
■ Gas supply structure: indigenous production zero; imports 100%, of which:
- France 11.5%
- Germany 56.5%
- Netherlands 19.1%
- Russia 11.2%
- Italy 1.7%Source: Swissgas.
■ Supply swing
As can be seen from the graph, suppliers offer a great deal of flexibility.
Jul-9
8
Jan-9
9Ju
l-99
Jan-0
0Ju
l-00
Jan-9
8
Apr-9
8
Oct-98
Apr-9
9
Oct-99
Apr-0
0
Oct-00
mcm500
400
300
200
100
0
Swing in 2000
Others 223%
Russia 198%
Netherlands 171%
Germany 163%
Figure 82: Swiss monthly gas imports
Others include imports from France and Italy.

STORAGE
Switzerland has no gas storage on its territory. Gaznat has an agreement withGaz de France that allows the Swiss company to withdraw a limited amountof gas from the French storage facility of Etrez, northwest of Geneva.
■ Stock changes
Seasonal demand is covered by flexibility in contracts and storage capacityrented in France. Interruptible contracts are concluded with large customers.
REGULATORY FRAMEWORK
■ Security of supply
Increasing interconnections with the rest of Europe have improved Switzerland’ssecurity of supply. Since the expansion of the Transitgas system, Switzerlandhas become an important transit country for gas from Northern Europe to Italy.
■ Access to the transmission network
As a non-EU member, Switzerland has no legal obligation to adopt the EU GasDirective. However, because of its comprehensive integration into the Europeannatural-gas grid system and the liberalisation processes under way in othersectors, the Swiss gas market is going to be opened up. New arrangements willtake into account both European trends and Swiss requirements. TPA to thehigh-pressure grid has been provided by legislation since many years.
236
Jan-9
8
Apr-9
8Ju
l-98
Oct-98
Jan-9
9
Apr-9
9Ju
l-99
Oct-00
Oct-99
Jan-0
0
Apr-0
0Ju
l-00
500
400
300
200
100
0
mcm
Gross inland consumption Total imports
Figure 83: Swiss load balancing

237
TURKEY
GAS DEMAND
■ Share of gas in TPES: 16% (2000)
■ Gas demand structure
Turkish gas consumption reached 14.8 bcm in 2000. With 9.3 bcm in 2000,power generation accounted for 64% of total gas demand, followed by theresidential sector with 3.2 bcm, and industry with 2.1 bcm. In most consumingsectors, gas has replaced oil and coal. The government has encouraged the useof natural gas to replace lignite in the residential sector to reduce urbanpollution.
Gas demand is expected to triple between 2000 and 2010.
■ Gas consumption reached 14.8 bcm in 2000. Turkey has very rapidgrowth in gas demand.
■ Natural gas is mainly used by the power and residential sectors (83%).
■ Demand seasonality is relatively high and is entirely met by importflexibility.
■ Turkey does not yet have any underground gas storage facility on itsterritory, but it does have an LNG receiving terminal.
Commerce - Public services
Residential
Power generation
Industry
Others
1%16%
64%
19%
0%
Figure 84: Turkish gas consumption by sector in 2000

238
■ Seasonality
The ratio between gas sales in the peak and low month of the year was 1.5 to1 in 2000. Seasonality of gas demand by sector is indicated in the graph below:
The seasonality of gas demand by residential consumers is very large. Sales inthis sector are concentrated in the winter months (73% of annual sales betweenDecember and March).
■ Share of gas in the power generation sector: 36% (2000)
Table 46: Multi-fired electricity generating capacity in Turkeyat 31 December 2000 (GW)
Solid/Liquid 0.41
Solids/Gas 0
Liquids/Gas 2.14
Liquids/Solids/Gas 0
Total multi-fired 2.55
Total capacity* 16.06
* from combustible fuels.
Only 16% of total electricity generating capacity by fuel is multi-fired, withplants running on natural gas playing a major role. Most electricity produced
Jul-9
8
Jan-9
9Ju
l-99
Jan-0
0Ju
l-00
Jan-9
8
Apr-9
8
Oct-98
Apr-9
9
Oct-99
Apr-0
0
Oct-00
mcm1600
1400
1200
1000
800
600
400
200
0
Residential
Power generation
Fertilizer
Industry
Figure 85: Turkish monthly gas consumption by sector
Source: Ministry of Energy and Natural Resources of Turkey.

in Turkey comes from single-fired power plants run on hydropower and coal.This situation, however, is rapidly changing with an expected tripling of gasconsumption in electricity plants by 2010.
■ Interruptibles and fuel switching
BOTAS has used interruptible customers as a tool to reduce demand at timesof peak gas use. The increase in natural gas consumption in cities duringwinter leads to an interruption of gas supply to interruptible customers for peakshaving purposes. Interruption in gas supply is effected with an eight hours priornotice. The notice period can be shorter in special circumstances. Theinterruptions are usually made between December and March and can last forseveral days or weeks. The price for interruptible customers is on average 12%less than the price for non-interruptible customers.
GAS SUPPLY
■ Reserves: 9 bcm R/P: 14 years
■ Gas supply stucture: indigenous production 4%; imports 96%, of which:
- Russia 65%
- Algeria 26%
- Nigeria 5%
Supplies from Algeria and Nigeria are imported in the form of LNG. Turkeyhas begun to top up its long-term contracts with spot deliveries.
In order to secure gas supplies, BOTAS signed eight natural gas purchaseagreements with six different countries for 67.8 bcm per year of natural gas orLNG imports. These break down into 4 bcm per year of LNG from Algeria,1.2 bcm of LNG from Nigeria, 14 bcm of natural gas from Russia via theWest, 16 bcm of natural gas from Russia through the Black Sea, 10 bcm ofnatural gas from Iran, 16 bcm of natural gas from Turkmenistan and 6.6 bcmof natural gas from Azerbaijan.
■ LNG share in supply: 31%
239

240
■ Supply swing
Figure 86: Turkish monthly gas supply
Source: Ministry of Energy and Natural Resources of Turkey.
The graph indicates the increasing amount of gas imported from Russia,Algeria and Nigeria. Little flexibility is offered by suppliers.
STORAGE
Turkey has not yet built any underground gas storage. However, studies areproceeding on the possibility of storing gas in underground storage facilities.
Within the framework of this project, the Salt Lake Natural Gas UndergroundStorage Project will use the salt domes in Salt Lake. Engineering and consultancystudies are under way for the project. A call for construction tenders will belaunched in late 2002. Environmental impact assessment studies of the projectare also being carried out.
The Tarsus Natural Gas Underground Storage Project will use the sodiumcarbonate beds of Sisecam Soda San. A.S., in Mersin, as underground storagefacilities. Pre-feasibility studies are being carried out.
Studies are also underway on using TPAO’s Northern Marmara andDegirmenköy gas fields as underground gas storage facilities following theirdepletion. Total storage capacity of these two facilities will be 1.6 bcm, and theyare to become operational in 2005.
Mar-
98Ju
l-98
Nov-9
8
Mar-
99Ju
l-99
Nov-9
9
Mar-
00Ju
l-00
Nov-0
0
Jan-9
8
May
-98
Sep-
98
Jan-9
9
May
-99
Sep-
99
Jan-0
0
May
-00
Sep-
00
mcm1800
1600
1400
1200
1000
800
600
400
200
0
Production 121%Russia 126%Spot LNGNigeria 127%Algeria 140%
Swing in 2000

241
■ LNG import terminals
■ Stock changes
Demand seasonality, 120% in 2000, can be met with flexibility in imports.
REGULATORY FRAMEWORK
■ Security of supply
In its monopoly role, BOTAS has been responsible for securing theuninterrupted delivery of natural gas to its customers. To maintain bothstrategic and technical security, BOTAS has diversified its gas supply sourcesby country, its importing pipeline routes and the way gas is imported into thecountry (by pipeline and LNG). BOTAS is now building storage facilities.
Jan-9
8
Mar-
98
May
-98
Jul-9
8
Sep-
98
Nov-9
8
Jan-9
9
Mar-
99
May
-99
Jul-9
9
Sep-
00
Nov-0
0
Sep-
99
Nov-9
9
Jan-0
0
Mar-
00
May
-00
Jul-0
0
1800
1600
1400
1200
1000
800
600
400
200
0
mcm
Stock changes Gross inland consumption Production Total imports
Figure 87: Turkish load balancing
Table 47: Turkish LNG import terminals
TerminalsStorage tanks Nominal capacity
Start-up date(1,000 cm of LNG) (mcm/day)
Marmara Erelisi 255 13 1994

242
BOTAS applies international standards for gas-system construction andoperation. Under the new Natural Gas Market Law of May 2001, transmissionand storage companies have an obligation to prove to the Natural Gas MarketRegulatory Agency that their services are economic and safe.
The new law obliges gas importers and wholesalers to cover 10% of theirimported gas with gas storage. The companies have five years to comply.
■ Access to the transmission grid
Since the adoption of the Natural Gas Market Law on 2 May 2001, theregulation of Turkey’s gas industry has been changing. The new law foreseesthe controlled opening of the gas industry to competition, with the aim,among others, of harmonising Turkish legislation with EU law. The Act allowsa twelve-month transition period. The Council of Ministers can extend thetransition by six months, but only once.
Restructuring of the gas market is also intended.
■ Natural gas supply, transmission and distribution are to be unbundled.BOTAS is to be split into two units, one responsible for trading, whichis to be privatized later, the other for transmission, which is to be kept asa State Economic Enterprise. The two distributors owned by BOTAS, inBursa and Eskisehir, are to be corporatised and then privatised.
■ BOTAS will continue to own and operate the national transmissionnetwork, as well as LNG and storage facilities. It will offer services undera system of non-discriminatory, regulated and published prices and accessconditions. These prices and access conditions are to be regulated by a newregulatory agency.
Network tariffs are based mainly on distance and volume. Storage tariffs arefreely negotiated between storage companies and users.

243
UNITED KINGDOM
GAS DEMAND
■ Share of gas in TPES: 38% (2000)
Gas demand has grown rapidly over the last ten years to 102 bcm in 2000. Thepower sector accounted for 29% of gas demand in 2000, an increase of 10percentage points over 1996. This share is expected to continue to rise withthe removal of the gas moratorium which prevented the building of new gas-fired power plants. The temperature-sensitive sectors represent 42% of gassales.
■ The British gas market has grown strongly in the past decade. Gasconsumption now amounts to more than 100 bcm.
■ The temperature-sensitive sectors (residential/commercial) represent42% of gas sales. But the ratio between gas sales in the peak and thelowest month of the year is only about two to one. This is due to thehigh share of gas in the power sector, mainly used for base load.
■ Interruptible contracts play an important role in balancing supply anddemand.
■ In the past, the very high production swing offered by North Seaproducers limited storage needs. This is changing, with increasingly highload factors from North Sea producers.
■ Since October 1998, the Interconnector has played a role in rebalancingUK gas supply and demand.
■ UK has nine storage sites (of which five are LNG peak shavers). Peaksendout is 138 mcm/day and the working capacity is 3.6 bcm, or 4%of annual gas consumption.
■ Access to storage is deregulated, but subject to some conditions. In July2001, US Dynegy bought BG Storage.
■ New independent storage projects are now operational and there arealso “virtual storage” services, as well as a secondary market for storage.

244
Figure 88: UK gas consumption by sector in 2000
(1) The energy sector accounts for 70% of the “others” category.
UK gas consumption hit a new one-day record on 3 January 2002, whendemand reached 435 mcm, beating the previous record of 427 mcm.
■ Seasonality
The ratio between gas sales in the peak and the lowest month of the year was2 to 1 in 2000.
Figure 89: UK quarterly gas demand by sector
Source: DTI.
DTI gives only quarterly breakdowns of gas consumption by sector. The graphnevertheless shows the seasonal variations in demand in the residential sector.
Commerce - Public services
Residential
Power generation
Industry
Others (1)
9%20%
29%
33%
9%
Q2 2
001
Q4 2
001
Q1 2
001
Q3 2
001
Q2 1
998
Q4 1
998
Q2 1
999
Q4 1
999
Q2 2
000
Q4 2
000
Q1 1
998
Q3 1
998
Q1 1
999
Q3 1
999
Q1 2
000
Q3 2
000
Gwh400000
350000
300000
250000
200000
150000
100000
50000
0
Others Residential Commercial Industry Electricity generation

245
In this sector, sales during the first quarter of 2001 were 4.5 times higher thatsales in the third quarter.
■ Share of gas in the power generation sector: 39% (2000)
Table 48: Multi-fired electricity generating capacity in the United Kingdomat 31 December 2000 (GW)
Solid/Liquid 7.49
Solids/Gas 0
Liquids/Gas 0.76
Liquids/Solids/Gas 0
Total multi-fired 8.25
Total capacity* 61.96
* from combustible fuels.
Only 13% of total electricity-generating capacity by fuel is multi-fired, with plantsrunning on natural gas having a marginal role; most of electricity produced inUK comes from nuclear plants and single-fuel fired coal and gas plants.
Combined-cycle gas turbine generation has grown very quickly in the UnitedKingdom. The share of gas in the power-generation sector was negligible10 years ago. It is now 39%.
Most of CCGT generation tends to run as base load. This is because gas hasbeen relatively cheap and the arbitrage opportunities between gas and powerhave gone only one way - favouring the burning of gas to generate electricity.Now, with the cost of gas rising and that of electricity decreasing, the arbitrageopportunities are no longer necessarily one way. When electricity prices are low,a generator with committed gas may do better by selling the gas on the spotmarket rather than generating electricity with it. If this happens frequently, someCCGT generation may cease to be used for base-load and be used only whenelectricity prices are high, at peak load. This would tie spot gas and electricityprices more closely together. It would also have implications for flows of gasacross the Interconnector, which could switch to being a swing provider inresponse to variation in UK spot-gas prices.
In 2001, gas use for electricity generation was 2% lower than in 2000, althoughtwo new gas-fired power stations started to generate during 2001 and 4 othersmade their first full year contributions. High gas prices led to some stationsgenerating for fewer hours than they would have liked.

246
■ Interruptible contracts and fuel switching
Sales of gas on an interruptible basis accounted for about 24% of total UK gassales in 1998 and 1999, rising to around 26% in 2000, but fell to 23% in 2001largely because of the high gas prices. In 2000, interruptible sales to theelectricity generation sector are estimated to have accounted for 69% of totalsales to that sector (61% in 2001).
The prevalence of interruptible sales to the power sector seems at first glanceinconsistent with the reduced capacity of gas-fired power plants able to switchto other fuels. However, power producers are able to cut off their electricitygeneration from gas thanks to the existing over-capacity in the overall electricitygeneration system.
GAS SUPPLY
■ Reserves: 760 bcm R/P: 7 years
■ Gas supply structure: indigenous production 98%; imports 2%, of which:
- Norway 1%
- Interconnector 1%
UK is a net exporter of gas through the interconnectors to Continental Europeand Ireland. In 2000, UK exported 13.38 bcm.
■ Gas production
Production was 115.3 bcm in 2000. Market liberalisation has given producersa strong incentive to explore for, appraise and develop new fields on a “just-in-time” basis and to accelerate production from fields as they are brought onstream.
As in the Netherlands, a key feature of the UK gas production was the highswing offered by offshore producers, which averaged 160% up to 1995.However, as the cost of developing incremental sources of production hasincreased, the swing has declined. It was 124% only in 2000.
Although the production swing in general has decreased, some fields still dooffer high swing. This is the case of the Morecambe field, owned by Centrica.The field offers a great deal of flexibility (swing production of 167% in 2001),and it helps Centrica to meet seasonal variations in its customers’ gas demand.

The further development potential of the UK Continental Shelf lies mainlyin small fields located near existing infrastructure in the southern and centralNorth Sea. This means less flexibility.
Trends over the past five years indicate a levelling off of total UK gas reservesand increased production. It is estimated that UK indigenous supplies willtighten by 2005 and that the UK will have to import gas regularly by 2005.It will need seasonal top-up deliveries even earlier.
■ Imports flexibility
Britain’s gas market ceased to be isolated from mainland Europe in October1998, when the UK-Belgium Interconnector entered service. TheInterconnector66, a 230-km pipeline linking Bacton to Zeebrugge, can importgas to the UK as well as export it, although importing capacity is currently only40% of export capacity, which is 20 bcm/year. Since it started operation inOctober 1998, the Interconnector has had a major impact on both imports fromand exports into the UK. Approximately 10 bcm per year have been sold toContinental Europe under long-term (10-15 years) contracts. Depending onprice differentials, extra volumes may be sold to or bought from the Continent.If gas is sold to the UK the volumes would first net with the volumes underthe long-term contracts and eventually lead to a net flow into UK. Thishappened several times in 2000 and 2001, as prices were higher on the NBP
247
66 Source : UK Trade in Natural Gas, Energy Trends, DTI, Fevruary 2001.
Mar-
98Ju
l-98
Nov-9
8
Mar-
99Ju
l-99
Nov-9
9
Mar-
00Ju
l-00
Nov-0
0
Jan-9
8
May
-98
Sep-
98
Jan-9
9
May
-99
Sep-
99
Jan-0
0
May
-00
Sep-
00
mcm
14000
12000
10000
8000
6000
4000
2000
0
Figure 90: UK monthly gas production

248
than in Zeebrugge. The Interconnector thus plays an important role forbalancing UK supply and demand. Since the facility opened, except for 1999,the UK has been a net importer of seasonal gas every winter. The amountimported is determined by a combination of temperatures, production andstorage availability in the UK and the cost of European gas.
In 2000, large volumes of gas were sold for export to Europe to take advantageof higher European gas prices. Higher oil prices prompted Continental buyers tomaximise their sourcing of cheaper UK supply. Gas exports from Britain throughthe Interconnector were often close to their 1.93 bcfd forward-flow capacity.
In 2001, gas imports were 17% higher than in 2000 and gas exports 5.5% lower.This was primarily due to a high level of imports from Belgium during the earlymonths of 2001 and also high levels of imports in the fourth quarter of 2001,as suppliers took advantage of cheaper gas from the Continent rather thanindigenous UK production. First production from the Norwegian Vesterledpipeline system in October 2001 also raised the amount of gas imported.
STORAGE
In the past, the very high production swing offered by North Sea producerslimited UK storage needs, and these were adequately covered by five LNG peak-shaving units. The situation has changed, with higher load factors from NorthSea producers. Now the UK has nine storage sites (including the five LNG units).Peak sendout is 138 million cm/day and the working capacity is 3.6 bcm (4%of annual consumption). Two independent storage, at Hatfield Moors andHolehouse Farm, are now operational and other sites are planned at HumblyGrove, Warmington and Aldbrough.
Mar-
98Ju
l-98
Nov-9
8
Mar-
99Ju
l-99
Nov-9
9
Mar-
00Ju
l-00
Nov-0
0
Jan-9
8
May
-98
Sep-
98
Jan-9
9
May
-99
Sep-
99
Jan-0
0
May
-00
Sep-
00
mcm
600500400300200100
0
Others 393%Norway 121%
Swing in 2000
Figure 91: UK monthly gas imports

■ LNG import terminal
The LNG receiving terminal (Canvey Island) is nowadays closed. There are plansto build new regasification terminals at Milford Haven and on the Isle ofGrain.
■ Stock changes
249
Jan-9
8
Mar-
98
May
-98
Jul-9
8
Sep-
98
Nov-9
8
Jan-9
9
Mar-
99
May
-99
Jul-9
9
Sep-
00
Nov-0
0
Sep-
99
Nov-9
9
Jan-0
0
Mar-
00
May
-00
Jul-0
0
14000
12000
10000
8000
6000
4000
2000
0
-2000
mcm
Stock changes Gross inland consumption Production Total imports
Figure 92: UK load balancing
Table 49: Underground gas storage in the United Kingdom
Operator/Working Peak
Name TypeNumber
capacity output(mcm) (mcm/day)
Hornsea Salt cavity Dynegy* 325 18.2
5 LNG Peak Shaving Peak shaving Transco 374 75
RoughSemi depleted
gas fieldDynegy* 2,800 42
Hatfield Moors Salt cavity Scottish Power 116 1.7
Holehouse Farm Salt cavity Aquila 12 1.5
Total 5 3,627 138.4
* Until 2001, most storage sites were owned by BG Storage, a division of BG Group. In July 2001, US Dynegybought BG Storage for £421 million ($590 million). The sale included the Rough offshore facility in the southernNorth Sea, the Easington gas processing terminal and nine salt cavities in Hornsea, east Yorkshire. The deal wasapproved by regulatory offices in November 2001.

250
As can be seen from the graph, storage plays a relatively minor role in balancingsupply and demand. Most of fluctuations in gas demand are covered byproduction swing.
REGULATORY FRAMEWORK
■ Security of supply
Key obligations on network operators, shippers and suppliers are set out in theiroperating license conditions67.
■ Suppliers are required to ensure that they can fulfil their peak demand fromresidential consumers for gas on the coldest day expected in a period of20 years and aggregate daily demand over the coldest winter or yearexpected in a period of 50 years.
■ Shippers are required to book sufficient capacity in the gas pipeline systemto meet the peak aggregate demand of its customers for gas on the coldestday expected in a period of 20 years.
■ Transmission system operators’ primary obligation is to install sufficientdelivery capacity to meet all non-interruptible capacity demand on thecoldest day expected in a period of 20 years. They have to report annuallyto the regulator Ofgem on their performance in terms of availability,security and quality of supply and have statutory duties to develop andmaintain the system. They also have an obligation to provide incentivesto suppliers to ensure that the supply security standards for residentialcustomers are met. These obligations are the responsibility of Transco asthe national transmission system operator.
In addition, Ofgem can set certain standards of performance for gastransportation, supply and metering. There are penalties for the breach oflicence conditions and of the standards set by the regulator.
The Energy Act 1976 gives statutory powers to the government to deal withemergencies in which supplies of oil, electricity and gas are disrupted. In thecase of gas, Transco would act as the national emergency co-ordinator. If asupply disruption were unavoidable, supply to households and other prioritygas consumers, such as hospitals would be given priority, but these rules have
67 DTI Standard License Conditions, September 2001 : http ://www.dti.gov.uk/energy/gas-electricity.htm

251
not been invoked since liberalisation and third-party competition wereintroduced.
■ Access to transmission network and storage
Access is regulated on the basis of published tariffs. The network is 100%open. Transco is the owner of the majority of Britain’s gas transportationsystem. It receives gas from several coastal reception terminals around GreatBritain, and transports it to more than 20 million industrial, commercial anddomestic customers. Its network is made up of around 275,000 km of pipeline,consisting of high-pressure national and regional transmission systems, andlower-pressure distribution systems. The interconnector to Belgium linksTransco’s gas transportation system to Continental Europe’s high-pressure gasgrid. A second interconnector supplies gas to Ireland and Northern Ireland.
Transportation is provided according to the terms of a standard contractapplicable equally to all prospective users, and known as the Network Code.The transporter is obliged to meet all reasonable requests for service as part ofits common-carriage obligations. A refusal to do so is appealable to the regulator.
Dynegy provides storage on a non-discriminatory basis to any shipper. Storagecapacity is auctioned subject to reserve prices.
Transco owns, operates and develops all LNG peak-shaving facilities in GreatBritain.

252
UNITED STATES
GAS DEMAND
■ Share of gas in TPES: 24% (2000)
The United States have the biggest gas market in the world, with 638.6 bcmconsumed in 2000.
Figure 93: US gas consumption by sector 2000
■ The United States have the biggest gas market in the world. Theresidential and commercial sectors represent 36% of gas consumption.
■ The seasonality of gas demand is large in the residential sector. Salesduring December 2000 were 7.4 times higher than in August.
■ The US is 84% self-sufficient in gas.
■ Gas storage is highly developed. Total working capacity amounts to110 bcm, or 17% of total gas consumption. Storage is used to meetseasonal and peak fluctuations in gas demand.
■ LNG import terminals and LNG peak shaving-units help smoothpeak daily gas demand.
■ Roughly 10 to 15% of all natural gas deliveries to US consumers byinterstate pipelines in 1997 were on an interruptible basis, downsubstantially from roughly half of all deliveries in the late 1980s.
■ The US has a complex and extensive pipeline infrastructure. Utilisationof pipelines in parts of the west have recently been well above 95% ona continuing basis.
Commerce - Public services
Residential
Power generation
Industry
Others
12%
22%
30%
22%
14%

253
The power generation sector (including CHP) was the largest user of naturalgas in 2000. Natural gas is the largest energy source in the residential sectorand the fastest-growing energy source for electricity generation.
■ Seasonality
The ratio between gas sales in the peak and the lowest month of the year wasapproximately 1.8 to 1 in 2000. The seasonality of gas demand is importantin the residential sector. Deliveries in December 2000, the peak month of theyear, were 7.4 times higher than in August, the lowest month.
Figure 94: US gas demand seasonality
(1) Includes CHP.Source: Energy Information Administration.
■ Share of gas in the power generation sector: 16% (2000)
The natural-gas share of US electricity generation, including cogeneration, rosefrom 13.2% in 1996 to about 16% in 2000 (EIA). When cogeneration isexcluded, the share was 13% in 2000.
Natural gas for electricity generation is mainly used during peak demandperiods in summer times, and it is the preferred energy source for new generatingcapacity. About 90% of planned additions to electricity-generation capacity overthe next few years are designed to use natural gas as a primary fuel source.
mcm
80000
70000
60000
50000
40000
30000
20000
10000
0
ResidentialCommercialElectric utilitiesIndustrial (1)
Jul-9
8
Jan-9
9Ju
l-99
Jan-0
0Ju
l-00
Jan-0
1
Apr-0
1
Jan-9
8
Apr-9
8
Oct-98
Apr-9
9
Oct-99
Apr-0
0
Oct-00

Table 50: Multi-fired electricity-generating capacity in the United Statesat 31 December 2000 (GW)
Solid/Liquid 6.29
Solids/Gas 38.65
Liquids/Gas 56.56
Liquids/Solids/Gas 164.99
Total multi-fired 266.49
Total capacity* 629.97
* from combustible fuels.
42% of total electricity-generating capacity by fuel is multi-fired, with plantsrunning on natural gas having a large role. Dual gas and heavy fuel oil capacityin the US stands at about 60 GW.
■ Interruptibles and fuel switching
Roughly 10 to 15% of all natural gas delivered to US consumers by interstatepipelines in 1997 were on an interruptible basis, down substantially fromroughly half in the late 1980s.
Interruptible service contracts with pipeline operators or local distributioncomapnies vary in terms and conditions. Generally, they allow for serviceinterruptions as a result of temperature-threshold triggers or system operatingconditions (for example, when line pressure is threatened by very high drawson the system). In addition, some contracts provide firm service only for a limitedduration, usually a month, or on a seasonal basis, with suspensions of servicepermitted during the winter. Suspension of service is not considered aninterruption so long as the terms of the contract are fully met.
In 1998 (the latest year with available data), total sales on an interruptible basisamounted to 140 bcm (25% of total gas sales). Of total sales to the industrialsector, 38% were on interruptible basis (93 bcm), as were 36% of sales toelectric utilities (33 bcm) and 15% of sales to commercial consumers (13 bcm).
GAS SUPPLY
■ Reserves: 5,024 bcm R/P: 9 years
254

Total imports include imports from Mexico, Trinidad, Oman, Qatar, UAE, Algeria and Nigeria.
■ Gas supply structure: indigenous production 84%; imports 16%, ofwhich:
- Canada 15%
- Mexico, Trinidad, Oman, Qatar, UAE, Algeria, Nigeria 1%
■ LNG share in gas supply: 1%
■ Gas production
US production amounted to 540 bcm in 2000. Production remains roughlyconstant year round, swing production was 107% in 2000. Production isconcentrated in the southern and central US States.
Figure 95: US monthly gas production
■ Gas imports
US is largely self-sufficient in gas, with 84% coming from domestic production,although imports in the form of LNG picked up in 2000 and 2001 due to high
Mar-
98Ju
l-98
Nov-9
8
Mar-
99Ju
l-99
Nov-9
9
Mar-
00Ju
l-00
Nov-0
0
Jan-9
8
May
-98
Sep-
98
Jan-9
9
May
-99
Sep-
99
Jan-0
0
May
-00
Sep-
00
mcm
50000
45000
40000
35000
30000
255
Mar-
98Ju
l-98
Nov-9
8
Mar-
99Ju
l-99
Nov-9
9
Mar-
00Ju
l-00
Nov-0
0
Jan-9
8
May
-98
Sep-
98
Jan-9
9
May
-99
Sep-
99
Jan-0
0
May
-00
Sep-
00
mcm11000
10000
9000
8000
7000
6000
Swing in 2000
Canada 122%
Total imports119%
Figure 96: US monthly gas imports

gas prices. In 2000, total gas imports amounted to 108 bcm, of which 94%came from Canada. In line with an increase of total imports, the graph belowshows the increasing load supply.
■ Transportation
The US has a complex and extensive pipeline infrastructure for transportinggas from production areas to ultimate consumers. More than 165 companiesoperate about 278,000 miles of interstate and intrastate transmission lines,hundreds of compressor stations and numerous storage facilities, allowing gasdelivery throughout the lower 48 States. In addition, more than 1,300 localdistribution companies provide local delivery services through another700,000 + miles of pipeline infrastructure. In 2000, these lines transported anestimated 22.8 tcf (645 bcm) of natural gas from supply sources to end-usemarkets.
Since 1990, the gas pipeline network has grown substantially, with a 27%increase in interregional capacity. The network has also become moreinterconnected, its routing more complex, and business operations moreefficient. Except during periods of extreme weather conditions or disruptionscaused by isolated pipeline outages, there has been no sustained disruption ofthe network since the mid-1970s.
Nonetheless, increasing growth in natural gas demand over the past several yearshas led to an increase in the utilisation of pipelines and has resulted in somepressure for expansion in several areas of the country. Pipeline utilisation in partsof the west, notably pipelines delivering gas to the California market, hasrecently been well above 95% on a continued basis. Further increases indemand could cause capacity bottlenecks to develop.
Over the past two years, 63 natural gas-pipeline construction projects (35 in1999 and 28 in 2000) have been completed and placed in service in the UnitedStates, adding more than 12.3 bcfd of new pipeline capacity, an increase of 15%over 1998.
A major growth area in pipeline expansion during the past several years has beenthe export/import market for natural gas. Much pipeline construction hasbeen to expand import capacity for Canadian gas into the U.S Midwest andNortheast. Natural gas export capacity to Mexico has more than doubled since1996 to 2.1 bcfd.
There are 88 pipeline projects announced for the next several years totallingan additional 20.8 bcfd of capacity.
256

257
STORAGE
Gas storage is highly developed in the United States. Total working capacityamounted to 110 bcm in 2000 (or 17% of total gas consumption). On 1November 2000, working gas-storage volumes - at 2,699 bcf or 76.4 bcm - werethe lowest for the start of a heating season since 1976 and 6 bcm below the five-year average. The situation reversed itself completely in 2001 and working gasin storage is now well above the five-year average.
Table 51: Underground gas storage in the United States (2000)*
Working PeakRegion Type Number capacity output
(mcm) (mcm/day)
East Aquifer 33 9,939 211.2
Depleted gas/oil field 243 47,855 903.0
Salt cavern 4 113 8.4
Total East 280 57,907 1,122.6
West Aquifer 6 1,104 33.3
Depleted gas/oil field 31 16,707 244.1
Salt cavern 0 0 0
Total West 37 17,811 277.4
Producing regions Aquifer 1 28 0.3
Depleted gas/oil field 74 30,837 486.1
Salt cavern 23 3,823 314.8
Total producing regions 98 34,688 801.2
Total US Aquifer 40 11,072 244.8
Depleted gas/oil field 348 95,399 1,633.1
Salt cavern 27 3,936 323.3
Total 415 110,406 2,201.2
* Does not include LNG peak-shaving facilities (99 sites, 2.6 bcm of capacity and 329.4 mcm/day of deliverability).Source: Energy Information Administration.
■ LNG import terminals
LNG imports rose to 6.6 bcm, or 1% of the total gas supply, in 2000. The twoexisting LNG receiving terminals, at Lake Charles and Everest, are increasing

258
their throughput. The other two at Cove Point and Elba Island, which havebeen mothballed for many years are being brought back into operation, andeven planned to be enlarged.
Table 52: US LNG import terminals
TerminalsStorage tanks Sendout capacity
Start-up date(1,000 cm of LNG) (mcm/day)
Everett 99.109 12.7 1971
Lake Charles 178.396 19.8 1982
Cove Point (mothballed) 141.584 28.3 1978
Elba Island (mothballed) 116.099 12.5 1978
Total 441 78.3
Source: Energy Information Administration.
■ Stock changes
Figure 97: US load balancing
This graph demonstrates the key role of underground storage in balancing gassupply and demand, with storage facilities being filled in summer monthsand drawn down in the winter.
Jan-9
8
Mar-
98
May
-98
Jul-9
8
Sep-
98
Nov-9
8
Jan-9
9
Mar-
99
May
-99
Jul-9
9
Sep-
00
Nov-0
0
Sep-
99
Nov-9
9
Jan-0
0
Mar-
00
May
-00
Jul-0
0
80000
60000
40000
20000
0
-20000
-40000
mcm
Stock changes Gross inland consumption Production Total imports

REGULATORY FRAMEWORK
■ Security of supply
According to the new National Energy Policy published in May 2001moderating the recurrence and severity of “boom and bust” cycles whilemeeting increasing demand at reasonable prices is one of the major challengesfacing the US natural gas industry today. At the core of the policy are proposalsto ensure adequate domestic energy supply and infrastructure.
The National Energy Policy includes a set of recommendations to enhance oiland gas exploration and production and investments in gas pipelines by:
■ promoting enhanced oil and gas recovery from existing wells throughnew technology;
■ improving oil and gas exploration technology through continuedpartnership with public and private entities;
■ reviewing land status and impediments to federal oil and gas leasing;
■ expediting the ongoing study of impediments to federal oil and gasexploration and development;
■ reviewing public lands withdrawals and lease stipulations;
■ considering economic incentives for oil and gas development such asroyalty reductions for enhanced oil and gas recovery; for reduction ofthe risk associated with production in frontier areas or deep gasformations, and for development of small fields that would otherwise beuneconomic;
■ reviewing the regulation of energy-related activities and the siting ofenergy facilities in the coastal zone and on the Outer Continental Shelf,continuing Outer Continental Shelf oil and gas leasing and approving ofexploration and development plans on predictable schedules;
■ considering further lease sales in the National Petroleum Reserve - Alaska,including areas not currently leased within the northeast corner of thereserve;
■ authorising exploration and possible development of the 1002 Area of theArctic National Wildlife Refuge;
■ expediting construction of a pipeline to deliver natural gas to the lower48 states;
259

■ supporting legislation to improve the safety of natural gas pipelines;
■ continuing efforts to improve pipeline safety and expediting pipelinepermissions;
■ considering improvements in the regulatory process governing approvalof interstate natural-gas pipeline projects.
■ Access to the transmission system
The US natural gas market today is extremely open and competitive. Wellheadgas prices were deregulated between 1979 and 1989 and are now subject tomarket forces.
Interstate pipelines are regulated by the Federal Energy Regulatory Commission,which regulates pipeline rates, construction of new or expanded pipelines andfacilities and certain environmental aspects. The Commission ensures open,non-discriminatory access to gas transport for all competing suppliers.
Commission’s Order 436 issued in 1985 provided for open access to pipelinesby requiring them to transport third-party gas. FERC Order 636, issued in 1992,unbundled pipeline sales and transportation functions, with transportationremaining a regulated monopoly but with sales opened to competition. Partlyas a consequence, there are now some 260 unregulated independent naturalgas marketers. The system of pipelines on which producers compete is extensive,with 278,000 miles of pipe.
Natural gas distribution is regulated by state public utility commissions thatare responsible for regulating all aspects of gas distribution including consumerrates. Many states are opening up functions like billing and metering tocompetition, while continuing to regulate local grids. There are some 1,400local gas-distribution utilities in all, varying in size from small companies witha few thousand customers to several that have over a million customers.
260

GLOSSARY OF TERMS AND ABBREVIATIONS
Associated gas - Natural gas found in a crude oil reservoir, either separatefrom or in solution with the oil.
At the beach - (UK) When gas has been brought ashore to a terminal byproducers but is not yet in the national transmission system, the gas is calledat the beach.
Balancing mechanism - In a natural gas pipeline network, the means ofensuring that supply does not outstrip demand, or vice versa.
Base-load - The minimum amount of electric power delivered or requiredover a given period of time at a steady rate.
bbl - barrel.
bcf - billion cubic feet.
bcf/d - billion cubic feet per day.
bcm - billion cubic metres.
Beach/border price - Price of gas delivered to the beach or border terminal.
Btu - British thermal unit.
Bundled services - Two or more gas services provided at a combined charge -e.g. gas transportation and storage.
Calorific Value (CV) - A measure of the amount of energy released as heat whena fuel is burned. It may be measured gross or net, where gross includes the heatproduced when the water vapour is condensed into a liquid and net does not.
Churn - The ratio of traded volumes at a hub to actual physical volumes.
Combined-cycle gas turbine (CCGT) - An energy-efficient gas turbine systemwhere the first turbine generates electricity from the gas produced during fuelcombustion. The hot gases pass through a boiler and then into the atmosphere.The steam from the boiler drives the second electricity generating turbine.
Combined heat and power (CHP) - A power station system that uses both gasand the heat/steam generated to produce electricity. Also known as cogeneration.
261

Compressor station - Gas loses pressure as it travels over long distances. Acompressor station, usually a gas turbine engine, is an installation whichrecompresses the gas to the required pressure.
Cost, Insurance and Freight (cif) - A cif price means that the cost of cargo,insurance and travel/freight to a given destination are all included in the price.
Counterparty - A participant in a financial contract.
City gate - Point at which a local distribution company takes delivery of gas;physical interface between transmission and local distribution systems.
Core market - Generally that part of the gas market that does not possessfuel-switching capability in the near term; typically residential, commercial andsmall industrial users.
Daily balancing - (UK) Balancing, on a day-by-day basis, the amount of gasa shipper puts into a pipeline system.
Day-ahead gas - Gas for delivery on the day after the trade takes place.
Deliverability (from storage) - The rate at which gas can be supplied from astorage in a given period. In a salt cavity storage facility for example, the ratewould depend on a number of factors including reservoir pressure, reservoirrock characteristics and withdrawal facilities such as pipeline capacity. Theterm is also used for the volume of gas which a field, pipeline, well, storage ordistribution system can supply in a single 24-hour period.
Derivative - Financial instrument derived from a cash market commodity,futures contract, or other financial instrument. Derivatives can be traded onregulated exchange markets or over-the-counter. For example, energy futurescontracts are derivatives of physical commodities, options on futures arederivatives of futures contracts.
DOE - US Department of Energy; Federal department.
DTI - UK Department of Trade and Industry; government ministry.
Dual-firing - Where two different fuels - e.g., gas and oil - can be used to generateenergy in one piece of equipment.
Eligibility, eligible customers - Gas users that meet criteria specified in the EUGas Directive or in national legislation, such as a minimum volume of gasconsumed per year, have the right to choose their supplier and request third-party access to the grid.
262

EIA - Energy Information Agency; part of US DOE.
EU - European Union.
Ex-ship - Under an ex-ship contract, the seller has to deliver LNG to thebuyer at an agreed importing terminal. The seller remains responsible for theLNG until it is delivered.
Exchange - Any trading arena where commodities and/or securities are boughtand sold - for example, the New York Mercantile Exchange.
FERC - Federal Energy Regulatory Commission (United States); responsiblefor regulation of the US interstate oil and gas pipeline businesses.
Flat gas - Gas purchased with zero swing and 100% take-or-pay.
Firm capacity - Amount of gas in a buyer’s contract that is guaranteed not tobe interrupted.
Firm (uninterrupted) - Gas for which the full price has been paid on theunderstanding it will be delivered continually through the contract period.
Forward contracts - Where products are traded ahead of their physical loading.
Free-on-board (fob) - Under a fob contract, the seller provides the LNG at theexporting terminal and the buyer takes responsibility for shipping and freightinsurance.
Futures contract - An exchange-traded supply contract between a buyer anda seller whereby the buyer is obligated to take delivery and the seller isobligated to provide delivery of a fixed amount of a commodity at apredetermined price at a specified location. Futures contracts are tradedexclusively on regulated exchanges and are settled daily based on their currentvalue in the marketplace.
G - Giga - 109.
GCV - Gross calorific value.
Gigajoule (GJ) - One billion joules, approximately equal to 948,000 Britishthermal units.
Gigawatt (GW) - One billion watts.
Gigawatt Hours (GWh) - One billion watt hours.
Henry Hub - The delivery point for the largest NYMEX natural gas contractby volume.
263

Hub - A transfer site or system where several pipelines interconnect and whereshippers may obtain services to manage and facilitate their routing of suppliesfrom production areas to markets.
IEA - International Energy Agency.
Interruptible customer - A customer that receives service only at those timesand to the extent that firm customers do not demand all the available service.
Interruptible service - Gas sales that are subject to interruption for a specifiednumber of days or hours during times of peak demand or in the event ofsystem emergencies. In exchange for interruptibility, buyers pay lower prices.
IPE - International Petroleum Exchange, located in London.
IPP - independent power producer.
kWh - Kilowatt hour (unit of energy).
LDC (local distribution company) - (US) A company that operates or controlsthe retail distribution system for the delivery of natural gas or electricity.
LNG (liquefied natural gas) - Natural gas (mainly methane) which has beenliquefied by reducing its temperature to minus 162 degrees Celcius atatmospheric pressure.
Load balancing - To balance demand and supply (at any given point) in agrid/pipeline/supply chain.
Load factor - The ratio of average to peak usage for gas customers for a timeperiod i.e. one day, one hour, etc. The higher the load factor, the smaller thedifference between average and peak demand.
Line-pack - Increasing the amount of gas in the system or pipeline segmentby temporarily raising the pressure to meet high demand for a short period oftime. Often exercised overnight as a temporary storage medium to meetanticipated next-day peaking demands.
m - mega - million - 106.
MBtu - Million British thermal units.
mcf - Million cubic feet.
mcf/d - Million cubic feet per day.
mcm - Million cubic metres.
264

mcm/d - Million cubic metres per day.
Merit order - Ranking in order of which generation plant should be used, basedon ascending order of operating cost together with amount of energy that willbe generated.
Mtoe - Million tonnes of oil equivalent.
MW - Megawatt.
NBP - National Balancing Point; a notional point on UK Transco’s nationaltransmission system where load is assumed to be balanced.
NEB - National Energy Board (Canada); responsible for regulation of provincialoil and gas pipelines.
NETA - New Electricity Trading Arrangements.
Netback, market value pricing - Delivered price of cheapest alternative fuelto gas to the customer (including any taxes) adjusted for any efficiencydifferences in the energy conversion process;
Minus cost of transporting gas from the beach/border to the customer;
Minus cost of storing gas to meeting seasonal or daily demand fluctuations;
NGTA - New Gas Trading Arrangements.
Nomination - The notification to put into effect a contract or part of acontract, e.g., a gas flow nomination from a shipper to advise the pipeline ownerof the amount of gas it wishes to transport or hold in storage on a given day.
NTS - (UK) National Transmission System.
NYMEX - New York Mercantile Exchange, where futures contracts for gas andother commodities are traded.
OECD - Organisation for Economic Cooperation and Development.
Off-take - Actual amount of gas withdrawn.
OTC - Over-the-counter - An over-the-counter deal is a customised derivativecontract usually arranged with an intermediary such as a major bank or thetrading arm of an energy major, as opposed to a standardised derivativecontract traded on an exchange. Swaps are the commonest form of OTCinstrument.
Open interest - The number of futures or options natural gas contractsoutstanding in the market.
265

One-in-twenty (1 in 20) - The highest gas demand expected on any given dayover a 20 year period.
One-in-fifty (1 in 50) - The highest gas demand expected in one single yearout of 50 years.
Peak day - The day during which the greatest gas demand occurs in a one yearperiod.
Peak load - Periods during the day when energy consumption is highest. Theintroduction of additional gas to cover this demand is known as peak shaving.
Peak shaving - During times of peak demand, supplies from sources other thannormal suppliers are used to reduce demand on the system - e.g., LNG peakshaving facilities or storage from a salt cavern.
Reserves-to-production ratio - (R/P) Remaining reserves divided by annualproduction.
Seasonal supplies - Supplies of gas used for winter demand. This often includesgas from storage systems.
Seasonality - All energy futures markets are affected to some extent by anannual seasonal cycle or “seasonality”. This seasonal cycle or pattern refers tothe tendency of market prices to move in a given direction at certain times ofthe year.
In the survey, “seasonality” in gas delivery is the ratio between gas consumptionin the peak and the lowest month of a given year.
Shipper - A company which transports gas along a pipeline system. Shippersneed to be registered with the local regulatory body.
Spark spread - The spark spread is defined as the difference, at a particularlocation and at a particular point in time, between the fuel cost of generatinga MWh of electricity and the price of electricity.
Spot market - The spot market is the physical/cash crude, refined product, gasor electricity market. The market for immediate delivery rather than futuredelivery.
Spot price - The price of a security or commodity in the cash market.
Storage capacity - The amount of gas which can be stored to cover peak andseasonal demand.
Swing - Variations in gas supply or demand. A contractual commitment
266

allowing a buyer to vary up to specified limits the amount of gas it can takeat the wellhead, beach or border; the maximum daily contract quantity isusually expressed as a percentage of the annual contract quantity (100%equates to zero swing).
In the study, the swing is the maximum gas monthly delivery divided by theaverage monthly delivery in a given year.
Swing factor - In gas purchasing agreements the swing factor is a measure ofthe flexibility to vary nominations and is expressed as a ratio of peak to averagesupplies.
Swing producer/supplier - A company or country which changes its gas outputto meet fluctuations in market demand.
T - Tera - 1012.
Take-or-Pay (ToP) - In a buyer’s contract take-or-pay is the obligation to payfor a specified amount of gas whether this amount is taken or not. Dependingon the contract terms under-takes or over-takes may be taken as make-up orcarry forward into the next contract period. When it is credited into anothercontract period this is called make-up gas.
tcf - trillion cubic feet.
tcm - trillion cubic meters.
Therm - equivalent to 100,000 Btu.
TJ - Terajoules.
Tolling - Under a tolling agreement a power marketer or commercial electricitycustomer provides the fuel, say natural gas, to produce electricity for themarketer or customer at an agreed spark spread, and receives the rights toelectricity output.
TPA - Third-party access; the right or possibility for a third party to make useof the transportation or distribution services of a pipeline company to movehis own gas, while paying a set or negotiated charge.
TPES - Total primary energy supply.
Unbundling - The separation of the various components of gas businesses inorder to introduce greater competition to these segments of the industry.
Volatility - A measure of the variability of a market factor, most often theprice of the underlying instrument. Volatility is defined mathematically as the
267

annualised standard deviation of the natural log of the ratio of two successiveprices; the actual volatility realised over a period of time (the historical volatility)can be calculated from recorded data.
Within-day gas - Gas for delivery within the day on which the trade takes place.
Working gas - The amount of gas in a storage facility above the amountneeded to maintain a constant reservoir pressure (the latter is known as cushiongas).
268

REFERENCES
Agency for Natural Resources and Energy (2001), Comprehensive Review ofJapanese Energy Policy, Tokyo: Ministry of Economy, Trade and Industry(METI).
British Petroleum (2001), BP Statistical Review of World Energy, London.
BTU Weekly, Red Bank, various issues.
Cambridge Energy Research Associates (CERA) (1998), The Levers of Swing:Emerging Market Opportunities in Gas Storage, Shankari Srinivasan andMichael Stoppard, Paris.
Cedigaz (2002), Natural Gas in the World - First Estimates for 2001, RueilMalmaison: Institut Français du Pétrole.
Cedigaz (2001), Natural Gas in the World: 2001 Survey, Rueil Malmaison:Institut Français du Pétrole.
Cedigaz News Report, Rueil Malmaison, various issues.
Commission of the European Communities (CEC) (2001a), First Report onthe Implementation of the Internal Electricity and Gas Market, Brussels: CEC.
CEC (2001b), Completing the Internal Energy Market, Brussels: CEC.
CEC (2001c), Proposal for a Directive of the European Parliament and of theCouncil amending Directives 96/92/EC and 98/30/EC Concerning CommonRules for the Internal Market in Electricity and Natural Gas, Brussels: CEC.
CEC (2000), Trading Opportunities and Promotion of Transparency in theInternal Gas Market, study prepared by Energy Markets Limited, UnitedKingdom; Ramboll, Denmark, Brussels: CEC.
Commission de Régulation de l’Electricité (CRE) (2002), Rapport d’étape surl’ouverture du marché gazier français, Paris.
Commission de Régulation de l’Electricité et du Gaz (CREG) (2001), Planindicatif de l’approvisionnement en gaz naturel, Brussels.
Crocker K. (2002), Improving the regulatory framework for transportation andprivatisation of gas pipelines: the Australian experience, presentation by theMinister-Counsellor of the Australian Delegation to OECD at the IEA
269

Cross-Border Gas Trade Conference, IEA, Paris, 26-27 March 2002(unpublished).
Department of Trade and Industry, Energy Trends, London: DTI, variousissues.
Energy Information Administration (EIA) (2002), Annual Energy Outlook2002, Washington, DC: US Department of Energy.
EIA, Natural Gas Monthly, Washington, DC: US DOE, various issues.
EIA (2001a), Natural Gas Storage in the United States in 2001: a CurrentAssessment and Near-Term Outlook, Washington, DC: US DOE.
EIA (2001b), US Natural Gas Markets: Recent Trends and Prospects for theFuture, Washington, DC: US DOE.
EIA (2001c), Impact of Interruptible Natural Gas Services on Northeast HeatingOil Demand, Washington, DC: US DOE.
EIA (2001d), Natural Gas Transportation - Infrastructure Issues and OperationalTrends, Washington, DC: US DOE.
EIA (2001e), U.S. Natural Gas Markets: Mid-Term Prospects for Natural GasSupply, Washington, DC: US DOE.
EIA (2000a), The Changing Structure of the Electricity Power Industry 2000: AnUpdate, Washington, DC: US DOE.
EIA (2000b), The Northeast Heating Fuel Market, Washington, DC: US DOE.
EIA (1998), The Challenges of Electric Power Restructuring for Fuel Suppliers,Washington, DC: US DOE.
EIA (1997a), Natural Gas 1996 - Issues and Trends, Washington, DC: USDOE.
EIA (1997b), 1994 Manufacturing Energy Consumption Survey, Washington,DC: US DOE.
EIA (1995), The Value of Underground Storage in Today’s Natural Gas Industry,Washington, DC: US DOE.
ESAI (2001), North American Natural Gas Stockwatch, November 2001,Boston.
ESAI, Updates Natural Gas Markets, various issues.
270

Energy Sector Management Assistance Programme (ESMAP) (1993), Long-Term Contracts - Principles and Applications, Washington, DC: World Bank.
Eurogas (1998), Security of Supply of Natural Gas in Western Europe, Brussels.
EuroHub website: www.eurohubservices.com
European Gas Matters (twice-monthly), London, various issues.
FACTS (2002), Japan Gas Update, Gas Insights No. 3, 6 March 2002, Honolulu:Fesharaki Associates Commercial and Technical Services, Inc.
FACTS (2001a), Japan’s Gas Market: Emerging Trends in International andDomestic Markets, Gas Alert No. 20, 23 February 2001, Honolulu: FesharakiAssociates Commercial and Technical Services, Inc.
FACTS (2001b), Japan’s Natural Gas Outlook, Occasional Gas Report No. 9,6 February 2001, Honolulu: Fesharaki Associates Commercial and TechnicalServices, Inc.
Gas Matters Today (daily), London, various issues.
Gasunie website: www.gasunie.nl
Gas Transmission Europe (GTE) (2001), Balancing and Storage Report, 27June 2001, Brussels: GTE.
GTE website: www.gte.be
International Group of Liquefied Natural Gas Importers (GIIGNL) (2002),The LNG industry - 2001, Paris.
GIIGNL (2001), The LNG industry - 2000, Paris.
Huberator web site: www.huberator.com
ILEX (2001), What influences gas prices in the UK and why have they increasedthrough 2000?, January 2001, ILEX Energy Consulting.
International Petroleum Exchange (IPE) website: www.ipemarkets.com
International Energy Agency (IEA) (2002a), World Energy Outlook 2002,Paris: Organisation for Economic Cooperation and Development.
IEA (2002b), Natural Gas Information 2002, Paris: OECD.
IEA (2002c), Energy Prices and Taxes, Paris: OECD.
IEA (2002d), Security of Supply in Electricity Markets - Evidence and PolicyIssues, Paris: OECD.
271
IEA (2002e-forthcoming), Energy Policies of IEA Countries, Paris: OECD.
IEA (2002f ), Summary of Results of the IEA Short-Term Fuel-Switching Survey,Note by the Secretariat, IEA/SEQ (2002) (unpublished).
IEA (2002g), Electricity Information 2002, Paris: OECD.
IEA (2001a), World Energy Outlook 2001 Insights - Assessing Today’s Supplies toFuel Tomorrow’s Growth, Paris: OECD.
IEA (2001b), Natural Gas Information 2001, Paris: OECD.
IEA (2001c), Energy Statistics of OECD Countries 2001.
IEA (2000a), World Energy Outlook 2000, Paris: OECD.
IEA (2000b), Regulatory Reform: European Gas, Paris: OECD.
IEA (1998), Natural Gas Pricing in Competitive Markets, Paris: OECD.
IEA (1995), The IEA Natural Gas Security Study, Paris: OECD.
Jensen J. (2002), Liquefied Natural Gas in North American Gas Supply, apresentation to the Energy Modeling Forum, 24 June 2002, WashingtonDC (unpublished).
Jensen J. (2001a), North American Natural Gas Price and Demand Dynamics,a presentation to the NAPIA/PIRA Joint Annual Conference, 11 October2001, Palm Beach, Florida (unpublished).
Jensen J. (2001b), Comparative Energy Costs in Power Generation, a presentationto the Centre for Global Energy Studies, at the fifth Annual Symposium“Natural gas in the Middle East Gulf in a Global Context”, 24 September2001, Bagshot, Surrey (unpublished).
Kuroyanagi N. (2001), Keynote speech delivered by the Executive Vice-President of Chubu Electric Power Co Inc at the 4th Doha Gas Conference,14-16 March 2001, Doha (unpublished).
National Energy Board (2001), 2000 Annual Report, Calgary: NEB.
National Energy Board (1999), Canadian Energy - Supply and Demand to2025, Calgary: NEB.
Natural Gas Exchange (NGX) website: www.ngx.com.
Office of Gas and Electricity Markets (OFGEM) (2001), Dynegy’ Inc’s ProposedAcquisition of BG Storage Ltd - A Consultation Document, London: OFGEM.
272

OFGEM (2000), A Review of the Development of Competition in the Gas StorageMarket, London: OFGEM.
Oil and Gas Journal (weekly), Tulsa, OK, various issues.
Petroleum Economist (2001), Fundamentals of the Global LNG Industry,Petroleum Economist Ltd in association with Shell Gas & Power, London.
Petrostratregies (weekly), Paris, various issues.
Roe D. (2001), LNG Trade: A Review of Markets, Projects and Issues in theChanging World of LNG, SMi, Business to Business Publishing, London.
The Utilities Journal (2002), NETA: The First Year, March 2002, p. 30-31,Oxford.
Valais M., TotalFinaElf, Chabrelie M.F., Cedigaz, Lefeuvre T., Gaz de France(2001), World LNG Prospects: Favourable Parameters for a New GrowthArea, presentation to the 18th World Energy Congress, 21-25 October2001, Buenos Aires.
Van Nieuwland A.J.F.M (2001), Planning and Developing NAM’s UGS Strategy,Presentation to the Global Gas Village Conference: The Case forUnderground Gas Storage in Europe, 17-18 May 2001, Paris (unpublished).
World Gas Intelligence (weekly), New York, various issues.
273


OECD TOKYO CENTRE
Tel: (+81-3) 3586 2016Fax: (+81-3) 3584 7929
E-mail: [email protected]
OECD WASHINGTON CENTER
Tel: (+1-202) 785-6323Toll-free number for orders:
(+1-800) 456-6323Fax: (+1-202) 785-0350
E-mail: [email protected]
INTERNATIONALENERGY AGENCY
O R D E R F O R M
You can also sendyour order
to your nearestOECD sales point
or throughthe OECD online
services:www.oecd.org/
bookshop
OECD PARIS CENTRETel: (+33-01) 45 24 81 67Fax: (+33-01) 49 10 42 76E-mail: [email protected]
OECD BONN CENTRETel: (+49-228) 959 12 15Fax: (+49-228) 959 12 18E-mail: [email protected]
OECD MEXICO CENTRETel: (+52-5) 280 12 09Fax: (+52-5) 280 04 80E-mail: [email protected]
IEA BOOKSFax: +33 (0)1 40 57 65 59
E-mail: [email protected]/books
DELIVERY DETAILSName Organisation
Address
Country Postcode
Telephone E-mail
PAYMENT DETAILS
I enclose a cheque payable to IEA Publications for the sum of $ or €
Please debit my credit card (tick choice). Mastercard VISA American Express
Card no:
Expiry date: Signature:
PUBLICATIONS ISBN QTY PRICE TOTAL
Flexibility in Natural Gas Supply and Demand 92-64-19938-1 $75 €82
World Energy Outlook 2002 92-64-19835-0 $150 €165
Distributed Generation in Liberalised Electricity Markets 92-64-19802-4 $75 €82
Security of Supply in Electricity Markets - Evidence and Policy Issues 92-64-19805-9 $100 €110
Russia Energy Survey 2002 92-64-18732-4 $150 €165
Natural Gas Information 2002 92-64-19791-5 $150 €165
Developing China's Natural Gas Market - The Energy Policy Challenges 92-64-19837-7 $100 €110
South American Gas - Daring to Tap the Bounty (Forthcoming) 92-64-19663-3 $120 €132
TOTAL
I would like to order the following publications
9, rue de la FédérationF-75739 Paris Cedex 15

IEA PUBLICATIONS, 9, Rue de la Fédération, 75739 PARIS cedex 15PRINTED IN FRANCE BY JOUVE
(61 2002 321 PI) ISBN : 92-64-19938-1 – 2002