flexcomp infiniti suite - thought technology biograph infiniti... · dynamap suite 3.0 for procomp...
TRANSCRIPT
BioGraph Infiniti DynaMap Suite 3.0 for ProComp Infiniti
March 2, 2006
SA7990B Ver 3.0

DynaMap Suite 3.0 for ProComp Infiniti Contents List P Inf 8 Ch EMG Bi-Lateral Difference.chs 3 P Inf 8 Ch EMG.chs 4 P Inf 8 Ch Legs.chs 5 P Inf 5 Ch Multi Modality.chs 6 P Inf 4 Ch EMG 2 Goni 2 Force.chs 7 P Inf Force Calibration.chs 8 P Inf Goniometer Calibration.chs 9 P Inf Force Calibration.scr 10 P Inf Goniometer Calibration.scr 11 P Inf 2 Ch Raw Separated Graphs.scr 12 P Inf 2 Ch Raw Graphs Dual Screen.scr 13 P Inf 2 Ch Raw.scr 14 P Inf Ch A Test.scr (also B) 15 P Inf Ch C Test.scr (also D, E, F, G, H) 16 P Inf 2 Ch Spectral.scr 17 P Inf 8 Ch RMS.scr 18 P Inf 8 Ch RMS Bargraphs.scr 19 P Inf 8 Ch Line & Bar.scr 20 P Inf A and B RMS.scr (also C/D, E/F, G/H) 21 P Inf RMS A and B FFT.scr 22 P Inf 8 Ch RMS with Video.scr 23 P Inf 4 Ch RMS 2 Goni 2 Force.scr 24 P Inf EMG, Force, Goni, Video Dual Screen.scr 25 P Inf 2 Axis Goniometer.scr 26 P Inf 2 Ch Review RAW.scr 27 P Inf 2 Ch Review RAW Dual Screen with Video.scr 28 P Inf 8 Ch Review RMS.scr 29 P Inf 2 Ch Review Median Frequency.scr 30 P Inf 2 Ch Median Freq.scr 31 P Inf 2 Ch Median Freq with Video.scr 32 P Inf 1 Ch Median Freq with Log.scr 33 P Inf 2 Ch Bi-Lateral.scr 34 P Inf 8 Ch Bi-Lateral Bars.scr 35 P Inf 8 Ch Bi-Lateral + Video.scr 36 P Inf 2 Ch A - B Bi-Lateral + Video.scr (also C/D, E/F, G/H) 37 P Inf 8 Ch Bi-Lateral Back.scr 38 P Inf Para-spinal muscle activity.scr 39 P Inf Para-spinal and cervical comparison.scr 40 P Inf 5 Ch Multi Modality Overview.scr 41 P Inf 1 Ch EKG.scr 42 P Inf 2 Ch SC, Temp.scr 43 P Inf 2 Ch EMG.scr 44 P Inf 8 Ch Seated Iso + Anim.scr 45 Recuired Files for DynaMap Suite 3.0 for ProComp infiniti 46

Channel Sets
P Inf 8 Ch EMG Bi-Lateral Difference.chs A. MyoScan-Flex B. MyoScan-Flex C. MyoScan- Pro 400 D. MyoScan- Pro 400 E. MyoScan- Pro 400 F. MyoScan- Pro 400 G. MyoScan- Pro 400 H. MyoScan- Pro 400
This channel set is designed with bi-lateral pairs of electrodes in mind, in placements such as the lumbar region. Two MyoScan-Flex channels is filtered with a notch, then a high pass IIR filter that is set by default to 0.5Hz this can be increased to filter out heart artifact if it becomes evident in the signal. It is converted from the raw state to an RMS value using the non-sliding window algorithm, with a time period of one second and an averaging factor of 10. For looking at the spectral of the signals it is converted by an FFT. The MyoScan-Pro sensor automatically converts SEMG signal to a root mean square (RMS) signal (an analog rectification is done inside the circuitry). The logic to determine if the signals have a difference greater than 20% is the following:- e.g. between channel A and B. (A > B + B x 0.2 OR A < B – B x 0.2 ) OR (B > A + A x 0.2 OR B < A – A x 0.2 ) To enable easy adjustment of the percentage difference all of the channels have been ganged together and converted into a real number. By changing the constant value of the channel labeled “Insert % Difference Value Here” from the default 20 to 30 the percentage used in all the channels will be changed to 30%. This Boolean output is then converted to a float and optionally smoothed for use in an instrument. This smoothed output is used in all the screens supplied with this channel set. An additional level of logic is added to the channel set to prevent small levels of environmental electronic noise from changing the value for the output. This logic looks at the level of the two signals and if it is below 2uV then it does not calculate the 20% difference, and the out put remains at 0 or the light off. Note 1: Smoothing has been added to some of the digital and animated bar graphs to enhance the clinical feedback. Smoothing has not been added to the red indicator lights, this smoothing delay can lead to a slight miss match between the numbers seen and the illumination of the light. Note 2: The frequency of Notch filter is necessary to set from the Biograph Infiniti application before recording a session by selecting Options, Notch Filters then 60Hz or 50 Hz. Click to return to contents...
3

P Inf 8 Ch EMG.chs A. MyoScan-Flex B. MyoScan-Flex C. MyoScan- Pro 400 D. MyoScan- Pro 400 E. MyoScan- Pro 400 F. MyoScan- Pro 400 G. MyoScan- Pro 400 H. MyoScan- Pro 400
Two MyoScan-Flex channels are filtered once through a notch filter to remove 60 Hz or 50 Hz noise, and then through a IIR high pass filter set to 20 Hz, this can be increased in the main application to 100 Hz to eliminate the heart rate artifact that may be detected when the electrodes are used in a number of locations. FFT, RMS, Median Frequency (MF), MF smoothed, Peak Frequency, Maximum, Minimum, Mean, Standard Deviation, Minimum MF, Variability, Mean MF are calculated for 2 channels. Six other channels are used to connect MyoScan- Pro sensors. . The MyoScan-Pro sensor automatically converts SEMG signal to a root mean square (RMS) signal (an analog rectification is done inside the circuitry). Maximum, Minimum, Mean, Standard Deviation, Variability are calculated for 6 MyoScan-Pro channels. Click to return to contents...
4

P Inf 8 Ch Legs.chs A. MyoScan-Flex B. MyoScan-Flex C. MyoScan-Pro 400 D. MyoScan-Pro 400 E. MyoScan-Pro 400 F. MyoScan-Pro 400 G. Goniometer H. Goniometer
A collection of channels intended for the monitoring of dual leg activity and angle. Standard signal processing of the EMG signals. Goniometer channels are processed through a linear transform, enabling the calibration by the user. Click to return to contents...
5

P Inf 5 Ch Multi Modality.chs A. MyoScan-Flex B. MyoScan-Flex C. EKG-Pro/Flex D. Temp-Pro/Flex E. SC-Pro/Flex
A mix of modalities to enable monitoring physiology and EMG simultaneously. Standard filtering on the EMG signal, with Notch and High Pass IIR filter and RMS and FFT calculations. EKG processed to detect the inter beat interval, from this Heart Rate is calculated and an FFT to look at the power spectrum. Temperature and Skin Conductance are also recorded and statistical values extracted. Click to return to contents...
6

P Inf 4 Ch EMG 2 Goni 2 Force.chs A. MyoScan-Flex B. MyoScan-Flex C. MyoScan-Pro 400 D. MyoScan-Pro 400 E. Force F. Force G. Goniometer H. Goniometer I.
Alternative arrangement of sensors inputs, processing for each channel as described above. Note: -
Goniometers and Torsiometers are interchangeable in the software. Goniometer, Torsiometer and Force sensors are all fed through a linear transform equation that is accessible within the main application. The input max and min values are correlated to the desired and calibrated output values.
Sensors that are not connected at time of recording are automatically set to a raw input value of 1. If this channel is then processed through a linear transform virtual channel it may result in a constant value different from 1, and will display as such on the display screen.
Click to return to contents...
7

P Inf Force Calibration.chs
A. Force B. Force C. Force D. Force E. Force F. Force G. Force H. Force
All Force channels are intended for calibrating Force sensors. Click to return to contents...
8
P Inf Goniometer Calibration.chs
A. Goniometer B. Goniometer C. Goniometer D. Goniometer E. Goniometer F. Goniometer G. Goniometer H. Goniometer
All Goniometer channels are intended for calibrating Goniometer/ Torsiometer sensors. Click to return to contents...
9

P Inf Force Calibration.scr Channel Set: P Inf Force Calibration.chs Category: Calibration Description: Force Calibration. Screen intended for force sensors calibration. To calibrate the sensors, connect the hardware and open the Force calibration screen then start a recording. Apply a know load to the force sensor and record the loaded (max) and unloaded (min). Stop the session and move to the channel set that is going to be used to record data, edit the virtual channel set and select the virtual channel relating to the sensor that you are calibrating. Manually enter the input Min and Max values and the corresponding output min and max values of the known load. It is also possible to enter the units of measure which will appear in generated reports. Note: - A force sensor converts the load applied to a raw value, as the load changes the value corresponding to that load changes with it. This raw value can be transformed into a meaningful calibrated value in the software by using the linear transform virtual channel. This linear transform takes the minimum and maximum raw value and converts it to the min-max output values corresponding to the positions (e.g. - 719 to 845 becomes 0 to 10 lbs). Click to return to contents...
10

P Inf Goniometer Calibration.scr Channel Set: P Inf Goniometer Calibration.chs Category: Calibration Description: Goniometer Calibration. Screen intended for goniometer sensors calibration. To calibrate the sensors, connect the hardware and open the goniometer calibration screen then start a recording. Manipulate the goniometer to its maximum and minimum specified deflection. Record the max and min values. Stop the session and move to the channel set that is going to be used to record data, edit the virtual channel set and select the virtual channel relating to the axis that you are calibrating. Manually enter the input Min and Max values and the corresponding output min and max values. It is also possible to enter the units of measure which will appear in generated reports. Note: -.A goniometer sensor converts its position to a raw value, as the position changes the value corresponding to that position changes with it. Most goniometers have a specified minimum and maximum deflection. This raw value can be transformed into a meaningful calibrated value in the software by using the linear transform virtual channel. This linear transform takes the minimum and maximum raw value and converts it to the min-max output values corresponding to the positions (e.g. -119 to 70 becomes 0 to 180 Degrees.) Click to return to contents...
11

P Inf 2 Ch Raw Separated Graphs.scrChannel Set: P Inf 8 Ch EMG.chs Category: RAW Description: 2 Ch Raw 2 channels of RAW EMG each on its own line graph. No feedback. Click to return to contents...
12
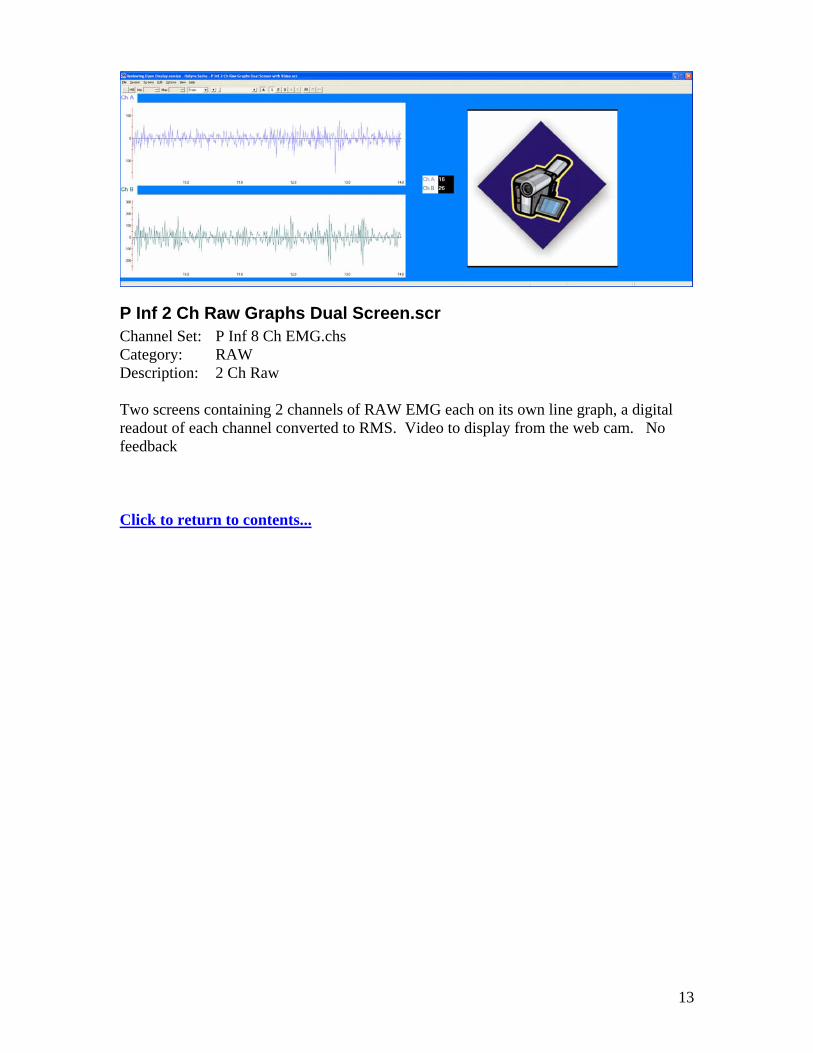
P Inf 2 Ch Raw Graphs Dual Screen.scrChannel Set: P Inf 8 Ch EMG.chs Category: RAW Description: 2 Ch Raw Two screens containing 2 channels of RAW EMG each on its own line graph, a digital readout of each channel converted to RMS. Video to display from the web cam. No feedback Click to return to contents...
13

P Inf 2 Ch Raw.scrChannel Set: P Inf 8 Ch EMG.chs Category: RAW Description: 2 Ch Raw 2 channels of RAW EMG on multi line graph. No feedback. Click to return to contents...
14

P Inf Ch A Test.scr (also B)Channel Set: P Inf 8 Ch EMG.chs Category: Review Description: Test screen Ch A A sample of information from the output of channel A. Raw Line graph, RMS line Graph, Max, Mean, Min, Std Deviation, Variability stats, and Median and Peak Frequencies and a 2D power spectrum. This screen has been duplicated for channel B. Click to return to contents...
15

P Inf Ch C Test.scr (also D, E, F, G, H)Channel Set: P Inf 8 Ch EMG.chs Category: Review Description: Test screen Ch C A sample of information from the output of channel C. RMS line Graph, Max, Mean, Min, Std Deviation, Variability stats. This screen has been duplicated for D, E, F, G, H channels as a test of each channel. Click to return to contents...
16
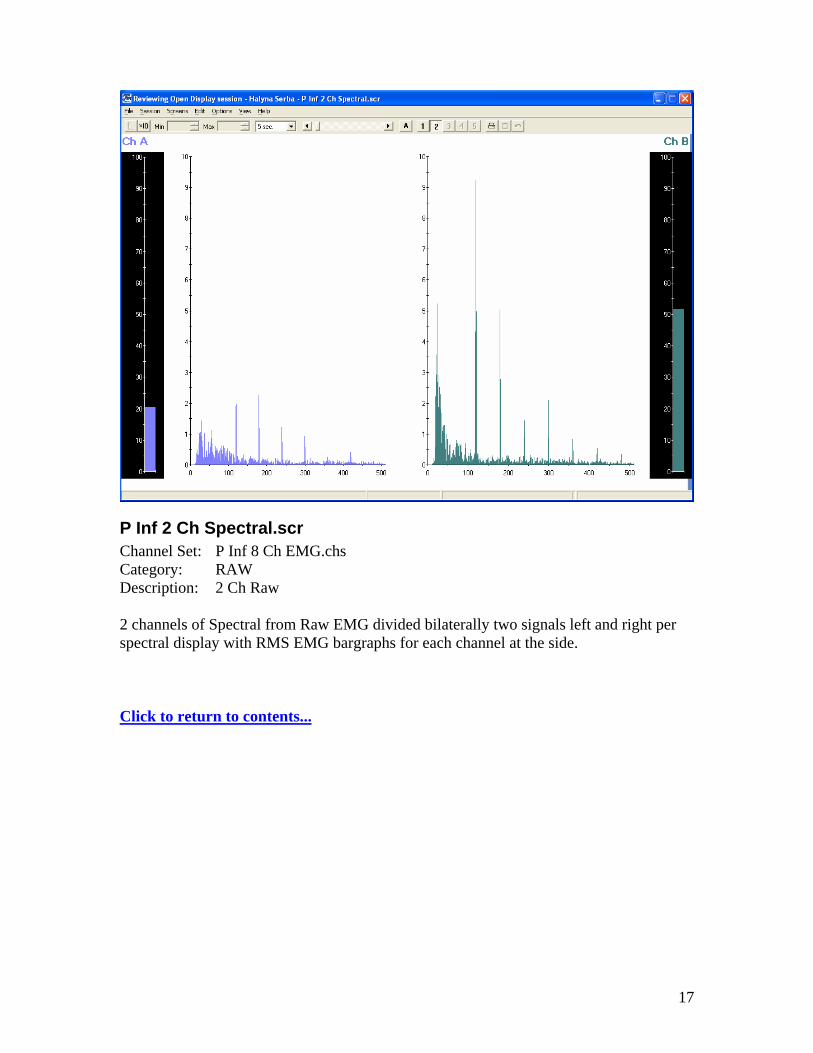
P Inf 2 Ch Spectral.scrChannel Set: P Inf 8 Ch EMG.chs Category: RAW Description: 2 Ch Raw 2 channels of Spectral from Raw EMG divided bilaterally two signals left and right per spectral display with RMS EMG bargraphs for each channel at the side. Click to return to contents...
17

P Inf 8 Ch RMS.scrChannel Set: P Inf 8 Ch EMG.chs Category: RMS Description: 8 Ch RMS 8 channels of RMS data shown in bi-lateral pairs on multi line graphs. Click to return to contents...
18
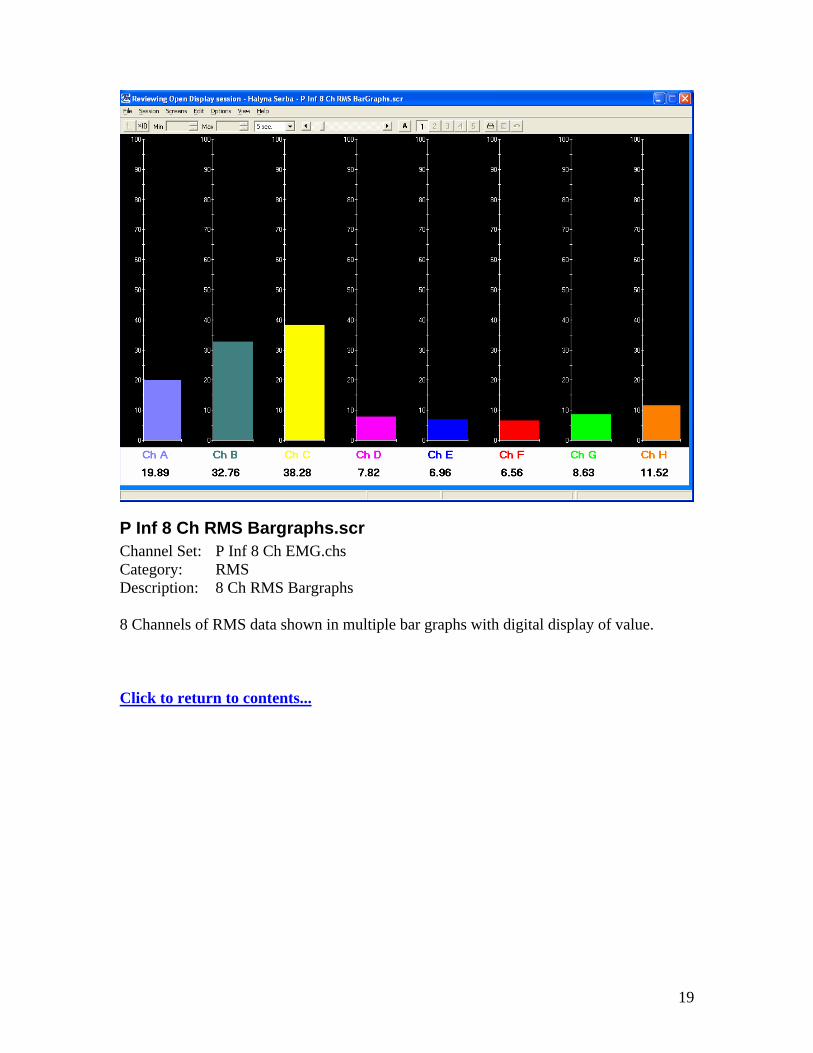
P Inf 8 Ch RMS Bargraphs.scrChannel Set: P Inf 8 Ch EMG.chs Category: RMS Description: 8 Ch RMS Bargraphs 8 Channels of RMS data shown in multiple bar graphs with digital display of value. Click to return to contents...
19

P Inf 8 Ch Line & Bar.scr Channel Set: P Inf 8 Ch EMG.chs Category: RMS Description: 8 Ch RMS Line Graph and Bar Graphs. 8 Channels of RMS data derived from the 2 RAW inputs (Channels A and B) and 6 RMS inputs (channels C, D, E, F, G, H) shown in 2 line graphs for signals A,B and bar graphs for the other 6 signals. Click to return to contents...
20

P Inf A and B RMS.scr (also C/D, E/F, G/H)Channel Set: P Inf 8 Ch EMG.chs Category: RMS Description: 2 Ch RMS A and B 2 channels of RMS data shown in a line graph. This screen has been duplicated for the other 3 pairs of channels. Click to return to contents...
21

P Inf RMS A and B FFT.scrChannel Set: P Inf 8 Ch EMG.chs Category: RMS Description: 2 Ch RMS A and B with 3D FFT display. 2 Channels of RMS data derived from the channels A and B RAW inputs to the ProComp shown in a line graph. Click to return to contents...
22

P Inf 8 Ch RMS with Video.scrChannel Set: P Inf 8 Ch EMG.chs Category: RMS Description: 8 Ch RMS with Video. 8 channels of RMS data shown in line graphs. It also shows a single video view. Click to return to contents...
23

P Inf 4 Ch RMS 2 Goni 2 Force.scr Channel Set: P Inf 4 Ch EMG 2 Goni 2 Force.chs Category: General Description: 4 Ch of EMG with Force and Goniometers. Two line graphs showing RMS EMG signals and two line graphs one for Goniometer dual axis and one for two force sensors. Click to return to contents...
24

P Inf EMG, Force, Goni, Video Dual Screen.scr Channel Set: P Inf 4 Ch EMG 2 Goni 2 Force.chs Category: General Description: 4 Ch of EMG with Force and Goniometers. Two line graphs showing RMS EMG signals and two line graphs one for Goniometer dual axis and one for two force sensors. Extended onto a second screen which displays a video display Click to return to contents...
25

P Inf 2 Axis Goniometer.scr Channel Set: P Inf 4 Ch EMG 2 Goni 2 Force.chs Category: Goniometer Description: 2 Axis Goniometer. 2 Channels of dual axis goniometer displayed on line graph. Click to return to contents...
26

P Inf 2 Ch Review RAW.scr Channel Set: P Inf 8 Ch EMG.chs Category: Review Description: 2 Ch Raw with stats for review. 2 Ch EMG review with RAW line graphs shown. Click to return to contents...
27
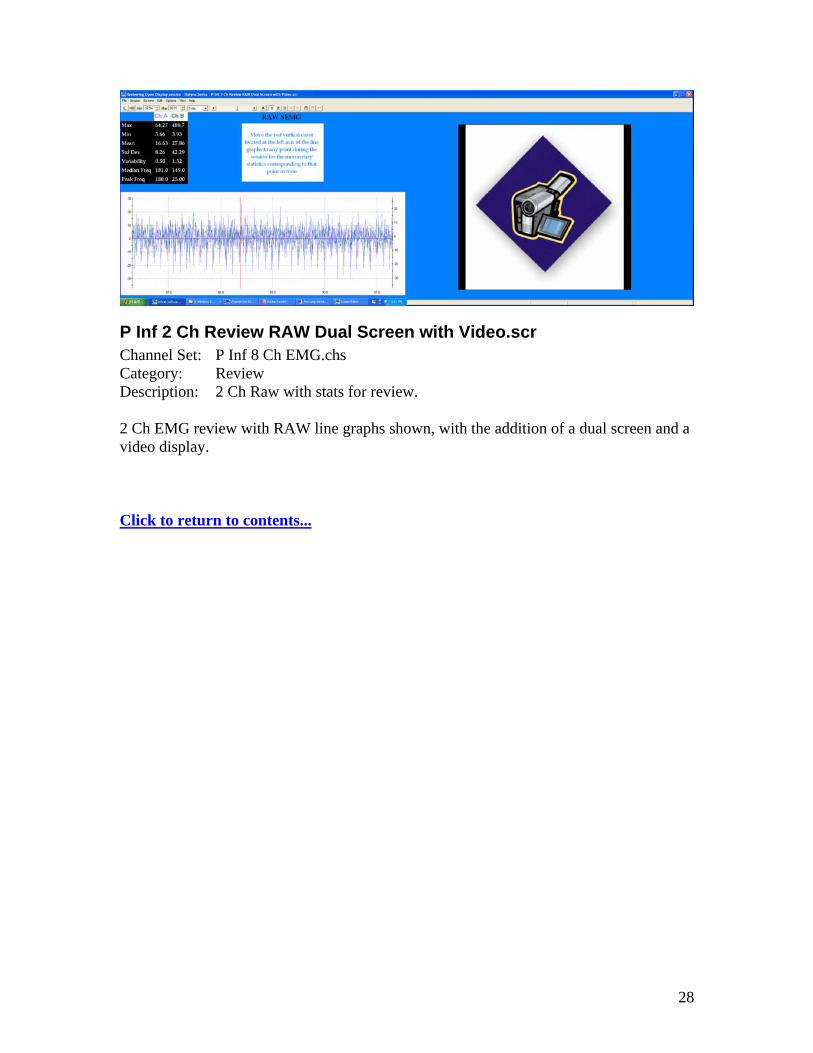
P Inf 2 Ch Review RAW Dual Screen with Video.scr Channel Set: P Inf 8 Ch EMG.chs Category: Review Description: 2 Ch Raw with stats for review. 2 Ch EMG review with RAW line graphs shown, with the addition of a dual screen and a video display. Click to return to contents...
28

P Inf 8 Ch Review RMS.scrChannel Set: P Inf 8 Ch EMG.chs Category: Review Description: 8 Ch RMS with stats for review. 8 channel review screen, with instruction. RMS data shown. Click to return to contents...
29

P Inf 2 Ch Review Median Frequency.scrChannel Set: P Inf 8 Ch EMG.chs Category: Review Description: 2 Ch Median Freq with stats for review. 2 channel review screen, with instruction. Median Frequency data shown. By moving the vertical red cursor available in the review mode it is possible to view statistics in the table above corresponding to any part of the session displayed as Median Frequency in the lower screens. The Median Frequency displayed in the table and the line graphs is smoothed to decrease the rapid changes and show a better trend. Click to return to contents...
30
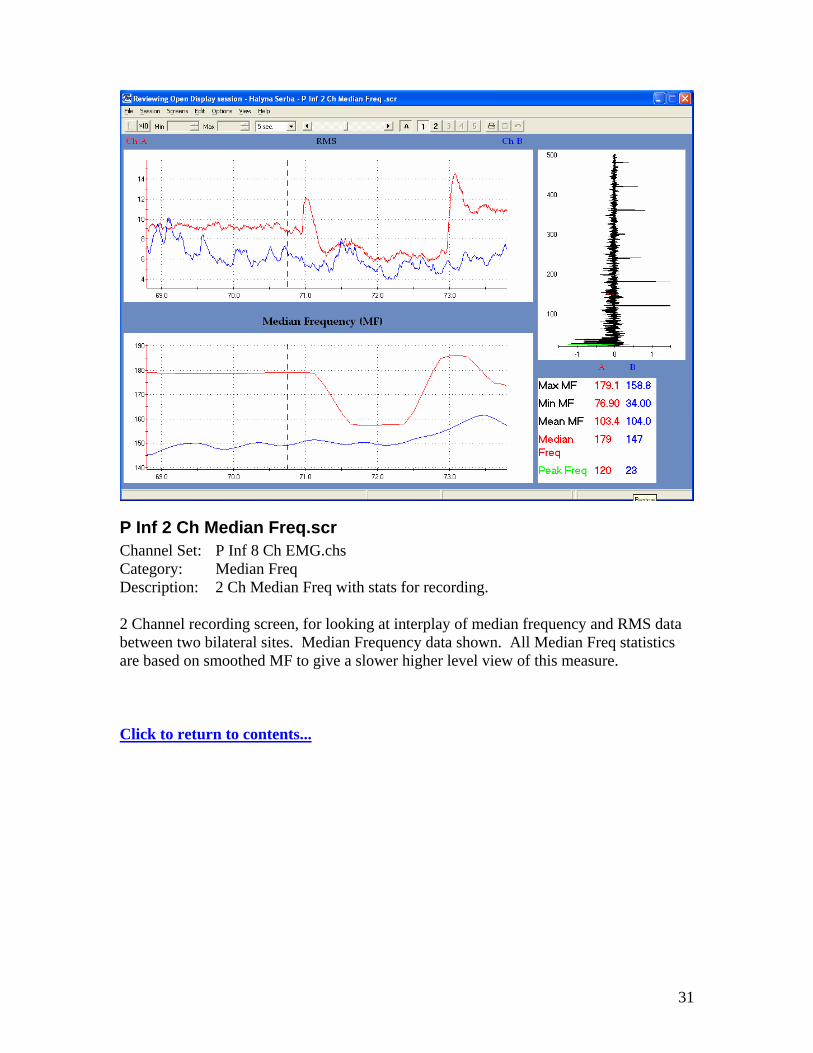
P Inf 2 Ch Median Freq.scr Channel Set: P Inf 8 Ch EMG.chs Category: Median Freq Description: 2 Ch Median Freq with stats for recording. 2 Channel recording screen, for looking at interplay of median frequency and RMS data between two bilateral sites. Median Frequency data shown. All Median Freq statistics are based on smoothed MF to give a slower higher level view of this measure. Click to return to contents...
31

P Inf 2 Ch Median Freq with Video.scr Channel Set: P Inf 8 Ch EMG.chs Category: Median Freq Description: 2 Ch Median Freq with stats for recording. 2 Channel recording screen, for looking at interplay of median frequency and RMS data between two bilateral sites. Median Frequency data shown. All Median Freq statistics are based on smoothed MF to give a slower higher level view of this measure. Dual screen with video and larger graphing spaces. Click to return to contents...
32
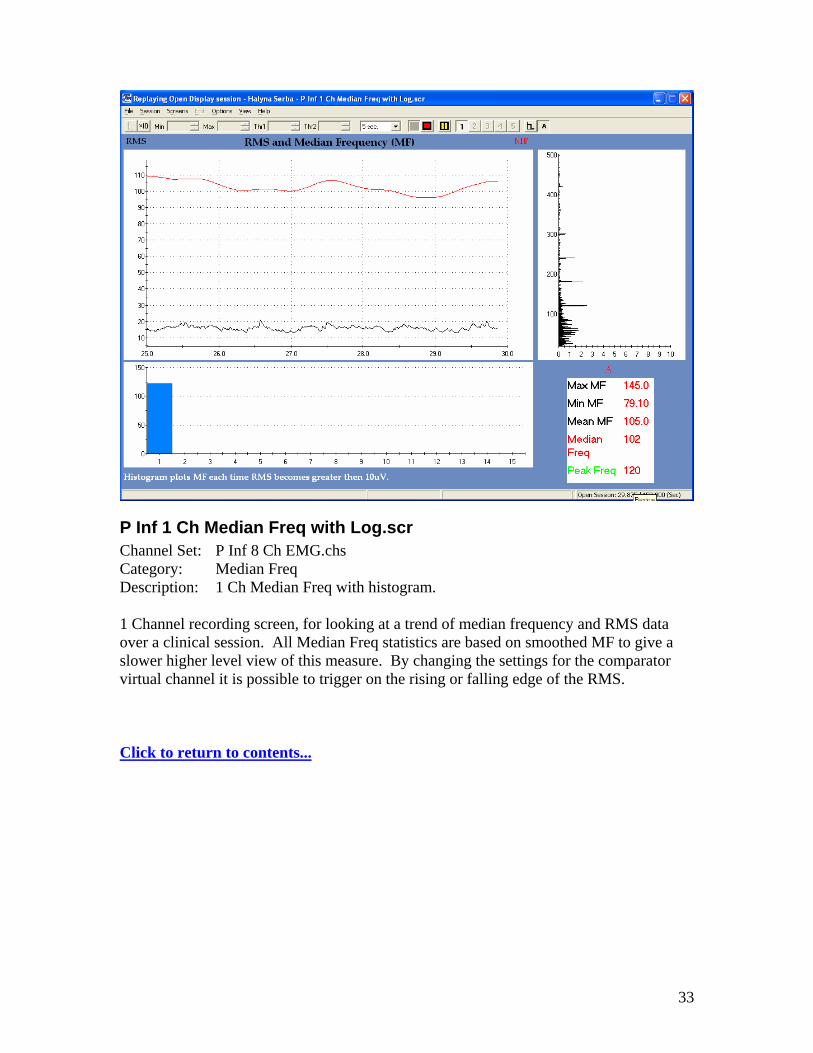
P Inf 1 Ch Median Freq with Log.scrChannel Set: P Inf 8 Ch EMG.chs Category: Median Freq Description: 1 Ch Median Freq with histogram. 1 Channel recording screen, for looking at a trend of median frequency and RMS data over a clinical session. All Median Freq statistics are based on smoothed MF to give a slower higher level view of this measure. By changing the settings for the comparator virtual channel it is possible to trigger on the rising or falling edge of the RMS. Click to return to contents...
33
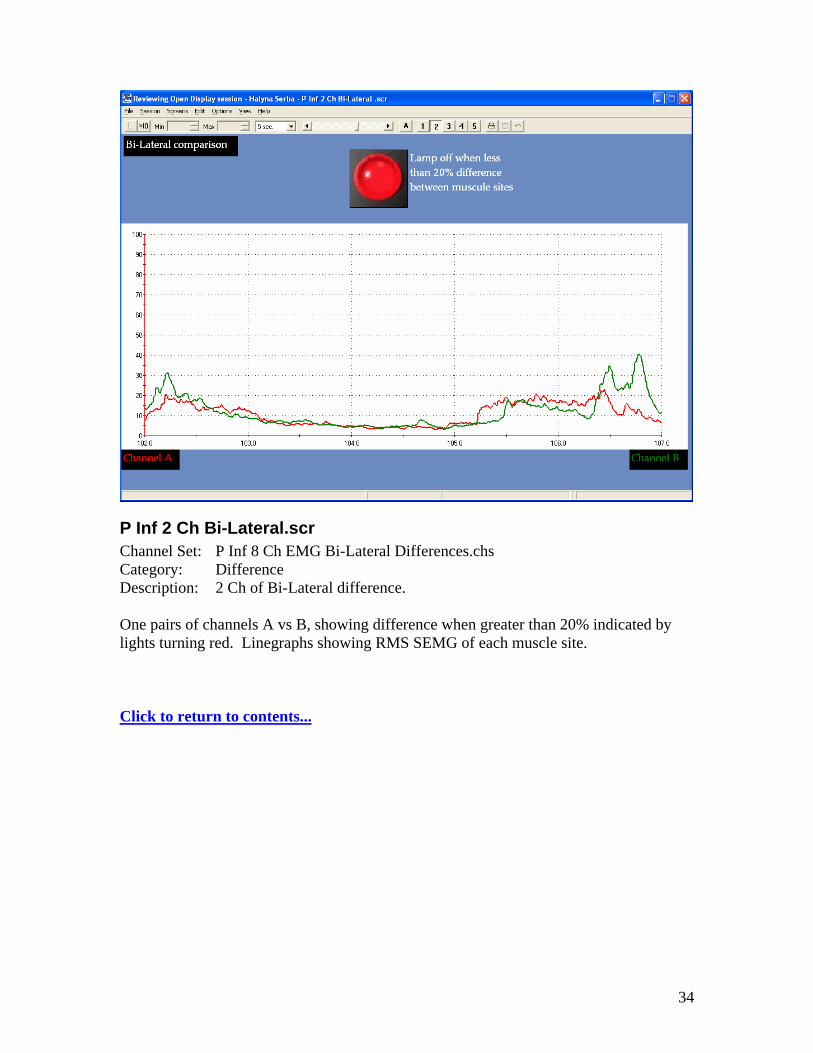
P Inf 2 Ch Bi-Lateral.scrChannel Set: P Inf 8 Ch EMG Bi-Lateral Differences.chs Category: Difference Description: 2 Ch of Bi-Lateral difference. One pairs of channels A vs B, showing difference when greater than 20% indicated by lights turning red. Linegraphs showing RMS SEMG of each muscle site. Click to return to contents...
34
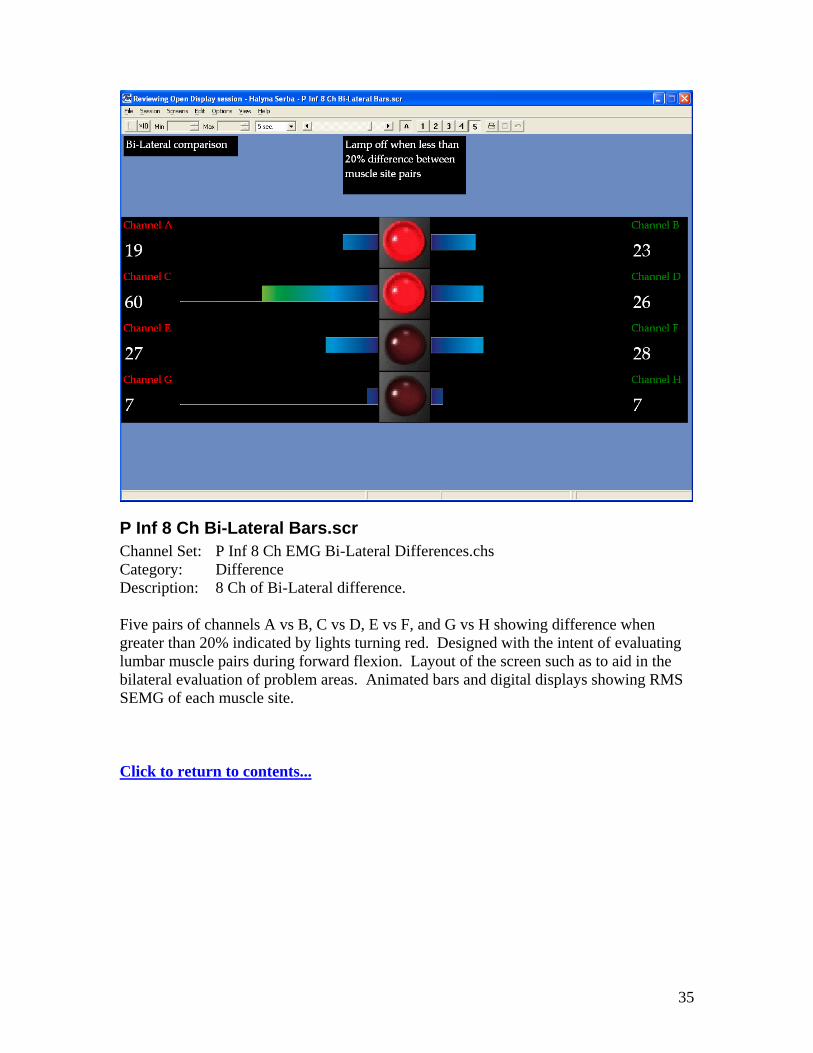
P Inf 8 Ch Bi-Lateral Bars.scr Channel Set: P Inf 8 Ch EMG Bi-Lateral Differences.chs Category: Difference Description: 8 Ch of Bi-Lateral difference. Five pairs of channels A vs B, C vs D, E vs F, and G vs H showing difference when greater than 20% indicated by lights turning red. Designed with the intent of evaluating lumbar muscle pairs during forward flexion. Layout of the screen such as to aid in the bilateral evaluation of problem areas. Animated bars and digital displays showing RMS SEMG of each muscle site. Click to return to contents...
35

P Inf 8 Ch Bi-Lateral + Video.scr Channel Set: P Inf 8 Ch EMG Bi-Lateral Differences.chs Category: Difference Description: 8 Ch of Bi-Lateral difference. Five pairs of channels A vs B, C vs D, E vs F, G vs H showing difference when greater than 20% indicated by lights turning red. Designed with the intent of evaluating lumbar muscle pairs during forward flexion. Layout of the screen such as to aid in the bilateral evaluation of problem areas. Animated bars and digital displays showing RMS SEMG of each muscle site. Includes video display to show web cam footage. Click to return to contents...
36

P Inf 2 Ch A - B Bi-Lateral + Video.scr (also C/D, E/F, G/H) Channel Set: P Inf 8 Ch EMG Bi-Lateral Differences.chs Category: Difference Description: 2 Ch A - B of Bi-Lateral difference with Video. One pair of channels A vs B, showing difference when greater than 20% indicated by lights turning red. Designed with the intent of evaluating lumbar muscle pairs during forward flexion. Animated bars and digital displays showing RMS SEMG of each muscle site. Video enables viewing of the motion performed. Click to return to contents...
37

P Inf 8 Ch Bi-Lateral Back.scrChannel Set: P Inf 8 Ch EMG Bi-Lateral Differences.chs Category: Difference Description: 8 Ch of Bi-Lateral difference. Five pairs of channels A vs B, C vs D, E vs F, and G vs H showing difference when greater than 20% indicated by lights turning red. Designed with the intent of evaluating lumbar muscle pairs during forward flexion. Layout of the screen such as to aid in the bilateral evaluation of problem areas. Animated bars and digital displays showing RMS SEMG of each muscle site Click to return to contents...
38

P Inf Para-spinal muscle activity.scrChannel Set: P Inf 8 Ch EMG Bi-Lateral Differences.chs Category: Difference Description: Bilateral comparison of para-spinal muscle activity. Five pairs of channels
• A vs B at C7 – T1, • C vs D at T6 – T7, • E vs F at T12 – L1, • G vs H at L2 – L3,
Bi-lateral difference when greater than 20% is indicated by lights turning red. Designed with the intent of evaluating para-spinal muscle pairs during forward flexion. Layout of the screen such as to aid in the bilateral evaluation of problem areas. Animated bars and digital displays showing RMS SEMG of each muscle site. Click to return to contents...
39
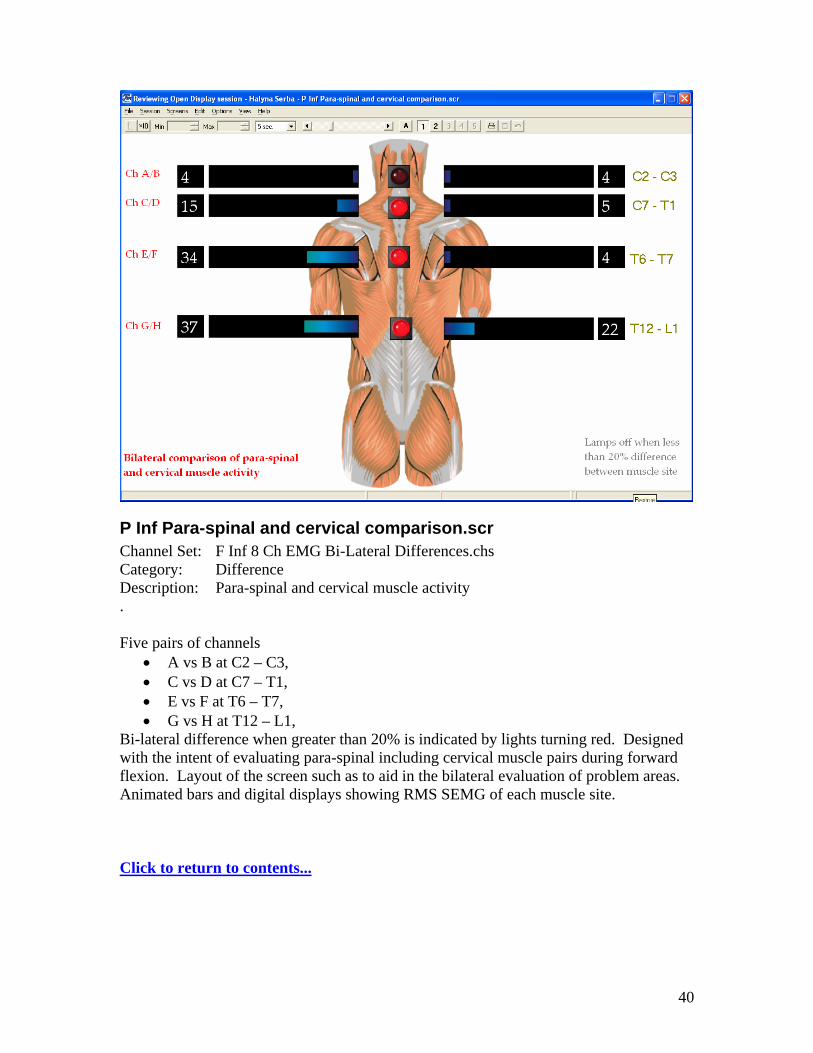
P Inf Para-spinal and cervical comparison.scrChannel Set: F Inf 8 Ch EMG Bi-Lateral Differences.chs Category: Difference Description: Para-spinal and cervical muscle activity . Five pairs of channels
• A vs B at C2 – C3, • C vs D at C7 – T1, • E vs F at T6 – T7, • G vs H at T12 – L1,
Bi-lateral difference when greater than 20% is indicated by lights turning red. Designed with the intent of evaluating para-spinal including cervical muscle pairs during forward flexion. Layout of the screen such as to aid in the bilateral evaluation of problem areas. Animated bars and digital displays showing RMS SEMG of each muscle site. Click to return to contents...
40

P Inf 5 Ch Multi Modality Overview.scrChannel Set: P Inf 5 Ch Multi Modality.chs Category: Multi Modality Description: Overview of Signals. A multi-modality use of the ProComp encoder, this channel set and screen presents data from the EMG, EKG, Temp and Skin Conductance sensors. EKG – Heart Rate, IBI, Max, Min Mean, Peak Freq, Std Dev in Heart Rate. Temp – Max, Min, Mean, Real Time. SC – Mean, Real Time EMG – Two channels of real time RMS EMG and the Mean for each channel. Click to return to contents...
41

P Inf 1 Ch EKG.scr Channel Set: P Inf 5 Ch Multi Modality.chs Category: Multi Modality Description: EKG Overview of Signals. Focusing on EKG and heart rate, this screen shows in line graphs both the heart rate and the raw EMG signal. Standard Deviation of the heart rate is shown as a bar graph on the right of the screen. A Fast Fourier Transform of the inter-beat interval (IBI) is displayed in both a 3D and a 2D power spectrum, to accompany these there is a digital display showing the peak frequency. Real-time measurements of Heart Rate, IBI, Max, Min and Mean Heart Rates are also displayed. Click to return to contents...
42

P Inf 2 Ch SC, Temp.scrChannel Set: P Inf 5 Ch Multi Modality.chs Category: Multi Modality Description: SC, Temp Overview of Signals. This screen shows in line graphs both the Temperature and Skin Conductance. Real-time measurements of Temperature, Skin Conductance, Max, Min and Mean are also displayed. Click to return to contents...
43

P Inf 2 Ch EMG.scrChannel Set: P Inf 5 Ch Multi Modality.chs Category: Multi Modality Description: EMG, Temp Overview of Signals. Focusing on EMG, this screen shows in line graphs both the RMS and the raw EMG signal. 2D Power Spectrums show the result of the FFT performed on the two channels. Real-time measurements of RMS, Max, Min and Mean are displayed. Click to return to contents...
44
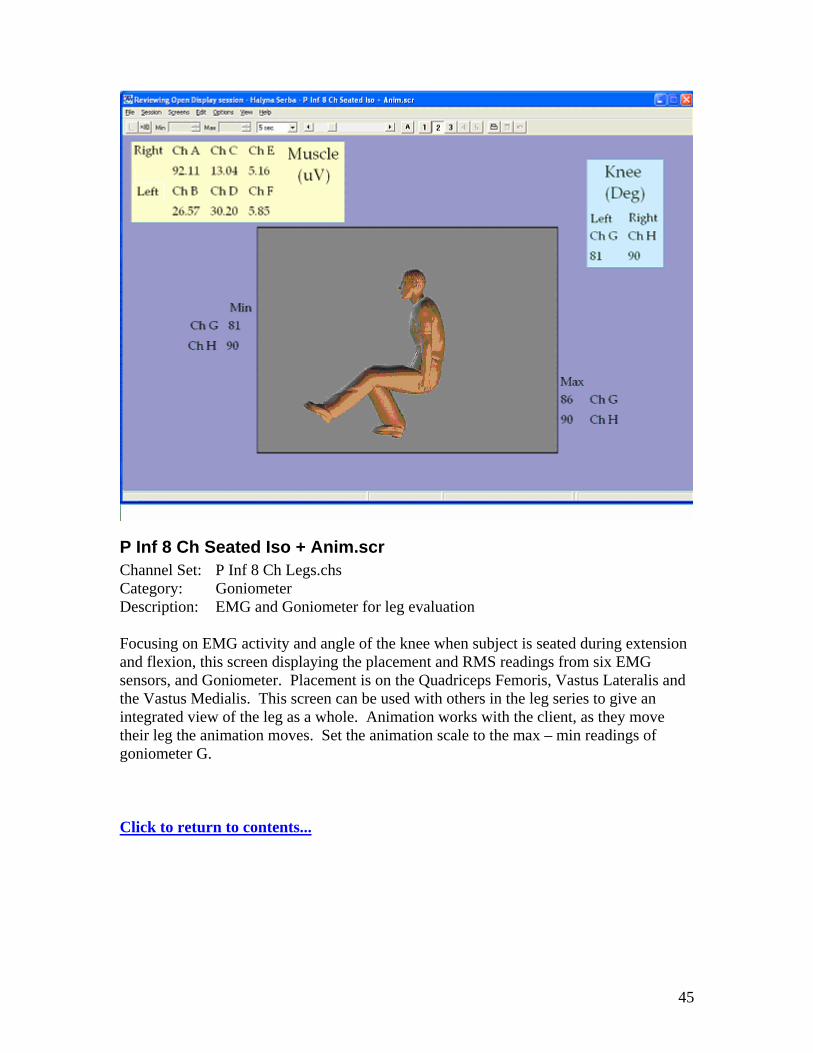
P Inf 8 Ch Seated Iso + Anim.scrChannel Set: P Inf 8 Ch Legs.chs Category: Goniometer Description: EMG and Goniometer for leg evaluation Focusing on EMG activity and angle of the knee when subject is seated during extension and flexion, this screen displaying the placement and RMS readings from six EMG sensors, and Goniometer. Placement is on the Quadriceps Femoris, Vastus Lateralis and the Vastus Medialis. This screen can be used with others in the leg series to give an integrated view of the leg as a whole. Animation works with the client, as they move their leg the animation moves. Set the animation scale to the max – min readings of goniometer G. Click to return to contents...
45

Recuired Files for DynaMap Suite 3.0 for ProComp infiniti Channel Sets ( .chs )
• P Inf 8 Ch EMG.chs • P Inf 8 Ch EMG Bi-Lateral Difference.chs • P Inf 8 Ch Legs.chs • P Inf 5 Ch Multi Modality.chs • P Inf 4 Ch EMG 2 Goni 2 Force.chs • P Inf Force Calibration.chs • P Inf Goniometer Calibration.chs
Screens ( .scr )
P Inf Force Calibration.scr P Inf Goniometer Calibration.scr P Inf 2 Ch Raw Separated Graphs.scr P Inf 2 Ch Raw Graphs Dual Screen.scr P Inf 2 Ch Raw.scr P Inf Ch A Test.scr (also B) P Inf Ch C Test.scr (also D, E, F, G, H) P Inf 2 Ch Spectral.scr P Inf 8 Ch RMS.scr P Inf 8 Ch RMS Bargraphs.scr P Inf 8 Ch Line & Bar.scr P Inf A and B RMS.scr (also C/D, E/F, G/H) P Inf RMS A and B FFT.scr P Inf 8 Ch RMS with Video.scr P Inf 4 Ch RMS 2 Goni 2 Force.scr P Inf EMG, Force, Goni, Video Dual Screen.scr P Inf 2 Axis Goniometer.scr P Inf 2 Ch Review RAW.scr P Inf 2 Ch Review RAW Dual Screen with Video.scr P Inf 8 Ch Review RMS.scr P Inf 2 Ch Review Median Frequency.scr P Inf 2 Ch Median Freq.scr P Inf 2 Ch Median Freq with Video.scr P Inf 1 Ch Median Freq with Log.scr P Inf 2 Ch Bi-Lateral.scr P Inf 8 Ch Bi-Lateral Bars.scr P Inf 8 Ch Bi-Lateral + Video.scr P Inf 2 Ch A - B Bi-Lateral + Video.scr (also C/D, E/F, G/H) P Inf 8 Ch Bi-Lateral Back.scr P Inf Para-spinal muscle activity.scr P Inf Para-spinal and cervical comparison.scr P Inf 5 Ch Multi Modality Overview.scr P Inf 1 Ch EKG.scr P Inf 2 Ch SC, Temp.scr
46

P Inf 2 Ch EMG.scr P Inf 8 Ch Seated Iso + Anim.scr
Animations
• Linear R to L Rainbow Bar.avi • Linear L to R Rainbow Bar.avi • Man with leg flex.avi • Binary Red Light.avi
Pictures • back.bmp
Click to return to contents...
47